Abstract
Nitrogen dioxide (NO2) impacts climate, air quality, soil nitrogen fixation, and crop production, yet its transboundary impacts remain unclear. This study combines 15 global datasets to assess nitrogen’s transboundary impacts on crop yields and soil health. We use machine learning to develop yield prediction models for major grain crops (maize, rice, soybean, and wheat) affected by NO2. Our findings indicate stable soil nitrogen fixation in China from 2015 to 2020, although overgrazing and deforestation may cause declines. Increasing soil total nitrogen content by 0.62–2.1 g/kg can reduce NO2 by 10–30%. Our research indicates that the current agricultural environments for major grain crops (58.5–94.2%) have already exceeded the NO2 concentration range that crops can tolerate, particularly in regions near northern urban clusters. This highlights the need for regional interventions, such as precision nitrogen fertilizer management, to enhance both soil nitrogen fixation and crop yields. Scenario analysis suggests that NO2 control can boost maize and rice yields in a greener context, while increasing total nitrogen content improves wheat and soybean yields. This provides a solution for advancing sustainable agriculture by linking nitrogen cycle management with improved crop yields and environmental sustainability.
1. Introduction
Soil plays a crucial role as a major nitrogen sink, and, alongside climatic factors, it significantly influences the distribution patterns of global agricultural land [1]. Plant-associated nitrogen-fixing bacteria are more efficient than free-living counterparts due to symbiotic advantages like resource sharing and optimized host conditions [2]. However, the development and use of agricultural land not only alter the structure and function of soil microbial communities but also impact soil’s nitrogen fixation [3]. In recent years, the rising global demand for food has put immense pressure on agricultural production to increase crop yields while simultaneously confronting escalating environmental challenges [4]. The reliance on nitrogen fertilizers to boost food and feed production has led to significant nitrogen losses—over half of the nitrogen fertilizer applied to arable land escapes into the atmosphere and water, contributing to a global total of 120 megatons of chemical nitrogen fertilizers used annually [5]. Nitrogen fixation levels and nitrogen oxide (NOX) emissions from cropland are influenced by multiple environmental factors, including nitrogen fertilizer application rates, soil organic carbon content, temperature, moisture, and pH levels [6,7]. As the global demand for food continues to grow, it is crucial to further assess how the nitrogen fixation of croplands may change, as well as the implications of these changes for nitrogen pollution and atmospheric emissions.
The negative impacts of nitrogen on agricultural ecosystems have been recognized since the last century [8]. The excessive use of nitrogen in agricultural ecosystems has increased the nitrogen footprint [9], and significantly disrupted the ecological diversity of communities [10]. Nitrogen dioxide (NO2) contributes to air pollution and directly intensifies climate change by promoting the formation of ozone and other greenhouse gases, posing a serious threat to crop growth environments [11]. However, certain studies [12] have shown that under specific conditions, NO2 can be converted into plant-available nitrogen forms, such as nitrate (NO3−) and ammonium (NH4+), thus enhancing nitrogen supply within ecosystems and promoting crop growth. Nitrogen, being a crucial factor in crop yield determination, is in high demand for the production of cereals and leguminous crops [13]. Legumes fix significantly higher quantities of nitrogen (50–300 kg N/ha/year) compared to cereals (5–25 kg N/ha/year). This makes legumes critical for improving soil fertility and reducing dependence on synthetic fertilizers, especially when integrated into cereal-based cropping systems [14,15]. Against this backdrop, the recycling of organic nitrogen sources within agricultural ecosystems has emerged as a key strategy for ensuring the sustainable development of food systems within the Earth’s environmental limits [16]. Therefore, NO2 emissions in the soil nitrogen fixation process are important indicators for studying the relationship between nitrogen cycling and crop yields.
Research has increasingly explored the role of soil and climate in determining crop yields and production environments. For instance, research has shown that for every 1 °C increase in temperature, wheat yields may decrease by 6% [17]. Meanwhile, high-quality soil can reduce crop yield sensitivity to climate variability and increase average yields [18]. Similar studies have confirmed that soil quality can both enhance crop yields and mitigate the effects of climate change in different ecosystems [19,20]. Research has also suggested that agricultural activities lead to a decline in the nitrogen-fixing functions of soil microorganisms, consequently affecting the nitrogen cycle [3]. High concentrations of NO2 negatively impact nitrogen-fixing microorganisms in the soil and disrupt overall nitrogen cycling [21]. By synergistically managing nitrogen and water resources, rice yields can be increased by 9% while reducing greenhouse gas emissions by 21% [22]. These studies all highlight the inseparable link between crop yields and soil and climate conditions.
Despite these insights, current research on the interaction between soil, environmental changes, and crop yields has not fully explored the dynamics of nitrogen cycling. The lack of research on the transboundary impact of nitrogen cycling across soil and climate environments has hindered the effective implementation of nitrogen fertilizer management strategies [23]. While previous studies have acknowledged the interactions between climate, soil, and yield [18,24], most focus on crop adaptation to general climate and soil conditions, without fully addressing the specific impact of environmental variables on crop yields through nitrogen cycling. This results in limited explanatory power in existing models. Moreover, studies examining the effects of nitrogen cycling—whether in soil or in the atmosphere—on crop yields still lack a comprehensive evaluation of nitrogen’s transboundary impacts.
This study investigates the transboundary impacts of NO2 on nitrogen fixation in croplands and its effects on crop yields under varying soil total nitrogen contents (TNCs). We developed a yield prediction model for major grain crops—Oryza sativa L. (rice), Triticum aestivum L. (wheat), Glycine max (L.) Merr. (soybean), and Zea mays L. (maize)—under the influence of NO2, using Random Forest Regression (RFR) and Extreme Gradient Boosting (XGBoost) machine learning techniques. RFR is known for its robustness, ability to handle large datasets, and high accuracy in classification and regression tasks, while XGBoost is particularly efficient for handling imbalanced data and can provide high predictive accuracy. Both models are widely used in environmental and agricultural studies for their ability to capture intricate patterns in large datasets, making them suitable for our yield prediction model. Through partial correlation analysis and Shapley Additive Explanations (SHAP) values, we identified the transboundary impacts of NO2 concentrations on crop yields and established optimal NO2 concentration ranges. Additionally, we projected yield changes from 2030 to 2050 under different soil nitrogen fixation levels, as represented by TNC, applying the A1 (balanced) and B1 (clean energy) scenarios from the Special Report on Emissions Scenarios (SRES). This study aims to propose effective nitrogen cycle management strategies to enhance environmental sustainability in agricultural systems.
2. Materials and Methods
2.1. Data Compilation
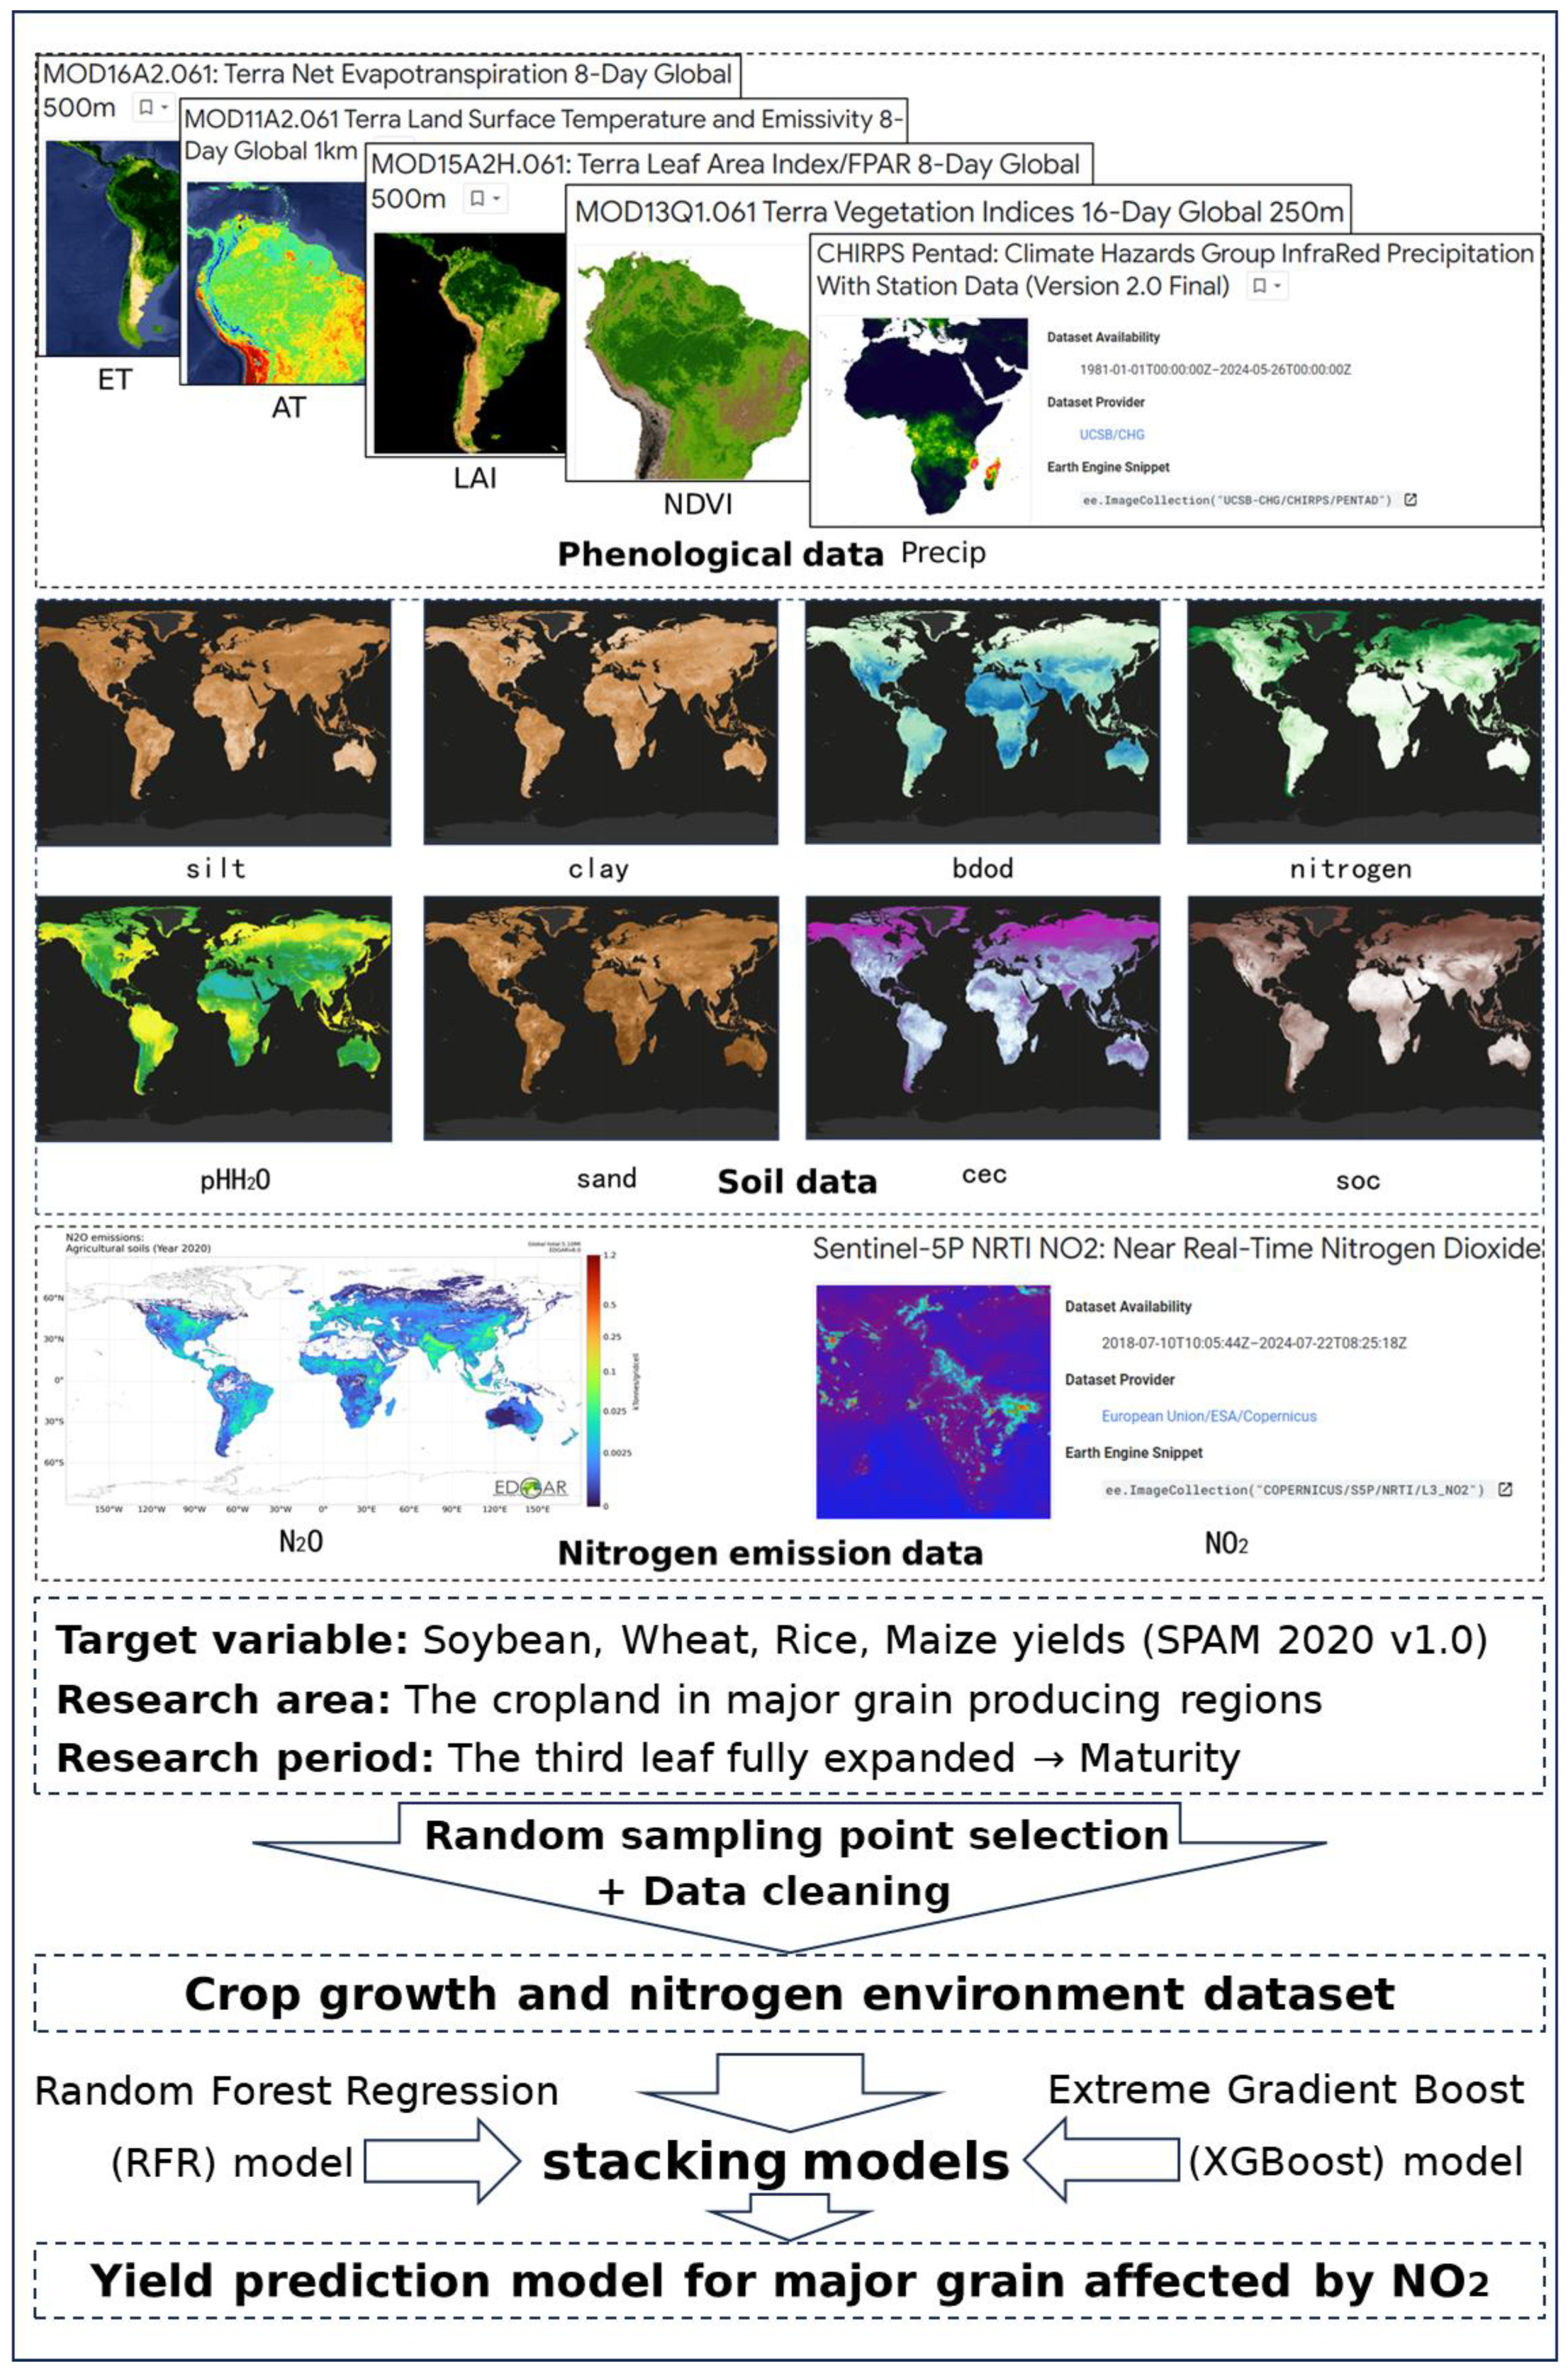
Our machine learning yield prediction model includes variables commonly used in crop growth studies [11,25], such as phenology, climate, and soil properties. Phenological data included leaf area index (LAI) and vegetation index (NDVI) as inputs, while climatic data comprised average surface temperature (AT), evapotranspiration (ET), and precipitation (Precip). AT is closely associated with crop canopy temperature, and both ET and Precip are key variables in crop yield prediction models [25]. Data used in this study were sourced from public databases. The nitrogen fixation process is accompanied by the denitrification process; nitrous oxide (N2O) remote sensing data were also incorporated as variables to analyze the transboundary impact of nitrogen in air and soil [26]. Additionally, the SoilGrids dataset [27] was used to incorporate nine distinct soil properties and to account for different soil depths depending on crop type. Specifically, soil data from a depth of 0–5 cm were used for maize, wheat, and soybeans, while rice used data from a depth of 5–15 cm to better observe the transboundary impact of NO2. Data used in this study were sourced from official public databases. Provincial crop production data for China were provided by the National Bureau of Statistics of China https://data.stats.gov.cn/ (accessed on 26 October 2024). N2O emission data were sourced from soil emissions attributed to the agricultural sector, as reported in EDGAR—Emissions Database for Global Atmospheric Research https://edgar.jrc.ec.europa.eu/ (accessed on 25 July 2024) [28], ensuring its relevance and alignment with the focus of this study. NO2 emission data were sourced from TROPOMI https://www.tropomi.eu/data-products/nitrogen-dioxide (accessed on 19 June 2024) [29], Precip data from CHIRPS https://chc.ucsb.edu/data/chirps (accessed on 15 September 2024) [30], ET data from MOD16A2v061 https://lpdaac.usgs.gov/products/mod16a2v061/ (accessed on 16 September 2024), AT data from MOD11A2v006 https://lpdaac.usgs.gov/products/mod11a2v006/ (accessed on 16 September 2024), LAI data from MOD15A2Hv006 https://lpdaac.usgs.gov/products/mod15a2hv006/ (accessed on 16 September 2024), soil data from SoilGrids https://soilgrids.org/ (accessed on 15 September 2024), and crop yield data from Spatial Production Allocation Model (SPAM) database 2020 v1.0 https://mapspam.info/data/ (accessed on 15 September 2024) [31]. Due to challenges associated with data acquisition, it was not feasible to investigate specific cultivars of globally consumed legumes. Instead, our study focuses on general crop categories rather than specific cultivars. The classification of crops in this research is based on the SPAM dataset to ensure consistency and reliability in the analysis while aligning with available data constraints. All data were integrated and randomly sampled using Google Earth Engine (GEE) https://code.earthengine.google.com/ (accessed on 6 September 2024).
In studying the relationship between NO2 and TNC, we ensured data accuracy by screening random sample points located in the major grain producing regions using MODIS land use raster data, specifically masks 12 (cropland) and 14 (paddy field). The initial sample size was 4000 points, and this screening ensured that all data originated from cropland, avoiding interference from non-agricultural areas. For studying the effects of environmental factors on crop yield, we established 2500–3500 sample points in each crop. As the crop yield data for non-cultivated land were null, further screening of sample points was unnecessary, which simplified data preprocessing and ensured both consistency and completeness. To accurately analyze the effects of various factors on crop yield within a consistent time frame, we standardized the study period based on the available years of the raster dataset, set from 2020 to 2021. To minimize bias from seasonality, we collected yield-related data from the rapid growth stage (when the third leaf is fully expanded) to the maturity stage for each grain crop. The growing periods for wheat, maize, rice, and soybean were defined as December 2020 to May 2021, May 2020 to September 2020, June 2020 to October 2020, and June 2020 to October 2020, respectively. After obtaining crop yield and environmental factor raster data, we performed band synthesis on datasets with different resolutions to extract eigenvalues for all feature variables at consistent spatial coordinates. This process, conducted using GEE, generated a random sample point dataset of crop yields and related environmental factors. After Z-test, the final numbers of valid sample points were 662 for maize, 890 for rice, 1063 for soybean, and 843 for wheat. Due to the lack of collected farmland management data for 2020–2021, this study does not incorporate management practice data. To mitigate potential model errors due to the absence of cropland management data and the difficulty in standardizing such data across different crops, crop yield was set under natural precipitation conditions (i.e., total yield minus the portion from artificial irrigation). As rice is less dependent on natural precipitation, total yield data were used for this crop. This study dataset contains information on crop yields, related environmental factors from a nitrogen cycle perspective, and the spatial coordinates of sample points. Source data are provided with this paper.
2.2. Yields of Major Grain Crops Modeling
2.2.1. Overview of the Methodology
This study examines the transboundary impact of nitrogen in both air and soil using machine learning models, combining the RFR model and the XGBoost model. This model was developed based on 16 feature variables, including NO2, TNC, LAI, ET, and soil properties for rice, maize, wheat, and soybean. Both the XGBoost and RFR models were validated for accuracy and underwent parameter tuning to optimize performance. To mitigate single-model errors, a Stacking model was employed to integrate the RFR and XGBoost models, resulting in a crop yield prediction model that accounts for the transboundary impact of NO2. The accuracy validation is shown in Table 1. MSE (Mean Squared Error) was used to evaluate the model’s prediction accuracy. The detailed introduction of both RFR and XGBoost models are provided in the Supplementary Methods.

Table 1.
Validation of accuracy for the stacked model (RFR and XGBoost).
2.2.2. Random Forest Regression Yield Prediction Model
We developed a RFR yield prediction model using the Scikit-learn library in Python. Initially, we processed missing values and applied feature engineering. The target variable in this study is grain crop yield, while the feature variables consist of 15 input indicators representing the water–soil–air dimensions of the crop’s environment. Subsequently, we divided the data into training and test sets, with the test set used to evaluate model performance and accuracy. An 80:20 ratio was applied. The RFR model was then initialized using the Scikit-learn library in Python, with a fixed random state to ensure reproducibility and verification of the experimental results. The RFR model predicts by integrating multiple decision trees, where the predictions from each tree are averaged or voted on to produce a final prediction, which can be expressed as
where represents the final predicted value; is the number of decision trees; denotes the predicted value of the -th tree. The RFR model consists of multiple decision trees, each trained on a different data subset and making predictions through a voting mechanism. As a result, unlike linear regression models, the RFR model lacks an explicit mathematical formula for its output and can only be optimized by adjusting its hyperparameters. Model performance was optimized by tuning the random forest’s hyperparameters (number of estimators, maximum depth, minimum samples split, and minimum samples leaf), using Grid Search to automate this process. Grid Search automates the hyperparameter tuning process to obtain the optimal model, as represented by the following formula:
where represents the hyperparameter space containing all possible combinations; is the optimal hyperparameter combination; denotes the number of cross-validation folds; is the loss function, which measures the difference between the predicted value and the true value ; and is the model’s predicted value with hyperparameter for the validation set in the -th fold of cross-validation.
2.2.3. XGBoost Yield Prediction Models
Although XGBoost benefits from some concepts and techniques used in Random Forests, its core principles and algorithmic mechanisms differ significantly. XGBoost is a decision tree algorithm based on Gradient Boosting, where, in each iteration, a new decision tree is designed to correct the prediction errors of all the previous trees. The primary goal of XGBoost is to minimize the loss function, which typically consists of two components: (1) training error, which measures the difference between the model’s predictions and the true labels, and (2) a regularization term, which controls the model complexity and prevents overfitting. Thus, the objective function of XGBoost can be expressed as
where is the training error and is the regularization term. To approximate the loss function, XGBoost simplifies the computation by using a second-order Taylor expansion:
where is the first-order derivative, representing the rate of change of the loss function with respect to the current prediction, and is the second-order derivative, reflecting the rate of change of the gradient. is the model prediction in round , is the number of leaf nodes in the current tree, is the regularization parameter controlling the number of leaf nodes to prevent overfitting, and is the regularization parameter that controls the size of the weights , where represents the weight of the -th leaf node. XGBoost employs a greedy algorithm, constructing decision trees iteratively by selecting the split point that maximizes the gain of the objective function at each layer:
where and represent the gradient and Hessian sums for the left child node, while and are the corresponding sums for the right child node. To prevent overfitting, XGBoost introduces pruning and regularization techniques, controlling leaf node weights through the parameter , and tree complexity through the parameter .
2.2.4. Analysis of Feature Variables
We analyzed the feature variables using feature importance analysis from the RFR model, partial dependency analysis, and SHAP analysis from the XGBoost model. Feature importance assessment was based on Gini node splitting and replacement feature importance measures. The reduction in node impurity before and after splitting determines each feature’s importance score. Although RFR captures nonlinear relationships between features, it is limited in its ability to model feature interactions.
SHAP, based on the Shapley value from game theory, reflects the strength of feature contributions through the magnitude of the SHAP values. When calculating SHAP values, the marginal contribution of feature values across all possible feature combinations is considered. Although this increases computational complexity, it provides the most equitable interpretation of feature importance. Additionally, SHAP values offer explanations for individual predictions rather than a global interpretation. This characteristic makes SHAP suitable for a wide range of machine learning models. Using partial dependency analysis, we further investigated the effect of NO2 on crop yield. The codes used in this study are available at: https://github.com/xiejhhhhhh/Transboundary-Impacts-of-NO2-on-Soil-Nitrogen-Fixation-Systems-and-Their-Effects-on-Four-Grain-Crops (accessed on 19 September 2024). We have created a flow chart that summarizes the strategy for data collection and statistical modeling (Figure 1). This chart visually outlines the key steps in our methodology.

Figure 1.
Framework of data collection and statistical modeling process. Phenological data included evapotranspiration (ET), average surface temperature (AT), leaf area index (LAI), normalized difference vegetation index (NDVI), precipitation (Precip. Soil data included silt, clay, bulk density (bdod), total nitrogen content (nitrogen), pH in H2O (pHH2O), sand, cation exchange capacity at pH7 (cec), soil organic carbon (soc). Terms in parentheses refer to key soil and environmental metrics. The crop yield data is from Spatial Production Allocation Model (SPAM) database 2020 v1.0.
3. Results
3.1. Spatial Distribution of Soil Nitrogen Fixation and Changing Trends
To ensure that our research findings were ultimately reflected in crop yield changes, we defined the cultivated land area covering 95% of the total grain production based on national statistical data. Building on this foundation, we mapped China’s major grain-producing regions and generated a total nitrogen density map (Figure 2) to highlight the primary areas of interest. Our results reveal distinct spatial climate distribution characteristics in China’s major grain-producing regions. Except for soybeans, provinces within the same climate zones not only share similar grain production rankings but are also geographically close to one another. Rice production is primarily concentrated in southern China, while wheat and maize production areas show significant overlap. The soybean-producing regions are more dispersed. From the soil total nitrogen density distribution shown in the Figure 2, we can observe that the North China Plain—a major production area for rice, maize, wheat, and soybeans—exhibits the lowest nitrogen fixation levels, as well as a low total soil nitrogen density. This finding suggests that the low nitrogen density in the North China Plain may be linked to long-term agricultural practices in this area. To test this hypothesis, we further examined the nitrogen fixation levels across different land types and assessed the changing trend in soil nitrogen fixation levels across China.
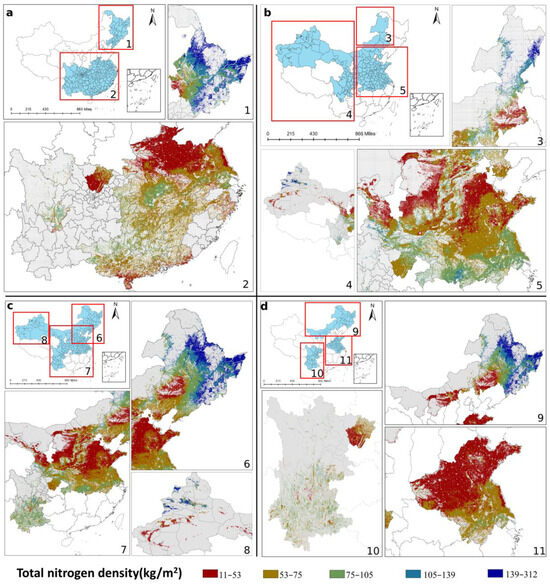
Figure 2.
Major grain-producing regions and the distribution of total nitrogen density in croplands of China. (a) Distribution of arable land in the major grain-producing regions of rice and its total soil nitrogen density, mainly in (1) the three northeastern provinces, and (2) the southern provinces. (b) Distribution of cultivated land and soil total nitrogen density in major wheat-producing areas is primarily located in the (3) north, (4) southwest, and (5) northern regions. (c) Distribution of cultivated land and soil total nitrogen density in major maize-producing areas, including (6) the three northeastern provinces, (7) Sichuan, Yunnan, Guizhou regions, Inner Mongolia, the North China Plain, and the (8) Xinjiang region. (d) Distribution of cultivated land and soil total nitrogen density in soybean-producing areas is mainly concentrated in (9) the northeast, (10) the southwest, and (11) parts of the North China Plain. The division of major grain-producing regions was based on the 2020 national statistics of crop production; spatial distribution data for cultivated land were sourced from the 30 m resolution land use dataset of CNLUCC [32] in 2020; total nitrogen concentration data were derived from the Basic Soil Property dataset of high-resolution China Soil Information Grids [33].
We quantified changes in nitrogen fixation levels across different land types in China during urbanization by aggregating and processing TNC data from land use types and soils at 3458 random sample sites nationwide (Figure 3a). We found that cropland, built-up land, and water bodies (swamps, wetlands, etc.) increased by 5.44 × 10⁶ ha, 6.93 × 10⁵ ha, and 1.61 × 10⁶ ha, respectively, while forests, grasslands, and unavailable land decreased by 1.09 × 10⁶ ha, 1.60 × 10⁶ ha, and 5.06 × 10⁶ ha, respectively from 2015 to 2020. The most significant changes were the conversion of unavailable land to cropland and of grassland to cropland. Overall, the land use changes from 2015 to 2020 showed a trend of grasslands and unavailable land being gradually converted into cropland.
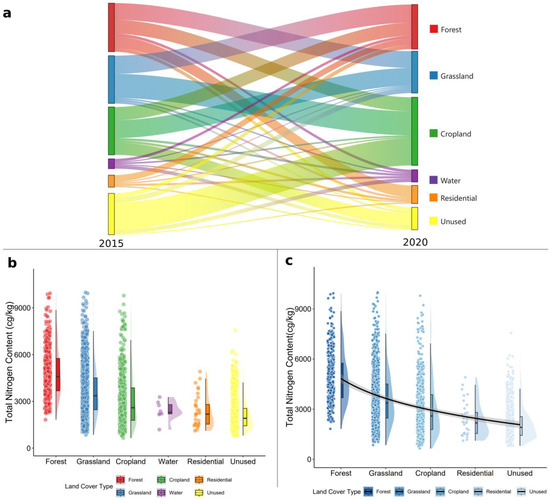
Figure 3.
The overall trend of soil TNC and its variation across different land types. (a) Flow chart of the land transfer matrix in China from 2015 to 2020. (b) Statistical analysis of the TNC of different land types. (c) Evolution of TNC during urbanization in China. The land transfer matrix was plotted using the CNLUCC dataset, total soil nitrogen content data were obtained from SoilGrids, corresponding land types were referred to MODIS land classification data.
The feature extraction and statistical analysis revealed that in 2020 (Figure 3b), forests (4857 cg/kg), grasslands (3579 cg/kg), and cropland (3035 cg/kg) had higher TNC, while unavailable land had lower (2132 cg/kg). By integrating average TNC with land use data, we found that China’s overall soil nitrogen fixation level remained relatively stable (approximately 0.1% change) between 2015 and 2020. The decrease in TNC, mainly due to the reduction in forests and grasslands, was offset by the conversion of unavailable land into cropland. This study revealed that the soil TNC decrease was most rapid during the conversion of forests to grassland or cropland (Figure 3c). Despite the overall stability in soil nitrogen fixation levels, the ongoing conversion of unavailable land to cropland is approaching its limit. If forest and grassland losses continue, soil TNC could decline rapidly.
3.2. Soil Nitrogen Fixation as a Buffer for NO2 Dispersion
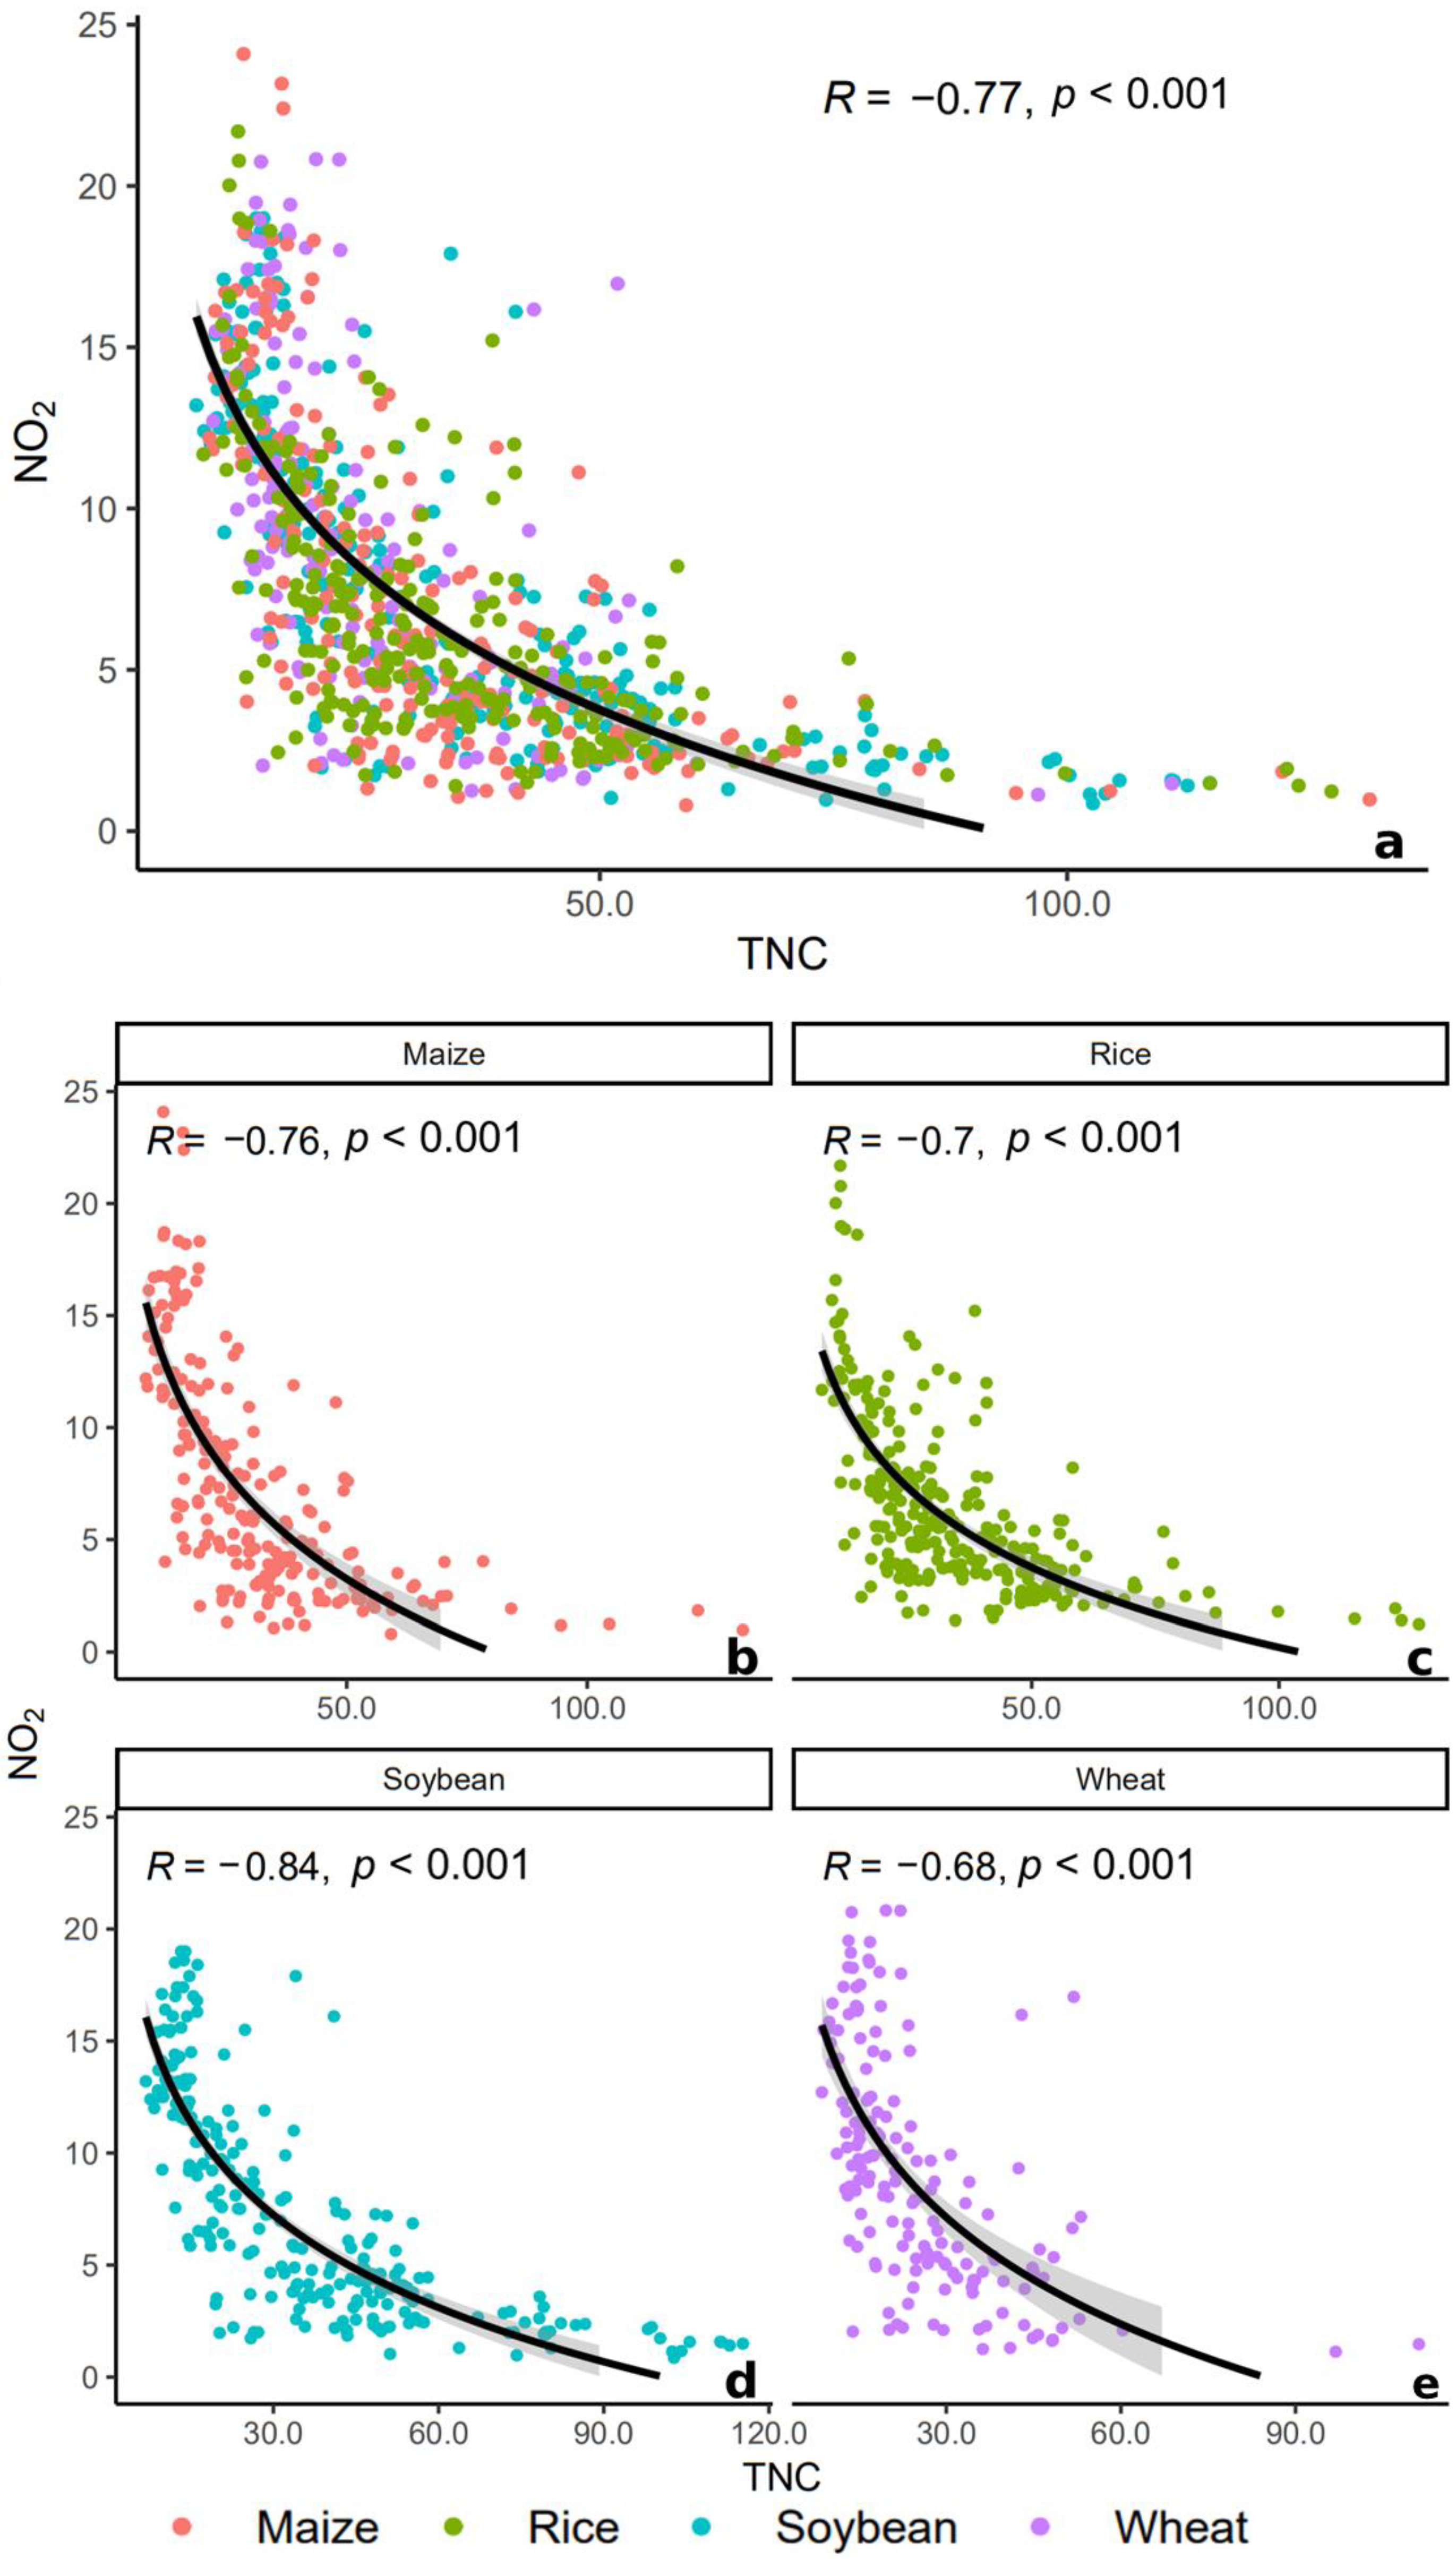
We used the SoilGrids soil information dataset, the TROPOMI module of the Sentinel 5 precursor satellite, and 878 sample points and plotted the relationship between NO2 and TNC (Figure 4), followed by linear regression analysis.
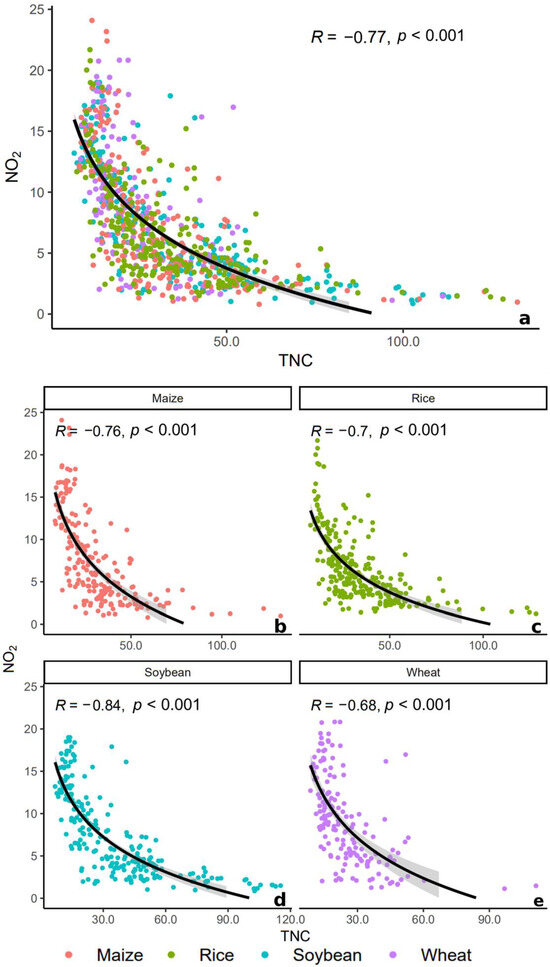
Figure 4.
Linear regression analysis between TNC and NO2 for major grain crops. (a) The scatter plot of the linear relationship between TNC and NO2 for total sample points (R = −0.76). (b) Linear relationship of TNC and NO2 for 202 maize sample points (R = −0.76). (c) Linear relationship of TNC and NO2 for 267 rice sample points (R = −0.70). (d) Linear relationship of TNC and NO2 for 224 soybean sample points (R = −0.84). (e) Linear relationship of TNC and NO2 for 165 wheat sample points (R = −0.68).
The results indicated that, overall, the TNC in the cropland of major food crops exhibited a significant negative linear relationship (R = −0.77) with ambient NO2. When distinguishing sample points based on crop type, we observed that soybean (R = −0.84) and maize (R = −0.76), both types of feed grains, exhibited the most pronounced negative correlations with ambient NO2 levels, whereas the correlations for rice and wheat were comparatively weak. This may be attributed to the higher sensitivity of soil nitrogen fixation systems in feed grains to NO2. The fitted equation estimates suggest that the NO2 concentration will decrease by approximately 10%, 20%, and 30% when TNC increases by 0.62 g/kg, 1.31 g/kg, and 2.10 g/kg, respectively, using 2020 as a baseline. These findings emphasize that TNC-enriched soils may help control NO2 emissions by inhibiting or absorbing NO2 through nitrogen transformation, nitrogen uptake, nitrogen fixation, and other pathways, thereby mitigating air pollution and climate change.
3.3. Crop Yields’ Response to NO2 Concentration and Its Spatial Distribution
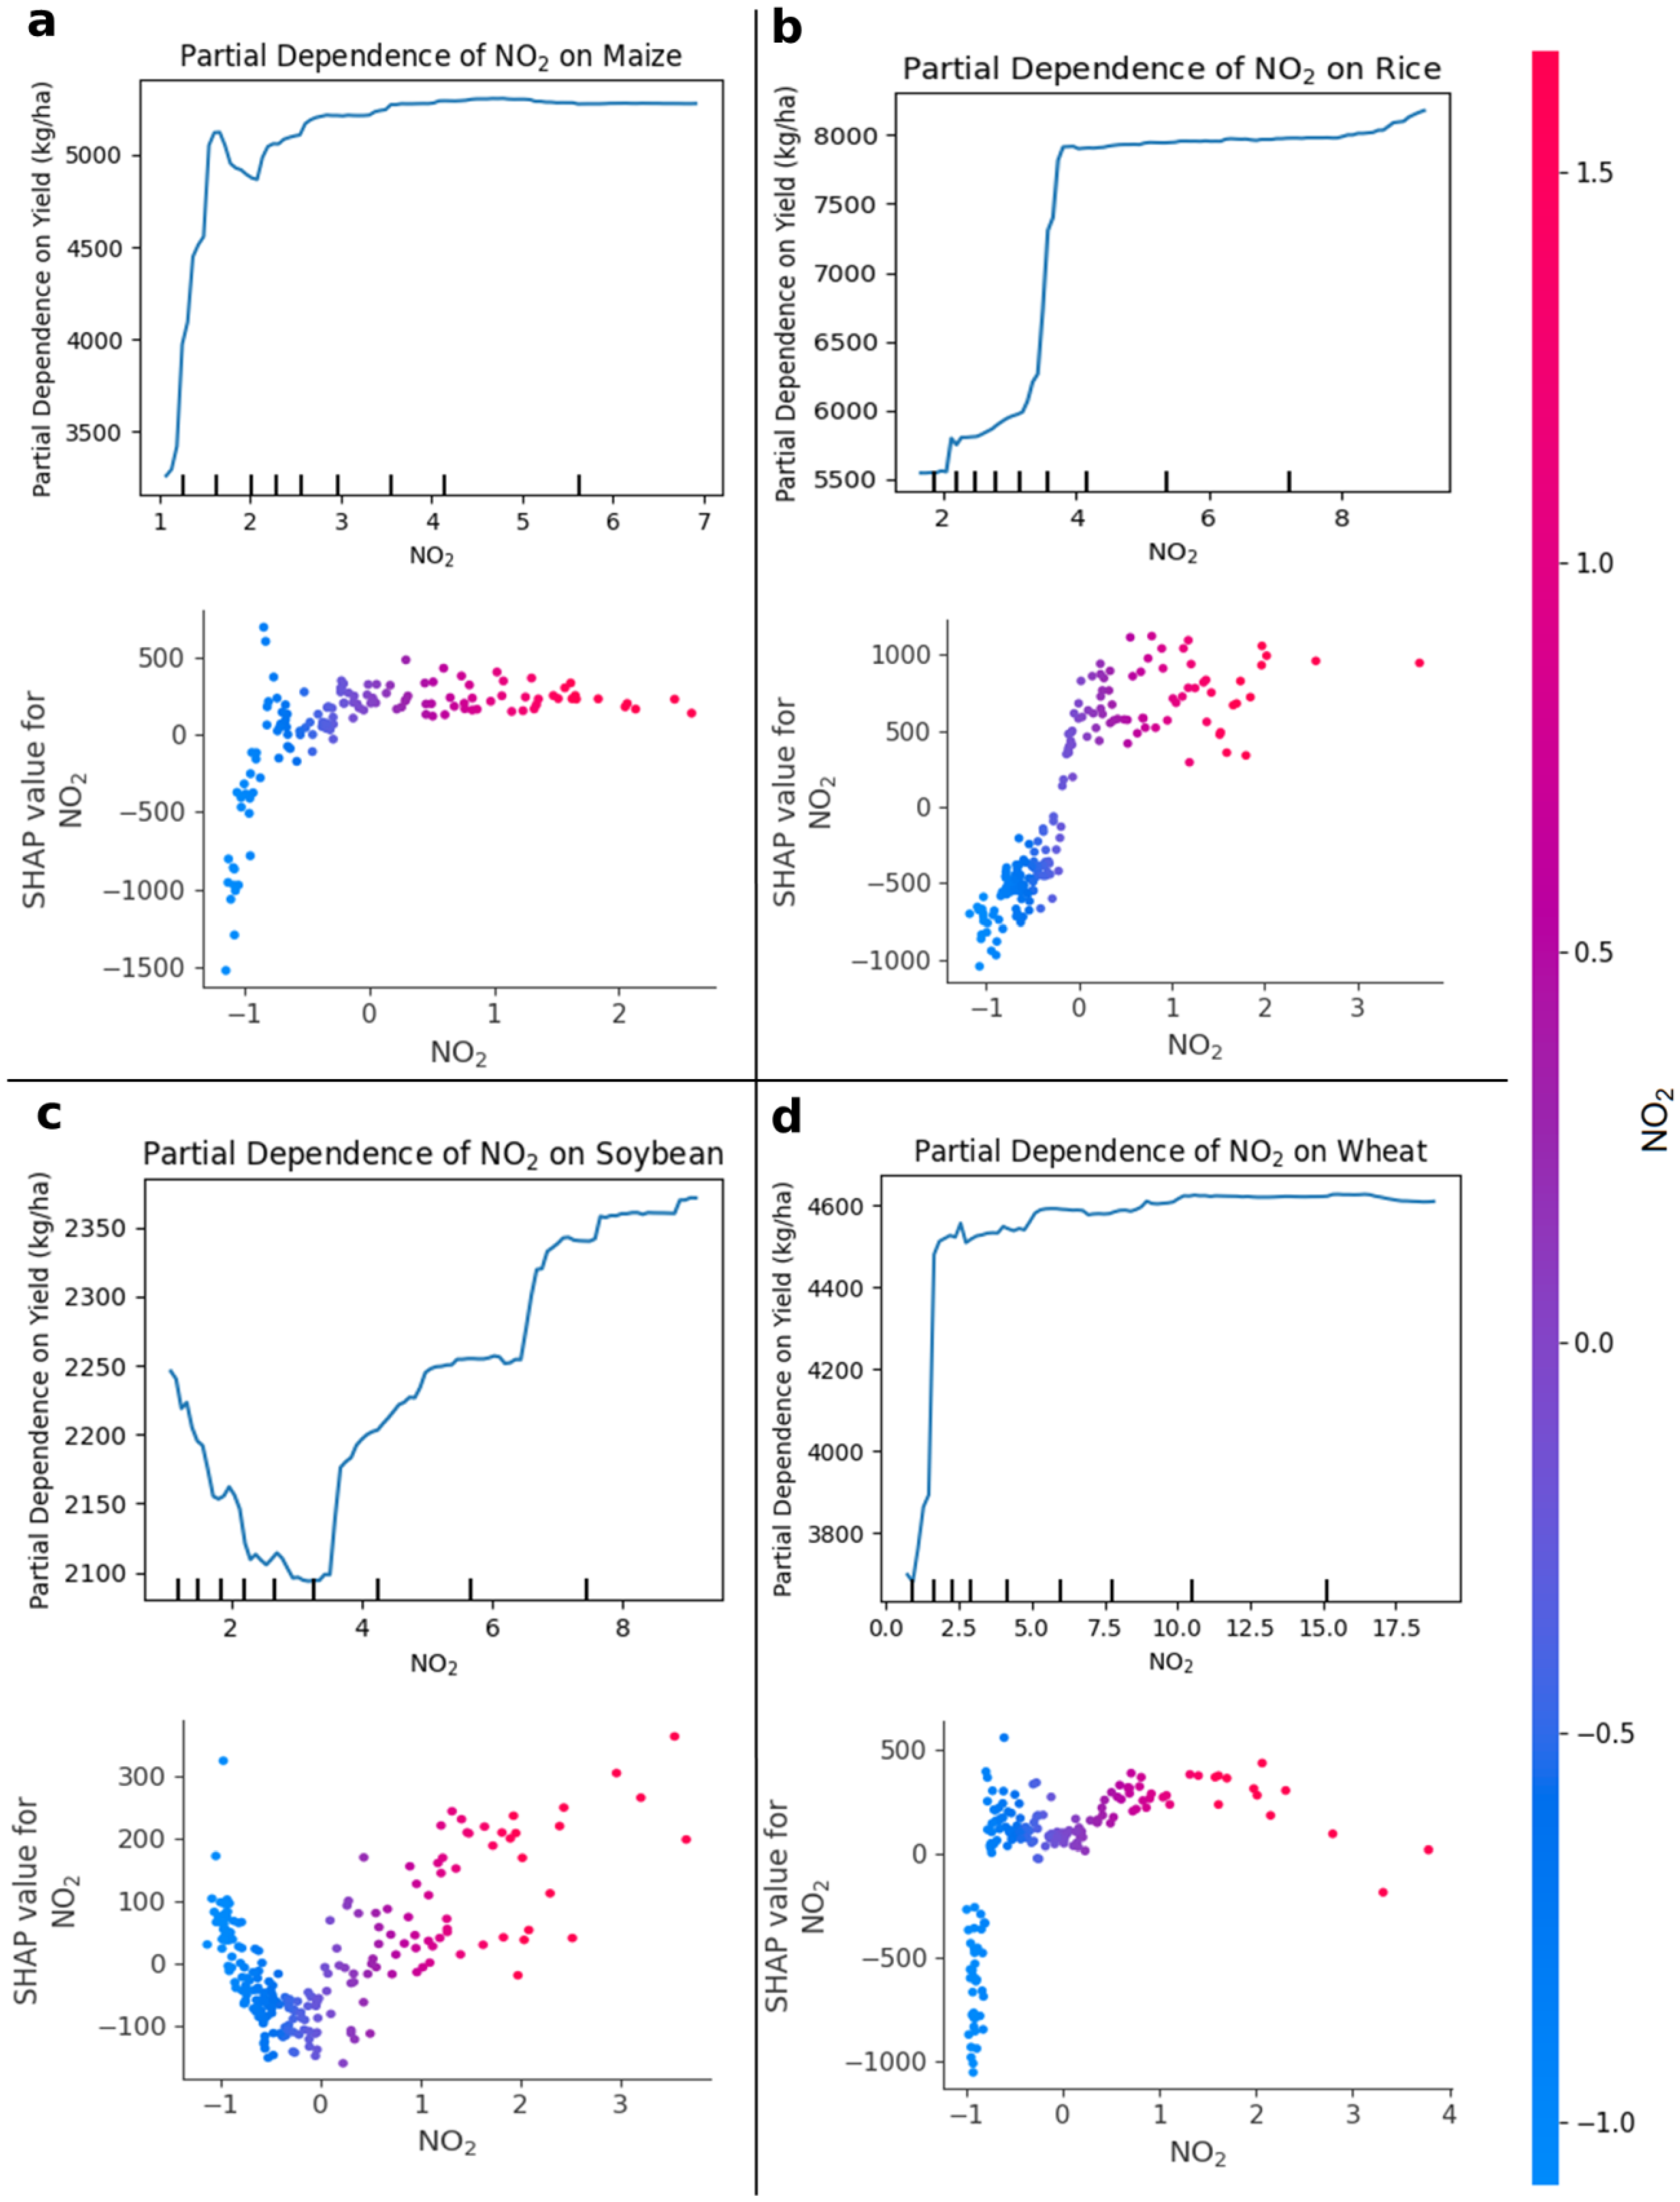
To clarify the relationship between NO2 concentration and crop yield, we conducted an in-depth analysis focused on the transboundary impact of NO2 on the soil nitrogen fixation system. In the bias dependence plots for maize and rice, the yields increased significantly within low NO2 ranges (maize: NO2 ≈ 1–3 × 10⁻⁵ tropospheric vertical column densities (VCDs); rice: NO2 ≈ 2–4 × 10⁻⁵ VCDs). As the NO2 concentrations rose, their contribution to the yields increased but plateaued beyond 4–5 × 10⁻⁵ VCDs. Soybean displayed a distinct response due to its symbiotic rhizobia; low NO2 levels (<3.5 × 10⁻⁵ VCDs) disrupted nitrogen fixation, while moderate levels (3.5 × 10⁻⁵ < NO2 < 7 × 10⁻⁵ VCDs) mitigated this effect. Wheat responded positively to low NO2 concentrations (≈1–2 × 10⁻⁵ VCDs), but excessive NO2 reduced fertilizer efficiency and contributed to soil degradation. The SHAP scatter plots from the XGBoost model aligned with the RFR bias dependence plots (Figure 5), showing the robustness of the analysis in assessing the effects of NO2. This suggests that, although low to moderate concentrations of NO2 are associated with improved major grain crops growth, concentrations above a certain level may produce marginal benefits, leading to nitrogen saturation or soil acidification.

Figure 5.
RFR bias dependence and SHAP scatter plots for the yields of major grain crops under influence of NO2. (a) RFR bias dependence and SHAP scatter plots for maize yields under influence of NO2. (b) RFR bias dependence and SHAP scatter plots for rice yields under influence of NO2. (c) RFR bias dependence and SHAP scatter plots for soybean yields under influence of NO2. (d) RFR bias dependence and SHAP scatter plots for wheat yields under influence of NO2.
We identified the optimal NO2 concentration range for each crop and the spatial distribution of this range (Figure 6). For maize, the yields increased significantly within a NO2 concentration range of 1–3 × 10⁻⁵ VCDs, which covers only 36.3% of the major maize-producing areas. In major maize-producing regions, particularly in the North China Plains and Northeast Plains, the NO2 levels exceeded the crops’ nitrogen uptake capacity. For rice, the effective NO2 range was 2–4 × 10⁻⁵ VCDs, covering 41.5% of the major rice-producing area, with a more stable nitrogen environment observed in the Northeast Plains and Southwest regions. The optimal range for soybean was 3.5–7 × 10⁻⁵ VCDs, covering 38.3% of the major soybean-producing areas, although many areas still experienced incompatible NO2 emissions. For wheat, the effective range was 1–2 × 10⁻⁵ VCDs, covering only 5.77% of the major wheat-producing area. Consequently, major grain-producing regions are currently experiencing NO2 oversaturation. Wheat faces the most severe NO2 challenge, while rice exhibits the best adaptability to current NO2 levels. NO2, as an intermediate in the nitrogen cycle during crop growth, reflects nitrogen accumulation in the environment. However, excessive fertilization and uncontrolled emissions have caused NO2 levels to exceed optimal ranges.
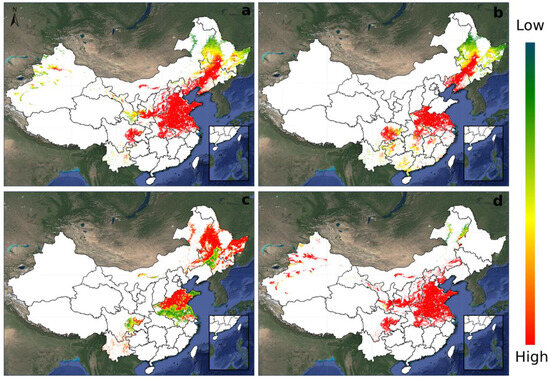
Figure 6.
Spatial distribution of the optimal NO2 concentration range for major grain crops in China. (a) Spatial distribution of the optimal NO2 concentration range for maize in major maize-producing areas. (b) Spatial distribution of the optimal NO2 concentration range for rice in major rice-producing areas. (c) Spatial distribution of the optimal NO2 concentration range for soybean in major soybean-producing areas. (d) Spatial distribution of the optimal NO2 concentration range for wheat in major wheat-producing areas. The legend shows the extent of NO2 impact on different crops, with colors ranging from blue (low impact) to red (high impact). The red areas highlight regions where crops are more vulnerable to the adverse effects of NO2. The basemap is from Google Earth.
3.4. Crop Yields’ Response to All Feature Variables
The importance ranking in the RFR can enhance our understanding of the extent of the transboundary impacts of NO2. Based on the importance ranking results of the RFR model, NO2 had the highest importance in crop yield prediction models for maize, rice, and wheat, with importance scores of 0.179, 0.404, and 0.140, respectively (Figure S1). Rice, in particular, exhibited a significantly greater influence of NO2 compared to the other feature variables, probably because rice growth is more dependent on atmospheric and aquatic feature variables than on soil properties. In major soybean-producing areas, the negative correlation between TNC and NO2 was significant, although TNC ranked second (0.141) in importance for soybean and third (0.091) for maize.
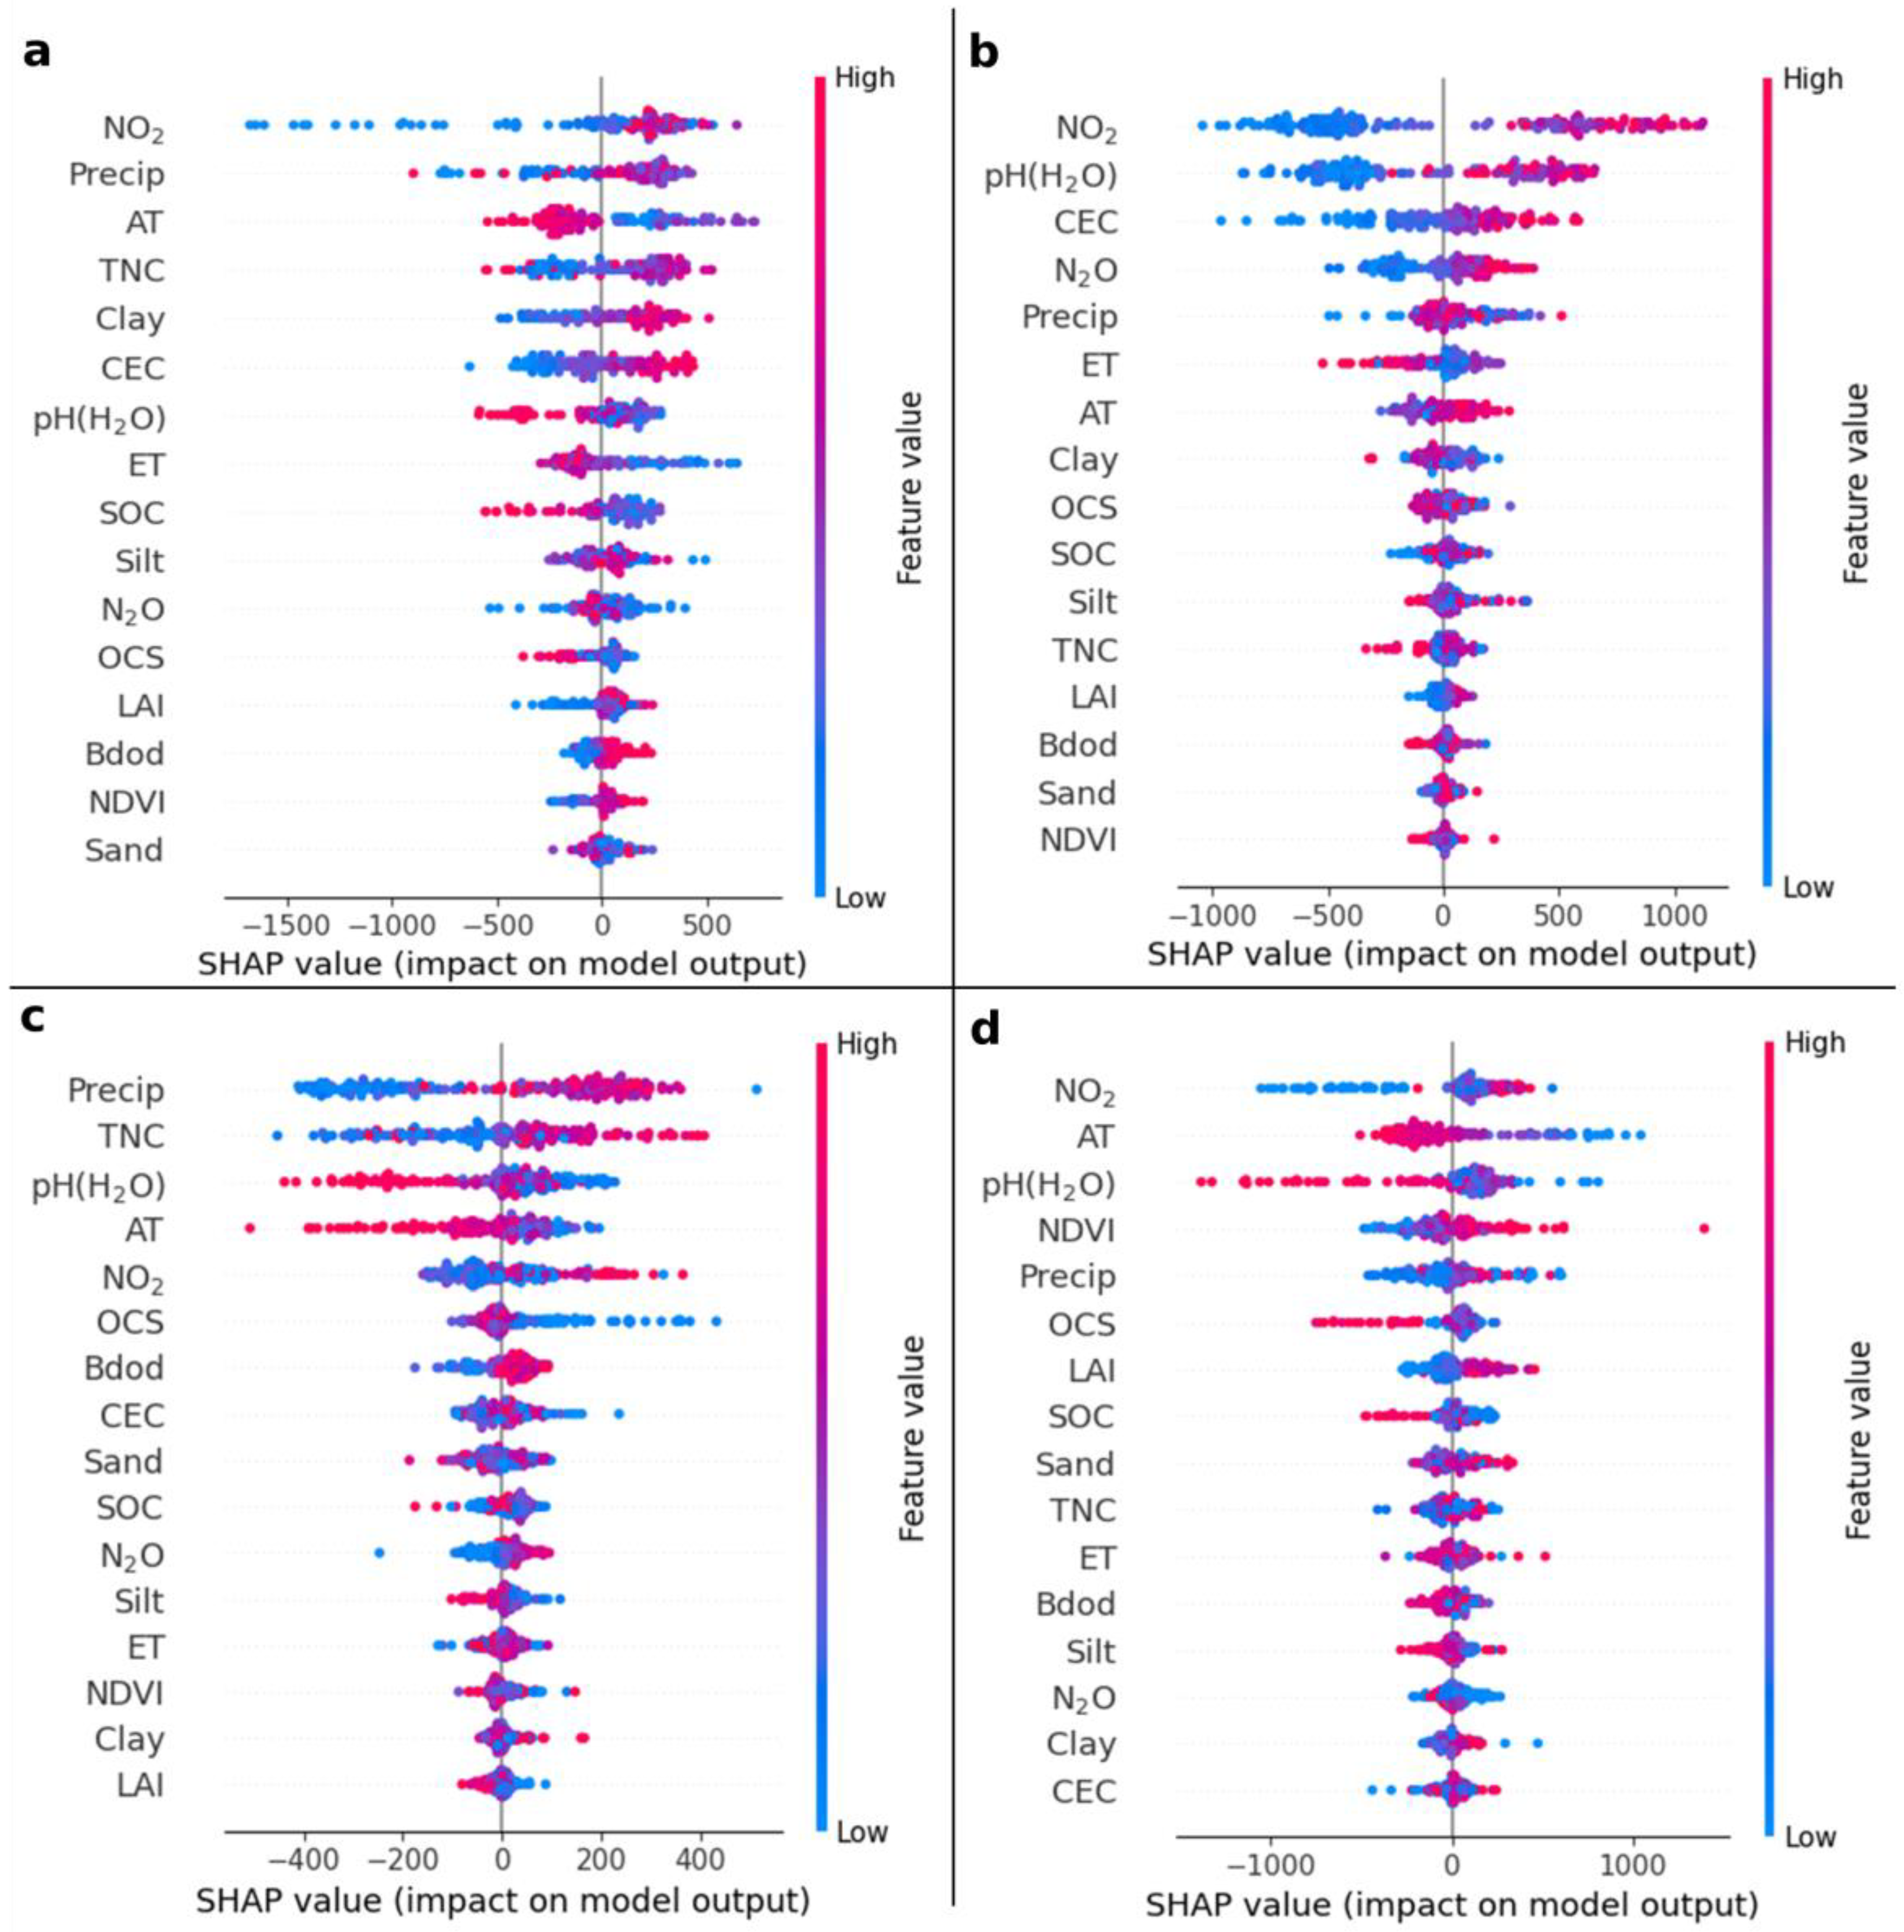
The correlations between other variables and crop yields, as derived from the XGBoost model, are also worth analyzing as potential factors influencing results. The SHAP ranking results for XGBoost were generally consistent with the variable importance ranking from the RFR. However, due to SHAP’s inherent randomness based on game theory, some variables with similar influence showed slight variations in ranking, although the overall trend remained unchanged. The results indicate that Precip and AT are two variables correlated with maize yield (Figure 7a). In rice, pH (H2O) and cation exchange capacity (CEC) are the main variables, with pH (H2O) values showing a significant negative correlation with yield (Figure 7b). For soybean, Precip, TNC, and pH (H2O) are important variables, with Precip showing a significant positive correlation with yield (Figure 7c). In wheat, pH (H2O) and AT are key variables, but low pH (H2O) values show a moderate negative correlation with yield (Figure 7d). We summarize four key observations on the trends of these variables: (1) NO2 shows a positive correlation with crop yield within a certain concentration range. (2) AT affects maize and wheat yields, with optimal temperatures enhancing photosynthesis and kernel filling. (3) Precip is critical for maize and soybean yields, with appropriate levels improving root development. (4) pH (H2O) affects crops differently: rice thrives in acidic soils, soybeans prefer neutral to slightly acidic soils, and wheat can tolerate a broader range of conditions. However, extreme pH levels still impact the production of major crops.
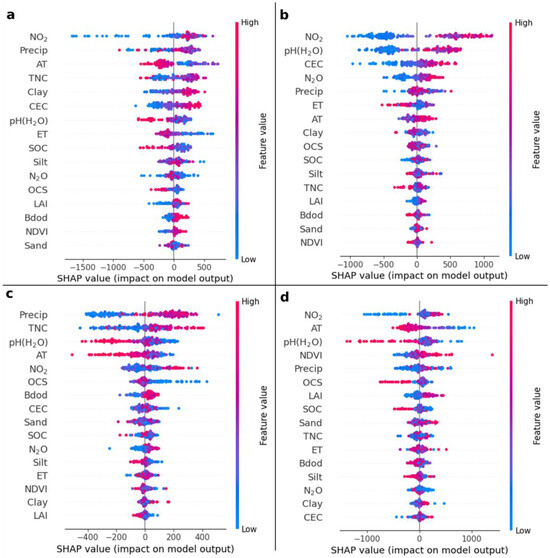
Figure 7.
Impact of all feature variables on major grain crops in XGBoost yield prediction models. (a) Impact of all feature variables on maize yield prediction models. (b) Impact of all feature variables on rice yield prediction models. (c) Impact of all feature variables on soybean yield prediction models. (d) Impact of all feature variables on wheat yield prediction models. The impact of different variables on crop yield is represented by SHAP values, and the magnitude of the variables’ eigenvalues is indicated by color.
3.5. Impacts of NO2 on Crop Yields at Different Soil Nitrogen Fixaiton Levels
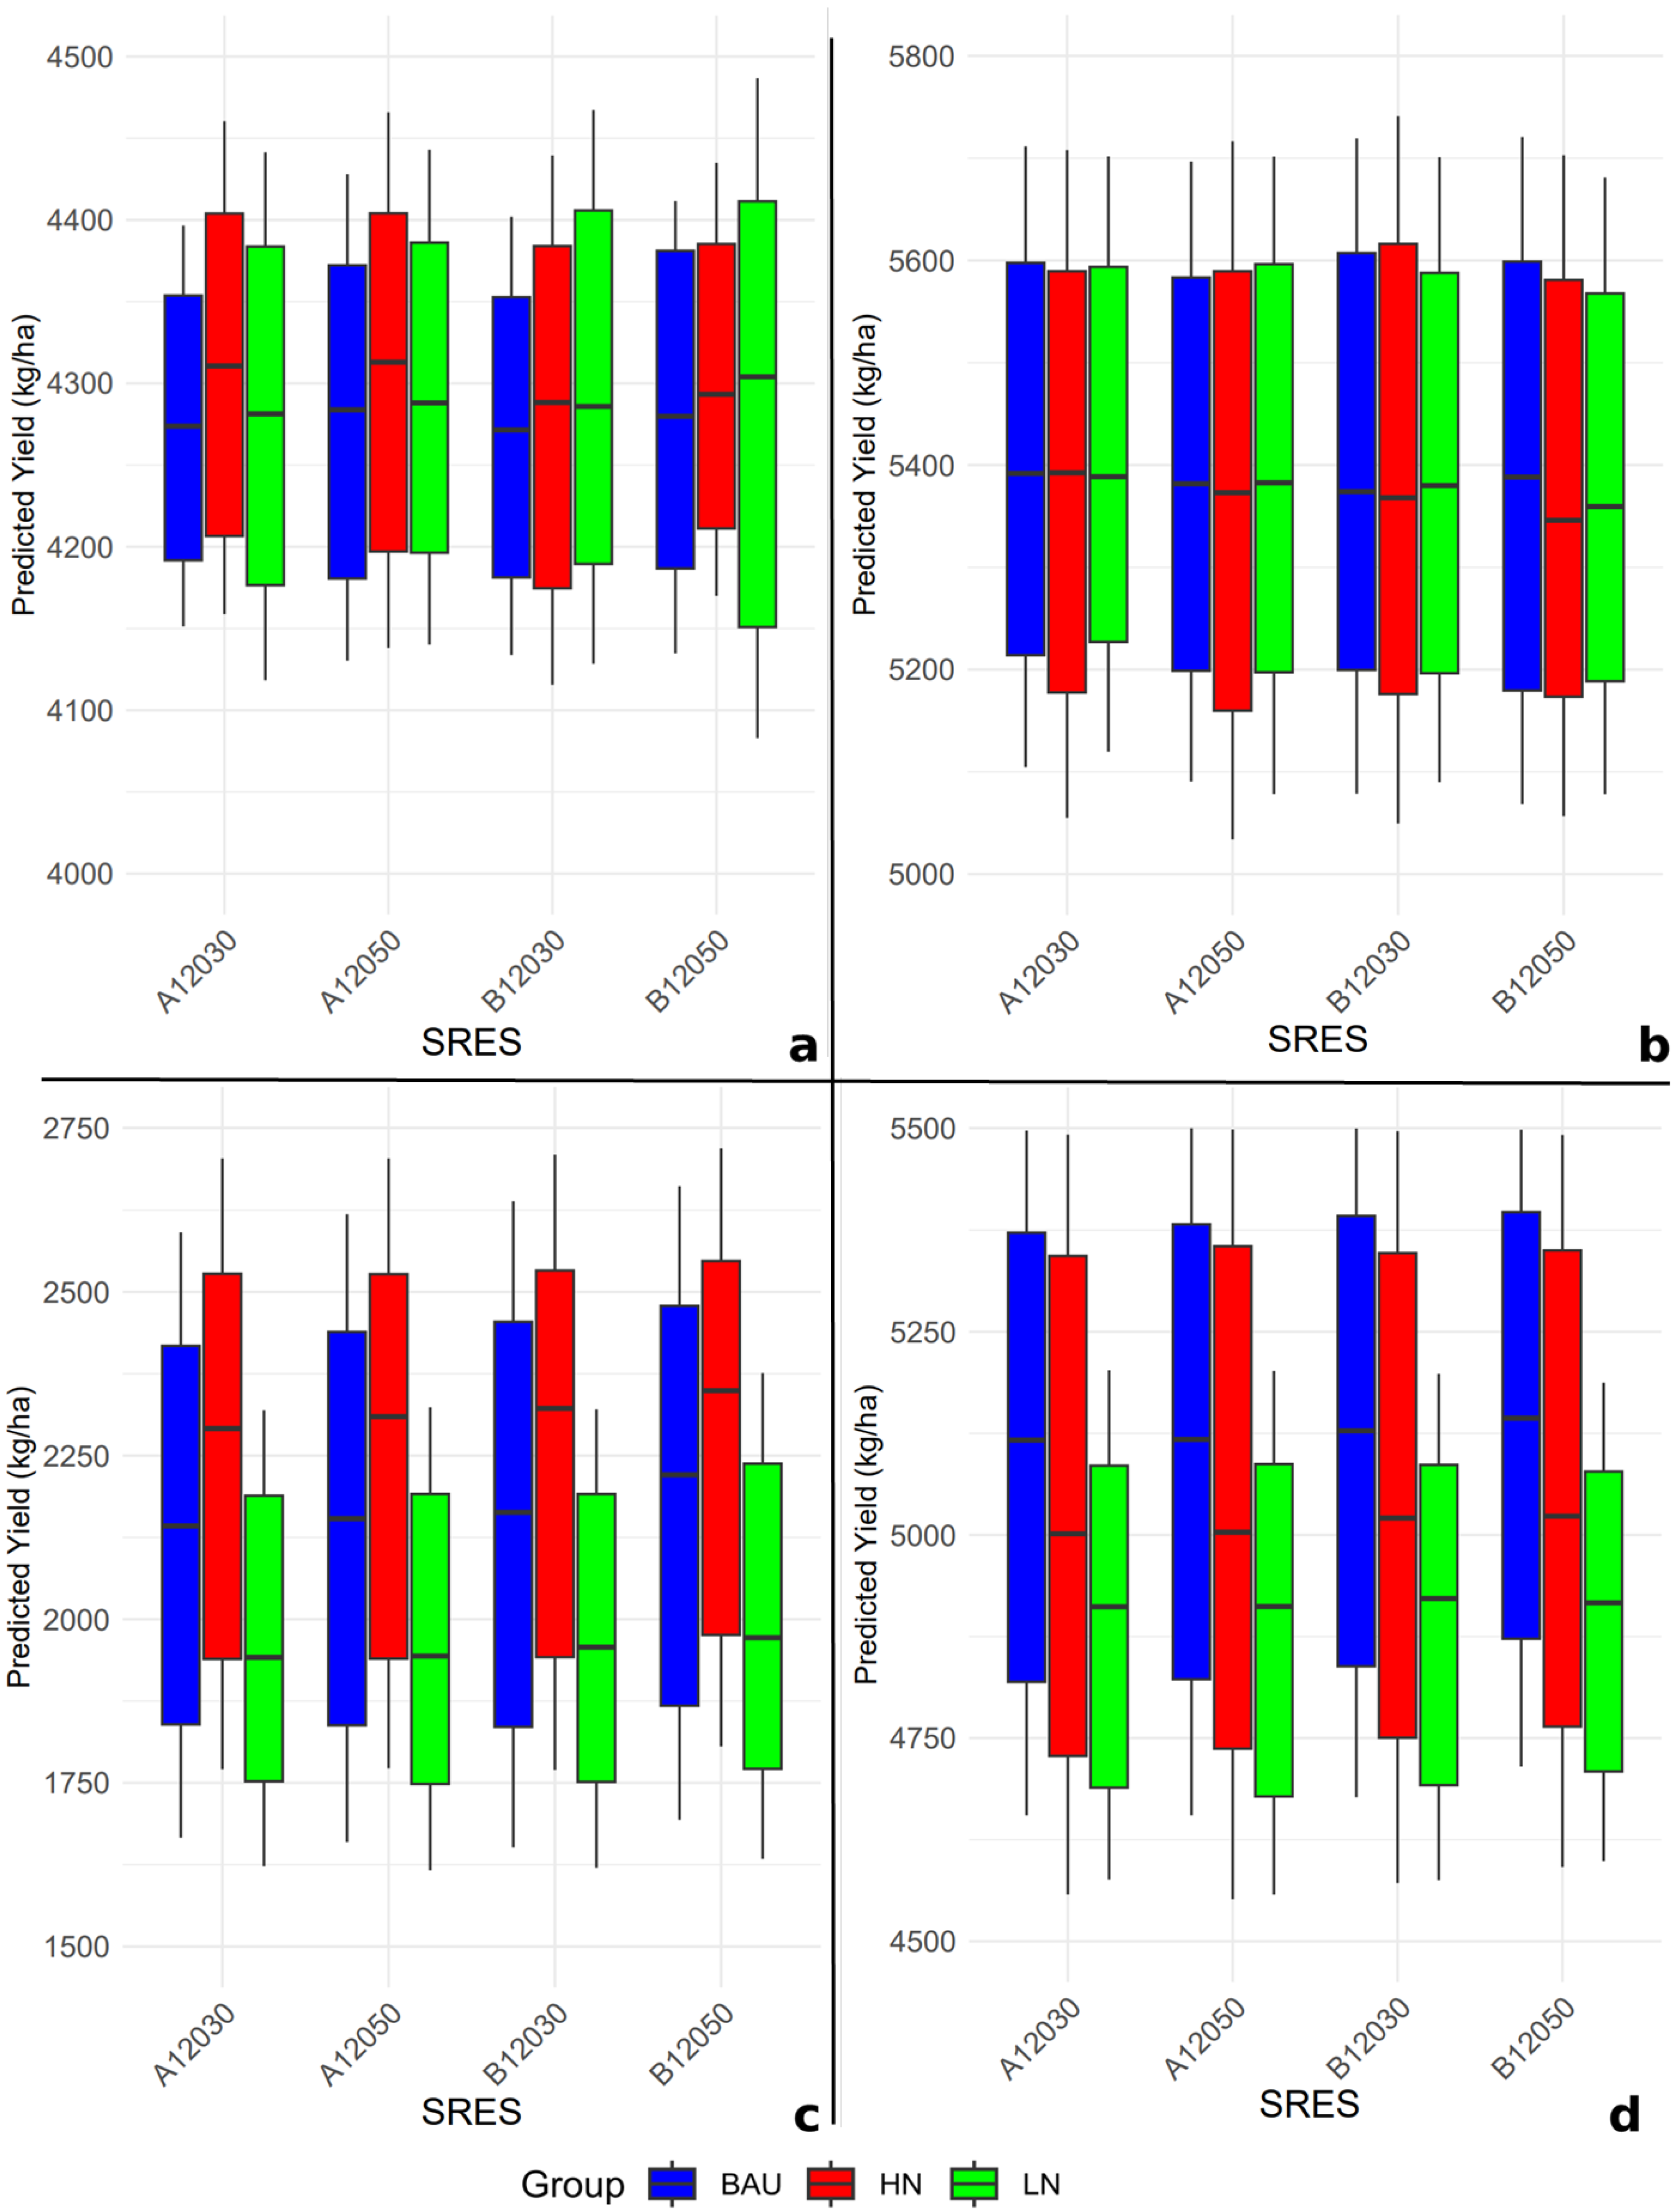
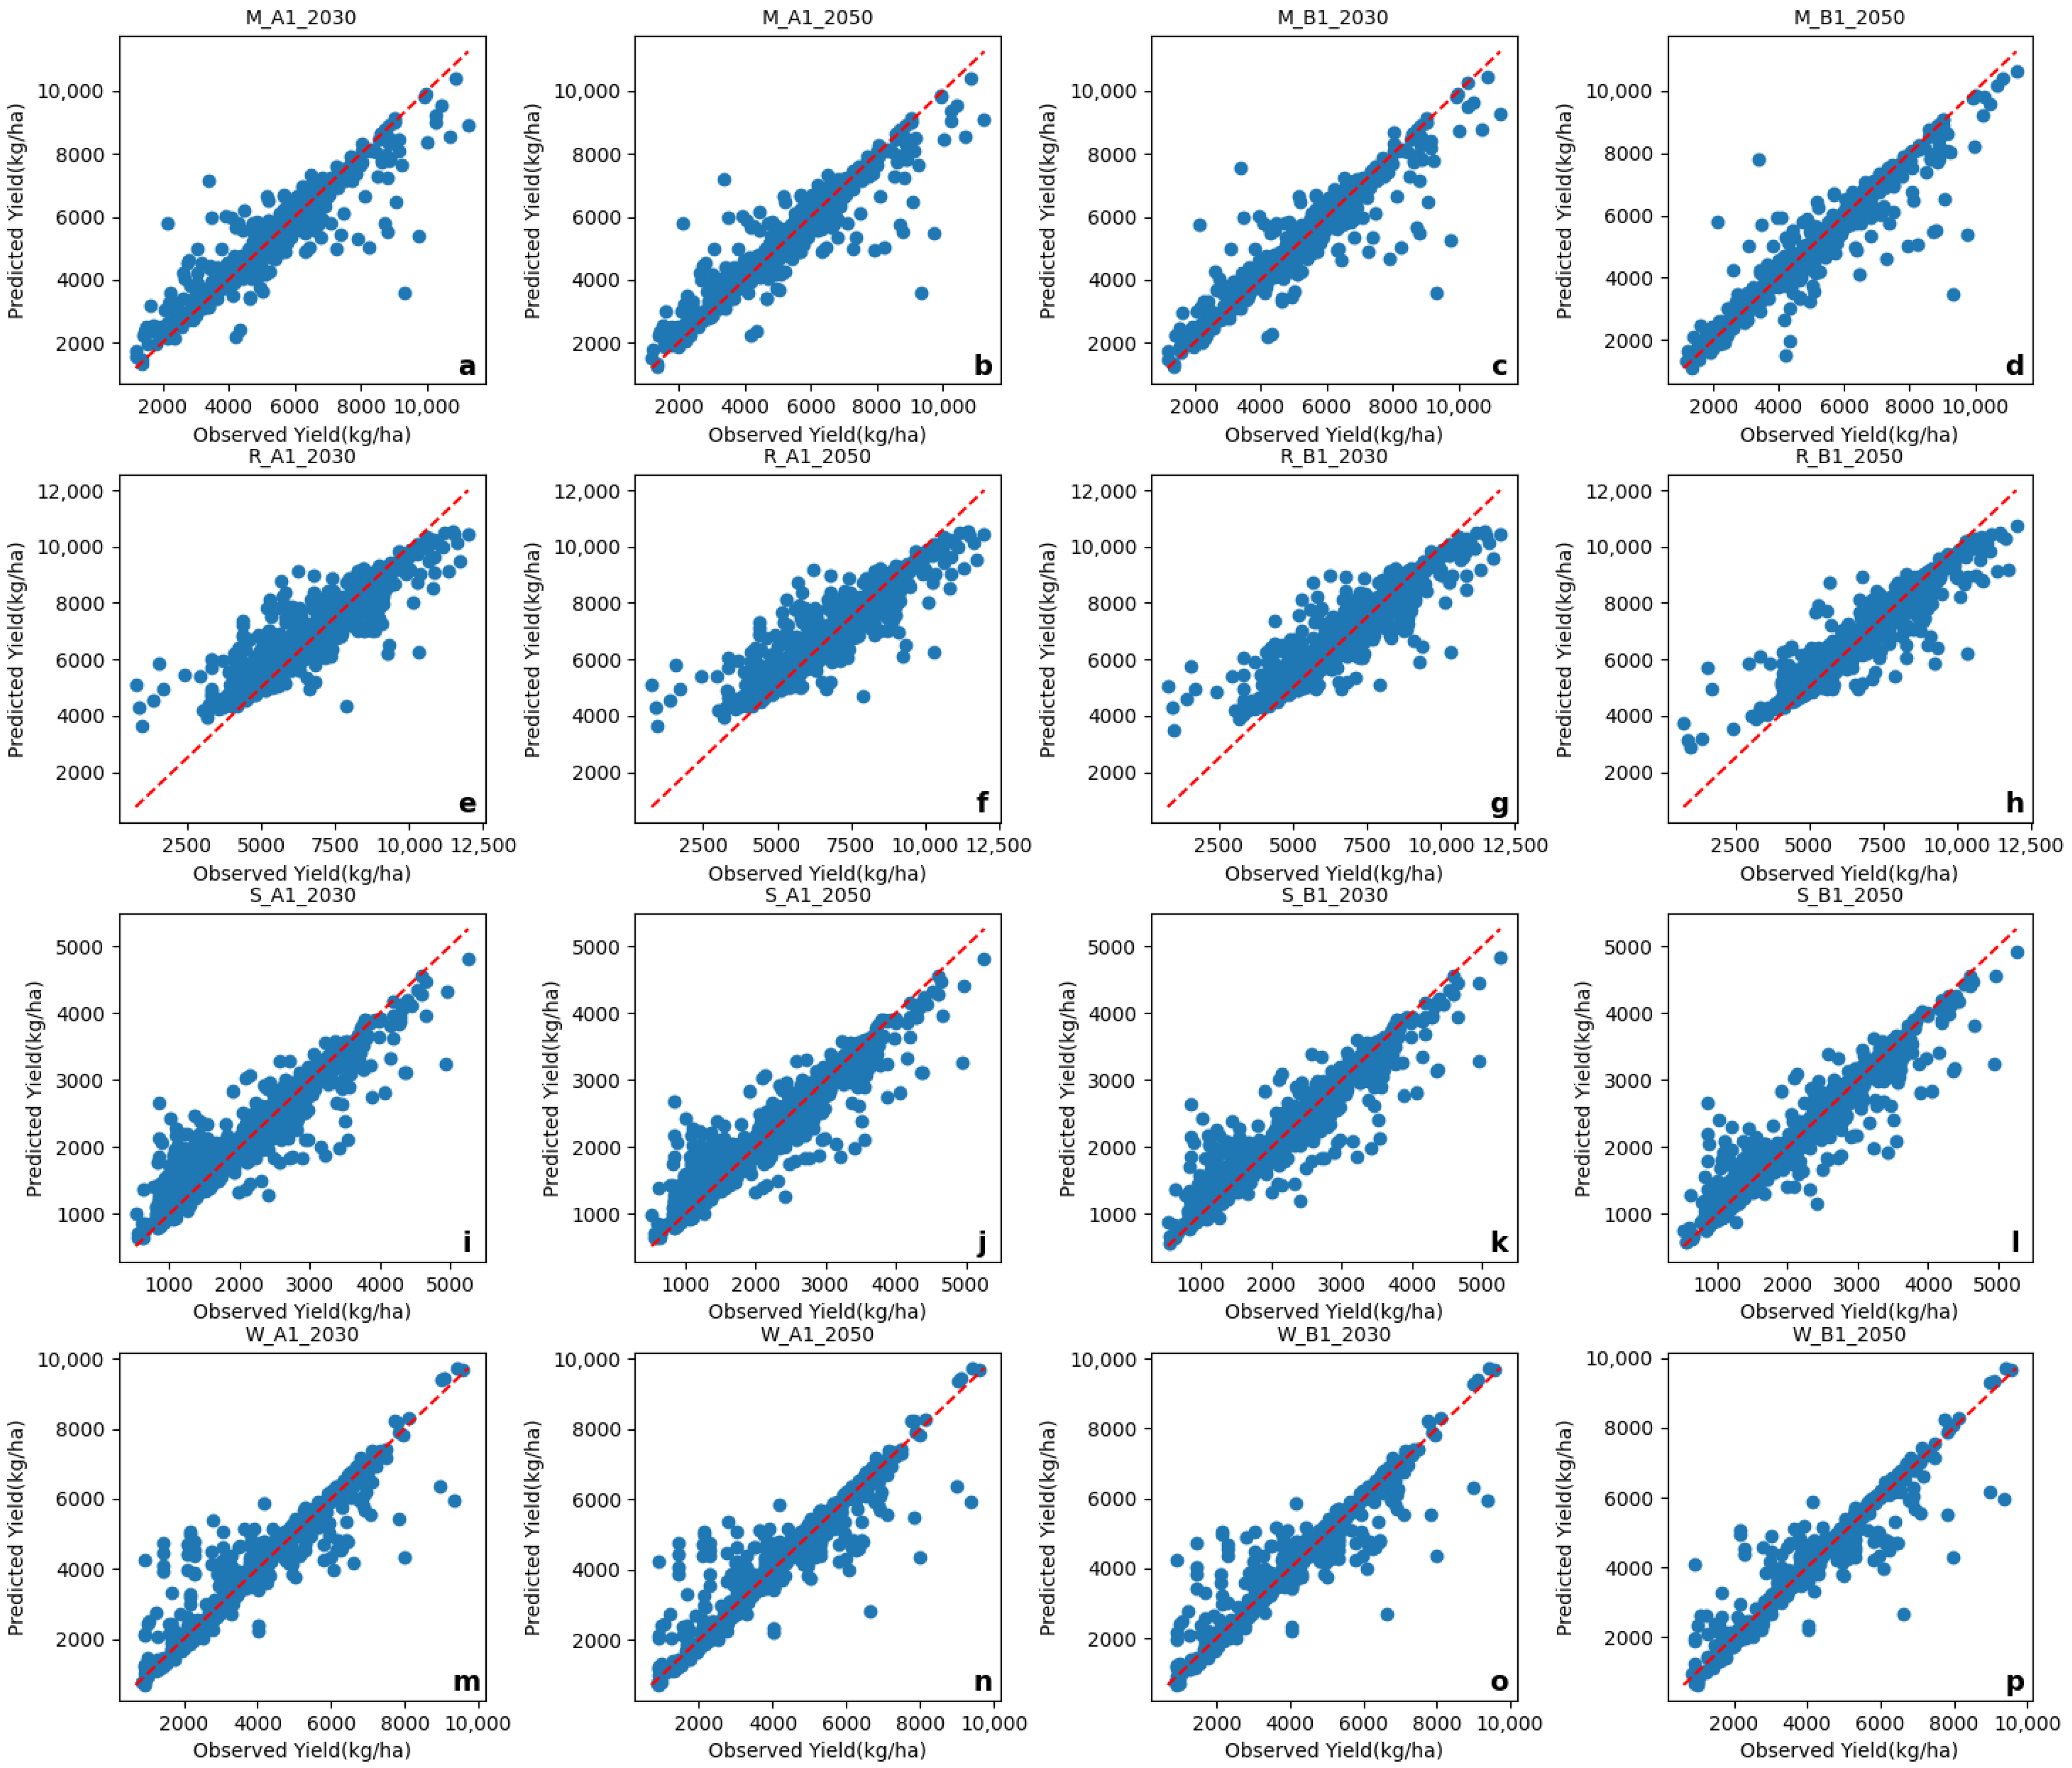
To better understand the transboundary impacts of NO2 on cropland and its impact on crop yields within a more sustainable resource context, we analyzed yield changes for major grain crops in 2030 and 2050 under different nitrogen fixation levels, based on the SRES A1 AIM (balanced) and B1 IMAGE (clean energy) scenarios. Our findings reveal that different NO2 emission scenarios significantly influence maize yields (Figure 8). In the more sustainable B1 IMAGE scenario, as NO2 concentrations decrease, maize yields increase. Nitrogen fixation levels—BAU (TNC basic as usual), HN (TNC increase by 20%), and LN (TNC decrease by 20%)—substantially affect nitrogen-demanding crops, particularly feed grains like soybeans and maize. For soybeans, the predicted yields increase under HN and decrease under LN. Based on a scenario analysis, we found that in the next 20–30 years, under a relatively clean scenario, if soil nitrogen fixation levels increase by 20%, the average soybean yield will increase to 2407 ± 38 kg/ha, representing an 8% increase. Conversely, if soil nitrogen fixation levels decrease by 20%, the average soybean yield will decline to 2013 ± 31 kg/ha, representing an 9.7% decrease. The scatter plot of the predicted versus the observed yields under different SRES scenarios (Figure 9) demonstrates the robustness of our model fit.
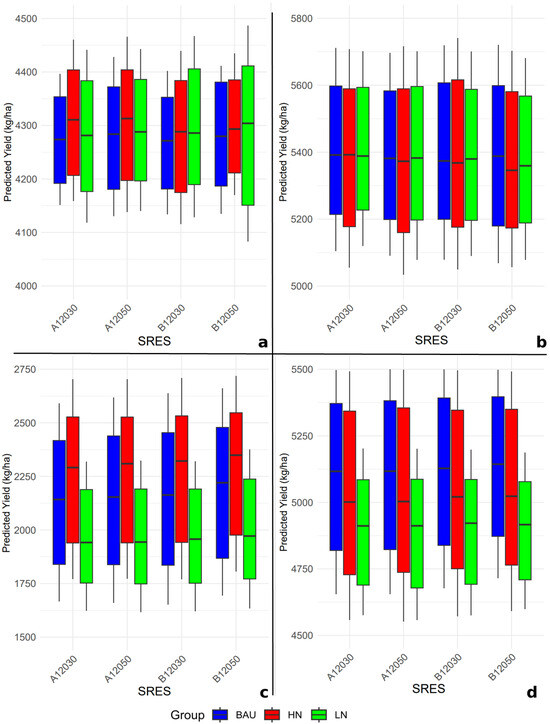
Figure 8.
Crop yield predictions at different nitrogen fixation levels for SRES in 2030 and 2050. (a) Maize yield predictions at different nitrogen fixation levels for SRES in 2030 and 2050. (b) Rice yield predictions at different nitrogen fixation levels for SRES in 2030 and 2050. (c) Soybean yield predictions at different nitrogen fixation levels for SRES in 2030 and 2050. (d) Wheat yield predictions at different nitrogen fixation levels for SRES in 2030 and 2050. The nitrogen fixation levels include basic as usual (BAU), high nitrogen (HN), and low nitrogen (LN). The two SRES scenarios from the Intergovernmental Panel on Climate Change (IPCC) are A1 AIM (balanced) and B1 IMAGE (clean energy), in 2030 and 2050.
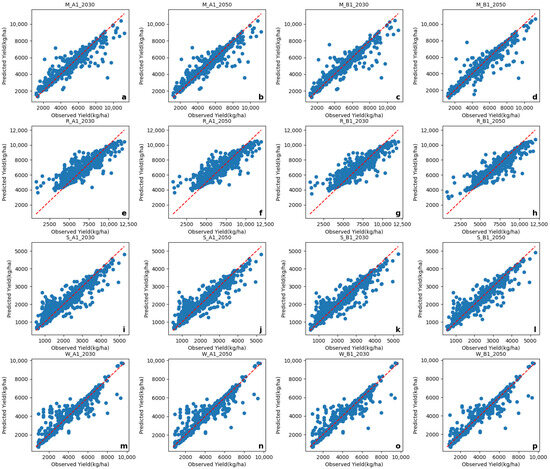
Figure 9.
Scatter plot of predicted vs. observed yields at BAU nitrogen fixation levels under different SRES. (a–d) Scatter plot of predicted vs. observed maize yield under the A1 AIM and B1 IMAGE scenarios. (e–h) Scatter plot of predicted vs. observed rice yield under the A1 AIM and B1 IMAGE scenarios. (i–l) Scatter plot of predicted vs. observed soybean yield under the A1 AIM and B1 IMAGE scenarios. (m–p) Scatter plot of predicted vs. observed wheat yield under the A1 AIM and B1 IMAGE scenarios.
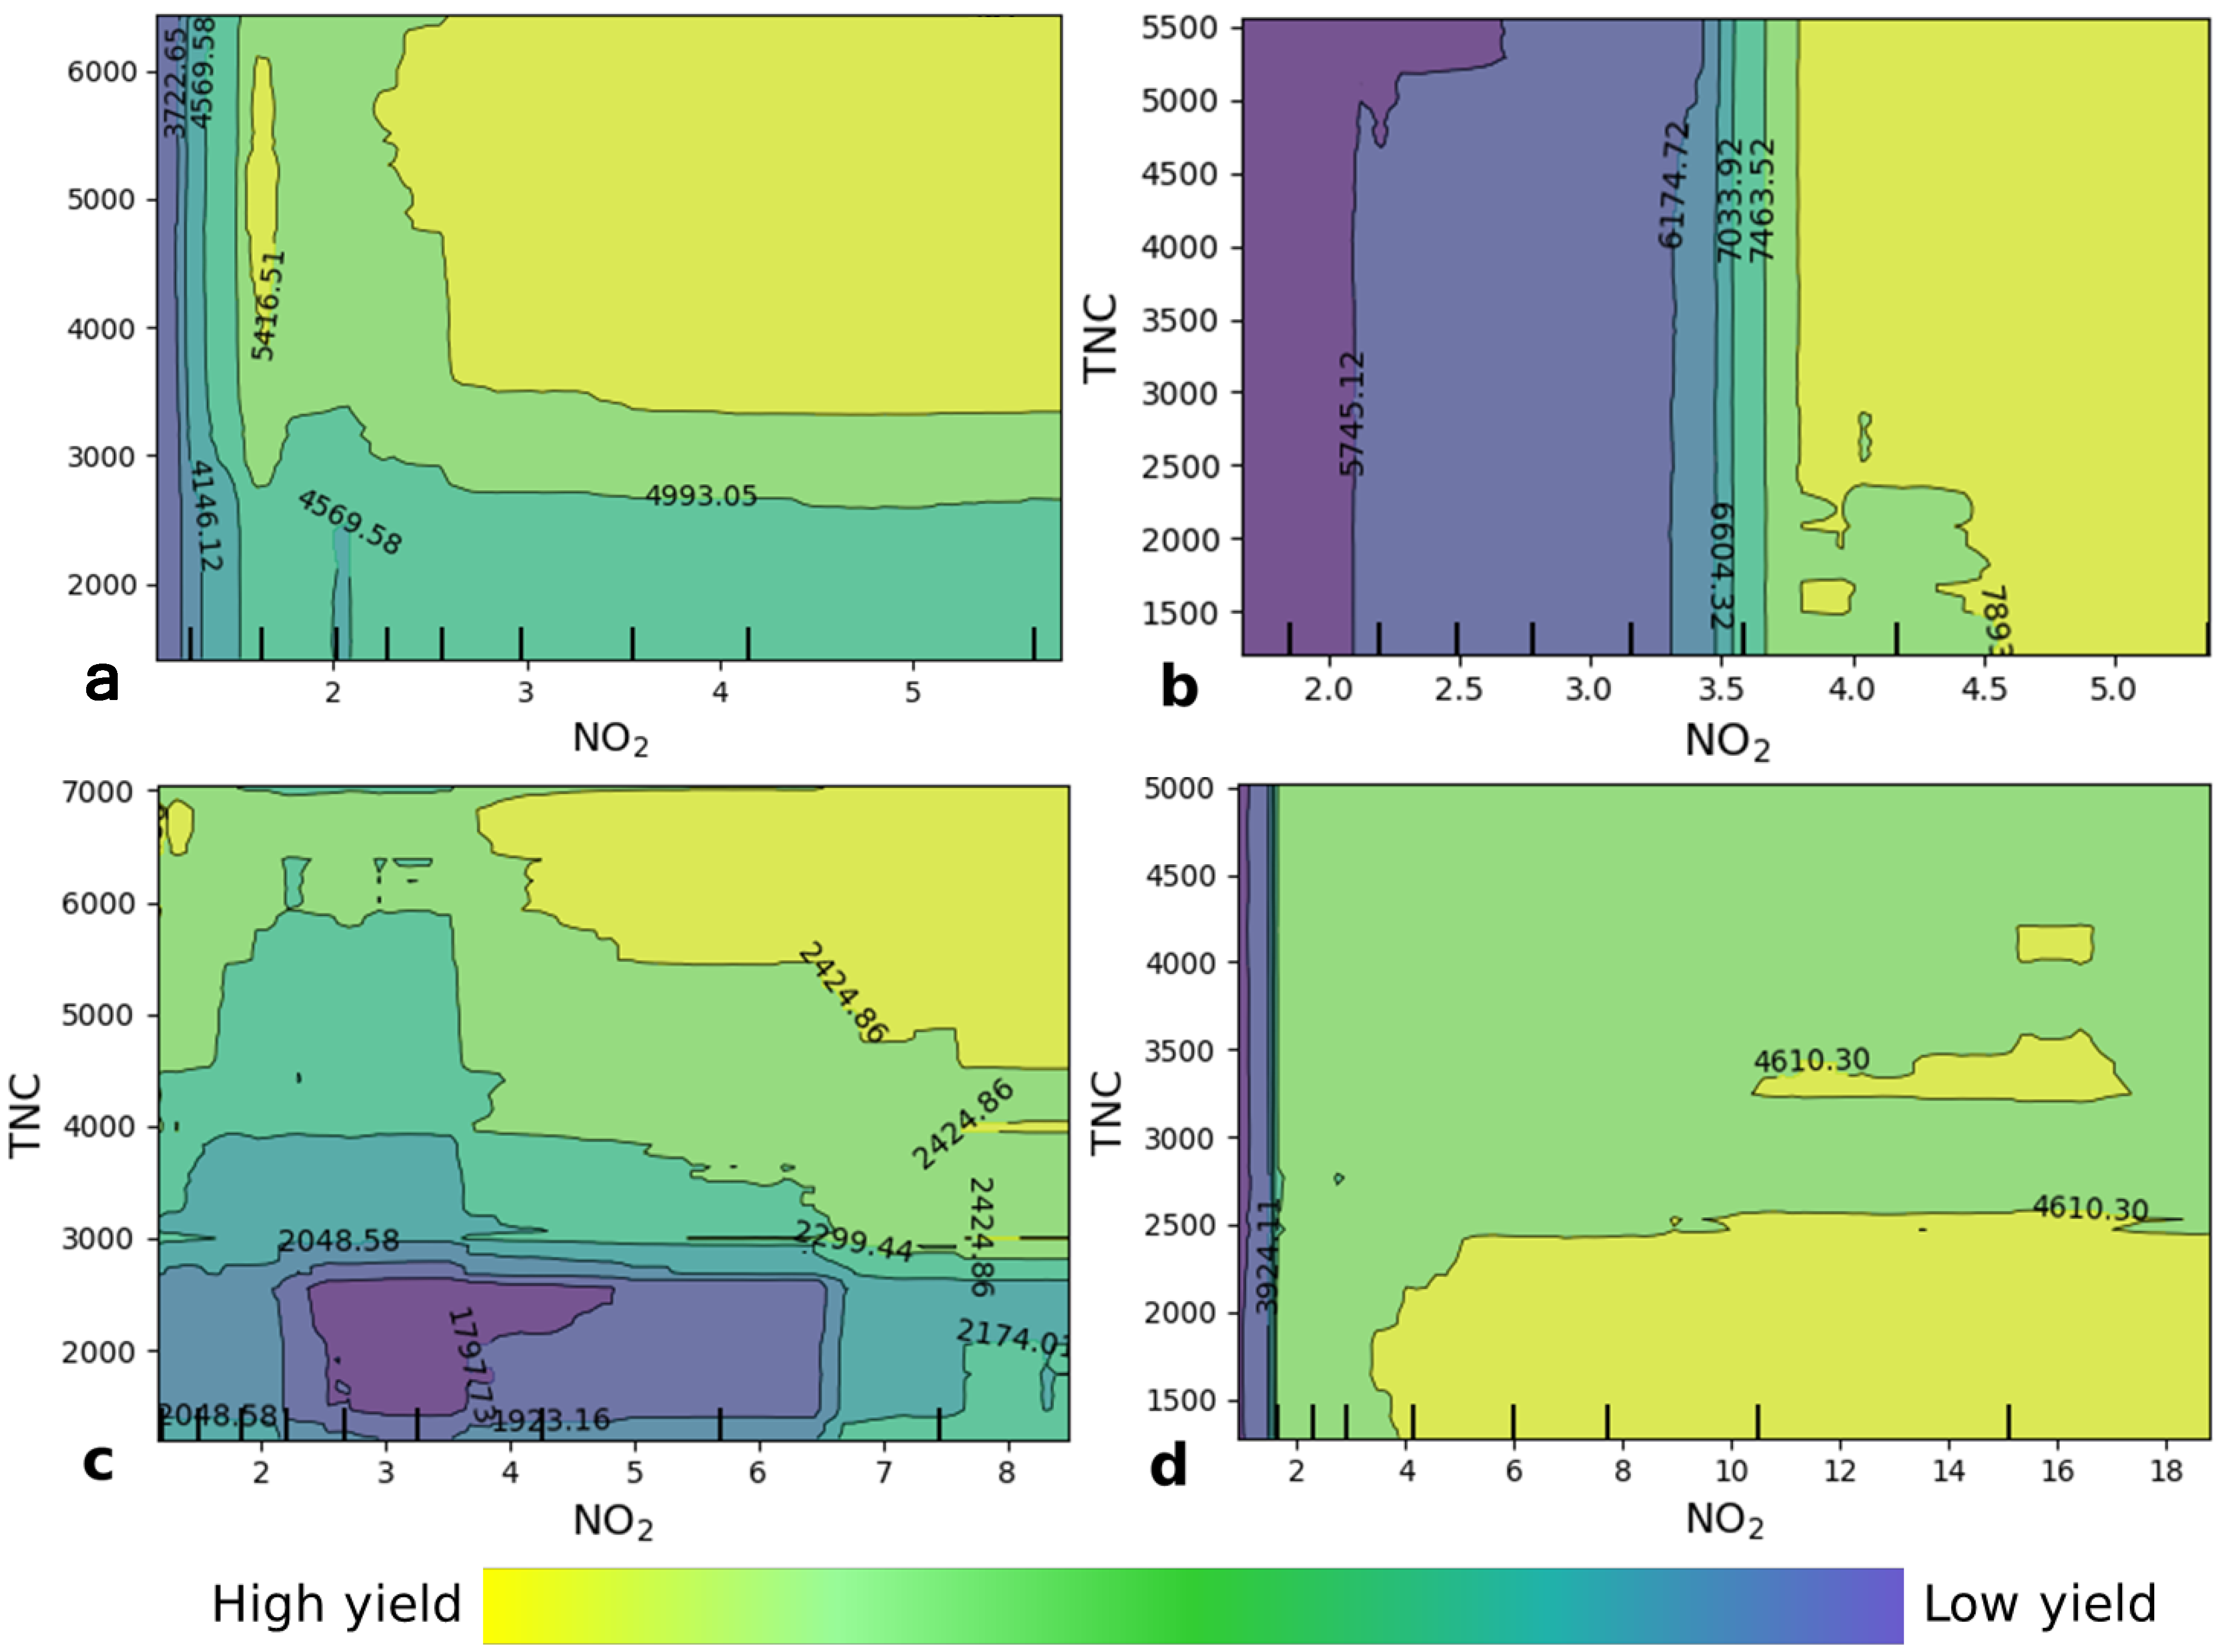
Upon comparing the significance of different crops’ responses to NO2 and TNC, we observed varied responsiveness across crops to different nitrogen levels (Table 2). Soybeans exhibited a highly significant response to TNC (p < 0.001), whereas their response to NO2 was not significant. Maize showed a highly significant response to TNC (p < 0.001) and a moderately significant response to NO2 (p < 0.05). Rice’s response to NO2 was highly significant (p < 0.001), but its response to TNC was not significant. Wheat’s response to both TNC and NO2 was not significant. This result is also reflected in the dual dependence plots of TNC and NO2 for the yields of major grain crops (Figure 10). The significance of the impact and the optimal TNC and NO2 combinations for different crops can be inferred from the general trends of the response surface. Furthermore, we found that the use of clean energy enhances the stability of crop yields at high nitrogen fixation levels, while its impact is less pronounced at low nitrogen fixation levels. Therefore, in addition to prioritizing air pollution control, it is essential to consider the environmental conditions of crop production areas and the security of cropland quality. These results reveal the long-term effects of climate and management practices on different crop yields under various scenarios. Therefore, nitrogen fertilization and related environmental management measures should consider the specific responses of these crops, particularly under different climate change scenarios, to ensure food security and sustainable agriculture.
Table 2.
Significance of yield response to NO2 and TNC in different grain crops.
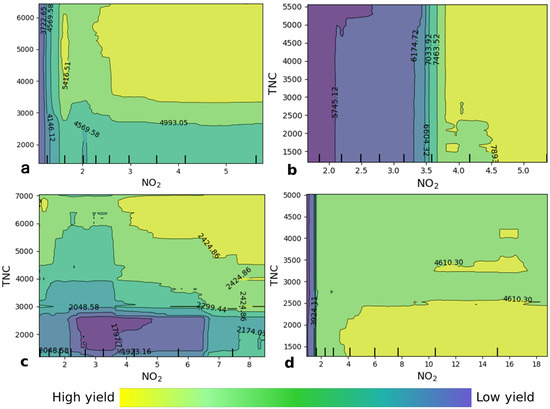
Figure 10.
The dual dependence plots of TNC and NO2 for the yields of major grain crops. (a) Partial dependence of NO2 and TNC on maize yield. (b) Partial dependence of NO2 and TNC on rice yield (kg/ha). (c) Partial dependence of NO2 and TNC on soybean yield (kg/ha). (d) Partial dependence of NO2 and TNC on wheat yield (kg/ha).
4. Discussion
4.1. The Application of Machine Learning Modeling in Agriculture
For our method selection, we chose machine learning to establish the yield model, as machine learning is increasingly relevant and suited to agricultural research, particularly in the field of big data. The combination of machine learning, big data technologies, and high-performance computing has opened up new opportunities for data-intensive research in the multidisciplinary field of agricultural technology [34]. For example, one study [25] used soil data and remote sensing data to predict the single-season wheat yield in a 22-hectare field in Bedfordshire, UK. Another study applied machine learning algorithms to estimate the spatial variation in carbon emissions caused by energy consumption in Shaanxi, China [35]. Additionally, a study used machine learning algorithms and multiple indicators to assess the early prediction of maize yields at the county level in China [36]. These studies collectively indicate that the use of machine learning algorithms in various aspects of agricultural research is gradually becoming mainstream.
4.2. Potential Explanations for the Insignificant Impact of NO2 on the Yields of Certain Crops
Although NO2 is generally harmful to plants, the negative impact of NO2 on crop yields is not significant in our study. Based on related mechanistic studies [12,37,38], we propose three potential explanations for this phenomenon. First, machine learning captures interactions between variables, which may alleviate the harmful effects of NO2. Second, in real agricultural environments, crops may develop resistance or adaptive mechanisms that reduce NO2 toxicity. For instance, sufficient levels of other nutrients, such as potassium and phosphorus, might enhance plant tolerance to NO2 [39]. Finally, as an intermediate in the nitrogen cycle during crop growth, NO2 reflects nitrogen accumulation in the environment. The active growth of major grain crops is closely associated with NO2 within an optimal concentration range. These effects could explain the positive impact of NO2 on crop yields. Additionally, studies have shown a close relationship between NO2 and nitrogen fertilizer application [40,41]. In farmlands using nitrogen fertilizers, NO2 emissions primarily result from the nitrification process, where nitrite (NO2−) is converted into nitrate. Elevated NO2 levels may indicate substantial nitrogen fertilizer use, which intensifies nitrogen cycling and increases nitrogen activity. When excessive nitrogen fertilizer is applied, disruptions in nitrogen cycling lead to greater nitrogen losses and higher NO2 emissions. This is particularly problematic in China’s major grain-producing regions, where nitrogen loss has led to resource depletion [42,43]. Effective nitrogen fertilizer management [44] can mitigate the negative impacts of NO2 while optimizing its benefits as a nitrogen source.
4.3. Mechanistic Insights into the Dynamic Yield Responses of Major Crops to NO2 Emissions
Our research indicates that TNC can suppress NO2, thereby reducing air pollution and mitigating climate change, which in turn affects crop yields. Similarly, a related study has shown that NO2 exerts a harmful impact on soil nitrogen fixation. NO2 itself has an inhibitory effect on soil nitrogen fixation capacity [45]. A further analysis of the transboundary impacts of NO2 on nitrogen-fixing microorganisms and plant roots revealed that elevated NO2 levels not only directly disrupted nitrogen-fixing microorganisms, but also indirectly reduced soil nitrogen fixation capacity by impairing root development and nutrient uptake, leading to a decline in overall plant health. In conjunction with other studies [38,46] on nitrogen utilization mechanisms in grain crops, we analyzed the complex processes underlying the impact of NOx on crop yields.
As a key component in the atmosphere, NOx plays a multifaceted role in plant photosynthesis. For maize, NO2 can be converted into nitrate through nitrification, serving as a nitrogen source for the plant. At lower concentrations (1–3 × 10⁻⁵ VCDs), maize can effectively utilize this nitrogen source, promoting growth and yield [47]. However, when NO2 concentrations exceed maize’s nitrogen absorption capacity, yield growth slows down. Rice requires a substantial amount of nitrogen, and NO2 deposition aids in its growth and yield improvement. However, water and soil management in rice fields can influence the actual efficiency of NO2 utilization [48]. Therefore, the optimal NO2 range for rice (2–4 × 10⁻⁵ VCDs) differs from that of maize. Soybeans, as nitrogen-fixing crops, can directly fix nitrogen from the atmosphere [49]. At lower NO2 concentrations, external nitrogen supply may interfere with the nitrogen fixation process, negatively affecting soybean growth. However, as NO2 concentrations increase, soybeans may utilize nitrogen in other forms (rhizobia symbiosis), although excessively high NO2 levels (>7 × 10⁻⁵ VCDs) still inhibit yield growth. Wheat requires a substantial nitrogen input to support rapid growth and grain development [48]. Based on our research findings, at lower NO2 concentrations (1–2 × 10⁻⁵ VCDs), wheat can efficiently absorb and utilize nitrogen. However, as NO2 concentrations rise beyond a critical threshold, wheat’s nitrogen fixation saturates. Excessive NO2 further harms the environment and crop health.
4.4. The Spatial Influence of NO2 Emissions on Environment Health
NO2 plays a pivotal role as an intermediate in the nitrogen cycle, particularly during the growth period of major grain crops. Acting as an indicator of nitrogen accumulation in the crop-growing environment, the NO2 concentration can have dual effects on soil and plant health. Within the optimal range, NO2 contributes to nitrogen availability, promoting plant growth and yield. However, when concentrations surpass this range, the toxic effects of NO2 become evident. Excessive levels of NO2 disrupt soil microbial communities, damage plant root systems, and impair the nutrient uptake processes essential for crop growth. These toxic effects not only reduce crop yields but also contribute to broader environmental challenges, such as nitrogen source pollution and eutrophication of nearby water systems.
Our research highlights a concerning trend: the agricultural environments of most staple crops, including maize, rice, wheat, and soybeans, are already experiencing NO2 concentrations beyond the tolerance thresholds of these crops. Specifically, 58.5–94.2% of these agricultural regions exceed the safe NO2 range, with the most severe cases observed in regions adjacent to northern urban clusters. These urban areas, characterized by high NO2 emissions from transportation, industrial activities, and dense human populations, exhibit limited soil nitrogen fixation capacities. The weakened nitrogen fixation in these areas further exacerbates the imbalance in nitrogen cycling, leading to long-term degradation of soil fertility and declining crop productivity. Urban agricultural zones bear a disproportionate burden of NO2 pollution, reflecting the need for targeted nitrogen management strategies [50]. Improving nitrogen cycle management in these areas requires a multifaceted approach.
4.5. Policy Recommendations
Research [51] indicates that implementing agricultural management practices can increase crop yields by 10%, reduce nitrogen pollution by 8%, and improve nitrogen use efficiency in China by 18%. Based on related studies and the current state of NO2 emissions in China, we propose the following nitrogen fertilizer management policy recommendations. First, the promotion of precision fertilization technologies is essential. By monitoring soil and crop needs in real time, the precise adjustment of nitrogen fertilizer application rates and timing can prevent nitrogen loss and NO2 emissions caused by over-fertilization. This technology not only reduces fertilizer waste but also enhances crop nitrogen uptake efficiency. Second, the combined use of nitrogen fertilizers and organic fertilizers should be encouraged. Integrating nitrogen fertilizers with organic matter helps increase soil organic content, enhancing nitrogen retention and reducing nitrogen loss and NO2 emissions. This also significantly alleviates agricultural waste pollution [52] and resource shortages [53]. This measure is particularly crucial in reducing environmental and resource pressures in agricultural production. Lastly, optimizing fertilization systems by promoting split fertilization is vital. Encouraging the staged application of nitrogen fertilizer according to crop growth phases prevents nitrogen loss from excessive one-time fertilization. In addition, the development of new nitrogen fertilizers through bioengineering presents a novel approach to further enhance nitrogen use efficiency and reduce environmental impacts [54]. These methods ensure nitrogen is effectively utilized during the critical growth periods of crops while reducing nitrogen oxide emissions.
Through fertilizer management, farmers can adjust NO2 concentrations to optimal levels, reducing nitrogen losses in crops and improving nitrogen uptake efficiency, thereby minimizing excessive NO2 emissions. The issue of NO2 oversaturation is particularly severe in the North China Plain and southern areas of the Northeast Plain. This may be due to the proximity of northern urban clusters to these farmlands. The related research [51] indicates that rapid urbanization can reduce nitrogen use efficiency in crop production. As nitrogen use efficiency declines, emissions of N2O and NO2 from agricultural activities accumulate, exacerbating the problem of nitrogen oxide emissions and diffusion. To optimize crop yields and promote environmental sustainability, nitrogen fertilizer application must be regulated and integrated with other fertilization strategies. Measures such as reducing urban NO2 emissions through cleaner energy solutions, optimizing agricultural practices to enhance soil nitrogen fixation, and implementing buffer zones between urban centers and croplands can help mitigate the detrimental effects of NO2 pollution.
At the same time, the nitrogen deposition function of forests is a major source of nitrogen sinks in the soil [55]. Microbial functional genes in forest soils play a crucial role in reducing NOx emissions [56]. Therefore, we must continue to focus on the issue of declining soil nitrogen fixation levels caused by deforestation and overgrazing [19,20]. Due to the strong nitrogen-fixing ability of legumes, the findings can be extrapolated to other cereals and legumes. For example, integrating legumes like peas or alfalfa into cropping systems could similarly enhance soil nitrogen fixation and improve the yields of non-leguminous crops, such as maize or wheat, through rotational or intercropping practices.
Based on previous research findings and discussions, we summarize the following policy recommendations. First, to maintain the stability of overall soil nitrogen fixation levels, deforestation and overgrazing should be reduced, and degraded land should be actively converted into farmland and forest. Second, to ensure food quality and soil safety in crop growing environments, precise management of agricultural nitrogen fertilizers is essential, particularly in regions near northern urban clusters. Third, implementing regulated nitrogen management, cleaner energy solutions, and urban–cropland buffer zones can reduce NO2 impact, enhance crop yields, and promote sustainable agriculture.
5. Conclusions
In our study, we found that the average level of soil nitrogen fixation in China has remained relatively stable over the past 5–10 years, but urbanization may pose a risk of decline. Both excessively high and low NO2 levels disrupt the normal grow of major grain crops. Therefore, we quantified the optimal NO2 concentration range for grain crops and assessed the current status of NO2 emission diffusion in farmland. Our findings reveal that 58.5–94.2% of grain crops are in a state of NO2 oversaturation, with wheat being the most affected. Based on scenario and significance analyses, we found that reducing NO2 emissions in a greener and cleaner scenario significantly improves crop yields, especially for maize and rice. Meanwhile, increasing soil nitrogen fixation levels significantly boosts the yields of soybean and maize. This provides a solution for advancing sustainable agriculture by linking nitrogen cycle management with improved crop yields and environmental sustainability.
The contributions of our study are primarily reflected in three key areas. First, we provide valuable insights into the NO2 transboundary impacts on crop yield by analyzing the complex interactions between NO2 concentrations and crop yields, focusing on major grain crops such as maize, rice, soybeans, and wheat. This research advances our understanding of how NO2 influences plant nitrogen utilization and growth at varying concentration levels. Second, our study identifies regional vulnerabilities, particularly in regions near northern urban clusters, where NO2 concentrations have already exceeded the threshold that crops can tolerate. This highlights the urgent need for targeted regional policy interventions. Finally, this study offers policy recommendations for sustainable agriculture, emphasizing the reduction of deforestation, control of overgrazing, and the implementation of precision nitrogen fertilizer management to enhance soil nitrogen fixation and crop productivity.
Despite these contributions, there are notable limitations. First, this study primarily focuses on a limited scope of crop types—major grain crops—which restricts the generalizability of our findings to other agricultural systems that may be impacted by NO2. Second, our research is geographically focused on Chinese cropland, which may not fully capture the diverse environmental and agricultural conditions in other regions, thus limiting its global applicability. Third, the lack of long-term data on the impacts of NO2 on crop yield means that this study could benefit from additional evidence to strengthen conclusions on the sustainability of nitrogen management practices in the face of changing environmental conditions. While we endeavored to select NO2 emission data from the troposphere above croplands during the crop growth period, we acknowledge that separating NO2 emissions from other sources (e.g., transportation, industries, livestock) was not feasible, which may introduce some level of uncertainty.
Supplementary Materials
The following supporting information can be downloaded at: https://www.mdpi.com/article/10.3390/agriculture15020208/s1. Figure S1: Importance of variables in crop yield models based on nitrogen cycling.
Author Contributions
Conceptualization, J.X. and X.D.; methodology, J.X.; software, J.X.; validation, J.X., P.Y., and X.D.; formal analysis, J.X.; investigation, J.X.; resources, X.D.; data curation, J.X.; writing—original draft preparation, J.X.; writing—review and editing, P.Y.; visualization, J.X.; supervision, X.D.; project administration, X.D.; funding acquisition, X.D. All authors have read and agreed to the published version of the manuscript.
Funding
This research was funded by the Science Fund for Creative Research Groups of the National Natural Science Foundation of China (Grant No.72221002; 72373139).
Institutional Review Board Statement
Not applicable.
Data Availability Statement
The data presented in this study are available upon reasonable request from the first author.
Conflicts of Interest
The authors declare no conflicts of interest.
References
- Lin, Q.; Zhu, J.; Wang, Q.; Zhang, Q.; Yu, G. Patterns and Drivers of Atmospheric Nitrogen Deposition Retention in Global Forests. Glob. Change Biol. 2024, 30, e17410. [Google Scholar] [CrossRef] [PubMed]
- Dahal, B.; NandaKafle, G.; Perkins, L.; Brözel, V.S. Diversity of Free-Living Nitrogen Fixing Streptomyces in Soils of the Badlands of South Dakota. Microbiol. Res. 2017, 195, 31–39. [Google Scholar] [CrossRef] [PubMed]
- Peng, Z.; Qian, X.; Liu, Y.; Li, X.; Gao, H.; An, Y.; Qi, J.; Jiang, L.; Zhang, Y.; Chen, S.; et al. Land Conversion to Agriculture Induces Taxonomic Homogenization of Soil Microbial Communities Globally. Nat. Commun. 2024, 15, 3624. [Google Scholar] [CrossRef] [PubMed]
- Iizumi, T.; Sakai, T. The Global Dataset of Historical Yields for Major Crops 1981–2016. Sci. Data 2020, 7, 97. [Google Scholar] [CrossRef]
- Gu, B.; Zhang, X.; Lam, S.K.; Yu, Y.; van Grinsven, H.J.M.; Zhang, S.; Wang, X.; Bodirsky, B.L.; Wang, S.; Duan, J.; et al. Cost-Effective Mitigation of Nitrogen Pollution from Global Croplands. Nature 2023, 613, 77–84. [Google Scholar] [CrossRef]
- Huang, L.; Fang, J.; Liao, J.; Yarwood, G.; Chen, H.; Wang, Y.; Li, L. Insights into Soil NO Emissions and the Contribution to Surface Ozone Formation in China. Atmos. Chem. Phys. 2023, 23, 14919–14932. [Google Scholar] [CrossRef]
- Wang, R.; Chen, J.; Li, Z.; Bai, W.; Deng, X. Factors Analysis for the Decoupling of Grain Production and Carbon Emissions from Crop Planting in China: A Discussion on the Regulating Effects of Planting Scale and Technological Progress. Environ. Impact Assess. Rev. 2023, 103, 107249. [Google Scholar] [CrossRef]
- Vitousek, P.M.; Aber, J.D.; Howarth, R.W.; Likens, G.E.; Matson, P.A.; Schindler, D.W.; Schlesinger, W.H.; Tilman, D. Human Alteration of the Global Nitrogen Cycle: Sources and Consequences. Ecol. Appl. 1997, 7, 737–750. [Google Scholar] [CrossRef]
- Arunrat, N.; Sereenonchai, S.; Chaowiwat, W.; Wang, C.; Hatano, R. Carbon, Nitrogen and Water Footprints of Organic Rice and Conventional Rice Production over 4 Years of Cultivation: A Case Study in the Lower North of Thailand. Agronomy 2022, 12, 380. [Google Scholar] [CrossRef]
- Zarabska-Bożejewicz, D. The Impact of Nitrogen Pollution in the Agricultural Landscape on Lichens: A Review of Their Responses at the Community, Species, Biont and Physiological Levels. Agronomy 2020, 10, 1852. [Google Scholar] [CrossRef]
- Almaraz, M.; Bai, E.; Wang, C.; Trousdell, J.; Conley, S.; Faloona, I.; Houlton, B.Z. Agriculture Is a Major Source of NOx Pollution in California. Sci. Adv. 2018, 4, eaao3477. [Google Scholar] [CrossRef] [PubMed]
- Ye, J.Y.; Tian, W.H.; Jin, C.W. Nitrogen in Plants: From Nutrition to the Modulation of Abiotic Stress Adaptation. Stress Biol. 2022, 2, 4. [Google Scholar] [CrossRef] [PubMed]
- Snapp, S.; Sapkota, T.B.; Chamberlin, J.; Cox, C.M.; Gameda, S.; Jat, M.L.; Marenya, P.; Mottaleb, K.A.; Negra, C.; Senthilkumar, K.; et al. Spatially Differentiated Nitrogen Supply Is Key in a Global Food–Fertilizer Price Crisis. Nat. Sustain. 2023, 6, 1268–1278. [Google Scholar] [CrossRef]
- Habtegebrial, K.; Singh, B.R. Wheat Responses in Semiarid Northern Ethiopia to N2 Fixation by Pisum Sativum Treated with Phosphorous Fertilizers and Inoculant. Nutr. Cycl. Agroecosyst 2006, 75, 247–255. [Google Scholar] [CrossRef]
- Ladha, J.K.; Reddy, P.M. Nitrogen Fixation in Rice Systems: State of Knowledge and Future Prospects. Plant Soil 2003, 252, 151–167. [Google Scholar] [CrossRef]
- Springmann, M.; Clark, M.; Mason-D’Croz, D.; Wiebe, K.; Bodirsky, B.L.; Lassaletta, L.; de Vries, W.; Vermeulen, S.J.; Herrero, M.; Carlson, K.M.; et al. Options for Keeping the Food System within Environmental Limits. Nature 2018, 562, 519–525. [Google Scholar] [CrossRef]
- Asseng, S.; Ewert, F.; Martre, P.; Roetter, R.P.; Lobell, D.B.; Cammarano, D.; Kimball, B.A.; Ottman, M.J.; Wall, G.W.; White, J.W.; et al. Rising Temperatures Reduce Global Wheat Production. Nat. Clim. Chang. 2015, 5, 143–147. [Google Scholar] [CrossRef]
- Deng, X.; Huang, Y.; Yuan, W.; Zhang, W.; Ciais, P.; Dong, W.; Smith, P.; Qin, Z. Building Soil to Reduce Climate Change Impacts on Global Crop Yield. Sci. Total Environ. 2023, 903, 166711. [Google Scholar] [CrossRef]
- Napoletano, P.; Barbarisi, C.; Maselli, V.; Rippa, D.; Arena, C.; Volpe, M.G.; Colombo, C.; Fulgione, D.; De Marco, A. Quantifying the Immediate Response of Soil to Wild Boar (Sus. scrofa L.) Grubbing in Mediterranean Olive Orchards. Soil Syst. 2023, 7, 38. [Google Scholar] [CrossRef]
- Napoletano, P.; Maselli, V.; Buglione, M.; Arena, C.; Zarrelli, A.; Fulgione, D.; De Marco, A. Wild Boar Grubbing Affects Soil Carbon Quantity and Fractions under Native, Reforested and Planted Vegetation. Catena 2025, 249, 108648. [Google Scholar] [CrossRef]
- Lobell, D.B.; Di Tommaso, S.; Burney, J.A. Globally Ubiquitous Negative Effects of Nitrogen Dioxide on Crop Growth. Sci. Adv. 2022, 8, eabm9909. [Google Scholar] [CrossRef] [PubMed]
- Liu, B.; Guo, C.; Xu, J.; Zhao, Q.; Chadwick, D.; Gao, X.; Zhou, F.; Lakshmanan, P.; Wang, X.; Guan, X.; et al. Co-Benefits for Net Carbon Emissions and Rice Yields through Improved Management of Organic Nitrogen and Water. Nat. Food 2024, 5, 241–250. [Google Scholar] [CrossRef] [PubMed]
- Chang, J.; Havlík, P.; Leclère, D.; de Vries, W.; Valin, H.; Deppermann, A.; Hasegawa, T.; Obersteiner, M. Reconciling Regional Nitrogen Boundaries with Global Food Security. Nat. Food 2021, 2, 700–711. [Google Scholar] [CrossRef] [PubMed]
- Qiao, L.; Wang, X.; Smith, P.; Fan, J.; Lu, Y.; Emmett, B.; Li, R.; Dorling, S.; Chen, H.; Liu, S.; et al. Soil Quality Both Increases Crop Production and Improves Resilience to Climate Change. Nat. Clim. Chang. 2022, 12, 574–580. [Google Scholar] [CrossRef]
- Pantazi, X.E.; Moshou, D.; Alexandridis, T.; Whetton, R.L.; Mouazen, A.M. Wheat Yield Prediction Using Machine Learning and Advanced Sensing Techniques. Comput. Electron. Agric. 2016, 121, 57–65. [Google Scholar] [CrossRef]
- Liu, S.; Lin, F.; Wu, S.; Ji, C.; Sun, Y.; Jin, Y.; Li, S.; Li, Z.; Zou, J. A Meta-Analysis of Fertilizer-Induced Soil NO and Combined NO+N2O Emissions. Glob. Change Biol. 2017, 23, 2520–2532. [Google Scholar] [CrossRef]
- Poggio, L.; de Sousa, L.M.; Batjes, N.H.; Heuvelink, G.B.M.; Kempen, B.; Ribeiro, E.; Rossiter, D. SoilGrids 2.0: Producing Soil Information for the Globe with Quantified Spatial Uncertainty. Soil 2021, 7, 217–240. [Google Scholar] [CrossRef]
- Joint Research Centre; Crippa, M.; Guizzardi, D.; Schaaf, E.; Monforti-Ferrario, F.; Quadrelli, R.; Risquez Martin, A.; Rossi, S.; Vignati, E.; Muntean, M.; et al. GHG Emissions of All World Countries: 2023; Publications Office of the European Union: Luxembourg, 2023; ISBN 978-92-68-07550-0. [Google Scholar]
- Geffen, J.; Eskes, H.; Compernolle, S.; Pinardi, G.; Verhoelst, T.; Lambert, J.-C.; Sneep, M.; ter Linden, M.; Ludewig, A.; Boersma, K.F.; et al. Sentinel-5P TROPOMI NO2 Retrieval: Impact of Version v2.2 Improvements and Comparisons with OMI and Ground-Based Data. Atmos. Meas. Tech. 2022, 15, 2037–2060. [Google Scholar] [CrossRef]
- Funk, C.; Peterson, P.; Landsfeld, M.; Pedreros, D.; Verdin, J.; Shukla, S.; Husak, G.; Rowland, J.; Harrison, L.; Hoell, A.; et al. The Climate Hazards Infrared Precipitation with Stations—A New Environmental Record for Monitoring Extremes. Sci. Data 2015, 2, 1–21. [Google Scholar] [CrossRef]
- International Food Policy Research Institute. Global Spatially-Disaggregated Crop Production Statistics Data for 2020 Version 1.0; International Food Policy Research Institute: Washington, DC, USA, 2024. [Google Scholar]
- Xu, X.; Liu, J.; Zhang, S.; Li, R.; Yan, C.; Wu, S. Multi-Temporal Land Use and Land Cover Remote Sensing Monitoring Dataset of China (CNLUCC). 2018. Available online: https://www.resdc.cn/DOI/DOI.aspx?DOIID=54 (accessed on 24 September 2024).
- Liu, F.; Zhang, G. Basic Soil Property Dataset of High-Resolution China Soil Information Grids (2010–2018). 2021. Available online: https://soildata.issas.ac.cn/lists/details/view/view/id/59.html (accessed on 24 September 2024).
- Liakos, K.; Busato, P.; Moshou, D.; Pearson, S.; Bochtis, D. Machine Learning in Agriculture: A Review. Sensors 2018, 18, 2674. [Google Scholar] [CrossRef]
- Cao, H.; Han, L.; Liu, M.; Li, L. Spatial Differentiation of Carbon Emissions from Energy Consumption Based on Machine Learning Algorithm: A Case Study during 2015–2020 in Shaanxi, China. J. Environ. Sci. 2025, 149, 358–373. [Google Scholar] [CrossRef] [PubMed]
- Cheng, M.; Penuelas, J.; McCabe, M.F.; Atzberger, C.; Jiao, X.; Wu, W.; Jin, X. Combining Multi-Indicators with Machine-Learning Algorithms for Maize Yield Early Prediction at the County-Level in China. Agric. For. Meteorol. 2022, 323, 109057. [Google Scholar] [CrossRef]
- Brouquisse, R. Multifaceted Roles of Nitric Oxide in Plants. J. Exp. Bot. 2019, 70, 4319–4322. [Google Scholar] [CrossRef] [PubMed]
- Mahboob, W.; Yang, G.; Irfan, M. Crop Nitrogen (N) Utilization Mechanism and Strategies to Improve N Use Efficiency. Acta Physiol. Plant 2023, 45, 52. [Google Scholar] [CrossRef]
- Fang, X.; Yang, Y.; Zhao, Z.; Zhou, Y.; Liao, Y.; Guan, Z.; Chen, S.; Fang, W.; Chen, F.; Zhao, S. Optimum Nitrogen, Phosphorous, and Potassium Fertilizer Application Increased Chrysanthemum Growth and Quality by Reinforcing the Soil Microbial Community and Nutrient Cycling Function. Plants 2023, 12, 4062. [Google Scholar] [CrossRef]
- Sainju, U.M.; Ghimire, R.; Pradhan, G.P.; Sainju, U.M.; Ghimire, R.; Pradhan, G.P. Nitrogen Fertilization I: Impact on Crop, Soil, and Environment. In Nitrogen Fixation; IntechOpen: Rijeka, Croatia, 2019; ISBN 978-1-78984-649-2. [Google Scholar]
- Pan, S.-Y.; He, K.-H.; Liao, Y.-L. Fertilization-Induced Reactive Nitrogen Gases and Carbon Dioxide Emissions: Insight to the Carbon-Nitrogen Cycles. Sustain. Environ. Res. 2023, 33, 23. [Google Scholar] [CrossRef]
- Zheng, Q.; Ha, T.; Prishchepov, A.V.; Zeng, Y.; Yin, H.; Koh, L.P. The Neglected Role of Abandoned Cropland in Supporting Both Food Security and Climate Change Mitigation. Nat. Commun. 2023, 14, 6083. [Google Scholar] [CrossRef]
- Li, Y.; Shi, Y.; Deng, X.; Sun, Z.; Accatino, F. Increasing Food and Feed Self-Sufficiency and Avoiding Manure N Surplus in Eastern Regions of China through a Spatial Crop-Livestock Optimisation Model. Agric. Syst. 2024, 217, 103911. [Google Scholar] [CrossRef]
- Yokamo, S.; Irfan, M.; Huan, W.; Wang, B.; Wang, Y.; Ishfaq, M.; Lu, D.; Chen, X.; Cai, Q.; Wang, H. Global Evaluation of Key Factors Influencing Nitrogen Fertilization Efficiency in Wheat: A Recent Meta-Analysis (2000–2022). Front. Plant Sci. 2023, 14, 1272098. [Google Scholar] [CrossRef]
- Aasfar, A.; Bargaz, A.; Yaakoubi, K.; Hilali, A.; Bennis, I.; Zeroual, Y.; Meftah Kadmiri, I. Nitrogen Fixing Azotobacter Species as Potential Soil Biological Enhancers for Crop Nutrition and Yield Stability. Front. Microbiol. 2021, 12, 628379. [Google Scholar] [CrossRef]
- Minamisawa, K. Mitigation of Greenhouse Gas Emission by Nitrogen-Fixing Bacteria. Biosci. Biotechnol. Biochem. 2022, 87, 7–12. [Google Scholar] [CrossRef] [PubMed]
- Hu, H.; Li, H.; Hao, M.; Ren, Y.; Zhang, M.; Liu, R.; Zhang, Y.; Li, G.; Chen, J.; Ning, T.; et al. Nitrogen Fixation and Crop Productivity Enhancements Co-driven by Intercrop Root Exudates and Key Rhizosphere Bacteria. J. Appl. Ecol. 2021, 58, 2243–2255. [Google Scholar] [CrossRef]
- Makino, A. Photosynthesis, Grain Yield, and Nitrogen Utilization in Rice and Wheat. Plant Physiol. 2011, 155, 125–129. [Google Scholar] [CrossRef] [PubMed]
- Zou, S.; Yan, J.; Han, X.Z.; Zou, W.X.; Chen, X.; Lu, X.C. Effects of Nitrogen Application on Nodulation, Nitrogen Fixation, Yield and Protein Content of Soybean. J. Plant Nutr. Fertil. 2022, 28, 1457–1465. [Google Scholar] [CrossRef]
- Chen, F.; Fahey, T.J.; Yu, M.; Gan, L. Key Nitrogen Cycling Processes in Pine Plantations along a Short Urban–Rural Gradient in Nanchang, China. For. Ecol. Manag. 2010, 259, 477–486. [Google Scholar] [CrossRef]
- Chen, C.; Wen, Z.; Sheng, N.; Song, Q. Uneven Agricultural Contraction within Fast-Urbanizing Urban Agglomeration Decreases the Nitrogen Use Efficiency of Crop Production. Nat. Food 2024, 5, 390–401. [Google Scholar] [CrossRef]
- Babu, S.; Singh Rathore, S.; Singh, R.; Kumar, S.; Singh, V.K.; Yadav, S.K.; Yadav, V.; Raj, R.; Yadav, D.; Shekhawat, K.; et al. Exploring Agricultural Waste Biomass for Energy, Food and Feed Production and Pollution Mitigation: A Review. Bioresour. Technol. 2022, 360, 127566. [Google Scholar] [CrossRef]
- Yu, Z.; Liu, J.; Kattel, G. Historical Nitrogen Fertilizer Use in China from 1952 to 2018. Earth Syst. Sci. Data 2022, 14, 5179–5194. [Google Scholar] [CrossRef]
- Zeng, Y.; Wang, M.; Yu, Y.; Wang, L.; Cui, L.; Li, C.; Liu, Y.; Zheng, Y. Rice N-Biofertilization by Inoculation with an Engineered Photosynthetic Diazotroph. World J. Microbiol. Biotechnol. 2024, 40, 136. [Google Scholar] [CrossRef]
- Cen, X.; Müller, C.; Kang, X.; Zhou, X.; Zhang, J.; Yu, G.; He, N. Nitrogen Deposition Contributed to a Global Increase in Nitrous Oxide Emissions from Forest Soils. Commun. Earth Environ. 2024, 5, 532. [Google Scholar] [CrossRef]
- Peng, Y.; Wang, T.; Li, J.; Li, N.; Bai, X.; Liu, X.; Ao, J.; Chang, R. Temporal-Scale-Dependent Mechanisms of Forest Soil Nitrous Oxide Emissions under Nitrogen Addition. Commun. Earth Environ. 2024, 5, 512. [Google Scholar] [CrossRef]


Disclaimer/Publisher’s Note: The statements, opinions and data contained in all publications are solely those of the individual author(s) and contributor(s) and not of MDPI and/or the editor(s). MDPI and/or the editor(s) disclaim responsibility for any injury to people or property resulting from any ideas, methods, instructions or products referred to in the content. |
© 2025 by the authors. Licensee MDPI, Basel, Switzerland. This article is an open access article distributed under the terms and conditions of the Creative Commons Attribution (CC BY) license (https://creativecommons.org/licenses/by/4.0/).