Article

A Coupling Coordination Assessment of the Land–Water–Food Nexus in China

by
Cong Liu
1,
Wenlai Jiang
2,
Jianmei Wei
1,
Hui Lu
1,
Yang Liu
2 and
Qing Li
1,*
1
Institute of Agricultural Economics and Information, Jiangxi Academy of Agricultural Sciences, Nanchang 330200, China
2
Institute of Agricultural Resources and Regional Planning, Chinese Academy of Agricultural Sciences, Beijing 100081, China
*
Author to whom correspondence should be addressed.
Agriculture 2025, 15(3), 291; https://doi.org/10.3390/agriculture15030291
Submission received: 7 January 2025 / Revised: 26 January 2025 / Accepted: 27 January 2025 / Published: 29 January 2025
(This article belongs to the Section Agricultural Economics, Policies and Rural Management)

Abstract

:
The synergistic relation among land resources, water resources, and food production plays a crucial role in sustainable agricultural development. This research constructs a coupling coordination assessment system of the land–water–food (LWF) nexus from 2005 to 2020 for 31 provinces (municipal cities, autonomous regions) in China, and explores the current development status of land, water, and food systems at multiple scales as well as the coupling coordination characteristics of the LWF nexus. The exploring spatial data analysis and spatial Tobit model are used to explain the spatial correlations and influencing factors of coupling coordination development on the LWF nexus. On that basis, the gray GM (1,1) model is used to forecast the future development of the LWF nexus in China. The results show that the comprehensive development indexes of the land system, water system, food system, and LWF nexus are on the rise, but the land system lags behind the water system and food system. The coupling coordination degree of the LWF nexus in different regions ranges from 0.538 to 0.754, and the coupling coordination development of the LWF nexus in China has reached the preliminary coupled coordination type, with an evolutionary process similar to that of its comprehensive development level. Further empirical research shows that there is a significant positive spatial correlation between coupling coordination development levels for the LWF nexus in China. The level of urbanization and agricultural industry agglomeration have negative effects, while economic development, ecological environment, and scientific and technological progress have positive effects. The prediction results indicate that the coupling coordination degree of the LWF nexus in China will show a stable upward trend from 2024 to 2025, and most provinces will reach the intermediate coupled coordination type in 2025. This study can inform decision-making for policy-makers and practitioners and enrich the knowledge hierarchy of the LWF nexus’ sustainable development on the national and regional scales.

1. Introduction

The theory of sustainable development, based on the three principles of equity, continuity, and commonality, fully reflects the transformation process of human social development from initial disordered exploitation to intergenerational equity, and has been incorporated into international agreements, national regulations, and policies [1,2,3,4,5]. As one of the world’s largest developing countries, China has been committed to the realization of the sustainable development goals. Significant progress has been achieved in multiple fields such as ecological environment protection [6], water resource management [7], agricultural production [8], energy transformation [9], and urban development [10]. Among them, the sustainable development of agriculture and rural areas has long been included in China’s Agenda 21, including the adjustment of agricultural structures, the optimization of resources and production factors, the sustainable utilization of natural resources in agriculture, and the protection of the ecological environment. This declares the significance of protecting natural resources and the eco-environment while promoting agricultural development, so that resources can be used in a sustainable manner [11]. Land, water, and food are important resources for agricultural production and the fundamental material for human survival. Ensuring the supply of water and land resources, food security, and the collaborative improvement of the efficiency of the “land, water and food” system has become a focus of attention for the whole society [12,13]. Thus, it is necessary to study the interaction and coupling development between land, water, and food under the situation of sustainable development.
Land, water, and food are closely interlinked, with interdependencies, constraints, and interactions between the elements, which together form an open system of complexity, sensitivity, and hierarchy (Figure 1). The quantity, quality, and development intensity of land resources largely affect the water demand, water quality, and the intensity of water development; the endowment conditions of water resources also affect the way in which land resources are utilized. Water resources are the basic guarantee element for food production, and food production often consumes large amounts of water resources; the limited nature of land resources objectively determines the upper limit of food production capacity; and the characteristics of water and land resources directly determine the material infrastructure conditions for food production and affect the potential and stability of food production. At the same time, changes in the planting structure of food production, as well as long-term heavy investments in factors such as fertilizers, pesticides, and agricultural films, will also directly affect the quantity and quality of water and land resources [14,15]. The intricate relationship between land, water, and food can be defined as an LWF nexus, which not only emphasizes the feed-forward linkages and coordinated sustainable development between the elements, but also takes into account the interaction mechanism between the systemic whole and external influences.
China has used only about 7% of the cultivated land to supply food for about 20% of the global population. Affected by factors such as rapid urbanization, the structural adjustment of agricultural production, natural disasters, and so on, the total amount of cultivated land is decreasing, and the proportion of cultivated land available for modern production is relatively small [16]. Agricultural water consumption has long accounted for above 60% of total water consumption, and agricultural irrigation remains the main method of water use. The extensive use of water has led to a gap of over 50 billion m3 in normal years [17]. The domestic food supply situation has remained critical, and food quality and security still need to be strengthened, with huge ecological and economic costs and frequent uncertainty factors [18]. Against the background of increasing demand, relatively low production efficiency, and a relative shortage of per capita resource utilization, land, water, and food are characterized by a certain degree of vulnerability. The distribution of land resources in China is more in the north and less in the south, while the distribution of water resources is more in the south and less in the north. Economic development and regional transformation have gradually shifted the population and economic center to the south, and the food transportation pattern has also changed from “transporting food from the south to the north” to “transporting food from the north to the south”. This spatial distribution imbalance and misalignment of resource matching have made the correlation and constraint characteristics between the three increasingly prominent, and the LWF nexus is facing major challenges.
The current research on the LWF nexus mainly focuses on the correlation mechanism [19], the evaluation of characteristics [20], and the path to ensure food security under the effective utilization of land and water resources [21]. The quantitative methods include the DEA model [22], the multivariate matching model [23], the correlation coefficient model [24], the coupling coordination model [25], and the system dynamics model [26], etc. The coupling coordination model can better judge the degree of mutual influence and the virtuous cycle between systems; many scholars have conducted extensive research on the coupling coordination relationship among the resources, economy, society, population, and eco-environment in regions. Cheng et al. [27] constructed a comprehensive evaluation model to explore the coupling coordination development trend of the Water–Economy–Ecology nexus in Western China; Zhang et al. [28] analyzed the coupling coordination degree of the Society–Economy–Resource– Environment system in the Jingjinji urban agglomeration; Shi et al. [29] revealed the temporal and spatial evolvement and influencing factors of Population–Land coordination in the 26 main cities of the Yangtze River Delta (YRD) from 1989 to 2018; Wang et al. [30] identified and predicted the coupled and coordinated changes in the Water–Energy–Food system in the Yellow River basin. However, research on the comprehensive development level and internal interaction relationships of land, water, and food in large-scale regions from a systemic perspective is still limited, and there is a lack of systematic research on the spatial distribution characteristics and influencing factors of coupling coordination degree for the LWF nexus.
To fill this gap, this study takes 31 provinces (municipal cities, autonomous regions) in China as typical cases, the LWF nexus evaluation index system from a systemic perspective is proposed, the weights of each index are determined by using a combined weighting method, and the development level or status of the three systems and the LWF nexus are analyzed. On this basis, the coupling coordination model is combined to evaluate the relationship characteristics of the coupling coordination development of the LWF nexus in recent years, the spatial differences and influencing factors of the LWF nexus are identified through the exploring spatial data analysis and spatial Tobit model, and the gray GM (1, 1) model is used to predict the future development trend of the LWF nexus. This study aims to improve the sustainable and green development of agriculture in China from the perspective of the LWF nexus, and inform decision-making references for policy-makers and practitioners while enriching the knowledge base on the synergistic evolution of land, water, and food on both global and regional scales.

2. Data and Methodology

2.1. Study Area

Unbalanced and insufficient development is the significant feature and major difficulty in China’s regional development; therefore, it is of great significance to explore the coupling coordination development level of the LWF nexus among different regions. China has a vast territory and a large latitude from north to south. Its climate is complex and diverse, spanning monsoon climates, temperate continental climates and alpine climates. The diversity of the geographical environment provides favorable conditions for food production. The three main grain crops include rice, wheat, and maize, and the production output of these crops was 606.8 million tons in 2020, accounting for 90.6% of China’s total grain output. This study was carried out in 31 provinces, municipal cities, and autonomous regions of mainland China. Due to limitations in available data, Hong Kong, Macao, and Taiwan are not considered in our study.

2.2. Research Design

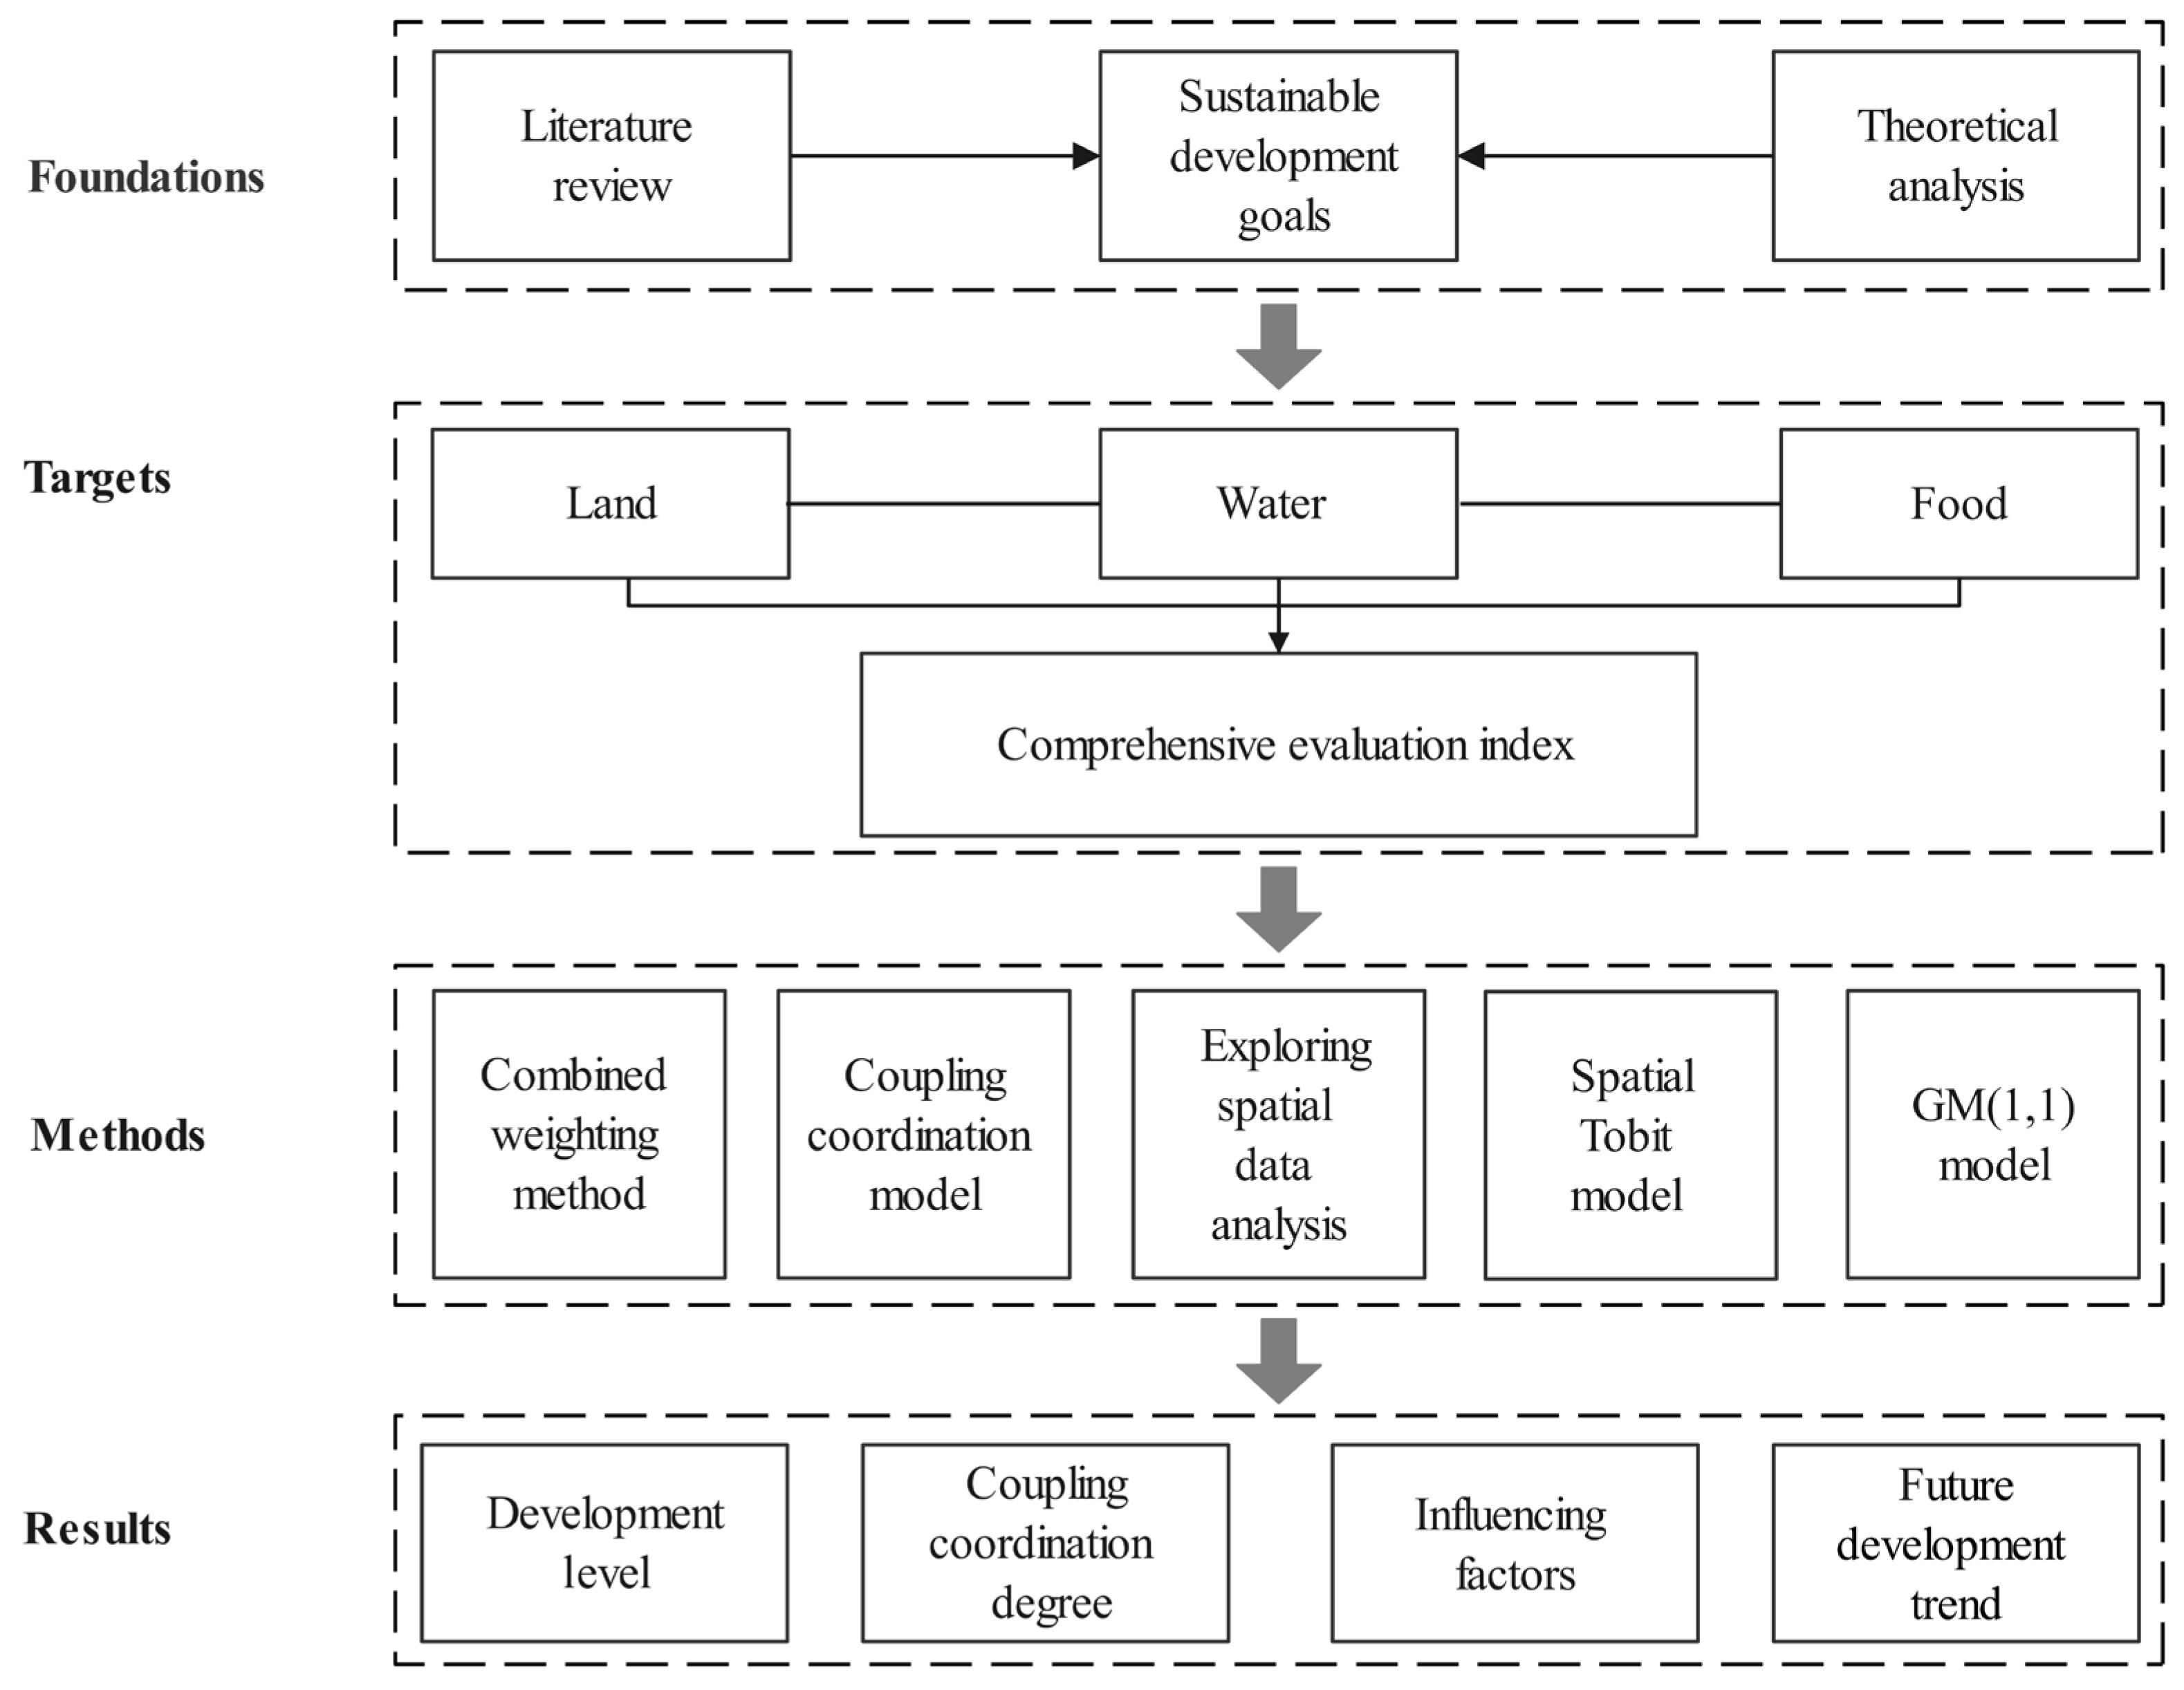
A mixed study approach is employed in this study to evaluate the development level, coupling coordination degree, influencing factors, and future development trend of the LWF nexus in China. The specific research design includes foundations, targets, methods, and results, as shown in Figure 2.

2.3. Research Methods

2.3.1. Construction of Comprehensive Evaluation Index for LWF Nexus

Based on the concept of sustainable development, we followed the principles of scientificity, representativeness, hierarchy, and computability in indicator selection; comprehensively considered the connotation and research scope of land resources, water resources, and food production; and constructed a comprehensive evaluation index system for the LWF nexus with reference to previous studies [31,32,33,34]. The comprehensive evaluation index system consists of the land system, water system, and food system. In the land system, eight indicators were selected, including average cultivated land output value, total power of agricultural machinery per unit cultivated area, multiple cropping index, per capita cultivated area, agricultural land conversion rate, soil erosion control rate, intensity of pesticide use on cultivated land, and intensity of fertilizer use on cultivated land. In the water system, eight indicators were selected, including irrigation water use coefficient, agricultural water output value, water use efficiency, water-saving irrigation rate, water production modulus, agricultural irrigation water ratio, groundwater extraction rate, and water resource utilization ratio. The food system had eight indicators selected, including per capita food production, food yield per hectare, per capita disposable income of rural households, fluctuation coefficient of total food production, Consumer Price Index of food for rural areas, Food Resilience Index, carbon emissions from food production, and emission of non-point source pollution from food production. The comprehensive evaluation system of the LWF nexus is shown in Table 1.

2.3.2. Combined Weighting Method

In order to increase the scientificity of the determining weights, we separately used the entropy method and the coefficient of variation method to determine the weights of each indicator, and then the weight results of the indicators determined by the two methods were combined and assigned by the linear weighting method. The specific calculation process is as follows:
(1)
Standardization of data:
P o s i t i v e   i n d i c a t o r s : r t i j = x t i j min ( x j ) max ( x j ) min ( x j ) N e g a t i v e   i n d i c a t o r s : r t i j = max ( x j ) x t i j max ( x j ) min ( x j )
where t is the year, i is the region, j is the indicator, rtij is the standardized result of the indicator, xtij is the value of indicator j for region i in year t, and max (xj) and min (xj) are, respectively, the maximum and minimum values of indicator j.
(2)
Normalization of indicators:
p t i j = r t i j t = 1 θ i = 1 m r t i j
where θ is the total number of years, m is the total number of regions, and ptij is the weight of indicator j for region i in year t. If ptij = 0, then ptijln(ptij) is defined as 0.
(3)
Calculating the information entropy:
e j = k t = 1 θ i = 1 m p t i j ln ( p t i j )
where ej is the information entropy of indicator j, satisfying 0 ≤ ej ≤ 1.
(4)
Calculating the redundancy:
d j = 1 e j
where dj is the redundancy of indicator j.
(5)
Calculating the entropy method weight:
w j = d j j = 1 n d j
where wj’ is the entropy method weight of indicator j and n is the total number of indicators.
(6)
Calculating the coefficient of variation method weight:
v j = σ j x ¯
w j = v j j = 1 n v j
where wj″ is the coefficient of variation method weight of indicator j, vj is the coefficient of variation in indicator j, σj is the standard deviation of indicator j, and x ¯ is the average value of indicator j.
(7)
Combined weighting:
w j = w j w j j = 1 n w j w j
where wj is the combined weight of indicator j. The weight values of various indicators determined using the above method are shown in Table 1.

2.3.3. Integrated Evaluation Model

The composite indexes are given by:
L ( x ) = i = 1 m α i x i W ( y ) = i = 1 n β i y i F ( z ) = i = 1 k χ i z i
where L(x), W(y), and F(z) are, respectively, the composite development indexes of each system; αi, βi, and γi are respective the weights of each indicator for each system; and xi, yi, and zi are dimensionless values that, respectively, weight each indicator.

2.3.4. Coupling Coordination Degree Model

The coupling coordination model can reflect the degree of coupling, coordination, and mutual feedback among systems. This study adopts the coupling coordination model to study the synergistic relation between land systems, water systems, and food systems. The specific calculation process is as follows:
C = 3 L ( x ) W ( y ) F ( z ) 3 L ( x ) + W ( y ) + F ( z )
where the coupling degree C indicates the strength of interaction and influence between systems. The following coupling coordination degree model was used to better indicate the high degree of local system coupling:
D = C T
T = γ L ( x ) + μ W ( y ) + η F ( z )
where D is the coupling coordination degree, T is the comprehensive development index of the LWF nexus, and ϒ, μ, and η are the weights of each system; ϒ + μ + η = 1. Considering that the three systems are equally important, ϒ, μ, and η are taken as 1/3 each. In order to better study the coupling coordination stage and type of the LWF nexus in China, the coupling coordination degree is graded with reference to existing research results [37], as shown in Table 2.

2.3.5. Exploring Spatial Data Analysis

Spatial autocorrelation analysis can reflect the degree of spatial dependence among variables within a geographic area. The two main types of spatial autocorrelation analyses that can be conducted are global analyses and local analyses [38]. Global and local analyses were used to measure the spatial correlation and the degree of regional aggregation or disaggregation of the coupling coordination degree of China’s LWF nexus. Global autocorrelation analysis can be used to calculate Global Moran’ s I index of the variables for the whole study area [39] with the following formula:
G l o b a l   M o r a n s   I = n i = 1 n j = 1 n w i j i = 1 n j 1 n w i j ( x i x ¯ ) ( x j x ¯ ) i = 1 n ( x i x ¯ ) 2
where wij is the matrix of the spatial weight; n is the number of samples; xi and xj are the values of variable x at the location i and j, respectively; and x ¯ is the average value of variable x. The value of Global Moran’s I is between −1 and + 1. Moran’s I > 0 indicates positive spatial correlation, and larger values correspond to stronger spatial correlation. Conversely, Moran’s I < 0 indicates negative spatial correlation; if Moran’s I equals 0, the spatial distribution of the variable is random [40].
Local autocorrelation analysis (LISA) can be employed to calculate the Local Moran’s I of all provincial administrative regions [38]; the calculation formula is as follows:
L o c a l   M o r a n s   I = ( x i x ¯ ) j 1 n w i j ( x j x ¯ )
The explanation of the indicators in the formula is the same as above. Local spatial associations are commonly divided into four categories: the High–High cluster, Low–Low cluster, Low–High outlier, and High–Low outlier. The first two categories indicate that the level (high or low) of the variable in this province is consistent with adjacent provinces, whereas the last two categories indicate that the level (high or low) of the variable in this province is different from adjacent provinces [38].

2.3.6. Spatial Tobit Model

As an explanatory variable, the coupling coordination degree has a value between 0 and 1; thus, using the Tobit regression model can avoid bias in the results. Considering that the coupling coordination degree may exhibit the characteristic of spatial correlation, spatial effects were included in the Tobit regression model; then, the spatial Tobit model was adopted to analyze the driving factors of the coupling coordination degree of the LWF nexus. It is established as follows:
D i t = α i + ρ W D i t + β x i t + δ W x i t + μ i + γ t + ε i t
where i and t represent the region and time, Dit presents the coupling coordination degree of the LWF nexus of region i in period t, W is the spatial weight matrix, ρ and δ represent the spatial regression coefficient, β is the estimation coefficient of the driving factor, xit represents the driving factor of region i in period t, μi denotes the spatial-fixed effect, γt denotes the time-fixed effect, and εit is the random disturbance term. Since the spatial correlation between regions may be complex, there are 3 kinds of possible spatial Tobit models: the spatial Durbin model (SDM), the spatial autocorrelation model (SAR), and the spatial error model (SEM) [41]. Table 3 presents the driving factor variables.

2.3.7. GM (1, 1) Model

The gray GM (1,1) prediction model follows the principle of prioritizing real information and can accurately predict sample data. This study adopted the gray GM (1,1) model to predict the coupling coordination degree of the LWF nexus in 2024 and 2025. The differential equation is expressed as follows:
d X 1 d t + a X 1 = u
where X1 presents the accumulated sequence values of the coupling coordination degree of the LWF nexus, α is the developmental gray number, and u is the endogenous control gray number.
By performing least-squares estimation on parameters α and u, the time series of the GM (1,1) model can be obtained as follows:
X ^ 1 ( k + 1 ) = ( X 0 ( 1 ) u a ) e a k + u a , k = 1 , 2 , n , n
Restoring the accumulated sequence can obtain the predicted value of the coupling coordination degree sequence. The posterior difference can be calculated using the following formula to verify the accuracy of the model:
C = S 2 S 1
where C presents the posterior difference ratio, S1 is the actual value variance, and S2 is the residual variance. If C < 0.35, the model accuracy is high; if C < 0.5, the model accuracy is qualified; and if C < 0.65, the model accuracy is barely qualified [42].

2.4. Data Sources

The data were mainly derived from the “China Agriculture Statistical Yearbook (2006–2022)”, “China Rural Statistical Yearbook (2006–2022)”, “China Water Statistical Yearbook (2006–2022)”, “China Natural Resources Statistical Yearbook (2005–2020)”, and “China Water Resources Bulletin (2005–2020)”, as well as relevant statistical yearbooks from the National Bureau of Statistics. The basic geographic data were obtained from the National Catalogue Service For Geographic Information (http://www.webmap.cn) accessed on 1 June 2024. Some missing data points have been supplemented using linear interpolation.

3. Results

3.1. Analysis of the Development Level of the LWF Nexus

3.1.1. Measurement of Comprehensive Development Index of LWF Nexus

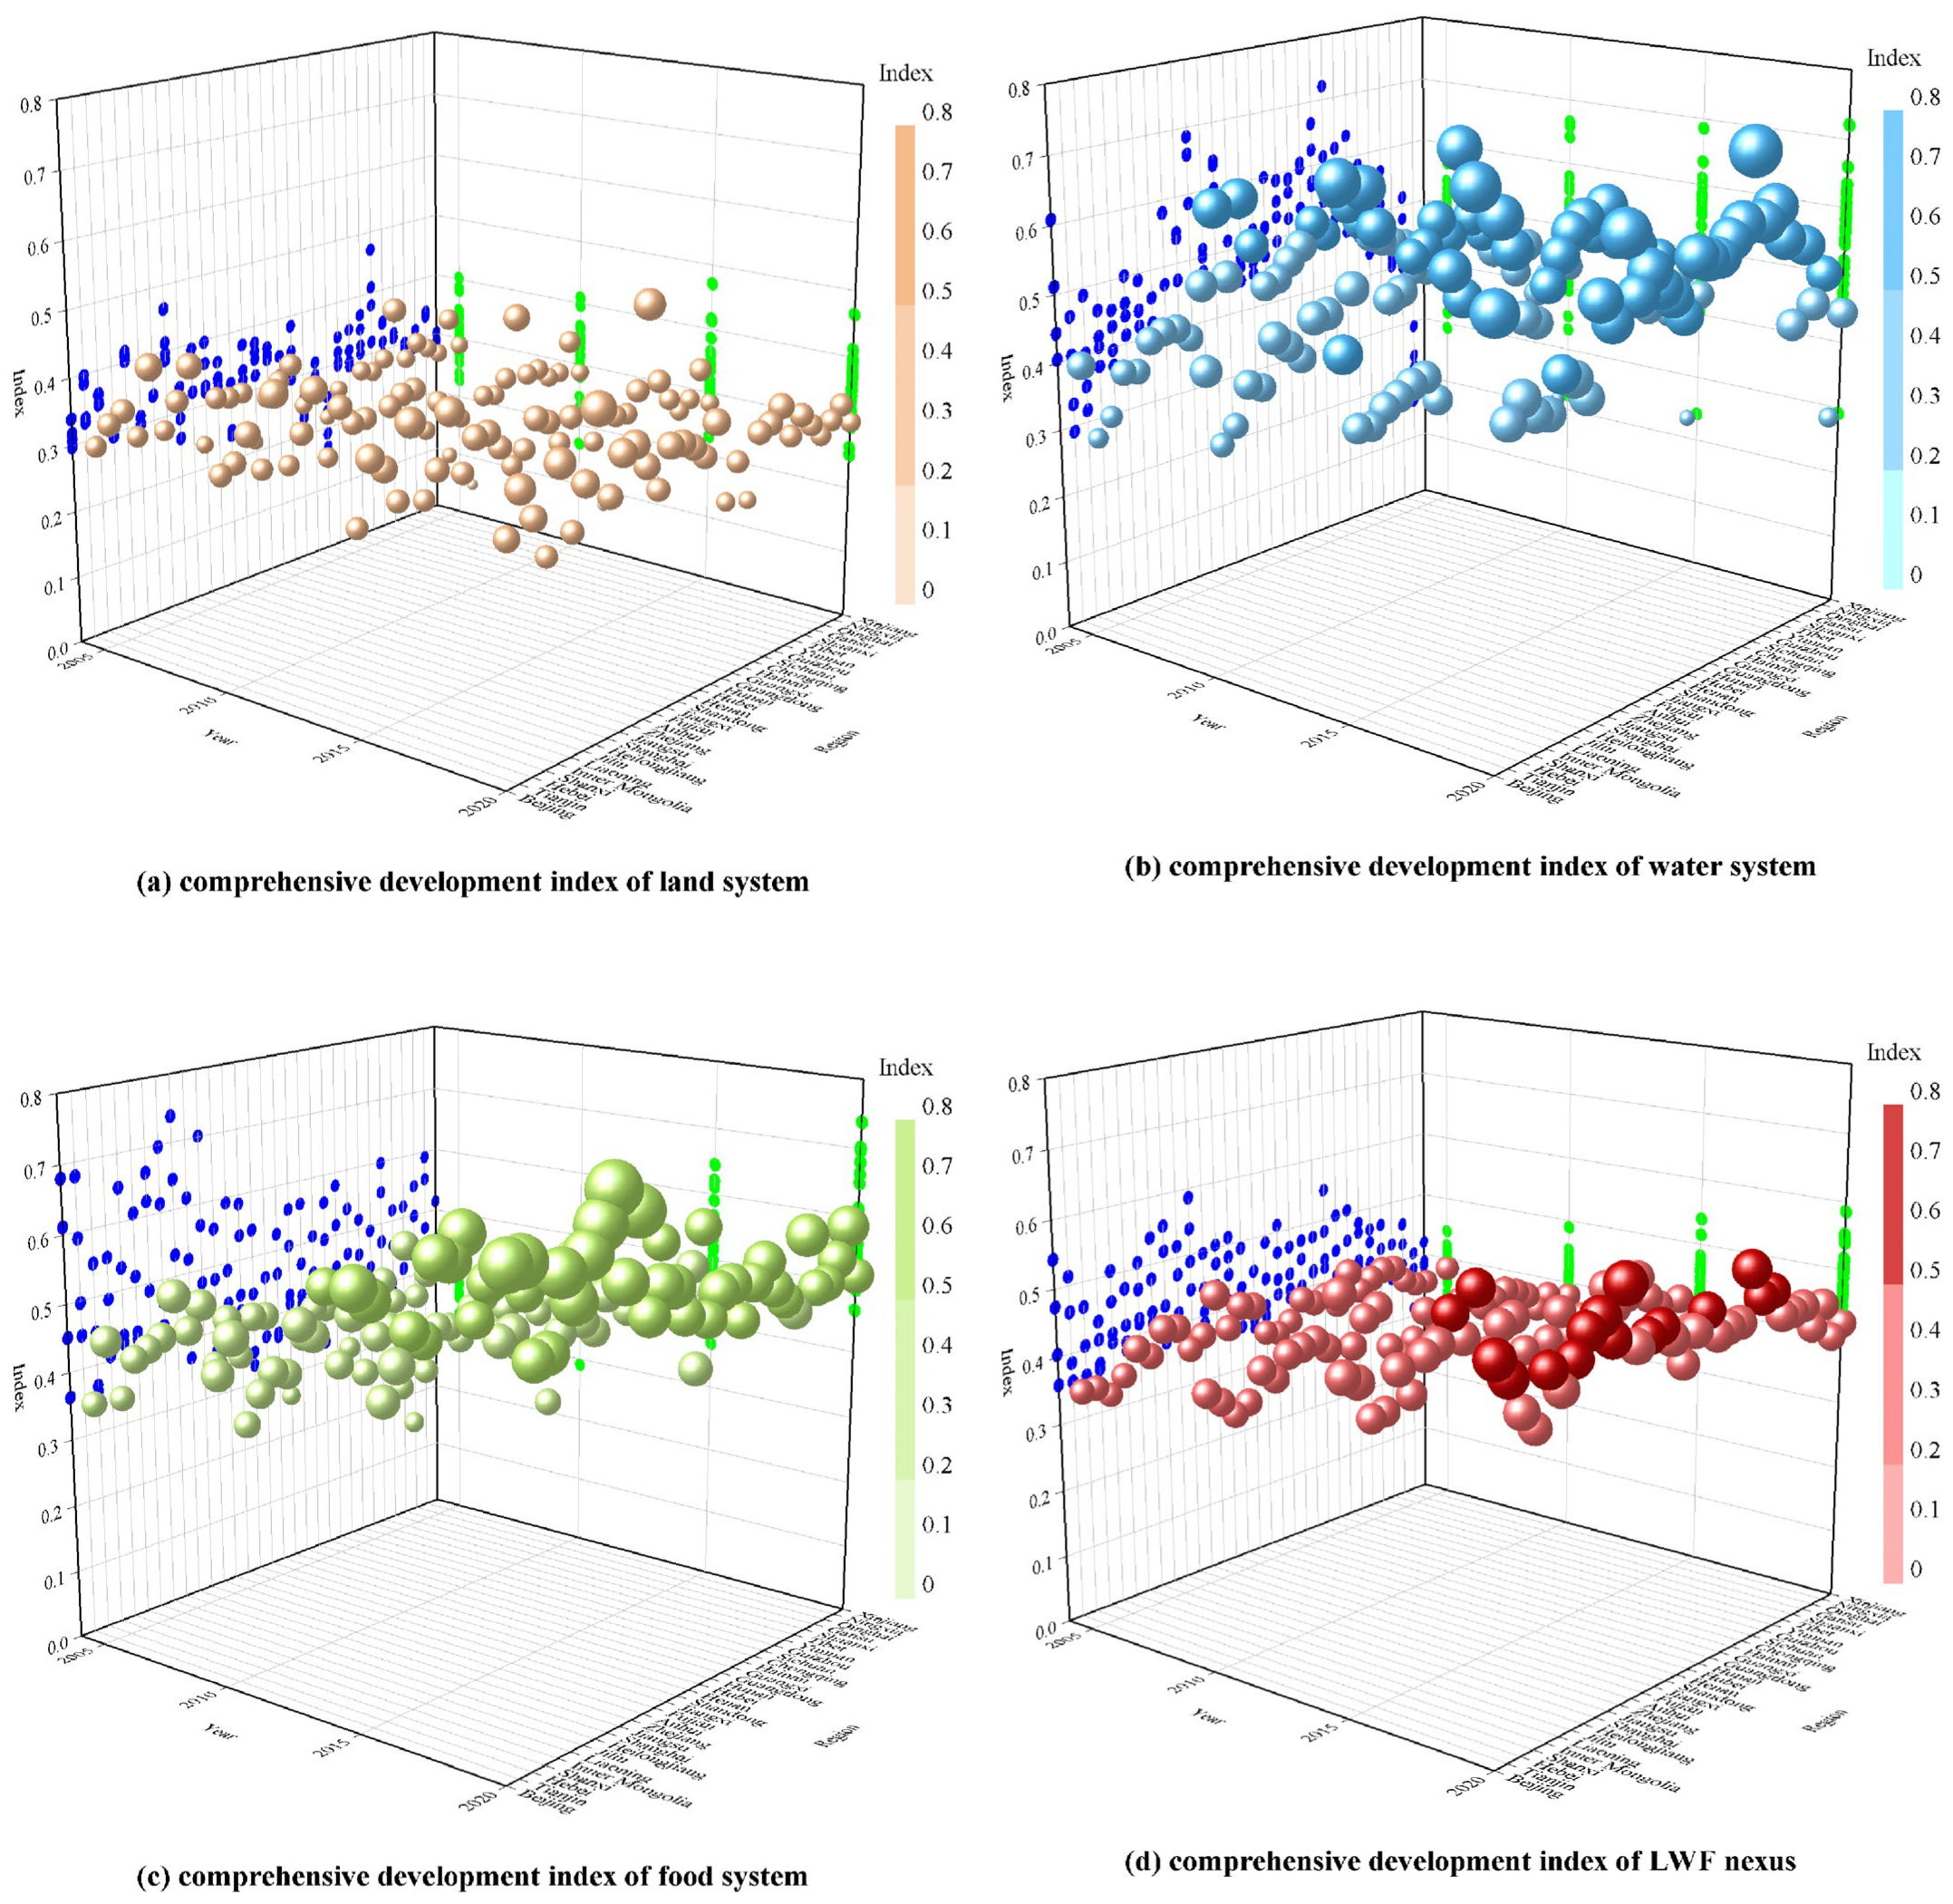
The comprehensive development index of the land system, water system, food system, and LWF nexus in 31 provinces (municipal cities, autonomous regions) of China was measured, and the distribution characteristics are shown in Figure 3 (due to the length, only the results in 2005, 2010, 2015, and 2020 are shown).
In Figure 3a, the comprehensive development index of the land system shows that from 2005 to 2020 the comprehensive development levels of 31 provinces (municipal cities, autonomous regions) in China ranged from 0.162 to 0.497, which has a large space for improvement. Among them, northeast regions such as Inner Mongolia, Heilongjiang, Yunnan, Jiangsu, and Tianjin have higher values, which are mainly related to the abundant local cultivated land resources, land intensification, and the achievements in soil erosion control. However, southern regions such as Guangdong, Fujian, Hainan, Guangxi, and Xinjiang have relatively low values, which are limited by the fragmented distribution of cultivated land and low land output efficiency. Accompanied by the large-scale application of pesticides and fertilizers, it is easy to cause land environmental pollution and bring pressure on the land ecosystem. In terms of temporal changes, Gansu, Ningxia, and Shaanxi show a decreasing trend; the sustainable utilization of land resources in these regions is limited by various factors. The Loess Plateau region should increase efforts to implement the project of returning farmland to forests and grasslands, taking into account both ecological and socio-economic effects, while other regions show varying degrees of growth. Based on the current situation of land fragmentation and decentralization and more water and less land in the southern region, fully utilizing limited land resources and effectively improving land resource utilization efficiency is an inevitable choice to promote the high-quality development of land resources.
In Figure 3b, the comprehensive development index of the water system shows that from 2005 to 2020, the comprehensive development levels of 31 provinces (municipal cities, autonomous regions) in China ranged from 0.164 to 0.729, with significant regional differences. Among them, southern and coastal regions such as Hainan, Zhejiang, Fujian, Chongqing, and Guangdong have higher values, which are mainly related to the abundant local water resources, complete water conservancy infrastructure, and favorable water ecosystems; however, northwestern and North China Plain regions such as Ningxia, Tianjin, Hebei, Inner Mongolia, and Shanxi have lower values, which are limited by their resource endowments and geographical and climatic conditions, as well as the level of technology and informatization. These areas are also characterized by the over-exploitation of groundwater, which is not conducive to the sustainable use of water resources. In terms of temporal changes, Tibet shows a decreasing trend, while other regions show varying degrees of growth. The growth rate in Ningxia reached 78.4%, which is closely related to its implementation of policies such as water right conversion practices and water ecology protection [43]. Tianjin, Hebei, and Beijing also have an increase of more than 50%. Measures such as agricultural water conservation, ecological water replenishment, the strict control of over-exploitation, and the optimization of high water-consuming industrial structures have had a significant impact on the improvement of water use structure and efficiency.
In Figure 3c, the comprehensive development index of the food system shows that from 2005 to 2020, the comprehensive development levels of 31 provinces (municipal cities, autonomous regions) in China ranged from 0.284 to 0.741, indicating a long-term trend of rapid development. Among them, regions such as Heilongjiang, Jilin, Shanghai, Tianjin, and Zhejiang have higher values. The Northeast region, as the “ballast stone” for safeguarding national food security, plays an important role in ensuring national food security. The comprehensive development level of economically developed provinces is related to the local agricultural technology level and financial income, achieving a balance between supply and demand in food production. Regions such as Henan, Shandong, Yunnan, Hubei, and Hebei have relatively low values. There is a certain food production efficiency deficit in some of the major producing provinces, and the unreasonable pursuit of agricultural economic growth has led to excessive non-point source pollution emissions and carbon emissions [44]. In terms of temporal changes, all regions show varying degrees of growth. Beijing almost doubled from 0.363 in 2005 to 0.681 in 2020, benefiting from its moderate-scale food production and operation and green and high-quality development of the planting industry, as well as agricultural technology and equipment support. Since the 18th National Congress of the Communist Party of China, China has clearly put forward the construction of a national food security strategy under the new situation. Various regions have conscientiously implemented the overall deployment of the national food security strategy and the requirements of the “Grain Storage in Land, Grain Storage in Technology” strategy so that food production capacity has been continuously improved.
In Figure 3d, the comprehensive development index of the LWF nexus shows that from 2005 to 2020, the comprehensive development levels of 31 provinces (municipal cities, autonomous regions) in China ranged from 0.307 to 0.586, with relatively small inter-regional differences. Among them, southern regions such as Zhejiang, Chongqing, Shanghai, Jiangxi, and Heilongjiang are relatively high. These areas have relatively abundant resources of all three types, and the development of each system is also relatively balanced. The northern arid and semi-arid regions such as Ningxia, Henan, Gansu, Xinjiang, and Hebei have relatively low values, which are limited by the land system and water system. In terms of temporal changes, all regions show varying degrees of growth. Beijing, Shanghai, and Tianjin have all increased significantly, above 40%. The overall development of the economy and society facilitates the increase in the comprehensive development level of the LWF nexus. Tibet, Yunnan, and Xinjiang have all increased slightly, below 15%. Their relatively poor resources and underdeveloped agricultural technology and economy weaken their improvement space.

3.1.2. Evolution of Comprehensive Development Index of China’s LWF Nexus

The comprehensive development index of the land system, water system, food system, and LWF nexus in China was measured, and the changing trends are shown in Figure 4. The values of the water, land, food, and LWF nexus in China are not high. From 2005 to 2020, the comprehensive development index of land system increased from 0.308 to 0.346, with an average annual change rate of 0.76%, which was relatively stable from 2005 to 2015 and continued to grow from 2016 to 2020. The value of water system increased from 0.446 to at 0.543, with an average annual change rate of 1.33%, which fluctuated greatly from 2005 to 2013, grew rapidly from 2014 to 2016, and remained relatively stable from 2017 to 2020. The value of the food system increased from 0.406 to 0.581, with an average annual change rate of 2.42%, which was relatively stable from 2005 to 2011 and grew rapidly from 2012 to 2020. The comprehensive development level of land lags behind that of water and food. The value of the LWF nexus increased from 0.387 to 0.490, with an average annual change rate of 1.59%, which showed a cyclical pattern of “growth–decline–growth”. The comprehensive development level of China’s water resources, land resources, and food production is still unstable. Attention should be paid to coordination in all aspects, especially external driving forces such as improving agricultural technology and strengthening infrastructure construction.

3.2. Coupling Coordinated Degree Development of the LWF Nexus

3.2.1. Measurement of Coupling Coordinated Development of the LWF Nexus

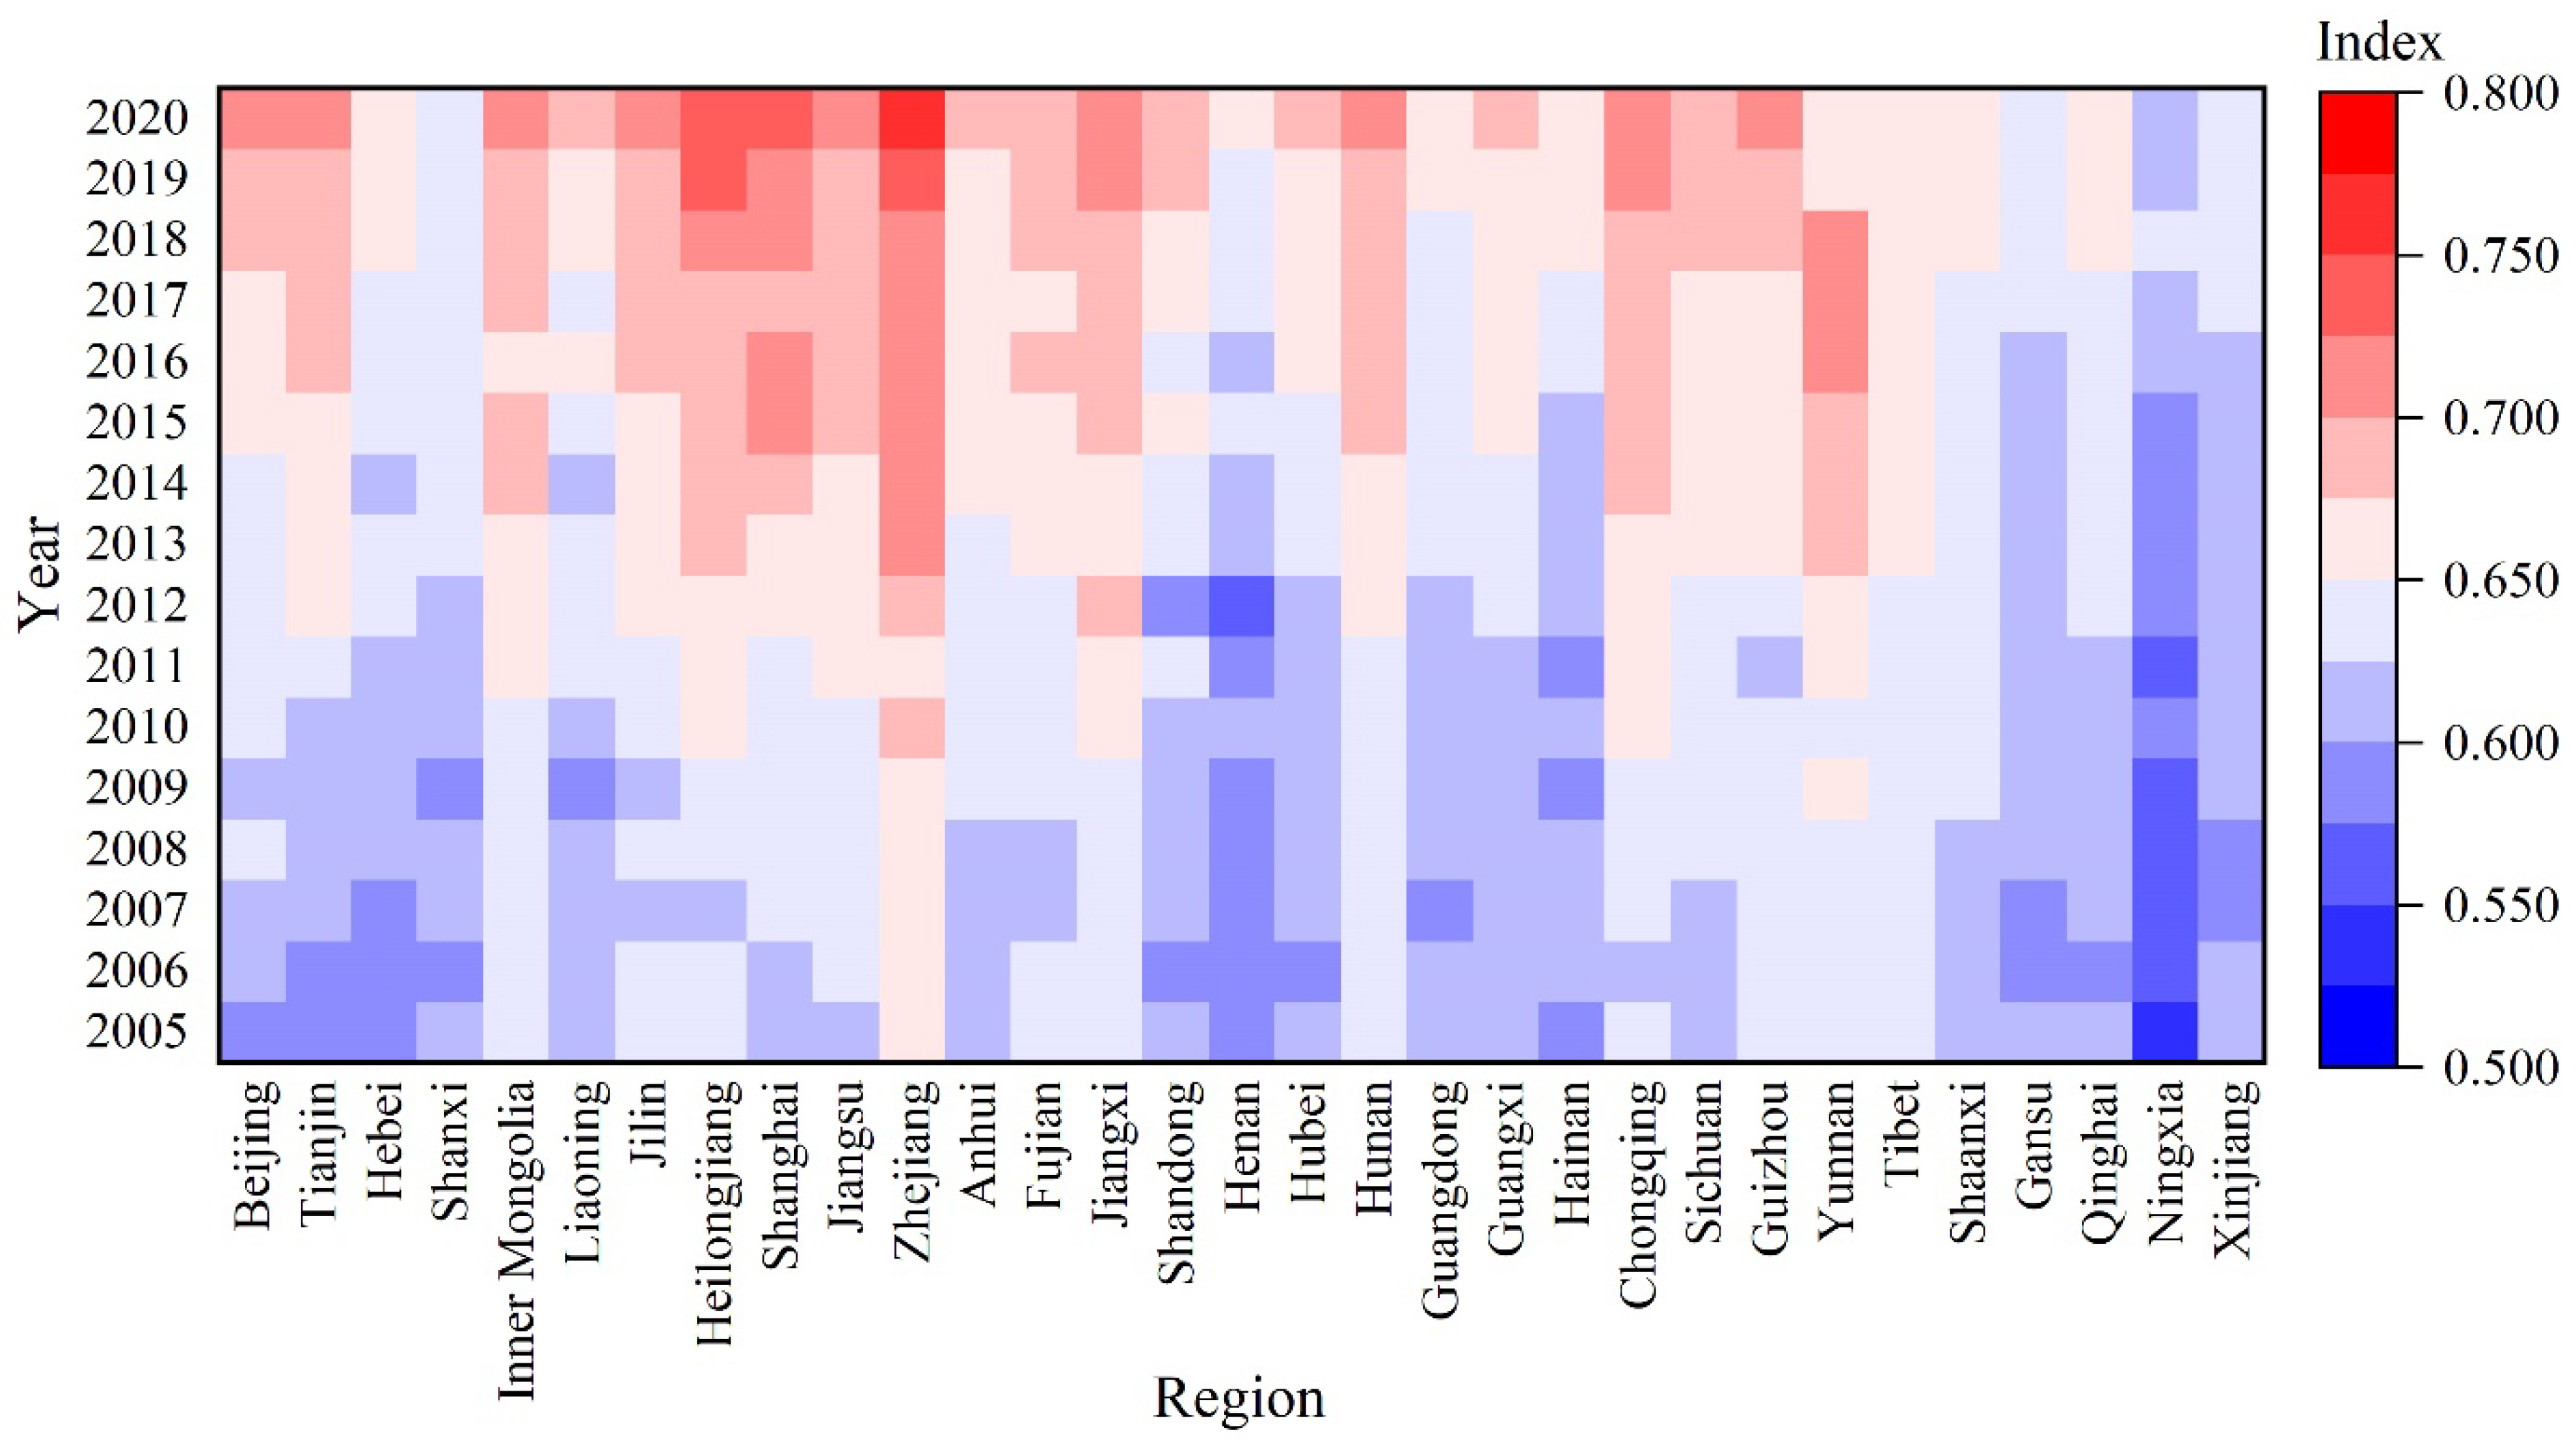
The coupling coordination degree of the LWF nexus in 31 provinces (municipal cities, autonomous regions) of China from 2005 to 2020 was measured, as shown in Figure 5. The coupling coordination degree of the LWF nexus in different regions ranged from 0.538 to 0.754, all of which showed fluctuating increases. The involved stages and types include the barely coupled coordination type in the transitional reconciliation stage, as well as the primary coupled coordination type and the intermediate coupled coordination type in the coordinated development stage. In 2005, Beijing, Tianjin, Hebei, Henan, Hainan, and Ningxia were in the transitional reconciliation stage, accounting for 19.4% of the total number of provinces, while all other regions were in the coordinated development stage. In 2006, the number of regions in the transitional reconciliation stage reached its maximum of 29% of the total number of regions, including Tianjin, Hebei, Shanxi, Shandong, Henan, Hubei, Gansu, Qinghai, and Ningxia, while all other regions were in the coordinated development stage. From 2010 to 2015, the remaining regions, except Ningxia, were in the coordinated development stage. By 2016, all regions entered the coordinated development stage, with Shanghai and Zhejiang taking the lead in the intermediate coupling coordination type. After that, the number of regions in the intermediate coupling coordination type increased continuously. By 2020, Beijing, Tianjin, Heilongjiang, Jilin, Shanghai, Jiangsu, Zhejiang, Jiangxi, Hunan, Guizhou, and Chongqing were all located in the intermediate coupling coordination type, accounting for 35.5% of the number of all provinces.
The evolution of the coupling coordination degree of the LWF nexus is related to the resource endowment, resource utilization structure, and food production efficiency of each region. At the beginning of the research stage, Yunnan, Tibet, and Xinjiang had great advantages in water resource and land resource endowment, which made the coupling coordination degree in these regions higher. However, with rapid economic and social development, the importance of resources’ rational allocation, green utilization, and intensive production gradually became prominent. Due to their low resource utilization output intensity, insufficient capacity for ensuring food production, relatively extensive development mode of agricultural industry, slow improvement of infrastructure conditions, and so on, the growth of their coupling coordination degree was slow. Among them, the average annual change rate of coupling coordination degree in Xinjiang was the lowest, which was 0.28%. In the early stage of research, Shanghai and Beijing had obvious resource constraints and a low coupling coordination degree. However, under the public role of industrial structure upgrading, resource intensive utilization, agricultural technology progress, and the strict implementation of pollution control policies, the coupling coordination degree has been rapidly improved [14]. Among them, the average annual change rate of coupling coordination degree in Beijing was the highest, which was 1.26%.

3.2.2. Characteristics of Coupling Coordinated Development of LWF Nexus in China

Based on the coupling coordination degree model, the coupling degree and coupling coordination degree of the LWF nexus in China from 2005 to 2020 was measured, and the results are shown in Table 4 (due to the length, only the results in 2005, 2010, 2015, and 2020 are shown). From 2005 to 2020, the coupling coordination level of the LWF nexus in China was relatively high, reaching the primary coupled coordination type and showing an upward trend. The coupling coordination degree increased from 0.615 in 2005 to 0.689 in 2020, with an average annual change rate of 0.76%. With the continuous advancement of agricultural modernization reform and agricultural green development, the strictest water resource management system and farmland protection system have been implemented, and technological innovation in the intensive use of resources has been strengthened, which has promoted the coupling coordination development level of the LWF nexus in China. Among them, the growth rate was the largest in 2013, when food security was raised to the height of “national strategy” for the first time. The Chinese government has successively introduced policy measures to support the increase in food production and farmers’ income. The evolution of the coupling coordinated development level of China’s LWF nexus is similar to that of the comprehensive development level, indicating that systematic coupling and coordinated development can be effectively achieved by the orderly promotion of resource utilization and the improvement of comprehensive development level of food production.

3.3. Spatial Correlations of Coupling Coordination Degree

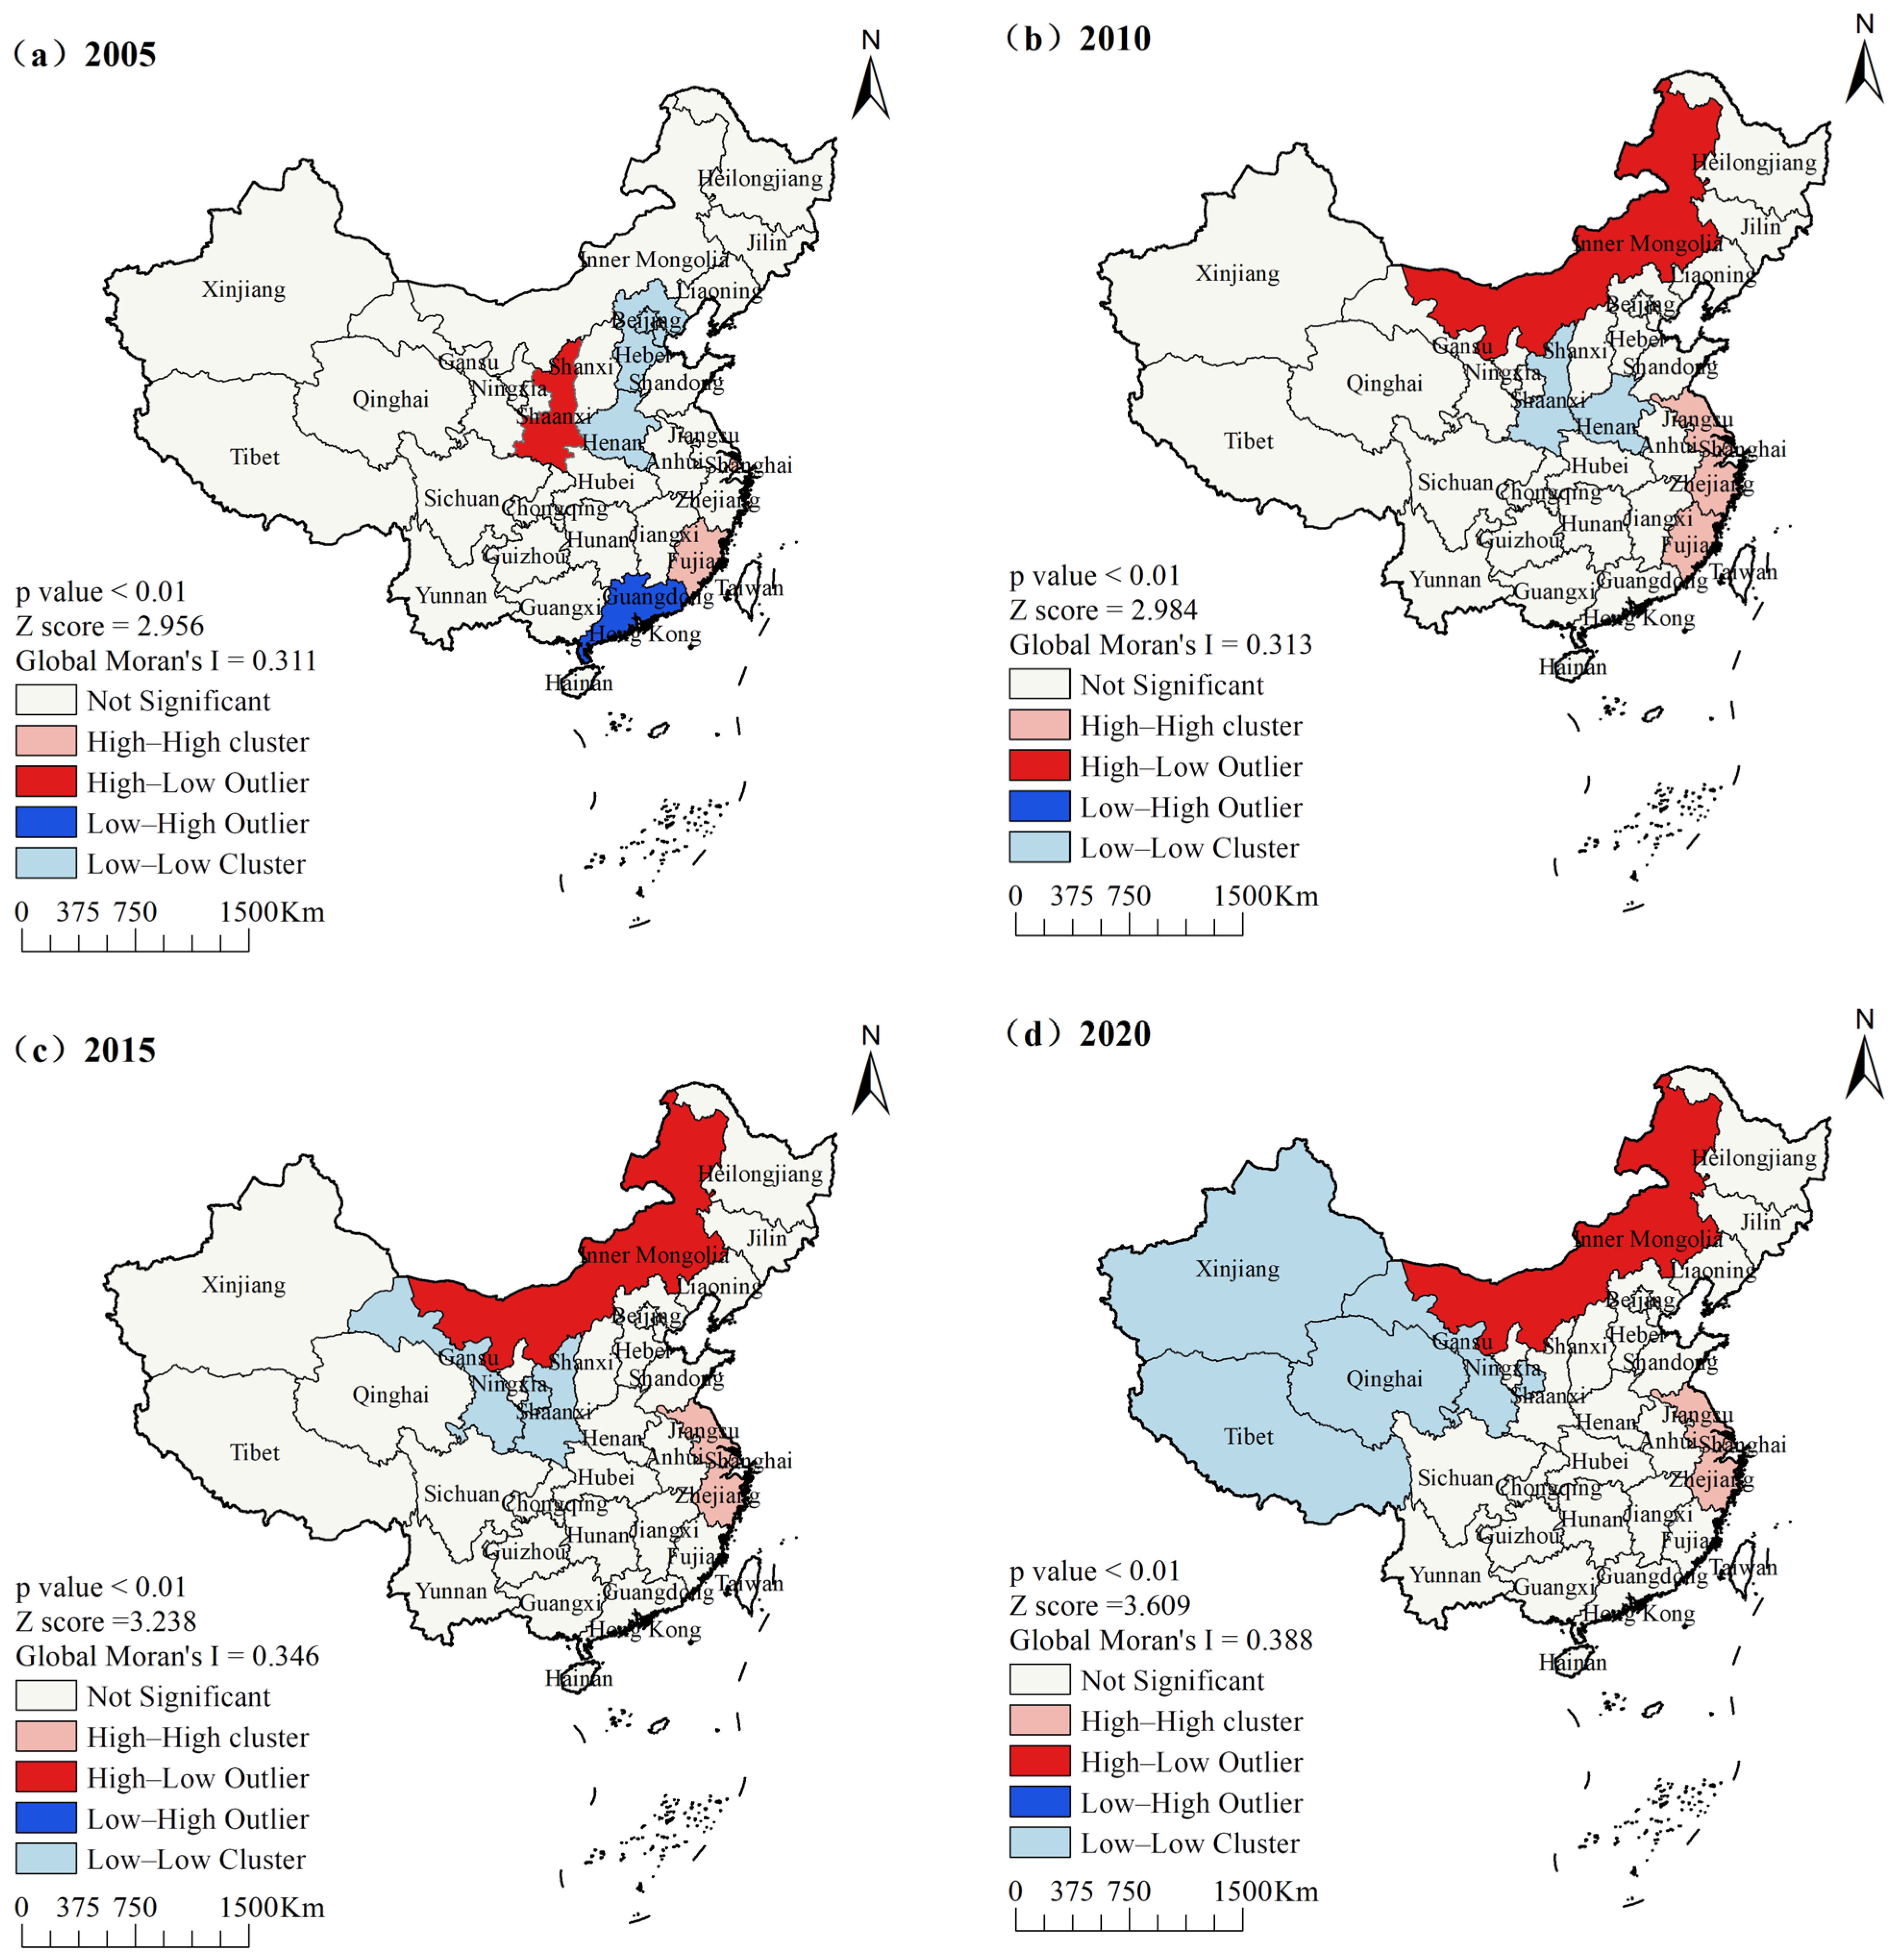
In order to clarify the spatial correlation characteristics of coupling coordinated development level, the coupling coordinated degree of the LWF nexus in 31 provinces (municipal cities, autonomous regions) from 2005 to 2020 was tested by using global autocorrelation and local autocorrelation. The spatial autocorrelation patterns of coupling coordinated degree in 2005, 2010, 2015, and 2020 are shown in Figure 6. From 2005 to 2020, the Global Moran’s I indices of the coupling coordinated degree of the LWF nexus in China were all above 0.280, with p-values less than 0.001, indicating that the coupling coordinated degree of the LWF nexus has significant spatial positive correlation and aggregation at the 0.001 level. Among them, the Global Moran’s I index in 2020 was the highest, at 0.388. The spatial positive correlation has an increasing trend.
In 2005, the spatial autocorrelation of the coupling coordinated degree of the LWF nexus in Fujian and Shanghai presents a distribution pattern of High–High Clusters; Low–Low Clusters are concentrated in Beijing, Tianjin, Hebei, and Henan, and the coupling coordination level in these regions possesses strong spatial agglomeration significance. High–Low Outliers are concentrated in Shaanxi, indicating that its own level of coupling coordinated level is high and that of neighboring regions is low. Low–High Outliers are concentrated in Guangdong, indicating that its own level of coupling coordinated level is low and that of neighboring regions is high. In 2010, High–High Clusters were concentrated in Jiangsu, Shanghai, Zhejiang, and Fujian, Low–Low Clusters were concentrated in Henan and Shaanxi, High–Low Outliers were concentrated in Inner Mongolia, and there were no Low–High Outlier areas. In 2015 and 2020, High–High Clusters were concentrated in Jiangsu, Shanghai, and Zhejiang, the High–Low Outliers remained unchanged, and there were no Low–High Outlier areas. However, in 2015, Low–Low Clusters were concentrated in Gansu and Shaanxi, and in 2020, Low–Low Clusters spread to Gansu, Qinghai, Tibet, and Xinjiang. On the whole, High–High Clusters were mainly concentrated in the Eastern Coast. Low-Low Clusters occupied more provinces, mainly in the central and western China; this distribution pattern has tended to migrate to the northwest in recent years. It is difficult for isolated high- or low-value regions to emerge.

3.4. Influencing Factors on Coupling Coordination Degree in China

Due to the existence of spatial positive correlation in the coupling coordination degree of the LWF nexus in China, the inclusion of spatial factors in the analysis could better explain the influencing factors and their spatial effect. Through the AIC test, the geographic distance matrix was incorporated into the spatial econometric analysis in this paper. Table 5 presents the regression results of the influencing factors of the coupling coordination degree using the SDM, SAR, and SEM methods. First, the LM lag statistic, the LM error statistic, as well as the LM lag (robustness) and LM error (robustness) are significant at the 1% level. Under further examination, it was observed that the statistics of the Wald test and LR test both passed the 1% significance-level test, which indicated that SDM is superior to SAR and SEM, making SDM more fit for the quantitative analysis of the panel data in this study. Secondly, the test result of the Husman estimation was 25.47, and it was significant at 1% level, which rejected the original hypothesis that random effects are better than fixed effects. Comparing and analyzing the SDM estimation results under spatial-fixed, temporal-fixed, and spatial–temporal double-fixed conditions, the R2 value and LOG-likelihood value of spatial–temporal double-fixed effects were the highest. Therefore, spatial–temporal double-fixed effects were selected as the optimization. Furthermore, the estimation results including the directions (positive and negative) and their significances for SDM, SAR, and SEM were essentially the same. This demonstrates the rationality of choosing the SDM with spatial–temporal fixed effects to estimate the influencing factors.
The SDM decomposes the impact of each influencing factor on the coupling coordination degree of the LWF nexus into direct effect, indirect effect, and total effect. Among them, the direct effect reflects the impact of specific influencing factors on the coupling coordination degree in the region. The indirect effect is caused by the change in explanatory variables in neighboring regions, which is the spillover effect. The total effect is the sum of the direct and indirect effects. The results of the effect decomposition results are shown in Table 6. The direct, indirect, and total effects of urbanization are significantly negative at the 1% level, with values of −0.032, −0.115, and −0.147, respectively. In the process of urbanization, the expanded human demand for water resources, land resources, and food production has led to an increase in the cost of resource supply. At the same time, high-intensity development and construction has driven land use changes as well as the transformation and upgrading of the food consumption structure, which is not conducive to coordination and matching among land, water, and food. This negatively affects the coupling coordination degree of the LWF nexus [45]. The direct effect of economic development is significantly positive at the 1% level, with a value of 0.015, while the indirect effect and the total effect fail the significance-level test, with values of −0.013 and 0.002, respectively. The expansion of economic development scale provides a financial guarantee and material basis for enhancing residents’ social welfare and improving social governance level, which in turn contributes to the improvement of local resource utilization efficiency. The direct, indirect, and total effects of the ecological environment are 0.015, 0.038, and 0.053, respectively. Among them, the direct effect passes the test for a 1% significance level, and the total effect passes the test for a 10% significance level. Carbon emission reduction can be effectively promoted by improving the level of ecological greening. The synergistic management level of the LWF nexus can be strengthened to enhance the ability of agriculture to cope with climate change. The direct, indirect, and total effects of scientific and technological progress are all positive, and the indirect effect (0.024) and total effect (0.034) are both significant at the 1% level. This further proves that technological progress can not only benefit the local area, but also promote the coupling coordination degree of the LWF nexus in the surrounding area. Strengthening basic scientific and technological research and developing security technologies for the LWF nexus are urgently needed [46]. The direct, indirect, and total effects of industrial structure are relatively small, and none of them pass the significance-level test. The regression coefficient of the direct effect is positive, while the regression coefficients of the indirect effect and total effect are negative. This indicates that the influence mechanism of agricultural industry agglomeration is complicated. On the one hand, agricultural industry agglomeration can coordinate related factors, reduce production and transaction costs, and promote resource sharing [47]; on the other hand, excessive pollution emission, resource congestion, and excessive competition for agricultural production materials may be triggered with an increase in agricultural industry agglomeration. The large scale of agricultural production and abundant resources in a region may attract the inflow of technology, talents, capital, and other factors from the surrounding areas, thus inhibiting the development of the LWF nexus in the surrounding areas [48].

3.5. Future Trend of Coupling Coordination Degree

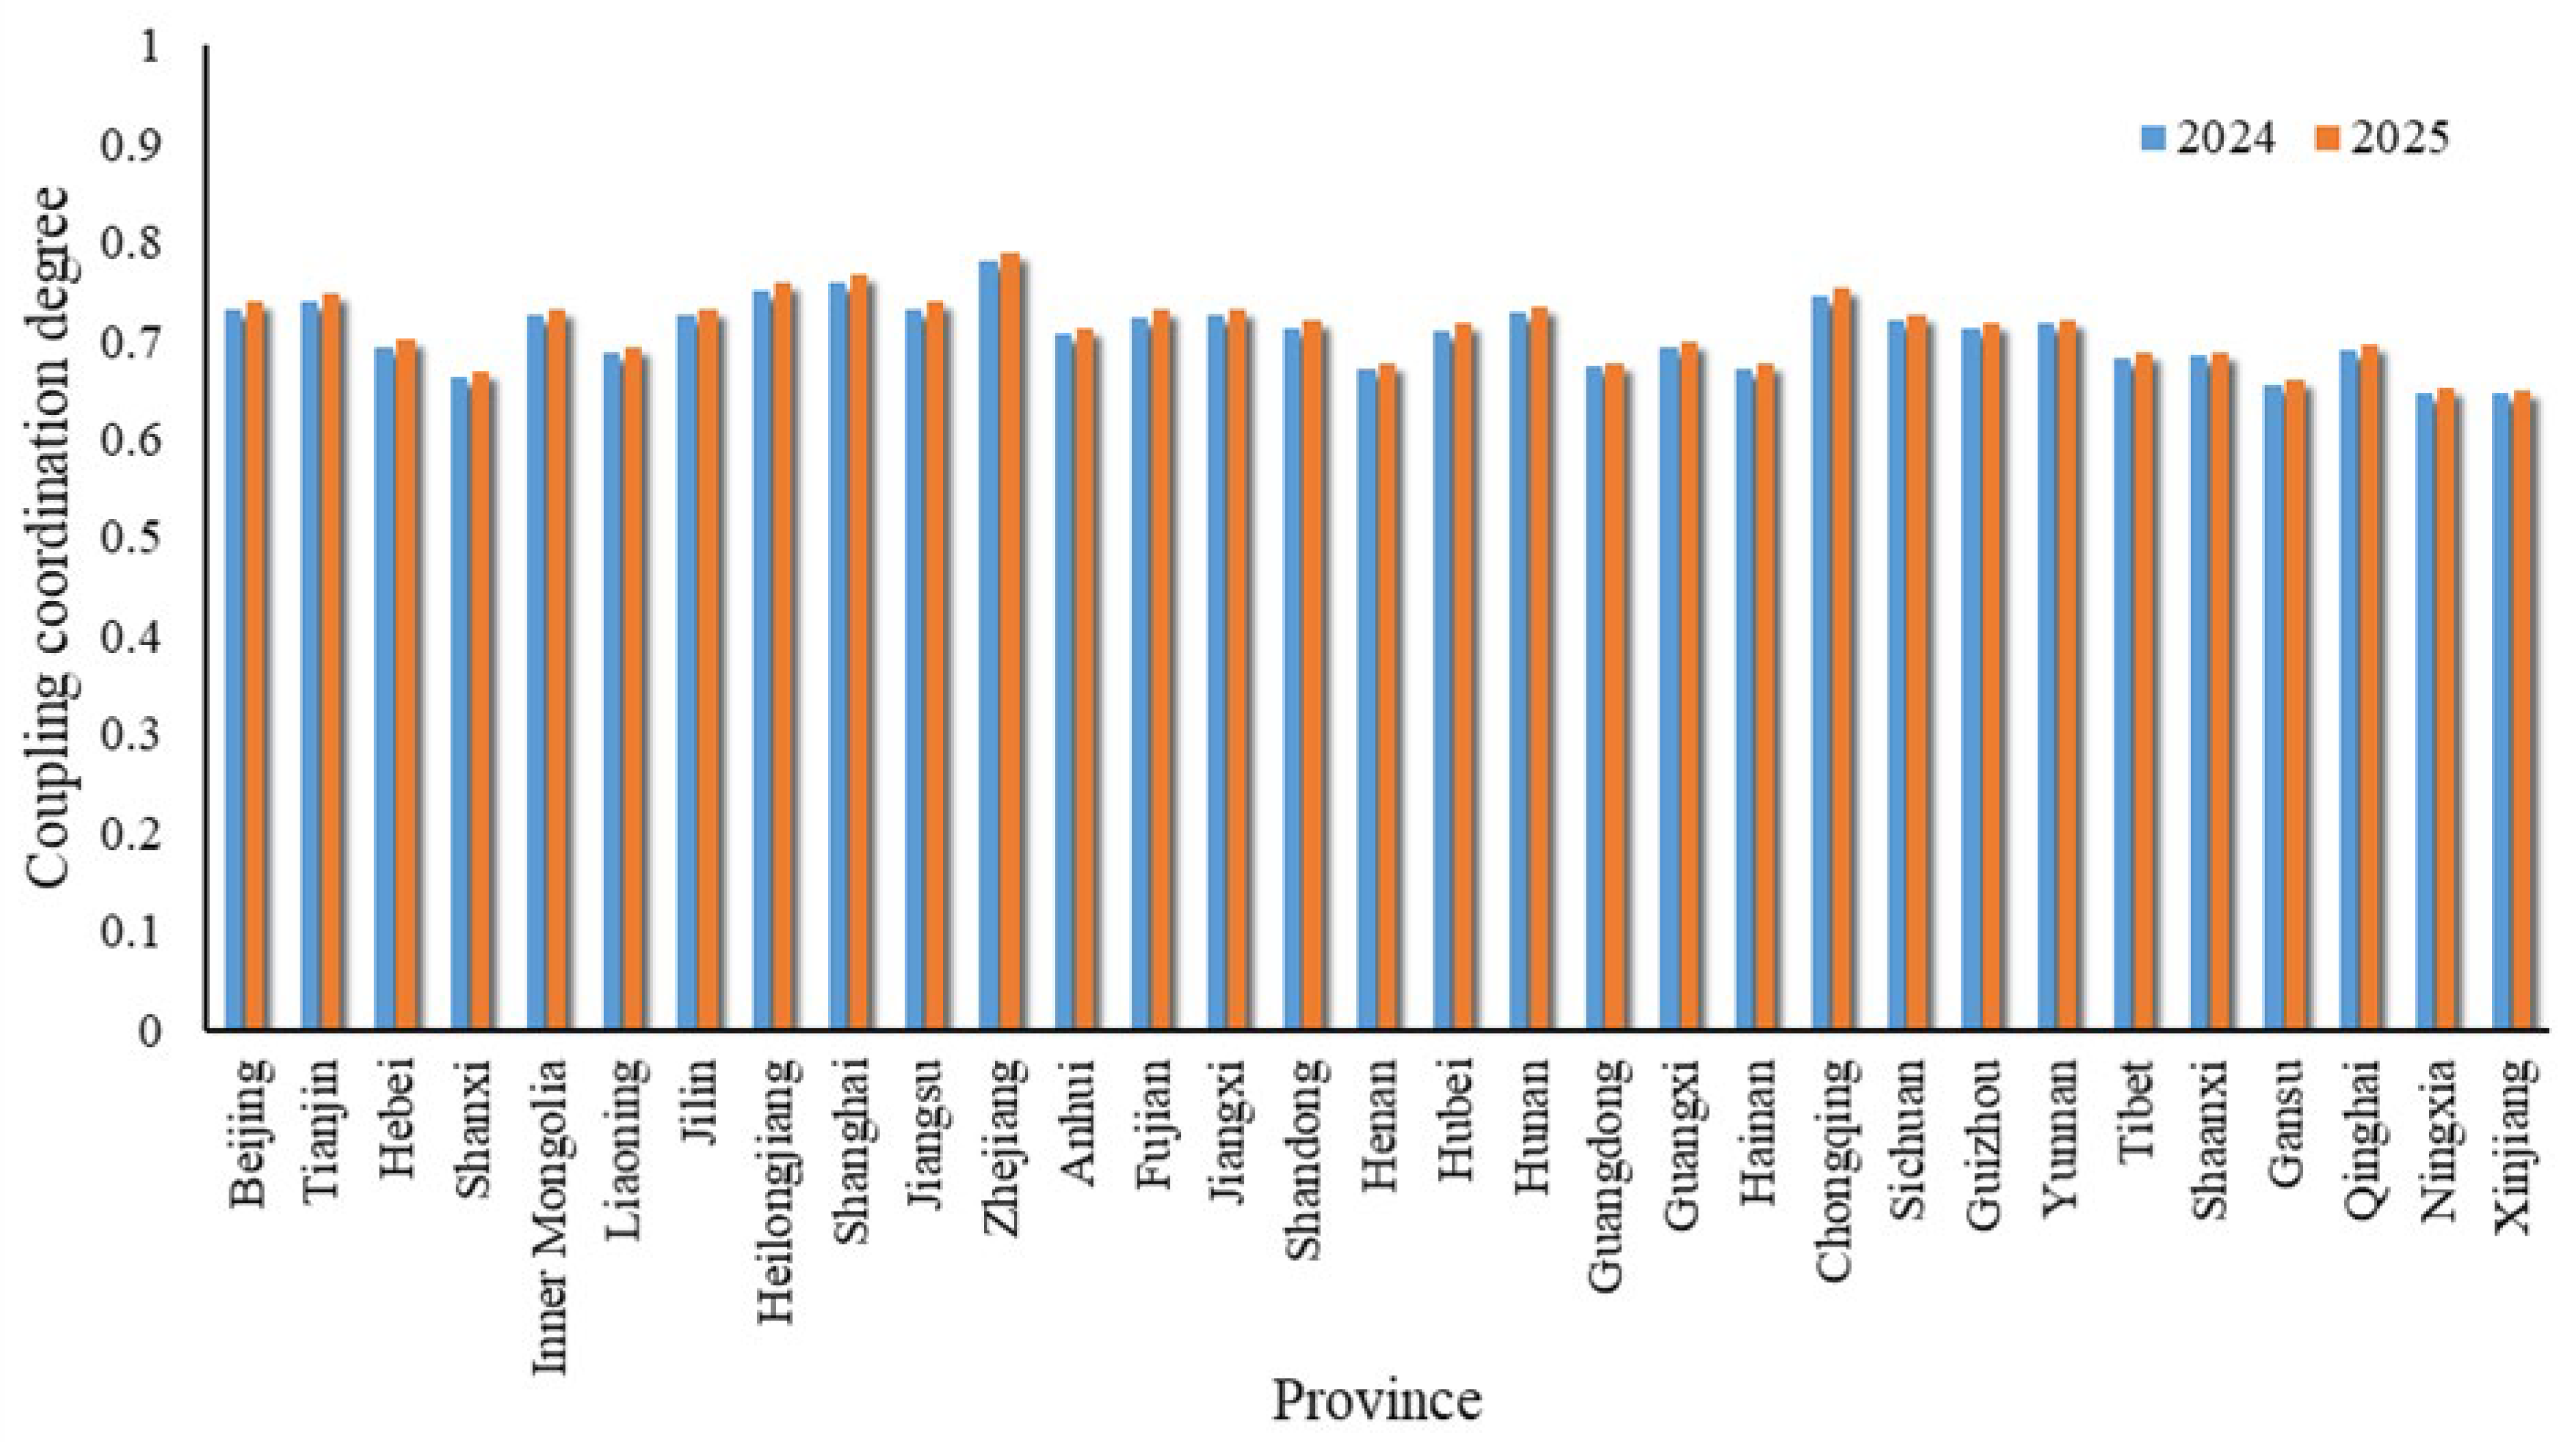
The GM (1,1) model was used to predict the coupling coordination degree of the LWF nexus in Chinese provinces from 2024 to 2025, and the results are shown in Figure 7. The coupling coordination degree predictions for the provinces have all passed the posterior-variance test and all the C results are less than 0.35, indicating that the model has a high prediction accuracy. The coupling coordination degree of the LWF nexus in various provinces from 2024 to 2025 shows a stable increase, basically keeping the development trend of coupling coordination development from 2005 to 2020. The coupling coordination degree of China’s LWF nexus will increase by 3.5% in 2025 compared with 2020, with most provinces entering the intermediate coupled coordination type. This is in line with important strategic plans issued by the Government of China, such as the “ Fourteenth Five-Year Plan” for agricultural and rural modernization and the “ Fourteenth Five-Year Plan” for water safety and security. Overall, the interaction degree between land, water, and food in China will continue to increase in the future, promoting the continuous improvement of the coupling coordination degree of the LWF nexus. Saving water resources, strengthening farmland protection, improving farmland quality, and enhancing agricultural productivity are the goals pursued by the Chinese government [49].
The coupling coordination degree of the LWF nexus in Zhejiang is in first place of all provinces in 2024 and 2025, reaching 0.780 and 0.788, respectively. The reason for this may be that, in recent years, Zhejiang has integrated resource conservation into the entire process of social development and ecological civilization construction, continuously leveraging its technological advantages, improving its comprehensive grain production capacity, promoting green and high-quality agricultural development, and building a demonstration area for common prosperity, which ensures the nexus’ stable development. However, the coupling coordination degrees of Xinjiang, Ningxia, Gansu, Shanxi, and others are still in the preliminary coupled coordination type. Strictly implementing the “four water and four determinations” of “setting the city, land, people, and production by water”, improving the water rights trading mechanism, and accelerating the western route of the South-to-North Water Diversion Project are particularly necessary. It is predicted that the development of the LWF nexus in western China will strengthen under the guidance of the new development concepts [50].

4. Discussion

In this study, the coupling coordination degree model, spatial Tobit model, and GM(1,1) model are used to evaluate the coupling coordination development level, influencing factors, and future trends of China’s LWF nexus, with a view to providing support and reference for promoting the resources’ synergistic development and guaranteeing national food security.
Although the coupling coordination development of the LWF nexus in China has a positive evolutionary trend, it is still in the preliminary coupled coordination type. In particular, the development of land lags behind the development of water and food. Land is the most fundamental production factor for ensuring food security; on the one hand, since the implementation of the policy of farmland occupation and compensation balance in China in 1997, it has achieved significant results in land development and improvement, basically achieving the goal of cultivated land area not being reduced; on the other hand, it is not optimistic that the overall quality level of cultivated land in China is low, the reserve land resources suitable for cultivation are exhausted, and the uneven development of water and land resources caused by the northward migration of cultivated land has limited the potential for food production [51]. Numerous studies have shown that the fundamental problem for China’s water and cultivated land resources is not an absolute shortage in quantity, but rather the low efficiency in resource matching and utilization due to the imbalance in the scale of water and cultivated land resource utilization, as well as the mismatch in spatial allocation [38,52,53]. The application of systematic cognitive ability to shift the thinking of single-factor governance towards the collaborative improvement of the efficiency of the LWF nexus is a necessary way to promote China’s food production to a higher level.
Regional differences are also an important feature of the coupling coordination development of the LWF nexus in China. The spatial distribution is generally higher in the southeast than in the northwest, which is consistent with the uneven distribution of socio-economic activities in China. Northwest China has abundant natural resources and strong ecosystem service supply capacity, but its utilization efficiency is not high, and the resource advantages are not fully utilized. It is worth noting that Heilongjiang always ranks high in the LWF nexus coupling coordination development ranking. The local government has increased investment and supervision in high-standard farmland construction and agricultural water conservancy infrastructure, continuously consolidating and improving the comprehensive food production capacity. In 2023, Heilongjiang’s food production achieved “twenty consecutive harvests”, ranking first in the country for 14 consecutive years, and building a solid “ballast stone” for food security. In realizing the reasonable sharing and dynamic balance of regional resources, it is necessary to accurately classify and implement measures based on the background conditions of water and land resources, provide supporting infrastructure, prevent and control farmland degradation, develop water-saving irrigation, and promote the spatial layout of food production to be more in line with the natural geographic pattern and agricultural production laws.
Research on influencing factors indicates that the coupling coordination development of the LWF nexus is a complex process involving both internal and external factors. Economic development and ecological environment are the main factors, and the Environmental Kuznets Curve proves that economic development can only provide a better foundation for the development of ecological environment to a certain extent [54]. Meanwhile, attention should also be paid to the increase in food production costs, water scarcity [55], decline in soil quality [56], rural labor migration, and “non-agricultural” rural population caused by the loss of farmland after population urbanization. Scientific and technological progress is also an important factor that can be easily overlooked. Enhancing the level of technological innovation and achieving key technological breakthroughs are of great significance for promoting the coupling coordination development of China’s LWF nexus.
In addition, in order to ensure food security, the Chinese government has proposed many effective measures. For example, it has drawn the “red line” for farmland, a policy that requires China’s farmland to be no less than 1.8 billion mu; deepened the reform of the farmland occupation and compensation balance, so that if farmland is taken up for construction it is necessary to replenish the same quantity and quality of farmland through reclamation and other methods; and committed to comprehensively improving the efficiency and effectiveness of water resource utilization. Based on the concept of sustainable development, establishing food security guarantee mechanisms with resource conservation and intensive use at their core is an effective way for the Chinese government to promote the synergistic development of the LWF nexus in the future. Water and land resources are rigid constraints on food production, and the selective maintenance of land and water sources and development of potentially usable farmland can improve the productivity of the LWF nexus under limited-resource conditions, especially in arid regions. It is worth noting that in the process of land–water–food (LWF) use and production, stakeholders mainly involve the central government, local governments, and the public. For a long time, the coupling coordination development of the LWF nexus in China has been led by the government. Mechanisms for the participation of the private sector, nongovernmental organizations, and the public have not yet been effectively established, which greatly affects the efficiency and effectiveness of the orderly evolution and sustainable development of the LWF nexus. In the future, the needs of different stakeholders can be fully considered; combined with multi-party governance, research will provide specific and in-depth policy programs and implementation methods, strengthen analysis depth and continuously enrich content.

5. Conclusions and Suggestions

5.1. Conclusions

LWF nexus is one of the important potential pathways to achieve sustainable development goals. In this study, by constructing the coupling coordination evaluation index system for the LWF nexus, we measured the comprehensive development index of each system and the LWF nexus in 31 provinces (municipal cities, autonomous regions) of China from 2005 to 2020 and evaluate the coupling and coordination relationships and characteristics. On this basis, the spatial correlation and influencing factors of the coupling coordination development of China’s LWF nexus were identified, and the future evolution trends were predicted by exploring spatial data analysis, the spatial Tobit model, and the GM (1, 1) model. The following conclusions are drawn:
(1)
The comprehensive development index of land in 31 provinces (municipal cities, autonomous regions) ranges from 0.162 to 0.497, the comprehensive development index of water ranges from 0.164 to 0.729, and the comprehensive development index of food ranges from 0.284 to 0.741. During the research period, the comprehensive development level of the land system lagged behind the water system and the food system. The comprehensive development level of China’s LWF nexus shows an upward trend. In regions with relatively abundant land resources, water resources, and food production resources, the level of the LWF nexus is relatively high, while in regions with relatively weak water and land resources, the level of the LWF nexus is relatively low.
(2)
The coupling coordination level of the LWF nexus in different regions ranges from 0.538 to 0.754, involving the barely coupled coordination type, preliminary coupled coordination type, and intermediate coupled coordination type. Among them, the average annual change rate of coupling coordination degree in Beijing is the highest, at 1.26%, and that in Xinjiang is the lowest, at 0.28%. The coupling coordination development of China’s LWF nexus has reached the preliminary coupled coordination type, and its evolution is similar to the evolution of the comprehensive development level. Through the orderly promotion of the comprehensive development level of resource utilization and food production, the coupling coordination development of the LWF nexus can be effectively achieved.
(3)
There is a significant spatial positive correlation between coupling coordination development levels for the LWF nexus in China, and it shows an increasing trend over time. The High–High Clusters are mainly concentrated in the eastern coastal regions, while the Low–Low Clusters occupy more provinces, mainly in the central and western regions. The spatial Tobit regression results show that urbanization level and agricultural industry agglomeration have a negative impact on the coupling coordination development of China’s LWF nexus, while economic development, ecological environment, and scientific and technological progress all have a positive impact.
(4)
The coupling coordination development of the LWF nexus in China shows a steady upward trend from 2024 to 2025, basically continuing the trend of changes from 2005 to 2020. If the current state is maintained, the LWF nexus in most regions will reach the intermediate coupled coordination type by 2025, while the development of the LWF nexus in western regions still needs to be strengthened.

5.2. Policy Suggestions

There is still room for improvement in the coupling coordination development of the LWF nexus in China. The government and relevant managers should ensure national food security and promote the sustainable utilization of water and land resources by zoning and classification based on their respective resource endowment conditions and characteristics.
Firstly, the land systems with relatively lagging comprehensive development capabilities should be given special attention. It is particularly important to strictly adhere to the red line of cultivated land; improve the quality of cultivated land; increase comprehensive management of polluted, damaged, and abandoned cultivated land; optimize production and planting structure; and tap into the potential of existing construction land. In the major grain marketing areas, the balance between economic construction and cultivated land protection should be actively sought to increase the local food self-sufficiency rate; in the producing–marketing balanced areas, the exploitation of marginal land resources should be reduced, and the relationship between land, economic development, and ecological environmental protection should be properly handled to ensure the sustainable utilization of cultivated land resources, whereas in the major grain producing areas, the policies and initiatives to support food production should be stabilized and perfected, the potential of varieties and technologies to stabilize and increase yields should be tapped, and high-standard farmland construction should be strengthened to give full play to local food production advantages.
Secondly, it is necessary to formulate a differentiated strategy for improving the level of the LWF nexus’ synergistic development. The eastern region should make full use of its significant advantages in terms of capital, technology, and talent, devote itself to agricultural science and technology and system innovation, and radiate the coordinated development of the LWF nexus into the surrounding areas through demonstration and promotion, experience exchange, and other methods. The central region should be based on its own resource endowment and the actual situation of agricultural development, actively introducing advanced and applicable agricultural technology and achievements, and promoting the transformation, upgrading, and improvement of the quality of food production. The western region should strengthen agro-ecological protections and environmental management, control high-intensity and high-water-consuming food cultivation, and gradually implement the project of returning farmland to grassland and grazing land with low yields and lack of facilities. The northeast region should do a good job in ensuring stable national grain production and supply, continue to improve the comprehensive grain production capacity and emergency support capacity, and promote food security to a higher level. Meanwhile, the eastern region, the central region, the western region, and the northeastern regions should strengthen exchanges and cooperation, and promote the full inter-regional flow of factors such as capital, technology, and talent.
Finally, multiple resource systems including water, land, and food need to be considered comprehensively through methods such as strengthening communication and cooperation among the competent authorities, promoting information management and information sharing for various type of resources, promoting synergistic regional development related to major water transfer projects, deeply innovating resource transformation and trading methods, evaluating and detecting the actual collaborative situation of resource development, utilization and protection, and exploring synergistic resource management measures to ensure food security and ecologically appropriate development.

Author Contributions

C.L.: Conceptualization, Methodology, Validation, Writing—original draft. W.J.: Methodology. J.W.: Data Curation. H.L.: Formal Analysis. Y.L.: Investigation. Q.L.: Writing—review and editing, Supervision, Project Administration. All authors have read and agreed to the published version of the manuscript.

Funding

The research is sponsored by the Jiangxi Academy of Agricultural Sciences Fundamental Research and Talent Training Program (No. JXSNKYJCRC202446), the Nanchang Social Science Planning Project (No.GL202408), the Third Xinjiang Scientific Expedition and Research Program (2021xjkk0203), and the Major Program of National Social Science Foundation of China (Grant No.21ZDA056).

Institutional Review Board Statement

Not applicable.

Data Availability Statement

The data presented in this study are available on request from the first author.

Conflicts of Interest

The authors declare no conflicts of interest.

References

  1. UN. Agenda 21. United Nations Conference on Environment & Development; United Nations: New York, NY, USA, 1992. [Google Scholar]
  2. UN. The Millennium Development Goals Report 2015; United Nations: New York, NY, USA, 2015. [Google Scholar]
  3. UN. Transforming Our World: The 2030 Agenda for Sustainable Development; United Nations: New York, NY, USA, 2015. [Google Scholar]
  4. UN. The Sustainable Development Goals Report 2020; United Nations: New York, NY, USA, 2020. [Google Scholar]
  5. Jeffrey, D.S.; Guillaume, L.; Christian, K.; Grayson, F.; Finn, W. Sustainable Development Report 2022: From Crisis to Sustainable Development: The SDGs as Roadmap to 2030 and Beyond; Cambridge University Press: Cambridge, UK, 2022. [Google Scholar]
  6. Xin, M.; Guo, H.; Li, S.; Chen, L. Can China achieve ecological sustainability? An LMDI analysis of ecological footprint and economic development decoupling. Ecol. Indic. 2023, 151, 110303. [Google Scholar] [CrossRef]
  7. Song, M.; Tao, W.; Shang, Y.; Zhao, X. Spatiotemporal characteristics and influencing factors of China’s urban water resource utilization efficiency from the perspective of sustainable development. J. Clean. Prod. 2022, 338, 130649. [Google Scholar] [CrossRef]
  8. Song, J.; Liu, C.; Xing, J.; Yang, W.; Ren, J. Linking bioenergy production by agricultural residues to sustainable development goals: Prospects by 2030 in China. Energy Convers. Manag. 2023, 276, 116568. [Google Scholar] [CrossRef]
  9. Bai, X.; Wang, K.; Tran, T.; Sadip, M.; Trung, L.M.; Khudoykulov, K. Measuring China’s green economic recovery and energy environment sustainability: Econometric analysis of sustainable development goals. Econ. Anal. Policy 2022, 75, 768–779. [Google Scholar] [CrossRef]
  10. Wang, Z.; Fu, H.; Liu, H.; Liao, C. Urban development sustainability, industrial structure adjustment, and land use efficiency in China. Sustain. Cities Soc. 2023, 89, 104338. [Google Scholar] [CrossRef]
  11. Feng, T.; Xiong, R.; Huan, P. Productive use of natural resources in agriculture: The main policy lessons. Resour. Policy 2023, 85, 103793. [Google Scholar] [CrossRef]
  12. Fitton, N.; Alexander, P.; Arnell, N.; Bajzelj, B.; Calvin, K.; Doelman, J.; Gerber, S.; Havlik, P.; Hasegawa, T.; Herrero, M.; et al. The vulnerabilities of agricultural land and food production to future water scarcity. Glob. Environ. Change 2019, 58, 101944. [Google Scholar] [CrossRef]
  13. He, G.; Zhao, Y.; Wang, L.; Jiang, S.; Zhu, Y. China’s food security challenge: Effects of food habit changes on requirements for arable land and water. J. Clean. Prod. 2019, 229, 739–750. [Google Scholar] [CrossRef]
  14. Li, C.; Zhou, X.; Zhou, Y. The Characteristics and Influencing Factors of Coupling Coordination Between Water-soil Matching Coefficient and Grain Production in the Lower Reaches of the Yellow River. Econ. Geogr. 2022, 42, 177–185. [Google Scholar]
  15. Wang, X.; Xin, L.; Tan, M.; Li, X.; Wang, J. Impact of spatiotemporal change of cultivated land on food-water relations in China during 1990–2015. Sci. Total Environ. 2020, 716, 137119. [Google Scholar] [PubMed]
  16. Zhou, Y.; Zhong, Z.; Cheng, G. Cultivated land loss and construction land expansion in China: Evidence from national land surveys in 1996, 2009 and 2019. Land Use Policy 2023, 125, 106496. [Google Scholar] [CrossRef]
  17. Xia, J.; Su, R.; He, X.; Huang, Y. Water resources problems in China and their countermeasures and suggestions. Bull. Chin. Acad. Sci. 2008, 2, 116–120. (In Chinese) [Google Scholar]
  18. Li, F.; Ma, S.; Liu, X. Changing multi-scale spatiotemporal patterns in food security risk in China. J. Clean. Prod. 2023, 384, 135618. [Google Scholar]
  19. Ibarrola-Rivas, M.; Granados-Ramírez, R.; Nonhebel, S. Is the available cropland and water enough for food demand? A global perspective of the Land-Water-Food nexus. Adv. Water Resour. 2017, 110, 476–483. [Google Scholar] [CrossRef]
  20. Huang, X.; Fang, H.; Wu, M.; Cao, X. Assessment of the regional agricultural water-land Nexus in China: A green-blue water perspective. Sci. Total Environ. 2022, 804, 150192. [Google Scholar] [CrossRef] [PubMed]
  21. Mu, Y. Research on the path and mechanism toward effective utilization of water resources to ensure food security. Theory. J. 2022, 6, 110–118. (In Chinese) [Google Scholar]
  22. Zheng, Y.; Hong, J.; Qin, W.; Chen, Y.; Ni, D. Managing water-land-food nexus towards resource efficiency improvement: A superedge-based analysis of China. J. Environ. Manag. 2023, 325, 116607. [Google Scholar]
  23. He, L.; Wang, Y.; Yin, F.; Guan, Y. The multivariate matching properties among water and soil resources and agricultural development in Central Asia under global climate change. Sci. Sin. 2020, 50, 1268–1279. (In Chinese) [Google Scholar]
  24. Yao, L.; Li, Y.; Chen, X. A robust water-food-land nexus optimization model for sustainable agricultural development in the Yangtze River Basin. Agr. Water Manag. 2021, 256, 107103. [Google Scholar] [CrossRef]
  25. Shu, J.; Bai, Y.; Chen, Q.; Weng, C.; Zhang, F. Dynamic simulation of the water-land-food nexus for the sustainable agricultural development in the North China Plain. Sci. Total Environ. 2024, 912, 168771. [Google Scholar] [CrossRef]
  26. Sušnik, J.; Masia, S.; Indriksone, D.; Brēmere, I.; Vamvakeridou-Lydroudia, L. System dynamics modelling to explore the impacts of policies on the water-energy-food-land-climate nexus in Latvia. Sci. Total Environ. 2021, 775, 145827. [Google Scholar] [CrossRef]
  27. Cheng, Z.; He, J.; Xu, S.; Yang, X. Coupling assessment for the water-economy-ecology nexus in Western China. Ecol. Indic. 2023, 154, 110648. [Google Scholar] [CrossRef]
  28. Zhang, Y.; Zhu, T.; Guo, H.; Yang, X. Analysis of the coupling coordination degree of the Society-Economy-Resource-Environment system in urban areas: Case study of the Jingjinji urban agglomeration, China. Ecol. Indic. 2023, 146, 109851. [Google Scholar] [CrossRef]
  29. Shi, J.; Liu, M.; Duan, K. Spatiotemporal evolution of coupling coordination in population-land relationship and its influencing factors: A case study of 26 main cities in Yangtze River Delta, China. Phys. Chem. Earth 2022, 128, 103247. [Google Scholar] [CrossRef]
  30. Wang, S.; Yang, J.; Wang, A.; Liu, T.; Du, S.; Liang, S. Coordinated analysis and evaluation of water–energy–food coupling: A case study of the Yellow River basin in Shandong Province, China. Ecol. Indic. 2023, 148, 110138. [Google Scholar] [CrossRef]
  31. Pang, J.; Liu, X.; Huang, Q. A new quality evaluation system of soil and water conservation for sustainable agricultural development. Agric. Water Manag. 2020, 240, 106235. [Google Scholar] [CrossRef]
  32. Ju, K.; Wang, J.; Wei, X.; Li, H.; Xu, S. A comprehensive evaluation of the security of the water-energy-food systems in China. Sustian. Prod. Consump. 2023, 39, 145–161. [Google Scholar] [CrossRef]
  33. Liu, L.; Wang, X.; Meng, X.; Cai, Y. The coupling and coordination between food production security and agricultural ecological protection in main food-producing areas of China. Ecol. Indic. 2023, 154, 110785. [Google Scholar] [CrossRef]
  34. Zhou, Y.; Zhang, X.; Chen, Y.; Xu, X.; Li, M. A water-land-energy-carbon nexus evaluation of agricultural sustainability under multiple uncertainties: The application of a multi-attribute group decision method determined by an interval-valued intuitionistic fuzzy set. Expert. Syst. Appl. 2024, 242, 122833. [Google Scholar] [CrossRef]
  35. Li, B.; Zhang, J.; Li, H. Research on spatial-temporal characteristics and affecting factors decomposition of agricultural carbon emission in China. Chin. J. Popul. Resour. 2011, 21, 80–86. (In Chinese) [Google Scholar]
  36. Lai, S.; Du, P.; Chen, J. Evaluation of non-point source pollution based on unit analysis. J. Tsinghua Univ. Sci. & Tech. 2004, 9, 1184–1187. (In Chinese) [Google Scholar]
  37. Zhang, N.; Yang, X.; Chen, T. Research on the coupling coordination of water-energy-food system and its temporal and spatial characteristics. Chin. Environ. Sci. 2022, 42, 4444–4456. (In Chinese) [Google Scholar]
  38. Liu, C.; Jiang, W.; Liu, Y.; Liu, Y. Evaluation for water and land resources system efficiency and influencing factors in china: A two-stage network DEA model. Land 2023, 12, 396. [Google Scholar] [CrossRef]
  39. Moran, P. The interpretation of statistical maps. J. R. Stat. Soc. Ser. B 1948, 10, 243–251. [Google Scholar] [CrossRef]
  40. Zhao, J.; Han, T.; Wang, C.; Shi, X.; Wang, K.; Zhao, M.; Chen, F.; Chu, Q. Assessing variation and driving factors of the county-scale water footprint for soybean production in China. Agric. Water Manag. 2022, 263, 107469. [Google Scholar] [CrossRef]
  41. Tang, J.; Wang, Q.; Li, Z.; Gu, J.; Xu, J. Coupling coordination degree of industrial solid waste prevention and treatment efficiencies and its driving factors in China. Ecol. Indic. 2024, 158, 111395. [Google Scholar] [CrossRef]
  42. Guo, S.; Wen, Y.; Zhang, X.; Chen, H. Runoff prediction of lower Yellow River based on CEEMDAN–LSSVM–GM(1,1) model. Sci. Rep. 2023, 13, 1511. [Google Scholar] [CrossRef]
  43. Liu, J.; Shi, K.; Wang, Z.; Jin, C. Policy effects of water rights trading (WRT). Environ. Sustain. Indic. 2024, 24, 100537. [Google Scholar] [CrossRef]
  44. Zhang, Q.; Zhang, F.; Wu, G.; Mai, Q. Spatial spillover effects of grain production efficiency in China: Measurement and scope. J. Clean. Prod. 2021, 278, 121062. [Google Scholar] [CrossRef]
  45. Yang, K.; Han, Q.; Vries, B. Urbanization effects on the food-water-energy nexus within ecosystem services: A case study of the Beijing-Tianjin-Hebei urban agglomeration in China. Ecol. Indic. 2024, 160, 111845. [Google Scholar] [CrossRef]
  46. Jiang, S.; Wang, J.; Liu, H.; Zhu, Y.; He, G.; Li, W.; Huang, H. Coordinated Development of Water, Food, and Energy in Upper and Middle Reaches of the Yellow River. Strateg. Study Chin. Acad. Eng. 2023, 25, 180–190. (In Chinese) [Google Scholar] [CrossRef]
  47. Xue, L.; Shen, Y.; Xu, C. A research on spillover effects of agricultural agglomeration on agricultural green development efficiency. Econ. Surv. 2020, 37, 45–53. (In Chinese) [Google Scholar]
  48. Guo, Y.; Tong, L.; Mei, L. The effect of industrial agglomeration on green development efficiency in Northeast China since the revitalization. J. Clean. Prod. 2020, 258, 120584. [Google Scholar] [CrossRef]
  49. Hao, S.; Wang, G.; Yang, Y.; Zhao, S.; Huang, S.; Liu, L.; Zhang, H. Promoting grain production through high-standard farmland construction: Evidence in China. J. Integr. Agr. 2024, 23, 324–335. [Google Scholar] [CrossRef]
  50. Wang, H.; Jiang, S.; Zhu, Y.; Zhao, Y.; He, F.; He, G.; Li, W. Research on the collaborative safety development strategy of Water-Energy-Food Nexus in China. Chin. Water. 2024, 17, 5–12. (In Chinese) [Google Scholar]
  51. Li, T.; Long, H.; Zhang, Y.; Tu, S.; Ge, D.; Li, Y.; Hu, B. Analysis of the spatial mismatch of grain production and farmland resources in China based on the potential crop rotation system. Land Use Policy 2017, 60, 26–36. [Google Scholar] [CrossRef]
  52. Zhang, B.; Wang, Q.; Liu, Y.; Zhang, Y.; Wu, X.; Sun, X.; Qiao, H. Uneven development within China: Implications for interprovincial energy, water and arable land requirements. J. Environ. Manag. 2020, 261, 110231. [Google Scholar] [CrossRef] [PubMed]
  53. Cao, X.; Wu, N.; Adamowski, J.; Wu, M. Assessing the contribution of China’s grain production during 2005–2020 from the perspective of the crop-water-land nexus. J. Hydrol. 2023, 626, 130376. [Google Scholar] [CrossRef]
  54. Stern, D.; Common, M.; Barbier, E. Economic growth and environmental degradation: The environmental Kuznets curve and sustainable development. World. Dev. 1996, 24, 1151–1160. [Google Scholar] [CrossRef]
  55. Hanjra, M.; Qureshi, M. Global water crisis and future food security in an era of climate change. Food Policy 2010, 35, 365–377. [Google Scholar] [CrossRef]
  56. Ye, L.; Van, R. Production scenarios and the effect of soil degradation on long-term food security in China. Glob. Environ. Change 2009, 19, 464–481. [Google Scholar] [CrossRef]
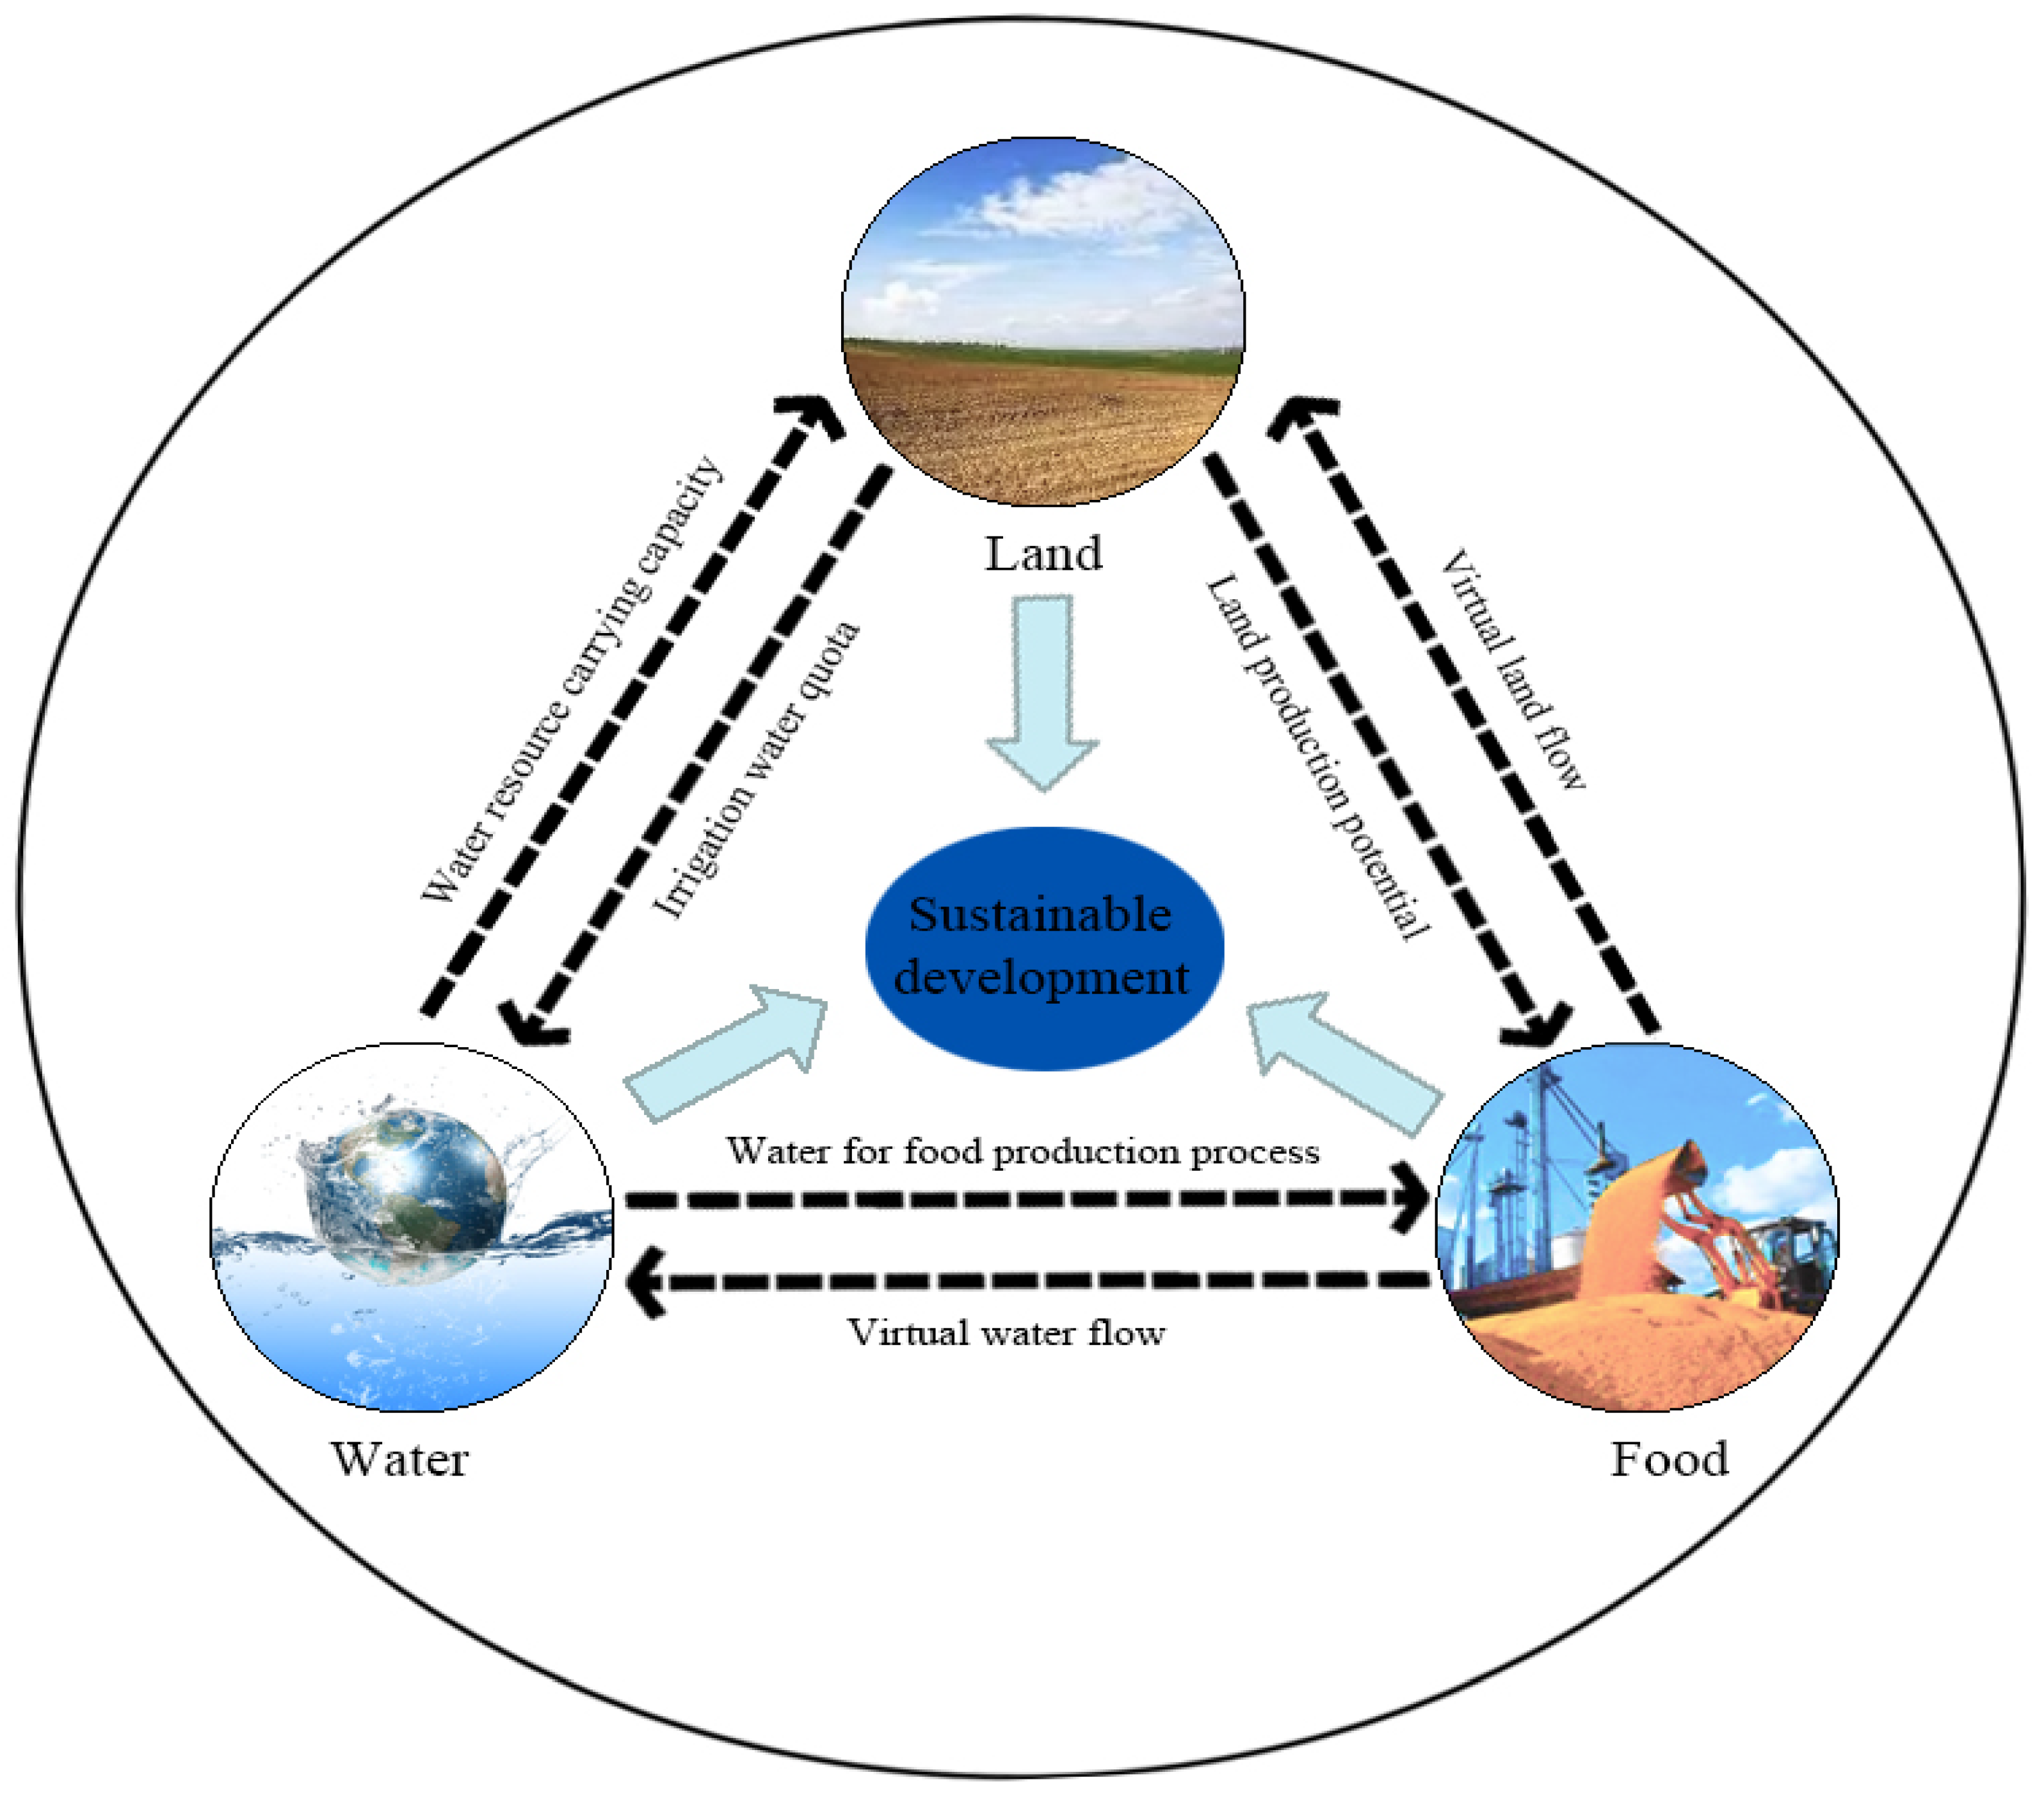
Figure 1. Land–water–food nexus.
Agriculture 15 00291 g001
Figure 2. Research design.
Agriculture 15 00291 g002
Figure 3. Comprehensive development index of land system (a), water system (b), food system (c), and LWF nexus (d) in 31 provinces (municipal cities, autonomous regions) of China in 2005, 2010, 2015, and 2020. Note: Darker colors and larger sizes represent larger values.
Agriculture 15 00291 g003
Figure 4. Time series evolution of comprehensive development index of China’s LWF nexus.
Agriculture 15 00291 g004
Figure 5. Changes in coupling coordinated degree in 31 provinces (municipal cities, autonomous regions) of China from 2005 to 2020.
Agriculture 15 00291 g005
Figure 6. Spatial autocorrelation of coupling coordinated degree of LWF nexus in 2005 (a), 2010 (b), 2015 (c), and 2020 (d).
Agriculture 15 00291 g006
Figure 7. Prediction of coupling coordination degree of LWF nexus in China.
Agriculture 15 00291 g007
Table 1. Comprehensive evaluation system of LWF nexus.
SystemIndicatorsData Source and CalculationUnitAttributeNo.Combined Weight
LandAverage cultivated land output valueGDP of planting industry/cultivated areayuan/hm2+x10.177
Total power of agricultural machinery per unit cultivated areaTotal power of agricultural machinery/cultivated areakw/hm2+x20.111
Multiple cropping indexTotal crop sown area/cultivated area-+x30.081
Per capita cultivated areaCultivated land area/total populationhm2/person+x40.191
Agricultural land conversion rateAgricultural land area/total land area%+x50.040
Soil erosion control rateSoil erosion control area/soil erosion area%+x60.208
Intensity of pesticide use on cultivated landPesticide application/cultivated areat/hm2x70.116
Intensity of fertilizer use on cultivated landFertilizer application/cultivated areat/hm2x80.076
WaterIrrigation water use coefficientWater used by crops/water withdrawal from headwater-+x90.054
Agricultural water output valueGDP of primary production/agriculture water consumptionyuan/m3+x100.140
Water use efficiencyGross primary productivity/evaportranspirationKg/m3+x110.064
Water-saving irrigation rateWater saving irrigation area/effective irrigation area%+x120.127
Water production modulusTotal water resources/aream3/hm2+x130.204
Agricultural irrigation water ratioAgricultural irrigation water consumption/agricultural water consumption%x140.068
Groundwater extraction rateGroundwater extraction/groundwater resources%x150.147
Water resource utilization ratioWater resource utilization/total water resources%x160.195
FoodPer capita food productionTotal food production/total populationkg/person+x170.219
Food yield per hectareTotal food production/total food crop sown areakg/hm2+x180.069
Per capita disposable income of rural householdsStatistical
data
-+x190.281
Fluctuation coefficient of total food productionFluctuation degree of total food production relative to long-term trends after excluding trend values-x200.143
Consumer Price Index of food for rural areasStatistical
data
-x210.013
Food Resilience IndexProportion of unaffected crop area to sown crop area-+x220.032
Carbon emissions from food production[35]tx230.121
Emission of non-point source pollution from food production[36]tx240.122
Note: + represents positive effect, − represents negative effect.
Table 2. Criteria for coupling coordination stage and type.
Coupling Coordination StageCoupling Coordination DegreeCoupling Coordination Type
Dysfunctional decline stage[0–0.1]Extreme disorder decline type
(0.1,0.2]Severe disorder decline type
(0.2,0.3]Moderate disorder decline type
(0.3,0.4]Mild disorder decline type
Transitional reconciliation stage(0.4,0.5]Nearly dysfunctional decline type
(0.5,0.6]Barely coupled coordination type
Coordinated development stage(0.6,0.7]Preliminary coupled coordination type
(0.7,0.8]Intermediate coupled coordination type
(0.8,0.9]Good coupled coordination type
(0.9,1.0]High-quality coordination type
Table 3. Variables of influencing factors.
VariableDescriptionSpecific Meaning
URBUrbanizationProportion of urban population to total population
ECOEconomic DevelopmentGDP per capita
ENVEcological EnvironmentForest cover rate
SCIScientific and Technological ProgressNumber of patent authorizations
INDIndustrial StructureDegree of agricultural industry agglomeration
Table 4. Coupling degree and coupling coordinated degree of LWF nexus in China.
YearCoupling DegreeComprehensive Development IndexCoupling Coordinated DegreeCoupling Coordination StageCoupling Coordination Type
20050.97800.38670.6146coordinated development stagepreliminary coupled coordination type
20100.97470.40660.6290coordinated development stagepreliminary coupled coordination type
20150.97230.44640.6582coordinated development stagepreliminary coupled coordination type
20200.96960.48990.6886coordinated development stagepreliminary coupled coordination type
Table 5. Regression results of different spatial Tobit models.
VariablesSDMSARSEM
LnURB−0.038 ***
(−7.10)
−0.023 ***
(−4.49)
−0.019 ***
(−2.91)
LnECO0.015 ***
(4.32)
0.011 ***
(4.73)
0.013 ***
(3.85)
LnENV0.016 ***
(3.09)
0.008 ***
(2.88)
0.015 ***
2.76
LnSCI0.012 **
(2.11)
0.012 **
(2.24)
0.012 **
(2.09)
LnIND0.003
(1.21)
0.004
(2.04)
0.001
(0.70)
N496496496
Adj. R20.2400.2070.138
Log-likelihood1761.0341803.9231841.016
LM Lag 213.178 ***
LM Lag(Roubust) 84.577 ***
LM Error 142.508 ***
LM Error(Roubust) 13.907 ***
Wald test 31.85 ***32.44 ***
LR test 31.51 ***32.03 ***
Note: ***, **, * represent significance levels at 1%, 5% and 10%, respectively.
Table 6. Effect decomposition results of SDM.
VariablesDirect EffectIndirect EffectTotal Effect
LnURB−0.032 ***
(−5.80)
−0.115 ***
(−3.25)
−0.147 ***
(−4.40)
LnECO0.015 ***
(4.41)
−0.013
(−0.90)
0.002
(0.11)
LnENV0.015 ***
(2.96)
0.038
(1.04)
0.053 *
(1.41)
LnSCI0.010
(1.18)
0.024 ***
(1.24)
0.034 ***
(3.60)
LnIND0.001
(0.8)
−0.006
(−0.4)
−0.005
(−0.4)
Note: ***, **, * represent significance levels at 1%, 5% and 10%, respectively.
Disclaimer/Publisher’s Note: The statements, opinions and data contained in all publications are solely those of the individual author(s) and contributor(s) and not of MDPI and/or the editor(s). MDPI and/or the editor(s) disclaim responsibility for any injury to people or property resulting from any ideas, methods, instructions or products referred to in the content.