Article

Analysis of Volatile Profile of Polish Gouda-Type Cheese and Its Analogue

1
Faculty of Physics, Warsaw University of Technology, ul. Koszykowa 75, 00-662 Warszawa, Poland
2
Department of Commodity Science and Food Analysis, Faculty of Food Science, University of Warmia and Mazury in Olsztyn, Heweliusza 6, 10-719 Olsztyn, Poland
3
Institute of Forest Sciences, Faculty of Civil Engineering and Environmental Sciences, Białystok University of Technology, Ul. Wiejska 45E, 15-351 Białystok, Poland
4
Department of Forest Sciences, University of Łódź Branch in Tomaszów Mazowiecki, University of Łódź, ul. Konstytucji 3 Maja 65/67, 97-200 Tomaszów Mazowiecki, Poland
5
Department of Entomology, Phytopathology and Molecular Diagnostics, Faculty of Agriculture and Forestry, University of Warmia and Mazury in Olsztyn, Pl. Łódzki 5, 10-727 Olsztyn, Poland
6
Zakład Mleczarski w Lidzbarku Warmińskim, ul. Topolowa 1, 11-100 Lidzbark Warmiński, Poland
7
Forest Protection Department, Forest Research Institute, ul. Braci Leśnej 3, 05-090 Sękocin Stary, Poland
*
Author to whom correspondence should be addressed.
Agriculture 2025, 15(3), 336; https://doi.org/10.3390/agriculture15030336
Submission received: 31 December 2024 / Revised: 29 January 2025 / Accepted: 31 January 2025 / Published: 3 February 2025
(This article belongs to the Section Agricultural Product Quality and Safety)

Abstract

:
Gouda-type cheese originated in the Netherlands, but is now produced all over the world. Analogue cheeses are cheese-like products with a lower price level that are based on non-dairy fats and proteins. The market demand for analogue cheese is currently also growing due to customers’ preference for low-fat foods. In this report, samples of Gouda-type cheese and its analogues produced by a dairy cooperative (Warmian-Masurian Voivodeship, Poland) were used as the subject of analysis; their volatile profiles were analyzed by gas chromatography coupled with mass spectrometry (GC-MS). In addition, measurements were carried out using a low-cost electronic nose based on MOX sensors. The results showed a richer chemical composition of the cheese volatiles compared to the analogue product. The measurements with the electronic nose made it possible to differentiate between the sample categories but also revealed similarities between them. The research demonstrated that both methods could be used for the assessment of the volatile profiles of the products.

1. Introduction

Cheeses are a component of many people’s diets. The large popularity of these products is due to their diversity and high nutritional value [1]. Cheese can be classified based on various parameters, including the type and quality of milk (e.g., cow, sheep, goat), production method, ripening technique, moisture level, fat content, and texture or hardness [2]. This multifaceted classification provides insight into the diverse sensory, nutritional, and functional properties of cheese. Ripened cheeses, in particular, tend to exhibit higher levels of calcium and milk fat, and they are recognized for their protein of high nutritional value. Cow’s milk remains the most frequently used raw material in cheese production, and its composition is a key factor shaping the quality and overall character of the final product.
Gouda cheese belongs to the group of hard, maturing cheeses of the Dutch type [3]. This cheese was originally made in the Netherlands, but similar products are now produced worldwide. Cow’s milk with a standardized fat content is used in its production. It is characterized by a hard and flexible body with small, oval “eyes”. This cheese has a slightly nutty, spicy flavor and aroma and is covered with a smooth, hard rind. The production process of this cheese includes stages such as milk pasteurization (72 °C for 15 s), fermentation (the addition of concentrated starter cultures: Lc. lactis subsp. lactis, Lc. lactis subsp. lactis biovar. diacetylactis, Leuconostoc spp.), milk coagulation, and clot cutting and processing [3]. A key step in the manufacture of Gouda-type cheese is the partial removal of whey followed by rinsing of the curd (often referred to as “grain”) with hot water (approximately 60 °C) [4]. This procedure reduces the concentration of lactose and acid in the cheese mass, which in turn helps develop the characteristic flavor and texture. Subsequently, the curd is molded, pressed, and then placed into a brine solution for salt absorption. After brining, it is packed and undergoes a ripening process, typically lasting at least three weeks at temperatures between 10 and 17 °C, depending on the desired degree of maturity. During the ripening process, numerous biochemical reactions occur, leading to the development of Gouda’s characteristic texture, flavor, and aroma. Fully matured Gouda is highly prized for its pronounced taste and distinctive aroma, typically achieved after 10–12 weeks of aging. Spicier and more intensely flavored varieties, such as Old Amsterdam, may mature for much longer, often up to 18 months [3]. Alternative maturation conditions may also be used (including the addition of enzymes to aid ripening), provided that the cheese has similar physical, biochemical, and sensory characteristics to the cheese produced by the maturation procedure described above. In order to meet commercial and/or technical requirements, Gouda cheese intended for further processing and Gouda cheese in small blocks (<2.5 kg) need not have the same degree of maturity [1,3].
The annual per capita cheese consumption in Poland is approximately 11.5 kg, while in western Europe, it reaches around 19 kg [5]. Although this level in Poland remains below the average in several western European countries, it has still shown a growing trend over the years.
In the last months of 2024, global butter prices reached record highs, primarily due to strong international demand and constrained supplies, particularly in western Europe [6]. Cheese prices exhibited a similar upward trend, driven by robust import demand for spot supplies and limited market availability. Notably, Gouda cheese recorded a significant price increase, with average costs reaching approximately 5.20 EUR/kg in many European markets [6,7]. According to the National Agricultural Support Centre, this surge in the price index was largely influenced by higher milk powder and butter prices in the international market, a situation closely linked to declining milk production in western Europe [6,7].
The market situation does not change the fact that cheese remains Poland’s most important dairy export, reflecting the high quality and taste of Polish cheeses [1,3]. Currently, the production of cheese and cottage cheese is a crucial branch of milk processing [3]. According to the Bureau of Analyses and Strategies of the National Agricultural Support Centre, Poland ranks as the sixth-largest cheese producer worldwide (after the USA, Germany, France, Italy, and the Netherlands) and fifth in the European Union. Rising global demand and open access to the EU market have increased Polish exports of cheese and cottage cheese, securing a dominant role in the country’s dairy export structure. Beyond the EU (mainly the Czech Republic, Germany, Italy, Slovakia, and Hungary), Polish maturing cheeses also find buyers in Saudi Arabia, Iraq, Ukraine, Israel, Libya, and Egypt [3].
Sales of lactose-free and gluten-free cheeses continue to grow [1,3]. Concurrently, premiumization drives consumer demand for more sophisticated products, although price remains a key factor [3]. Convenience also matters as retailers seek high turnover and reliable supply. In response to these market needs, cheese-like products (cheese analogues) have been introduced [3]. These analogues can be categorized into traditional, filled, tofu-based, and partially or fully non-dairy types, all designed with specific nutritional and functional properties [8,9,10].
Cheese analogues generally contain modified fat and protein contents, and their production—whether ripened or processed—closely resembles processed cheese manufacturing. The protein and milk fat components are replaced by preparations such as caseinates, casein, or vegetable fats, which are thoroughly emulsified and heat-treated in melting cauldrons. In producing processed cheese analogues, carbohydrate ingredients (e.g., starch) may act as bulking or texturizing agents, while hydrocolloid-based thickeners and carefully selected emulsifying salts help attain the required texture and melting profile.
Modern techniques enable analogues to closely imitate the original cheese in taste, aroma, appearance, and shelf life [1,3,11], meeting consumer expectations. A Gouda cheese analogue, for instance, uses skimmed cow’s milk combined with selected vegetable fats to provide an acceptable taste and texture, serving as an alternative to traditional cheese [10].
Cheese analogues usually have an altered composition of fat and protein, and the manufacturing process, regardless of whether it is a ripened or processed cheese analogue, is similar to processed cheese—the mixture of preparations that replace the protein component and the milk fat must be thoroughly emulsified and heat-treated, which is most easily achieved in the melting vats used in processed cheese production. In producing processed cheese analogues, caseinates, rennet or acid casein, and whey protein preparations commonly replace the milk protein fraction. In certain formulations, carbohydrate ingredients (e.g., starch) are introduced, but only as bulking or texturizing agents. Consequently, hydrocolloid-based thickeners and carefully selected emulsifying salts are required to achieve the desired consistency and melting properties of the final product. Current technologies make it possible to produce an analogue that perfectly imitates the original—both in terms of taste, aroma, appearance, and shelf life [1,3,11]. This is also what the cheese manufacturer strives for in order to meet consumer expectations. Gouda analogue cheese is made from skimmed cow’s milk with the addition of selected vegetable fats, which ensure an acceptable taste and texture. It is an alternative to real cheese [10].
Nevertheless, the flavor profile of cheese analogues is still less complex than that of conventional cheese and requires advanced processing methods to achieve acceptable textural and sensory properties [12]. Despite their increasing prevalence, the regulatory framework for cheese analogues remains underdeveloped internationally, underlining the need for a clear distinction from natural cheese [11].
In summary, cheese analogues can be defined as products in which individual ingredients, including non-dairy fats and/or proteins, are formulated to create a cheese-like product that meets certain requirements. Market demand for these products is growing for a number of reasons, including easier production and lower cost compared to milk-based cheeses, as well as growing consumer interest in consuming foods that are lower in total fat, saturated fat, cholesterol, and calories.
The rapid growth in global production and consumption of cheese analogues underscores the need to clarify their sensory and chemical profiles in comparison to conventional cheeses. Between 2019 and 2022, analogue cheese sales rose by 51%, indicating a surging interest in plant-based alternatives [13]. In 2023, global retail sales of plant-based cheese reached 869 million USD, with Europe (530 million USD) and North America (297 million USD) holding the largest market shares [14]. However, despite this expansion and influence in the food industry, cheese analogues typically exhibit less flavor complexity than traditional cheeses [11], posing challenges to consumer acceptance and competitiveness.
The aromatic properties of foods are usually analyzed using sensory panels that rely on the human senses and require highly qualified experts. An obvious disadvantage of such an approach is the difficulty in obtaining objective measurements. On the other hand, chemical analysis techniques of gases are also used to detect and distinguish different odors. The golden standard in the application of gas chromatography methods is supplemented by a mass spectrometer (GC-MS), which allows the determination of the individual chemical components present in a sample and their relative concentrations. In practice, however, the use of GC-MS also requires highly qualified personnel for operation and is limited to applications under laboratory conditions. Another approach to distinguish samples by their odors is the use of an electronic nose (e-nose) [15]. Such a device does not identify the chemical compounds of the investigated gas mixture. The idea of an electronic nose consists of the application of a series of non-specific gas sensors, often with overlapping sensitivity to various gases, and the application of pattern recognition techniques to distinguish between samples. Numerous commercial electronic nose devices are currently available on the market. However, the construction of one’s own devices, which often belong to the low-cost category, is also an active field of research [16]. Numerous studies have been carried out on the volatile components present in the aroma of Gouda cheese. Sloot et al. [17] and van Leuven et al. [18] reported GC-MS analyses of volatile components contained in the aroma of Gouda cheese. Jo et al. [19] analyzed the sensory and chemical properties of Gouda cheese. Lee et al. [20] analyzed the aroma compounds of miniature Gouda cheese using the Heracles II Analyzer/GC E-Nose, which was a kind of gas chromatography research. Chen et al. [21] presented research on the characterization of the main volatile compounds of Gouda cheese and their contribution to its flavors according to the preferences of Chinese consumers. It is known that the overall flavor intensity of Gouda cheese increases with a longer ripening time. Shiota et al. [22] and Duensing et al. [23] presented research on the formation of key aroma compounds during ripening in Gouda-type cheese. The volatile profiles of other cheese varieties were also studied, and the chemical composition constituting their aroma was identified. However, reports providing an analysis of the composition of volatiles present in cheese analogues are very rare [11].
Aroma sensing by means of electronic nose technologies applied to advance dairy production has been reviewed by Yakubu et al. [24]. To the best of our knowledge, electronic noses have not yet been used to distinguish between cheese and its analogues. Reports on the applications of electronic nose technology to the particular case of Gouda-type cheese samples are not known to the authors. However, numerous research papers have been published on the application of electronic noses to other types of cheese. O’Riodran and Delahunty [25,26] have shown that differentiation between cheeses using electronic nose technology—i.e., a metal oxide semiconductor gas sensor—can be useful in the cheddar cheese industry. Trihaas et al. [27,28] used electronic nose technology to monitor the ripening process of Danish blue cheese. Benedetti et al. [29] used an electronic nose to measure the shelf life of Crescenza cheese. Cevoli et al. [30] used an electronic nose based on an array of six metal oxide semiconductor sensors and GC–MS analysis of volatile compounds to classify Pecorino cheeses according to their ripening time and manufacturing techniques. Sberveglieri et al. [31] and Abbatangelo [32] reported an experiment with a newly constructed nanowire sensor device and applied it to discriminate a degraded or an adulterated Parmigiano Reggiano cheese from a typical one. Štefániková et al. [33] applied an electronic nose for the determination of Slovak cheese authentication based on its aroma profile. Lee-Rangel et al. [34] reported the application of an electronic nose and gas chromatography to determine volatile organic compounds in fresh Mexican cheese.

2. Materials and Methods

2.1. Production Procedure of Gouda-Type Cheese and Its Analogue

Here, we would like to give a short description of the production procedure of cheese and its analogues with focus on differences between them, as the procedure explains the different volatile profiles found in the measurements.
The production of Dutch Gouda cheese and its analogue follow a very similar production process scheme with one significant difference. The same raw material is used to produce both products and at this stage, the same milk can be used for both types of products. During the production of Dutch Gouda cheese, the raw milk is standardized with cream; after that, it is pasteurized and sent to the cheese-making department. During the production of the cheese analogue, the milk is skimmed in a centrifuge to a milk fat level of around 0.05% and then standardized with vegetable oil (palm oil).
It can be noticed that the vegetable fat added during the production of the analogue exhibits weaker binds with proteins when compared to the original animal fat present in the case of the original cheese. This leads to the loss of some of the added fat content to whey. As a result, finished products containing fat of various origins (animal and vegetable) are obtained for the case of the cheese analogue, while in the original cheese, only animal fat is present. The further stages of production of Dutch-type cheese and its cheese analogue are the same.

2.2. Samples Used for Measurements

Three-month-old Gouda cheeses (N = 4) and Gouda cheese analogues (N = 4) from the same dairy cooperative (Warmian-Masurian Voivodeship, Poland) were used in this study. All samples were produced on the same date from cow’s milk and subsequently analyzed for their aroma profiles using an electronic nose (e-nose) and GC-MS (Figure 1).

2.3. GC-MS Measurement of Volatiles

Volatile organic compounds (VOCs) present in the studied samples of Gouda cheese and its analogue were investigated by headspace solid-phase microextraction and gas chromatography coupled with mass spectrometry (HS-SPME/GC-MS). Immediately prior to the chemical analysis, the Gouda-type cheeses and their analogues were taken from a refrigerator of 4 °C.

2.3.1. Sample Preparation

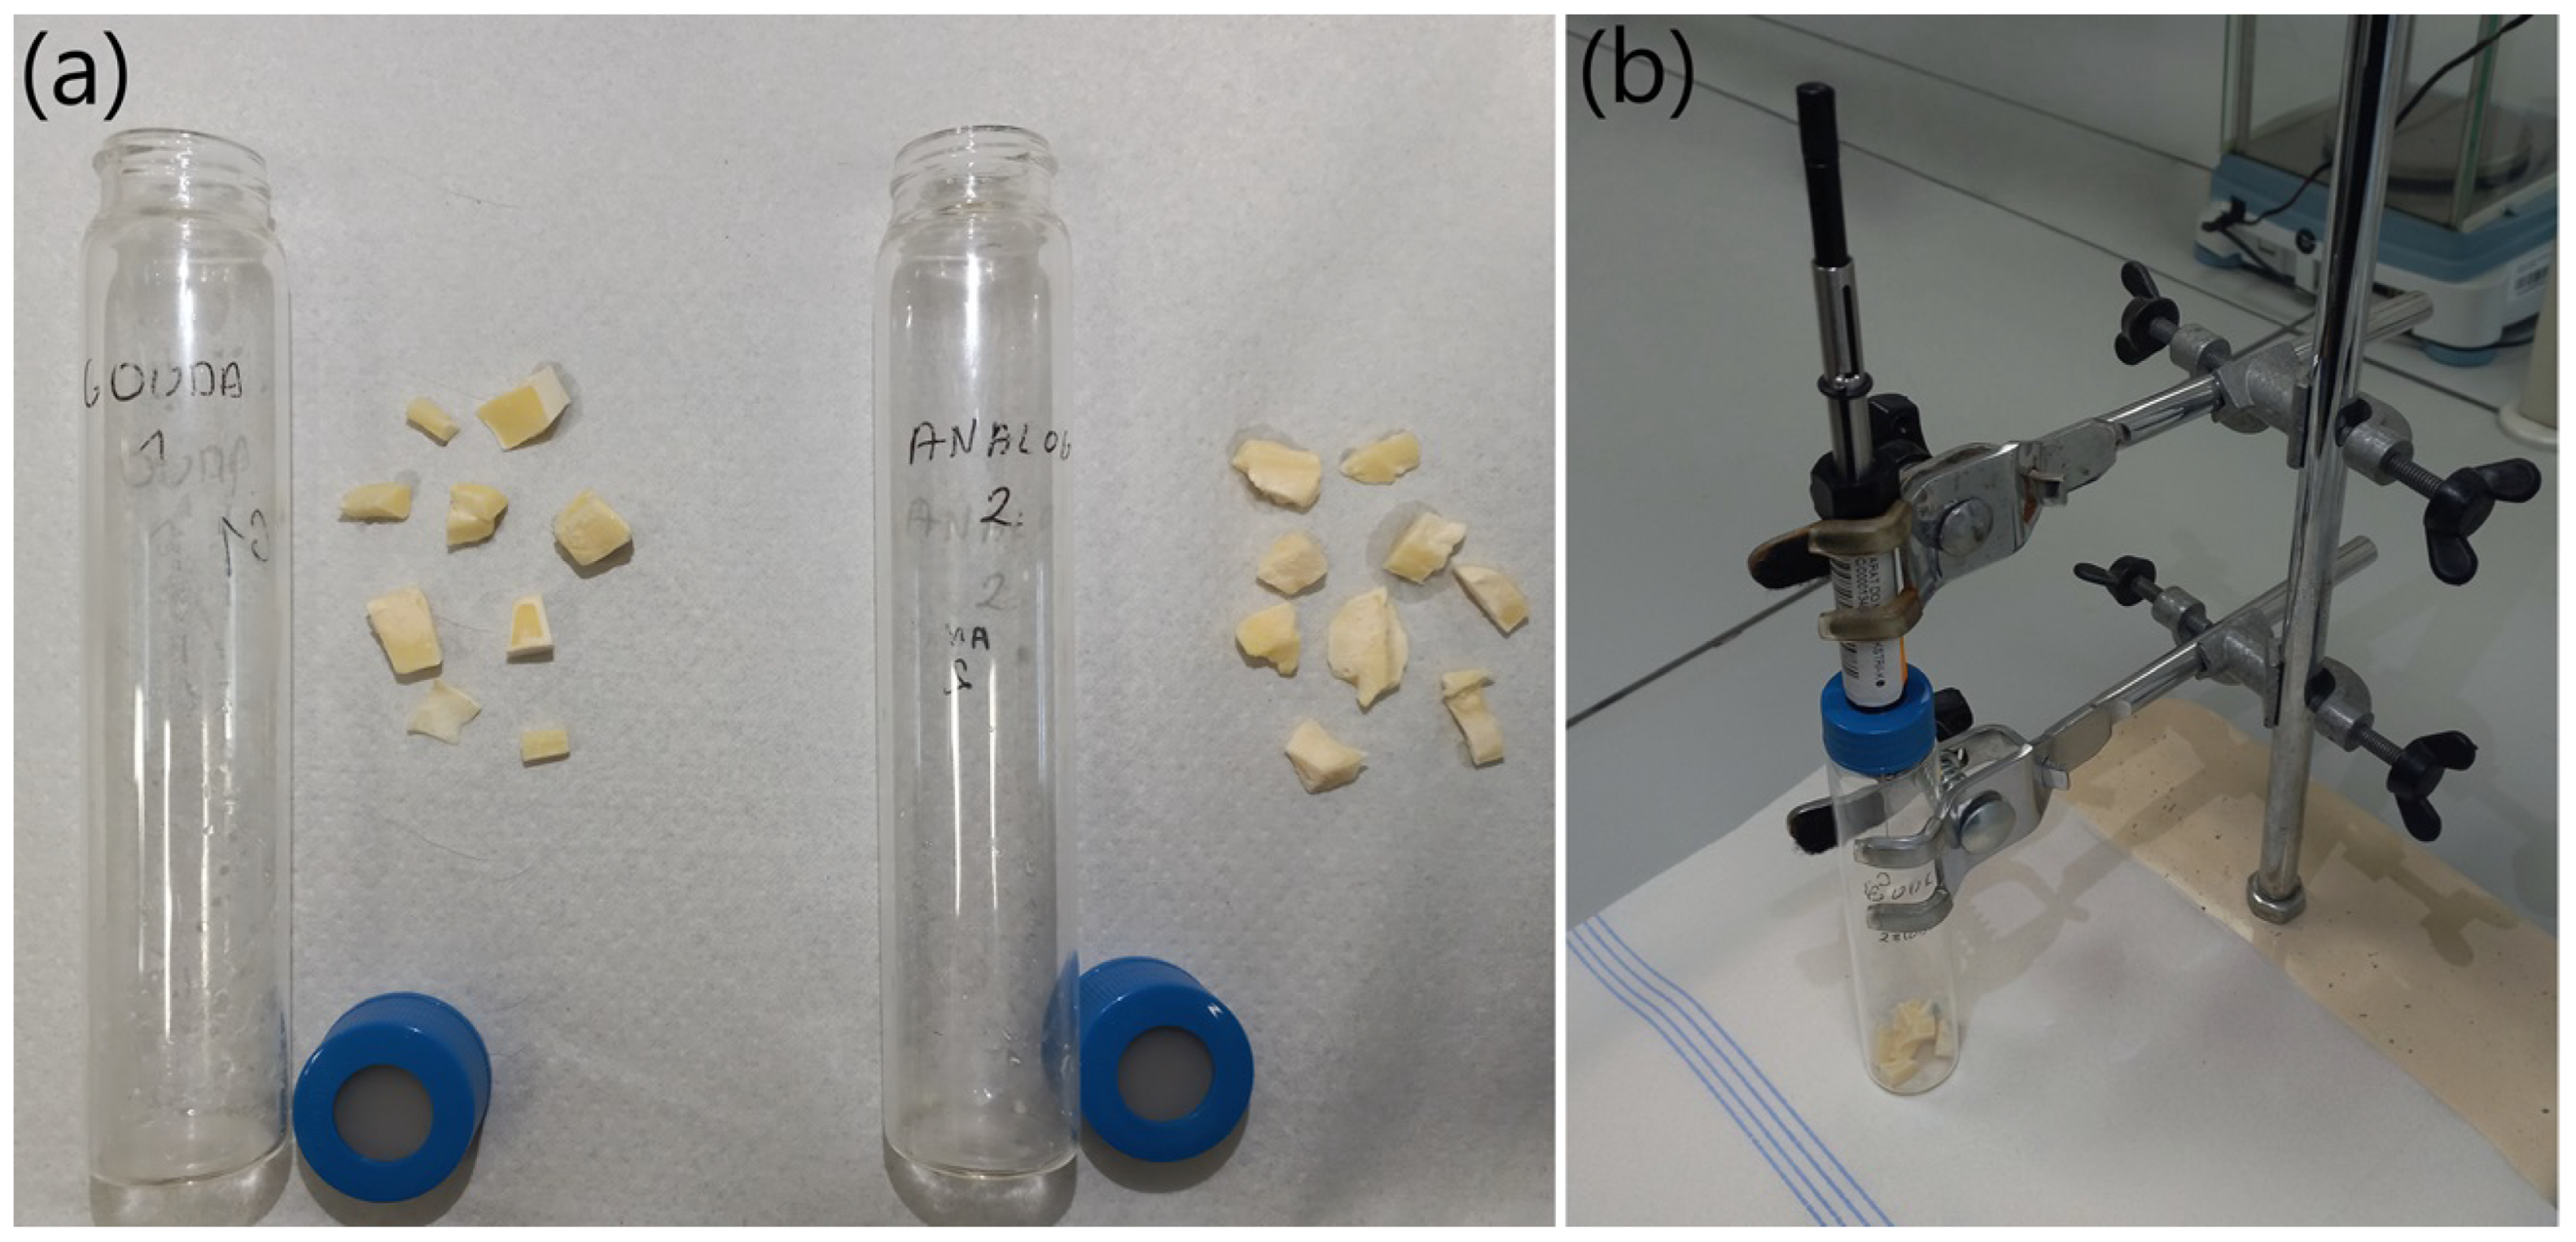
The samples of Gouda cheese and its analogue were cut into cubes with sides measuring approximately 0.5 cm (Figure 2). The sample (2 g) was placed into a crew-cap vial with a septum and heated for 60 min at 25 °C in an air-conditioned laboratory room.

2.3.2. Volatile Collection

The volatile compounds concentrated inside the vial were collected using an SPME fiber (Supelco, Bellefonte, PA, USA) with stationary-phase divinylbenzene/carboxen/polydimethylsiloxane (DVB/CAR/PDMS). The fiber was exposed for adsorption of the volatiles in the headspace for 30 min at 25 °C in an air-conditioned laboratory room (Figure 2).

2.3.3. GC-MS Measurements

After volatile adsorption onto the SPME fiber, the fiber was placed inside the injector of the GC-MS device for 10 min. An Agilent 7890A gas chromatograph coupled with an Agilent 5975C mass spectrometer (Agilent Technologies Inc., Santa Clara, CA, USA) was used. A splitless injection mode at 250 °C was applied. For the separation of the chemical compounds, a capillary column HP-5MS (30 m, 0.25 mm, 0.25 μm) was used. Helium was the carrier gas, with a flow rate of 1 mL/min. The column temperature program started at 40 °C and finished at 250 °C, at a rate of 5 °C/min. The ion source and quadrupole temperatures were set at 230 and 150 °C, respectively. The mass spectrometer was operated at an ionization energy of 70 eV. A detection range of m/z 29–600 in full-scan mode was used.

2.3.4. GC-MS Raw Data Analysis

The area under the chromatographic peaks was integrated, and the percentage content of the VOC in the total ion current (% TIC) was calculated. The observed chemical components were identified by analyzing the mass spectra and the retention indices. For the mass spectrometric analysis, the NIST (2020) and Wiley (2020) mass spectral libraries, as well as the atlases by Adams (2017) [35] and Tkachev (2008) [36], were used. The match factor of the experimental and literature mass spectrum was above 850 for every identified compound. To calculate the retention indices of the compounds, the retention times of C6–C40 n-alkanes were used.

2.4. Electronic Nose

2.4.1. Electronic Nose Device

In the present study, a low-cost electronic nose device based on metal-oxide (MOX) gas sensors was used [37,38]. Its main component is a set of non-specific gas sensors by Figaro Inc. (Osaka, Japan), TGS series [39]. MOX gas sensors operate by changing their electrical resistance when transitioning from clean air to the presence of a measured gas. The sensor resistance can be recorded [40], but it is important to note that the meaningful quantity is the ratio of the sensor resistance measured in the presence of the gas to that in clean air ( R / R 0 ). Another important component of the electronic nose is a sensor chamber [38], which allows changing the sensor conditions from clean air to the measured gas by opening a shutter and allowing the sensors to contact the measured aroma. In the device used, the sensor chamber was opened manually.

2.4.2. Sample Preparation

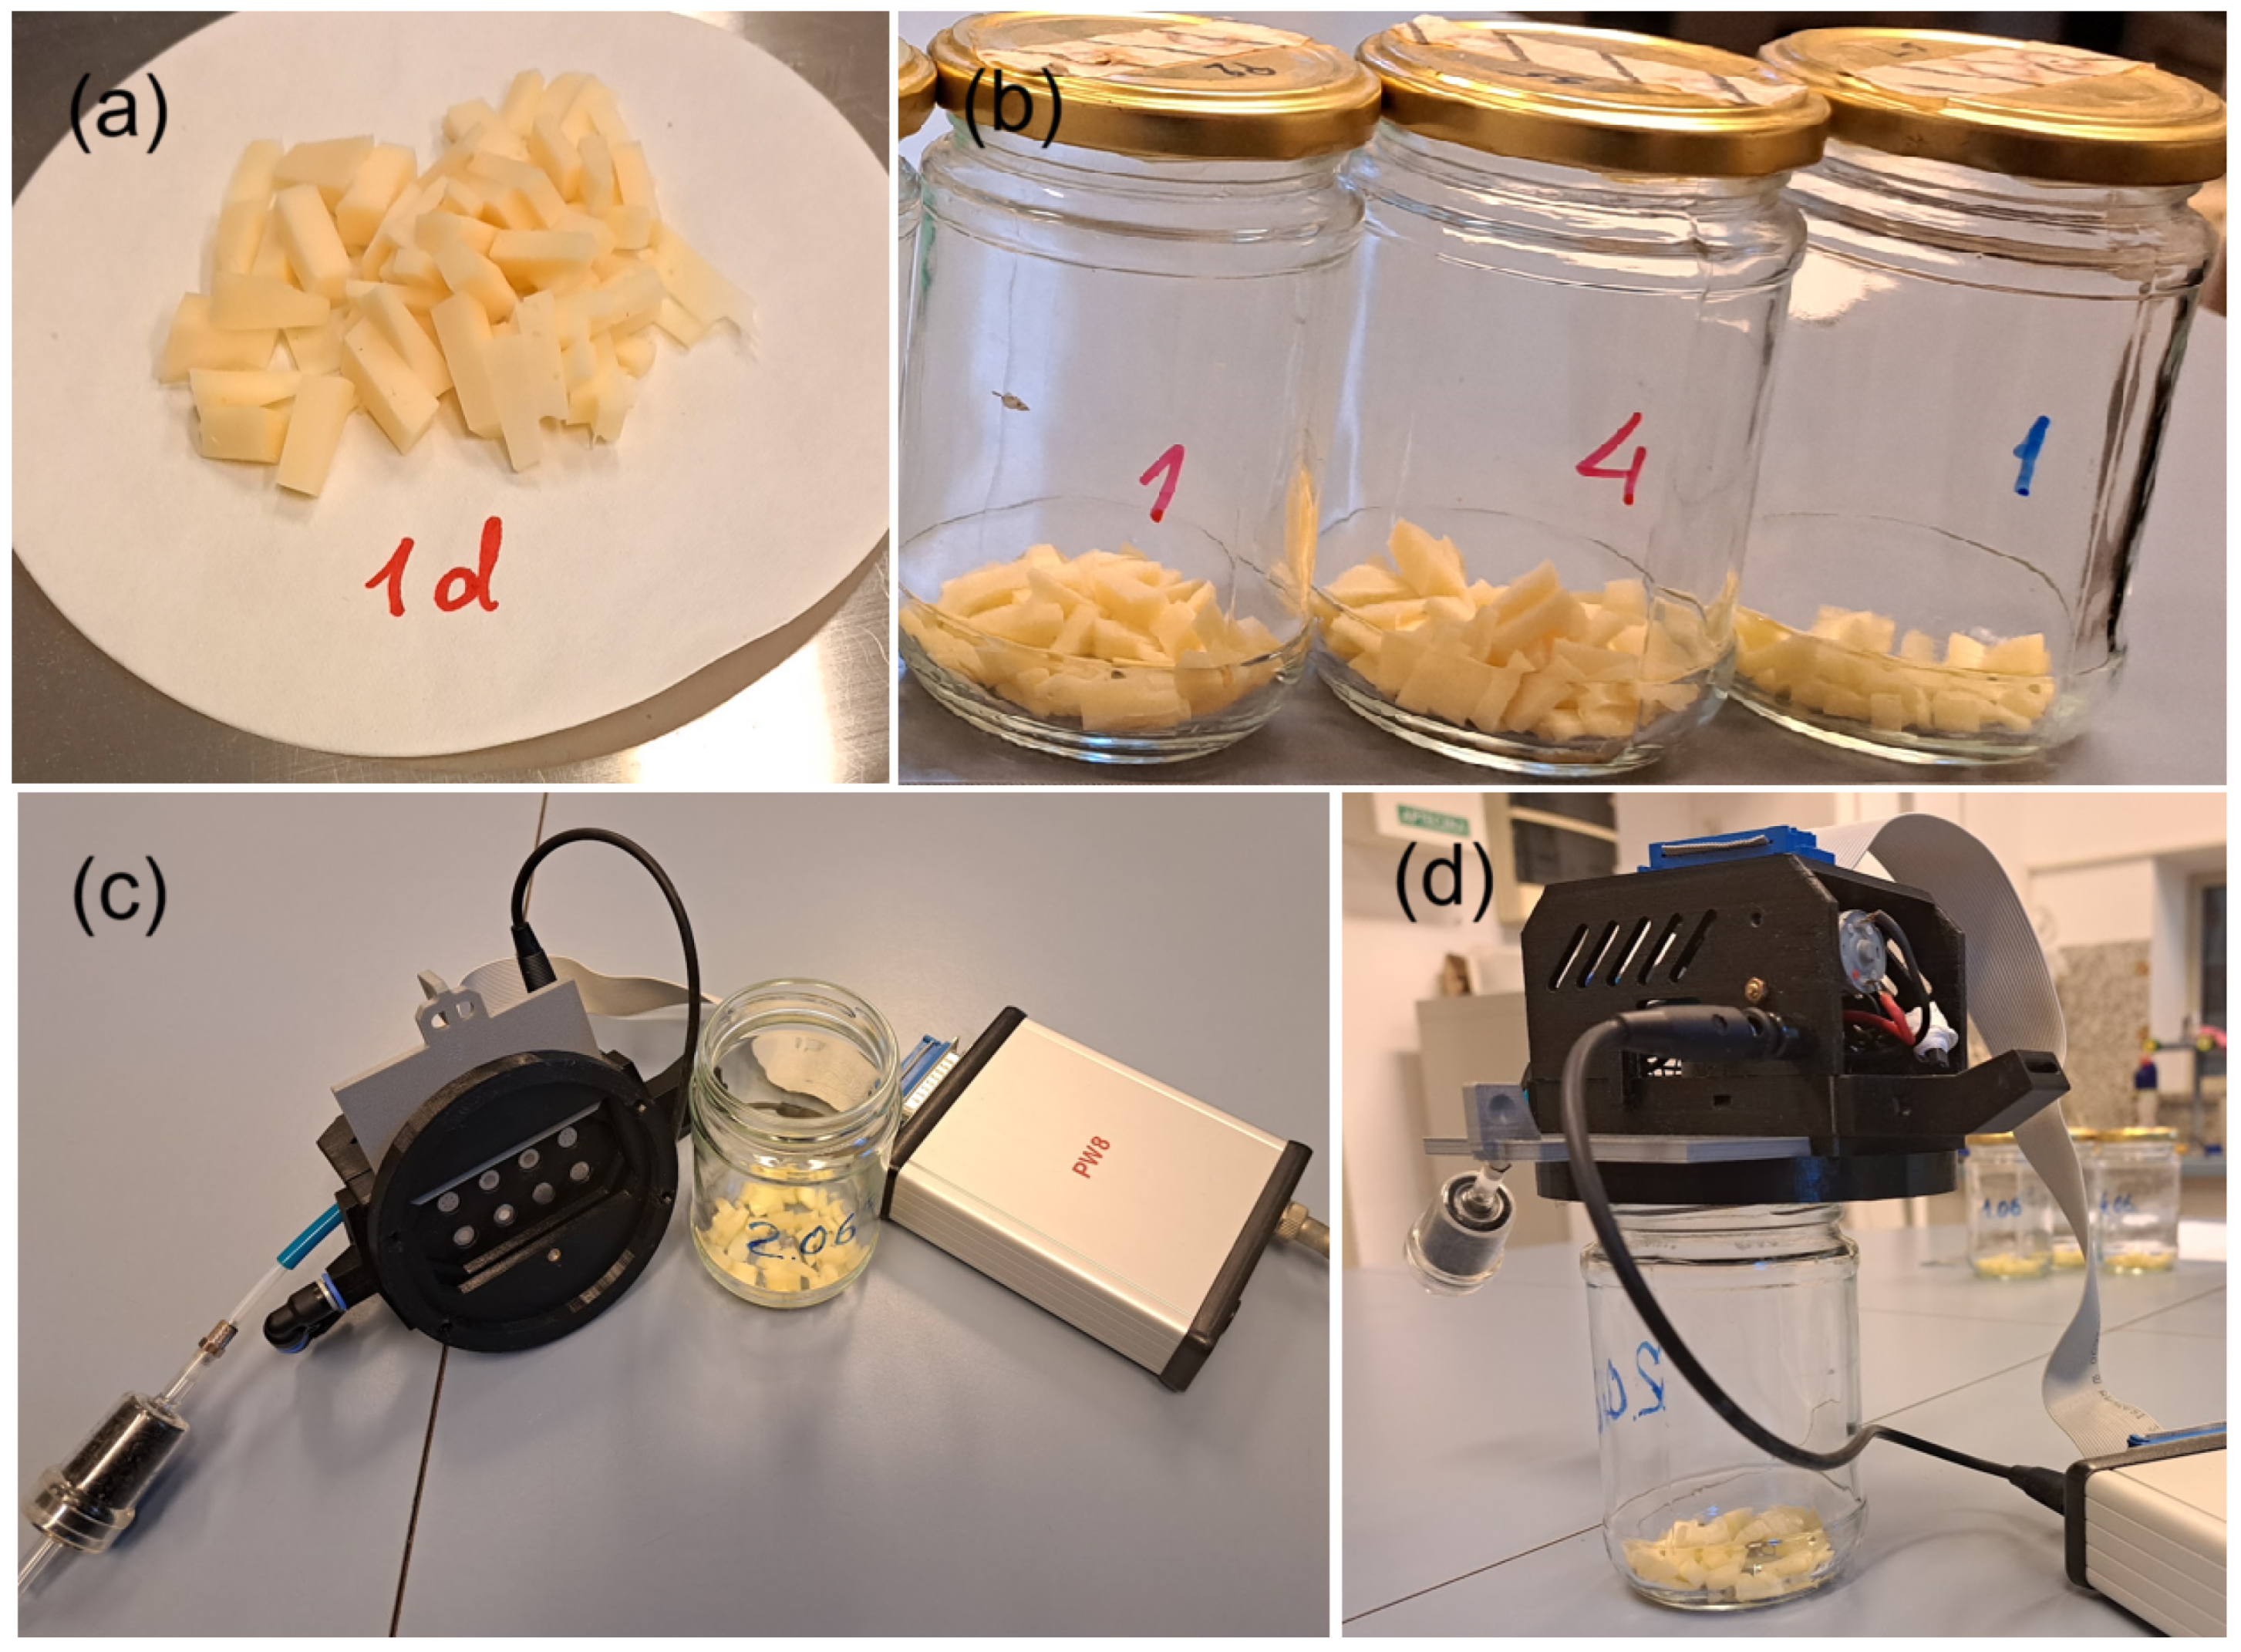
During the entire experiment, the cheese pieces (Figure 1) were stored in a refrigerator at 3 °C. On each day of the measurements with the electronic nose, a small slice of cheese was cut from each piece and further chopped into smaller pieces as presented in Figure 3. Approximately 8 g of cheese was then placed in a cleaned jar and left for at least 3 h before the measurement. This relatively long preparation time was chosen to allow the cheese to reach room temperature (21 °C), consistent with the storage conditions of the jars. It was also assumed that, during this time, the cheese aroma would be released and accumulate in the jar headspace.

2.4.3. Measurements by Electronic Nose

The samples prepared as described above were used for measurements with the electronic nose. Five series of measurements were performed, one series per day. In each series, a single sample of each piece of Gouda cheese or its analogue was measured. Thus, one series comprised eight measurement events. Measurements were carried out alternately: one cheese sample followed by one analogue sample. The order of samples was randomized in each series using an Excel random number generator.
The measurement procedure started by applying the electronic nose sensor chamber to an open jar containing a cheese sample (Figure 3c). Initially, the chamber was closed, and the sensors were immersed in clean air. The sensor’s resistance was measured for about 30 s, and the measured value ( R 0 ) was later used to calculate the sensor response. The stability of the sensor response was also checked to confirm that the sensor state had reached equilibrium after the previous cleaning procedure. After collecting the baseline response, the chamber was opened, allowing the sensors to come into contact with the cheese aroma. The sensor response was collected for 6 min 30 s, during which time it reached a steady state. The final 30 s of the measurement was averaged to reduce noise, and the averaged value was considered the sensor response in the presence of the investigated gas.
After the measurement, the sensor chamber was closed, and the sensors were cleaned by pumping air purified by a charcoal filter for 15 min. Sample preparation and measurements were performed under controlled conditions inside a laminar flow cabinet (Telstar, Bio II Advance, Sacramento, CA, USA) with the air supply turned on at an ambient temperature of 21 °C and a humidity of 40%.

2.5. Data Analysis

2.5.1. Visualization of Experimental Data

Box plots were applied to evaluate the variability in the collected data distribution.
To visualize patterns in the distribution of multidimensional data, a commonly used dimensionality reduction technique, Principal Components Analysis (PCA), was employed, and the data were observed in a two-dimensional space.

2.5.2. Electronic Nose Data Analysis

The sensor responses collected during the measurements were compared between two experimental treatment groups of Gouda cheese and analogue samples. For each sensor, a t-test was used to evaluate the significance of differences in mean responses to the odor of the investigated samples. The t-test was calculated assuming unequal variances in treatment groups.
Since the electronic nose uses non-specific gas sensors whose sensitivities overlap, the signals from different sensors can be correlated. The constructed electronic nose consists of six gas sensors, which makes it difficult to intuitively discern data patterns due to its multidimensional nature. Therefore, PCA was used on the collected data.
Finally, a machine learning classification model was trained to differentiate between the studied sample categories. For this purpose, a Support Vector Machine classifier—one of the primary methods in this domain—was used. To objectively estimate the classification performance, the 5-fold cross-validation method was applied. Accuracy was used as the performance metric, defined as the proportion of correctly classified observations.

2.5.3. Software Packages for Data Analysis

All data processing pipelines and analyses were performed using Python 3.12 with the scikit-learn package [41]. Statistical tests were conducted using the scipy package [42].

3. Results of Measurements

3.1. Gas Chromatography–Mass Spectrometry

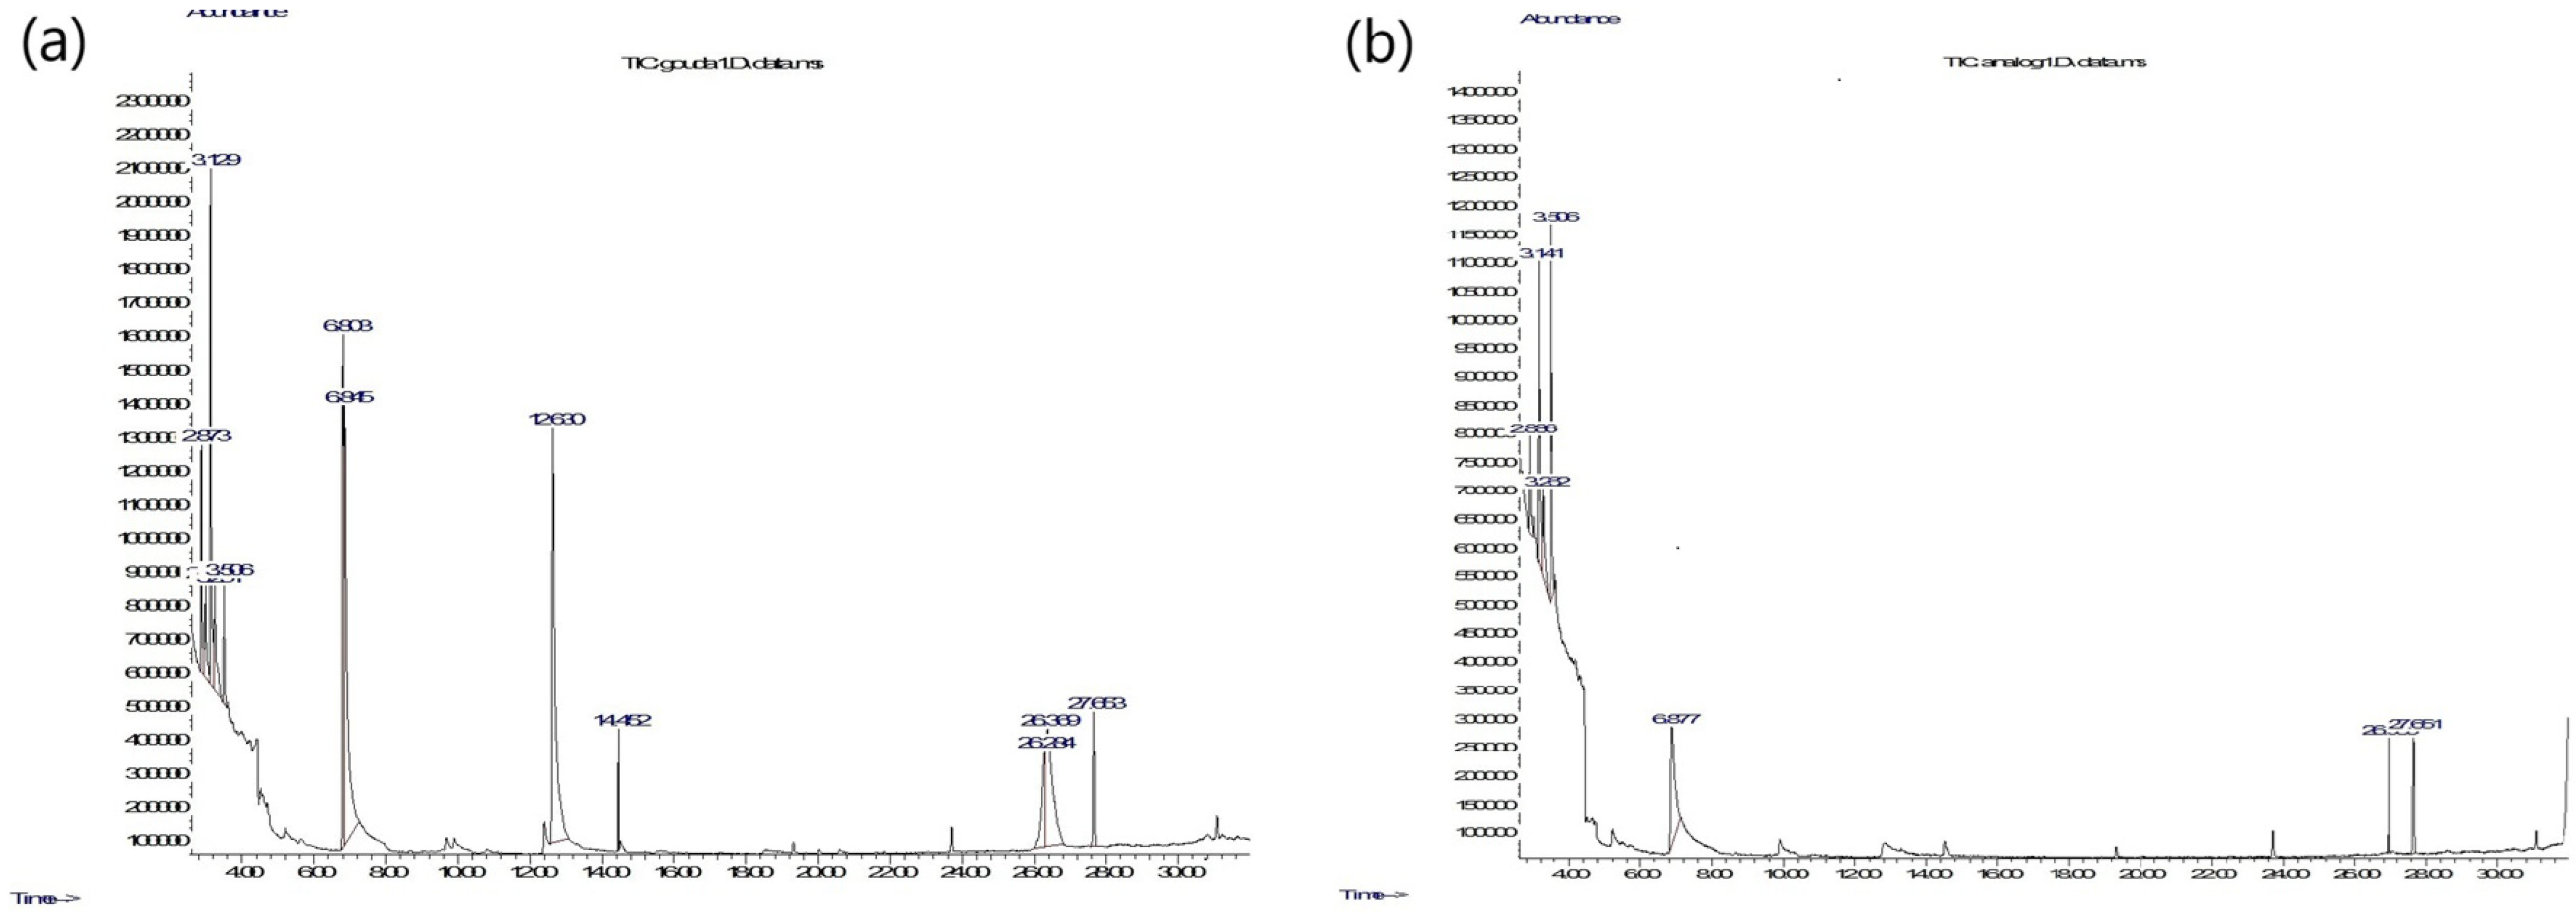
In Figure 4, examples of chromatograms recorded for the cheese samples used in the experiment are presented. As one can notice, the number of peaks appearing in the chromatograms of Gouda-type cheese samples is higher than in those of the analogues, indicating a richer chemical composition in these samples.
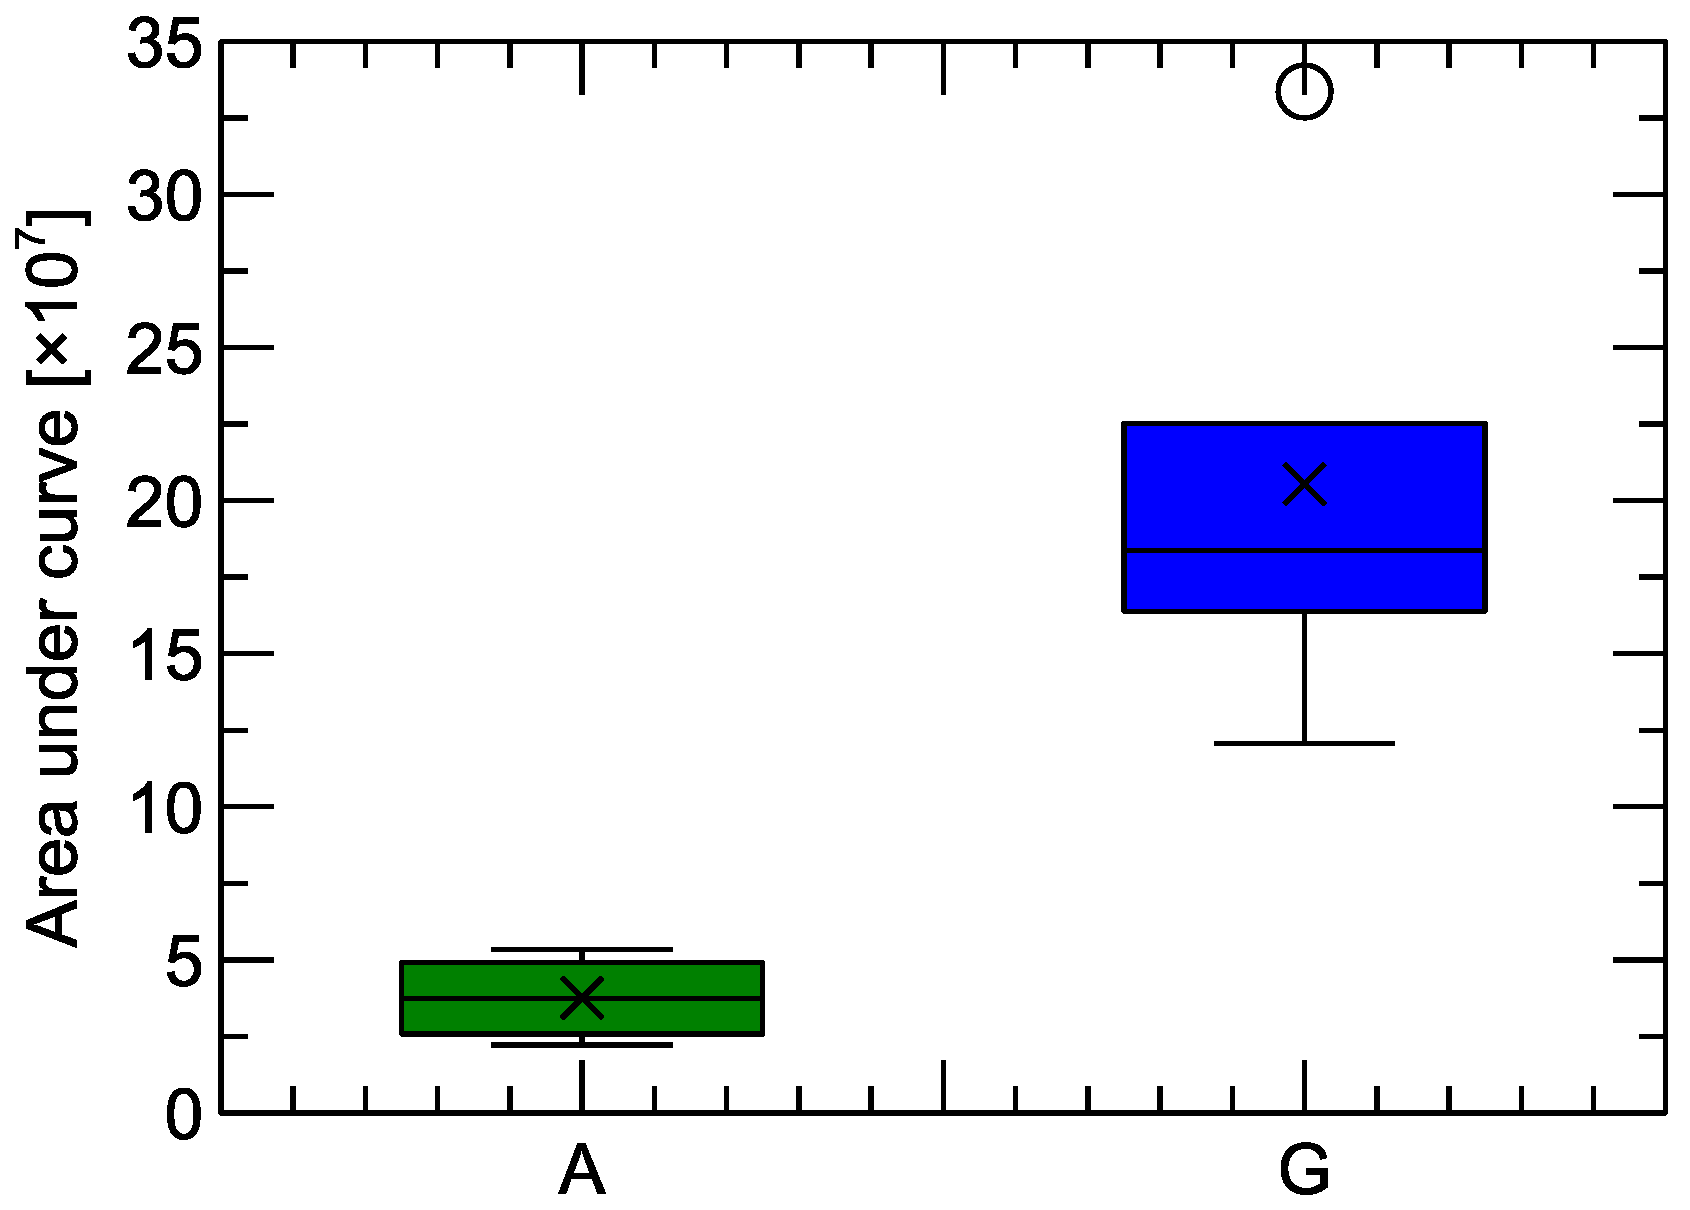
It is not straightforward to see in Figure 4 the total ion current (TIC) registered by the chromatograph, as this requires the calculation of the area under the curves. The TIC corresponds to the number of chemical molecules observed in the GC-MS experiment, namely, (i) captured by the fiber, (ii) transferred through the chromatographic column, and (iii) detected by mass spectrometry. In Figure 5, a comparison of the TIC values between the two studied categories of samples is shown. One can observe that the volatile components emitted by the Gouda-type cheese are not only richer in chemical composition (Figure 4) but also more abundant (Figure 5).
The mean TIC value from the Gouda-type cheese samples was 2.05 × 10 8 with a standard deviation of 7.85 × 10 7 . For the cheese analogue samples, the mean value was 3.76 × 10 7 with a standard deviation of 1.33 × 10 7 . (This quantity is expressed in arbitrary units without physical interpretation). Thus, it can be estimated that the number of molecules in Gouda-type cheese volatiles was approximately 5.5 times higher compared to the analogue samples.
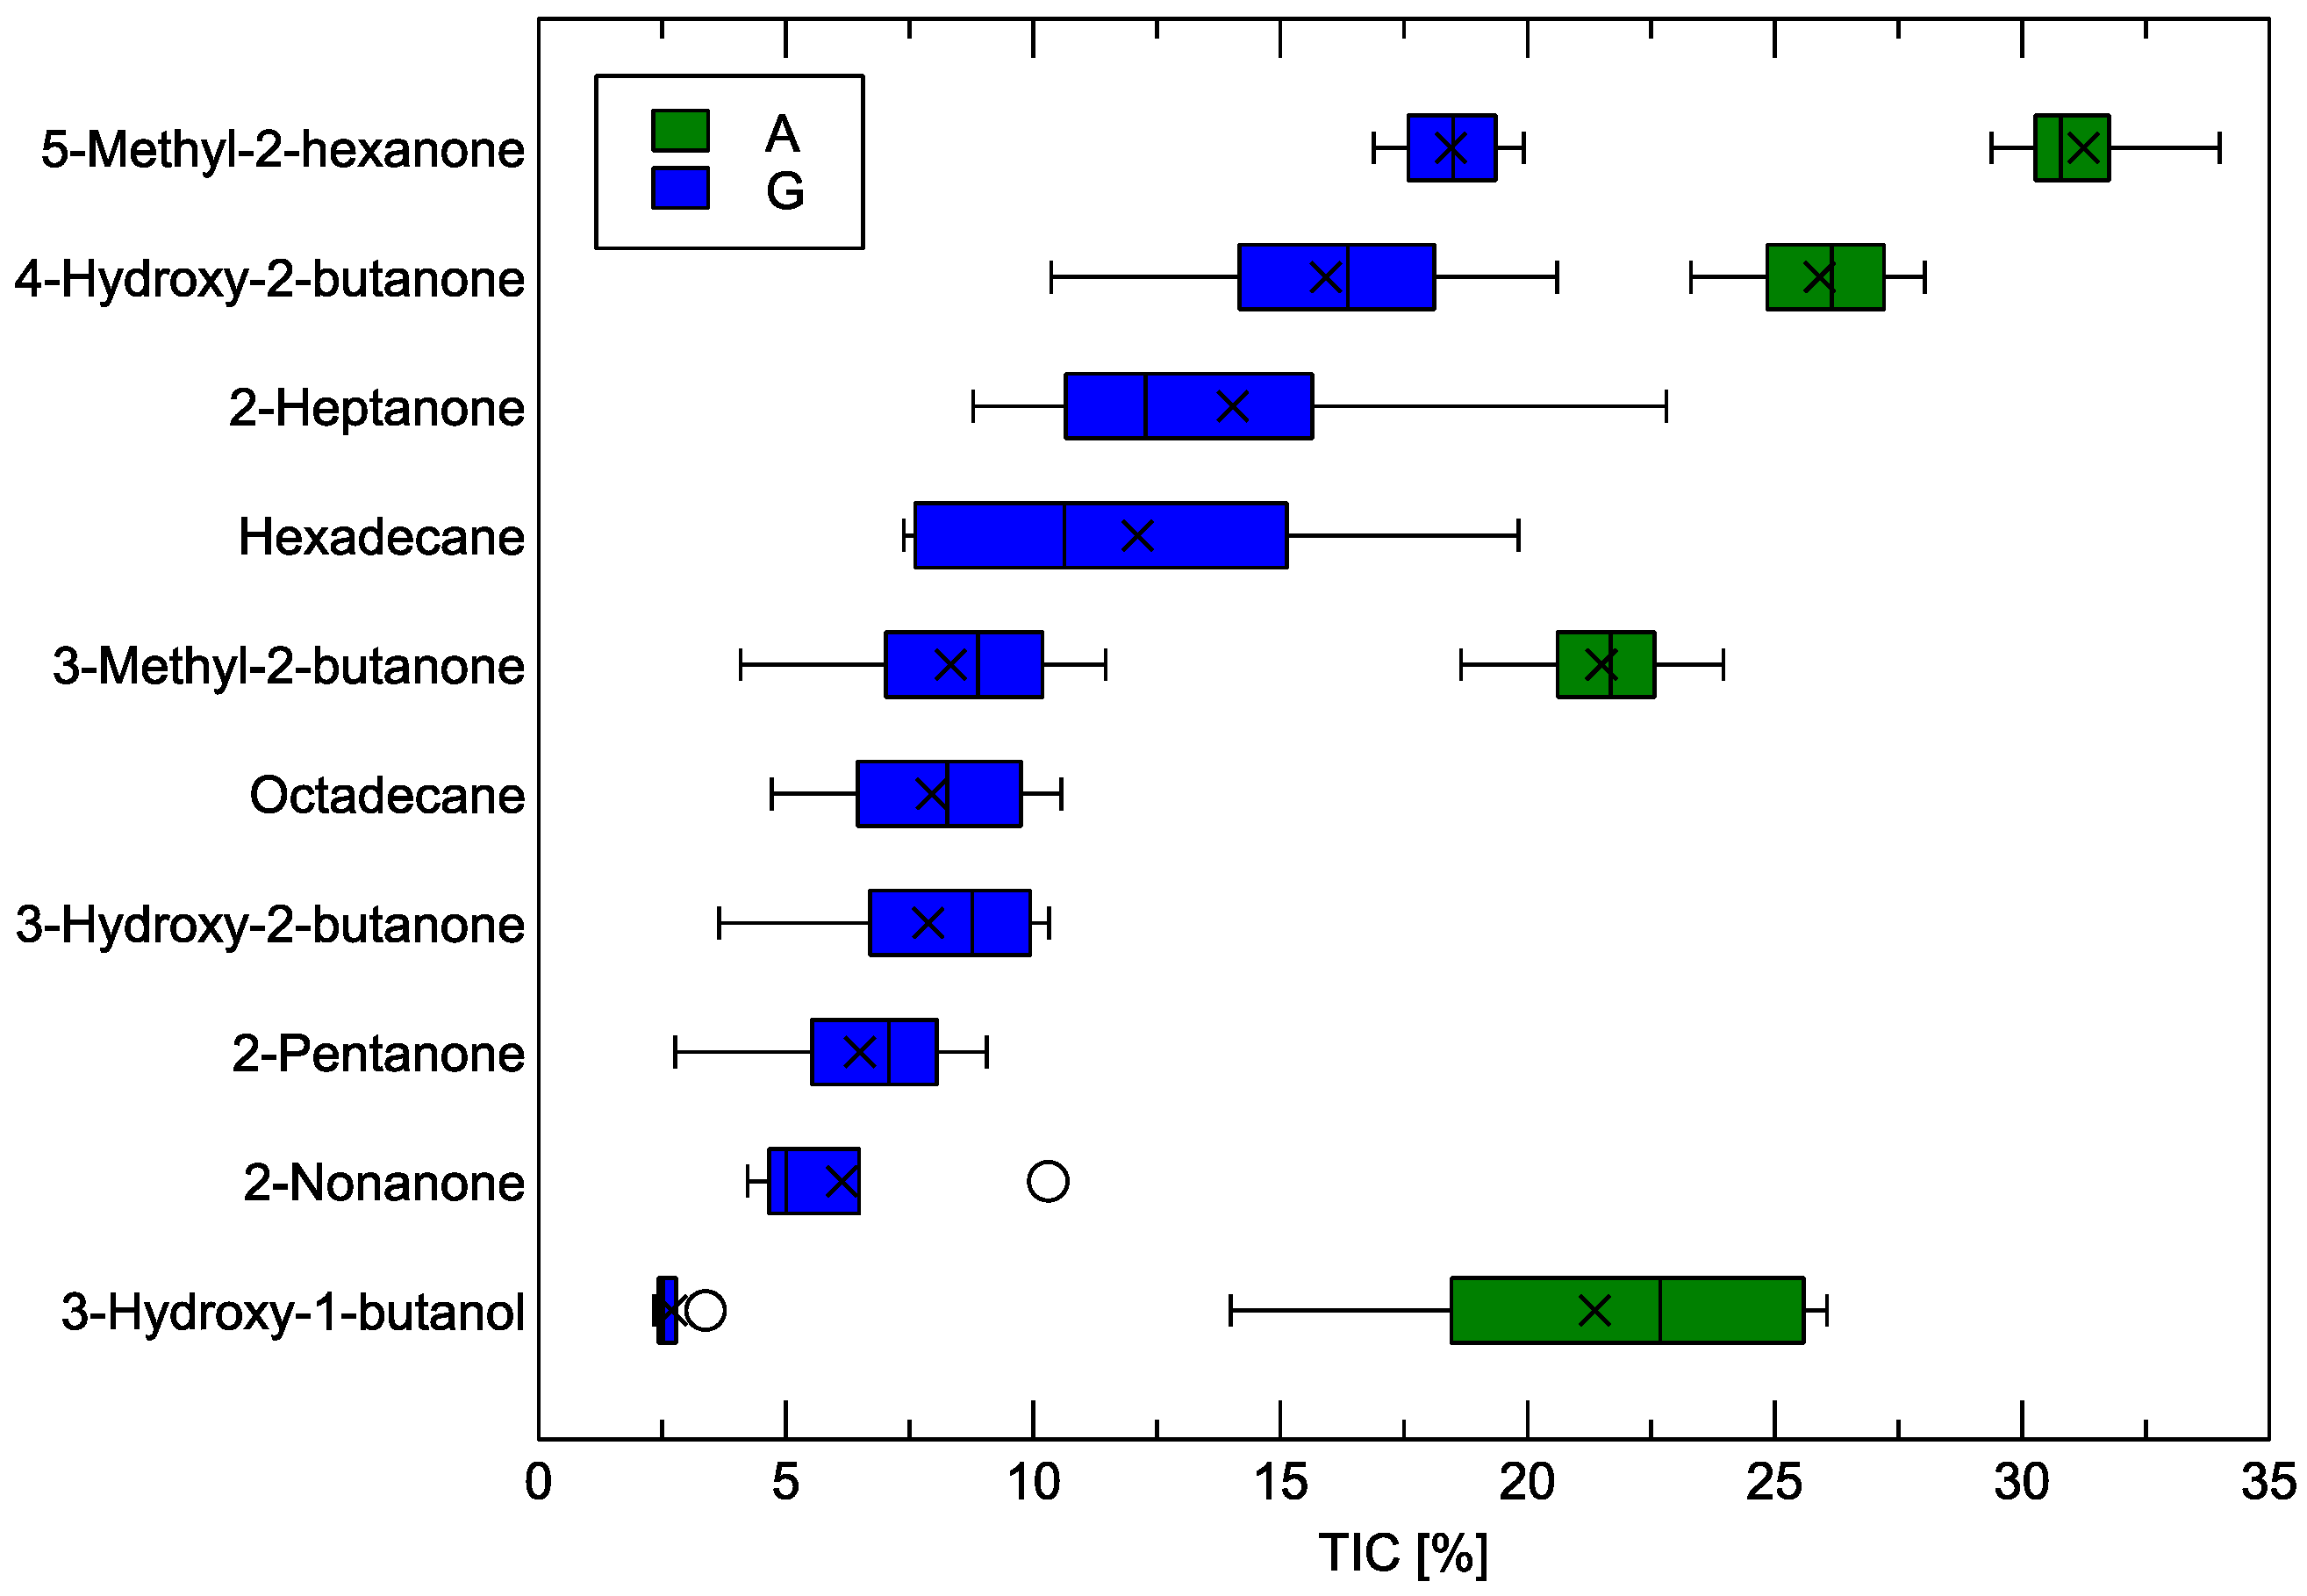
The main result of the GC-MS analysis is the identification of the chemical components present in the volatiles collected from the measured samples, along with their relative abundance. This relative abundance is the proportion of molecules of a given chemical component to the total number of molecules in the odor sample. Such results are presented in Figure 6.
As could already be noticed in Figure 4, the number of chemical components identified in the Gouda-type cheese samples was higher than in the analogue samples. 5-Methyl-2-hexanone was found to be the most abundant compound in both studied categories of samples, with its relative contribution reaching approximately 18.5% in Gouda-type cheese and 31.4% in the analogue. The second most abundant compound common to both types of cheese, 4-hydroxy-2-butanone, was measured at approximately 15.9% in Gouda-type cheese and 25.9% in the analogue. In addition, 3-methyl-2-butanone and 3-hydroxy-1-butanol were detected in both sample categories; notably, 3-hydroxy-1-butanol constituted about 2.7% in Gouda-type cheese and 21.4% in analogue cheese. These results emphasize that although the same primary volatile compounds may be present in both categories of samples, the proportions of these compounds can differ significantly. The detailed identification and relative abundance data for all chemical components in the examined samples are presented in Table 1.
The proportions of these volatile components in the two categories of samples, shown in Figure 6 and Table 1, are intentionally presented to emphasize their relative distribution and the role each compound plays in the overall aroma profile. This approach is further substantiated by the results depicted in Figure 5, which demonstrate that the total amount of volatile compounds detected in Gouda-type cheese was about 5.5 times higher than in the analogue. Therefore, rough estimates of the actual number of molecules for the compounds detected in both sample types can be derived. For instance, the ratio of 5-methyl-2-hexanone in Gouda-type cheese to the analogue is approximately 3.2, while 4-hydroxy-2-butanone reaches about 3.4, and for 3-methyl-2-butanone, it is around 2.1. Notably, 3-hydroxy-1-butanol presents a ratio of 0.7, indicating a relatively higher absolute abundance of this particular compound in the analogue. Consequently, for most of the main volatile compounds that appear in both cheese varieties, the total emission in Gouda-type cheese clearly surpasses that observed in the analogue.
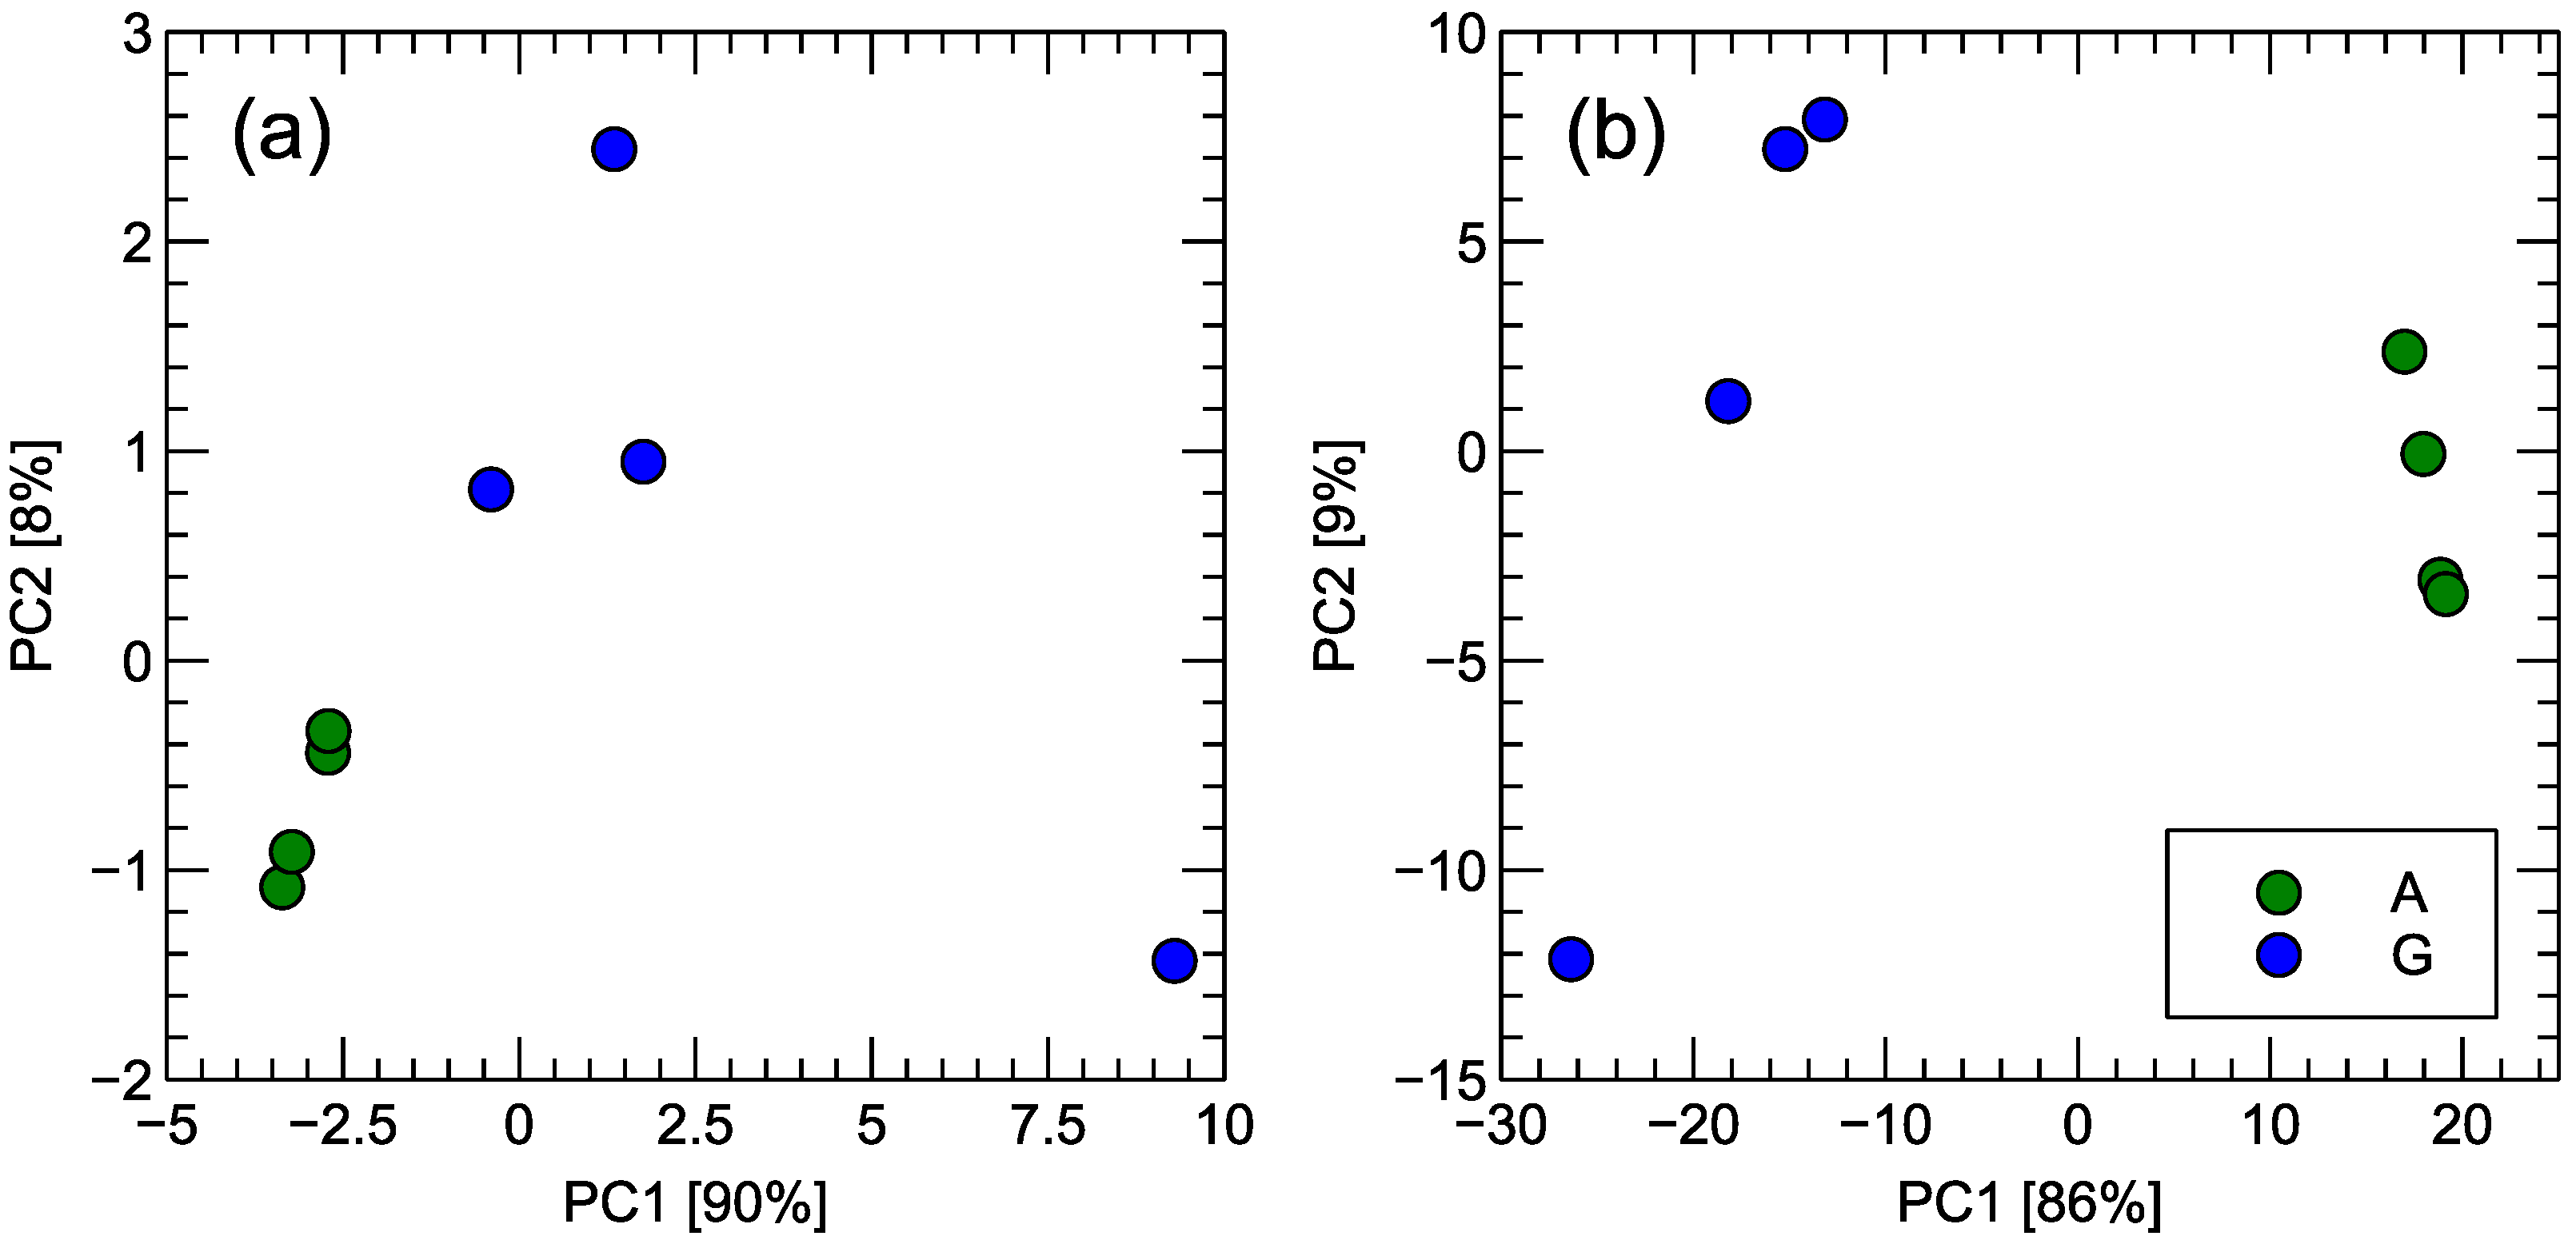
GC-MS identified a total of ten major chemical components across all samples. In order to visualize the multidimensional nature of these data in a simplified manner, Principal Component Analysis (PCA) was performed, and the results are displayed in Figure 7. As anticipated, Gouda-type and analogue samples form two distinct clusters, but it is also apparent that Gouda-type samples exhibit a more pronounced internal variability, most notably in Figure 7a), which incorporates the full scope of the concentration dataset.

3.2. Electronic Nose

3.2.1. Sensor Response

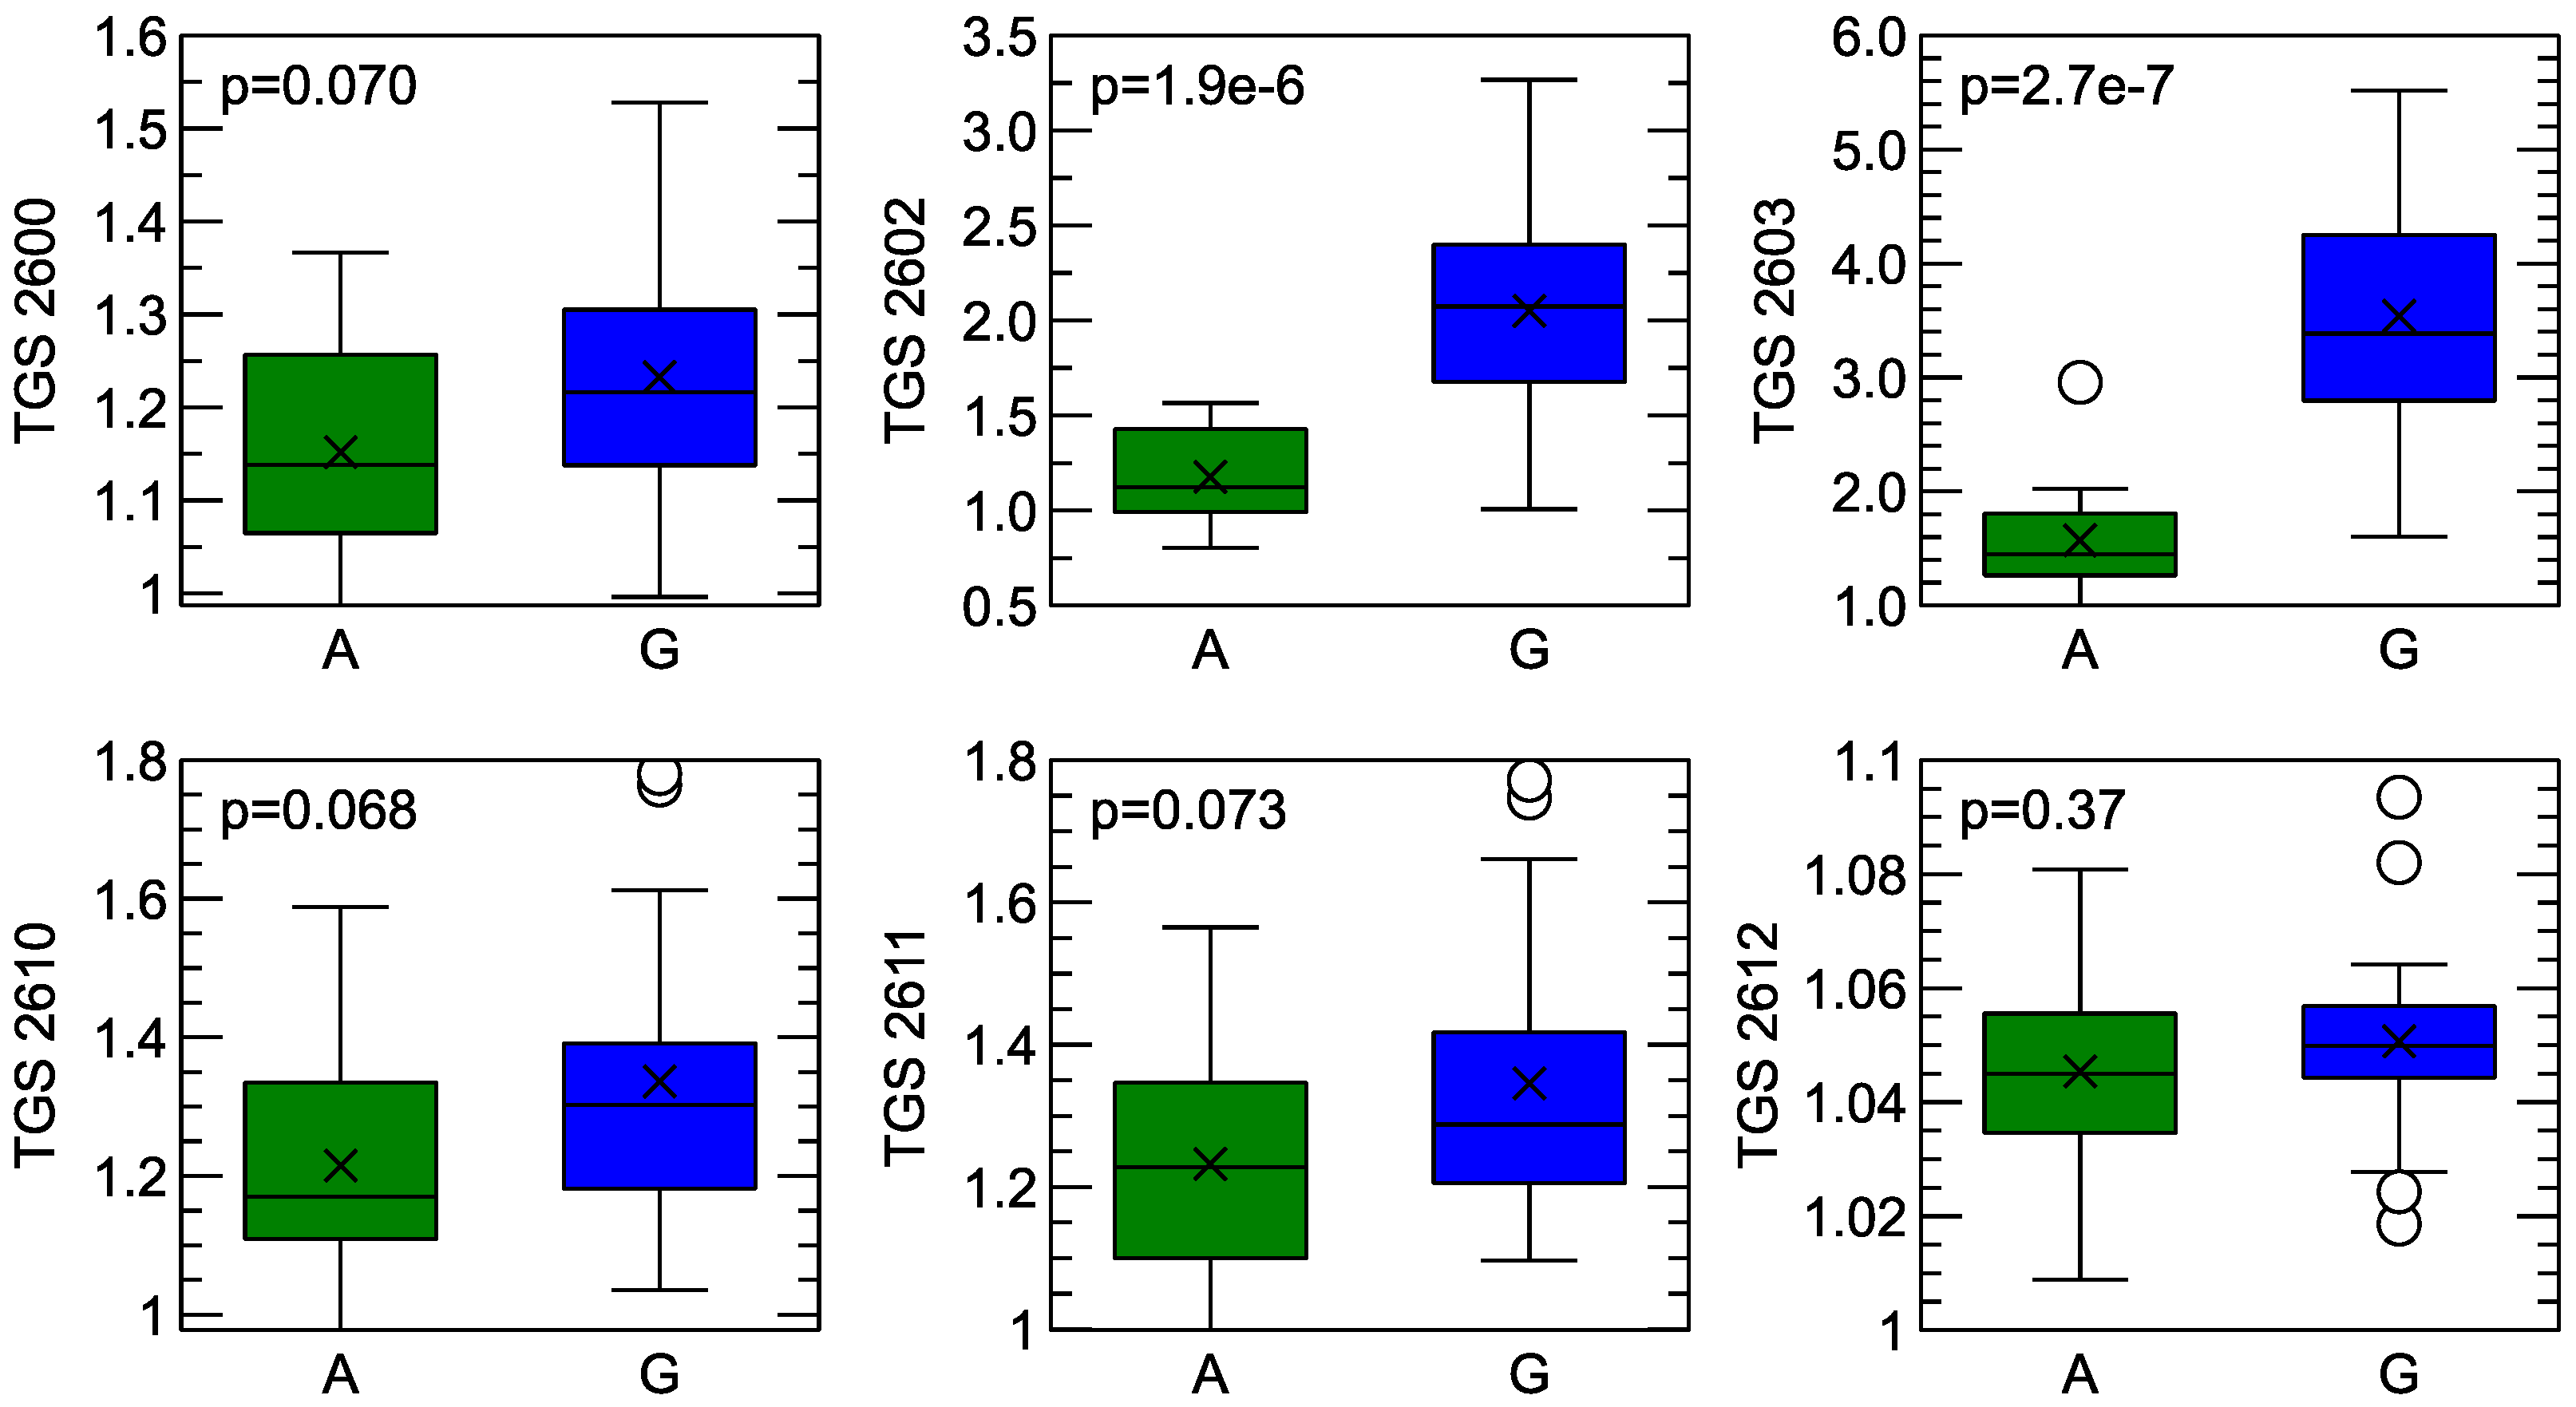
The first result of the electronic nose measurements is the comparison of the sensor’s response to two studied categories of samples. In Figure 8, a box-plot visualization of such a comparison is presented.
As can be noticed from this figure, for the sensors TGS 2602 and TGS 2603, the mean magnitude of the response is different when the aroma of Gouda cheese is compared with its analogue. This difference is also found to be statistically significant at the commonly used threshold of p < 0.05. However, one can also notice an overlap of the collected response distributions, which can make it difficult to differentiate between the treatments.
It can also be observed that when signals collected from samples of the analogue are compared with those from Gouda cheese samples, the reaction of the sensor to the latter samples is higher. This effect can be observed for all sensors.

3.2.2. Principal Components Analysis

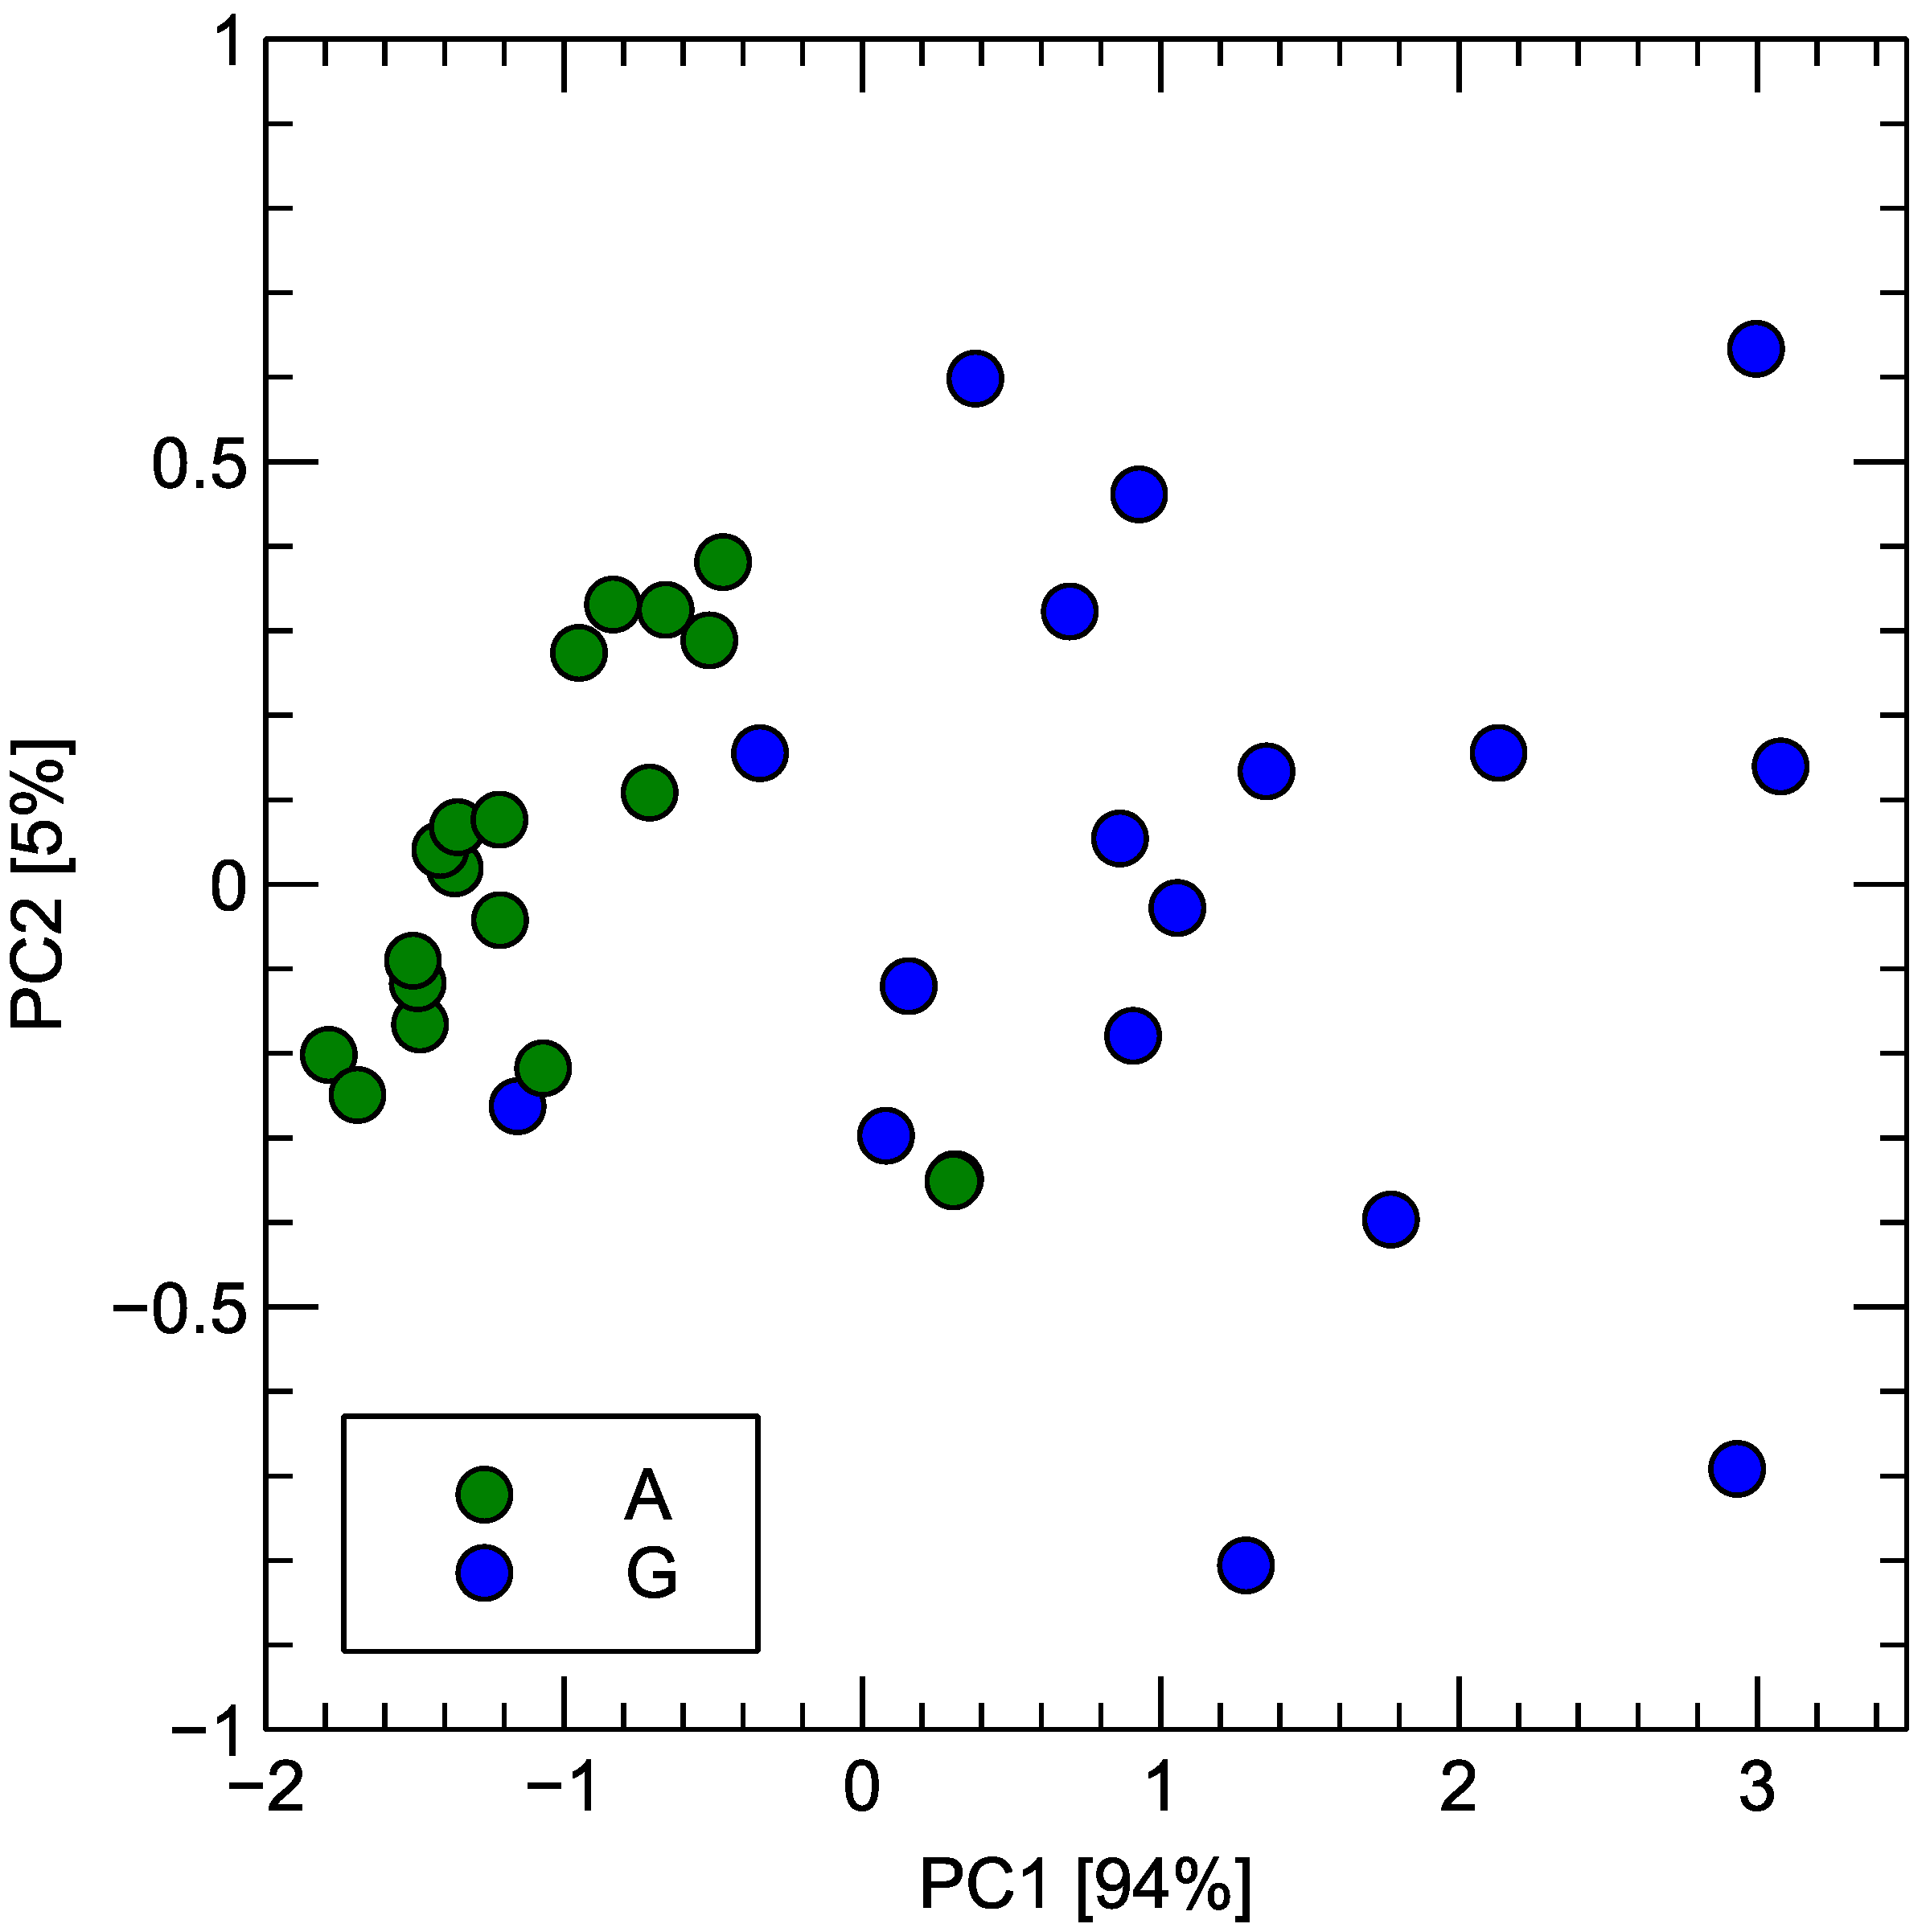
In order to provide more intuitive insights into the patterns in data distribution, PCA transformation of the sensors’ response data collected during the experiment is presented in Figure 9.
As can be seen, reducing the dimensionality to the first two principal components captures about 99% of the variance of the original dataset, with the first component alone accounting for about 95% of the variability. This is a sign of a strong correlation between the signal response captured by multiple sensors of the electronic nose. This could be explained by the fact that sensors’ sensitivity to various gases strongly overlaps, and thus, differences in chemical composition are detected by most of the sensors, which could be observed in Figure 8.
It can also be observed in Figure 9 that the points representing two studied categories form two distinct clusters, which only slightly overlap. Such an overlap is an expected effect from the perspective of the quality of analogue products as it signifies similarity in the odor profile of the product. However, the visible separation of the two clusters also signifies that there is still room for improvement in the technological process.
An interesting observation from this figure is that the variability of the sensor response to the aroma of Gouda cheese is much larger compared to that of the cheese analogue. This may indicate that the aroma of cheese is more varied than the analogue aroma. Such a higher variability can be at least partially explained by the more varied raw ingredients used for the production of cheese when compared to analogues. However, since the observed higher variability occurs when we consider experimental results collected during several consecutive days of the measurements, this may reflect shelf life, which strongly influences cheese more than analogue samples. However, this point requires a much more detailed analysis and is not considered in the scope of the present research.

3.2.3. Support Vector Machine (SVM) Classification Model

Electronic nose measurements allowed us to collect data, forming patterns that can differentiate between the studied sample categories. As shown in the previous sections, the mean sensor response differs for Gouda samples compared with analogue samples, but there is still some overlap in the data distributions. In order to estimate the performance of differentiation based on the electronic nose measurements, machine learning models are commonly employed.
In the present study, a Support Vector Machine classifier was used, and the 5-fold cross-validation procedure estimated the classification accuracy at 92.1%. The standard deviation among the cross-validation folds was 10.2%.

4. Discussion

4.1. Detected Chemical Components

Let us briefly review the basic information concerning chemical components detected in the studied samples [43].
  • 5-methyl-2-hexanone is a ketone, a colorless liquid with a pleasantly fruity odor. The chemical compound is less dense than water, and its vapors are heavier than air. According to our best knowledge, this substance has not been previously detected in Gouda cheese or its analogues; however, GC/MS analyses have confirmed its presence both in processed cheese, as reported by Sunesen et al. [44], and in liquid culture medium isolated from surface-ripened French cheese, as described by Deetae et al. [45].
  • 4-hydroxybutan-2-butanone, beta-hydroxy ketone, is a colorless liquid with a sweet, fruity odor. According to our best knowledge, this compound has not been previously detected in studies on volatile compounds in cheeses; however, it has been identified as a natural constituent in Glycyrrhiza glabra L. [46], a medicinal plant with well-documented pharmacological activity, and in the fungus Dictyophora rubrovolata Zang [47].
  • 2-Heptanone, N-amyl methyl ketone, is a clear colorless liquid, less dense than water, and only slightly soluble in water, with vapors heavier than air. It is used for synthetic flavoring and in perfumes and has a banana-like, fruity odor. This chemical component was found by Sloot et al. [17], van Leuven et al. [18], Shiota et al. [22], Jo et al. [19], and Sýkora et al. [48] in the context of aroma characterization of Gouda-type cheeses.
  • Hexadecane is a component of essential oils isolated from long pepper, having the role of a plant metabolite. The reported odor is gasoline-like to odorless. This compound was identified in the composition of semi-hard traditional cheese during studies conducted by Povolo et al. [49], as well as in volatile flavor compounds found in enzyme-modified cheese mixed with Soy–Cow’s milk, as described by Ali et al. [50].
  • Octadecane has the role of a bacterial and plant metabolite and is reported to be odorless. While it has not yet been detected as a volatile compound in cheese, it has been frequently reported in the analysis of volatiles from plants such as Lagenaria breviflora R. [51] and Symplocos crataegoides Buch.-Ham. [52].
  • 3-Methyl-2-butanone is a colorless liquid. The reported odor is sharp and pleasant, resembling other ketones with an acetone-like character. While this compound has not been previously detected in Gouda cheese, it has been identified in other types of cheese, such as Idiazabal cheese manufactured from ewe’s milk, as reported by Barron et al. [53], and in volatile compounds of Emmental cheese juice, as described by Thierry et al. [54].
  • 3-Hydroxy-2-butanone, acetonin, is known as a product of fermentation. The reported odor is bland and yogurt-like. It is one of the compounds that gives butter its characteristic flavor. This chemical component was found by van Leuven et al. [18] and Chen et al. [21] in the aroma characterization of Gouda-type cheeses. Additionally, 3-hydroxy-2-butanone was identified among the volatile compounds of Hispánico cheese through GC/MS analysis [55] and in cream cheese [56].
  • 2-Pentanone, methyl propyl ketone, is a clear colorless liquid with the odor of fingernail polish resembling acetone. It occurs naturally in Nicotiana tabacum (Tobacco) and blue cheese as a metabolic product of Penicillium mold growth. This chemical component was found by van Leuven et al. [18], Shiota et al. [22], and Chen et al. [21] in aroma characterization of Gouda-type cheeses.
  • 2-Nonanone is a methyl ketone. It has a role as a plant metabolite, and has a fruity type odor and a cheesy type flavor. This chemical component was found by van Leuven et al. [18], Shiota et al. [22], and Jo et al. [19] in aroma characterization of Gouda-type cheeses.
  • 3-Hydroxy-1-butanol, isoamyl alcohol, is a colorless liquid with a mild, choking alcohol odor. It is an ingredient in the production of banana oil. It is found in nature and also produced in industry as a flavoring.

4.2. Other Studies of Gouda Cheese Odor Composition

Van Leuven et al. [18] analyzed the steam distillation extract from Gouda-type cheeses and detected more chemical compounds than are typically identified using headspace solid-phase microextraction (HS-SPME). However, we believe the HS-SPME method better corresponds to the aroma measured by an electronic nose (or human perception) because it reflects volatiles naturally emitted from the sample. Van Leuven et al. [18] identified numerous ketones, such as 2-pentanone, 2-heptanone, 2-nonanone, and 3-hydroxy-2-butanone, which we also detected in Gouda-type cheese.
Duensing et al. [57] investigated the chemical composition of diethyl ether extract from Gouda-type cheese, focusing particularly on acidic compounds. They identified a range of aliphatic acids and esters, including cyclic esters (lactones). Based on HS-SPME/GC-MS analysis in our study, the main emitted compounds of Gouda-type cheese are ketones, which are generally more volatile than aliphatic acids.
Duensing et al. [23] analyzed Gouda-type cheese at five different ripening stages. They found that the content of individual volatiles is not constant, but changes significantly with the cheese age.
Sykora et al. [48] studied volatiles in four cheese types. They reported that the concentration of 2-heptanone in Gouda-type cheese (4.60 ± 0.05 μg/kg) was higher than in Edam or Emmentaler but was about half that in Maasdam cheese. Our study also confirmed 2-heptanone in the tested Gouda cheese samples.
Sloot et al. [17] investigated volatile compounds in Gouda cheese using low-temperature vacuum distillation in combination with Amberlite XAD-2 adsorption chromatography and identified a limited number of compounds, including bis(methylthio)methane, alkyl pyrazines, hexanoic acid, 2-heptanol, 2-heptanone, ethylhexanoate, and toluene. In our study, 2-heptanone was identified, confirming its role as a key volatile compound in Gouda cheese. However, our analysis revealed a more diverse volatile profile, with a higher proportion of ketones and alcohols, as well as hydrocarbons not reported by Sloot et al. [17]. This can be attributed to the improved sensitivity of modern GC-MS techniques and the avoidance of selective adsorption steps, which likely led to the loss of less stable or nonpolar compounds in the earlier study.
Chen et al. [21] identified 77 volatile compounds in Gouda cheese using a combination of solid-phase microextraction (SPME), solvent-assisted flavor evaporation (SAFE), gas chromatography–olfactometry (GC-O), and GC-MS. SAFE, particularly effective for extracting thermally labile and high-molecular-weight volatiles, combined with GC-O for identifying aroma-active compounds at trace levels, allowed the detection of a wide range of acids, esters, lactones, alcohols, and ketones. Chen et al. [21] used an SPME fiber with stationary-phase divinylbenzene/carboxyl/polydimethylsiloxane (DVB/CAR/PDMS). The sorption of volatiles was carried out in the headspace for 30 min at 60 °C. In our study, the same fiber type and exposition time were used, whereas the temperature of sorption was significantly lower and amounted to 25 °C. The application of lower temperatures resulted in less volatile compounds (e.g., carboxylic acids) not being easily transferred to headspace over Gouda-type cheese. Therefore, the volatile composition emitted from the cheese consists of fewer ingredients. On the other hand, testing Gouda-type cheese at room temperature (25 °C) is more convenient for the application of e-nose equipment because it does not require heating the sample of cheese to 60 °C. In our study, HS-SPME/GC-MS and electronic nose techniques were employed, focusing on low- to mid-volatility compounds. This approach enabled the detection of key aroma contributors, primarily ketones and hydroxy-ketones, which are essential for the creamy and buttery notes characteristic of Gouda cheese. In the volatile composition emitted from Gouda-type cheese, both Chen et al. [21] and this study identified aliphatic ketones, such as 2-pentanone, 2-heptanone, and 2-nonanone. Additionally, branched-chain ketones (3-methyl-2-butanone, 5-methyl-2-hexanone), hydroxyketones (4-hydroxy-2-butanone, 3-hydroxy-2-butanone), alkanes (hexadecane, octadecane), and diol (3-hydroxy-1-butanol), which were not reported by Chen et al. [21], were identified in this study. By contrast, lactones and long-chain fatty acids, such as delta-hexalactone and hexanoic acid, identified in Chen et al. [21], were not observed in our study. This discrepancy likely arises from the absence of SAFE, which is better suited for recovering less-volatile and high-boiling compounds that headspace techniques alone may miss. While Chen et al. [21] achieved a broader volatile profile through complementary extraction methods and GC-O, our approach with HS-SPME/GC-MS and the electronic nose allowed the detection of a distinct set of compounds, particularly mid-chain ketones, hydroxy-ketones, and specific hydrocarbons and alcohols. These findings underscore the influence of methodological differences on the volatile profiles obtained and demonstrate the unique insights provided by each approach.
A recent study by Perpetuini et al. [58] investigated the effect of Kluyveromyces marxianus on the gross composition and aroma profile of cow cheese. Volatile organic compounds were extracted by solid-phase microextraction and analyzed by gas chromatography–mass spectrometry (GC-MS) in combination with odor activity values [58]. The properties of the cheese are influenced by several factors, including the type of milk used, animal diet, ripening conditions, length of ripening, and microbiota [59]. Kluyveromyces marxianus is one of the most interesting dairy yeasts because it is thermotolerant, known to grow at temperatures as high as 42 °C. However, it is also capable of growing at refrigeration temperatures [60,61]. K. marxianus strains affect cheese ripening through their proteolytic and lipolytic activities, as well as the formation of volatile aromatic compounds [62,63]. This yeast species metabolises lactose as a carbon source through the expression of the LAC12 and LAC4 genes, which encode lactose permease and β -galactosidase, respectively Varela2017Polymorphisms. A total of 55 volatile compounds were detected in the cheeses, including 10 organic acids, 13 higher alcohols, 17 esters, 7 aldehydes, and 8 ketones. The content of higher alcohols was higher in the cheeses obtained with the strains than in the other selected studies. The predominant contents in these samples were isoamyl alcohol (fuselic, alcoholic, whisky, fruity, banana), 1-octanol (waxy, green, orange, aldehyde, rose, mushroom), 2-butanol (sweet, apricot), and 2-phenylethanol (floral, sweet, rose) [58] The study showed that inoculation with K. marxianus FM09 induced an increase in esters, higher alcohols, organic acids, and ketones, and the production of key volatile compounds was observed. These results demonstrated the potential of K. marxianus FM09 as a co-inoculation culture, even if further studies are needed to better investigate the interaction of the strains used and the cheese microflora.

4.3. Electronic Nose vs. GC-MS Measurements

In this manuscript, GC-MS and electronic nose measurements were applied, allowing differentiation between the samples of Gouda-type cheese and its analogue. In both types, volatile chemical components emitted by the samples were used. The GC-MS method allows the identification of individual chemical components constituting a sample and thus allows the obtaining of objective information on the chemical composition. The electronic nose method relies on pattern recognition methods applied to signals of a matrix of non-specific gas sensors. What is important to notice is that the sensor’s response is nonlinear [39] and does not give clear information concerning concentrations of gases, especially in the case of mixtures of various components present in biological samples.
Both applied methods allowed differentiation between the Gouda-type cheese and the analogue. In the case of GC-MS analysis, very different chemical composition of volatiles was confirmed, with several chemical components present only in the regular cheese and absent in analogues. Since the gas sensors applied in the electronic nose device are not specific, similar patterns in sensor reactions cannot be noticed, and sensor reactions are always observed for all measured types of samples. An interesting pattern could be observed in the PCA projection of the sensors’ signals. As one can notice, the cluster of points representing analogue sample measurements is much more concentrated compared to points representing the measurements of Gouda cheese. This is a sign that the variability between the measurements of Gouda cheese samples is much higher. It is our opinion that this could be an interesting observation, suggesting that the variability of these samples is higher. Such a pattern could not be easily observed in the analysis of GC-MS results, which, in our opinion, may be at least partially caused by a much smaller number of measurements that could be performed by the GC-MS. It could be speculated that the samples of Gouda-type cheese are more varied as the milk used for production is more likely to have a variable composition than oils used as raw materials for analogue production. Also, the biological process of cheese production from milk is more varied. However, this could not be confirmed with more quantitative measurements in our experiments. The GC-MS measurements, and especially the analysis of the output results, are much more laborious compared to electronic nose measurements.

4.4. Differences of Methods of Production

In our opinion, some of the differences in the content of the volatile components emitted by Gouda-type cheese and its analogue could be explained by differences in the production procedure of these two products.
As one could notice in Section 2.1, in the case of cheese production, animal fat present in milk is extracted, which also may contain volatile chemical components that dilute or bind to fat molecules, explaining the impoverished odor profile of the analogue product. Also, we can hypothesize that vegetable fat present in added palm oil does not provide specific volatiles that can supplement the odoral profile of analogue. However, confirmation of this requires more research, which we intend to perform in the future.

5. Summary and Conclusions

Gouda cheese is a washed-curd cheese originating from the Netherlands but currently produced worldwide. Traditionally, it is made from bovine milk (raw or pasteurized) and brined before ripening, which can range from 1 to 20 months.
In the process of the production of cheese analogues, ingredients, including non-dairy fats and/or proteins, are used to obtain a cheese-like product. Market demand for these analogues is increasing for several reasons, including lower cost compared to traditional cheeses and consumer interest in products with less saturated fat, cholesterol, and calories.
The odor and flavor profile of cheese analogues is usually less complex than that of conventional cheese, and the manufacturing process requires advances in processing methods to achieve the quality expected by customers.
An important step in the advancements of cheese analogue production is the analysis of their volatile profile and comparison with the original products. Advances in analytical methods for odor measurement that can be used in production practice are also welcome. Such methods as the use of electronic noses may be helpful as they can provide a more objective and less costly means of determining product quality.
In the present study, samples of 3-month-old Gouda-type cheese and an analogue thereof, originating from a dairy cooperative (Warmian-Masurian Voivodeship, Poland), were used for the analysis of their volatile profiles by headspace solid-phase microextraction and gas chromatography coupled with mass spectrometry (HS-SPME/GC-MS).
Ten chemical components were identified in the Gouda-type cheese, whereas only four were detected in the analogue. The GC-MS analysis revealed similar yet distinct volatile profiles when comparing these two product types.
A low-cost electronic nose device, constructed at the laboratory of the Warsaw University of Technology, was applied for measurements of the same samples. The performed measurements allowed for differentiating between the sample types, with an accuracy of classification by an SVM machine learning model of 95%. However, the experiment also demonstrated that the measured odors are similar and the distribution of data points, visualized by Principal Component Analysis, occupy close space. The experiment also demonstrated a much higher variability in the volatile profile between real cheese samples compared to its analogue.
The presented research demonstrated the usefulness of analytical methods of analysis of the quality of cheese products in terms of their volatile profile, and especially the ability to apply low-cost devices such as electronic noses for such tasks.

Author Contributions

Conceptualization, P.B. and M.P.-Ś.; methodology, P.B. and M.P.-Ś.; software, P.B.; validation, T.O. and A.O. (Adam Okorski); formal analysis, T.O. and A.O. (Adam Okorski); investigation, M.P.-Ś., H.H., M.S., T.P. and R.T.; resources, M.P.-Ś., A.O. (Andrzej Orłowski) and M.S.; data curation, P.B.; writing—original draft preparation, P.B., T.P., M.S. and M.P.-Ś.; writing—review and editing, P.B. and A.O. (Andrzej Orłowski); visualization, P.B.; supervision, P.B.; project administration, P.B. and M.P.-Ś.; funding acquisition, P.B., M.P.-Ś. and M.S. All authors have read and agreed to the published version of the manuscript.

Funding

This work was supported by the National Centre for Research and Development by the grant agreement BIOSTRATEG3/347105/9/NCBR/2017.

Institutional Review Board Statement

Not applicable.

Informed Consent Statement

Not applicable.

Data Availability Statement

The original contributions presented in the study are included in the article. Further inquiries can be directed to the authors. The raw data supporting the conclusions of this article will be made available by the authors on request.

Conflicts of Interest

Author Andrzej Orłowski was employed by the company Zakład Mleczarski w Lidzbarku Warmińskim. The remaining authors declare that the research was conducted in the absence of any commercial or financial relationships that could be construed as a potential conflict of interest.

References

  1. Zaręba, D.; Ziarno, M. Analogi: Wyroby podobne i analogi – podróbki czy nowy trend w produkcji żywności? Forum Mlecz. Bizn. 2015, 2, 21. [Google Scholar]
  2. Johnson, M.E. A 100-Year Review: Cheese production and quality. J. Dairy Sci. 2017, 100, 9952–9965. [Google Scholar] [CrossRef] [PubMed]
  3. Forum Mleczarskie, Podręcznik Serowy, Europejskie Specjalności, Gouda. Available online: https://www.forummleczarskie.pl/podrecznik-serowy/europa/16,gouda (accessed on 20 December 2024).
  4. Ferawati, F.; Hefni, M.; Östbring, K.; Witthöft, C. The Application of Pulse Flours in the Development of Plant-Based Cheese Analogues: Proximate Composition, Color, and Texture Properties. Foods 2021, 10, 2208. [Google Scholar] [CrossRef] [PubMed]
  5. Rawa, Ł. Rynek Serów Twardych w Polsce Zmienia Się Bardzo Powoli. 2017. Available online: https://www.wiadomoscihandlowe.pl/wywiady-i-opinie/rynek-serow-twardych-w-polsce-zmienia-sie-bardzo-powoli-2424728 (accessed on 20 December 2024).
  6. Ceny sera Gouda Wzrosły do Najwyższego Poziomu w 2024 r. Available online: https://www.portalspozywczy.pl/mleko/wiadomosci/ceny-sera-gouda-wzrosly-do-najwyzszego-poziomu-w-2024-r,272920.html (accessed on 18 December 2024).
  7. Czuba, A.; Starkowski, M.T. Polska Jest w Tym potęGą! Available online: https://www.fakt.pl/pieniadze/za-miastem/jak-produkowane-sa-polskie-sery-jestesmy-w-tym-potega/k6c5n39 (accessed on 4 December 2020).
  8. Giha, V.; Ordoñez, M.J.; Villami, R.A. How does milk fat replacement influence cheese analogue microstructure, rheology, and texture profile? J. Food Sci. 2021, 86, 2802–2815. [Google Scholar] [CrossRef]
  9. Fox, P.F.; Guinee, T.P.; Cogan, T.M.; McSweeney, P.L.H. Fundamentals of Cheese Science, 2nd ed.; Springer: New York, NY, USA, 2017. [Google Scholar] [CrossRef]
  10. Bachmann, H.P. Cheese analogues: A review. Int. Dairy J. 2001, 11, 505–515. [Google Scholar] [CrossRef]
  11. Vítová, E.; Loupancová, B.; Sklenářová, K.; Divišová, R.; Buňka, F. Identification of volatile aroma compounds in processed cheese analogues based on different types of fat. Chemical Papers 2012, 66, 907–913. [Google Scholar] [CrossRef]
  12. Kilcawley, K.N.; Wilkinson, M.G.; Fox, P.F. Enzyme-modified cheese. Int. Dairy J. 1998, 8, 1–10. [Google Scholar] [CrossRef]
  13. Panescu, P.; Carter, M.; Cohen, M.; Ignaszewski, E.; Murray, S.; O’Donnell, M.; Pierce, B.; Voss, S. State of the Industry Report: Plant-Based Meat, Seafood, Eggs, and Dairy; GFI: Washington, DC, USA, 2022. [Google Scholar]
  14. Battle, M.; Pierce, B.; Carter, M.; Clarke, J.C.; Fathman, L.; Gertner, D.; Ignaszewski, E.; Kroger, N.; Leet-Otley, T.; Panescu, P. 2023 State of the Industry Report: Plant-Based Meat, Seafood, Eggs, and Dairy; The Good Food Institute: Arlington, VA, USA, 2023. [Google Scholar]
  15. Persaud, K.; Dodd, G. Analysis of discrimination mechanisms in the mammalian olfactory system using a model nose. Nature 1982, 299, 352–355. [Google Scholar] [CrossRef]
  16. Cheng, L.; Meng, Q.H.; Lilienthal, A.J.; Qi, P.F. Development of compact electronic noses: A review. Meas. Sci. Technol. 2021, 32, 062002. [Google Scholar] [CrossRef]
  17. Sloot, D.; Harkes, P.D. Volatile trace components in Gouda cheese. J. Agric. Food Chem. 1975, 23, 356–357. [Google Scholar] [CrossRef]
  18. Van Leuven, I.; Van Caelenberg, T.; Dirinck, P. Aroma characterisation of Gouda-type cheeses. Int. Dairy J. 2008, 18, 790–800. [Google Scholar] [CrossRef]
  19. Jo, Y.; Benoist, D.; Ameerally, A.; Drake, M. Sensory and chemical properties of Gouda cheese. J. Dairy Sci. 2018, 101, 1967–1989. [Google Scholar] [CrossRef] [PubMed]
  20. Lee, H.W.; Kim, I.S.; Kil, B.J.; Seo, E.; Park, H.; Ham, J.S.; Choi, Y.J.; Huh, C.S. Investigation of Flavor-Forming Starter Lactococcus lactis subsp. lactis LDTM6802 and Lactococcus lactis subsp. cremoris LDTM6803 in Miniature Gouda-Type Cheeses. J. Microbiol. Biotechnol. 2020, 30, 1404–1411. [Google Scholar] [CrossRef] [PubMed]
  21. Chen, C.; Tian, T.; Yu, H.; Yuan, H.; Wang, B.; Xu, Z.; Tian, H. Characterisation of the key volatile compounds of commercial Gouda cheeses and their contribution to aromas according to Chinese consumers’ preferences. Food Chem. X 2022, 15, 100416. [Google Scholar] [CrossRef]
  22. Shiota, M.; Iwasawa, A.; Suzuki-Iwashima, A.; Iida, F. Effects of Flavor and Texture on the Sensory Perception of Gouda-Type Cheese Varieties during Ripening Using Multivariate Analysis. J. Food Sci. 2015, 80, C2740–C2750. [Google Scholar] [CrossRef]
  23. Duensing, P.W.; Hinrichs, J.; Schieberle, P. Formation of Key Aroma Compounds During 30 Weeks of Ripening in Gouda-Type Cheese Produced from Pasteurized and Raw Milk. J. Agric. Food Chem. 2024, 72, 11072–11079. [Google Scholar] [CrossRef]
  24. Yakubu, H.G.; Kovacs, Z.; Toth, T.; Bazar, G. Trends in artificial aroma sensing by means of electronic nose technologies to advance dairy production—A review. Crit. Rev. Food Sci. Nutr. 2021, 63, 234–248. [Google Scholar] [CrossRef]
  25. O’Riordan, P.J.; Delahunty, C.M. Characterisation of commercial Cheddar cheese flavour. 1: Traditional and electronic nose approach to quality assessment and market classification. Int. Dairy J. 2003, 13, 355–370. [Google Scholar] [CrossRef]
  26. O’Riordan, P.J.; Delahunty, C.M. Characterisation of commercial Cheddar cheese flavour. 2: Study of Cheddar cheese discrimination by composition, volatile compounds and descriptive flavour assessment. Int. Dairy J. 2003, 13, 371–389. [Google Scholar] [CrossRef]
  27. Trihaas, J.; Vognsen, L.; Nielsen, P. Electronic nose: New tool in modelling the ripening of Danish blue cheese. Int. Dairy J. 2005, 15, 679–691. [Google Scholar] [CrossRef]
  28. Trihaas, J.; van den Tempel, T.; Nielsen, P.V. Electronic Nose Technology in Quality Assessment: Predicting Volatile Composition of Danish Blue Cheese During Ripening. J. Food Sci. 2005, 70, e392–e400. [Google Scholar] [CrossRef]
  29. Benedetti, S.; Sinelli, N.; Buratti, S.; Riva, M. Shelf Life of Crescenza Cheese as Measured by Electronic Nose. J. Dairy Sci. 2005, 88, 3044–3051. [Google Scholar] [CrossRef]
  30. Cevoli, C.; Cerretani, L.; Gori, A.; Caboni, M.; Toschi, T.G.; Fabbri, A. Classification of Pecorino cheeses using electronic nose combined with artificial neural network and comparison with GC–MS analysis of volatile compounds. Food Chem. 2011, 129, 1315–1319. [Google Scholar] [CrossRef] [PubMed]
  31. Sberveglieri, V.; Bhandari, M.; Núñez Carmona, E.; Betto, G.; Sberveglieri, G. A Novel MOS Nanowire Gas Sensor Device (S3) and GC-MS-Based Approach for the Characterization of Grated Parmigiano Reggiano Cheese. Biosensors 2016, 6, 60. [Google Scholar] [CrossRef]
  32. Abbatangelo, M.; Núñez-Carmona, E.; Sberveglieri, V.; Zappa, D.; Comini, E.; Sberveglieri, G. Application of a Novel S3 Nanowire Gas Sensor Device in Parallel with GC-MS for the Identification of Rind Percentage of Grated Parmigiano Reggiano. Sensors 2018, 18, 1617. [Google Scholar] [CrossRef]
  33. Štefániková, J.; Nagyová, V.; Hynšt, M.; Vietoris, V.; Martišová, P.; Nagyová, L. Application of electronic nose for determination of Slovak cheese authentication based on aroma profile. Potravin. Slovak J. Food Sci. 2019, 13, 262–267. [Google Scholar] [CrossRef]
  34. Lee-Rangel, H.A.; Mendoza-Martinez, G.D.; Diaz de León-Martínez, L.; Relling, A.E.; Vazquez-Valladolid, A.; Palacios-Martínez, M.; Hernández-García, P.A.; Chay-Canul, A.J.; Flores-Ramirez, R.; Roque-Jiménez, J.A. Application of an Electronic Nose and HS-SPME/GC-MS to Determine Volatile Organic Compounds in Fresh Mexican Cheese. Foods 2022, 11, 1887. [Google Scholar] [CrossRef]
  35. Adams, R.P. Identification of Essential Oil Components by Gas Chromatography/Mass Spectrometry, 4th ed.; Texensis Publishing: Gruver, TX, USA, 2017. [Google Scholar]
  36. Tkachev, A.V. Chirospecific Analysis of Plant Volatiles. Russ. Chem. Rev. 2008, 76, 951. [Google Scholar] [CrossRef]
  37. Borowik, P.; Adamowicz, L.; Tarakowski, R.; Wacławik, P.; Oszako, T.; Ślusarski, S.; Tkaczyk, M. Application of a Low-Cost Electronic Nose for Differentiation between Pathogenic Oomycetes Pythium intermedium and Phytophthora plurivora. Sensors 2021, 21, 1326. [Google Scholar] [CrossRef]
  38. Borowik, P.; Grzywacz, T.; Tarakowski, R.; Tkaczyk, M.; Ślusarski, S.; Dyshko, V.; Oszako, T. Development of a Low-Cost Electronic Nose with an Open Sensor Chamber: Application to Detection of Ciboria batschiana. Sensors 2023, 23, 627. [Google Scholar] [CrossRef]
  39. Figaro Engineering Inc. MOS Type Sensors Operating Principle. Available online: https://www.figarosensor.com/technicalinfo/principle/mos-type.html (accessed on 30 April 2024).
  40. Cervera Gómez, J.; Pelegri-Sebastia, J.; Lajara, R. Circuit Topologies for MOS-Type Gas Sensor. Electronics 2020, 9, 525. [Google Scholar] [CrossRef]
  41. Pedregosa, F.; Varoquaux, G.; Gramfort, A.; Michel, V.; Thirion, B.; Grisel, O.; Blondel, M.; Prettenhofer, P.; Weiss, R.; Dubourg, V.; et al. Scikit-learn: Machine Learning in Python. J. Mach. Learn. Res. 2011, 12, 2825–2830. [Google Scholar]
  42. Virtanen, P.; Gommers, R.; Oliphant, T.E.; Haberland, M.; Reddy, T.; Cournapeau, D.; Burovski, E.; Peterson, P.; Weckesser, W.; Bright, J.; et al. SciPy 1.0: Fundamental Algorithms for Scientific Computing in Python. Nat. Methods 2020, 17, 261–272. [Google Scholar] [CrossRef] [PubMed]
  43. National Library of Medicine, National Center for Biotechnology Information, PubChem. Available online: https://pubchem.ncbi.nlm.nih.gov/ (accessed on 24 November 2024).
  44. Sunesen, L.O.; Lund, P.; Sørensen, J.; Hølmer, G. Development of Volatile Compounds in Processed Cheese during Storage. LWT—Food Sci. Technol. 2002, 35, 128–134. [Google Scholar] [CrossRef]
  45. Deetae, P.; Bonnarme, P.; Spinnler, H.E.; Helinck, S. Production of volatile aroma compounds by bacterial strains isolated from different surface-ripened French cheeses. Appl. Microbiol. Biotechnol. 2007, 76, 1161–1171. [Google Scholar] [CrossRef]
  46. PubChem. 4-Hydroxy-2-Butanone, Compound Summary, 2024. Available online: https://pubchem.ncbi.nlm.nih.gov/compound/4-Hydroxy-2-Butanone (accessed on 4 December 2024).
  47. Hang, M.Q.; Zou, Q.Q.; Tian, H.Y.; Sun, B.G.; Chen, H.T. Analysis of Volatile Components from Dictyophora rubrovolota Zang, ji et liou. Procedia Eng. 2012, 37, 240–249. [Google Scholar] [CrossRef]
  48. Sýkora, M.; Vítová, E.; Jeleń, H.H. Application of vacuum solid-phase microextraction for the analysis of semi-hard cheese volatiles. Eur. Food Res. Technol. 2020, 246, 573–580. [Google Scholar] [CrossRef]
  49. Povolo, M.; Pelizzola, V.; Lombardi, G.; Tava, A.; Contarini, G. Hydrocarbon and fatty acid composition of cheese as affected by the pasture vegetation type. J. Agric. Food Chem. 2012, 60, 299–308. [Google Scholar] [CrossRef]
  50. Ali, B.; Khan, K.Y.; Majeed, H.; Jin, Y.; Xu, D.; Rao, Z.; Xu, X. Impact of Soy–Cow’s mixed milk enzyme modified cheese on bread aroma. LWT—Food Sci. Technol. 2021, 147, 112793. [Google Scholar] [CrossRef]
  51. Adeyemi, M.A.; Ekunseitan, D.A.; Abiola, S.S.; Dipeolu, M.A.; Egbeyale, L.T.; Sogunle, O.M. Phytochemical Analysis and GC-MS Determination of Lagenaria breviflora R. Fruit. Int. J. Pharmacogn. Phytochem. Res. 2017, 9, 1045–1050. [Google Scholar] [CrossRef]
  52. Govindarajan, N.; Cheekala, U.M.R.; Arcot, S.; Sundaramoorthy, S.; Duraisamy, R.; Raju, I. GC-MS Analysis of n-hexane Extract of Stem Bark of Symplocos crataegoides Buch.-Ham. ex D. Don. Pharmacogn. J. 2016, 8, 520–524. [Google Scholar] [CrossRef]
  53. Barron, L.J.R.; Redondo, Y.; Aramburu, M.; Perez-Elortondo, F.J.; Albisu, M.; Najera, A.I.; de Renobales, M. Variations in volatile compounds and flavour in Idiazabal cheese manufactured from ewe’s milk in farmhouse and factory. J. Sci. Food Agric. 2005, 85, 1660–1671. [Google Scholar] [CrossRef]
  54. Thierry, A.; Maillard, M.B.; Hervé, C.; Richoux, R.; Lortal, S. Varied volatile compounds are produced by Propionibacterium freudenreichii in Emmental cheese. Food Chem. 2004, 87, 439–446. [Google Scholar] [CrossRef]
  55. Garde, S.; Ávila, M.; Medina, M.; Nuñez, M. Influence of a bacteriocin-producing lactic culture on the volatile compounds, odour and aroma of Hispánico cheese. Int. Dairy J. 2005, 15, 1034–1043. [Google Scholar] [CrossRef]
  56. Zheng, A.R.; Wei, C.K.; Wang, M.S.; Ju, N.; Fan, M. Characterization of the key flavor compounds in cream cheese by GC-MS, GC-IMS, sensory analysis and multivariable statistics. Curr. Res. Food Sci. 2024, 8, 100772. [Google Scholar] [CrossRef]
  57. Duensing, P.W.; Hinrichs, J.; Schieberle, P. Influence of Milk Pasteurization on the Key Aroma Compounds in a 30 Weeks Ripened Pilot-Scale Gouda Cheese Elucidated by the Sensomics Approach. J. Agric. Food Chem. 2024, 72, 11062–11071. [Google Scholar] [CrossRef]
  58. Perpetuini, G.; Rossetti, A.P.; Rapagnetta, A.; Tofalo, R. Unlocking the potential of Kluyveromyces marxianus in the definition of aroma composition of cheeses. Front. Microbiol. 2024, 15, 1464953. [Google Scholar] [CrossRef]
  59. Mayo, B.; Rodríguez, J.; Vázquez, L.; Flórez, A.B. Microbial Interactions within the Cheese Ecosystem and Their Application to Improve Quality and Safety. Foods 2021, 10, 602. [Google Scholar] [CrossRef]
  60. Fonseca, G.G.; Heinzle, E.; Wittmann, C.; Gombert, A.K. The yeast Kluyveromyces marxianus and its biotechnological potential. Appl. Microbiol. Biotechnol. 2008, 79, 339–354. [Google Scholar] [CrossRef]
  61. Tofalo, R.; Fasoli, G.; Schirone, M.; Perpetuini, G.; Pepe, A.; Corsetti, A.; Suzzi, G. The predominance, biodiversity and biotechnological properties of Kluyveromyces marxianus in the production of Pecorino di Farindola cheese. Int. J. Food Microbiol. 2014, 187, 41–49. [Google Scholar] [CrossRef]
  62. Binetti, A.; Carrasco, M.; Reinheimer, J.; Suárez, V. Yeasts from autochthonal cheese starters: Technological and functional properties. J. Appl. Microbiol. 2013, 115, 434–444. [Google Scholar] [CrossRef] [PubMed]
  63. Padilla, B.; Belloch, C.; López-Díez, J.J.; Flores, M.; Manzanares, P. Potential impact of dairy yeasts on the typical flavour of traditional ewes’ and goats’ cheeses. Int. Dairy J. 2014, 35, 122–129. [Google Scholar] [CrossRef]
Figure 1. Pieces of Gouda-type cheese and its analogue used for preparation of samples for experiment.
Agriculture 15 00336 g001
Figure 2. (a) Preparation of samples (Gouda 1 and Analogue 2). (b) Collection of volatile compounds using solid-phase microextraction (SPME) fiber for subsequent GC-MS analysis.
Agriculture 15 00336 g002
Figure 3. Preparation of samples for electronic nose measurements. (a) Weighting of chopped cheese; (b) samples in jars; (c) electronic nose experimental setup with open sensor chamber and demonstrated sensors; and (d) electronic nose applied to cheese sample in jar.
Agriculture 15 00336 g003
Figure 4. (a) Representative chromatogram of Gouda-type cheese. (b) Representative chromatogram of its analogue.
Agriculture 15 00336 g004
Figure 5. Total ion current (TIC) registered in the samples of Gouda-type cheese (G) and its analogue (A). In the box plots, the horizontal line inside the box represents the sample median, the × symbol represents the mean value, the box area spans from the 1st to the 3rd quartile, and the whiskers span from Q1*1.5 IQR to Q3 + 1.5*IQR (IQR—interquartile range). The circles beside the whiskers represent outlier observations.
Agriculture 15 00336 g005
Figure 6. Abundance of the recognized chemical components in samples of Gouda-type cheese (G) and its analogue (A), expressed as a proportion between the ion current peak area of the peak corresponding to the chemical component and the total ion current (% of TIC). In the box plots, the horizontal line inside the box represents the sample median, the × symbol represents the mean value, the box area spans from the 1st to the 3rd quantile, and the whiskers span from Q1*1.5 IQR to Q3 + 1.5*IQR (IQR—interquartile range). The circles beside the whiskers represent outlier observations.
Agriculture 15 00336 g006
Figure 7. Principal Component Analysis transformation of the data obtained by the GC-MS measurements of samples of Gouda-type cheese (G) and its analogue (A). Figure (a) presents the transformation of the area under the peak of the ion current. Figure (b) presents the transformation of the relative abundance of the peak in the total ion current. The two most important principal components (PCs) are used, and the variability of the data captured by the PC is indicated in the axis captions.
Agriculture 15 00336 g007
Figure 8. Comparison of electronic sensor response between sample measurements of Gouda-type cheese (G) and its analogue (A). The sensor’s response on the y-axis is expressed in proportion to the sensor response in clean air conditions R / R 0 . The sensor type is indicated in the y-axis caption. The p-values of the t-test is presented in the subfigures. In the box-plots, the horizontal line inside the box represents the sample median, the × symbol represents the mean value, the box area spans from the 1st to the 3rd quantile, and the whiskers span from Q1*1.5 IQR to Q3 + 1.5*IQR (IQR—interquantile range). The circles beside the whiskers represent outlier observations.
Agriculture 15 00336 g008
Figure 9. Distribution of sensor response for measurements of Gouda-type cheese (G) and its analogue (A) samples using PCA transformation of signals. Variance ratio captured by two most important components is indicated in axis captions.
Agriculture 15 00336 g009
Table 1. Chemical components identified in measured samples of Gouda cheese and its analogue by GC-MS method. Mean: fragmentation ions—mass/charge ratio (m/z), molecular ion (M+), retention time (tret), experimental retention index (RIexp), literature retention index (RIlit). Average (AVG) and standard deviation (STD) of contribution of each component to total ion current (TIC) are presented. CAS number is unique identifier assigned by Chemical Abstracts Service to each chemical substance.
CompoundFormulaCAS Numberm/zM+tret [min]RIexpRIlitGouda [%TIC]Analogue [%TIC]
AVG STD AVG STD
3-Methyl-2-butanoneC5H10O563-80-443, 86, 41, 71, 58862.873664.4666 a8.332.7421.491.91
2-PentanoneC5H10O107-87-943, 86, 41, 71, 58862.992679.8682 b6.502.34
4-Hydroxy-2-butanoneC4H8O2590-90-945, 43, 88, 42, 44883.129697.5698 a15.923.7025.911.78
3-Hydroxy-2-butanoneC4H8O2513-86-045, 43, 32, 88, 44883.251705.2706 a7.882.63
3-Hydroxy-1-butanolC5H12O123-51-355, 42, 70, 41, 43883.506724.0726 c2.680.4121.364.87
5-Methyl-2-hexanoneC7H14O110-12-343, 58, 71, 59, 411146.803855.0857 a18.451.1731.241.70
2-HeptanoneC7H14O110-43-043, 58, 71, 59, 411146.995887.0889 b14.045.31
2-NonanoneC9H18O821-55-658, 43, 59, 71, 5714212.6301086.01087 b6.142.43
HexadecaneC16H34544-76-357, 71, 43, 85, 4122626.2841600.01600 a12.115.08
OctadecaneC18H38593-45-357, 71, 85, 43, 4125430.9621800.01800 a7.952.27
ahttps://webbook.nist.gov (accessed on 1 December 2024). b—Adams, 2017 [35]. c—Tkachev, 2008 [36].
Disclaimer/Publisher’s Note: The statements, opinions and data contained in all publications are solely those of the individual author(s) and contributor(s) and not of MDPI and/or the editor(s). MDPI and/or the editor(s) disclaim responsibility for any injury to people or property resulting from any ideas, methods, instructions or products referred to in the content.