Abstract
Magnesium (Mg) deficiency is increasingly recognized as a critical factor limiting crop production, especially in soils with high potassium (K) application. This study investigated the effects of different Mg fertilizers (MgSO4 and Mg(OH)2-based nanofertilizer) on K–Mg interactions in hydroponically grown tomato seedlings, with varying K (0.7, 7, and 21 mM) and Mg (0.1 and 1 mM) supply concentrations. The results observed with MgSO4 application showed that high K levels (21 mM) significantly antagonized Mg uptake, reducing total Mg content and negatively affecting plant growth and root-to-shoot ratios at both Mg supply levels. Specifically, the K3 (21 mM) treatment reduced total biomass by 45.35% compared to the K2 (7 mM) treatment. Moreover, a high K supply combined with low Mg intake exacerbated Mg deficiency. The optimal K:Mg ratio for growth was found to be 7:1. K–Mg antagonism occurred primarily during root uptake, with excessive K leading to increased Mg2+ efflux in the root elongation zone. Notably, the application of Mg(OH)2 nanoparticles alleviated K-induced Mg deficiency, as indicated by the lack of a significant correlation between K supply and relative Mg concentrations in plants treated with nano-Mg across K:Mg ratios ranging from 7:0.1 to 21:0.1. However, Mg concentration decreased by 17.54% and 35.63% in shoots and by 27.72% and 37.08% in roots for K2 and K3, respectively, in plants treated with MgSO4. It is concluded that optimizing K:Mg ratios and using Mg-based nanofertilizers can improve K and Mg utilization in high-K soils.
1. Introduction
Magnesium (Mg) is an essential nutrient for plant growth and development, and plays crucial roles in photosynthesis as part of the chlorophyll structure and as a cofactor for photosynthetic enzymes, regulating carbohydrate and lipid metabolism [1,2]. Mg deficiency significantly reduces crop yield, with severe deficiency (exchangeable Mg < 60 mg kg−1) causing up to a 10.6% decrease in yield [3]. Thus, Mg deficiency is a growing concern, particularly in high-input crop production systems, as traditional agricultural practices prioritize nitrogen (N), phosphorus (P), and potassium (K) fertilizers while neglecting the importance of secondary nutrients.
Soil exchangeable Mg levels between 60 and 120 mg kg−1 (ammonium acetate extraction method) are generally sufficient for plant growth [3]. Mg availability for plants is influenced by soil type, climate, and plant species [4], with an example that Mg deficiency occurs in highly weathered, wet, strongly acidic, sandy soils from which Mg is easily leached [5]. Mg2+ ions have a small hydration shell, leading to weak adsorption and higher leaching rates [6]. Intensive crop production often depletes Mg levels, and insufficient fertilization exacerbates the issue [3]. Additionally, the presence of competing cations, such as calcium (Ca2+) in calcareous soils, ammonium (NH4+), hydrogen (H+), and aluminum (Al3+) in acidic soils, or sodium (Na+) in saline soils, can attenuate Mg bioavailability and inhibit its uptake by crops [7]. In regions with high precipitation and acidic soils, K-induced Mg deficiency is common, especially in crops with substantial K requirements [8]. For instance, in Shouguang, Shandong Province, tomato plants in greenhouses exhibited Mg deficiency symptoms despite soil exchangeable Mg levels (107–1459 mg kg−1) being above the moderate range, primarily due to high accumulation of available K (average: 500 mg kg−1) as a result of excessive K application (793 kg ha−1 per season) [9]. In fact, the production of vegetable crops in greenhouses has expanded considerably in recent decades. During rapid growth stages, Mg deficiency often manifests in these systems, often as a consequence of imbalanced fertilization or unfavorable root conditions, which can severely impact both yield and quality [10]. These findings highlight the importance of balanced nutrient management to maintain plant health and productivity.
Previous studies have identified antagonistic interactions between K and Mg, with K generally inhibiting Mg absorption, particularly at the plasma membrane of root cells where both ions compete for the same transport sites [11,12,13]. K has a higher affinity for these sites, leading to reduced Mg uptake. While some studies suggest that K limits Mg translocation from roots to aboveground parts [14], others propose that K does not directly inhibit Mg uptake but influences its redistribution, promoting Mg recycling from stems to roots via the phloem [15,16]. The exact localization of this antagonism, however, remains debated.
Determining the optimal K:Mg ratio is crucial for maintaining nutrient balance in agriculture. Studies have suggested different ratios: Tisdale et al. (1985) recommended a K:Mg ratio below 0.6 for greenhouse crops [17], while Reuter and Robinson (1997) found K deficiency at ratios below 10:1 and Mg deficiency at ratios above 14:1 [18]. Additionally, K concentrations above 17 mM in nutrient solutions, with 2 mM Mg, caused leaf Mg concentrations to drop below 4.7 mg kg−1, indicating deficiency [19]. However, establishing suitable K:Mg ratios is challenging due to soil variability and plant-specific factors.
Understanding nutrient interactions is essential for optimizing fertilization strategies and improving nutrient use efficiency. Studies emphasize the need for a balanced supply of K and Mg in fertilizers, as well as the role of factors like fertilization practices, cropping patterns, irrigation, and soil amendments (e.g., liming) to reduce K–Mg antagonism [20,21,22]. Innovative fertilizers, such as polyphosphates, enhance the availability of micronutrients like iron (Fe), manganese (Mn), and zinc (Zn) by up to 14%, 16%, and 20%, respectively [23], while Mg-modified biochar can address Mg deficiency in citrus soils [24]. The development of Fe chelates and organic Fe complexes aims to alleviate nutrient antagonism, particularly the interference of high P, Mn, Zn, and Cu levels with Fe nutrition in plants [25]. Nanofertilizers, with their small particle size and efficient nutrient uptake, offer improved nutrient utilization under challenging conditions [26,27,28]. The application of nanofertilizers could contribute to achieving balanced crop nutrition through diversified mechanisms of nanoparticle root uptake and cellular internalization [29]. However, to date, no studies have explored the potential of Mg-based nanofertilizers to mitigate K–Mg antagonism.
Tomato (Solanum lycopersicum L.), a Mg-sensitive crop, is a widely cultivated and consumed solanaceous vegetable, with its nutritional quality being crucial for human health and diet. This study aims to ascertain the effects of different levels of K and Mg supply on tomato growth and nutrient interactions in a hydroponic system, using two types of Mg fertilizers: MgSO4 and Mg(OH)2 nanoparticles (NPs). Under MgSO4 treatment, we hypothesize that optimizing K and Mg levels in the nutrient solution will improve chlorophyll content, root-to-shoot ratio, and nutrient interactions in tomato plants. Additionally, we aim to explore how K and Mg supply rates influence K-induced Mg deficiency and observe the uptake dynamics of Mg in tomato roots by noninvasive microtest technology (NMT). Furthermore, we explored whether Mg-based nanofertilizers could alleviate K–Mg antagonism compared to MgSO4. This study could potentially improve agricultural production in regions with high soil K concentrations.
2. Materials and Methods
2.1. Characterization of a Mg(OH)2 Nanomaterial
The Mg(OH)2-based nanofertilizer used in this study was a white to light yellow powder with a particle size < 100 nm, 99.8% purity, and a density of 2.36 g cm−3 (Macklin Biochemical Technology Co., Ltd., Shanghai, China). The shape and size of Mg(OH)2 NPs were characterized using transmission electron microscopy (TEM, FEI Tecnai G2 F30, FEI Company, Hillsboro, OR, USA), and size distribution diagrams of the NPs were analyzed using Nano Measurer v1.2 software [30], and the zeta potential of Mg(OH)2-based nanofertilizer solution was determined by dynamic light-scattering spectrometry (Zetasizer Nano ZS90, Malvern Panalytical Ltd., Malvern, Worcestershire, UK). Mg(OH)2 NPs were stable and did not contain any surface-modification substances. TEM analysis showed that Mg(OH)2 NPs were flaky, with a mean size of 51.03 nm. Energy-dispersive X-ray spectroscopy showed that Mg(OH)2 NPs had an Mg atom ratio of 55.61% and an O atom ratio of 44.39% (Figure 1). The zeta potential of Mg(OH)2 NPs was −20.9 ± 7.25 mV.
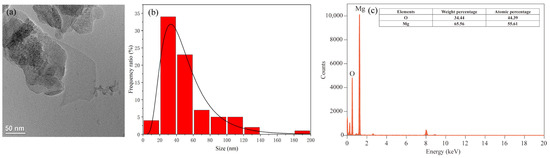
Figure 1.
Nanoparticle morphology, size distribution, and elemental composition analysis of Mg(OH)2 NPs. Transmission electron microscopy (TEM) image, scale bars: 50 nm (a). Size distribution histograms for Mg(OH)2 NPs, mean particle size: 51.03 nm (b). Energy-dispersive X-ray (EDX) spectroscopy results (c).
2.2. Experimental Design
Experiments were conducted from November 2021 to January 2022 in a hydroponic growth chamber with a 16 h light/8 h dark photoperiod, maintaining a day/night temperature regime of 25°/18 °C and a relative humidity of 50%. The photon flux intensity was set at 150 μmol m−2 s−1. The tomato (Solanum lycopersicum L.) cultivar ‘Leiden’ which exhibits high Mg deficiency tolerance, was used in this study. In the experiment, a total of 12 treatments were conducted, including three factors: K, Mg supply level, and Mg fertilizer type, with 4 replicates per treatment. Mg was added to the nutrient solution in the form of either Mg(OH)2 NPs or MgSO4·7H2O, maintaining consistent levels of K and Mg. In accordance with the findings from previous experiments conducted by the research group and some publications [19], three levels of K were established: K1 (0.7 mmol L−1), K2 (7 mmol L−1), and K3 (21 mmol L−1). Two levels of Mg were also designated: low Mg (0.1 mmol L−1) and high Mg (1 mmol L−1). Specifically, K1 and Low Mg represented the low K and low Mg levels, while K2 and High Mg represented the standard K and Mg concentrations in the improved Hoagland’s nutrient solution formulation for tomatoes in this study, respectively. Whether MgSO4 or nano-Mg(OH)2 was applied, the treatments with K:Mg = 7:1 were considered controls. K3 denoted the high K level. K was supplied in the form of K2SO4. Additionally, a table summarizing the treatments is provided in Figure 2 for better understanding.
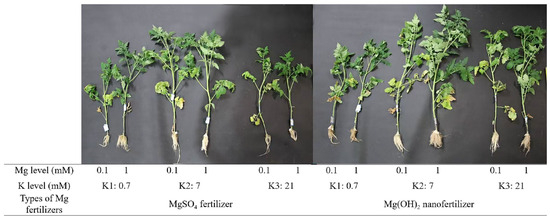
Figure 2.
Photograph of the tomato seedlings sampled from different treatments.
Tomato seeds of uniform size were sterilized with a 10% hydrogen peroxide (H2O2) solution for 20 min, followed by triple rinsing with distilled water. Then, the seeds were soaked overnight in a saturated calcium sulfate (CaSO4) solution with adequate ventilation. The treated seeds were placed in sterile Petri dishes under controlled humidity in the dark to facilitate germination. After germination, seedlings were transplanted into quartz sand and irrigated daily with 1/4-strength nutrient solution under continuous light. The seedlings were cultured for 2 weeks until they reached a suitable growth stage, and then those with similar height, stem diameter, and petiole number were selected.
The roots of the selected seedlings were carefully washed with deionized water and dried on filter paper. Plants of similar weight were treated with nutrient solutions containing different K:Mg ratios and Mg morphologies. Four plants were transplanted into each 3 L hydroponic container and supplied with full-strength modified Hoagland nutrient solution for optimal growth. The nutrient solution was prepared by dissolving analytical reagents in deionized water according to the modified Hoagland formula: Ca(NO3)2·4H2O: 3.4 mM; NH4NO3: 1.5 mM; NH4H2PO4: 1.5 mM; ethylenediaminetetraacetic acid·NaFe·3H2O: 53 µM; H3BO3: 46 µM; MnSO4·H2O: 13 µM; ZnSO4·7H2O: 0.76 µM; CuSO4·5H2O: 0.016 µM; (NH4)6Mo7O24·4H2O: 20 µM. The pH of the nutrient solution was adjusted to 6.5 using dilute H2SO4 or dilute KOH. The levels of K and Mg were adjusted using K2SO4 and MgSO4 or Mg(OH)2 while maintaining the other elements in the original formula. In the hydroponic experiment involving the application of nano-Mg to roots, suspensions of Mg(OH)2 NPs were prepared in 50 mL of deionized water, containing 174.9 mg and 17.49 mg, respectively. Prior to application, the Mg(OH)2 suspensions underwent sonication using an ultrasonic homogenizer operating at approximately 40 kHz and 150 Watts for 20 min to ensure the production of a homogeneous aqueous solution. Subsequently, freshly prepared exposure test solutions of Mg(OH)2 were applied to the plant roots, which were placed in a wide-mouth plastic container containing Mg-deficient Hoagland medium (3 L) and stirred. As a result, the hydroponic system was filled with Mg(OH)2 NPs suspended in deionized water at concentrations of 58.3 mg L−1 or 5.83 mg L−1. The hydroponic culture was equipped with an aquarium aerator to provide oxygen to the roots and later to maintain the NPs in suspension. The nutrient solution was renewed weekly during the early stages of plant growth and biweekly in later growth stages. Throughout the 28-day experimental period, plants were closely monitored for significant differences among treatments and the onset of nutrient deficiency symptoms (Figure 2). Further analyses were conducted to assess the impacts of varying K:Mg ratios and Mg forms on seedling growth and physiology, including biomass, chlorophyll content, K and Mg concentrations, as well as related indicators calculated to assess K–Mg antagonism.
2.3. Sample Collection and Analysis
2.3.1. Sample Collection
Tomato seedlings were separated into roots and shoots, weighed, and measured. The roots were repeatedly washed with deionized water and surface-dried using filter paper. Subsequently, they were deactivated at 105 °C in an oven for 30 min, followed by drying at 65 °C for 48 h until constant weight was reached. The dry weight was recorded, and the samples were homogenized for plant nutrient analyses. The second part of the fresh seedlings’ roots was used for NMT testing, and fresh leaf samples were used for chlorophyll content determination.
2.3.2. K and Mg Analyses
Dried samples weighing 0.2 ± 0.01 g were digested using an automatic tissue digester (Auto Digblock S60UP, LabTech Inc., Hopkinton, MA, USA) with a mixture of HNO3 and H2O2. Then, the filtered solution was analyzed for K and Mg concentrations using an inductively coupled plasma emission spectrometer (ICP-OES, 5110 SVDV, Agilent, Santa Clara, CA, USA).
2.3.3. Chlorophyll Determination
Leaf chlorophyll content was measured using a UV/VIS spectrophotometer (UV-5200, Shanghai Metash Instruments Co., Ltd., Shanghai, China). Briefly, fresh leaves (0.5 g) were accurately weighed, and chlorophyll was extracted with a 1:1 (v/v) mixture of anhydrous ethanol and acetone. The absorbance values at 645, 663, and 652 nm were measured and used to calculate the concentrations of chlorophyll a and b and total chlorophyll (g kg−1 fresh weight) according to Arnon’s equation [31].
2.3.4. Net Mg2+ Flux into Roots
Net Mg2+ flux was measured at the surface of the tomato root elongation zone under different K and Mg rates using NMT (NMT100 Series, Younger USA LLC, Amherst, MA, USA; Xuyue, Sci. & Tech. Co., Ltd., Beijing, China) with the iFluxes/imFluxes v1.0 software (Younger USA, LLC, Amherst, MA, USA), which simultaneously integrates and coordinates differential voltage signal collections, moving control, and image capture. Each measurement was conducted with a minimum of six replicates, and the ion flux was recorded at intervals of one reading every 6 s. Flux data were obtained using the JCal v3.3 software and then imported and converted into net Mg2+ fluxes [32].
2.3.5. Statistical Analyses
Each treatment was replicated four times, and the standard error (SE) was calculated. The data are presented as means ± SEs of four replicates. The normality of the data was determined by the Kolmogorov–Smirnov test (test K–S). The one-way, two-way, and three-way analysis of variance (ANOVA), along with Fisher’s least significant difference (LSD) test, were used to identify significant differences at p < 0.05, p < 0.01, or p < 0.001 between the treatments, using SPSS v25.0 software (SPSS Inc., Chicago, IL, USA). Correlations among the traits were performed using SPSS v25.0 software. Graphs were created using Origin software (Ver. OriginPro 21, OriginLab Corporation, Northampton, MA, USA), and data were processed using Excel 2010 (Microsoft Corp., Redmond, WA, USA).
Partial indicators involved in the results were calculated as follows:
Shoot(Root) Mg accumulation (mg plant−1) = Mg concentration Shoot(Root) × Dry weight Shoot(Root)
Total Mg accumulation (mg plant−1)= Mg concentration Shoot × Dry weight Shoot + Mg concentration Root × Dry weight Root
K accumulation and uptake were calculated using the same formula used for Mg.
3. Results
3.1. Impacts of K and Mg Supply on Tomato Growth
Both low Mg-treated plants and K3-treated plants exhibited different degrees of Mg deficiency symptoms, including a gradual transformation of leaf color from green to yellow (Figure 2). K levels significantly affected the shoot and root biomass of tomato seedlings (Figure 3), as well as the chlorophyll content of leaves (Figure 4). The dry weights of roots (DWRs) showed a significant increase at higher Mg supply levels, whereas those of shoots were unaffected. However, the DW of both shoots and roots significantly increases at high Mg application in the application of nano-Mg. At all Mg concentrations, DWR for different K application rates showed similar trends, with inhibition observed in the K1 and K3 treatments. Under MgSO4 treatment, dry weights in general were significantly higher (p < 0.05) in the K2 treatment (7 mM), reaching maximum values of 0.45 g plant−1 for roots and 3.91 g plant−1 for shoots at a K:Mg ratio of 7:1, nearly double those of the K1 and K3 treatments. A similar trend was observed in plants treated with nano-Mg(OH)2, where the maximum dry weights for shoots and roots were also achieved at a K:Mg ratio of 7:1, with values of 5.85 g plant−1 and 0.37 g plant−1, respectively. There were no significant differences in chlorophyll content among seedlings treated with varying MgSO4 levels. Under high Mg concentrations, the K3 treatment (21 mM) showed no significant difference compared to the K2 treatment. The chlorophyll levels of seedlings in the K:Mg = 21:0.1 were 12.86–13.42% lower than that in the K:Mg = 7:0.1 treatment (Figure 4a). In contrast to the significant decrease in chlorophyll levels with increasing K supply and no significant change with higher Mg supply under MgSO4 treatment, no significant changes in chlorophyll content were observed across different K levels under nano-Mg treatment, and a significant increase was noted under high Mg conditions. Under low Mg conditions, chlorophyll levels remained consistent between the K2 and K3 treatments (Figure 4b).
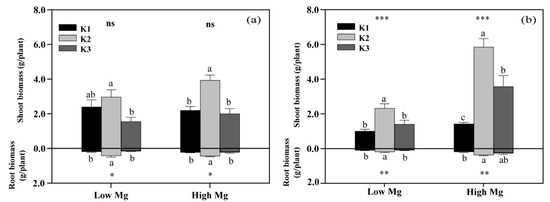
Figure 3.
Effects of different potassium (K) and magnesium (Mg) rates (K1: 0.7 mM, K2: 7 mM, K3: 21 mM, low Mg: 0.1 mM, high Mg: 1 mM) on the shoot and root biomass of tomato seedlings under MgSO4 (a) and nano-Mg applications (b), respectively. Values are the average + SE of four replicates. Means with the same letters are not significantly different at p < 0.05 among different K rates, according to Fisher’s least significant difference (LSD) test. ns indicate not significantly different, *, ** and *** indicate significant differences at p < 0.05, p < 0.01 and p < 0.001, respectively, between different Mg rates.
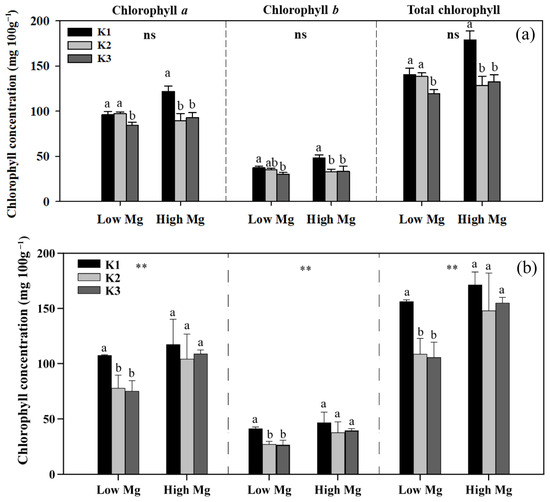
Figure 4.
Chlorophyll a, b, and total chlorophyll concentrations in leaves of tomato seedlings under MgSO4 (a) and nano-Mg (b) applications in response to K and Mg supply rates (K1: 0.7 mM, K2: 7 mM, K3: 21 mM, low Mg: 0.1 mM, high Mg: 1 mM). Values are the average + SE of four replicates. Means with the same letters are not significantly different at p < 0.05 among different K rates according to Fisher’s least significant difference (LSD) test. ns indicates no significant differences between different Mg rates. ** indicates significant differences at p < 0.01 between different Mg rates.
3.2. Impacts of K and Mg Supply on K and Mg Nutrient Status in Different Parts of Tomato Seedlings
We examined the responses of tomato seedlings to varying K and Mg concentrations in different plant parts, as well as the uptake of K+ and Mg2+ by roots and their accumulation in seedlings under different K:Mg ratios. Under MgSO4 application, Mg concentrations were significantly higher (1- to 1.5-fold) in roots than in shoots. By contrast, K concentrations were approximately 1.3–2 times higher in shoots than in roots. In both roots and shoots, Mg concentrations increased with decreasing K levels at the same Mg level, whereas seedling K concentrations did not change significantly between different Mg treatments in both the nano-Mg and MgSO4·7H2O treatments (Table 1). The net flux of Mg2+ on the surface of tomato roots (elongation zone) was the highest in the K3 (21 mM) treatment, with Mg2+ influx observed only in K1 and efflux detected in all other roots treated with MgSO4. The efflux flow rate of Mg2+ peaked at a K:Mg ratio of 21:0.1 (Figure 5a). Trends in Mg uptake per unit DWR were similar to those of Mg flux (Figure 6a). Mg concentrations and Mg uptake per unit DWR were highest at a K:Mg ratio of 0.7:1, with shoot and root Mg concentrations reaching 3.94 and 4.12 mg g−1 DW, respectively. Plants treated with nano-Mg showed the lowest Mg uptake in K1, with no significant differences between K2 and K3 (Figure 6b). A comparison of MgSO4 treatments with different Mg levels showed that K+ and Mg2+ accumulation tended to increase in both roots and shoots under K2 treatment (7 mM) to a greater extent than in all other treatments. Compared to the K3 treatment (K:Mg = 21:1), the total K+ and Mg2+ accumulation rates in tomato seedlings cultured with full-strength nutrient solution for 28 days in the K:Mg = 7:1 treatment were 56.5% and 132.5% higher, respectively. Under MgSO4 treatments, the root-to-shoot ratios increased with increasing Mg and K concentrations, with the lowest ratio observed at a K:Mg ratio of 0.7:0.1 (Figure 7a). Additionally, the root-to-shoot ratio in nano-Mg treated plants remained consistent between K2 and K3 treatments, with the highest ratio observed in K1, which was unaffected by Mg concentration (Figure 7a,d). We observed no significant effects of different K levels on the root-to-shoot ratio of Mg concentration under the same Mg levels, both with MgSO4 and nano-Mg applications (Figure 7b,e). In both the nano-Mg and MgSO4·7H2O treatments, Mg accumulation was partitioned between shoots and roots at similar rates of 12.8% and 87.2%, respectively, across all treatments (Figure 7c,f).

Table 1.
Effects of potassium (K) and magnesium (Mg) supply rates on K and Mg concentrations and accumulation in shoots and roots of tomato seedlings under MgSO4 and nano-Mg applications, respectively.
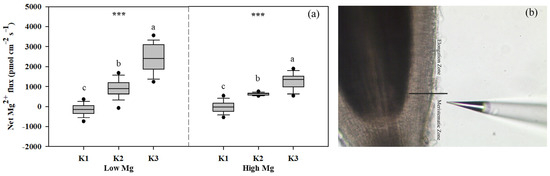
Figure 5.
(a) Net Mg2+ fluxes on tomato root (elongation zone) surfaces under different K and Mg supply rates (K1: 0.7 mM, K2: 7 mM, K3: 21 mM, Low Mg: 0.1 mM, High Mg: 1 mM) (under MgSO4 application). Positive and negative values indicate efflux and influx, respectively. (b) Image of the root elongation zone. The data represent values with 95% bootstrap confidence intervals, and the solid line passing through the box indicates the median. Means with the same letters are not significantly different at p < 0.05 among different K rates according to Fisher’s least significant difference (LSD) test. *** indicates significant differences at p < 0.001 between different Mg rates. Schematic diagram of tomato root system under noninvasive microtest micrometer (b).
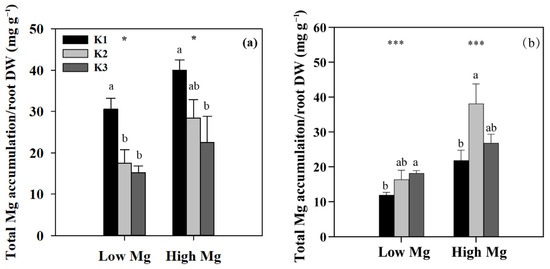
Figure 6.
Total (shoot + root) accumulation of Mg per unit DWR in tomato seedlings under MgSO4 (a) and nano-Mg (b) applications, respectively, in response to various K and Mg supply rates (K1: 0.7 mM, K2: 7 mM, K3: 21 mM, Low Mg: 0.1 mM, High Mg: 1 mM). Values are the average + SE of four replicates. Means with the same letters are not significantly different at p < 0.05 among different K rates, according to Fisher’s least significant difference (LSD) test. * and *** indicate significant differences at p < 0.05 and p < 0.001 between different Mg rates.
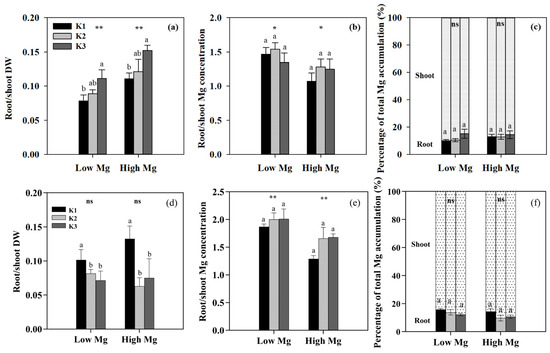
Figure 7.
Effects of K and Mg supply rates (K1: 0.7 mM, K2: 7 mM, K3: 21 mM, Low Mg: 0.1 mM, High Mg: 1 mM) on the root-to-shoot ratios of (a,d) dry weight (DW), (b,e) Mg concentration, and (c,f) root and shoot Mg accumulation as percentages of total (root + shoot) Mg accumulation in tomato seedlings under MgSO4 (a–c) and nano-Mg (d–f) applications, respectively. Values are the average + SE of four replicates. Means with the same letters are not significantly different at p < 0.05 among different K rates according to Fisher’s least significant difference (LSD) test. ns indicates not significantly different, * and ** indicate significant differences at p < 0.05 and p < 0.01 between different Mg rates.
3.3. Correlation Analysis of Indicators Related to K–Mg Antagonism
Bivariate Pearson’s correlation coefficients were utilized to assess the strength and direction of the association or relationship between the two variables. The correlation coefficient values and their graphical representation for all the studied traits relevant to K–Mg antagonism are displayed in Figure 8. Significant positive correlations were observed between specific pairs of indicators, including root and shoot Mg concentrations, Mg uptake per unit of DWR, root and shoot dry weight, and chlorophyll content. Conversely, K uptake per unit of DWR and shoot and root K+ concentrations exhibited significant negative correlations with total chlorophyll content, root and shoot Mg concentrations, and Mg uptake per unit of DWR, respectively. A positive correlation was detected between K uptake per unit of DWR and root Mg2+ efflux flow rates.
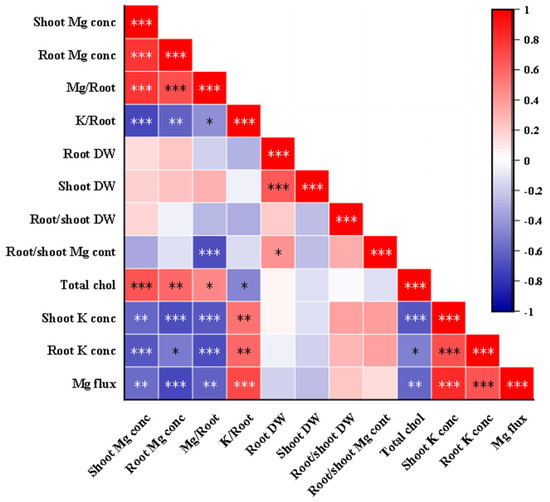
Figure 8.
Pearson correlation analysis of indicators related to K–Mg antagonism (under MgSO4 application). Note that Mg or K/Root indicates total Mg or K accumulation (shoot + root) per unit root dry weight, respectively. Chlorophyll concentrations were measured in leaves. Mg fluxes were measured at the surface of the root elongation zone. Chol, chlorophyll; conc, concentration. The red and blue colors correspond to positive and negative correlations between the measured traits, respectively. The color is related to the strength of correlation. *, **, and *** indicate significant differences at p < 0.05, p < 0.01, and p < 0.001.
3.4. Impact of Mg Nanofertilizer on Tomato Growth and K and Mg Nutrition Status
In the hydroponic experiment involving the application of nano-Mg to roots, tomato seedling dry weight increased in both roots and shoots at higher Mg concentrations. Specifically, in the K2 and K3 treatments, low nano-Mg concentrations resulted in a 60% decrease in dry weight compared to high nano-Mg concentrations. The K2 treatment had the highest dry weight (Figure 3b). At high nano-Mg concentrations, Mg accumulation in tomato seedlings was significantly higher in the K2 treatment than in the K1 and K3 treatments, with increases of 2.5-fold compared to K1 and 1-fold compared to K3. In low nano-Mg treatments, the total Mg accumulation was significantly higher in the K2 than in the K1 and K3 treatments, with differences of 59.1% and 37.0%, respectively. No significant difference in Mg accumulation was detected between the K1 and K3 treatments, and Mg concentration did not significantly change among all K levels when the nano-Mg supply was 0.1 mM. Mg concentrations in both roots and shoots, as well as shoot Mg accumulation, were significantly influenced by the type of Mg fertilizer applied. It is worth noting that seedling K concentrations did not change significantly across different Mg treatments in the nano-Mg group. Additionally, seedling K concentrations were the highest in K3, while K accumulation was greatest in K3 (Table 1). Under high nano-Mg supply, the K3 treatment showed a 29.7% reduction in Mg absorption per unit DWR compared to the K2 treatment (Figure 6b). The highest shoot and root Mg concentrations, as well as Mg absorption per unit DWR, were observed in the K2 treatment (K:Mg = 7:1). At the same nano-Mg concentration, no significant differences in total Mg uptake were observed between the K2 and K3 treatments.
The relationship between relative Mg concentrations in shoots (roots) and K supply was assessed under two Mg-based fertilizers, MgSO4 and Mg(OH)2. There was a significant quadratic correlation when MgSO4 was applied, root Mg concentration decreased by 17.54% for K2 (7 mM) and 35.63% for K3 (21 mM) compared to the K1 treatment (0.7 mM), while the shoot Mg concentrations decreased by 27.72% and 37.08%, respectively. The effect of K on root Mg uptake increased progressively, with higher K application rates from 0.7 to 21 mM. For shoot Mg uptake, the effect of K application initially intensified and then diminished after approximately 16 mM (Figure 9a). In contrast, when Mg(OH)2 NPs were applied, no significant correlation between K supply and the relative Mg in shoots or roots was observed (Figure 9b).
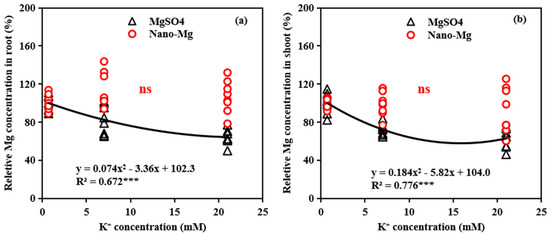
Figure 9.
Relationships between K+ concentrations and relative Mg concentrations in root (a) and shoot (b) of tomato under different Mg source (MgSO4 and nano-Mg). Relative Mg concentrations in shoot (root) were calculated by shoot (root) Mg concentration in higher K+ treatments (7 and 21 mM) divided by shoot (root) Mg concentration in low K+ treatment (0.7 mM). ns, not significantly different. *** indicates significant differences at p < 0.001.
4. Discussion
4.1. Impacts of K and Mg Supply Rates on Tomato Seedling Growth
Potassium is a strongly antagonistic mineral element towards Mg, impeding Mg uptake and potentially causing Mg deficiency that can inhibit plant growth. Specifically, under high K supply, we observed reduced chlorophyll content, biomass, and Mg uptake in tomato seedlings, along with a marked increase in the root–shoot ratio, even with high MgSO4 supply (Figure 3a, Figure 4a, Figure 6a, Figure 7a and Figure 8, Table 1). In line with previous reports, there is a negative correlation between exchangeable K+ content in soil and Mg content in functional leaves of greenhouse tomato plants [33]. Mg deficiency results in the loss of chlorophyll, reducing photosynthetic rates [34] through the systemic downregulation of gene expression within the auxin signaling pathway in the root system [35] and the disruption of source–sink carbon partitioning. In addition, we found that the antagonism was unidirectional, as increased Mg supply—whether from MgSO4 or nano-Mg—did not hinder K uptake in any part of the tomato seedlings (Table 1), consistent with findings from previous studies [36]. Notably, despite high Mg concentrations in soil, the inhibition of K uptake was not significant, likely because of the presence of specific K transporters in the high-affinity transport system, which are not affected by elevated Mg levels [21]. The contradictory conclusion that Mg has antagonistic effects on K, as reported in some studies [37], could potentially be attributed to varying concentrations and availability of ion supply.
In this study, both K and Mg levels, and their balance, significantly impacted plant growth. Based on our findings, the optimal K:Mg ratio for tomato growth was identified as 7:1, which ensured that both K and Mg levels were sufficient without causing deficiency in either nutrient. When applying MgSO4, an increase in K supply led to a decrease in chlorophyll content, which was not mitigated by higher Mg levels (Figure 4). This suggests that high K concentrations more strongly inhibited chlorophyll synthesis, and Mg deficiency induced by excessive K prevail in the source organ, particularly as the leaves mature [8]. The optimal K:Mg ratio of 7:1 (mM) in this study corresponds to a concentration ratio of approximately 11:1 (mg L−1), which falls within reasonable ranges for plant growth obtained from Reuter et al. [18]. However, responses to K:Mg ratios vary among different crops, cultivars, organ types (sink or source), leaf ages, fertilizer types, and growth stages [8]. The tomato cultivars Zhongza 9 and Jinpengchaoguan exhibited higher Mg uptake efficiency than Gailiangmaofen at a K:Mg ratio of 8:1, at which the Mg levels of shoots and roots were 10.4% and 21.8% lower, respectively, than in treatments with a K:Mg ratio of 4:1 [38]. In soil-cultivated cucumber plants (Cucumis sativus L.), a more balanced cation ratio in leaves and fruits was achieved at a K:Mg ratio of 6 [39]. These results highlight the importance of maintaining a balanced K:Mg ratio for optimal plant growth.
4.2. Root-Specific K–Mg Antagonism in Tomato Plants
Our investigation of Mg2+ flux in the root elongation zone using NMT revealed an antagonistic interaction between K+ and Mg2+ root uptake, supported by the correlation between these indicators (Figure 5 and Figure 8). The Mg uptake per unit DWR shows the same trend (Figure 6). Overall, the data indicated that the primary factor contributing to the antagonistic relationship between K+ and Mg2+ is the inhibition of root Mg uptake at higher K:Mg ratios. Mg2+ is known to have a low affinity for binding sites on the root protoplasmic membrane and a lack of selective ion channels [40], resulting in competition with other cations and reducing Mg2+ uptake [13], while element antagonism in plant roots has been widely discussed. High Al3+ concentrations can lead to an ionic imbalance in the root system, altering the concentrations of large numbers of other elements in roots, such as Ca, Mg, Mn, and Fe [41]. Fe2+ absorption at the root level is facilitated by IRT1-like protein, which can also transport Mn, Zn, Cu, and Cd across the plasma membrane [42].
Our results showed that neither MgSO4 nor nano-Mg application significantly altered the Mg concentration ratio between roots and shoots, nor did increasing K supply affect the percentage of Mg accumulation in these two plant parts (Figure 7b,c,e,f). This suggests that K does not interfere with the processes of Mg translocation and distribution within tomato plants. Studies on Mg nutrient transport and distribution within plants have yielded conflicting results. Some research suggests that K inhibits root Mg uptake and hinders the transport of Mg2+ from roots to aboveground [14]. In potato plants, high K levels resulted in decreased leaf Mg content and no Mg decrease in roots and tubers [43], and elevated Mg content in tubers (18–50% of the total plant Mg content) due to K application was linked to reduced Mg levels in stems and leaves, as the overall Mg uptake remained largely unchanged [16]. Mg deficiency in tomato plants has been found under low-Mg, high K conditions, suggesting that K may not impede Mg uptake, but rather render Mg unavailable within the plant, leading to its accumulation in the leaves [44]. Excessive K can also hinder Mg from fulfilling its physiological functions [15]. These findings suggest that the antagonistic interaction between K and Mg is most pronounced during root-to-shoot translocation.
Magnesium transporters play a crucial role in acquiring and distributing Mg2+ throughout the plant. In particular, CorA-type Mg2+ transporters are key regulators of Mg2+ homeostasis, while the Mg2+/H+ exchanger MHX in the vascular system is involved in loading Mg2+ into the xylem [45,46]. Importantly, these transporters exhibit nonspecificity, leading to potential competition between Mg2+ and K+ for binding sites [13]. In this study, however, the data suggest that the translocation and partitioning of Mg were not significantly affected by the changes in K supply. This could indicate that, while K and Mg may compete at the root membrane, other mechanisms, such as the upregulation of specific Mg transporters like the MGT gene, might help maintain Mg2+ homeostasis in response to varying internal Mg levels. Understanding the molecular mechanisms underlying plant K+ and Mg2+ homeostasis may contribute to engineering desirable nutritional traits in crops.
4.3. Alleviation of K–Mg Antagonism by Mg Nanofertilizer Application
Our investigation of the application of Mg(OH)2-based nanofertilizer revealed the alleviating effect of antagonism of K towards Mg, specifically during root absorption. Unlike for ionic MgSO4, no significant correlation was found between K supply and relative concentrations of Mg in shoots and roots in plants treated with nano-Mg (Figure 9). Further, compared to MgSO4, the application of nano-Mg increased shoot dry biomass by 49.6% and 70.5%, and shoot Mg accumulation by 12.84% and 27.43% at K:Mg ratios of 7:1 and 21:1, respectively (Figure 3, Table 1). In contrast to the MgSO4 treatment, no significant changes in chlorophyll content were observed across different K levels in tomato seedlings treated with nano-Mg under high Mg conditions, and under low Mg conditions, chlorophyll levels remained consistent between K2 and K3 treatments (Figure 4b). Additionally, the root-to-shoot ratio in nano-Mg treated plants remained consistent between K2 and K3 treatments, with the highest ratio observed in K1, which was unaffected by Mg concentration (Figure 7a,d). This suggests that, compared to MgSO4 treatment, the antagonistic effect of K on Mg is weakened when using Mg(OH)2, and that high K is no longer the main factor influencing the Mg nutrient. Instead, Mg deficiency in nutrient solution appears to be the dominant factor, further supporting the ability of nano-Mg(OH)2 to alleviate K-induced Mg antagonism. A similar conclusion can be drawn from the Mg uptake per unit DWR, where plants treated with nano-Mg showed the lowest Mg uptake in K1, with no significant differences between K2 and K3.
The unique physicochemical properties of NPs enable efficient interaction with plant tissues, facilitating their absorption and translocation. The Mg(OH)2 NPs used in this study have low solubility, but a small fraction of the NPs can dissolve in the nutrient solution and be absorbed by the roots in an ionic form. The majority of the inactive NPs could be absorbed directly [47]. The Mg(OH)2 NPs possess a negative surface charge of −20.9 ± 7.25 mV, which allows them to exert a weaker effect on the roots, resulting in higher uptake and internalization of NPs compared to positively charged NPs [48]. NPs with smaller diameters (5–20 nm) can penetrate plant cells through cell wall pores and are predominantly transported through the symplast. Larger particles (50–200 nm), such as the Mg(OH)2 NPs used in this study, tend to move through the apoplast [49]. This suggests that the mitigating effect of K on Mg antagonism observed in this study may be due to NPs bypassing the typical ion channel competition between K+ and Mg2+. NPs can become internalized in the cytoplasmic matrix through various mechanisms, including ion channel transport, passive diffusion, transport facilitated by water molecules through aquaporins, assistance from carrier proteins, endocytosis, formation of new pores, physical damage, and binding with organic matter [50,51]. Moreover, analysis using AAS confirmed higher Mg levels in both the leaves and roots of plants treated with Mg(OH)2 NPs compared to those treated with traditional Mg salts, indicating that the NPs enhanced Mg uptake and translocation [52]. These support the hypothesis that NP-based delivery systems can improve the efficiency of nutrient uptake in plants. However, further research is necessary to investigate the potential oxidative stress induced by NPs, their impact on plant metabolism, and any toxicity concerns, which remain important considerations for the application of nanofertilizers in agriculture.
However, the potential of nanofertilizers to modulate nutrient interactions at the soil, rhizosphere, and plant levels has been largely underestimated. Interactions between NPs and plant proteins offer a unique approach to regulating nutrient uptake and mitigating antagonisms, as shown by previous studies on cadmium transporters in roots [53]. To address soil nutrient loss caused by climate, soil properties, and farming practices, nanomembranes have been proposed to coat fertilizer particles for controlled nutrient release and to prevent nutrient imbalances [54]. Our findings suggest that Mg(OH)2-based nanofertilizers can effectively alleviate nutrient imbalances, particularly the K–Mg antagonism, by circumventing the typical competition for uptake sites.
5. Conclusions
Potassium is a strongly antagonistic mineral element towards Mg, impeding Mg uptake and potentially causing sufficient Mg deficiency to inhibit plant growth. According to various plant parameters such as chlorophyll content, biomass, and K and Mg concentrations, we determined that optimal tomato seedling growth performance was achieved at a K:Mg supply ratio of 7:1 (mM). NMT revealed that excessive K in the environment promoted the efflux of Mg2+ in the elongation zone of tomato roots, resulting in significantly reduced Mg accumulation. Thus, our study provided direct evidence of K–Mg antagonism in tomato seedling roots. However, K did not block Mg transport or distribution within the plants. To address the issue of Mg deficiency due to K–Mg antagonism, we propose the application of Mg(OH)2 NPs, as their small size and high surface area enable better penetration into the plant system. When MgSO4 was applied as the Mg fertilizer, a comparison with the K1 treatment (0.7 mM) revealed a 17.54% decrease in root Mg concentration in tomato seedlings for K2 (7 mM) and a 35.63% decrease for K3 (21 mM). Similarly, the shoot Mg concentration decreased by 27.72% and 37.08% for K2 and K3, respectively. In contrast to the results observed with ionic MgSO4, no significant correlation was observed between K supply and the relative concentrations of Mg in shoots and roots in plants treated with nano-Mg across the K:Mg ratios ranging from 7:0.1 to 21:0.1. Nanofertilizer application was found to effectively mitigate the antagonistic effects of K on Mg. The detrimental effects of nutritional imbalance of K and Mg in crops on yield and quality caused by excessive K application must be avoided. Mg-based nanofertilizers show promise in addressing Mg deficiency in high-K soils; however, further research is needed to ensure the safety of nanofertilizers for crops and their consumers.
Author Contributions
D.L.: conceptualization, funding acquisition, data curation, writing—review and editing. W.C.: data analysis, project administration, writing and editing. Z.H.: investigation, writing—original draft preparation. All authors have read and agreed to the published version of the manuscript.
Funding
This work was supported by Sichuan Science and Technology Program (2024YFHZ0226) and the Fundamental Research Funds for the Central Universities (SWU-KQ22060).
Institutional Review Board Statement
Not applicable.
Data Availability Statement
The datasets generated and analyzed during the current study are available from the corresponding author upon reasonable request.
Conflicts of Interest
The authors declare no conflicts of interest.
References
- Cakmak, I.; Yazici, A.M. Magnesium: A forgotten element in crop production. Better Crop. 2010, 94, 23–25. [Google Scholar]
- He, Z.; Shang, X.; Zhang, T.; Yun, J. Effect of calcium and magnesium on starch synthesis in maize kernels and its physiological driving mechanism. Front. Plant Sci. 2024, 14, 1332517. [Google Scholar] [CrossRef] [PubMed]
- Wang, Z.; Hassan, M.U.; Nadeem, F.; Wu, L.; Zhang, F.; Li, X. Magnesium fertilization improves crop yield in most production systems: A Meta-analysis. Front. Plant Sci. 2020, 10, 495191. [Google Scholar] [CrossRef] [PubMed]
- Ishfaq, M.; Wang, Y.; Yan, M.; Wang, Z.; Wu, L.; Li, C.; Li, X. Physiological essence of magnesium in plants and its widespread deficiency in the farming system of China. Front. Plant Sci. 2022, 13, 802274. [Google Scholar] [CrossRef] [PubMed]
- Mayland, H.F.; Wilkinson, S.R. Soil factors affecting magnesium availability in plant-animal systems: A review. J. Anim. Sci. 1989, 67, 3437–3444. [Google Scholar] [CrossRef]
- Maathuis, F.J. Physiological functions of mineral macronutrients. Curr. Opin. Plant Biol. 2009, 12, 250–258. [Google Scholar] [CrossRef]
- Mengel, K.; Kirkby, E.A.; Kosegarten, H.; Appel, T. The soil as a plant nutrient medium. In Principles of Plant Nutrition; Mengel, K., Kirkby, E.A., Kosegarten, H., Appel, T., Eds.; Springer: Cham, Switzerland, 2001; pp. 15–110. [Google Scholar] [CrossRef]
- Xie, K.; Cakmak, I.; Wang, S.; Zhang, F.; Guo, S. Synergistic and antagonistic interactions between potassium and magnesium in higher plants. Crop J. 2021, 9, 249–256. [Google Scholar] [CrossRef]
- Fei, C.; Zhang, S.; Sun, Z.; Ding, X. Assessment of magnesium deficiency in greenhouse tomato crops grown on calcareous soil. Soil Use Manag. 2024, 40, e12939. [Google Scholar] [CrossRef]
- Shamhari, N.M.; Wee, B.S.; Chin, S.F.; Kok, K.Y. Synthesis and characterization of zinc oxide nanoparticles with small particle size distribution. Acta Chim. Slov. 2018, 65, 578–585. [Google Scholar] [CrossRef]
- Shukla, U.; Mukhi, A.K. Sodium, potassium, and zinc relationship in Corn1. Agron. J. 1979, 71, 235–237. [Google Scholar] [CrossRef]
- Rhodes, R.; Miles, N.; Hughes, J.C. Interactions between potassium, calcium and magnesium in sugarcane grown on two contrasting soils in South Africa. Field Crop. Res. 2018, 223, 1–11. [Google Scholar] [CrossRef]
- Dibb, D.W.; Thompson, W.R., Jr. Interaction of potassium with other nutrients. In Potassium Agric; Munson, R.D., Ed.; American Society of Agronomy: Madison, WI, USA, 1985; pp. 515–533. [Google Scholar] [CrossRef]
- Ologunde, O.O.; Sorensen, R.C. Influence of concentrations of K and Mg in nutrient solutions on sorghum1. Agron. J. 1982, 74, 41–46. [Google Scholar] [CrossRef]
- Hovland, D.; Caldwell, A.C. Potassium and magnesium relationships in soils and plants. Soil Sci. 1960, 89, 92–96. [Google Scholar] [CrossRef]
- Addiscott, T.M. Potassium and the distribution of calcium and magnesium in potato plants. J. Sci. Food Agric. 1974, 25, 1173–1183. [Google Scholar] [CrossRef]
- Tisdale, S.L.; Nelson, W.L.; Beaton, J.D. Soil Fertility and Fertilizers; Collier Macmillan Publishers: New York, NY, USA, 1985. [Google Scholar]
- Reuter, D.; Robinson, J.B. (Eds.) Plant Analysis: An Interpretation Manual; CSIRO Publishing: Melbourne, Australia, 1997. [Google Scholar] [CrossRef]
- Guan, X.; Liu, D.; Liu, B.; Wu, C.; Liu, C.; Wang, X.; Zou, C.; Chen, X. Critical leaf magnesium concentrations for adequate photosynthate production of soilless cultured cherry tomato—Interaction with potassium. Agronomy 2020, 10, 1863. [Google Scholar] [CrossRef]
- Rietra, R.P.; Heinen, M.; Dimkpa, C.O.; Bindraban, P.S. Effects of nutrient antagonism and synergism on yield and fertilizer use efficiency. Commun. Soil Sci. Plant Anal. 2017, 48, 1895–1920. [Google Scholar] [CrossRef]
- Gransee, A.; Führs, H. Magnesium mobility in soils as a challenge for soil and plant analysis, magnesium fertilization and root uptake under adverse growth conditions. Plant Soil 2013, 368, 5–21. [Google Scholar] [CrossRef]
- Tränkner, M.; Jákli, B.; Tavakol, E.; Geilfus, C.M.; Cakmak, I.; Dittert, K.; Senbayram, M. Magnesium deficiency decreases biomass water-use efficiency and increases leaf water-use efficiency and oxidative stress in barley plants. Plant Soil 2016, 406, 409–423. [Google Scholar] [CrossRef]
- Wang, X.; Gao, Y.; Hu, B.; Chu, G. Comparison of the Hydrolysis Characteristics of three polyphosphates and their effects on soil phosphorus and micronutrient availability. Soil Use Manag. 2019, 35, 664–674. [Google Scholar] [CrossRef]
- Hu, L.; Huang, R.; Zhou, L.; Qin, R.; He, X.; Deng, H.; Li, K. Effects of magnesium-modified biochar on soil organic carbon mineralization in citrus orchard. Front. Microbiol. 2023, 14, 1109272. [Google Scholar] [CrossRef]
- Shenker, M.; Chen, Y. Increasing Iron Availability to Crops: Fertilizers, organo-fertilizers, and biological approaches. Soil Sci. Plant Nutr. 2005, 51, 1–17. [Google Scholar] [CrossRef]
- El-Shal, R.M.; El-Naggar, A.H.; El-Beshbeshy, T.R.; Mahmoud, E.K.; El-Kader, N.I.A.; Missaui, A.M.; Du, D.; Ghoneim, A.M.; El-Sharkawy, M.S. Effect of nano-fertilizers on alfalfa plants grown under different salt stresses in hydroponic system. Agriculture 2022, 12, 1113. [Google Scholar] [CrossRef]
- Elsayed, A.A.; Ahmed, E.G.; Taha, Z.K.; Farag, H.M.; Hussein, M.S.; AbouAitah, K. Hydroxyapatite nanoparticles as novel nano-fertilizer for production of rosemary plants. Sci. Hortic. 2022, 295, 110851. [Google Scholar] [CrossRef]
- Seleiman, M.F.; Almutairi, K.F.; Alotaibi, M.; Shami, A.; Alhammad, B.A.; Battaglia, M.L. Nano-fertilization as an emerging fertilization technique: Why can modern agriculture benefit from its use? Plants 2021, 10, 2. [Google Scholar] [CrossRef]
- Subramanian, K.S.; Manikandan, A.; Thirunavukkarasu, M.; Rahale, C.S. Nano-fertilizers for balanced crop nutrition. In Nanotechnologies in Food and Agriculture; Rai, M., Ribeiro, C., Mattoso, L., Duran, N., Eds.; Springer International Publishing: Cham, Switzerland, 2015; pp. 69–80. [Google Scholar] [CrossRef]
- Savvas, D.; Ntatsi, G.; Passam, H.C. Plant nutrition and physiological disorders in greenhouse grown tomato, pepper and eggplant. Eur. J. Plant Sci. Biotechnol. 2008, 2, 45–61. [Google Scholar]
- Arnon, D.I. Copper enzymes in isolated chloroplasts. Polyphenoloxidase in beta vulgaris. Plant Physiol. 1949, 24, 1. [Google Scholar] [CrossRef]
- Liu, B.; Zhang, J.; Ye, N. Noninvasive micro-test technology: Monitoring ion and molecular flow in plants. Trends Plant Sci. 2023, 28, 123–124. [Google Scholar] [CrossRef]
- Yan, B.; Zhou, T.; Wang, H.M.; Chen, Z.J.; Cao, J.Y.; Liu, S.M. The relationships between magnesium deficiency of tomato and cation balances in solar greenhouse soil. Sci. Agric. Sin. 2016, 49, 3588–3596, (In Chinese with English abstract). [Google Scholar] [CrossRef]
- Shabala, S.; Hariadi, Y. Effects of magnesium availability on the activity of plasma membrane ion transporters and light-induced responses from broad bean leaf mesophyll. Planta 2005, 221, 56–65. [Google Scholar] [CrossRef]
- Ishfaq, M.; Zhong, Y.; Wang, Y.; Li, X. Magnesium limitation leads to transcriptional down-tuning of auxin synthesis, transport, and signaling in the tomato root. Front. Plant Sci. 2021, 12, 802399. [Google Scholar] [CrossRef]
- Fageria, N.K. Ionic interactions in rice plants from dilute solutions. Plant Soil 1983, 70, 309–316. Available online: http://www.jstor.org/stable/42934193 (accessed on 2 November 2024). [CrossRef]
- del Amor, F.M.; Rubio, J.S. Effects of antitranspirant spray and potassium: Calcium: Magnesium ratio on photosynthesis, nutrient and water uptake, growth, and yield of sweet pepper. J. Plant Nutr. 2009, 32, 97–111. [Google Scholar] [CrossRef]
- Li, H.X.; Chen, Z.J.; Zhou, T.; Liu, Y.; Zhou, J.B. High potassium to magnesium ratio affected the growth and magnesium uptake of three tomato (Solanum lycopersicum L.) cultivars. J. Integr. Agric. 2018, 17, 2813–2821. [Google Scholar] [CrossRef]
- Ruiz, J.M.; Moreno, D.A.; Romero, L. Pyruvate kinase activity as an indicator of the level of K+, Mg2+, and Ca2+ in leaves and fruits of the cucumber: The role of potassium fertilization. J. Agric. Food Chem. 1999, 47, 845–849. [Google Scholar] [CrossRef]
- Hariadi, Y.; Shabala, S. Screening broad beans (Vicia faba) for magnesium deficiency. I. Growth characteristics, visual deficiency symptoms and plant nutritional status. Funct. Plant Biol. 2004, 31, 529–537. [Google Scholar] [CrossRef]
- Dai, B.; Chen, C.; Liu, Y.; Liu, L.; Qaseem, M.F.; Wang, J.; Li, H.; Wu, A.M. Physiological, biochemical, and transcriptomic responses of neolamarckia cadamba to aluminum stress. Int. J. Mol. Sci. 2020, 21, 9624. [Google Scholar] [CrossRef]
- Connolly, E.L.; Campbell, N.H.; Grotz, N.; Prichard, C.L.; Guerinot, M.L. Overexpression of the FRO2 ferric chelate reductase confers tolerance to growth on low iron and uncovers posttranscriptional control. Plant Physiol. 2003, 133, 1102–1110. [Google Scholar] [CrossRef]
- Koch, M.; Busse, M.; Naumann, M.; Jákli, B.; Smit, I.; Cakmak, I.; Hermans, C.; Pawelzik, E. Differential effects of varied potassium and magnesium nutrition on production and partitioning of photoassimilates in potato plants. Physiol. Plant. 2019, 166, 921–935. [Google Scholar] [CrossRef]
- Kabu, K.; Toop, E.W. Influence of potassium-magnesium antagonism on tomato plant growth. Can. J. Plant Sci. 1970, 50, 711–715. [Google Scholar] [CrossRef][Green Version]
- Tang, Y.; Yang, X.; Li, H.; Shuai, Y.; Chen, W.; Ma, D.; Lü, Z. Uncovering the role of wheat magnesium transporter family genes in abiotic responses. Front. Plant Sci. 2023, 14, 1078299. [Google Scholar] [CrossRef]
- Chen, Z.C.; Peng, W.T.; Li, J.; Liao, H. Functional dissection and transport mechanism of magnesium in plants. Semin. Cell Dev. Biol. 2018, 74, 142–152. [Google Scholar] [CrossRef] [PubMed]
- Chen, L.; Hu, Z.; Chen, W.; Xu, Z.; Hao, C.; Lakshmanan, P.; Liu, D.; Chen, X. Comparative study of the effectiveness of nano-sized iron-containing particles as a foliar top-dressing of peanut in rainy conditions. Agric. Water Manag. 2023, 286, 108392. [Google Scholar] [CrossRef]
- Sun, X.D.; Yuan, X.Z.; Jia, Y.; Feng, L.J.; Zhu, F.P.; Dong, S.S.; Liu, J.; Kong, X.; Tian, H.; Duan, J.L.; et al. Differentially charged nanoplastics demonstrate distinct accumulation in Arabidopsis thaliana. Nat. Nanotechnol. 2020, 15, 755–760. [Google Scholar] [CrossRef] [PubMed]
- Liu, R.; Lal, R. Potentials of engineered nanoparticles as fertilizers for increasing agronomic productions. Sci. Total Environ. 2015, 514, 131–139. [Google Scholar] [CrossRef]
- Yang, J.; Cao, W.; Rui, Y. Interactions between nanoparticles and plants: Phytotoxicity and defense mechanisms. J. Plant Interact. 2017, 12, 158–169. [Google Scholar] [CrossRef]
- Hillaireau, H. Investigating interactions between nanoparticles and cells: Internalization and intracellular trafficking. In Polymer Nanoparticles for Nanomedicines: A Guide for their Design, Preparation and Development; Vauthier, C., Ponchel, G., Eds.; Springer International Publishing: Cham, Switzerland, 2016; pp. 291–323. [Google Scholar] [CrossRef]
- Shinde, S.; Paralikar, P.; Ingle, A.P.; Rai, M. Promotion of seed germination and seedling growth of Zea mays by magnesium hydroxide nanoparticles synthesized by the filtrate from Aspergillus niger. Arabian J. Chem. 2020, 13, 3172–3182. [Google Scholar] [CrossRef]
- Wu, S.; Shi, K.; Hu, C.; Guo, J.; Tan, Q.; Sun, X. Non-invasive microelectrode cadmium flux measurements reveal the decrease of cadmium uptake by zinc supply in pakchoi root (Brassica chinensis L.). Ecotoxicol. Environ. Saf. 2019, 168, 363–368. [Google Scholar] [CrossRef]
- Tarafdar, J.C.; Raliya, R.; Rathore, I. Microbial synthesis of phosphorous nanoparticle from tri-calcium phosphate using aspergillus tubingensis TFR-5. J. Bionanosci. 2012, 6, 84–89. [Google Scholar] [CrossRef]


Disclaimer/Publisher’s Note: The statements, opinions and data contained in all publications are solely those of the individual author(s) and contributor(s) and not of MDPI and/or the editor(s). MDPI and/or the editor(s) disclaim responsibility for any injury to people or property resulting from any ideas, methods, instructions or products referred to in the content. |
© 2025 by the authors. Licensee MDPI, Basel, Switzerland. This article is an open access article distributed under the terms and conditions of the Creative Commons Attribution (CC BY) license (https://creativecommons.org/licenses/by/4.0/).