
Response of Wheat Genotypes Stressed by High Temperature in Terms of Yield and Protein Composition Across Diverse Environments in Australia


Abstract
:1. Introduction
2. Materials and Methods
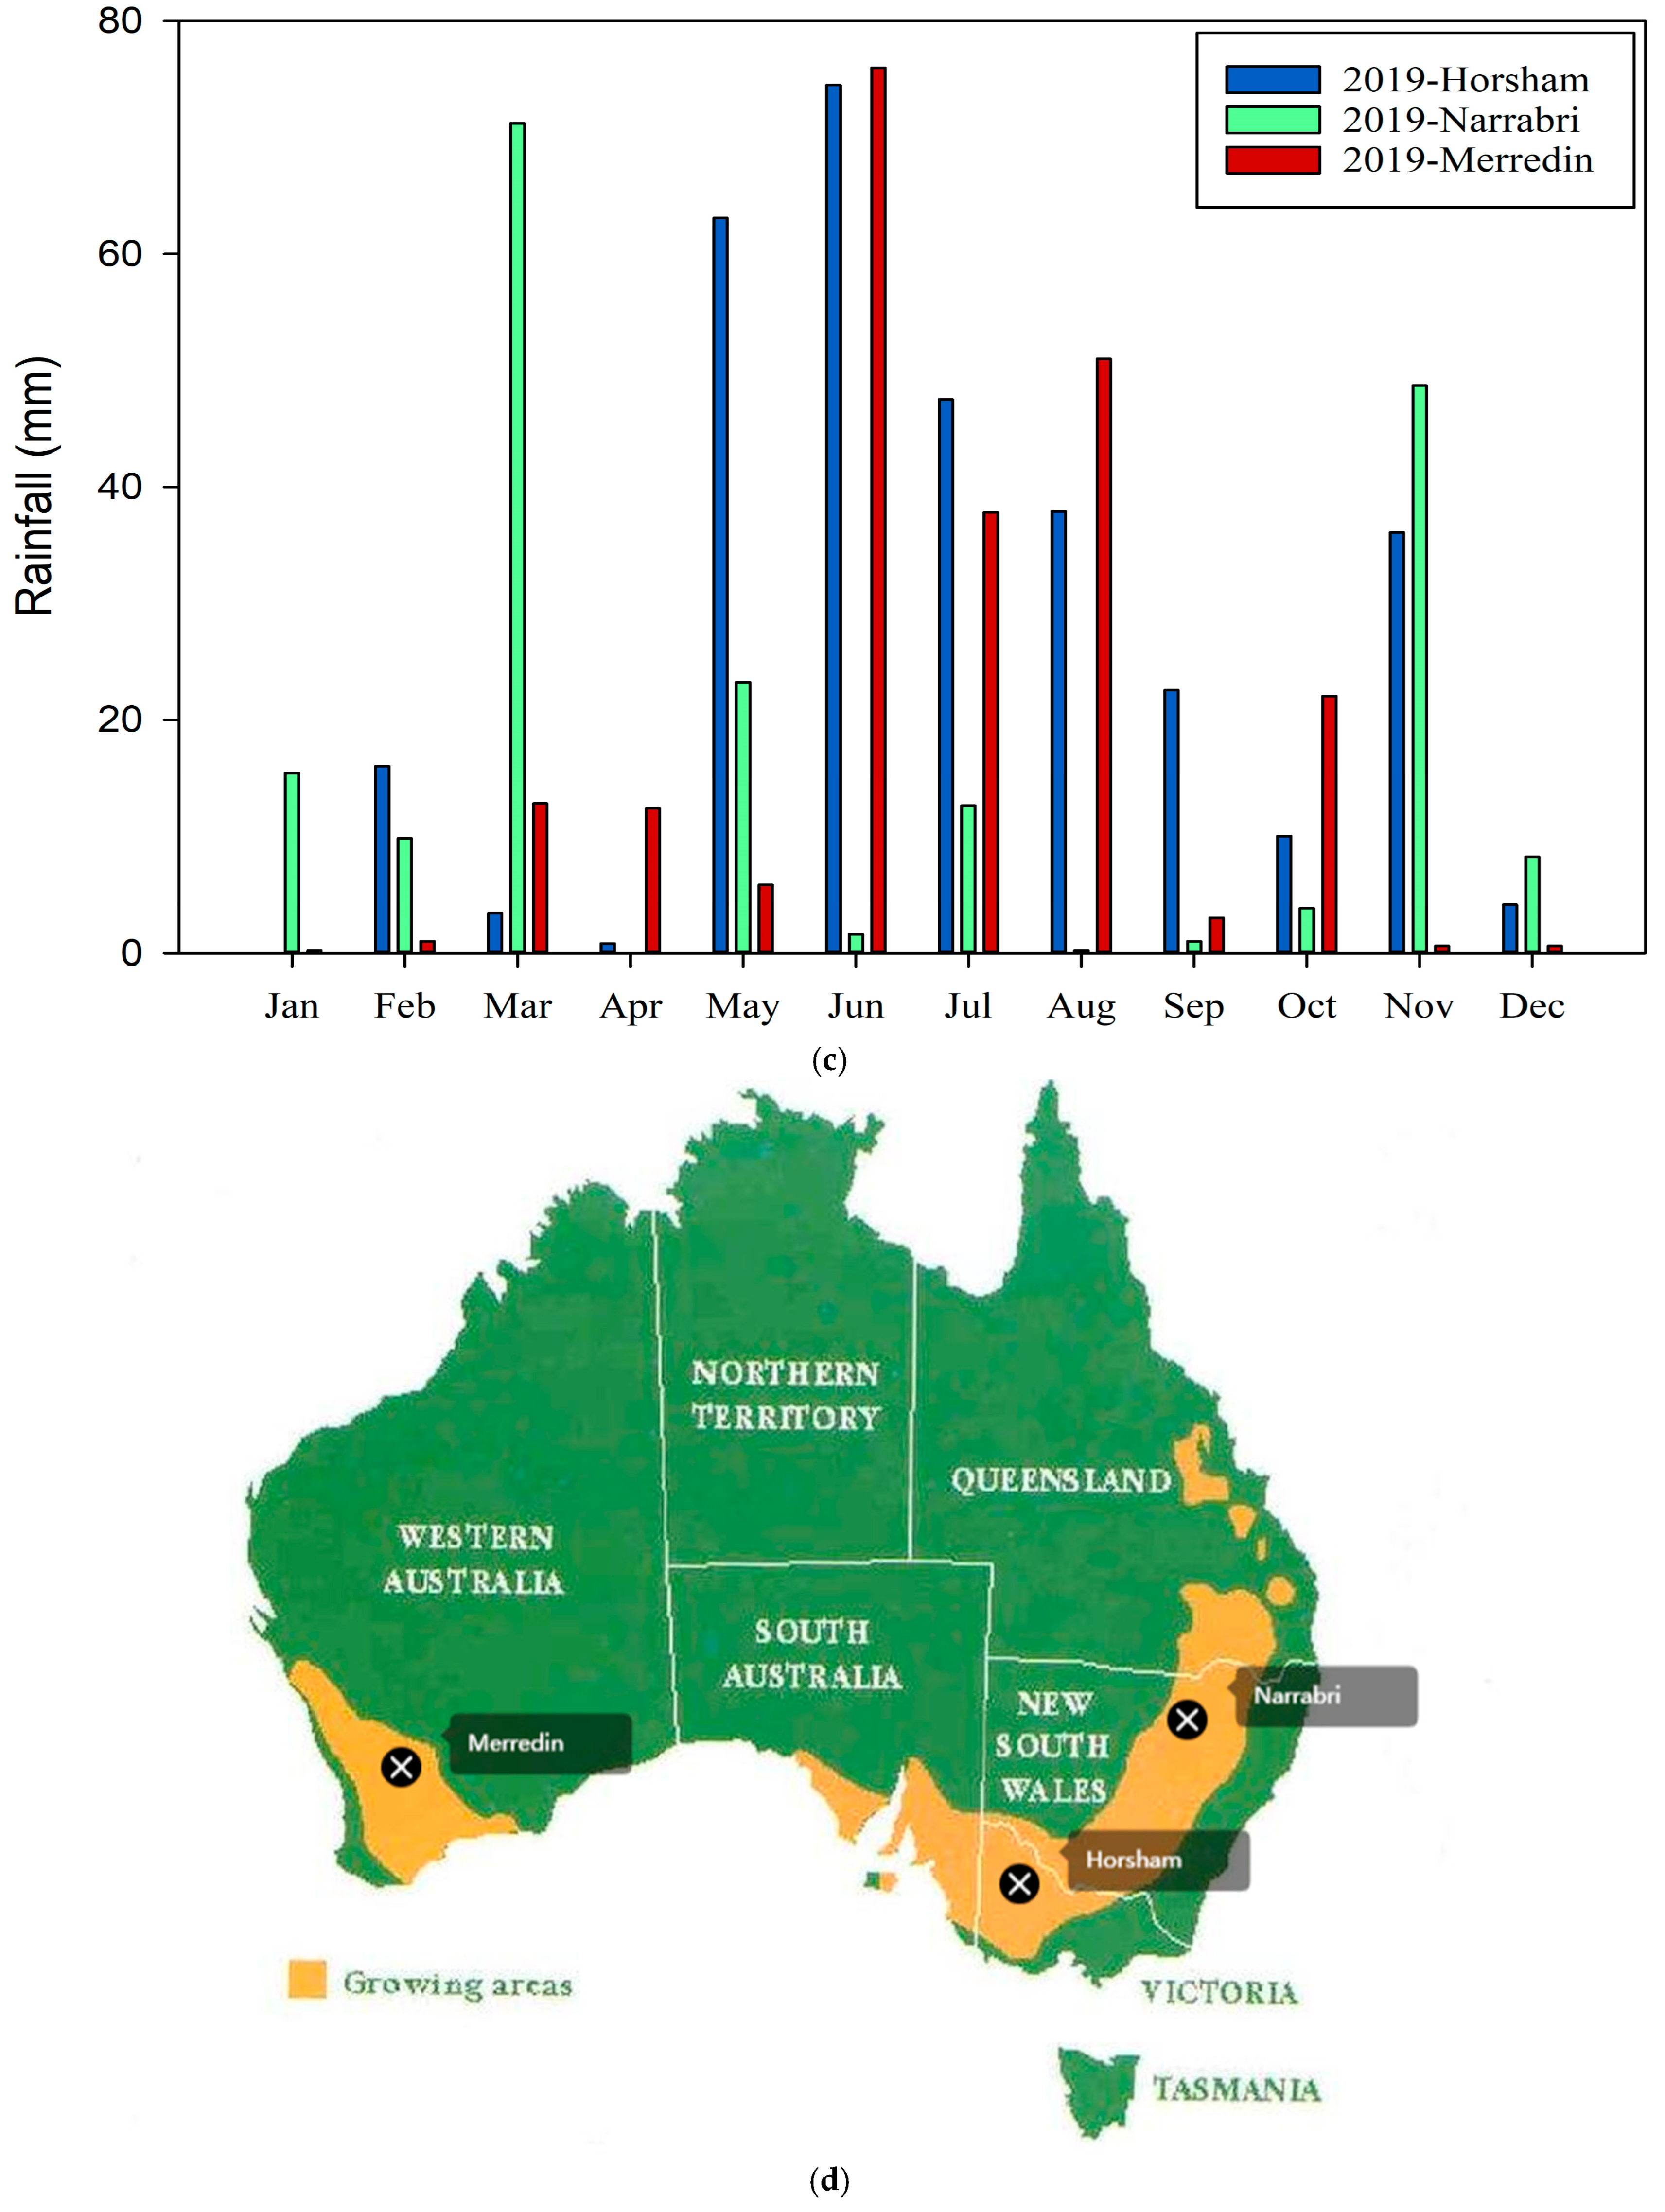
2.1. Field Experimental Design
2.2. Wheat Genotypes
2.3. Chemical Analyses
2.4. Statistical Analyses
3. Results
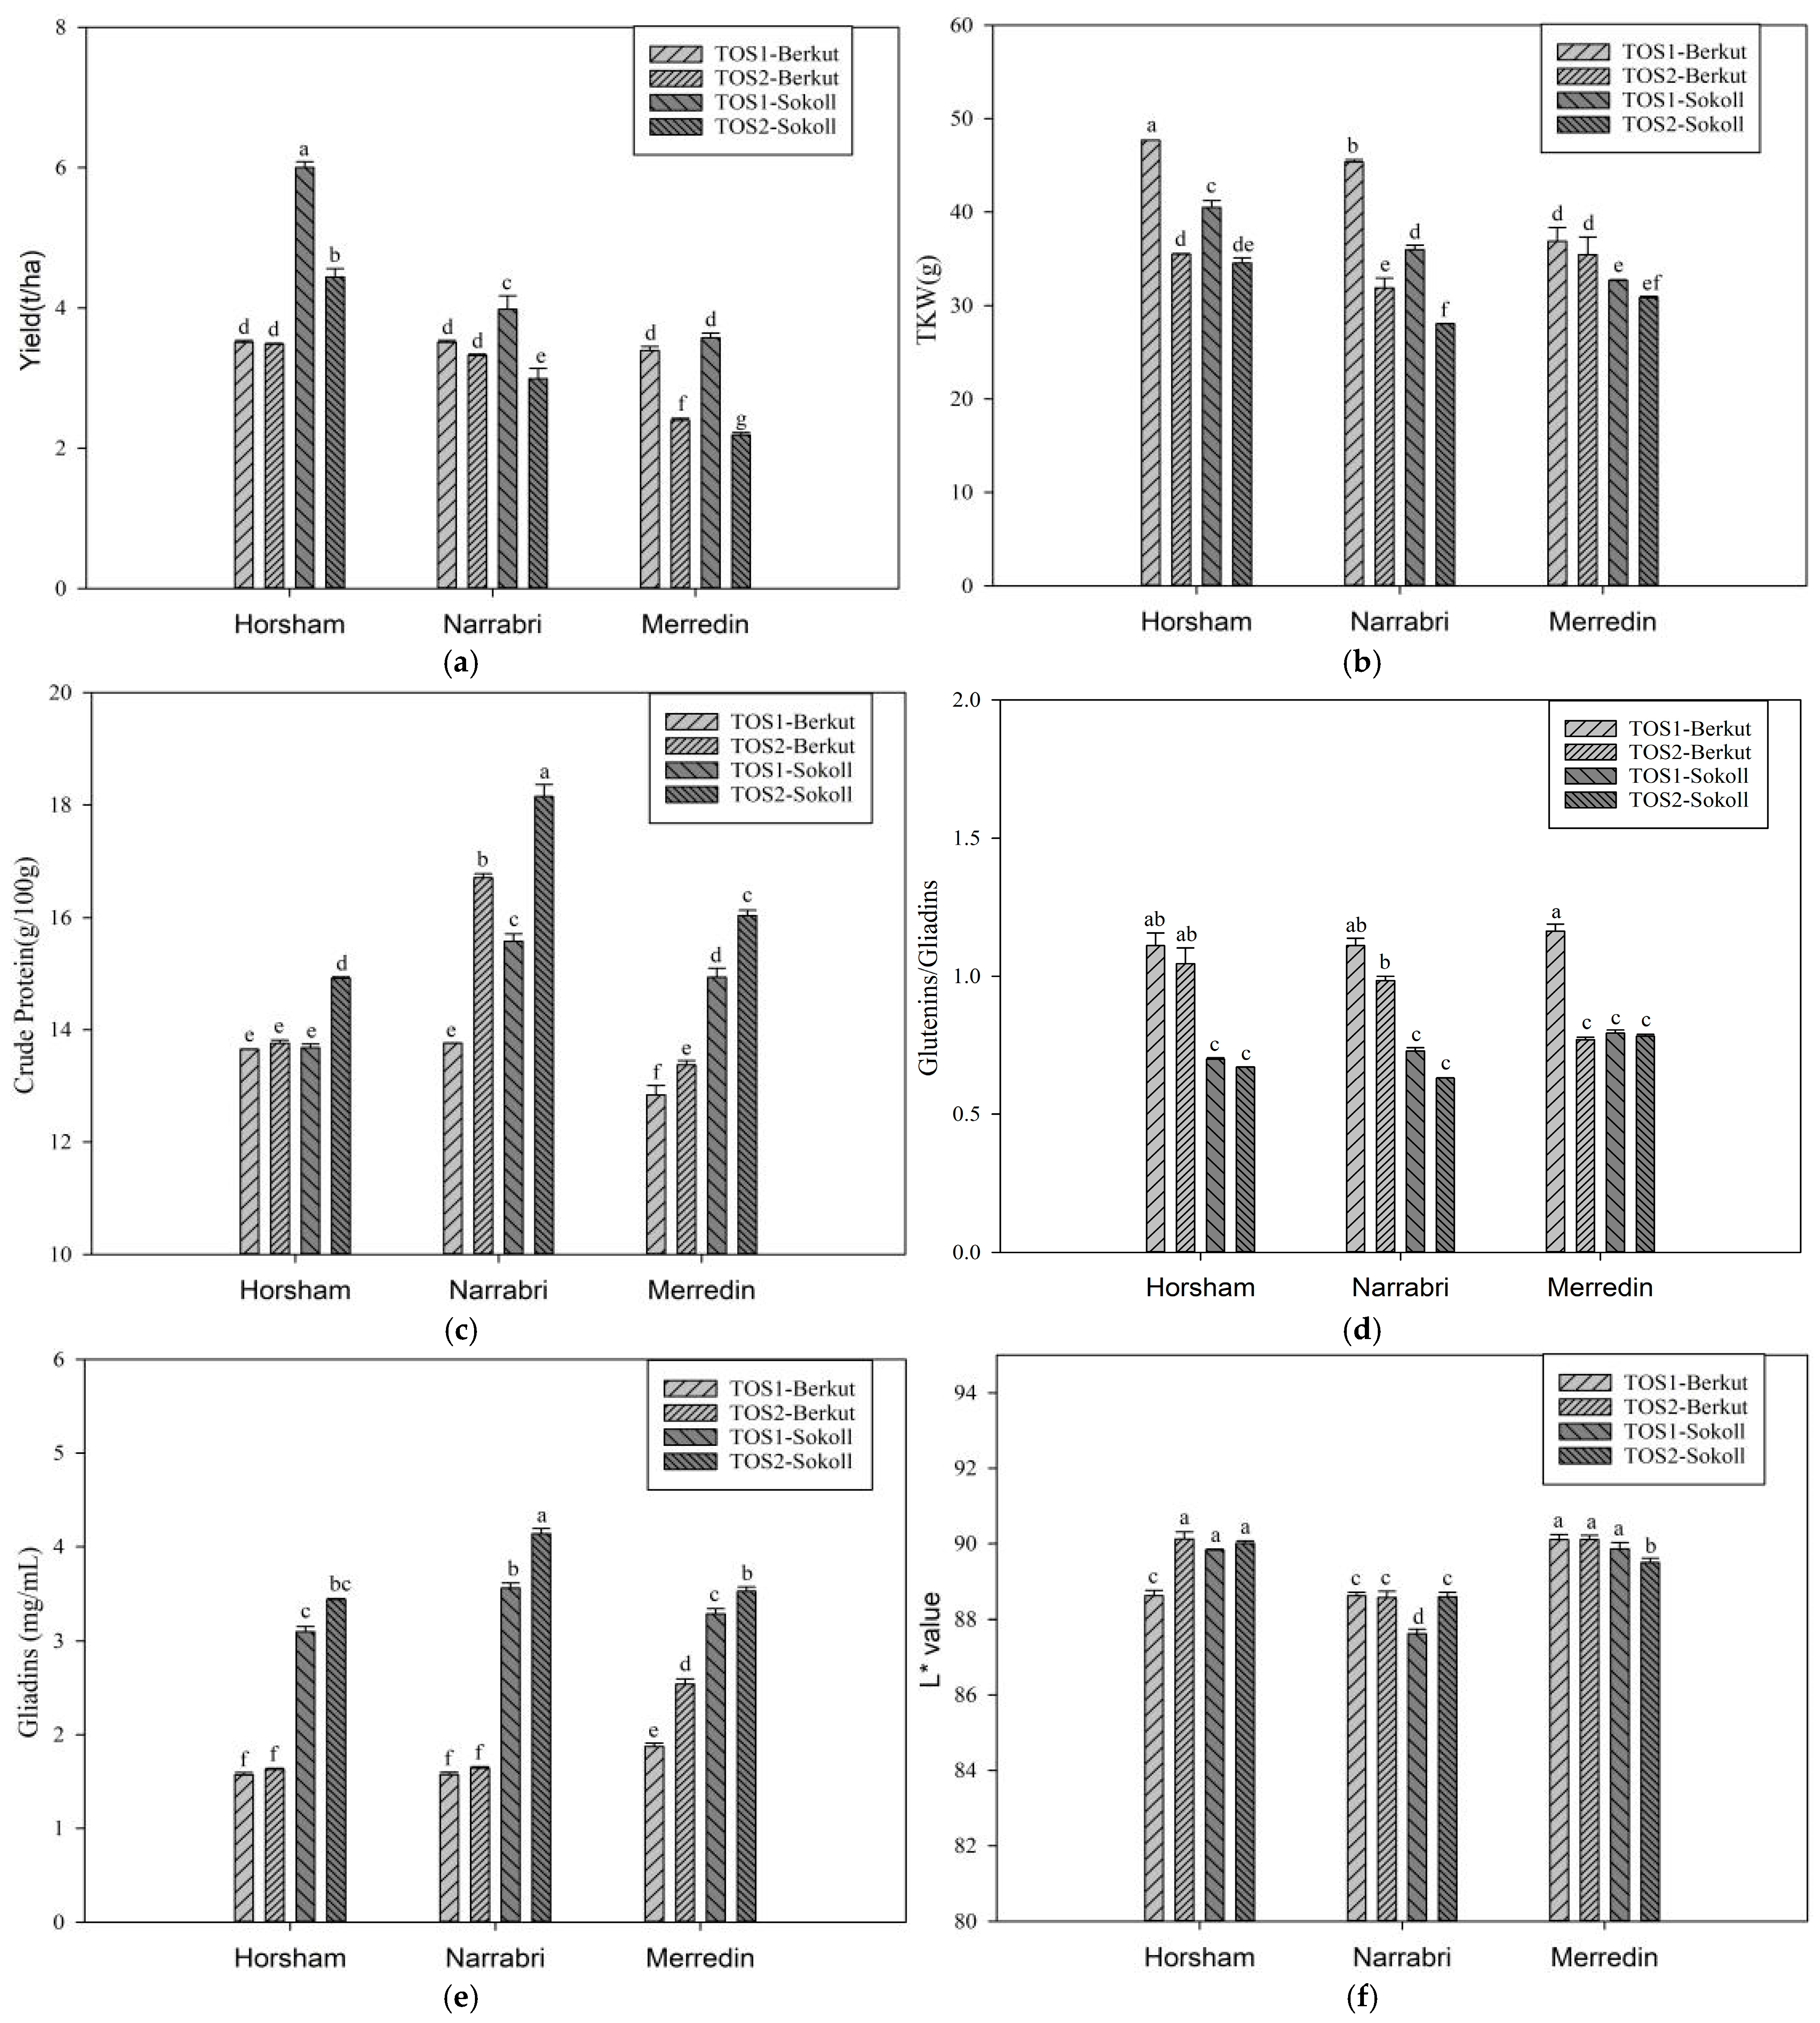
3.1. Experiment 1
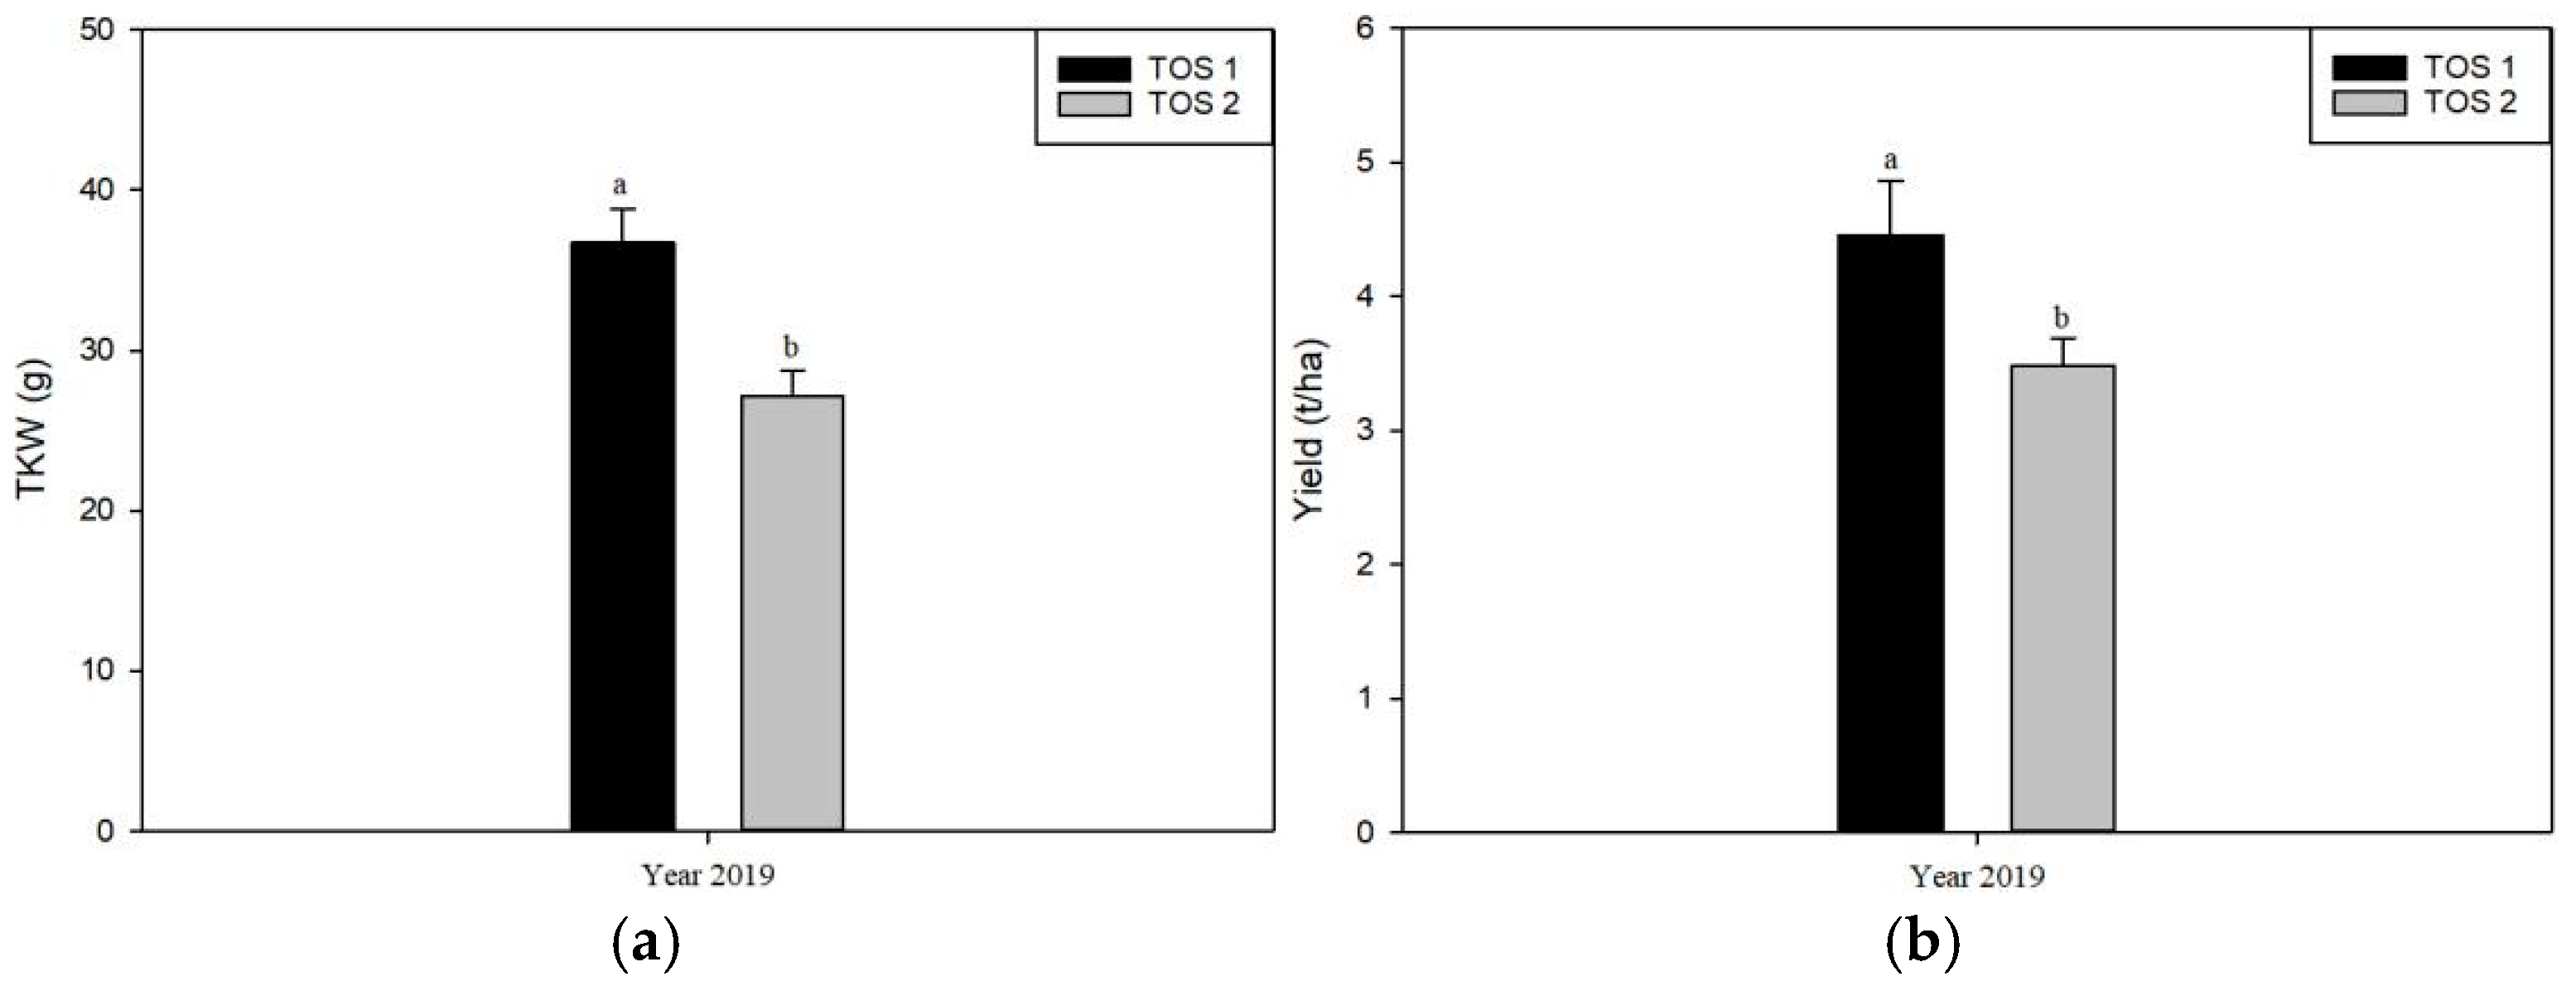
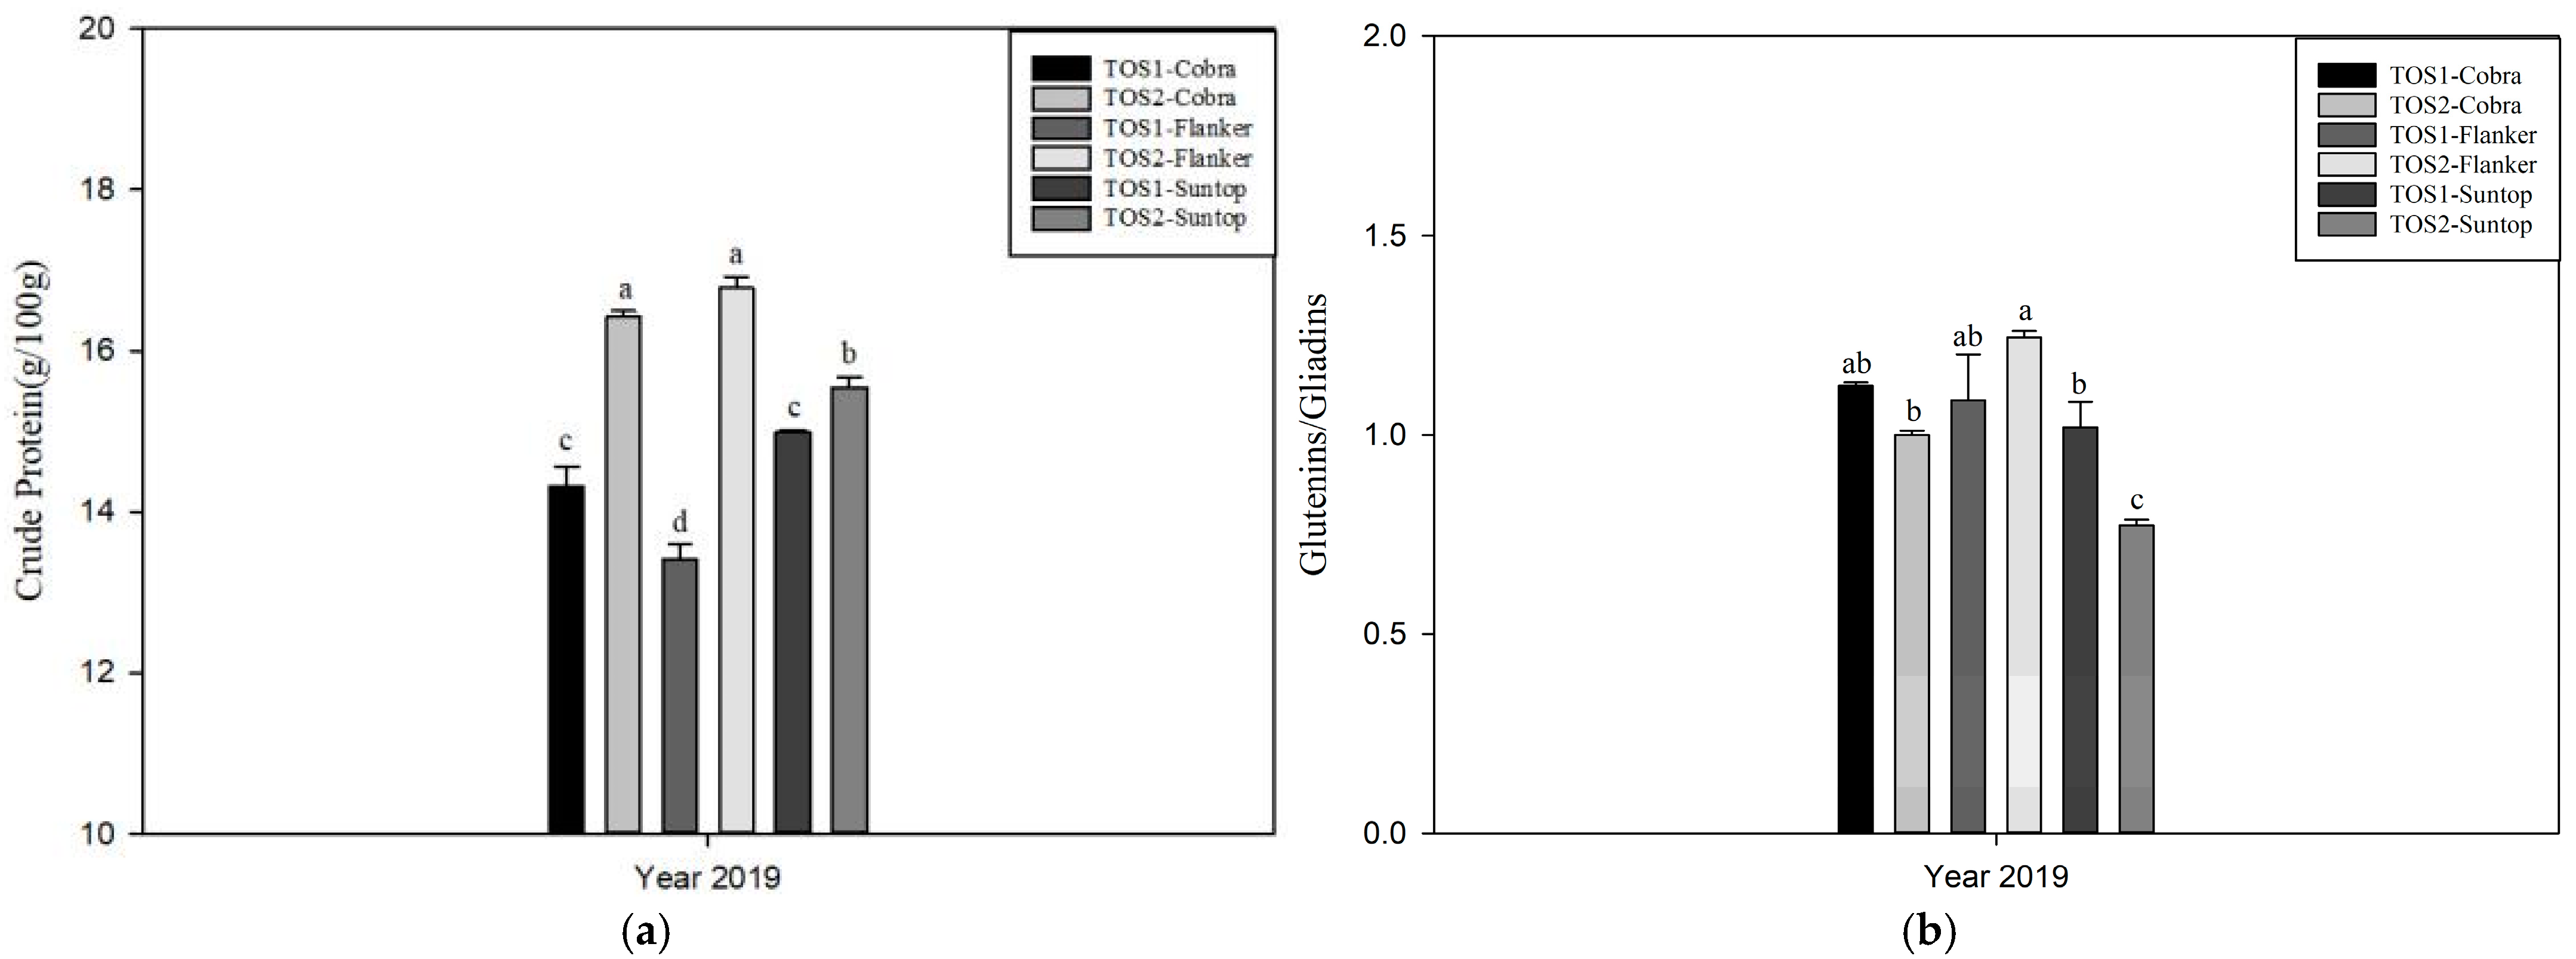
3.2. Experiment 2
4. Discussion
4.1. Impact of High Temperatures on Wheat Yield and Thousand Kernel Weight (TKW)
4.2. Impact of High Temperatures on Wheat Colour
4.3. Impact of High Temperatures on Wheat Protein Content and Composition
4.4. Future Prospects for Wheat Research
5. Conclusions
Author Contributions
Funding
Institutional Review Board Statement
Data Availability Statement
Acknowledgments
Conflicts of Interest
References
- Rivelli, G.M.; Calderini, D.F.; Abeledo, L.G.; Miralles, D.J.; Rondanini, D.P. Yield and quality traits of wheat and rapeseed in response to source–sink ratio and heat stress in post-flowering. Eur. J. Agron. 2024, 152, 127028. [Google Scholar] [CrossRef]
- Shi, J.; Ding, Z.; Ge, X.; Qiu, X.; Xu, J.; Xiao, L.; Liu, L.; Tang, L.; Cao, W.; Zhu, Y.; et al. Compound extreme heat and drought stress alter the spatial gradients of protein and starch in wheat grains. Agric. Water Manag. 2024, 303, 109049. [Google Scholar] [CrossRef]
- FAOSTAT. Food and Agricultural Data; Food and Agriculture Organization of the United Nations: Rome, Italy, 2021; Available online: http://www.fao.org/faostat/en/#home (accessed on 18 February 2025).
- Braun, H.J.; Atlin, G.; Payne, T. Multi-location testing as a tool to identify plant response to global climate change. In Climate Change and Crop Production; Reynolds, M.P., Ed.; Centre for Agriculture and Bioscience International: Wallingford, UK, 2010; Volume 1, pp. 115–138. [Google Scholar]
- Gupta, N.K.; Agarwal, S.; Agarwal, V.P.; Nathawat, N.S.; Gupta, S.; Singh, G. Effect of short-term heat stress on growth, physiology and antioxidative defence system in wheat seedlings. Acta Physiol. Plant. 2013, 35, 1837–1842. [Google Scholar] [CrossRef]
- Zhao, C.; Liu, B.; Piao, S.; Wang, X.; Lobell, D.B.; Huang, Y.; Huang, M.T.; Yao, Y.T.; Bassu, S.; Ciais, P.; et al. Temperature increase reduces global yields of major crops in four independent estimates. Proc. Natl. Acad. Sci. USA 2017, 114, 9326–9331. [Google Scholar] [CrossRef] [PubMed]
- Asseng, S.; Foster, I.A.N.; Turner, N.C. The impact of temperature variability on wheat yields. Glob. Change Biol. 2011, 17, 997–1012. [Google Scholar] [CrossRef]
- Wieser, H.; Koehler, P.; Scherf, K.A. The two faces of wheat. Front. Nutr. 2020, 7, 517313. [Google Scholar] [CrossRef] [PubMed]
- Savill, G.P.; Michalski, A.; Powers, S.J.; Wan, Y.; Tosi, P.; Buchner, P.; Hawkesford, M.J. Temperature and nitrogen supply interact to determine protein distribution gradients in the wheat grain endosperm. J. Exp. Bot. 2018, 69, 3117–3126. [Google Scholar] [CrossRef] [PubMed]
- Zhao, K.; Tao, Y.; Liu, M.; Yang, D.; Zhu, M.; Ding, J.; Zhu, X.; Guo, W.; Zhou, G.; Li, C. Does temporary heat stress or low temperature stress similarly affect yield, starch, and protein of winter wheat grain during grain filling? Cereal Sci. 2022, 103, 103408. [Google Scholar] [CrossRef]
- Zhao, H.; Dai, T.; Jiang, D.; Cao, W. Effects of high temperature on key enzymes involved in starch and protein formation in grains of two wheat cultivars. J. Agron. Crop Sci. 2008, 194, 47–54. [Google Scholar] [CrossRef]
- Gooding, M.J.; Ellis, R.H.; Shewry, P.R.; Schofield, J.D. Effects of restricted water availability and increased temperature on the grain filling, drying and quality of winter wheat. J. Cereal Sci. 2003, 37, 295–309. [Google Scholar] [CrossRef]
- Wan, C.; Dang, P.; Gao, L.; Wang, J.; Tao, J.; Qin, X.; Feng, B.; Gao, J. How Does the environment affect wheat yield and protein content response to drought? A meta-analysis. Front. Plant Sci. 2022, 13, 896985. [Google Scholar] [CrossRef] [PubMed]
- Saini, P.; Kaur, H.; Tyagi, V.; Saini, P.; Ahmed, N.; Dhaliwal, H.S.; Sheikh, I. Nutritional value and end-use quality of durum wheat. Cereal Res. Commun. 2023, 51, 283–294. [Google Scholar] [CrossRef]
- Shewry, P.R.; Belton, P.S. What do we really understand about wheat gluten structure and functionality? J. Cereal Sci. 2024, 117, 103895. [Google Scholar] [CrossRef]
- Blumenthal, C.S.; Barlow EW, R.; Wrigley, C.W. Growth environment and wheat quality: The effect of heat stress on dough properties and gluten proteins. J. Cereal Sci. 1993, 18, 3–21. [Google Scholar] [CrossRef]
- Tabbita, F.; Ammar, K.; Ibba, M.I.; Andrade, F.; Maccaferri, M.; Sanguineti, M.C.; Tuberosa, R.; Guzmán, C. Response to heat stress and glutenins allelic variation effects on quality traits in durum wheat. J. Agron. Crop Sci. 2024, 210, e12686. [Google Scholar] [CrossRef]
- Padarian Campusano, J.S. Provision of Soil Information for Biophysical Modelling. Master’s Thesis, University of Sydney, Sydney, Australia, 2014. [Google Scholar]
- Hughes, R.J.; Khoddami, A.; Chrystal, P.V.; Crawford, A.P.; Liu, S.Y.; Selle, P.H. Potential of CIELAB colour scores to gauge the quality of sorghum as a feed grain for chicken-meat production. Anim. Prod. Sci. 2020, 60, 930–935. [Google Scholar] [CrossRef]
- Hwang, S.H.; Koo, M.; Jo, S.; Cho, Y.S. A comparison study of crude protein contents obtained utilizing the kjeldahl method and dumas combustion method in foods. Anal. Sci. Technol. 2020, 33, 143–150. [Google Scholar]
- Smith, P.E.; Krohn, R.I.; Hermanson, G.T.; Mallia, A.K.; Gartner, F.H.; Provenzano, M.; Klenk, D.C. Measurement of protein using bicinchoninic acid. Anal. Biochem. 1985, 150, 76–85. [Google Scholar] [CrossRef]
- Ullah, A.; Nadeem, F.; Nawaz, A.; Siddique, K.H.; Farooq, M. Heat stress effects on the reproductive physiology and yield of wheat. J. Agron. Crop Sci. 2022, 208, 1–17. [Google Scholar] [CrossRef]
- Shew, A.M.; Tack, J.B.; Nalley, L.L.; Chaminuka, P. Yield reduction under climate warming varies among wheat cultivars in South Africa. Nat. Commun. 2020, 11, 4408. [Google Scholar] [CrossRef]
- Dias, A.S.; Lidon, F.C. Evaluation of grain filling rate and duration in bread and durum wheat, under heat stress after anthesis. J. Agron. Crop Sci. 2009, 195, 137–147. [Google Scholar] [CrossRef]
- Shirdelmoghanloo, H.; Cozzolino, D.; Lohraseb, I.; Collins, N.C. Truncation of grain filling in wheat (Triticum aestivum) triggered by brief heat stress during early grain filling: Association with senescence responses and reductions in stem reserves. Funct. Plant Biol. 2016, 43, 919–930. [Google Scholar] [CrossRef] [PubMed]
- Dhaka, V.; Khatkar, B.S. Effects of gliadin/glutenin and HMW-GS/LMW-GS ratio on dough rheological properties and bread-making potential of wheat varieties. J. Food. Qual. 2015, 38, 71–82. [Google Scholar] [CrossRef]
- Hurkman, W.J.; McCue, K.F.; Altenbach, S.B.; Korn, A.; Tanaka, C.K.; Kothari, K.M.; DuPont, F.M. Effect of temperature on expression of genes encoding enzymes for starch biosynthesis in developing wheat endosperm. Plant Sci. 2003, 164, 873–881. [Google Scholar] [CrossRef]


| Cultivar | Flanker | Berkut | Suntop | Sokoll | Cobra |
|---|---|---|---|---|---|
| Rating | Highly tolerant | High | Medium | Medium | Sensitive |
| Soil Characteristics | Horsham | Narrabri | Merredin |
|---|---|---|---|
| Soil Type | Grey Vertosol | Grey Vertosol | Orthic Tenosol |
| Texture | Clay | Clay | Sandy Loam |
| PAWC (Plant Available Water Capacity) (mm/m) [18] | 160.6 | 158.7 | 132.9 |
| Organic Carbon (%) | 1.13 | 0.63 | 0.96 |
| Nitrate Nitrogen (mg/kg) (soil extract) | 19.0 | 11.5 | 20.0 |
| Phosphorus—Colwell (mg/kg) (soil extract) | 70.5 | 66.5 | 42.0 |
| Organic Matter (OM) % | 1.95 | 1.05 | 1.65 |
| Total Ca (%) | 0.74 | 0.46 | 0.18 |
| Total Mg (%) | 0.70 | 0.63 | 0.20 |
| Total Na (%) | 0.075 | 0.039 | 0.025 |
| Total K (%) | 0.76 | 0.36 | 0.30 |
| pH (1:5 Water) | 8.65 | 8.65 | 6.00 |
| pH (1:5 CaCl2) | 7.9 | 7.6 | 5.5 |
| Effect | Loc (Location) | TOS | Var (Variety) | Loc × TOS | Loc × Var | TOS × Var | Loc × TOS × Var |
|---|---|---|---|---|---|---|---|
| Yield | <0.001 | <0.001 | <0.001 | <0.001 | <0.001 | <0.001 | <0.001 |
| Thousand kernel weight (TKW) | <0.001 | <0.001 | <0.001 | <0.001 | NS | <0.001 | 0.011 |
| Crude protein | <0.001 | <0.001 | <0.001 | <0.001 | <0.001 | 0.027 | 0.012 |
| Glutenins/gliadins | NS | <0.001 | <0.001 | 0.01 | <0.001 | <0.001 | 0.002 |
| Gliadins | <0.001 | <0.001 | <0.001 | 0.041 | <0.001 | NS | <0.001 |
| Glutenins | <0.001 | NS | <0.001 | NS | <0.001 | 0.002 | NS |
| Albumin | 0.016 | <0.001 | NS | NS | NS | 0.001 | NS |
| Globulin | NS | NS | <0.001 | NS | NS | NS | NS |
| L* Value | <0.001 | <0.001 | NS | <0.001 | <0.001 | NS | <0.001 |
| a* Value | <0.001 | <0.001 | <0.001 | <0.001 | <0.001 | NS | <0.001 |
| b* Value | <0.001 | 0.003 | <0.001 | <0.001 | <0.001 | <0.001 | <0.001 |
| Grain filling to maturity | <0.001 | <0.001 | NS | <0.001 | NS | NS | NS |
| Sowing to maturity | <0.001 | <0.001 | NS | <0.001 | 0.019 | NS | NS |
| Yield | TKW | Crude Protein | Glutenins/Gliadins | Gliadins | Glutenins | Albumin | Globulin | L* | a* | b* | Grain Filling to Maturity | Sowing to Maturity | ||
|---|---|---|---|---|---|---|---|---|---|---|---|---|---|---|
| Yield | r = | 1 | ||||||||||||
| p = | ||||||||||||||
| TKW | r = | NS | 1 | |||||||||||
| p = | ||||||||||||||
| Crude protein | r = | NS | −0.665 | 1 | ||||||||||
| p = | <0.001 | |||||||||||||
| Glutenins/Gliadins | r = | NS | NS | NS | 1 | |||||||||
| p = | ||||||||||||||
| Gliadins | r = | NS | −0.418 | NS | −0.909 | 1 | ||||||||
| p = | 0.042 | <0.001 | ||||||||||||
| Glutenins | r = | NS | −0.433 | NS | −0.6604 | 0.899 | 1 | |||||||
| p = | 0.035 | <0.001 | <0.001 | |||||||||||
| Albumin | r = | NS | NS | NS | NS | NS | NS | 1 | ||||||
| p = | ||||||||||||||
| Globulin | r = | NS | NS | NS | 0.639 | −0.709 | −0.683 | NS | 1 | |||||
| p = | <0.001 | <0.001 | 0.001 | |||||||||||
| L* | r = | NS | NS | −0.507 | NS | NS | NS | 0.463 | NS | 1 | ||||
| p = | 0.011 | 0.023 | ||||||||||||
| a* | r = | NS | NS | NS | NS | NS | NS | −0.436 | NS | −0.77 | 1 | |||
| p = | 0.033 | <0.001 | ||||||||||||
| b* | r = | NS | −0.724 | 0.574 | NS | NS | NS | NS | NS | NS | NS | 1 | ||
| p = | <0.001 | 0.003 | ||||||||||||
| Grain filling to maturity | r = | NS | NS | NS | NS | NS | NS | NS | NS | −0.473 | 0.745 | −0.601 | 1 | |
| p = | 0.019 | <0.001 | 0.002 | |||||||||||
| Sowing to maturity | r = | NS | NS | NS | NS | NS | NS | NS | NS | −0.534 | 0.719 | −0.432 | 0.935 | 1 |
| p = | 0.007 | <0.001 | 0.035 | <0.001 |
| Effect | TOS | Variety | TOS × Variety |
|---|---|---|---|
| Yield | 0.027 | NS | NS |
| TKW | 0.001 | NS | NS |
| Crude protein | <0.001 | <0.001 | <0.001 |
| Glutenins/gliadins | NS | 0.001 | 0.006 |
| Gliadins | <0.001 | <0.001 | 0.024 |
| Glutenins | <0.001 | 0.002 | 0.024 |
| Albumin | 0.024 | <0.001 | NS |
| Globulin | 0.045 | <0.001 | <0.001 |
| L* Value | <0.001 | <0.001 | NS |
| a* Value | <0.001 | <0.001 | 0.01 |
| b* Value | <0.001 | <0.001 | NS |
| Grain filling to maturity | <0.001 | 0.02 | NS |
| Sowing to maturity | <0.001 | NS | NS |
| Yield | TKW | Crude Protein | Glutenins/Gliadins | Gliadins | Glutenins | Albumin | Globulin | L* | a* | b* | Grain Filling to Maturity | Sowing to Maturity | ||
|---|---|---|---|---|---|---|---|---|---|---|---|---|---|---|
| Yield | r = | 1 | ||||||||||||
| p = | ||||||||||||||
| TKW | r = | 0.753 | 1 | |||||||||||
| p = | 0.005 | |||||||||||||
| Crude protein | r = | NS | NS | 1 | ||||||||||
| p = | ||||||||||||||
| Glutenins/Gliadins | r = | NS | NS | NS | 1 | |||||||||
| p = | ||||||||||||||
| Gliadins | r = | NS | NS | NS | −0.898 | 1 | ||||||||
| p = | <0.001 | |||||||||||||
| Glutenins | r = | 0.621 | 0.597 | NS | NS | 0.747 | 1 | |||||||
| p = | 0.031 | 0.04 | 0.005 | |||||||||||
| Albumin | r = | NS | NS | NS | NS | NS | NS | 1 | ||||||
| p = | ||||||||||||||
| Globulin | r = | NS | NS | NS | NS | NS | NS | 0.58 | 1 | |||||
| p = | 0.048 | |||||||||||||
| L* | r = | NS | NS | NS | 0.629 | −0.703 | NS | NS | NS | 1 | ||||
| p = | 0.029 | 0.011 | ||||||||||||
| a* | r = | NS | NS | NS | −0.598 | NS | NS | NS | NS | −0.591 | 1 | |||
| p = | 0.04 | 0.043 | ||||||||||||
| b* | r = | NS | NS | NS | NS | 0.621 | NS | NS | NS | −0.924 | 0.761 | 1 | ||
| p = | 0.031 | <0.001 | 0.004 | |||||||||||
| Grain filling to maturity | r= | 0.656 | 0.801 | NS | NS | 0.65 | 0.716 | NS | NS | −0.736 | NS | 0.637 | 1 | |
| p= | 0.021 | 0.002 | 0.022 | 0.009 | 0.006 | 0.026 | ||||||||
| Sowing to maturity | r= | 0.699 | 0.798 | NS | −0.787 | 0.82 | 0.657 | NS | NS | −0.689 | NS | 0.613 | 0.91 | 1 |
| p= | 0.012 | 0.002 | 0.002 | 0.001 | 0.02 | 0.013 | 0.034 | <0.001 |
Disclaimer/Publisher’s Note: The statements, opinions and data contained in all publications are solely those of the individual author(s) and contributor(s) and not of MDPI and/or the editor(s). MDPI and/or the editor(s) disclaim responsibility for any injury to people or property resulting from any ideas, methods, instructions or products referred to in the content. |
© 2025 by the authors. Licensee MDPI, Basel, Switzerland. This article is an open access article distributed under the terms and conditions of the Creative Commons Attribution (CC BY) license (https://creativecommons.org/licenses/by/4.0/).
Share and Cite
Bai, Y.; Khoddami, A.; Messina, V.; Zhang, Z.; Tan, D.K.Y. Response of Wheat Genotypes Stressed by High Temperature in Terms of Yield and Protein Composition Across Diverse Environments in Australia. Agriculture 2025, 15, 514. https://doi.org/10.3390/agriculture15050514
Bai Y, Khoddami A, Messina V, Zhang Z, Tan DKY. Response of Wheat Genotypes Stressed by High Temperature in Terms of Yield and Protein Composition Across Diverse Environments in Australia. Agriculture. 2025; 15(5):514. https://doi.org/10.3390/agriculture15050514
Chicago/Turabian StyleBai, Yunlong, Ali Khoddami, Valeria Messina, Zhao Zhang, and Daniel K. Y. Tan. 2025. "Response of Wheat Genotypes Stressed by High Temperature in Terms of Yield and Protein Composition Across Diverse Environments in Australia" Agriculture 15, no. 5: 514. https://doi.org/10.3390/agriculture15050514
APA StyleBai, Y., Khoddami, A., Messina, V., Zhang, Z., & Tan, D. K. Y. (2025). Response of Wheat Genotypes Stressed by High Temperature in Terms of Yield and Protein Composition Across Diverse Environments in Australia. Agriculture, 15(5), 514. https://doi.org/10.3390/agriculture15050514