Article

Multi Standardized Precipitation Evapotranspiration Index (Multi-SPEI-ETo): Evaluation of 40 Empirical Methods and Their Influence in SPEI

by
Tariacuri Marquez-Alvarez
,
Joel Hernandez Bedolla
*,
Jesus Pardo-Loaiza
,
Benjamín Lara-Ledesma
and
Constantino Domínguez-Sánchez
*
Faculty of Civil Engineering, Michoacan University of Saint Nicolas of Hidalgo, Morelia 58030, Mexico
*
Authors to whom correspondence should be addressed.
Agriculture 2025, 15(7), 703; https://doi.org/10.3390/agriculture15070703
Submission received: 17 January 2025 / Revised: 4 February 2025 / Accepted: 21 February 2025 / Published: 26 March 2025

Abstract

:
Reference evapotranspiration (ETo) refers to the combined processes of evaporation and transpiration, which are relevant for hydrology, climate change research, and irrigation system design. The ETo is considered for different climatological studies, agriculture-focused studies, drought indices and climate change as well. From the ETo, water needs can be obtained, and along with precipitation, it is important to determine water availability and drought indices like the Standardized Precipitation Evapotranspiration Index (SPEI). Currently, there are different methods to estimate the ETo based on various climatic variables, which have been proposed for different climates and applied in different regions worldwide. The method standardized by most studies for determining the ETo is the “modified Penman–Monteith” method by the Food and Agriculture Organization (FAO). This method is versatile as it considers different climatic conditions and global latitudes. Due to limited climate data in developing countries like Mexico, alternative methods are used. The present study analyzed 40 comparative methods for determining ETo and their influence on SPEI. The best methods for the study area were chosen, including Hansen, Hargreaves and Samani, and Trajkovic, as they are the best based on the available information in Mexico. Additionally, each equation was adjusted to reduce errors and achieve closer approximations to actual ETo values to obtain the most accurate values possible. The influence on SPEI calculation indicates overestimations in temperature-based methods and underestimations in radiation and mass-transfer-based methods. The SPEI calculation showed fewer errors when using the modified HANSEN equations. In the absence of information, Allen’s temperature-based method is recommended.

1. Introduction

Several variables collectively contribute to accurately assessing studies centered on evapotranspiration, including temperature, precipitation, solar radiation, and crop type [1,2]. In irrigation research, key factors such as planting frequency, the area designated for cultivation, and water availability are considered [3,4,5]. The concept of evapotranspiration encompasses reference evapotranspiration (ETo), which is contingent upon specific climatological parameters and the regions being examined [6]. Characterizing ETo and its climatic causes will contribute to the estimation of the atmospheric water cycle under climate change [7].
The Penman–Monteith method is the most widely utilized worldwide [8,9,10,11]. It is the most accepted method [12,13,14,15] due to its reliance on various climatological variables, making it applicable to diverse climate types with greater precision in calculating ETo [16,17,18,19,20]. Numerous methods exist for estimating ETo, each dependent on different climatic variables available in their development and application regions. Consequently, the availability of information is a critical factor in selecting and applying a specific method. Methods exist for estimating annual, monthly, daily, and even hourly evapotranspiration. Monthly methods include Blaney–Criddle [21] and more straightforward methods used in Mexico, such as the Thornthwaite method [22]. However, monthly methods do not capture climatic variability with sufficient accuracy. Therefore, it is imperative to use daily-scale methods.
Droughts have caused significant global issues due to water scarcity. The Standardized Precipitation Evapotranspiration Index (SPEI) was developed to assess droughts and has also been utilized in climate change studies [23].
The normalization functions used include normal (NOR), generalized extreme value (GEV), Pearson Type III (PE3), and generalized logistic (GLO) [24,25,26,27,28]. Among these functions, GEV performs best for extremes compared to the GLO function [29]. However, the GLO function has also been widely applied in China and other regions [30,31].
Machine learning methods such as extreme gradient boosting, support vector machines, and bias random forests have also been implemented [32]. Furthermore, copula functions with notable performance have been proposed [33].
In this research, Multi-SPEI-ETo is proposed to evaluate 40 methods for obtaining evapotranspiration with and without climatic information, as well as its influence on the calculation of the SPEI. The necessary algorithms were programmed in MATLAB R2023a [34] software to be applied to different study areas and types of climates.

2. Materials and Methods

Daily-scale evapotranspiration methods include those based on (1) mass transfer, (2) temperature, and (3) radiation [2].

2.1. Methods Based on Temperature (°C)

Methods based on temperature are the most widely utilized for estimating ETo due to their simplicity and the specific temperature requirements needed for their development. These methods stem from extensive comparisons of the relationship between precipitation, temperature, and hydrological changes [2,35,36].
Hargreaves and Samani [36], developed in Davis, California, has been applied in various regions of the United States, including Lompoc, California, and Seabrook, New Jersey, as well as in countries like Australia and Haiti. Trajkovic [37]. This method identifies the shortcomings of the FAO and Hargreaves methods. It was initially applied in the Western Balkans region in southeastern Europe. This method was compared in regions predominantly characterized by humid climates, including Varazdin, Croatia; Zagreb, Croatia; Bihac, Bosnia; Novi Sad, Serbia; Negotin, Serbia; Kragujevac, Serbia; Niš, Serbia; and Vranje, Serbia. Tabari and Talaee-1 [38]. This method compared the FAO methods of Tabari and Talaee-1 and Hargreaves. Tabari and Talaee’s approach was developed in the arid and cold climates of Kerman and Kurdistan provinces in Iran. This method has also been applied successfully in contrasting climates, such as Colombia’s humid and warm conditions [39]. Tabari and Talaee-2 [38]. As this method was developed in Iran’s arid and cold climates, the original formula was adjusted with constant coefficients depending on the specific zones. Despite these adjustments, it produced consistent ETo values. This method has been successfully applied in various countries, including Indonesia [40] and Bangladesh [40]. Droogers and Allen-1 [41]. This method aimed to refine the original Hargreaves and FAO methodologies. Utilizing global climate data, it facilitated enhanced comparisons with the aforementioned methods. Initially applied in climates akin to Davis, California, it has seen implementation in northern Mexico [42] and China [43]. Droogers and Allen-2 [41]. Similar to the first in climates such as Hargreaves, this method requires correction in humid regions [44]. Berti [45]. Berti observed that the FAO and Hargreaves methods are applicable as long as meteorological data are available. Consequently, Berti recalibrated the Hargreaves equation, which was subsequently applied in the northeastern region of Italy, Veneto. Ugyen Dorji [46]. The Dorji method was initially applied in the Bhutan region of Switzerland but has since been adapted for use in the Himalayan region, covering elevations ranging from 100 to 7550 m, which corresponds to the terrain of Bhutan. Robertson [47]. This method compares ETo under specific climatic conditions. The primary cities where this method has been implemented include Ottawa, Normandin, Swift Current, Lacombe, Beaverlodge, and Fort Simpson, all located in Canada. Ahooghalandari-1 [48]. This is the first method that incorporates considerations of extraterrestrial radiation, relative humidity, and average temperature. Originally developed and applied in western Australia, this method represents a significant advancement in the field. Ahooghalandari-2 [48]. The coefficient variation solely depends on an adjustment that competes with the FAO equation.

2.2. Methods Based on Solar Radiation

Methods based on solar radiation primarily require the maximum and minimum air temperatures and incoming solar radiation [2,38,39,49,50]. These methods are the most widely employed on both global and regional scales [49].
Makkink [51]. This method is designed explicitly for arid climates and has been successfully applied in regions such as Uzbekistan [52]. Priestley and Tayler [53]. The method was applied in Victoria, Australia, and developed explicitly for dry climates and regions [54]. Jensen and Haise [55]. The findings of this study indicate that solar radiation is the predominant factor influencing ETo. This methodology was initially developed in the western United States, specifically within the Columbia River Basin, as well as in Phoenix, Arizona, and Fresno, California. Hargreaves [56]. This method is specified for climates with distinct humidity levels, such as Venezuela, Nicaragua, and Ecuador. However, it has also been applied effectively in northern Brazil and Mexico. Due to the required variables for this method (precipitation, temperature, and solar radiation), it can be implemented in many areas [50]. Abtew-1 and 2 [57]. This method was applied in southeastern Florida, which is characterized by a humid climate [58]. Irmak 1 and 2 [59]. Based on the FAO and Priestley–Taylor methods, this approach developed two equations applicable to humid, arid, and coastal climates. It has been implemented in various locations in the United States, including Miami, Utah, Tifton, Tampa, and Gainesville. Oudin [47]. This method primarily relies on average temperature and solar radiation. It was developed in Canadian cities, including Ottawa, Normandin, Swift Current, Lacombe, and Beaverlodge. The Oudin method has also been effectively applied in African regions [60].

2.3. Methods Based on Mass Transfer

Mass transfer methods, also known as “aerodynamic methods”, focus on the transfer of water vapor from the evaporating surface to the atmosphere [2,38,49,61,62,63].
Dalton [2] identified wind speed and humidity as the primary variables influencing ETo. No specific location exists where this method was initially developed [2]. This equation was developed for dry, humid, and desert climates with high relative humidity [63]. This method has been applied in Peninsular Malaysia [64]. Rohwer observed a direct relationship between evaporation and vapor pressure difference during periods of constant wind [65]. This method is considered aerodynamic and has been effectively developed in various climatic zones in China [66]. This method was developed in the Indo-Pacific region, particularly in areas adjacent to water bodies. To determine ETo, the thermal balance was calculated, and the vapor pressure gradient was utilized [62]. The method uses instruments to achieve more precise and reliable measurements of ETo. It distinguishes between the use of evaporation tanks and pans [67,68]. This method focuses on observations of wind speeds and evaporation. Currently, this method serves primarily as a reference for developing new equations in various regions where the necessary variables are present [69]. This method emphasizes the development of studies related to heat coefficients that have an air–water interface function based on wind speed in areas of the Netherlands [70]. It has been compared with various existing methods applied in regions of Iran [71]. The research conducted by Mahringer has primarily been applied to lake studies, such as the examination of Lake Neusiedl in Austria and the Senegal River Valley [72]. This method laid the foundation for the standardized method developed by the FAO [14]. Although this method is based on mass transfer, it has served as a reference in China, particularly in the northeastern plain, utilizing new study technologies such as deep learning methods and deep neural network studies [73].
In the present study, the methods previously described were meticulously analyzed to determine their applicability in Mexico for a temperate climate based on the available data. The objective is to develop an equation suitably adjusted for the specific study area. Additionally, the study examines the uncertainty associated with different methods in obtaining the Standardized Precipitation Evapotranspiration Index (SPEI).
The FAO-implemented Penman–Monteith method is the most widely used method for calculating ETo [4]. This method relies on climatological variables such as maximum temperature, average temperature, relative air humidity, wind speed, and vapor pressure. It is a mass transfer method. In 1990, a committee of FAO scientists recommended the standardization of the Penman–Monteith method [16], which can be seen in the following equation:
E T o = 0.408 Δ ( Rn G ) + γ [ 900 / ( Tmean + 273 ) ] u 2 ( es ea   )   Δ + γ ( 1 + 0.34 u 2 )  
where ETo: evapotranspiration reference (mm day−1) Δ: pressure curvature gradient (kPa °C−1); Rn: net solar radiation (MJ m−2 day−1); G: soil heat flux (MJ m−2 day−1); ɣ: psychrometric constant (kPa °C−1); u2: wind speed (m s−1); Tmean temperature (°C); (es − es): vapor pressure deficit (kPa).
Two primary advantages distinguish the method developed by the FAO compared to other methods: (1) it allows for the comparison of evapotranspiration across different periods of the year and/or various climate types, and (2) it enables the correlation of evapotranspiration from other crops within the same region or cultivation area [4].
The equation employs climatic data, including solar radiation, air temperature, humidity, and wind speed. For accurate calculations, this climatic data must be measured or adjusted to a standardized height of 2 m above a vast expanse of green grass, which should uniformly cover the soil and be free from any water constraints [74]
Equations (2)–(4) were used for regional calibration because the methods were developed in varied regions with unique conditions. These equations include the Pearson Correlation Coefficient (R), Percentage Error (PE), Mean Absolute Error (MAE), and Root Mean Square Error (RMSE) [75].
MAE = 1 / n   i = 1 n ( P i O i )
RMSE = ( ( i = 1 n P i O i 2 ) / n ) 0.5
PE = | P ¯ O ¯ | / O ¯
R = i = 1 n ( O i O ¯ ) ( P i P ¯ )   i = 1 n ( O i O ¯ ) 2   i = 1 n ( P i P ¯ ) 2     1 / 2  
where P: predicted ETo values; O: observed ETo values; P ¯ : mean of predicted ETo values; O ¯ : mean of observed ETo values; n: total number of ETo data points.
In this document, 40 methods were analyzed (see Figure 1), which are classified into three groups: methods based on mass transfer, solar radiation, and temperature. Although each method aims to achieve the same goal as the FAO method, their accuracy varies because they were implemented in different regions with specific conditions, as previously described. Table 1 is based on the article by [49].

2.4. SPEI: Temporal Analysis

While the calculation of SPEI was initially developed on a monthly scale, this study examines the impact of calculating evapotranspiration (ETo) daily and how the selection of different methods influences the SPEI results. The daily information is used to solve Equation (6).
D i = P i E T o i
where Di represents the daily precipitation deficit for day i (ranging from 1 to 365), Pi denotes the daily precipitation, and EToi signifies the daily evapotranspiration calculated using 40 distinct methods. Subsequently, a monthly deficit accumulation was conducted for the various months of the year (Equation (7)).
x j = i = 1 n D i
where xj is the accumulated monthly series for month j, n is the number of days in the month, and i is the day of the year. For the calculation of the distribution function, the generalized extreme value function was employed, which can be defined as follows:
1 σ t ( x ) ξ + 1 e t ( x )
x = 1 + ξ x μ σ 1 / ξ   i f   ξ 0 e x μ σ                         i f   ξ = 0
where σ is the scale parameter, ξ is the shape parameter, and μ is the location parameter. Finally, the standardized SPEI values were obtained using the normal distribution function and Barton’s approximation (76).
The SPEI values are classified according to their deviation from the location parameter. Positive biases (+) indicate normal to wet conditions, while negative biases (−) indicate drought conditions. Table 1 presents the classification of SPEI values [76].

2.5. Study Area

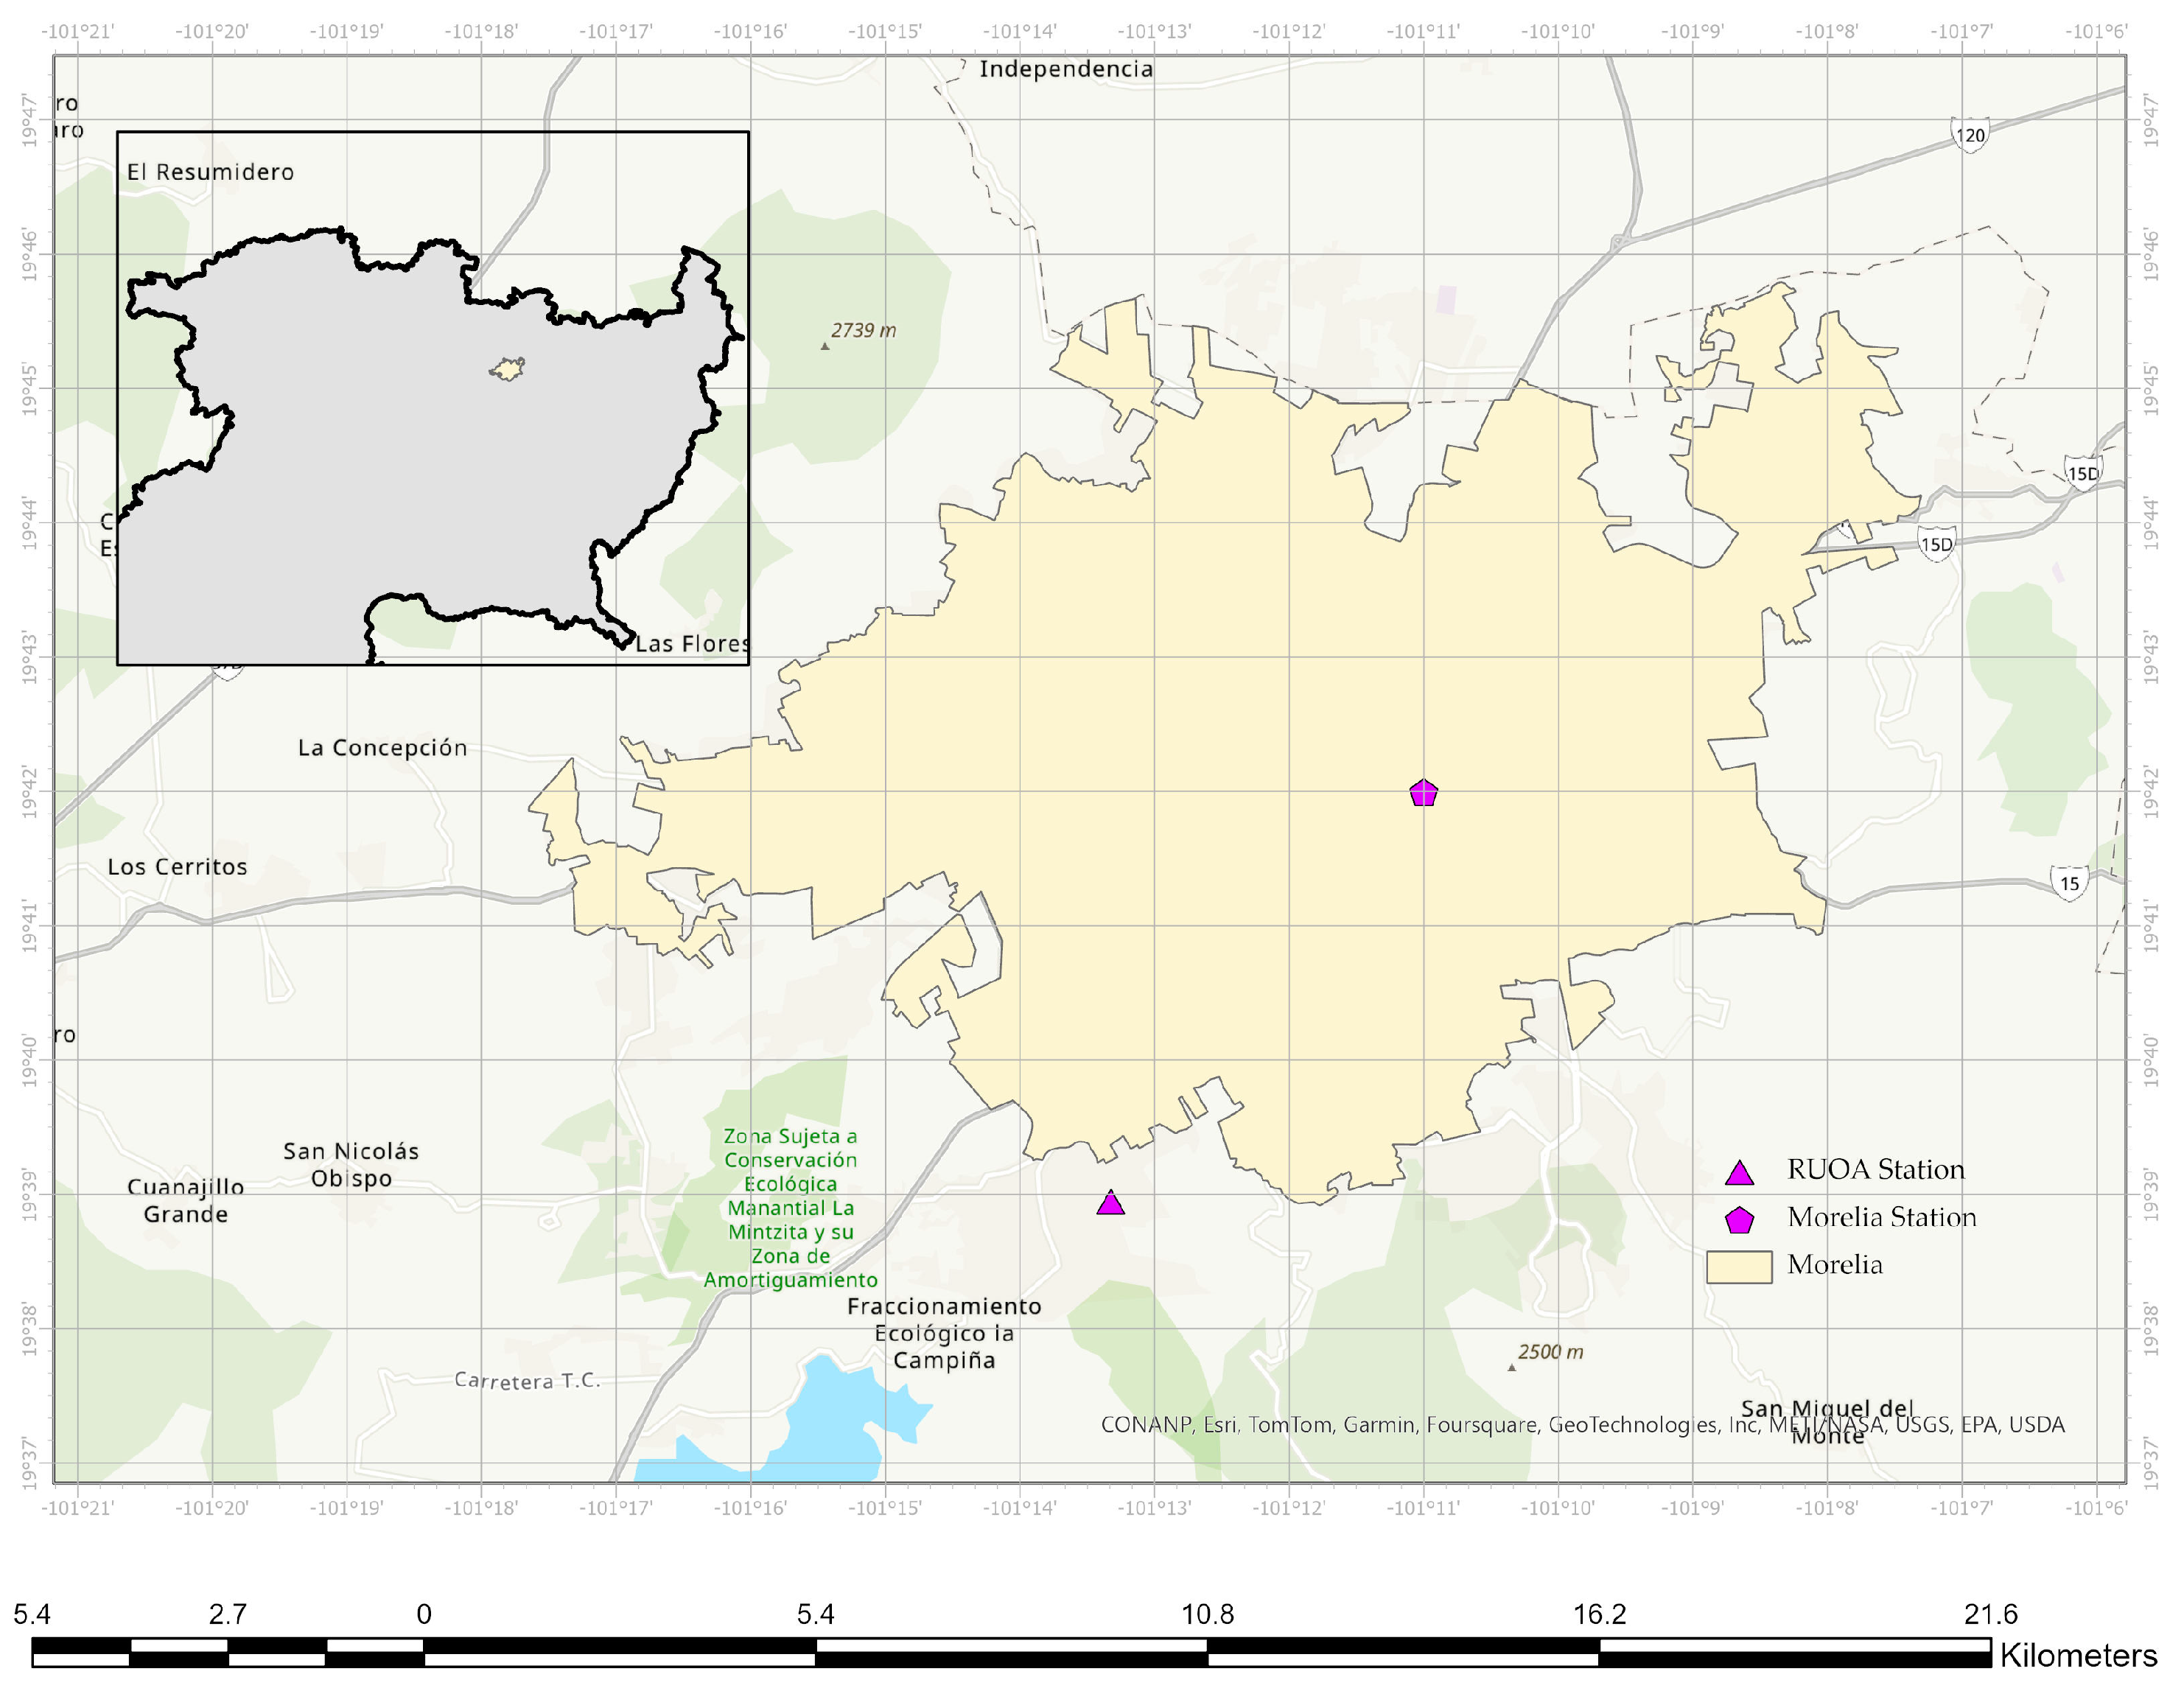
The study area is the city of Morelia, Michoacán, Mexico. The geostatistical data for this area are listed in Table 2 [77]. For this study, the meteorological information was obtained from the website of the Red Universitaria de Observatorios Atmosféricos (RUOA).
Two automatic weather stations were utilized within the study area. These weather stations are of recent creation in Mexico, and the available information dates from 2010 for the Morelia station and from 2016 for the RUOA (Table 3).
Both weather stations provide the majority of necessary variables to estimate ETo based on the methodology developed by the FAO, as illustrated in Figure 2.

3. Results

The comparison of the previously described methods revealed certain similarities in the estimation of ETo based on climatic variables. Figure 1 illustrates various methods compared to the FAO approach. Although some methods share the same variables and others do not, discrepancies were expected. However, the results showed otherwise, prompting the decision to conduct statistical analyses to observe the correlations between each method.
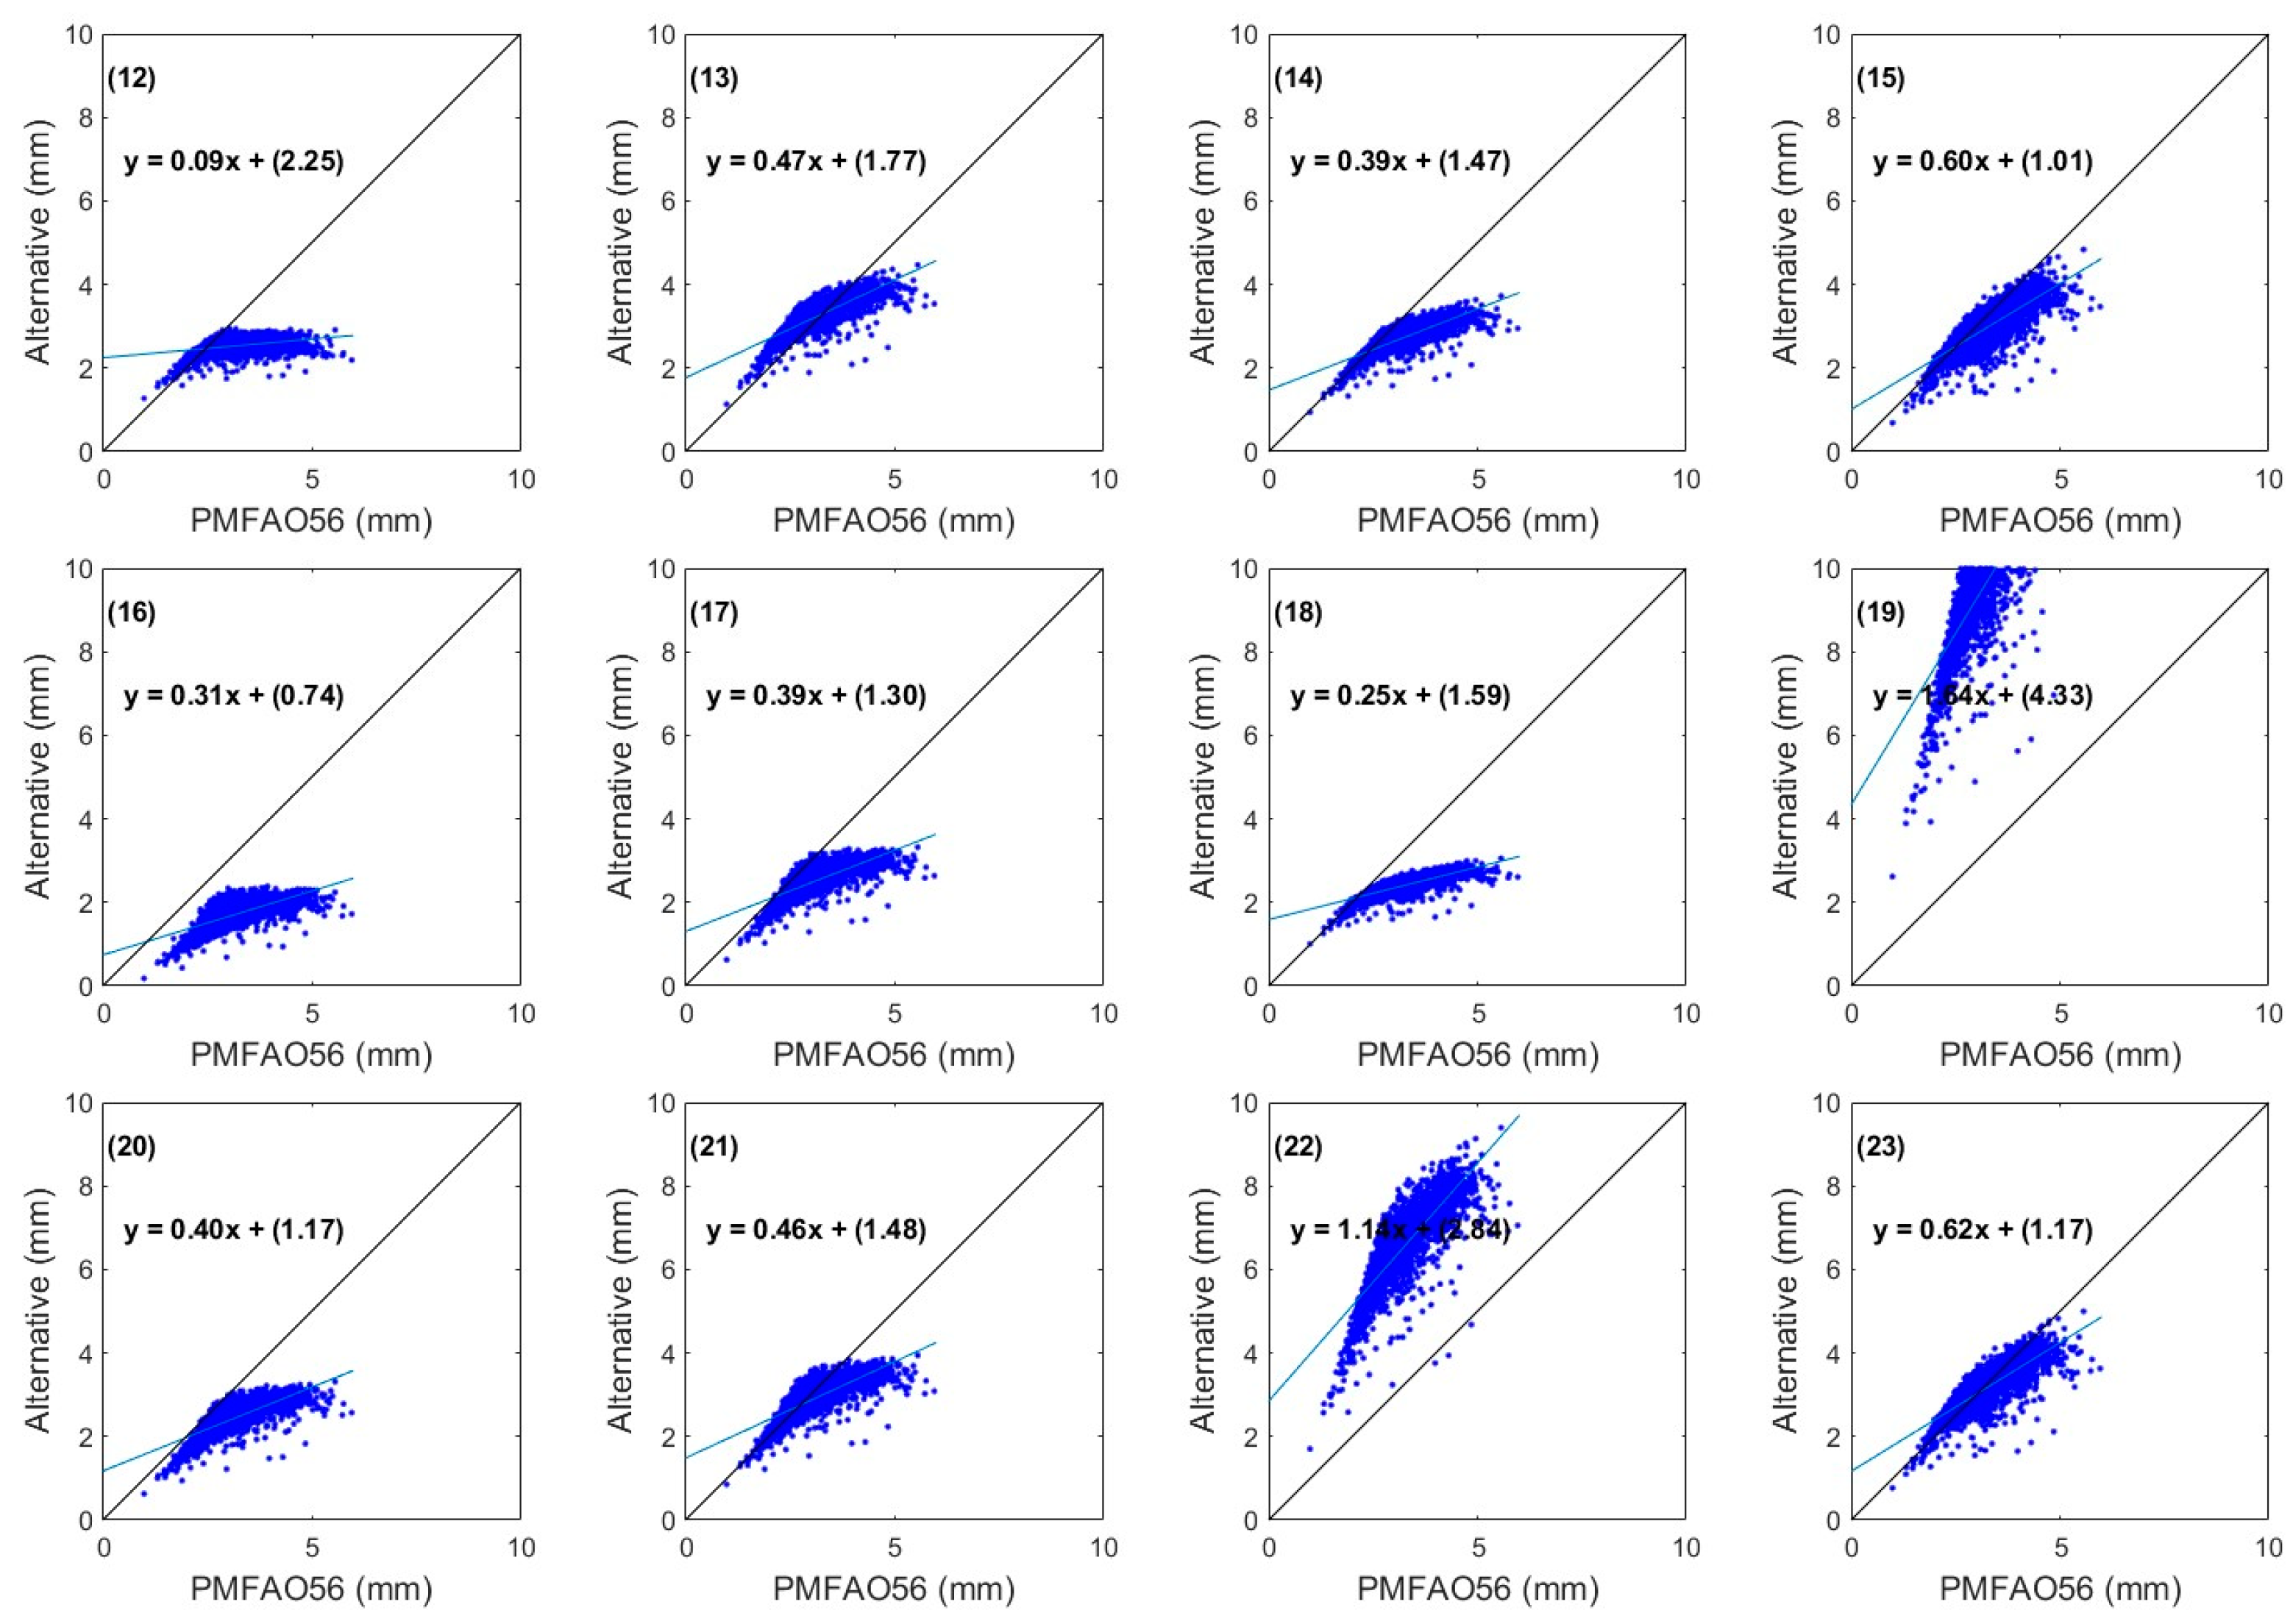
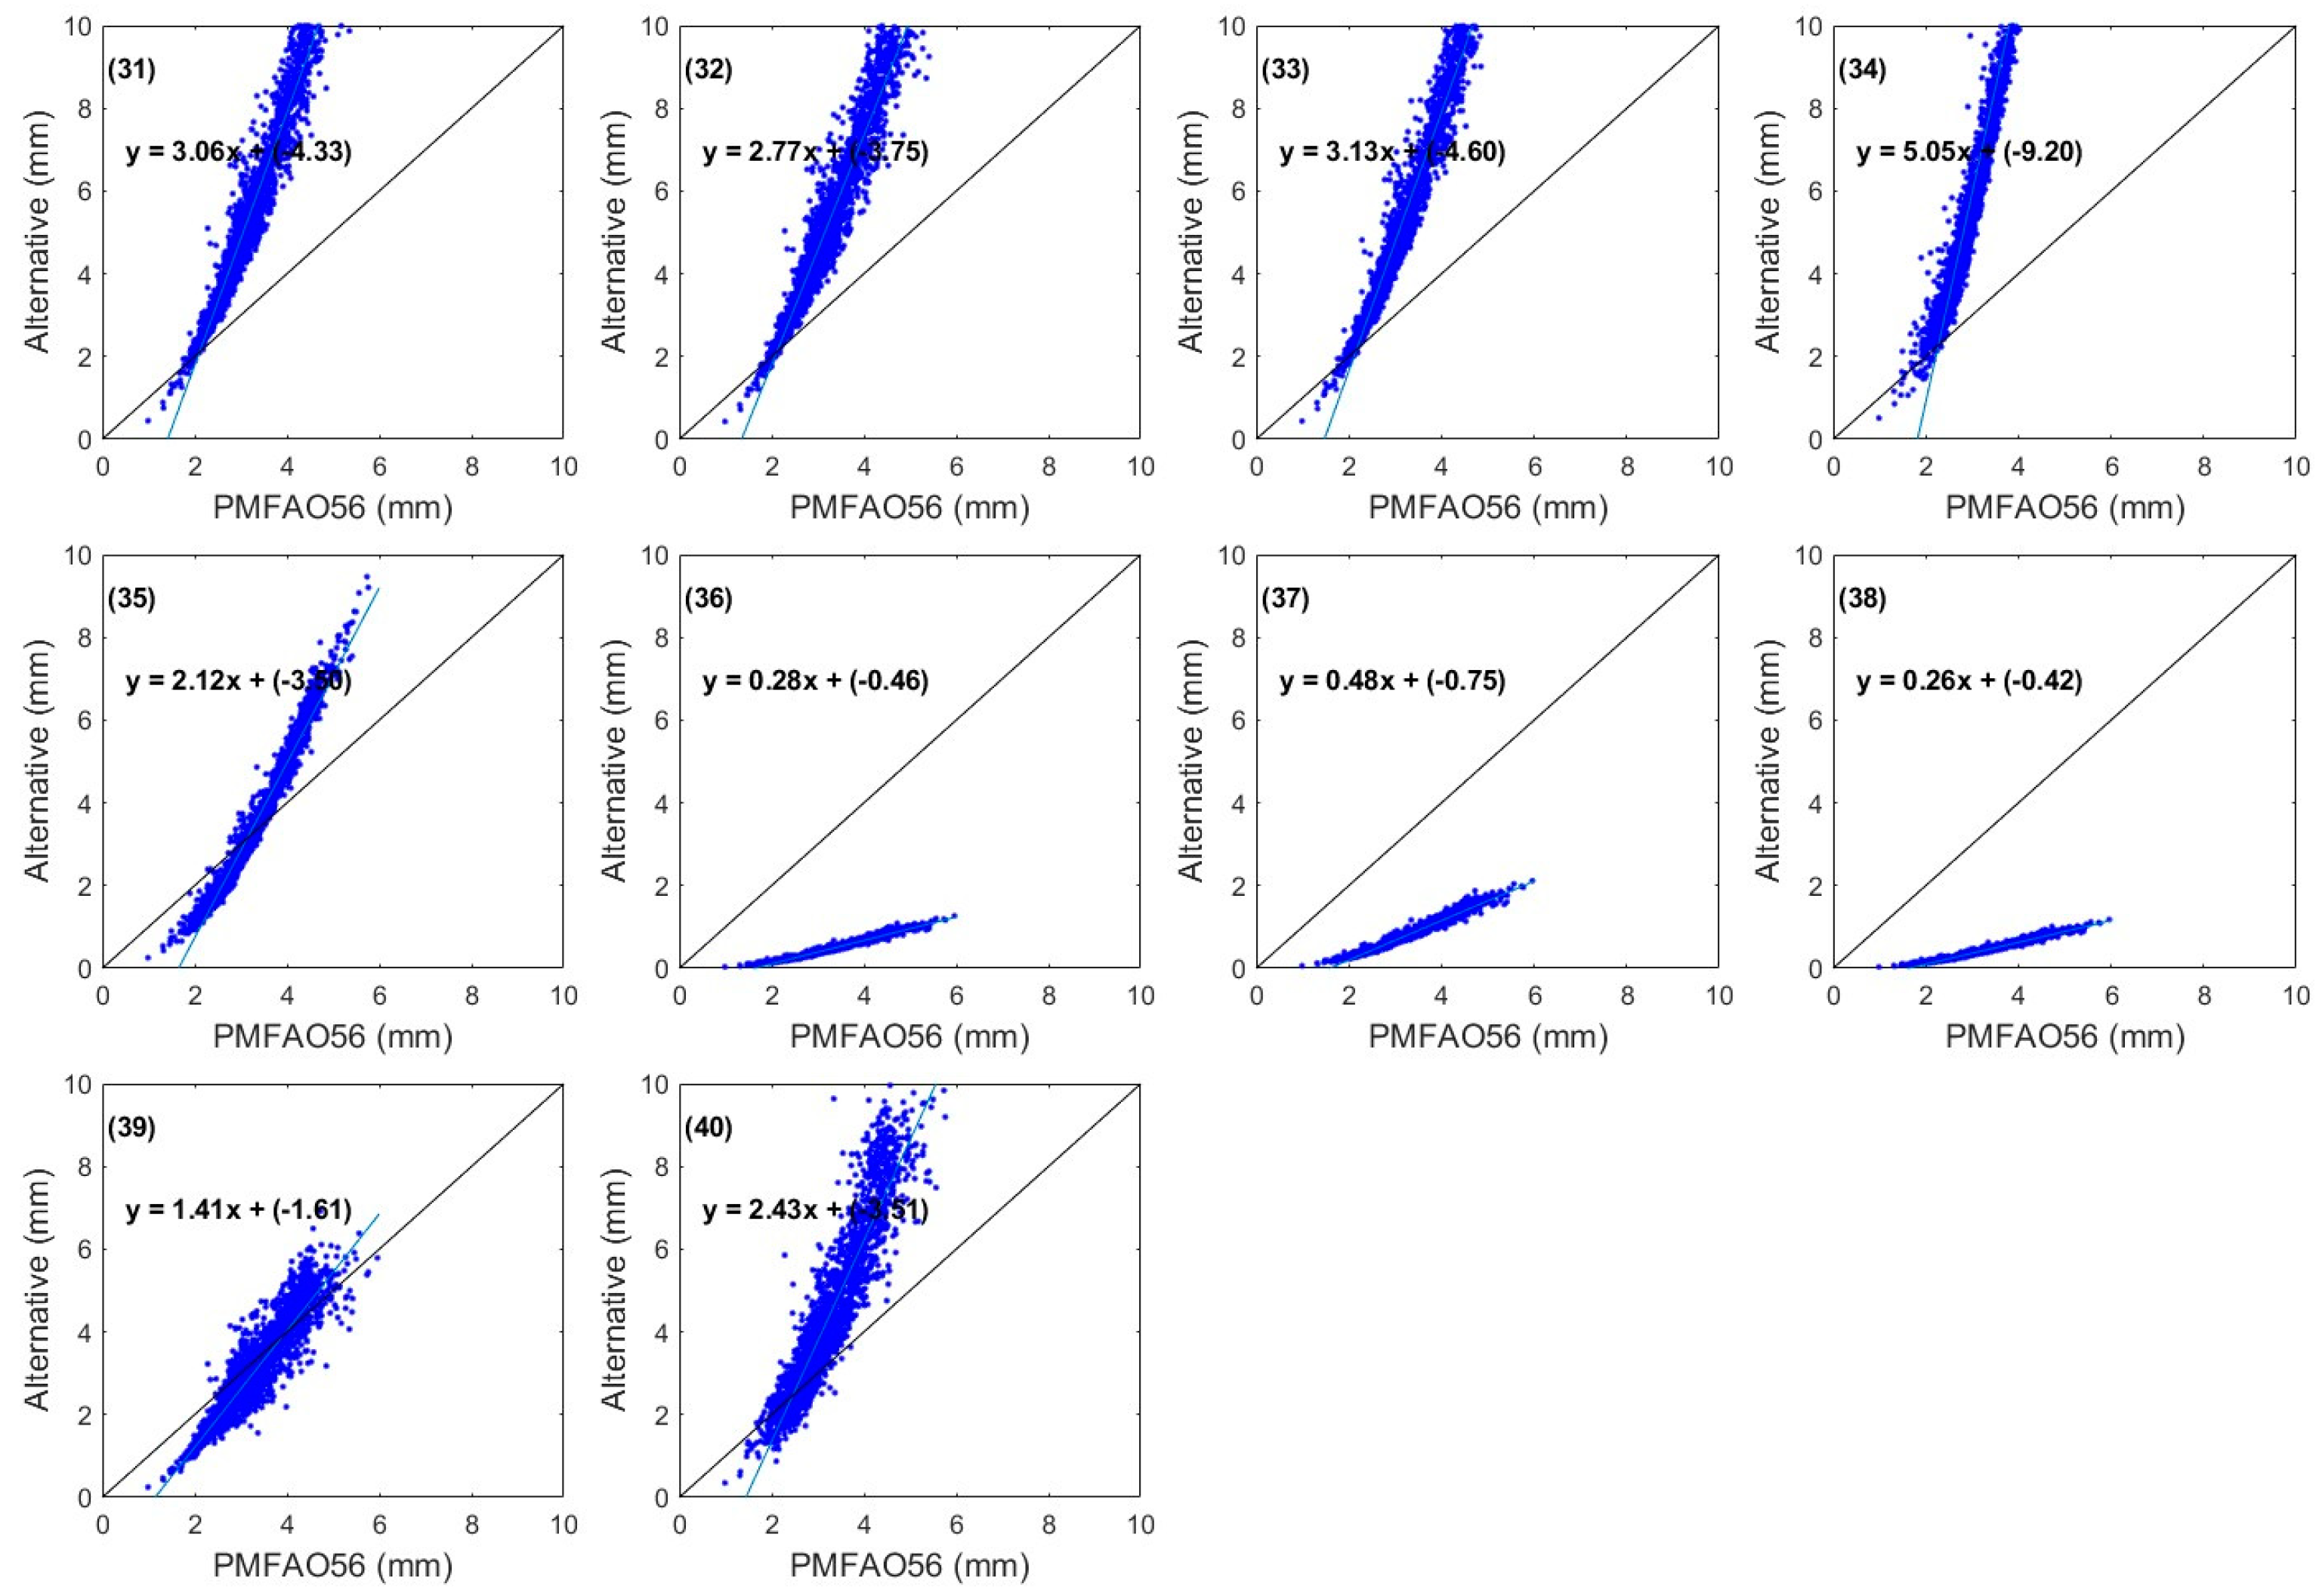
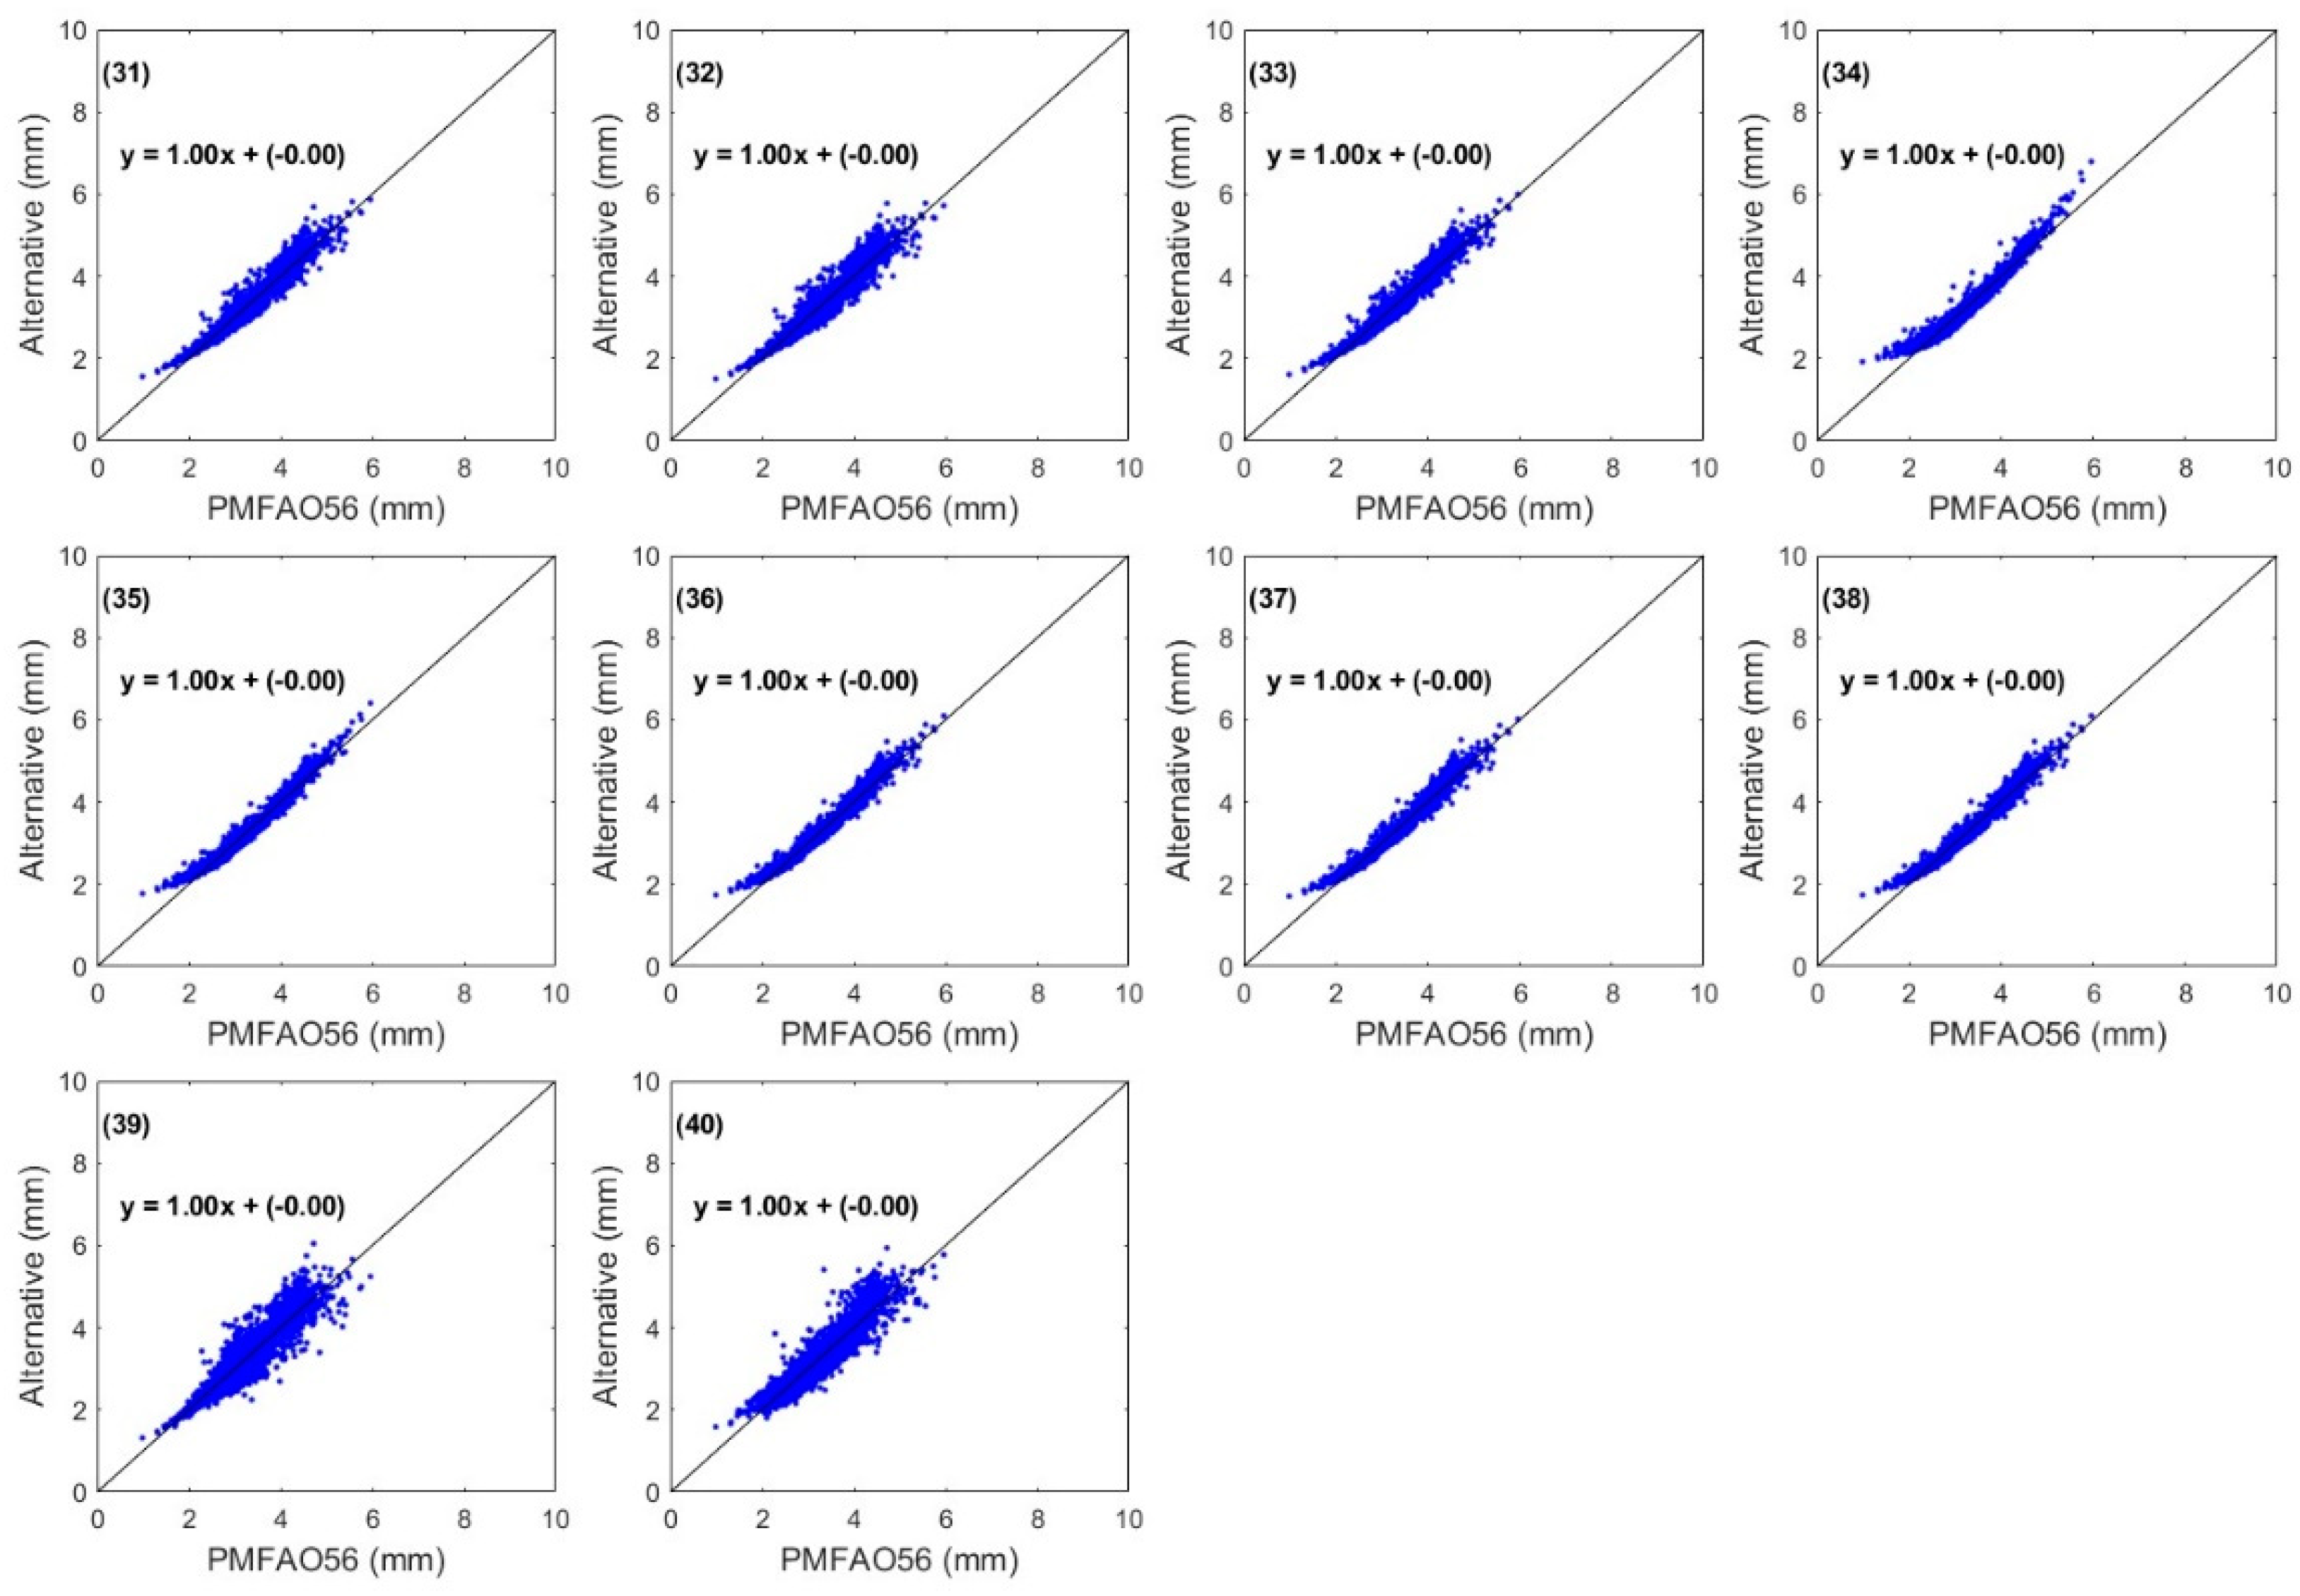
Table 3 presents the different results applied to each method compared to the FAO method. Figure 3, Figure 4, Figure 5 and Figure 6 display the methods developed using station data without regional calibration.
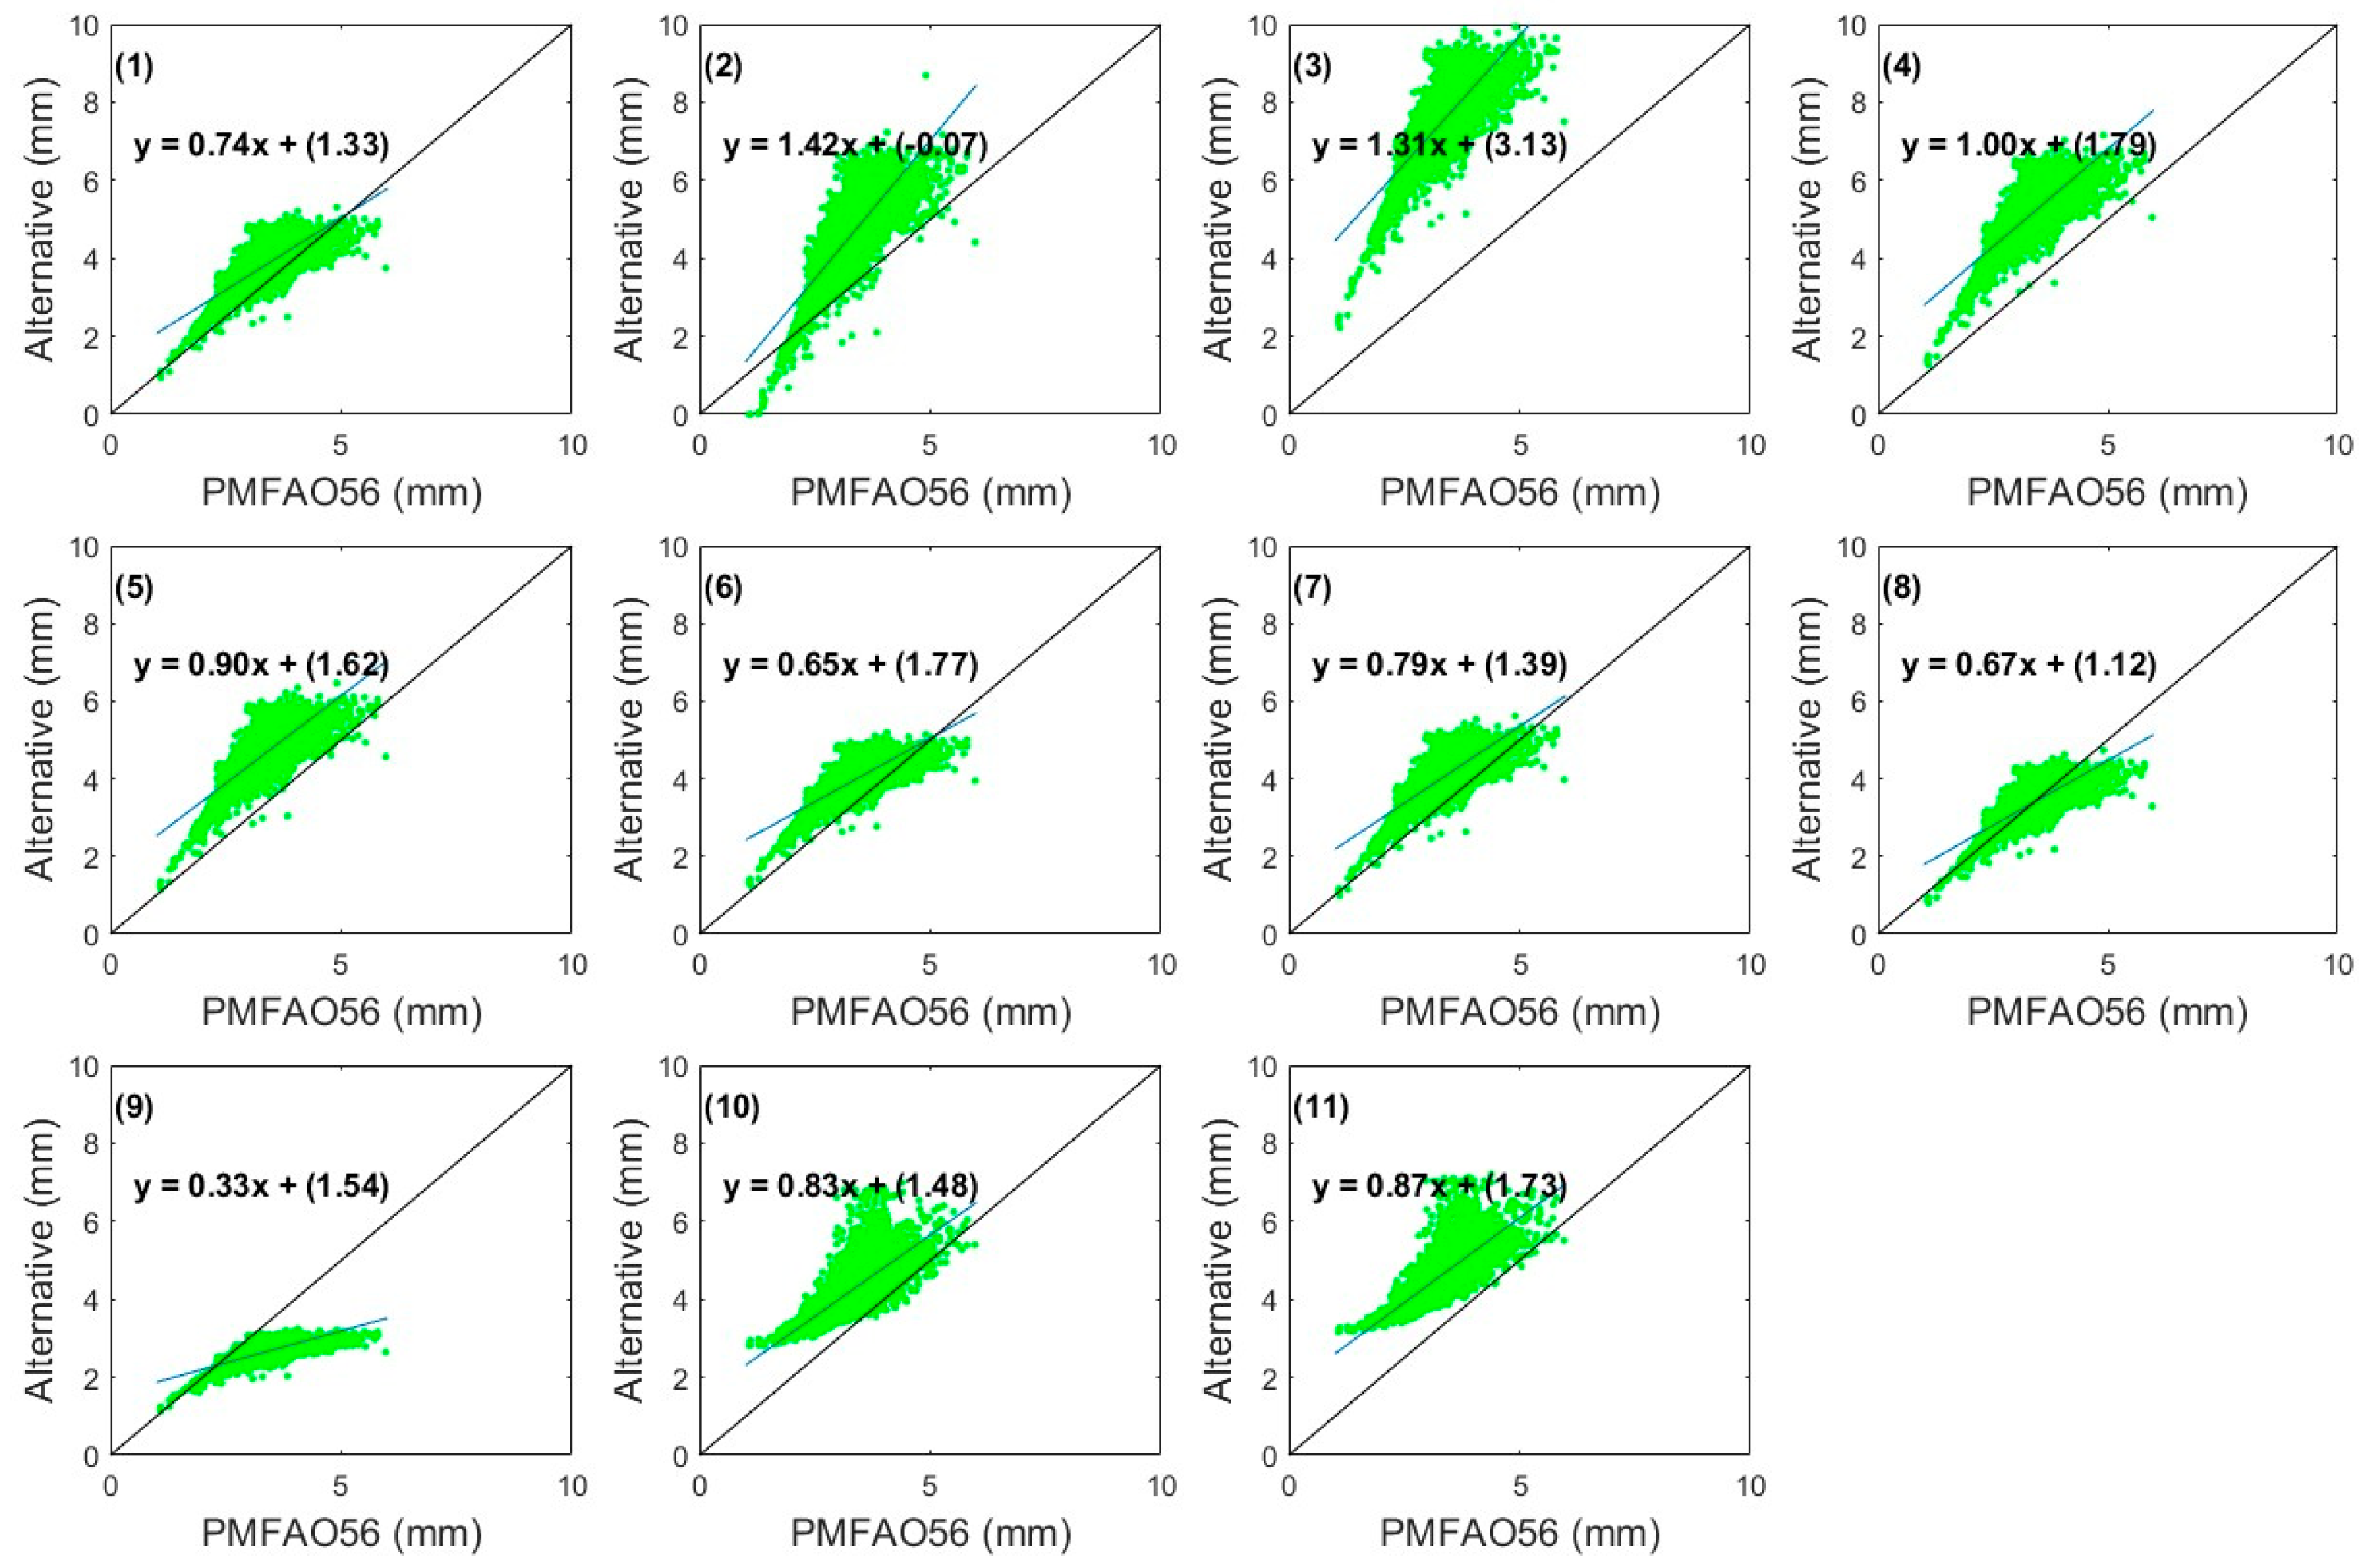
The temperature-based methods at the Morelia station, functioning without any regional adjustments, exhibit a strong positive correlation with existing climatic variables. However, when compared to the standardized FAO method, some methods tend to overestimate the ETo values, including (2) Baier–Robertson, (3) Trajovic, and (11) Ahooghalandari-2. Conversely, the methods that tend to underestimate the values are (6) Droogers–Allen, (7) Droogers–Allen-2, and (8) Berti (Figure 3).
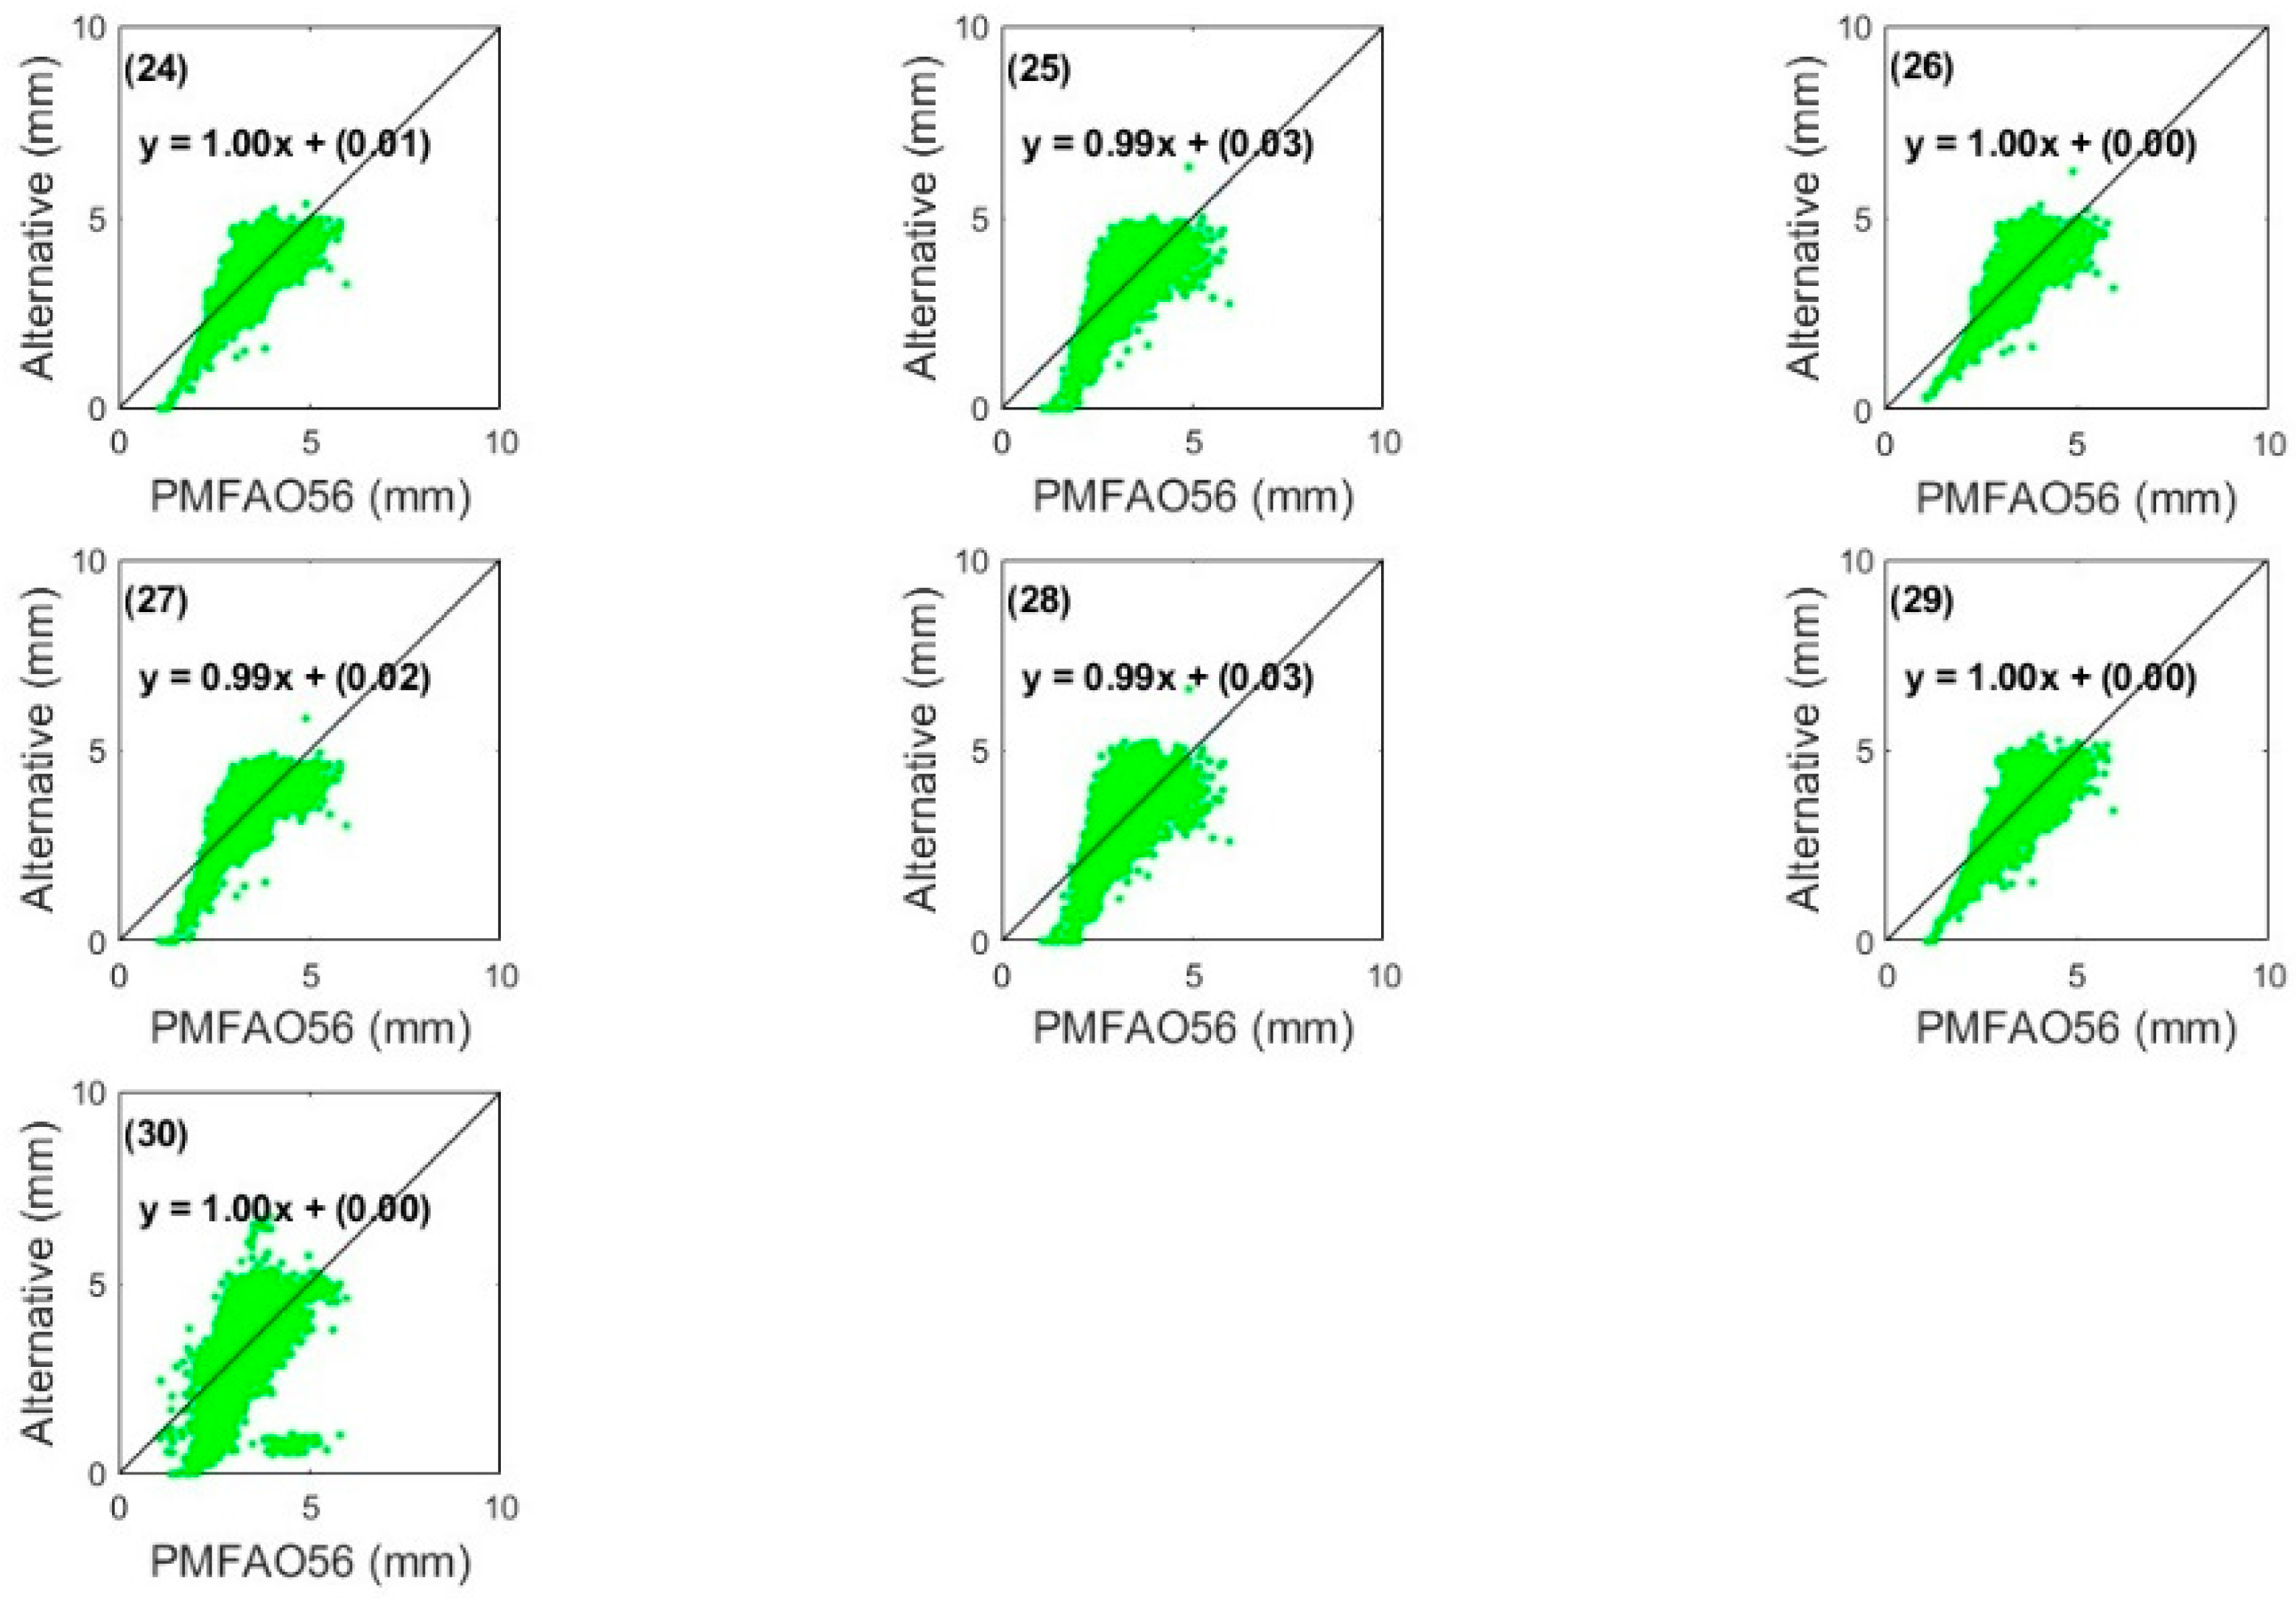
Similarly, the solar radiation-based methods (Figure 4 and 5) show a strong positive correlation. Despite this, most studied methods overestimate the ETo values, except for the (26) Abtew-2 method, which achieves equality in the calculations without any regional calibration.
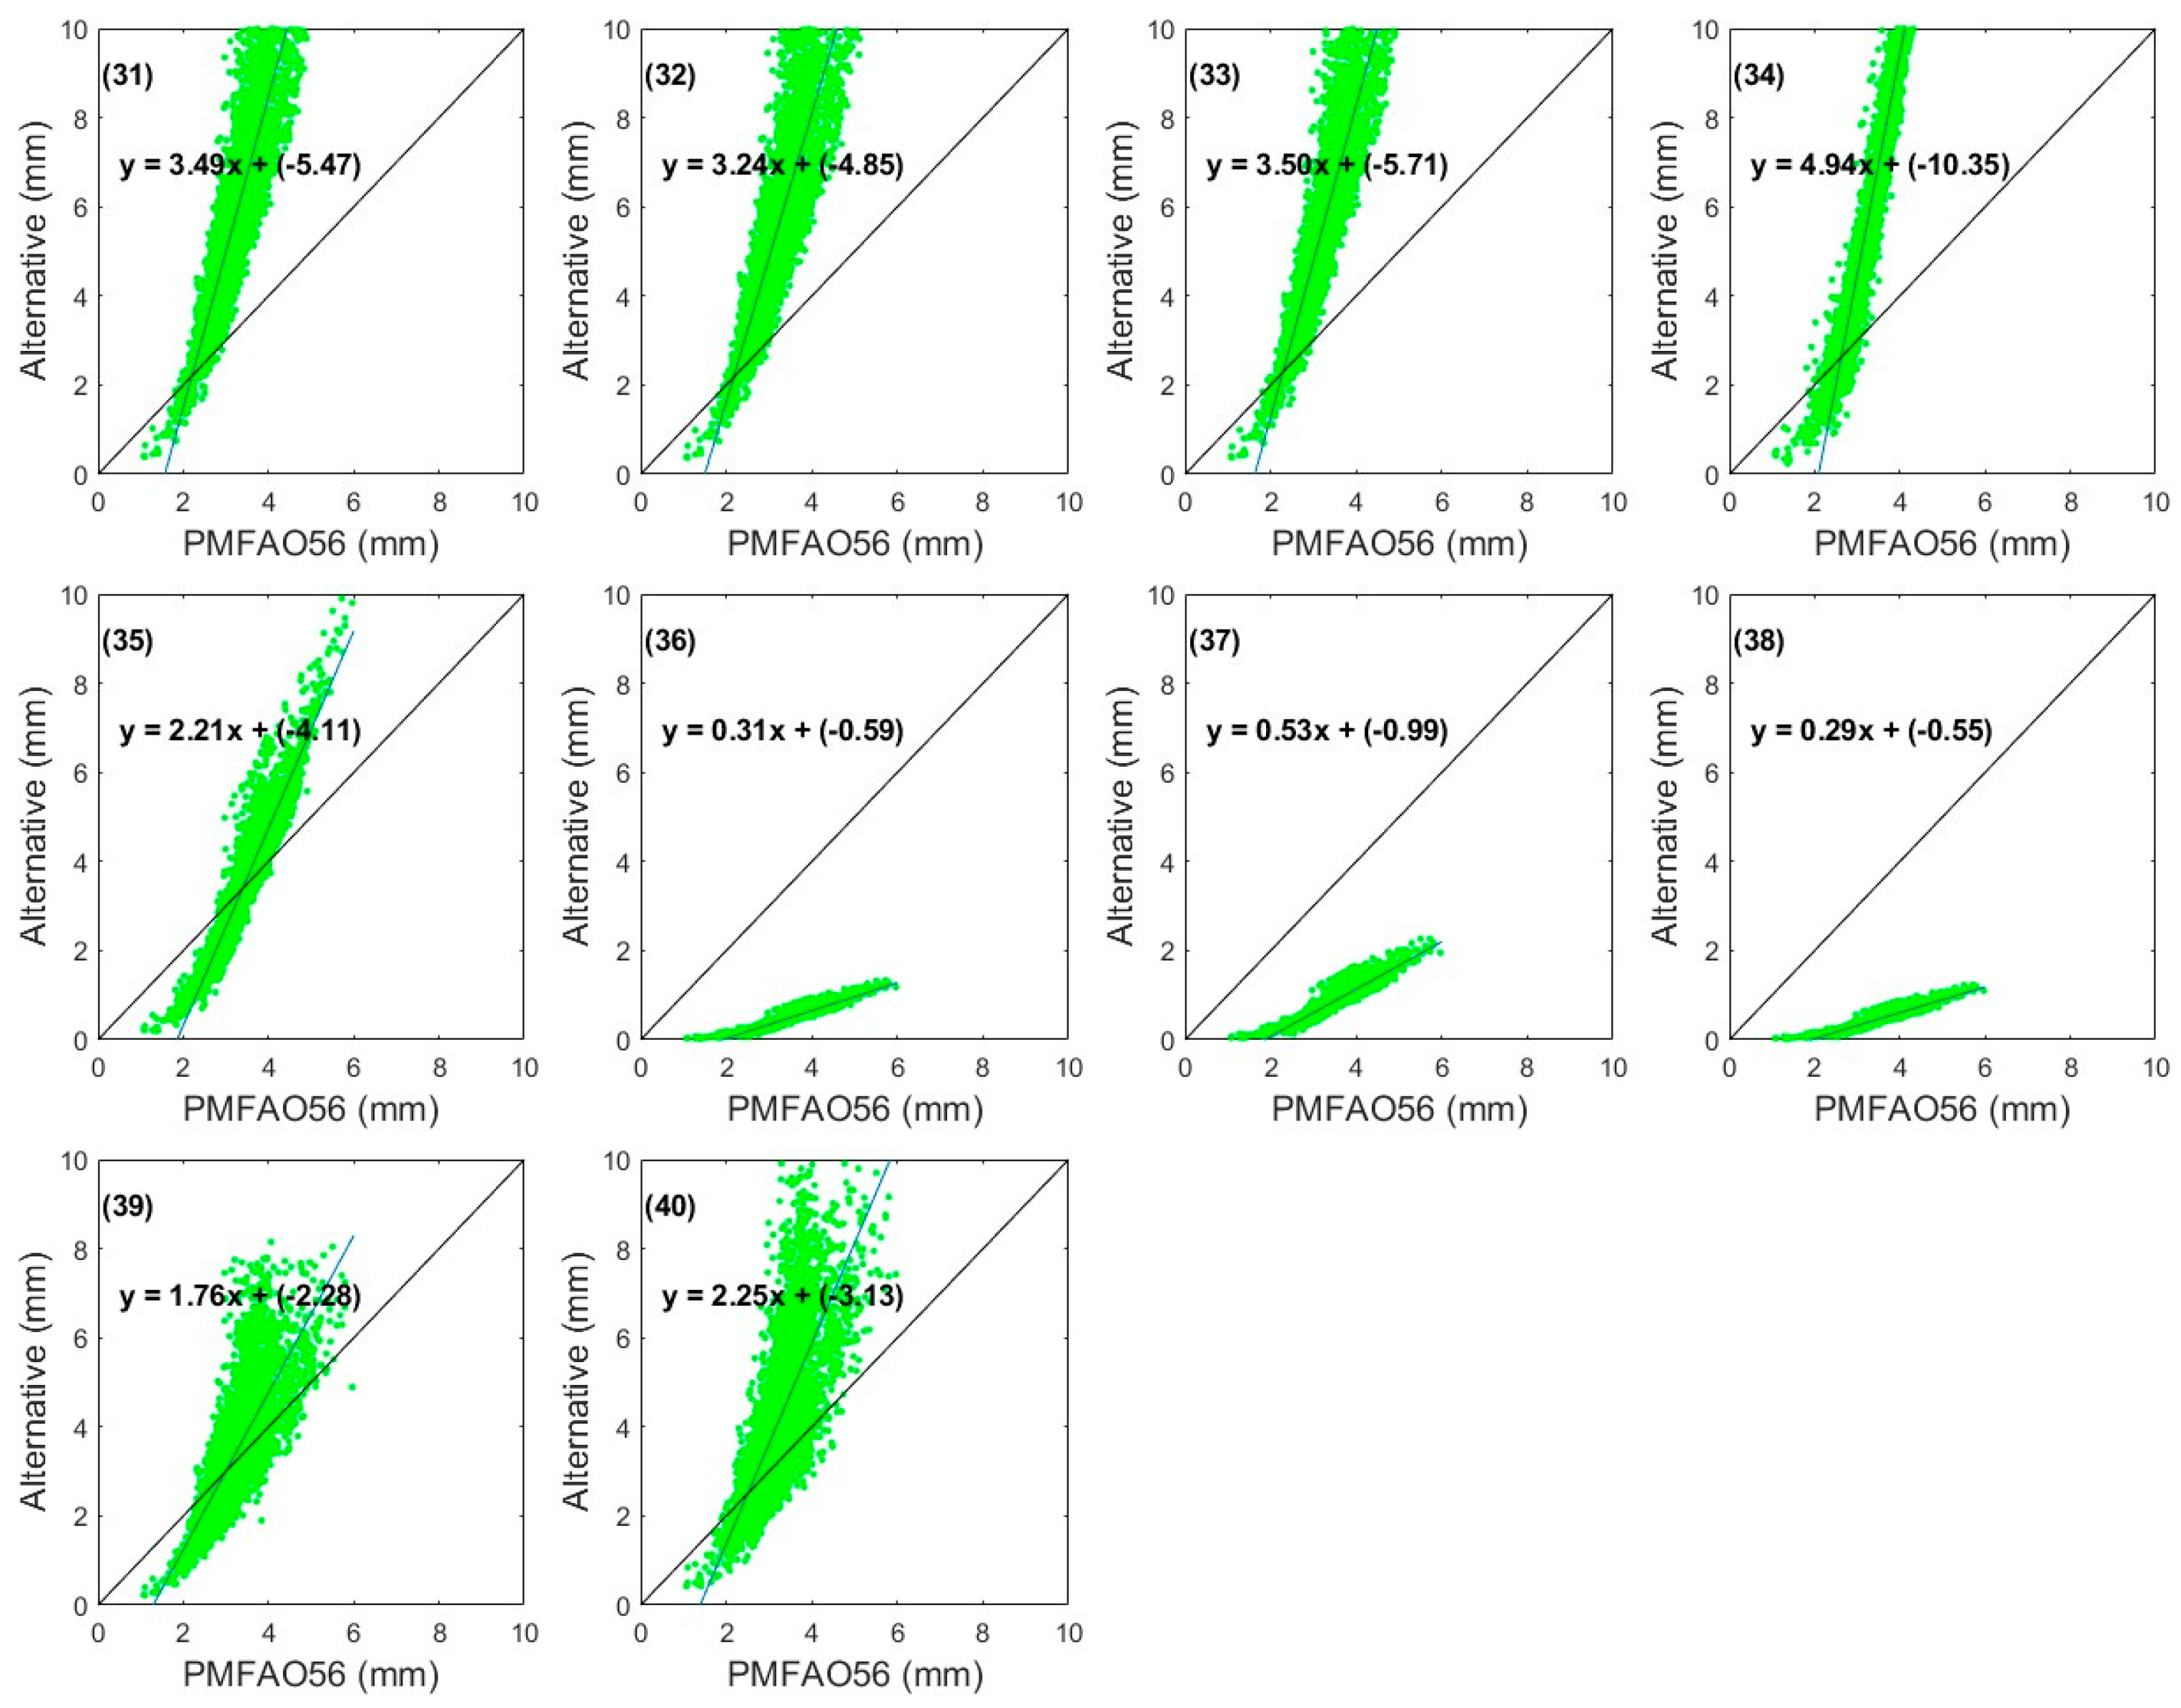
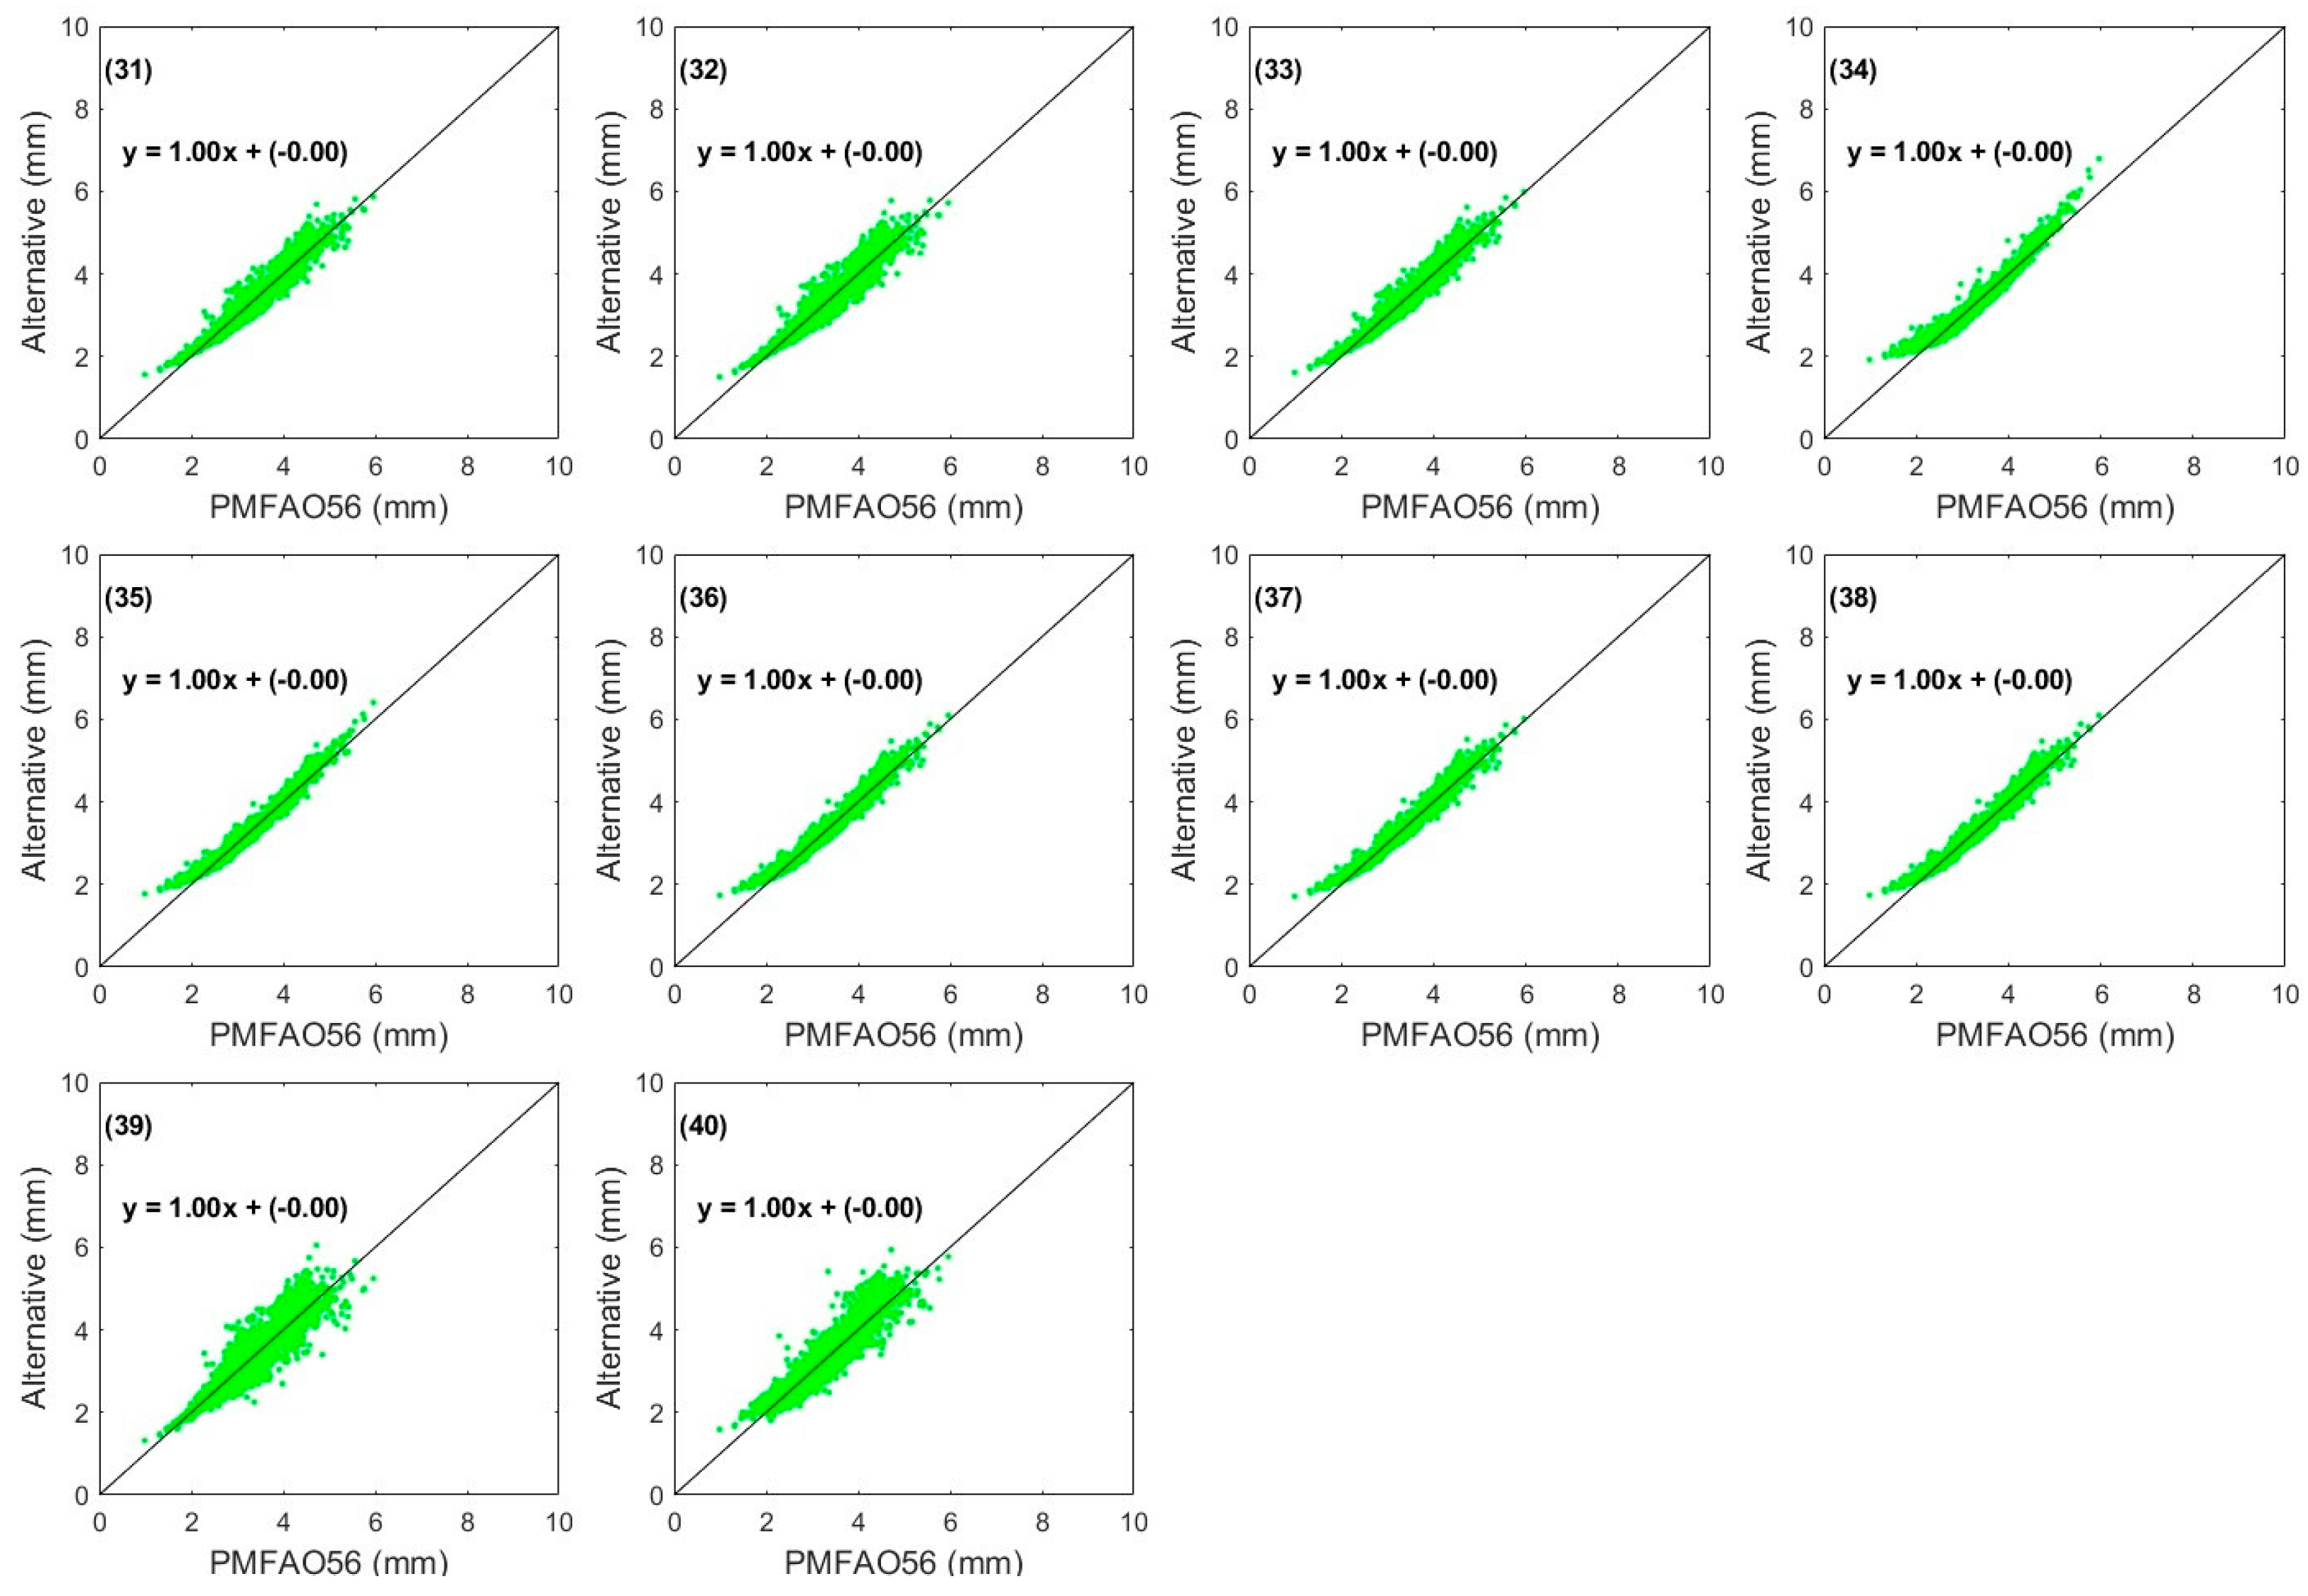
The mass transfer-based methods (Figure 6) demonstrate significant disparities among the different methods. Specifically, the methods (31) Dalton, (32) Meyer, (33) Rohnwer, (34) Albrecht, and (35) WMO considerably overestimate the ETo values, while the methods (36) Trabert, (37) Brockamp–Wenner, and (38) Mahringer tend to underestimate these calculations.
For the RUOA station, without any regional calibration for temperature methods (Figure 7), methods such as (3) Trajovic, (10) Ahooghalandari, and (11) Ahooghalandari-2 tend to overestimate ETo values. The (2) Baier–Robertson method appears to perform better under existing climatic conditions without regional calibration. Across the subsequent two ETo groups (Figure 8, Figure 9 and Figure 10), similar patterns of overestimation or underestimation are observed. Compared to the standardized FAO method, all studied methods show systematic discrepancies, suggesting that regional recalibration is necessary.
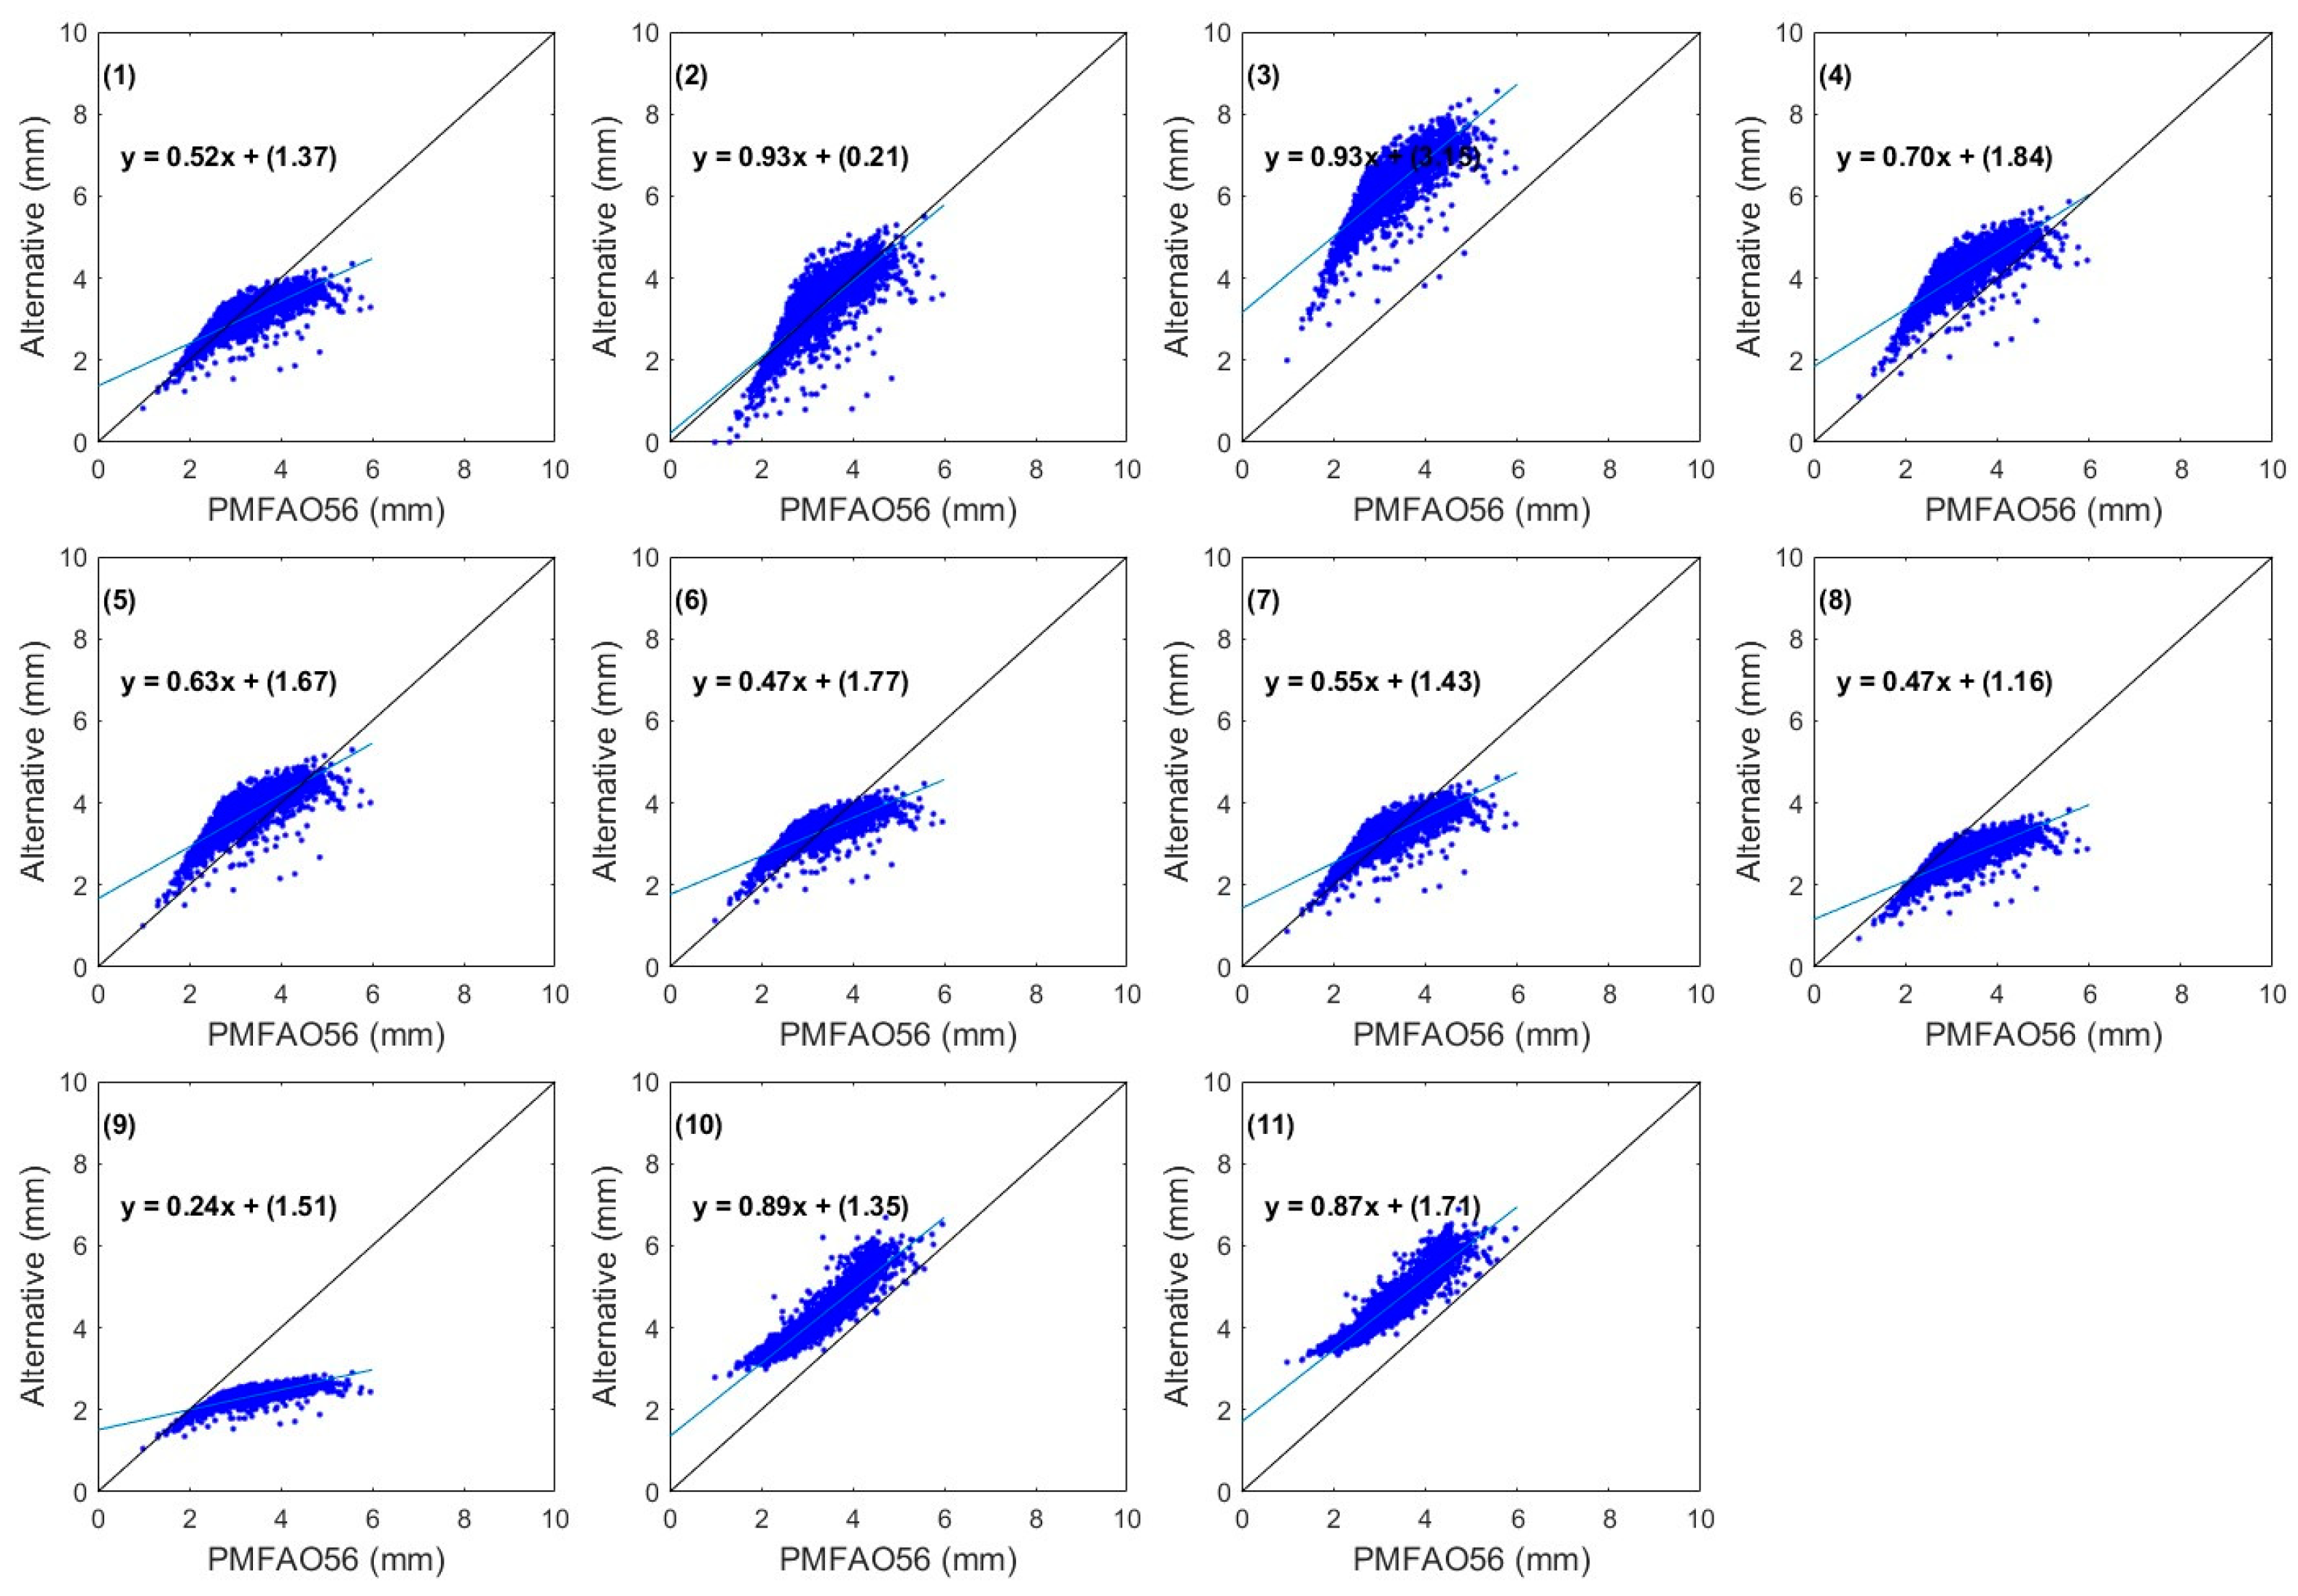
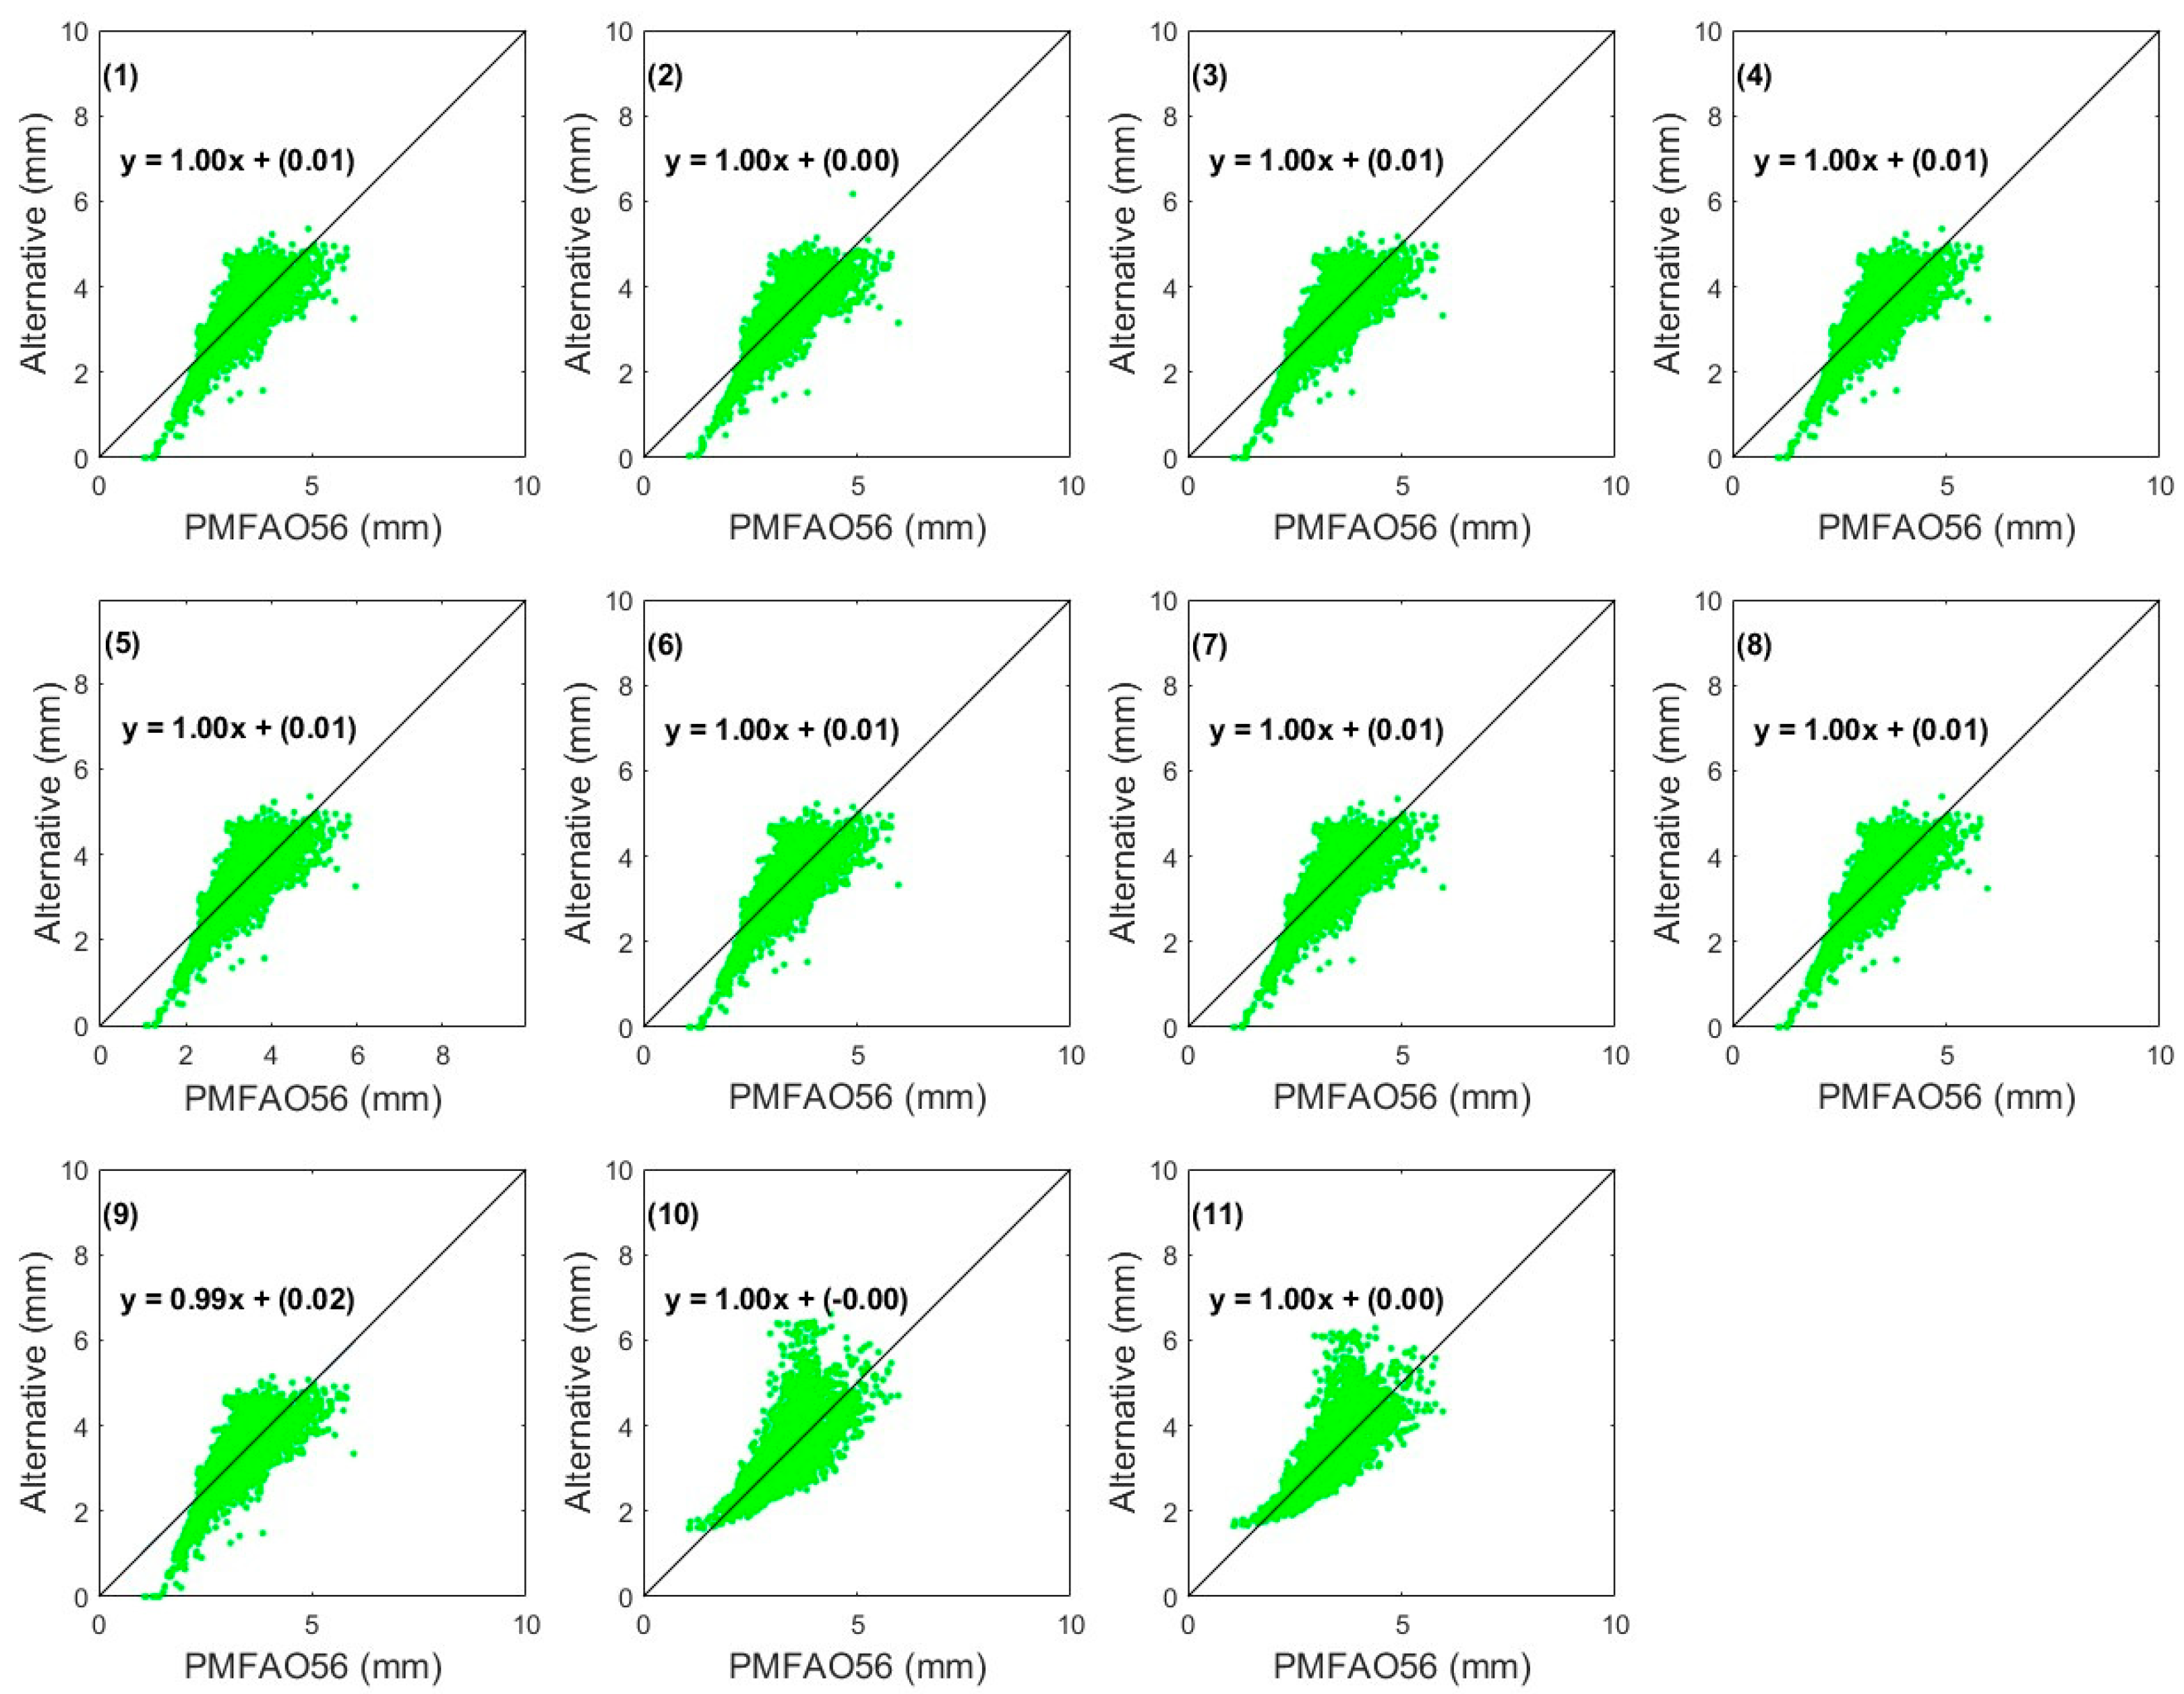
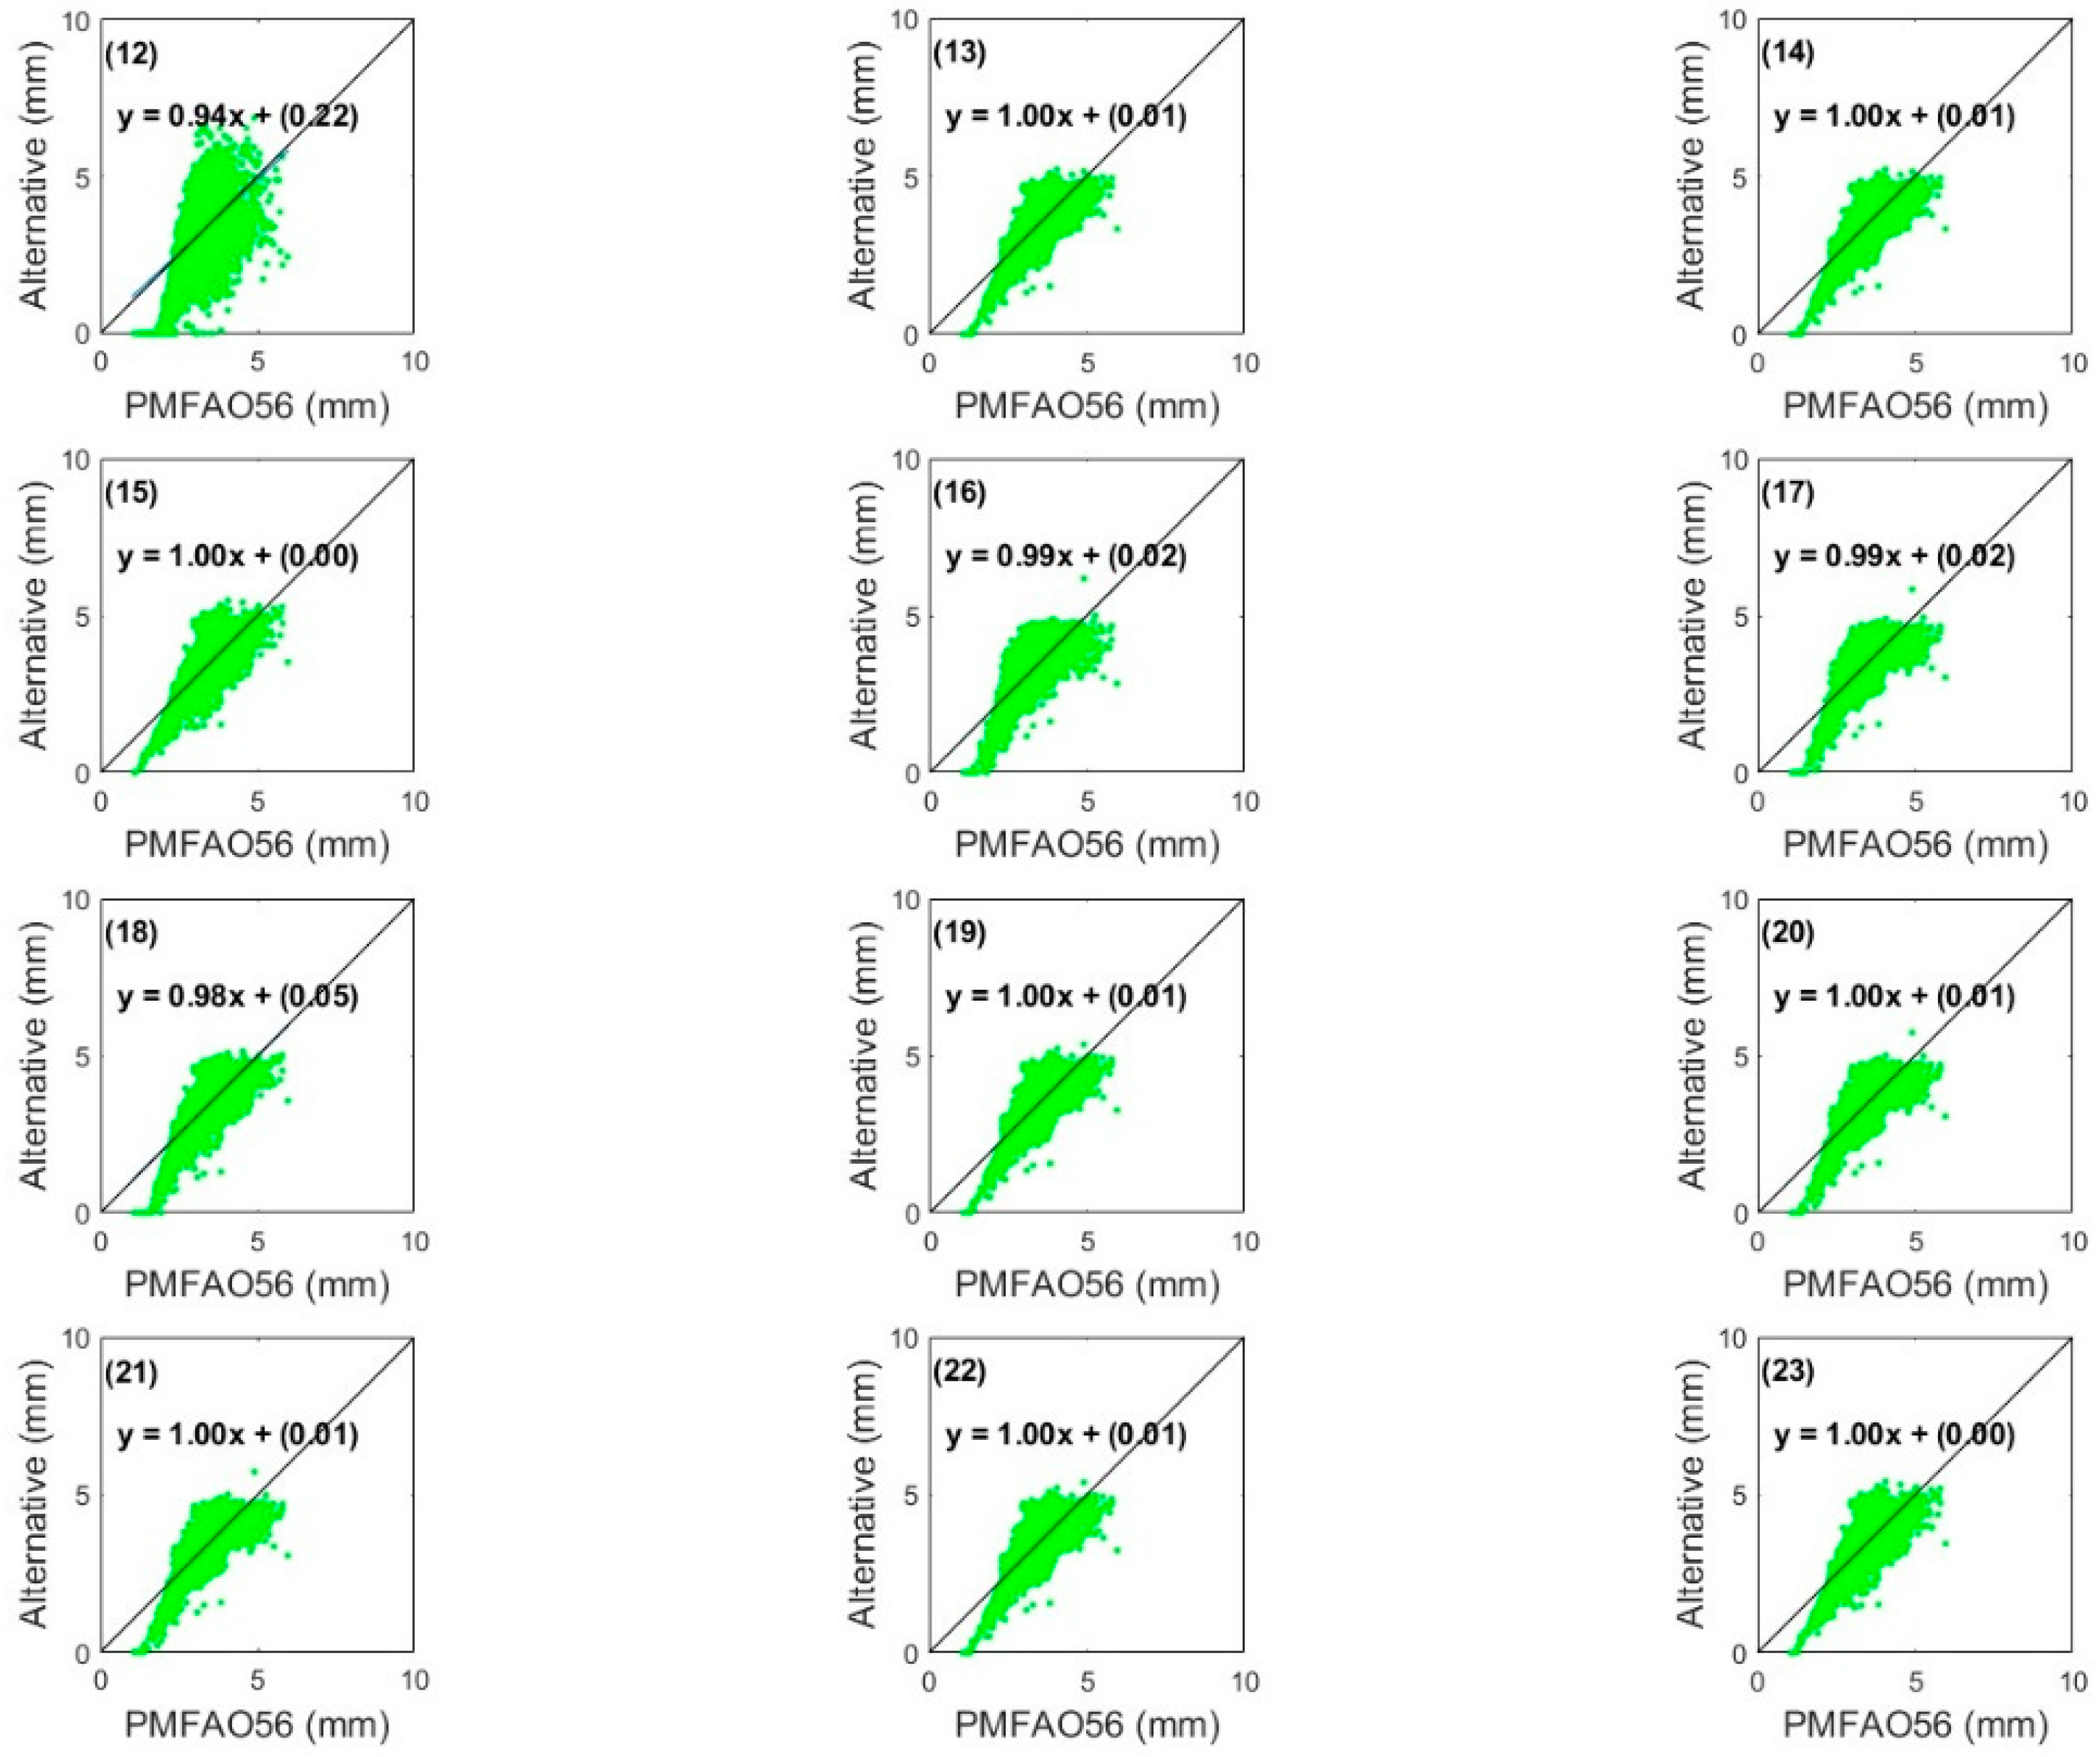
Once the parameters for regional calibration for the Morelia station have been applied, the results are depicted in Figure 11, Figure 12, Figure 13 and Figure 14. Similarly, for the RUOA station, the adjusted methods are shown in Figure 15, Figure 16, Figure 17 and Figure 18.
For the temperature-based methods at the Morelia station (Table 4), there is a strong positive correlation ranging from 0.75 (Ahooghalandari) to 0.81 (Hargreaves–Samani). The standard deviation indicates underestimations compared to the mean, ranging from 0.13 to 0.19 mm/day. RMSE values range from 0.42 (Hargreaves–Samani) to 0.52 (Ahooghalandari), while MAE values range from 0.32 (Hargreaves–Samani) to 0.36 (Ahooghalandari). According to the scatter data, the methods that exhibit a better fit to the identity diagonal are as follows (Figure 9): (4) Tabari–Tale; (5) Tabari–Tale-2; (6) Droogers–Allen; (7) Droogers–Allen-2; (8) Berti.
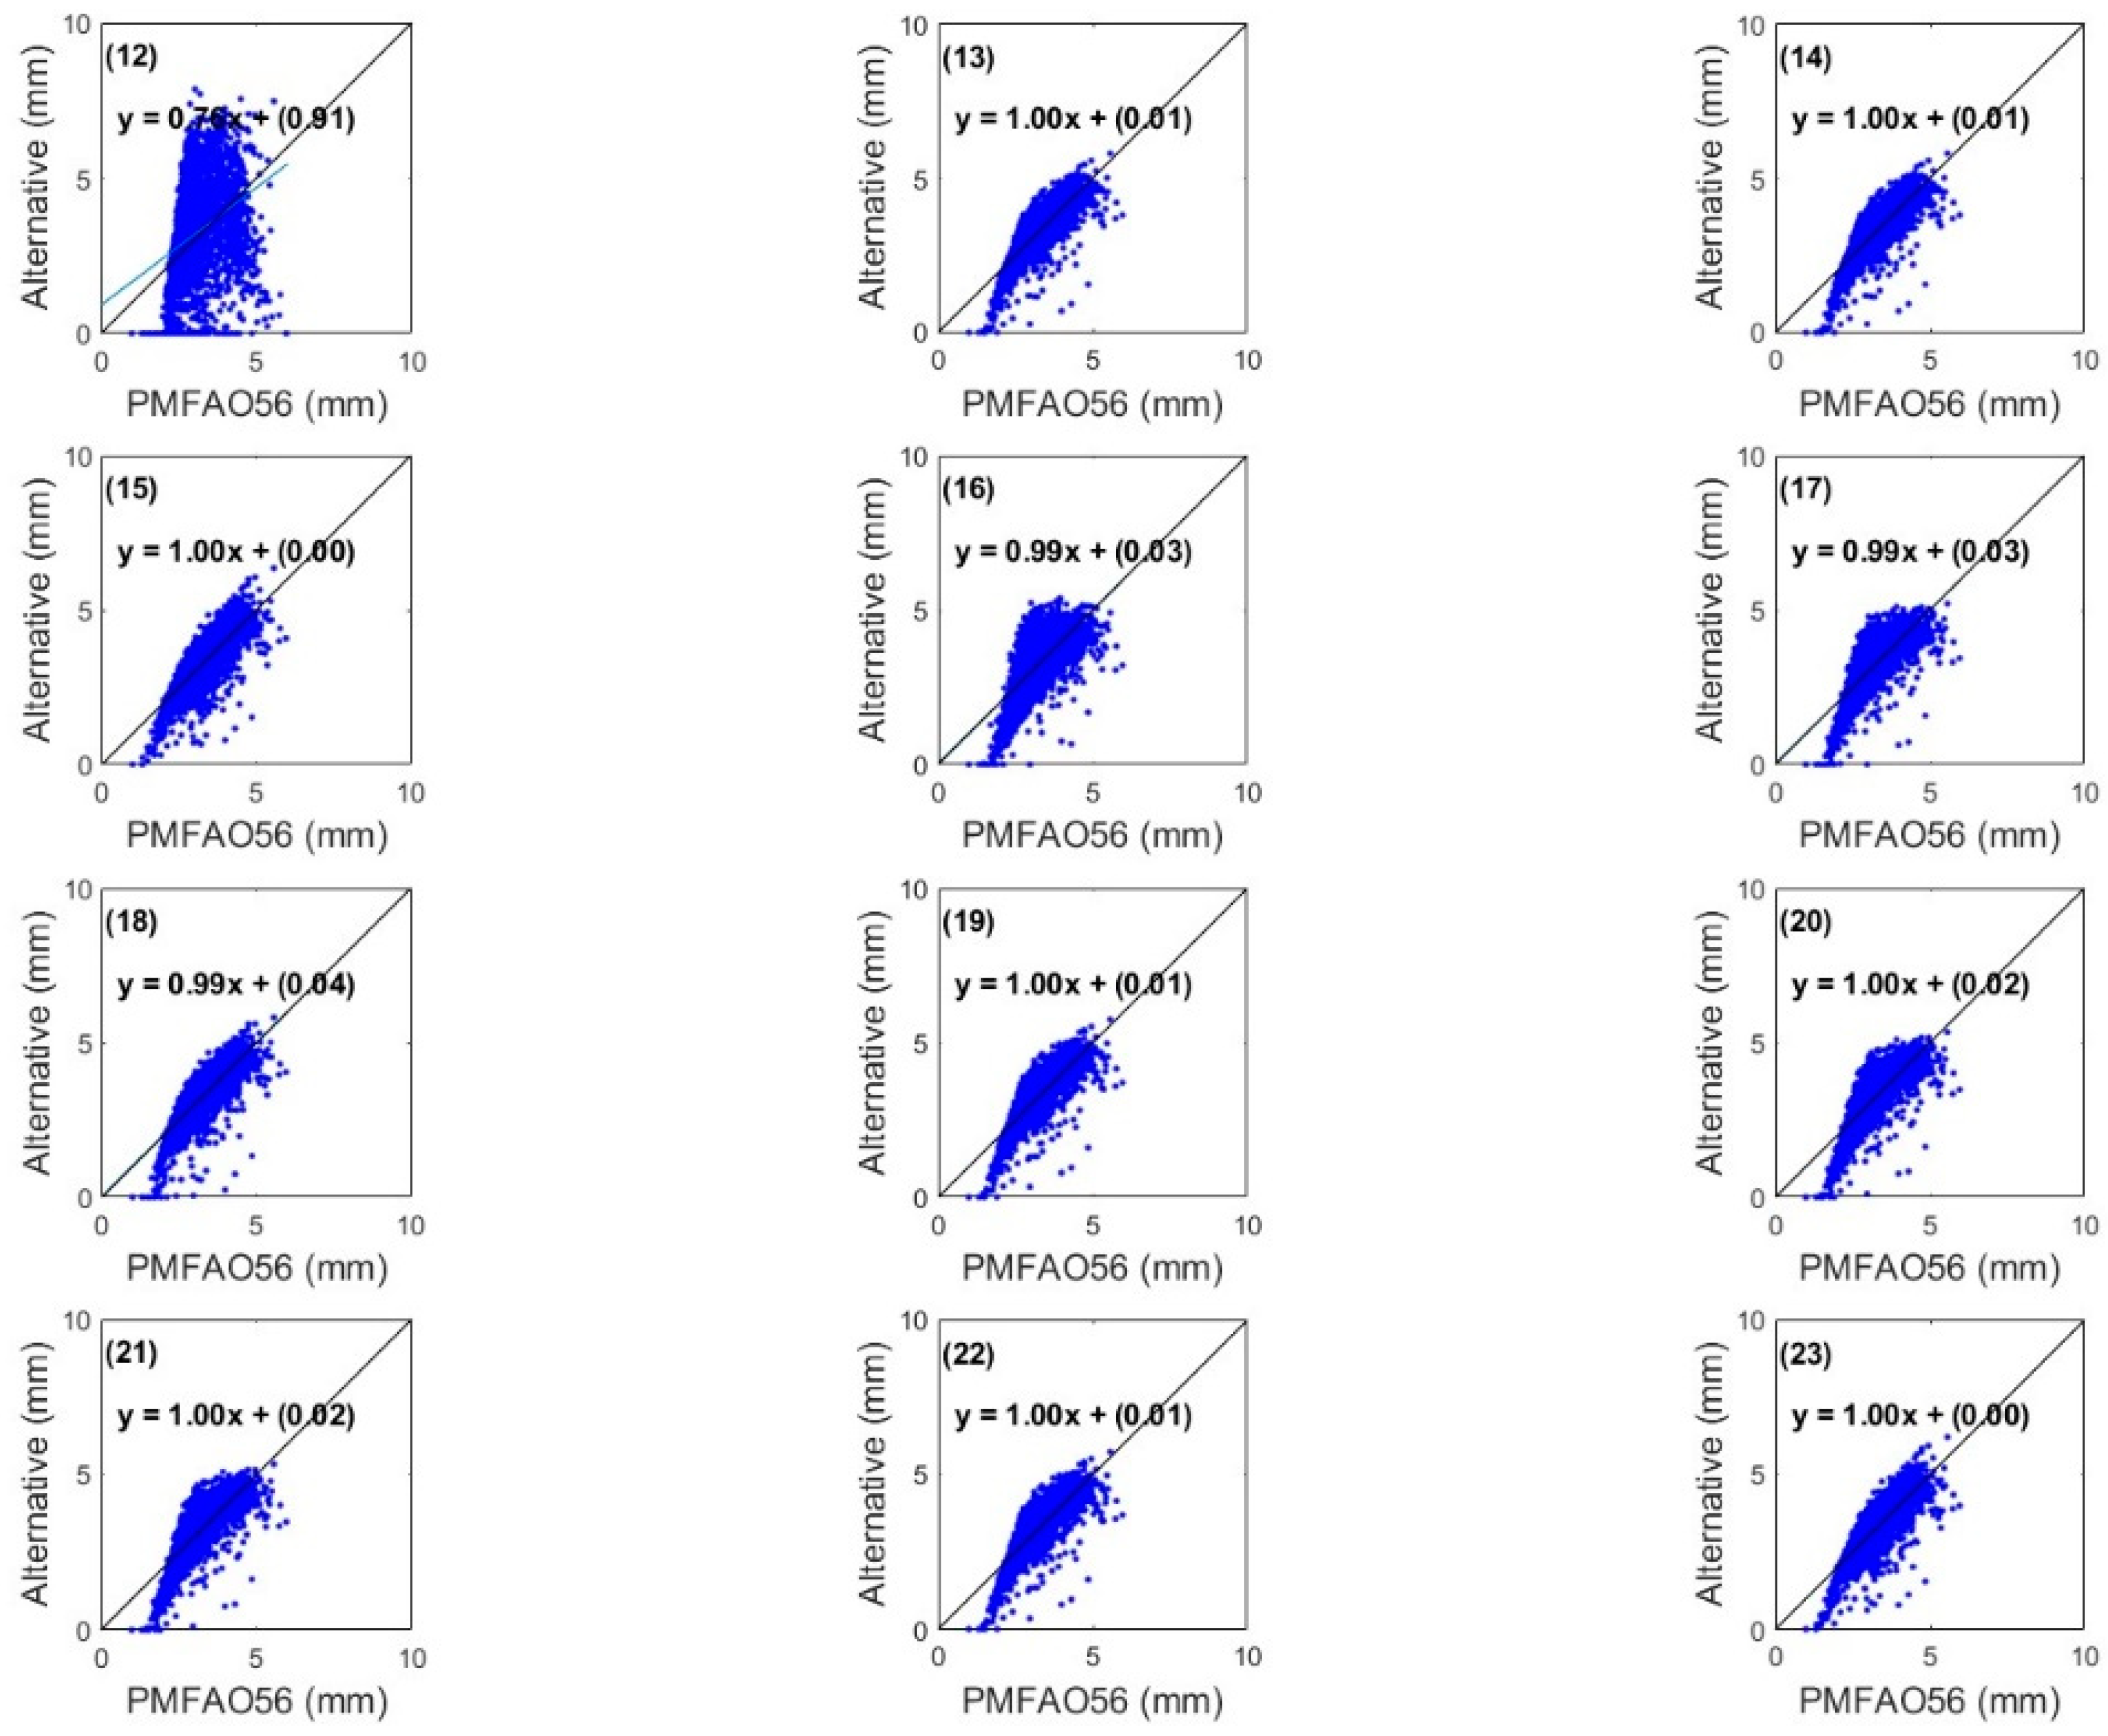
The correlation observed in solar radiation-based methods ranges from 0.53 (Priestley) to 0.81 (Hargreaves-4). The standard deviation shows underestimations between 0.13 and 0.47 mm/day. RMSE values range from 0.42 (Hargreaves-4) to 0.89 (Turc), and MAE values range from 0.32 (Hargreaves-1) to 0.69 (Priestley). According to Figure 11, the methods that demonstrate more uniform dispersion and less scatter are (13) Hargreaves-1, (14) Hargreaves-2, (19) Ravazani, and (26) Abtew-2.
The correlation observed for the mass transfer methods is between 0.75 (Romanenko) and 0.95 (Albrecht), with the standard deviation showing underestimations ranging from 0.02 to 0.19 mm/day. RMSE values range from 0.17 (Albrecht) to 0.51 (Romanenko), while MAE values range from 0.12 (Albrecht) to 0.36 (Romanenko). According to these statistical analyses, this group of methods demonstrated the best performance with regional adjustment.
The temperature-based methods at the RUOA station (Table 5) exhibit a strong positive correlation for each method, with values ranging from 0.82 (Hargreaves–Samani) to 0.92 (Ahooghalandari-2). The standard deviation indicates underestimations compared to the mean, ranging from 0.05 to 0.16 mm/day. RMSE values range from 1.32 (Ahooghalandari-2) to 2.96 (Trajovic), while MAE values range from 0.22 (Ahooghalandari-2) to 0.39 (Baier–Robertson). For this station, the methods that best align with the identity line according to regional calibration and dispersion data (Figure 13) are (10) Ahooghalandari and (11) Ahooghalandari-2.
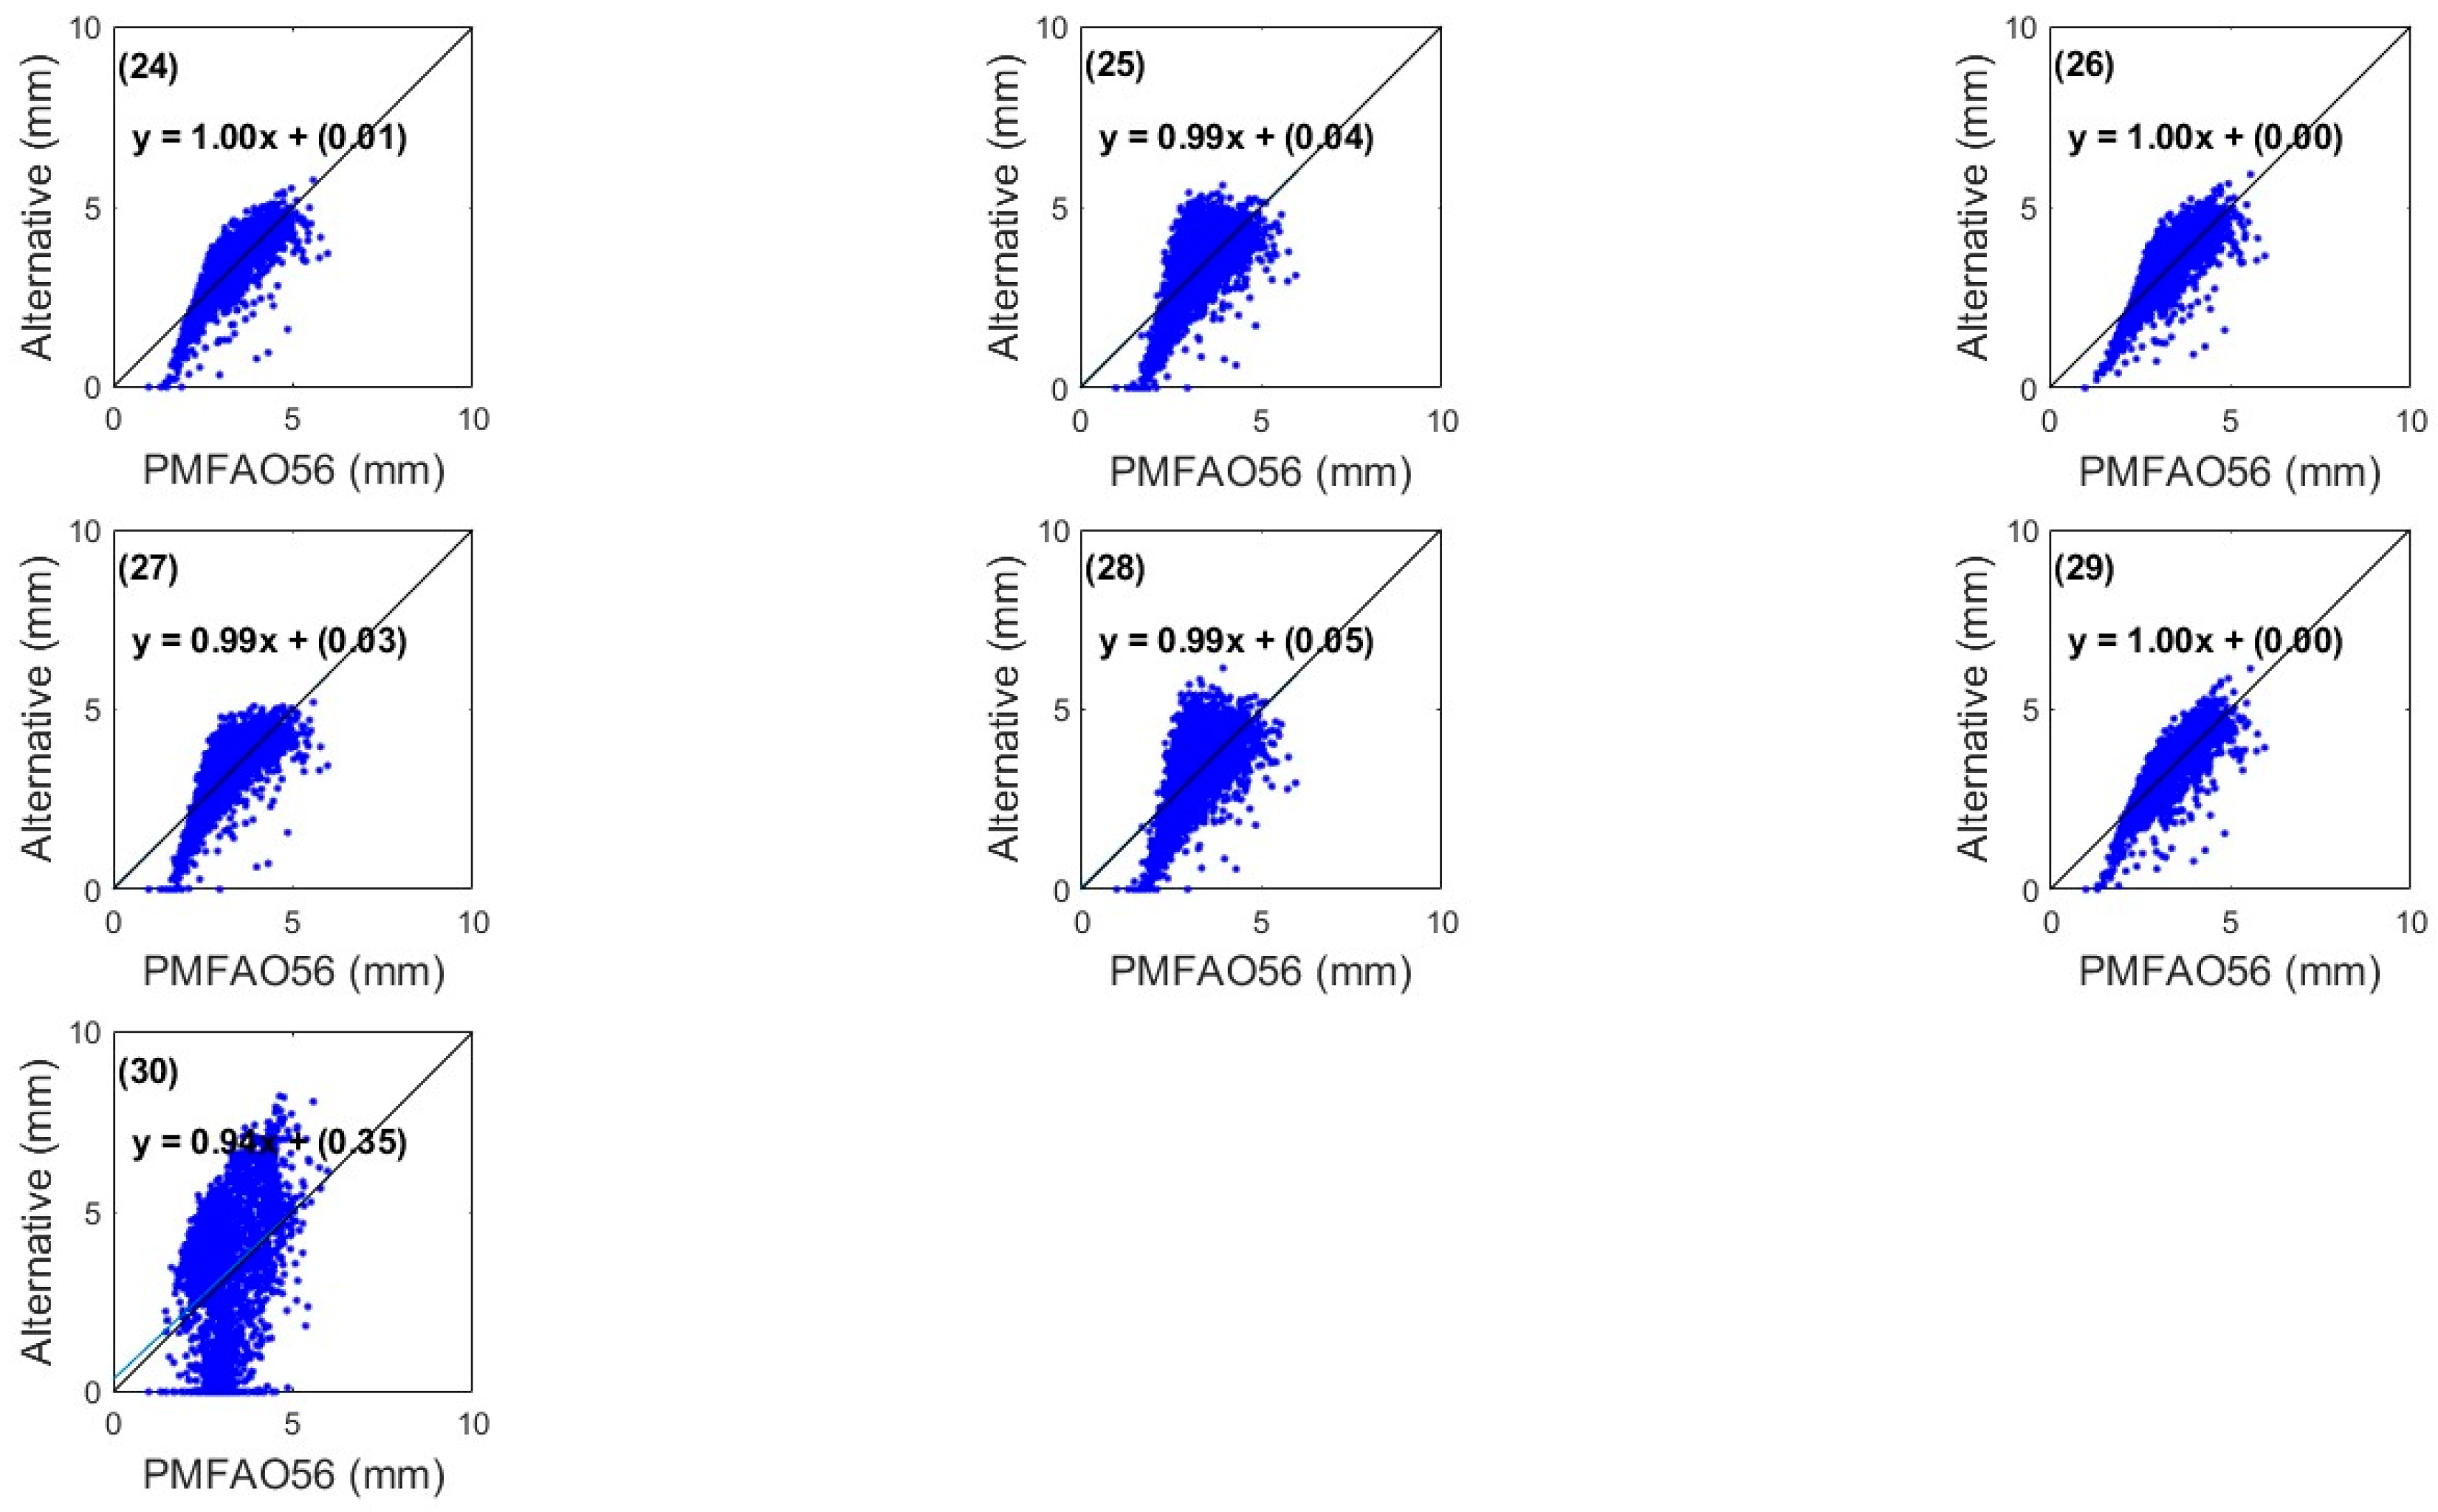
The solar radiation-based methods demonstrate a correlation between 0.33 (Priestley) and 0.83 (Outdin), with a standard deviation showing underestimations between 0.42 (Tabaritalaee-2) and 1.23 (Turc) mm/day. RMSE values range from 0.42 (Hansen) to 6.46 (Ravazani), and MAE values range from 0.36 (Outdin) to 1.61 (Turc). According to Figure 14, methods that showed improved fit due to regional recalibration include (13) Hargreaves-1, (14) Hargreaves-2, (19) Ravazani, and (26) Abtew-2.
All of the mass transfer methods show a positive correlation, indicating an excellent regional fit, with values ranging from 0.92 (Romanenko) to 0.98 (Trabert). The standard deviation indicates underestimations between 0.018 and 0.05 mm/day. RMSE values range from 0.60 (Penman) to 4.89 (Albrecht), and MAE values range from 0.10 (WMO) to 0.22 (Romanenko). According to the calibration, the methods with the best fit to the identity line in Figure 15, which exhibit almost perfect alignment and uniform dispersion, include (33) Rohnwer, (34) Albrecht, (35) WMO, (36) Trabert, (37) Brockamp–Wenner, and (38) Mahringer.
Based on the determination of the Standardized Precipitation Evapotranspiration Index (SPEI), a comparison was made between each evapotranspiration calculation method and the FAO standardized method. The temporal scales investigated were monthly and every 3, 6, 9, and 12 months. This study presents the results on a monthly, 3-month, and 6-month scale, as illustrated in Figure 19, Figure 20, Figure 21, Figure 22, Figure 23, Figure 24, Figure 25, Figure 26 and Figure 27 for each group and station.
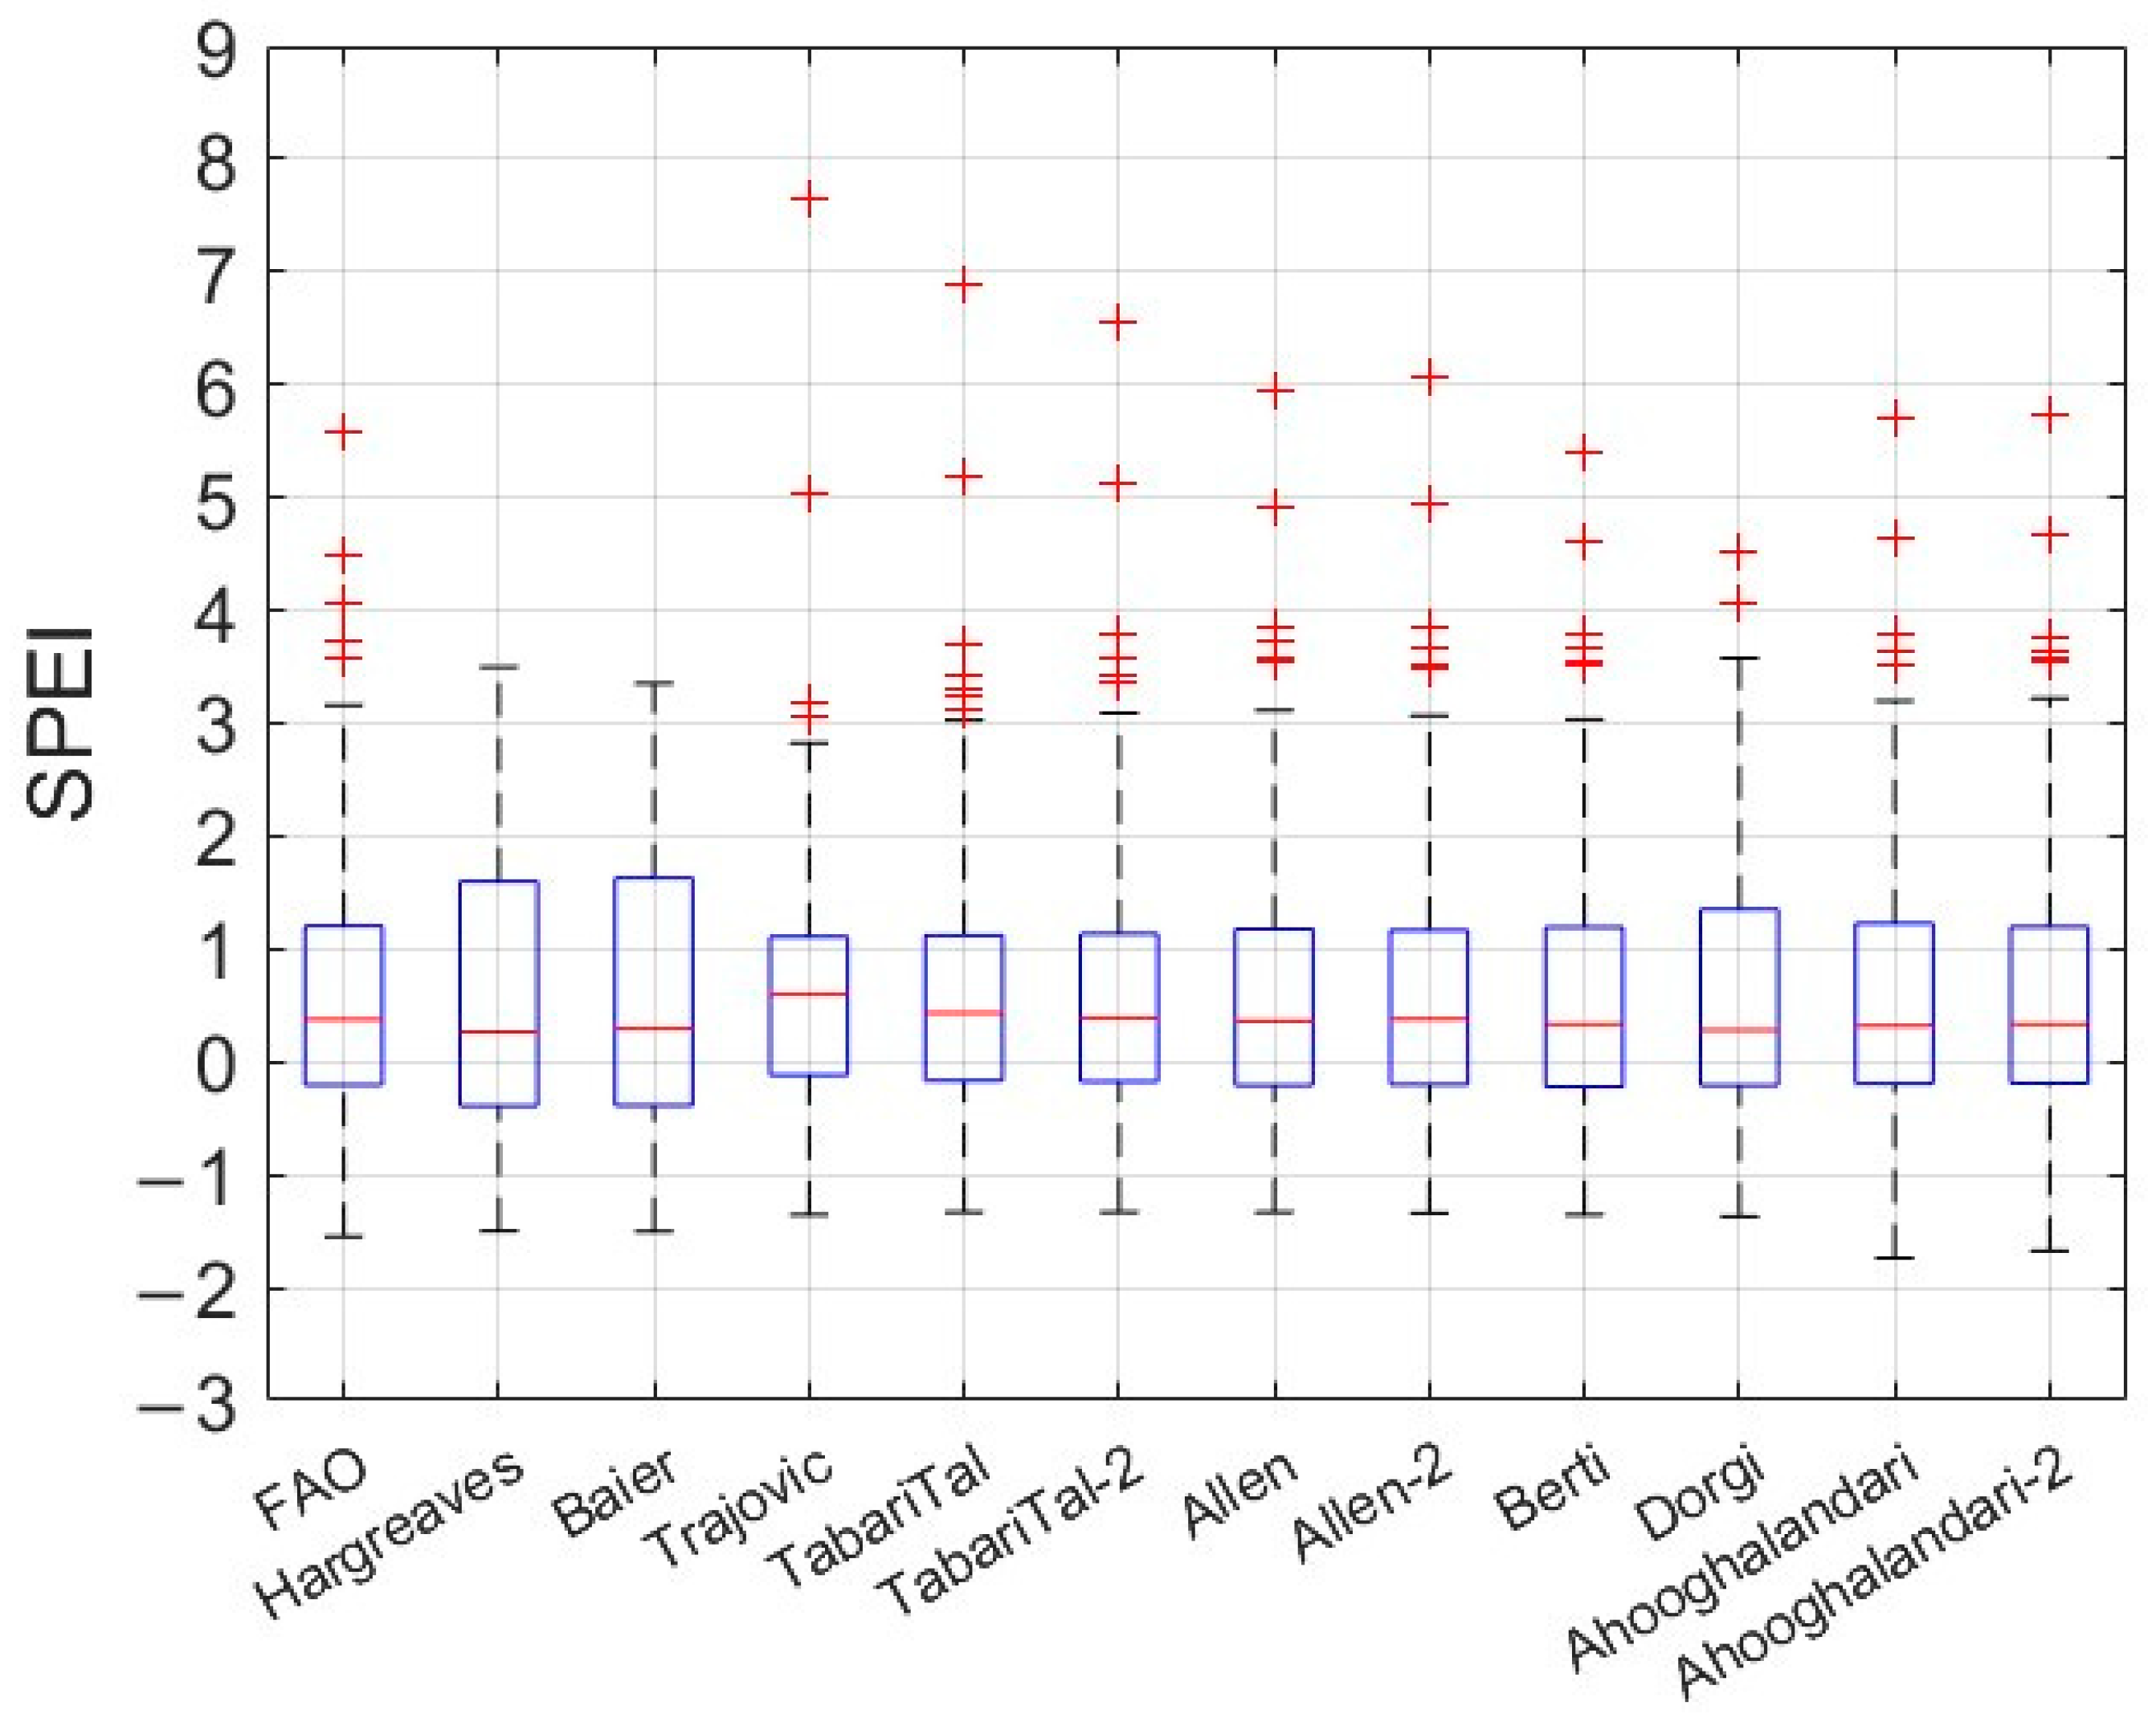
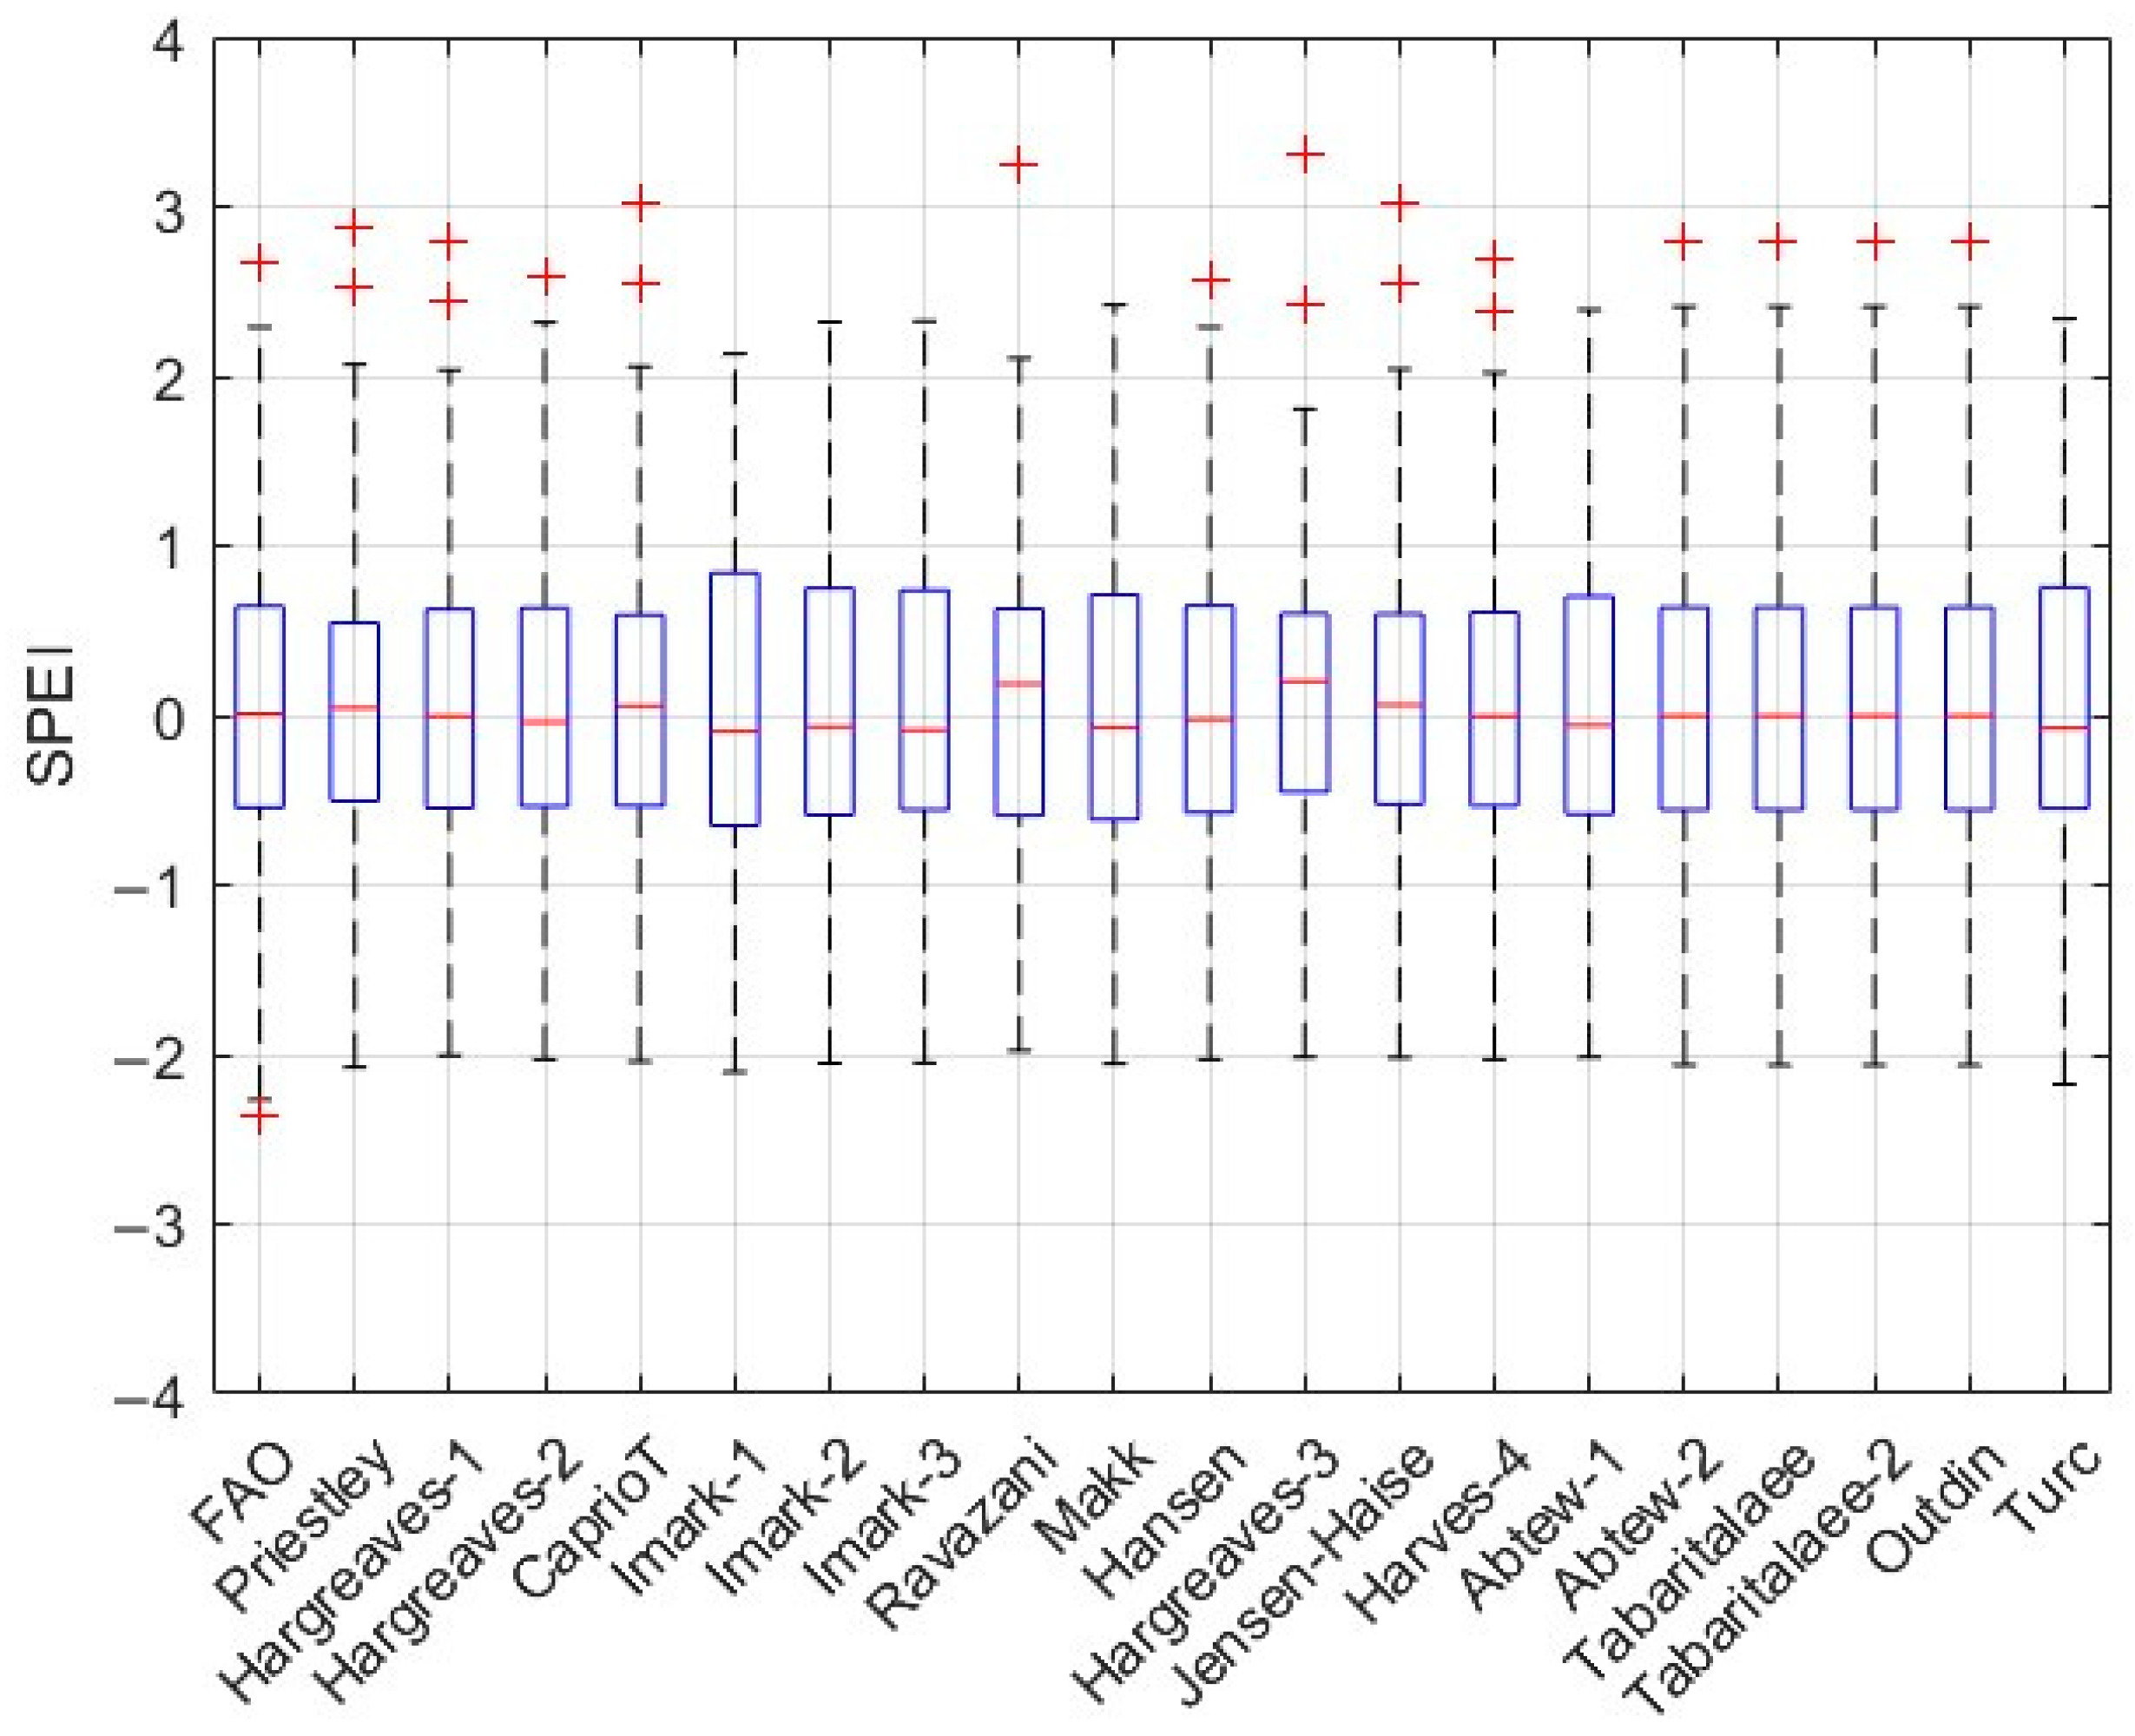
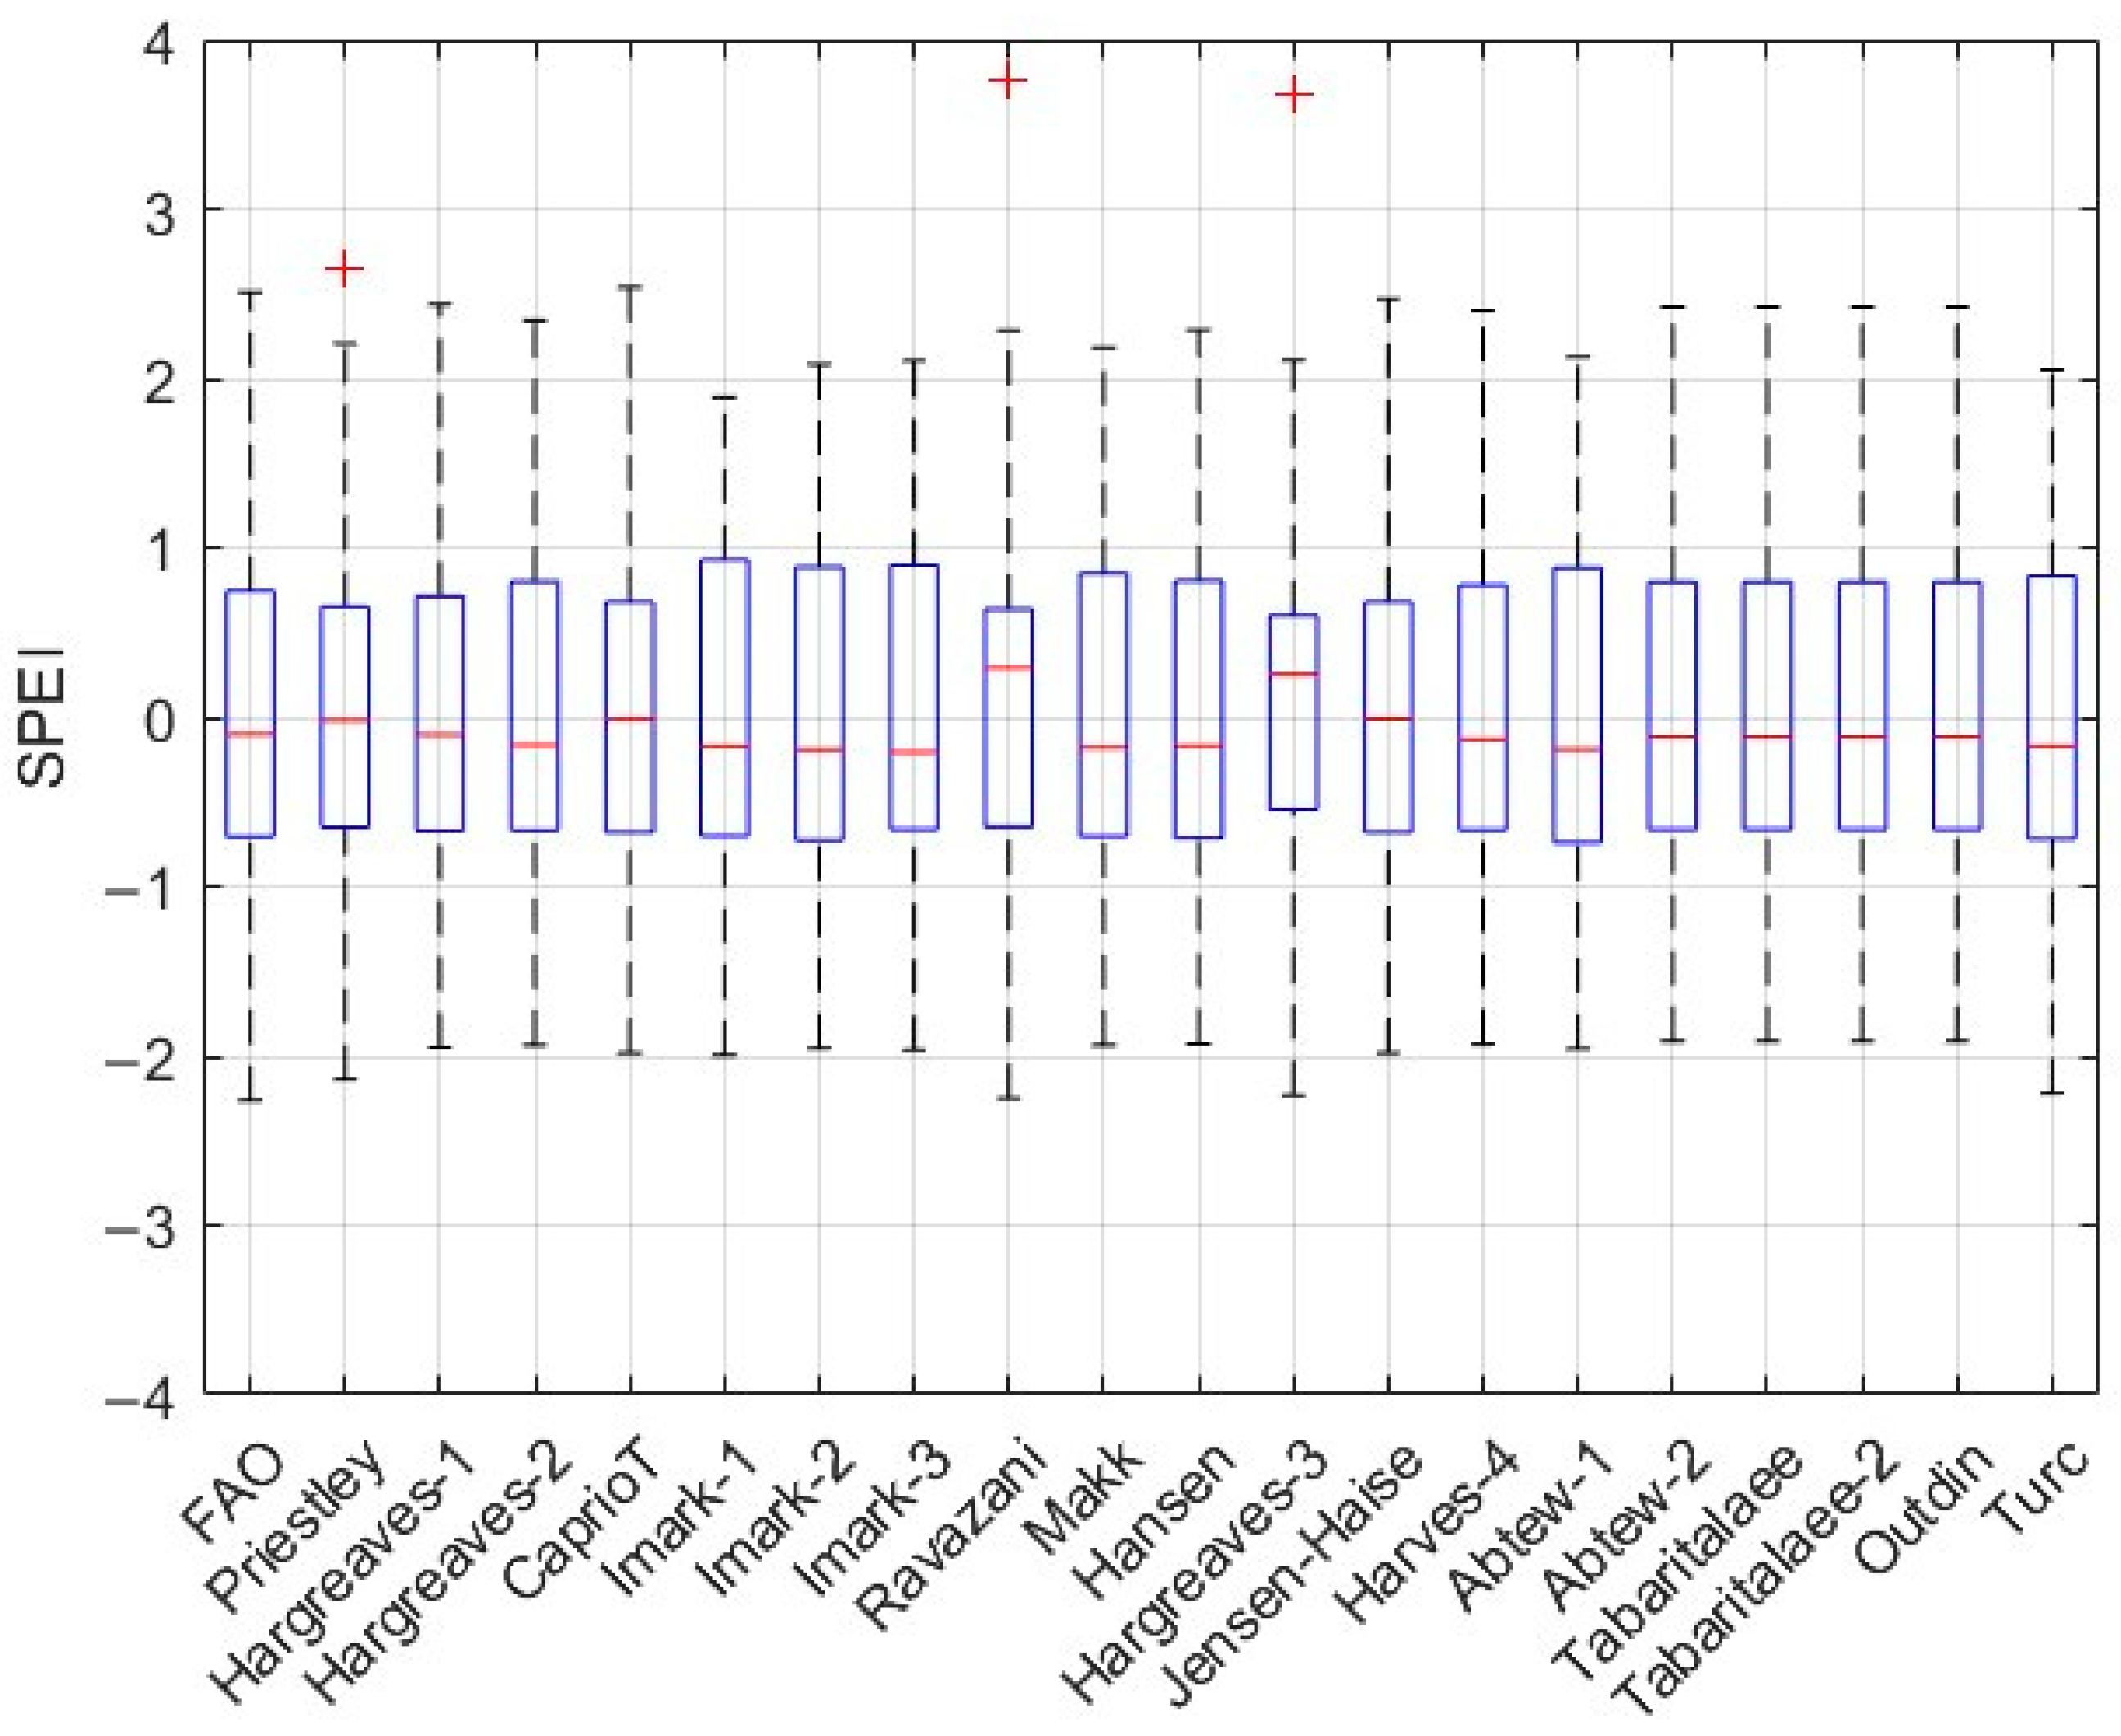
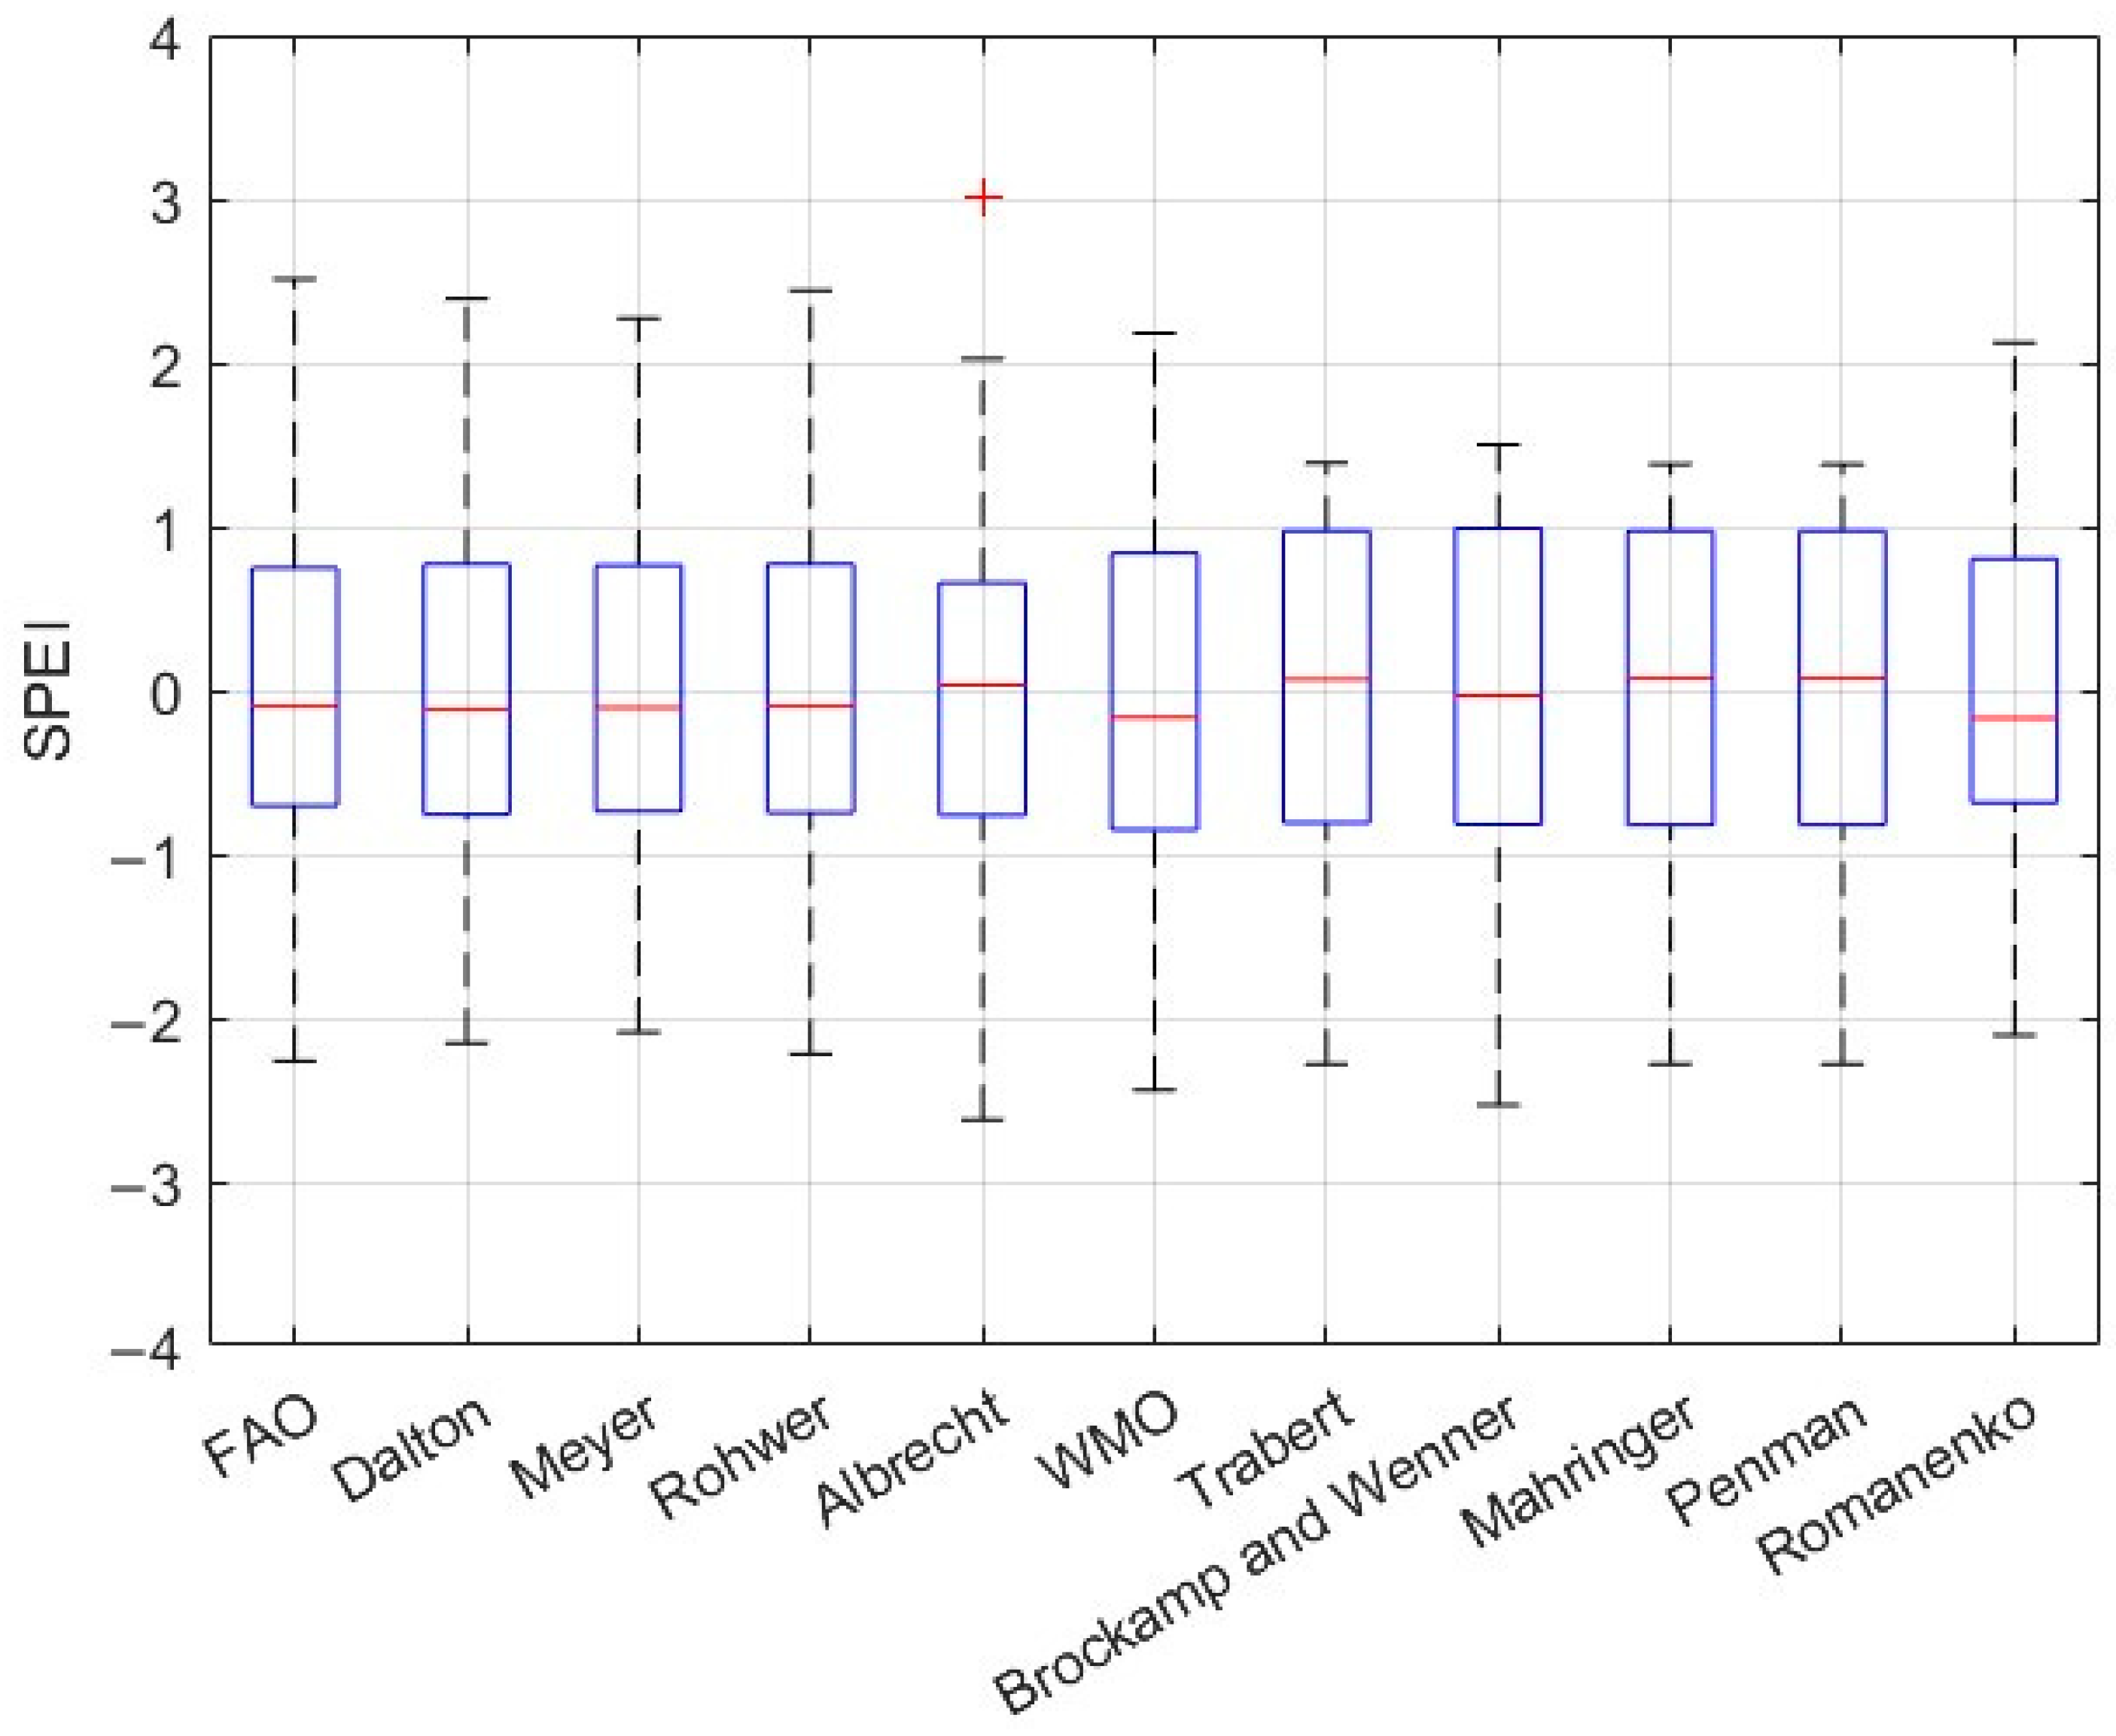
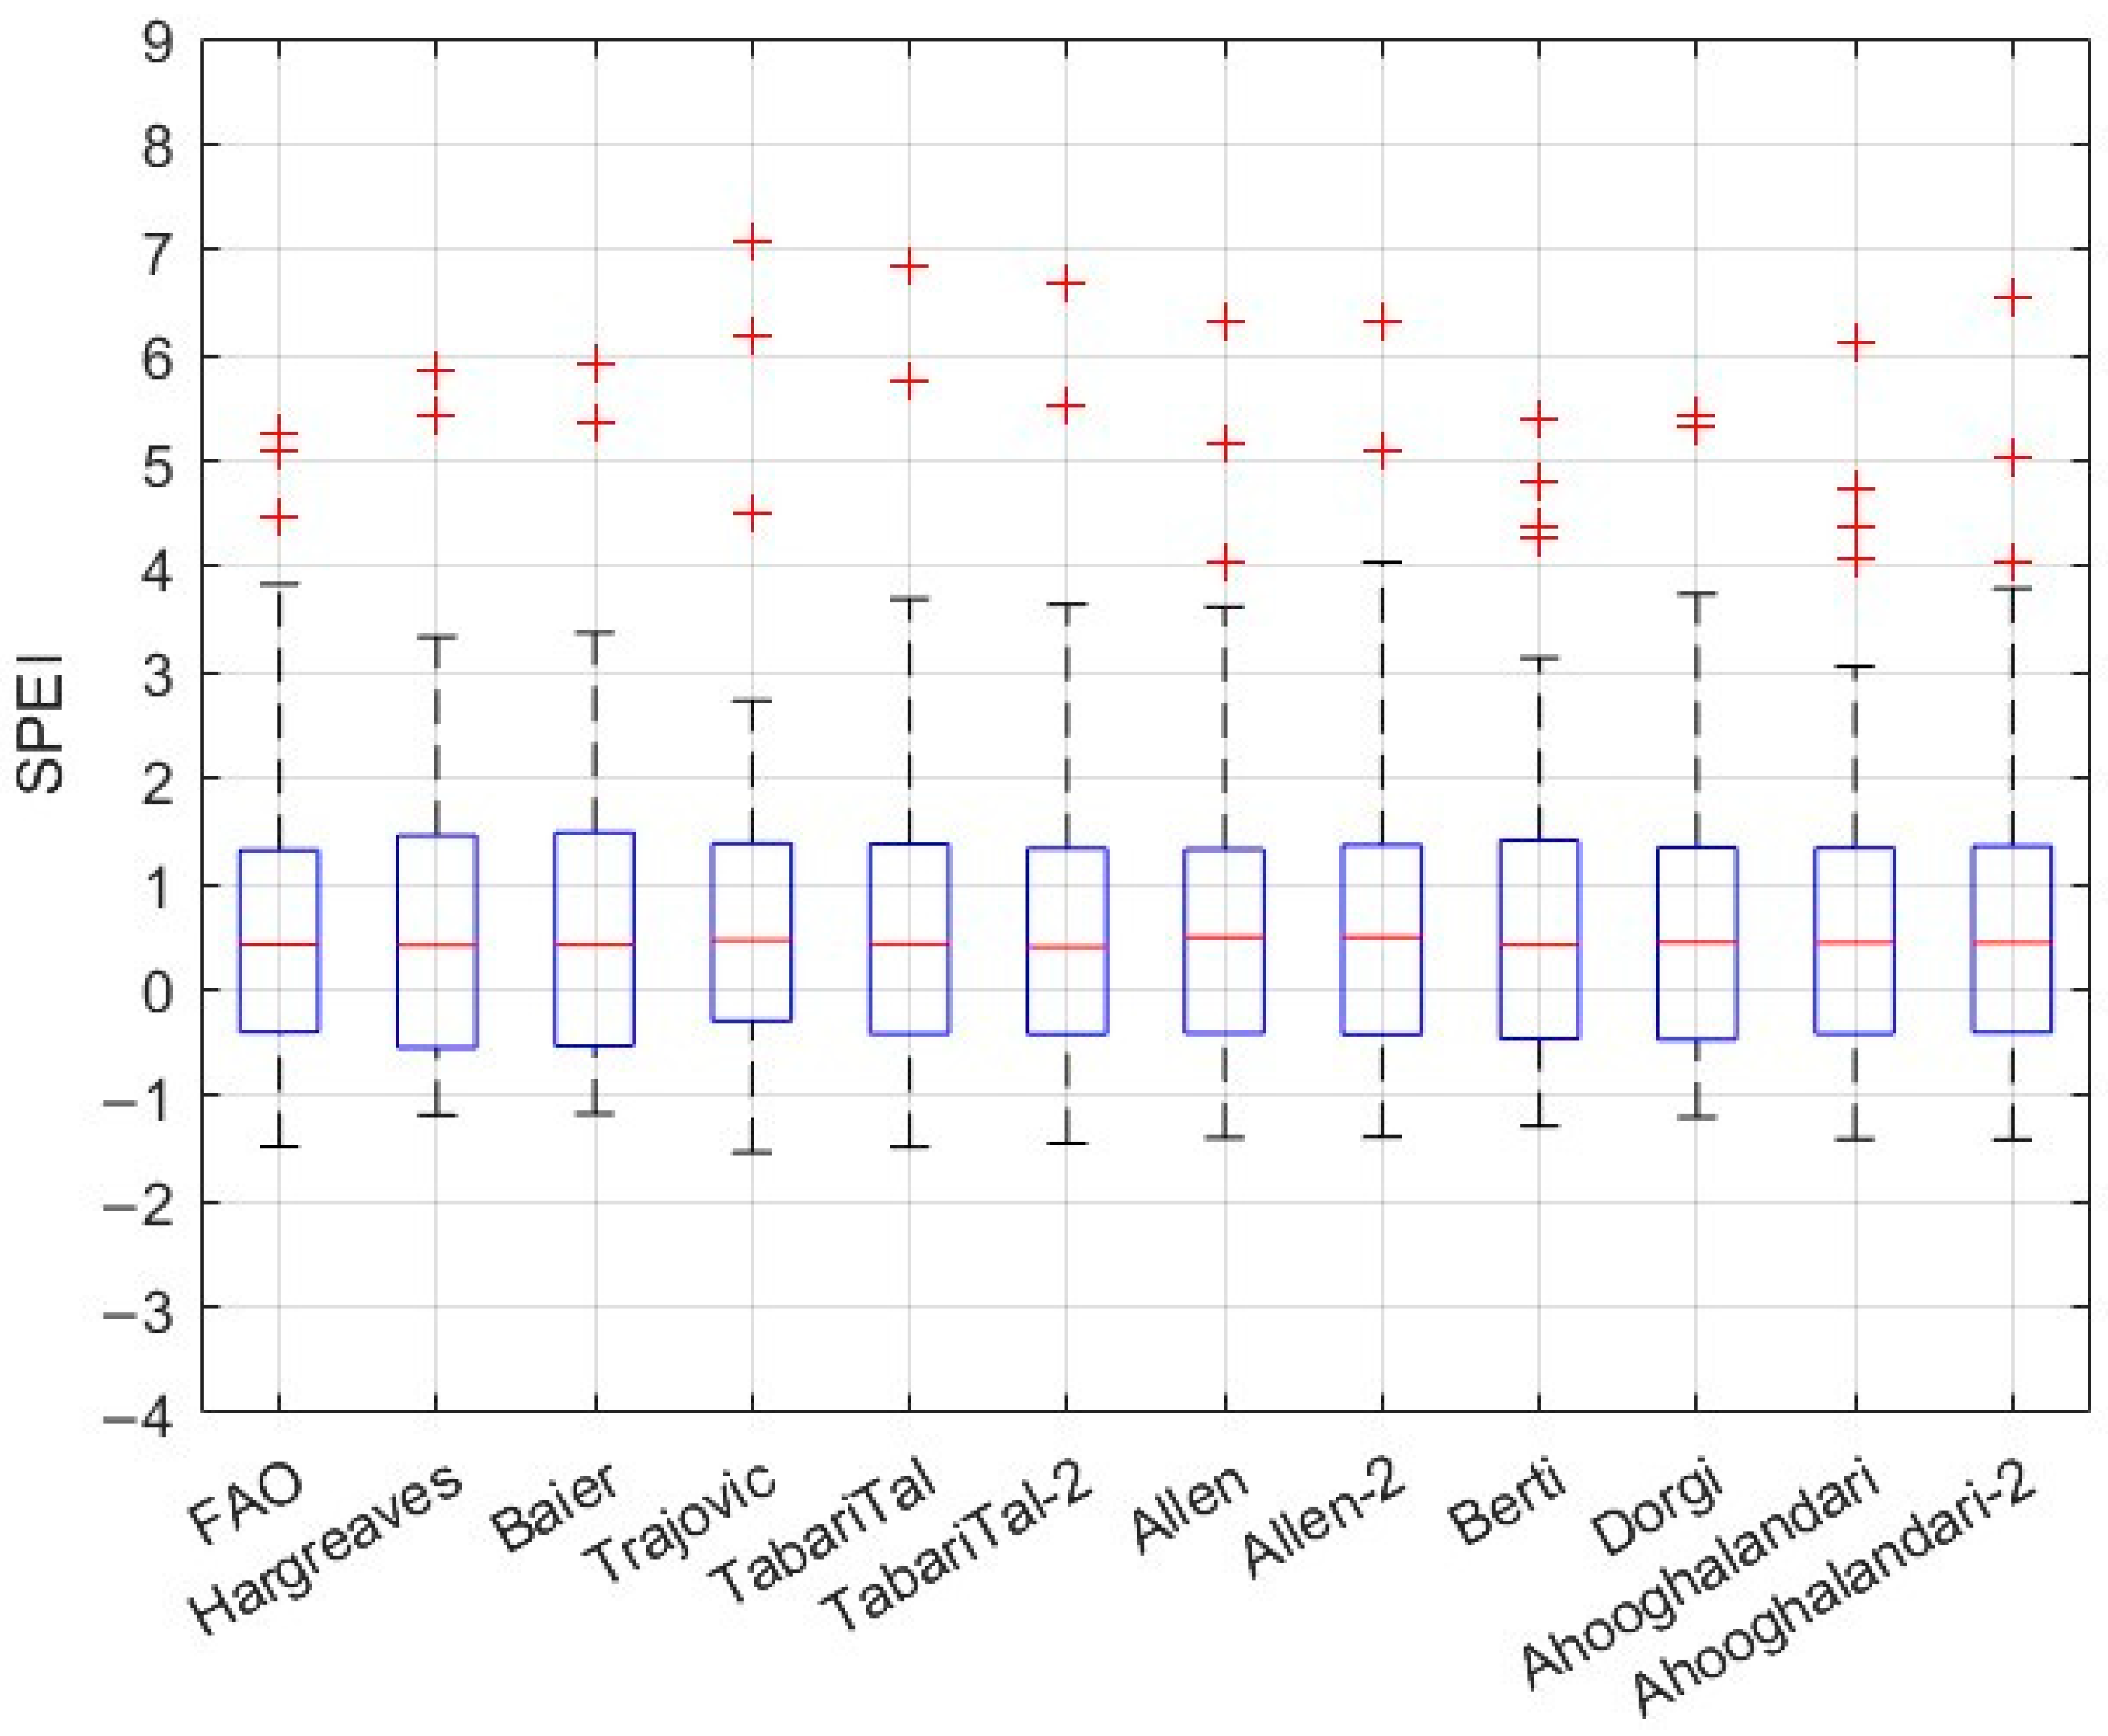
According to the previous Figure 19, Figure 20 and Figure 21, the application of the SPEI calculation is demonstrated. In Figure 19, the distribution is not uniform across the applied methods, but the averages of each box tend to have similar behavior compared to the FAO method. However, it should be noted that the red dots may indicate outliers. In Figure 20, the radiation-based methods are no exception, as there are outliers, but not as pronounced as in the temperature-based methods. The mean concerning the FAO method shows both overestimation and underestimation, resulting in a lack of uniformity. Figure 21, which addresses the mass transfer methods, exhibits a better correlation, showing a uniform data distribution. The mean tends to be very similar to the FAO method, and it does not exhibit multiple outliers as observed in the radiation-based methods.
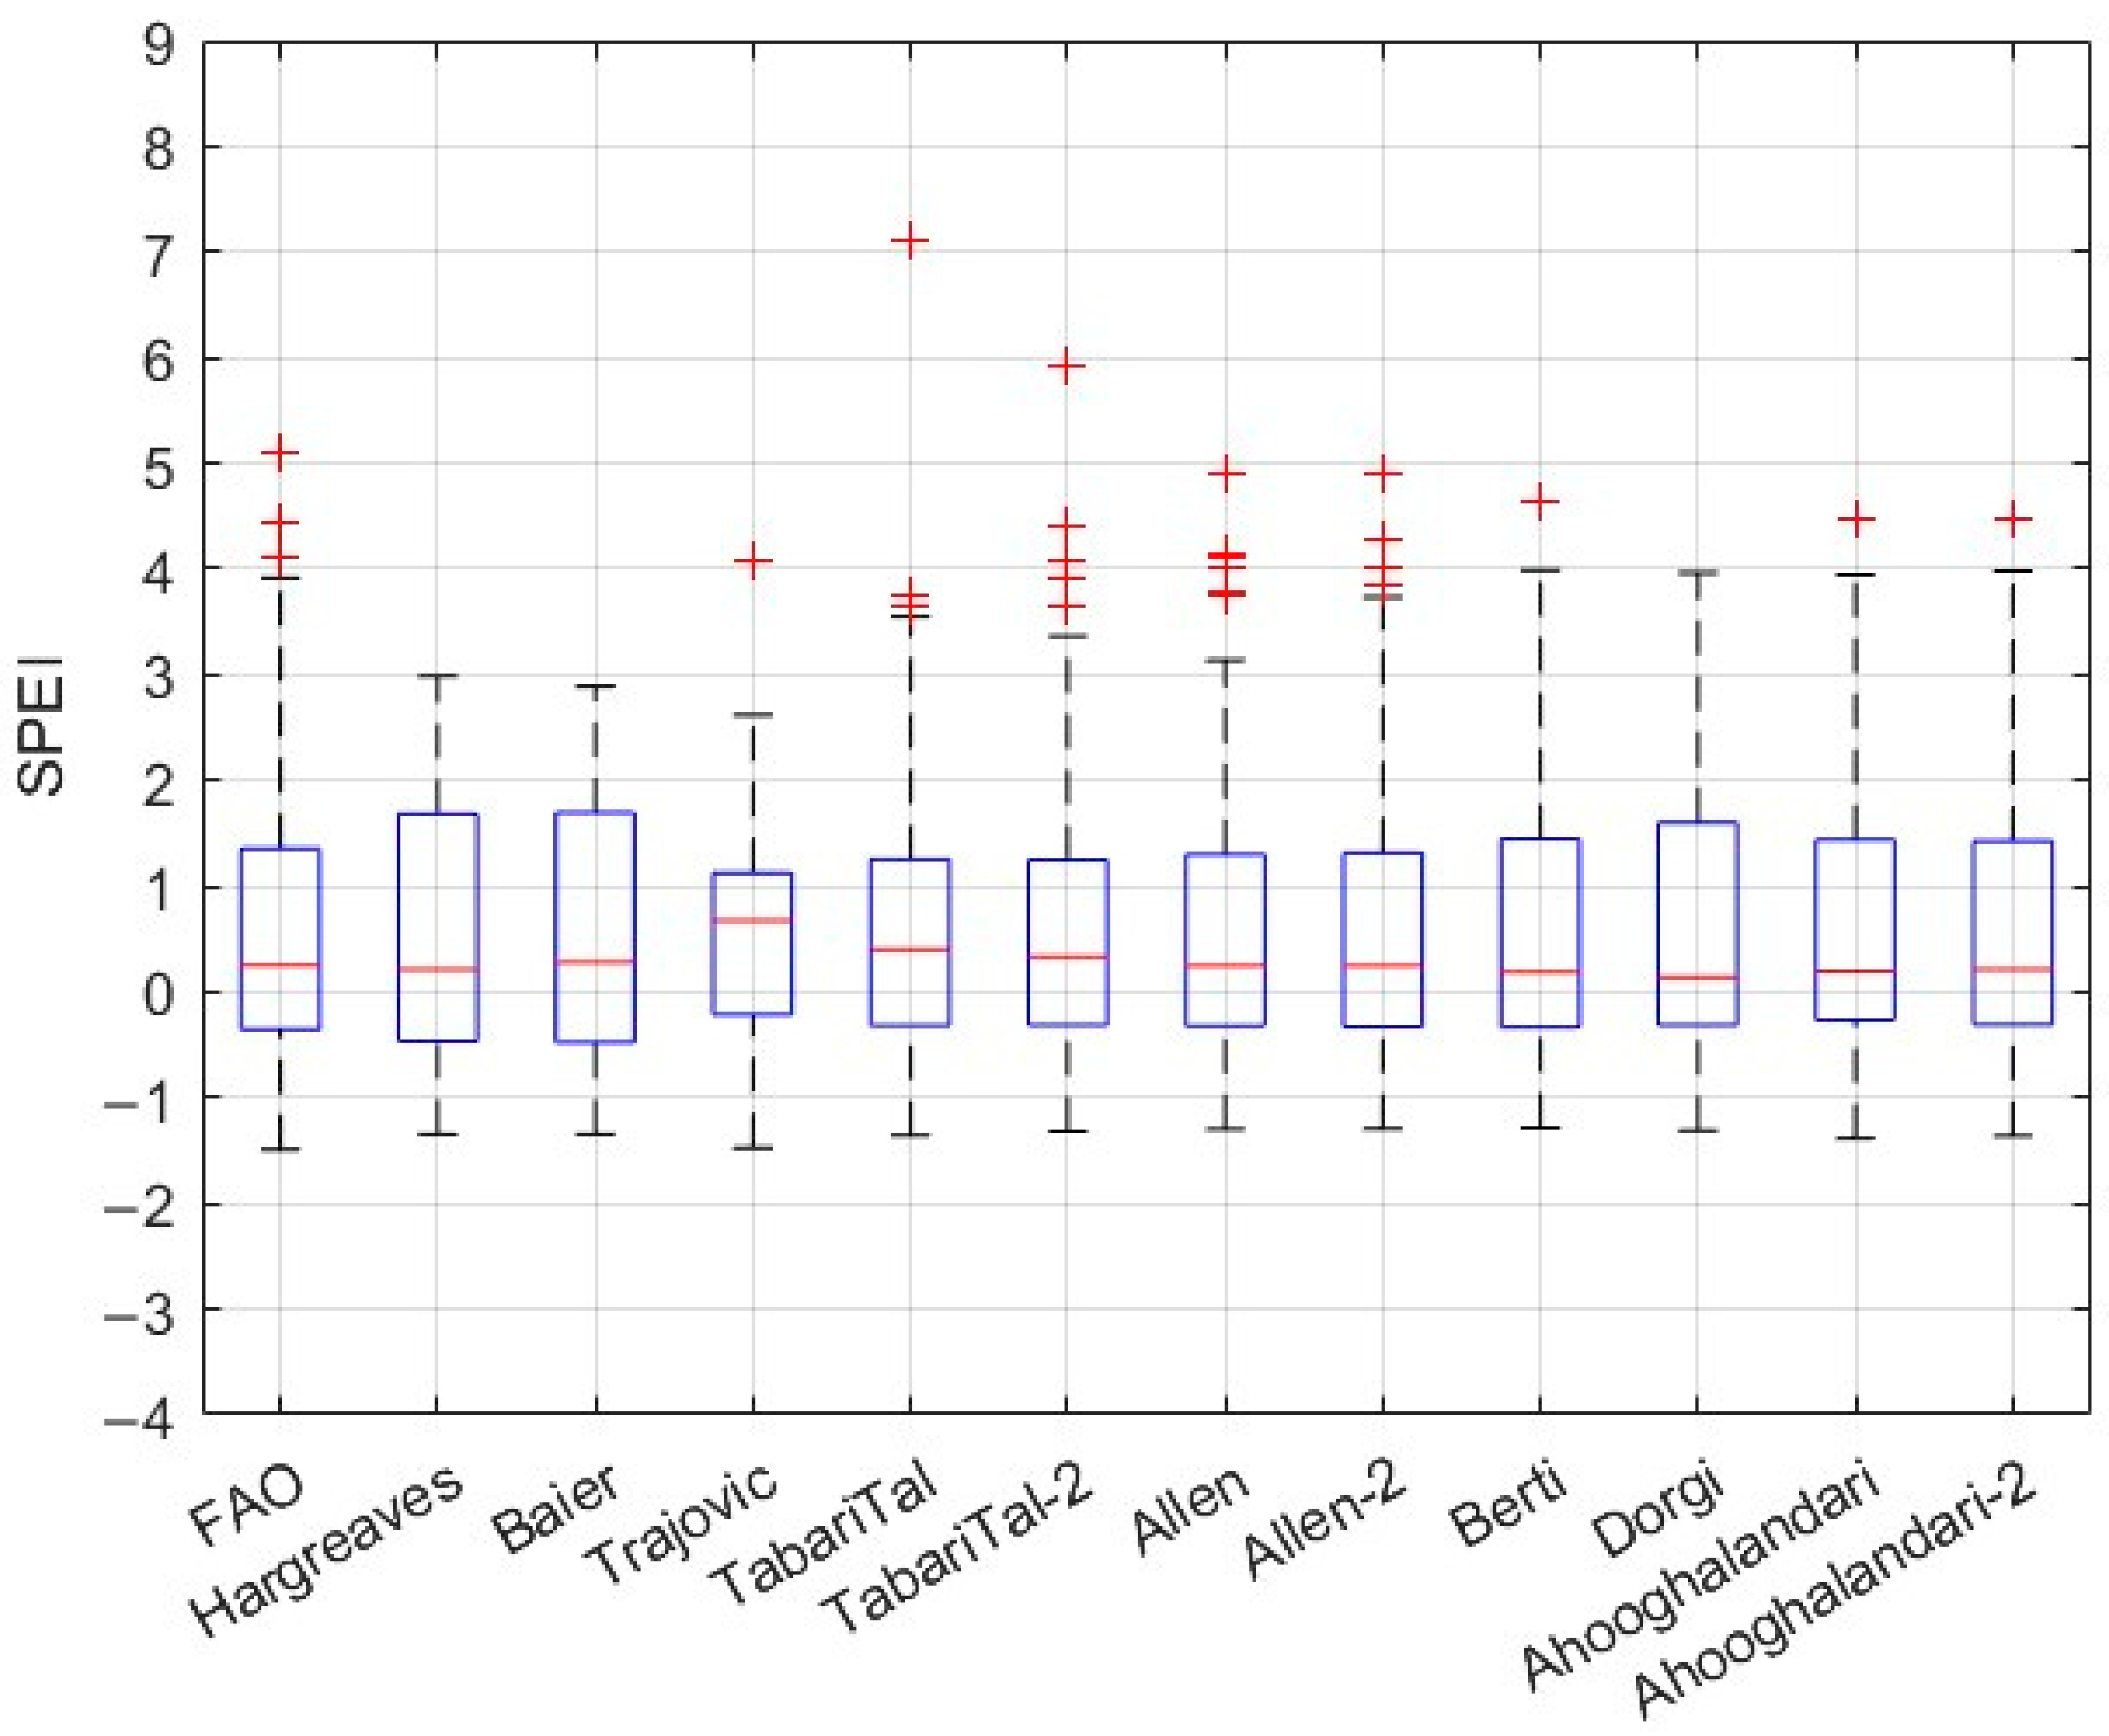
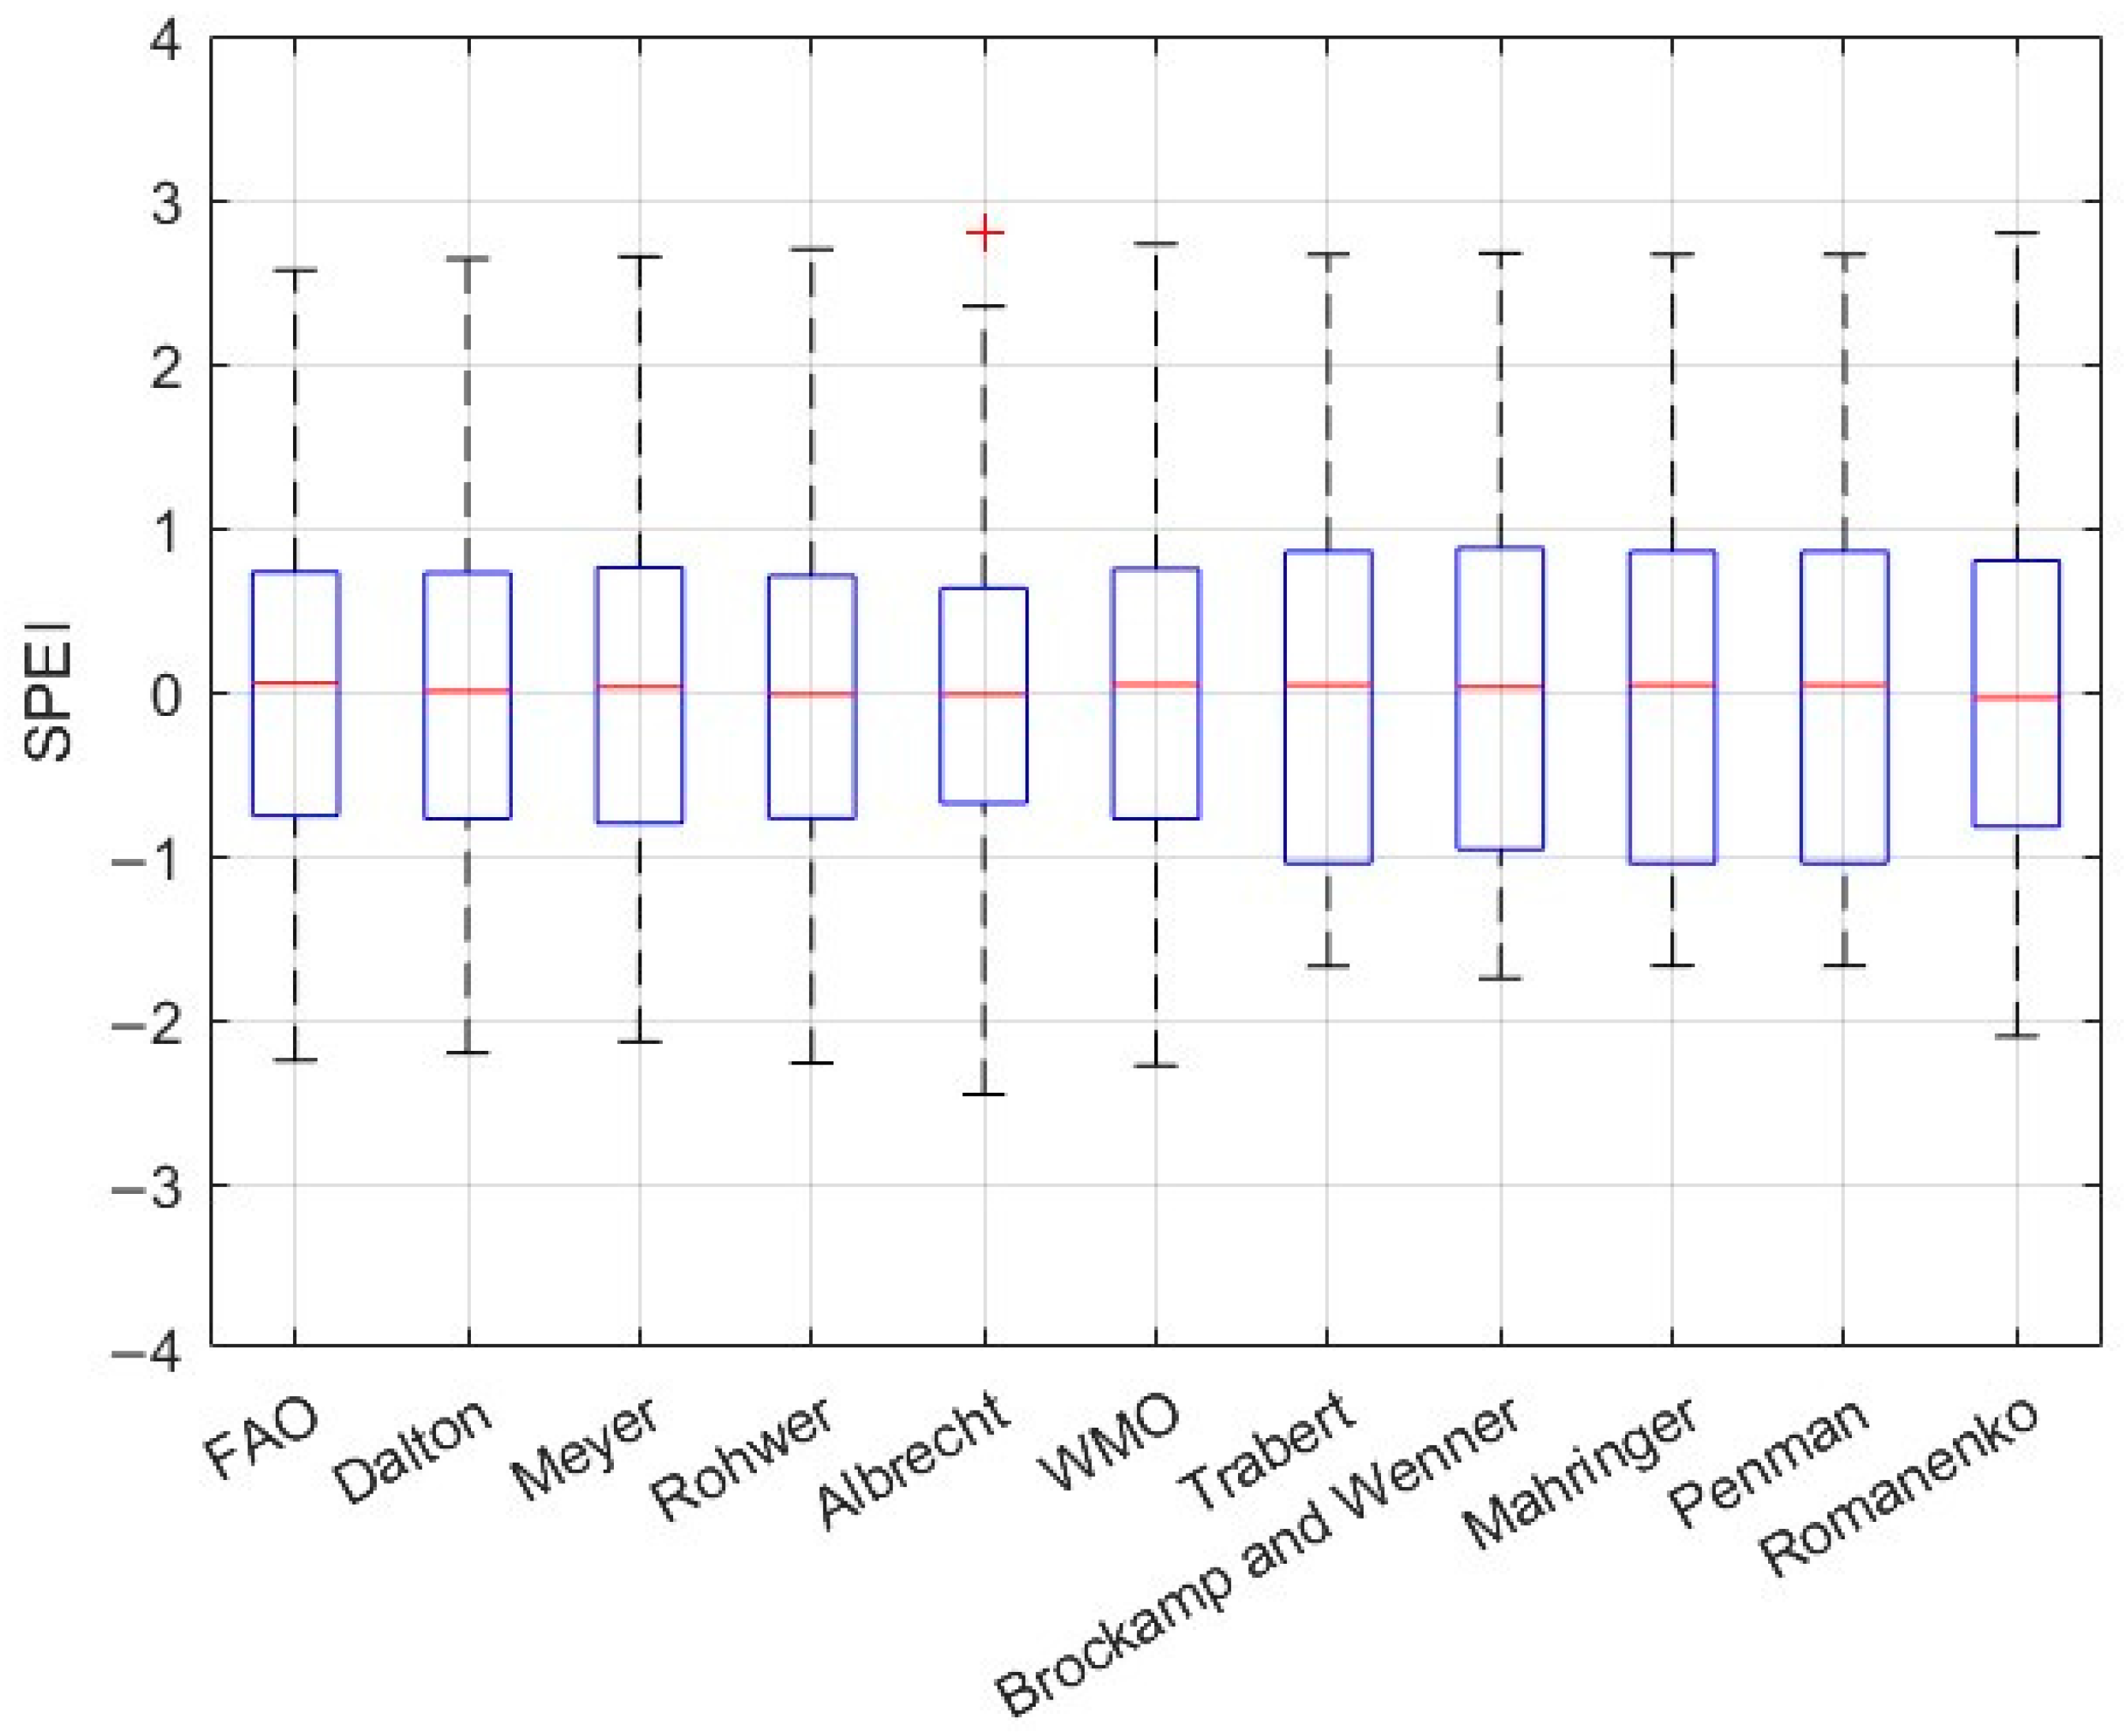
Based on Figure 22, Figure 23 and Figure 24, the 3-month accumulated data reveal a reduction in outliers and a decrease in the vertical range of values. The most notable case is the radiation method (Figure 23). When compared to the monthly method (Figure 20), the red points decrease, and the data distribution becomes more uniform and extends along the vertical axis. However, the means tend to deviate from those of the FAO method. Finally, Figure 24 continues to demonstrate uniformity in data distribution.
For the 6-month SPEI calculation, the temperature methods exhibit a pattern of atypical events similar to those observed in the monthly and 3-month calculations. However, the data distribution remains consistent across methods, and the mean values tend to be uniform (Figure 25). In the radiation methods (Figure 26), outliers disappear, resulting in a uniform data distribution and similar mean values. This uniformity is also observed in the mass transfer methods (Figure 27).
According to Table 6, the summary illustrates the improvements of methods with regional calibration compared to the FAO method. It highlights that mass transfer methods demonstrated the best fit for the study area, followed by temperature-based methods and radiation-based methods.

4. Discussion

The present study investigates the influence of different methods for calculating daily evapotranspiration (ETo) on the Standardized Precipitation Evapotranspiration Index (SPEI), an important indicator for monitoring drought and wet conditions. While the SPEI was initially developed using monthly data, this research explores how the shift to daily data impacts the final results, particularly when employing 40 distinct methods for calculating ETo.
Moreover, a detailed review of the methods was used to estimate daily potential evapotranspiration (ETo), dividing them into three main categories: temperature-based, solar radiation-based, and mass transfer-based methods. Below, we discuss some of the key considerations of these approaches, with an emphasis on their applicability in different climatic contexts, specifically the case of Mexico. Temperature-based methods are the most widely used due to their simplicity and the specific temperature requirements for their development. One advantage of temperature-based methods is their ability to be applied across a variety of regions, but they also have limitations, particularly in more humid areas. Solar radiation-based methods are also fundamental, particularly on global and regional scales. These methods require measurements of maximum and minimum air temperatures as well as incoming solar radiation. They are especially useful in arid climates. Mass transfer-based methods, also known as aerodynamic methods, focus on the transfer of water vapor from the evaporating surface to the atmosphere. These methods, such as Dalton and Penman, focus on variables like wind speed and relative humidity, which affect the evapotranspiration rate. The advantage of these approaches is that they can provide accurate ETo measurements, especially when specialized instruments like evaporation tanks are used.
The study demonstrates how the choice of ETo method affects the distribution of SPEI values and their categorization into drought or wet conditions. The results illustrate how the distribution of SPEI values varies depending on the method used. Notably, temperature-based methods show significant variability, with outliers appearing more frequently. This suggests that temperature-based methods may not always provide the most accurate representation of ETo, especially under certain climatic conditions.
On the other hand, radiation-based methods also show some outliers but not to the same extent as the temperature-based methods. These methods, while still prone to some inconsistencies, generally provide a more uniform distribution of data compared to the temperature-based methods. The mass transfer methods, however, exhibit the best correlation with the FAO method, with a more consistent and uniform data distribution, suggesting that they might be more reliable for the study area. The findings support the notion that regional calibration of methods is essential for improving the precision of drought and wetness monitoring, as it accounts for local climatic variations that may not be fully captured by global methods like the FAO approach. Mass transfer methods, due to their sensitivity to local environmental conditions such as wind speed and humidity, demonstrate their superior performance in capturing the nuances of the local climate.

5. Conclusions

In Mexico, the application of various methods for calculating evapotranspiration has not been extensively studied. This research aims to identify the most effective method based on available climatological data. Data from the utilized station indicate that temperature-based methods are the most accurate due to the availability of variable records. However, radiation-based methods demonstrated greater accuracy than the FAO method.
This article presents the calculation of Multi-SPEI-ETo using 40 different methods for daily evapotranspiration and the influence and importance of these methods. Additionally, modifications of various methods adapted to the study area’s climatology are discussed. These advancements contribute to calculating drought indicators (SPEI), quantifying irrigation requirements, studying climate change, and managing water resources.
Local adjustments are necessary for optimal performance when comparing the 40 methods to the FAO method. Initially, the best-performing methods were those based on temperature, radiation, and mass transfer. After adjusting the constants, mass transfer-based methods perform the best, followed by temperature-based and radiation-based methods.
Regarding the required variables, mass transfer-based methods require the most variables, followed by radiation-based methods and temperature-based methods. The choice of method depends on the specific case. For developing countries like Mexico, adjusted temperature-based methods are recommended when information is limited.
The influence of multi ETo on multiscale SPEI is an underexplored area that this study addresses. The Multi-SPEI-ETo allows for the calculation and adjustment of different ETo methods and the comparison of the SPEI of different methods, provided the necessary variables are available. The calculations are accumulated over 3, 6, 9, and 12 months, allowing for observing meteorological, agricultural, and hydrological droughts.

Author Contributions

Conceptualization, J.H.B. and B.L.-L.; methodology, J.H.B. and J.P.-L.; software, T.M.-A. and J.H.B.; validation, C.D.-S. and J.H.B.; formal analysis, T.M.-A. and J.H.B.; investigation, J.H.B. and T.M.-A.; resources, C.D.-S.; data curation, T.M.-A.; writing—original draft preparation, J.P.-L. and J.H.B.; writing—review and editing, C.D.-S. and B.L.-L.; visualization, J.P.-L.; supervision, B.L.-L.; project administration, C.D.-S.; funding acquisition, C.D.-S. and B.L.-L. All authors have read and agreed to the published version of the manuscript.

Funding

The authors acknowledge the support Institute of Science, Technology and Innovation (ICTI) for its financial support through the project PICIR22-069-c ICTI/cnv/070/2024 “Validation of the flood risk mitigation system (historical and rainfall prediction) for the city of Morelia”.

Institutional Review Board Statement

Not applicable.

Data Availability Statement

The original contributions presented in this study are included in the article. Further inquiries can be directed to the corresponding author.

Acknowledgments

We also thank the anonymous reviewers and the editor for their constructive comments on the manuscript, Master’s in Water Resources Engineering and the Faculty of Civil Engineering, Institute of Science, Technology and Innovation (ICTI).

Conflicts of Interest

The authors declare no conflicts of interest.

References

  1. Liu, Z. Estimating Land Evapotranspiration from Potential Evapotranspiration Constrained by Soil Water at Daily Scale. Sci. Total Environ. 2022, 834, 155327. [Google Scholar] [CrossRef]
  2. Xiang, K.; Li, Y.; Horton, R.; Feng, H. Similarity and Difference of Potential Evapotranspiration and Reference Crop Evapotranspiration—A Review. Agric. Water Manag. 2020, 232, 106043. [Google Scholar]
  3. FAO. Guidelines for Designing and Evaluating Surface Irrigation System: Irrigation and Drainage Paper 45; FAO: Rome, Italy, 1989. [Google Scholar]
  4. Lang, D.; Zheng, J.; Shi, J.; Liao, F.; Ma, X.; Wang, W.; Chen, X.; Zhang, M. A Comparative Study of Potential Evapotranspiration Estimation by Eight Methods with FAO Penman–Monteith Method in Southwestern China. Water 2017, 9, 734. [Google Scholar] [CrossRef]
  5. FAO. Irrigation Management|Land & Water. Available online: https://www.fao.org/land-water/water/water-management/irrigation-management/en/ (accessed on 23 November 2023).
  6. Hou, P.S.; Fadzil, L.M.; Manickam, S.; Al-Shareeda, M.A. Vector Autoregression Model-Based Forecasting of Reference Evapotranspiration in Malaysia. Sustainability 2023, 15, 3675. [Google Scholar] [CrossRef]
  7. Nie, T.; Yuan, R.; Liao, S.; Zhang, Z.; Gong, Z.; Zhao, X.; Chen, P.; Li, T.; Lin, Y.; Du, C.; et al. Characteristics of Potential Evapotranspiration Changes and Its Climatic Causes in Heilongjiang Province from 1960 to 2019. Agriculture 2022, 12, 2017. [Google Scholar] [CrossRef]
  8. Kim, H.J.; Chandrasekara, S.; Kwon, H.H.; Lima, C.; Kim, T. woong A Novel Multi-Scale Parameter Estimation Approach to the Hargreaves-Samani Equation for Estimation of Penman-Monteith Reference Evapotranspiration. Agric. Water Manag. 2023, 275, 108038. [Google Scholar] [CrossRef]
  9. Sutapa, I.W.; Saparuddin, Y.A.; Lipu, S.; Rustiati, N.B.; Adi, I.P.H. The Performance of Thirty-Eight Evapotraspiation Methods against the Penman Montieth Method. J. Eng. Res. 2023, 11, 13251. [Google Scholar] [CrossRef]
  10. Filho, L.C.A.L.; Carvalho, L.G.; Evangelista, A.W.P.; Alves, J. Spatial Analysis of the Influence of Meteorological Elements on the Reference Evapotranspiration in the State of Minas Gerais, Brazil. Rev. Bras. Eng. Agric. Ambient. 2010, 14. [Google Scholar] [CrossRef]
  11. Chen, D.; Gao, G.; Xu, C.Y.; Guo, J.; Ren, G. Comparison of the Thornthwaite Method and Pan Data with the Standard Penman-Monteith Estimates of Reference Evapotranspiration in China. Clim. Res. 2005, 2, 28123. [Google Scholar] [CrossRef]
  12. Cunha, A.C.; Filho, L.R.A.G.; Tanaka, A.A.; Goes, B.C.; Putti, F.F. Influence of the Estimated Global Solar Radiation on the Reference Evapotranspiration Obtained Through the Penman-Monteith Fao 56 Method. Agric. Water Manag. 2021, 243, 106491. [Google Scholar] [CrossRef]
  13. McColl, K.A. Practical and Theoretical Benefits of an Alternative to the Penman-Monteith Evapotranspiration Equation. Water Resour. Res. 2020, 56, e2020WR027106. [Google Scholar] [CrossRef]
  14. Beven, K. A Sensitivity Analysis of the Penman-Monteith Actual Evapotranspiration Estimates. J. Hydrol. 1979, 44, 169–190. [Google Scholar] [CrossRef]
  15. Guo, D.; Westra, S.; Maier, H.R. Sensitivity of Potential Evapotranspiration to Changes in Climate Variables for Different Australian Climatic Zones. Hydrol. Earth Syst. Sci. 2017, 21, 2107–2126. [Google Scholar] [CrossRef]
  16. Zhang, H.; Wang, L. Analysis of the Variation in Potential Evapotranspiration and Surface Wet Conditions in the Hancang River Basin, China. Sci. Rep. 2021, 11, 8607. [Google Scholar] [CrossRef]
  17. Thorp, K.R. Pyfao56: FAO-56 Evapotranspiration in Python. SoftwareX 2022, 19, 101208. [Google Scholar] [CrossRef]
  18. El-Rawy, M.; Batelaan, O.; Al-Arifi, N.; Alotaibi, A.; Abdalla, F.; Gabr, M.E. Climate Change Impacts on Water Resources in Arid and Semi-Arid Regions: A Case Study in Saudi Arabia. Water 2023, 15, 606. [Google Scholar] [CrossRef]
  19. Das, S.; Kaur Baweja, S.; Raheja, A.; Gill, K.K.; Sharda, R. Development of Machine Learning-Based Reference Evapotranspiration Model for the Semi-Arid Region of Punjab, India. J. Agric. Food Res. 2023, 13, 100640. [Google Scholar] [CrossRef]
  20. Xu, C.-Y.; Singh, V.P. Evaluation and Generalization of Temperature-Based Methods for Calculating Evaporation. Hydrol. Process. 2001, 15, 305–319. [Google Scholar]
  21. Aparicio, F.J. Fundamentos de Hidrología de Superficie; Noriega: San Francisco, CA, USA, 1989; ISBN 9681830148. [Google Scholar]
  22. Vicente-Serrano, S.M.; Beguería, S.; López-Moreno, J.I. A Multiscalar Drought Index Sensitive to Global Warming: The Standardized Precipitation Evapotranspiration Index. J. Clim. 2010, 23, 1696–1718. [Google Scholar] [CrossRef]
  23. Stagge, J.H.; Tallaksen, L.M.; Gudmundsson, L.; Van Loon, A.F.; Stahl, K. Candidate Distributions for Climatological Drought Indices (SPI and SPEI). Int. J. Climatol. 2015, 35, 4027–4040. [Google Scholar] [CrossRef]
  24. Tam, B.Y.; Cannon, A.J.; Bonsal, B.R. Standardized Precipitation Evapotranspiration Index (SPEI) for Canada: Assessment of Probability Distributions. Can. Water Resour. J. 2023, 48, 283–299. [Google Scholar] [CrossRef]
  25. Wang, H.; Chen, Y.; Pan, Y.; Chen, Z.; Ren, Z. Assessment of Candidate Distributions for SPI/SPEI and Sensitivity of Drought to Climatic Variables in China. Int. J. Climatol. 2019, 39, 4392–4412. [Google Scholar] [CrossRef]
  26. Zhang, P.; Cai, Y.; Cong, P.; Xie, Y.; Chen, W.; Cai, J.; Bai, X. Quantitation of Meteorological, Hydrological and Agricultural Drought under Climate Change in the East River Basin of South China. Ecol. Indic. 2024, 158, 111304. [Google Scholar] [CrossRef]
  27. Yimer, E.A.; Van Schaeybroeck, B.; Van de Vyver, H.; van Griensven, A. Evaluating Probability Distribution Functions for the Standardized Precipitation Evapotranspiration Index over Ethiopia. Atmosphere 2022, 13, 364. [Google Scholar] [CrossRef]
  28. Stagge, J.H.; Tallaksen, L.M.; Gudmundsson, L.; Van Loon, A.F.; Stahl, K. Response to Comment on “Candidate Distributions for Climatological Drought Indices (SPI and SPEI)”. Int. J. Climatol. 2016, 36, 2132–2138. [Google Scholar] [CrossRef]
  29. Ma, B.; Zhang, B.; Jia, L.; Huang, H. Conditional Distribution Selection for SPEI-Daily and Its Revealed Meteorological Drought Characteristics in China from 1961 to 2017. Atmos. Res. 2020, 246, 105108. [Google Scholar] [CrossRef]
  30. Vicente-Serrano, S.M.; Beguería, S. Comment on “Candidate Distributions for Climatological Drought Indices (SPI and SPEI)” by James, H. Stagge et al. Int. J. Climatol. 2016, 36, 2120–2131. [Google Scholar] [CrossRef]
  31. Zhao, Y.; Zhang, J.; Bai, Y.; Zhang, S.; Yang, S.; Henchiri, M.; Seka, A.M.; Nanzad, L. Drought Monitoring and Performance Evaluation Based on Machine Learning Fusion of Multi-Source Remote Sensing Drought Factors. Remote Sens. 2022, 14, 6398. [Google Scholar] [CrossRef]
  32. Fan, L.; Wang, H.; Liu, Z.; Li, N. Quantifying the Relationship between Drought and Water Scarcity Using Copulas: Case Study of Beijing-Tianjin-Hebei Metropolitan Areas in China. Water 2018, 10, 1622. [Google Scholar] [CrossRef]
  33. Jensen, M.E.; Burmann, R.D.; Allen, R.G. Evaporation and Irrigation Water Requirements. In ASCE Manual and Reports on Engineering Practice; American Society of Civil Engineers: Reston, VA, USA, 1990; p. 332. [Google Scholar]
  34. The MathWorks Inc. MATLAB version: 9.14.0 (R2023a); The MathWorks Inc. 2022. Available online: https://www.mathworks.com (accessed on 25 March 2025).
  35. Thornthwaite, C.W. An Approach toward a Rational Classification of Climate. Geogr. Rev. 1948, 38, 55. [Google Scholar] [CrossRef]
  36. Hargreaves, G.H.; Samani, Z.A.; Abstract, A. Reference Crop Evapotranspiration from Temperature. Appl. Eng. Agric. 1985, 2, 96–99. [Google Scholar]
  37. Trajkovic, S. Hargreaves versus Penman-Monteith under Humid Conditions. J. Irrig. Drain. Eng. 2007, 133, 38–42. [Google Scholar] [CrossRef]
  38. Tabari, H.; Talaee, P.H. Local Calibration of the Hargreaves and Priestley-Taylor Equations for Estimating Reference Evapotranspiration in Arid and Cold Climates of Iran Based on the Penman-Monteith Model. J. Hydrol. Eng. 2011, 16, 837–845. [Google Scholar] [CrossRef]
  39. Arteaga-Ramírez, R.; Vázquez-Peña, M.A.; Ibáñez-Castillo, L.A. Agrociencia; Colegio de Postgraduados, Escuela Nacional de Agricultura (Mexico): Mexico City, Mexico, 2015; Volume 49. [Google Scholar]
  40. Salam, R.; Islam, A.R.M.T.; Pham, Q.B.; Dehghani, M.; Al-Ansari, N.; Linh, N.T.T. The Optimal Alternative for Quantifying Reference Evapotranspiration in Climatic Sub-Regions of Bangladesh. Sci. Rep. 2020, 10, 20171. [Google Scholar] [CrossRef]
  41. Droogers, P.; Allen, R.G. Estimating Reference Evapotranspiration under Inaccurate Data Conditions. Irrig. Drain. Syst. 2002, 16, 33–45. [Google Scholar]
  42. Ortiz-Gómez, R.; Flowers-Cano, R.S.; Medina-García, G. Sensitivity of the RDI and SPEI Drought Indices to Different Models for Estimating Evapotranspiration Potential in Semiarid Regions. Water Resour. Manag. 2022, 36, 2471–2492. [Google Scholar] [CrossRef]
  43. Peng, L.; Li, Y.; Feng, H. The Best Alternative for Estimating Reference Crop Evapotranspiration in Different Sub-Regions of Mainland China. Sci. Rep. 2017, 7, 5458. [Google Scholar] [CrossRef]
  44. Majidi, M.; Alizadeh, A.; Vazifedoust, M.; Farid, A.; Ahmadi, T. Analysis of the Effect of Missing Weather Data on Estimating Daily Reference Evapotranspiration Under Different Climatic Conditions. Water Resour. Manag. 2015, 29, 2107–2124. [Google Scholar] [CrossRef]
  45. Berti, A.; Tardivo, G.; Chiaudani, A.; Rech, F.; Borin, M. Assessing Reference Evapotranspiration by the Hargreaves Method in North-Eastern Italy. Agric. Water Manag. 2014, 140, 20–25. [Google Scholar] [CrossRef]
  46. Dorji, U.; Olesen, J.E.; Seidenkrantz, M.S. Water Balance in the Complex Mountainous Terrain of Bhutan and Linkages to Land Use. J. Hydrol. Reg. Stud. 2016, 7, 55–68. [Google Scholar] [CrossRef]
  47. Robertson, W.; Baier, W. Estimation of Latente Evaporation from Simple Weather Observations. Can. J. Plant Sci. 1965, 45, 276–284. [Google Scholar]
  48. Ahooghalandari, M.; Khiadani, M.; Jahromi, M.E. Developing Equations for Estimating Reference Evapotranspiration in Australia. Water Resour. Manag. 2016, 30, 3815–3828. [Google Scholar] [CrossRef]
  49. Celestin, S.; Qi, F.; Li, R.; Yu, T.; Cheng, W. Evaluation of 32 Simple Equations against the Penman–Monteith Method to Estimate the Reference Evapotranspiration in the Hexi Corridor, Northwest China. Water 2020, 12, 2772. [Google Scholar] [CrossRef]
  50. Hargreaves, G.H.; Allen, R.G. History and Evaluation of Hargreaves Evapotranspiration Equation. J. Irrig. Drain. Eng. 2003, 129, 53–63. [Google Scholar] [CrossRef]
  51. Singh Rawat, K.; Kumar Singh, S.; Bala, A.; Szabó, S. Estimation of Crop Evapotranspiration through Spatial Distributed Crop Coefficient in a Semi-Arid Environment. Agric. Water Manag. 2019, 213, 922–933. [Google Scholar] [CrossRef]
  52. López-Urrea, R.; Martín de Santa Olalla, F.; Fabeiro, C.; Moratalla, A. Testing Evapotranspiration Equations Using Lysimeter Observations in a Semiarid Climate. Agric. Water Manag. 2006, 85, 15–26. [Google Scholar] [CrossRef]
  53. Priestley, C.H.B.; Taylor, R.J. On the Assessment of Surface Heat Flux and Evaporation Using Large-Scale Parameters. Mon. Weather. Rev. 1972, 100, 81–92. [Google Scholar] [CrossRef]
  54. Wu, H.; Zhu, W.; Huang, B. Seasonal Variation of Evapotranspiration, Priestley-Taylor Coefficient and Crop Coefficient in Diverse Landscapes. Geogr. Sustain. 2021, 2, 224–233. [Google Scholar] [CrossRef]
  55. Jensen, M.E.; Haise, H.R. Estimating Evapotranspiration from Solar Radiation. J. Irrig. Drain. Div. 1963, 89, 15–41. [Google Scholar] [CrossRef]
  56. Hargreaves, G.H.; Asae, M. Moisture Availability and Crop Production. Trans. ASAE 1975, 18, 980–984. [Google Scholar] [CrossRef]
  57. Abtew, W. Water Resources Bulletin Evapotranspiration Measurements and Modeling for Three Wetland Systems in South Florida. J. Am. Water Resour. Assoc. 1996, 32, 465–473. [Google Scholar] [CrossRef]
  58. Abtew, W. Evapotranspiration in the Everglades: Comparison of Bowen Ratio Measurements and Model Estimations. In 2005 ASAE Annual International Meeting; American Society of Agricultural and Biological Engineers: St. Joseph, MI, USA, 2005; p. 1. [Google Scholar] [CrossRef]
  59. Irmak, S.; Irmak, A.; Allen, R.G.; Jones, J.W. Solar and Net Radiation-Based Equations to Estimate Reference Evapotranspiration in Humid Climates. J. Irrig. Drain. Eng. 2003, 129, 336–347. [Google Scholar] [CrossRef]
  60. Kodja, D.J.; Akognongbé, A.J.S.; Amoussou, E.; Mahé, G.; Vissin, E.W.; Paturel, J.E.; Houndénou, C. Calibration of the Hydrological Model GR4J from Potential Evapotranspiration Estimates by the Penman-Monteith and Oudin Methods in the Ouémé Watershed (West Africa). Proc. Int. Assoc. Hydrol. Sci. 2020, 383, 163–169. [Google Scholar] [CrossRef]
  61. Dalton, J. Experimental Essays, on the Constitution of Mixed Gases. Manch. Soc. 1785–1879 1802, 5, 535–602. [Google Scholar]
  62. Albrecht, F. Die Methoden Zur Bestimmung Der Verdunstung Der Natürlichen Erdoberfläche. Arch. Meteorol. Geophys. Bioklimatol. Ser. B 1950, 2, 1–38. [Google Scholar] [CrossRef]
  63. Meyer, A. Ueber Einige Zusammenhänge Zwischen Klima Und Boden in Europa. Ph.D. Thesis, ETH Zurich, Zurich, Switzerland, 1926. [Google Scholar] [CrossRef]
  64. Muhammad, M.K.I.; Nashwan, M.S.; Shahid, S.; Ismail, T.b.; Song, Y.H.; Chung, E.S. Evaluation of Empirical Reference Evapotranspiration Models Using Compromise Programming: A Case Study of Peninsular Malaysia. Sustainability 2019, 11, 4267. [Google Scholar] [CrossRef]
  65. Rohwer, C.; Rohwer, G. Evaporation from Free Water Surfaces; US Department of Agriculture: Washington, DC, USA, 1931. [Google Scholar]
  66. Yang, Y.; Chen, R.; Han, C.; Liu, Z. Evaluation of 18 Models for Calculating Potential Evapotranspiration in Different Climatic Zones of China. Agric. Water Manag. 2021, 244, 106545. [Google Scholar] [CrossRef]
  67. WMO. Measurement and Estimation of Evaporation and Evapotranspiration; WMO: Geneva, Switzerland, 1966. [Google Scholar]
  68. Bormann, H. Sensitivity Analysis of 18 Different Potential Evapotranspiration Models to Observed Climatic Change at German Climate Stations. Clim. Change 2011, 104, 729–753. [Google Scholar] [CrossRef]
  69. Ghiat, I.; Govindan, R.; Al-Ansari, T. Evaluation of Evapotranspiration Models for Cucumbers Grown under CO2 Enriched and HVAC Driven Greenhouses: A Step towards Precision Irrigation in Hyper-Arid Regions. Front. Sustain. Food Syst. 2023, 7, 1155443. [Google Scholar] [CrossRef]
  70. Sweers, H.E. A Nomogram to Estimate the Heat-Exchange Coefficient at the Air-Water Interface as a Function of Wind Speed and Temperature; a Critical Survey of Some Literature. J. Hydrol. 1976, 30, 375–401. [Google Scholar] [CrossRef]
  71. Rezaei, M.; Valipour, M.; Valipour, M. Modelling Evapotranspiration to Increase the Accuracy of the Estimations Based on the Climatic Parameters. Water Conserv. Sci. Eng. 2016, 1, 197–207. [Google Scholar] [CrossRef]
  72. Djaman, K.; Balde, A.B.; Sow, A.; Muller, B.; Irmak, S.; N’Diaye, M.K.; Manneh, B.; Moukoumbi, Y.D.; Futakuchi, K.; Saito, K. Evaluation of Sixteen Reference Evapotranspiration Methods under Sahelian Conditions in the Senegal River Valley. J. Hydrol. Reg. Stud. 2015, 3, 139–159. [Google Scholar] [CrossRef]
  73. Chen, Z.; Zhu, Z.; Jiang, H.; Sun, S. Estimating Daily Reference Evapotranspiration Based on Limited Meteorological Data Using Deep Learning and Classical Machine Learning Methods. J. Hydrol. 2020, 591, 125286. [Google Scholar] [CrossRef]
  74. Farg, E.; Arafat, S.M.; Abd El-Wahed, M.S.; El-Gindy, A.M. Estimation of Evapotranspiration ETc and Crop Coefficient K c of Wheat, in South Nile Delta of Egypt Using Integrated FAO-56 Approach and Remote Sensing Data. Egypt. J. Remote Sens. Space Sci. 2012, 15, 83–89. [Google Scholar] [CrossRef]
  75. Yaseen, Z.M.; Al-Juboori, A.M.; Beyaztas, U.; Al-Ansari, N.; Chau, K.W.; Qi, C.; Ali, M.; Salih, S.Q.; Shahid, S. Prediction of Evaporation in Arid and Semi-Arid Regions: A Comparative Study Using Different Machine Learning Models. Eng. Appl. Comput. Fluid. Mech. 2020, 14, 70–89. [Google Scholar] [CrossRef]
  76. Wang, Q.; Wu, J.; Lei, T.; He, B.; Wu, Z.; Liu, M.; Mo, X.; Geng, G.; Li, X.; Zhou, H.; et al. Temporal-Spatial Characteristics of Severe Drought Events and Their Impact on Agriculture on a Global Scale. Quat. Int. 2014, 349, 10–21. [Google Scholar] [CrossRef]
  77. INEGI. Uso de Suelo y Vegetación. Available online: https://www.inegi.org.mx/app/biblioteca/ficha.html?upc=702825568580 (accessed on 3 August 2023).
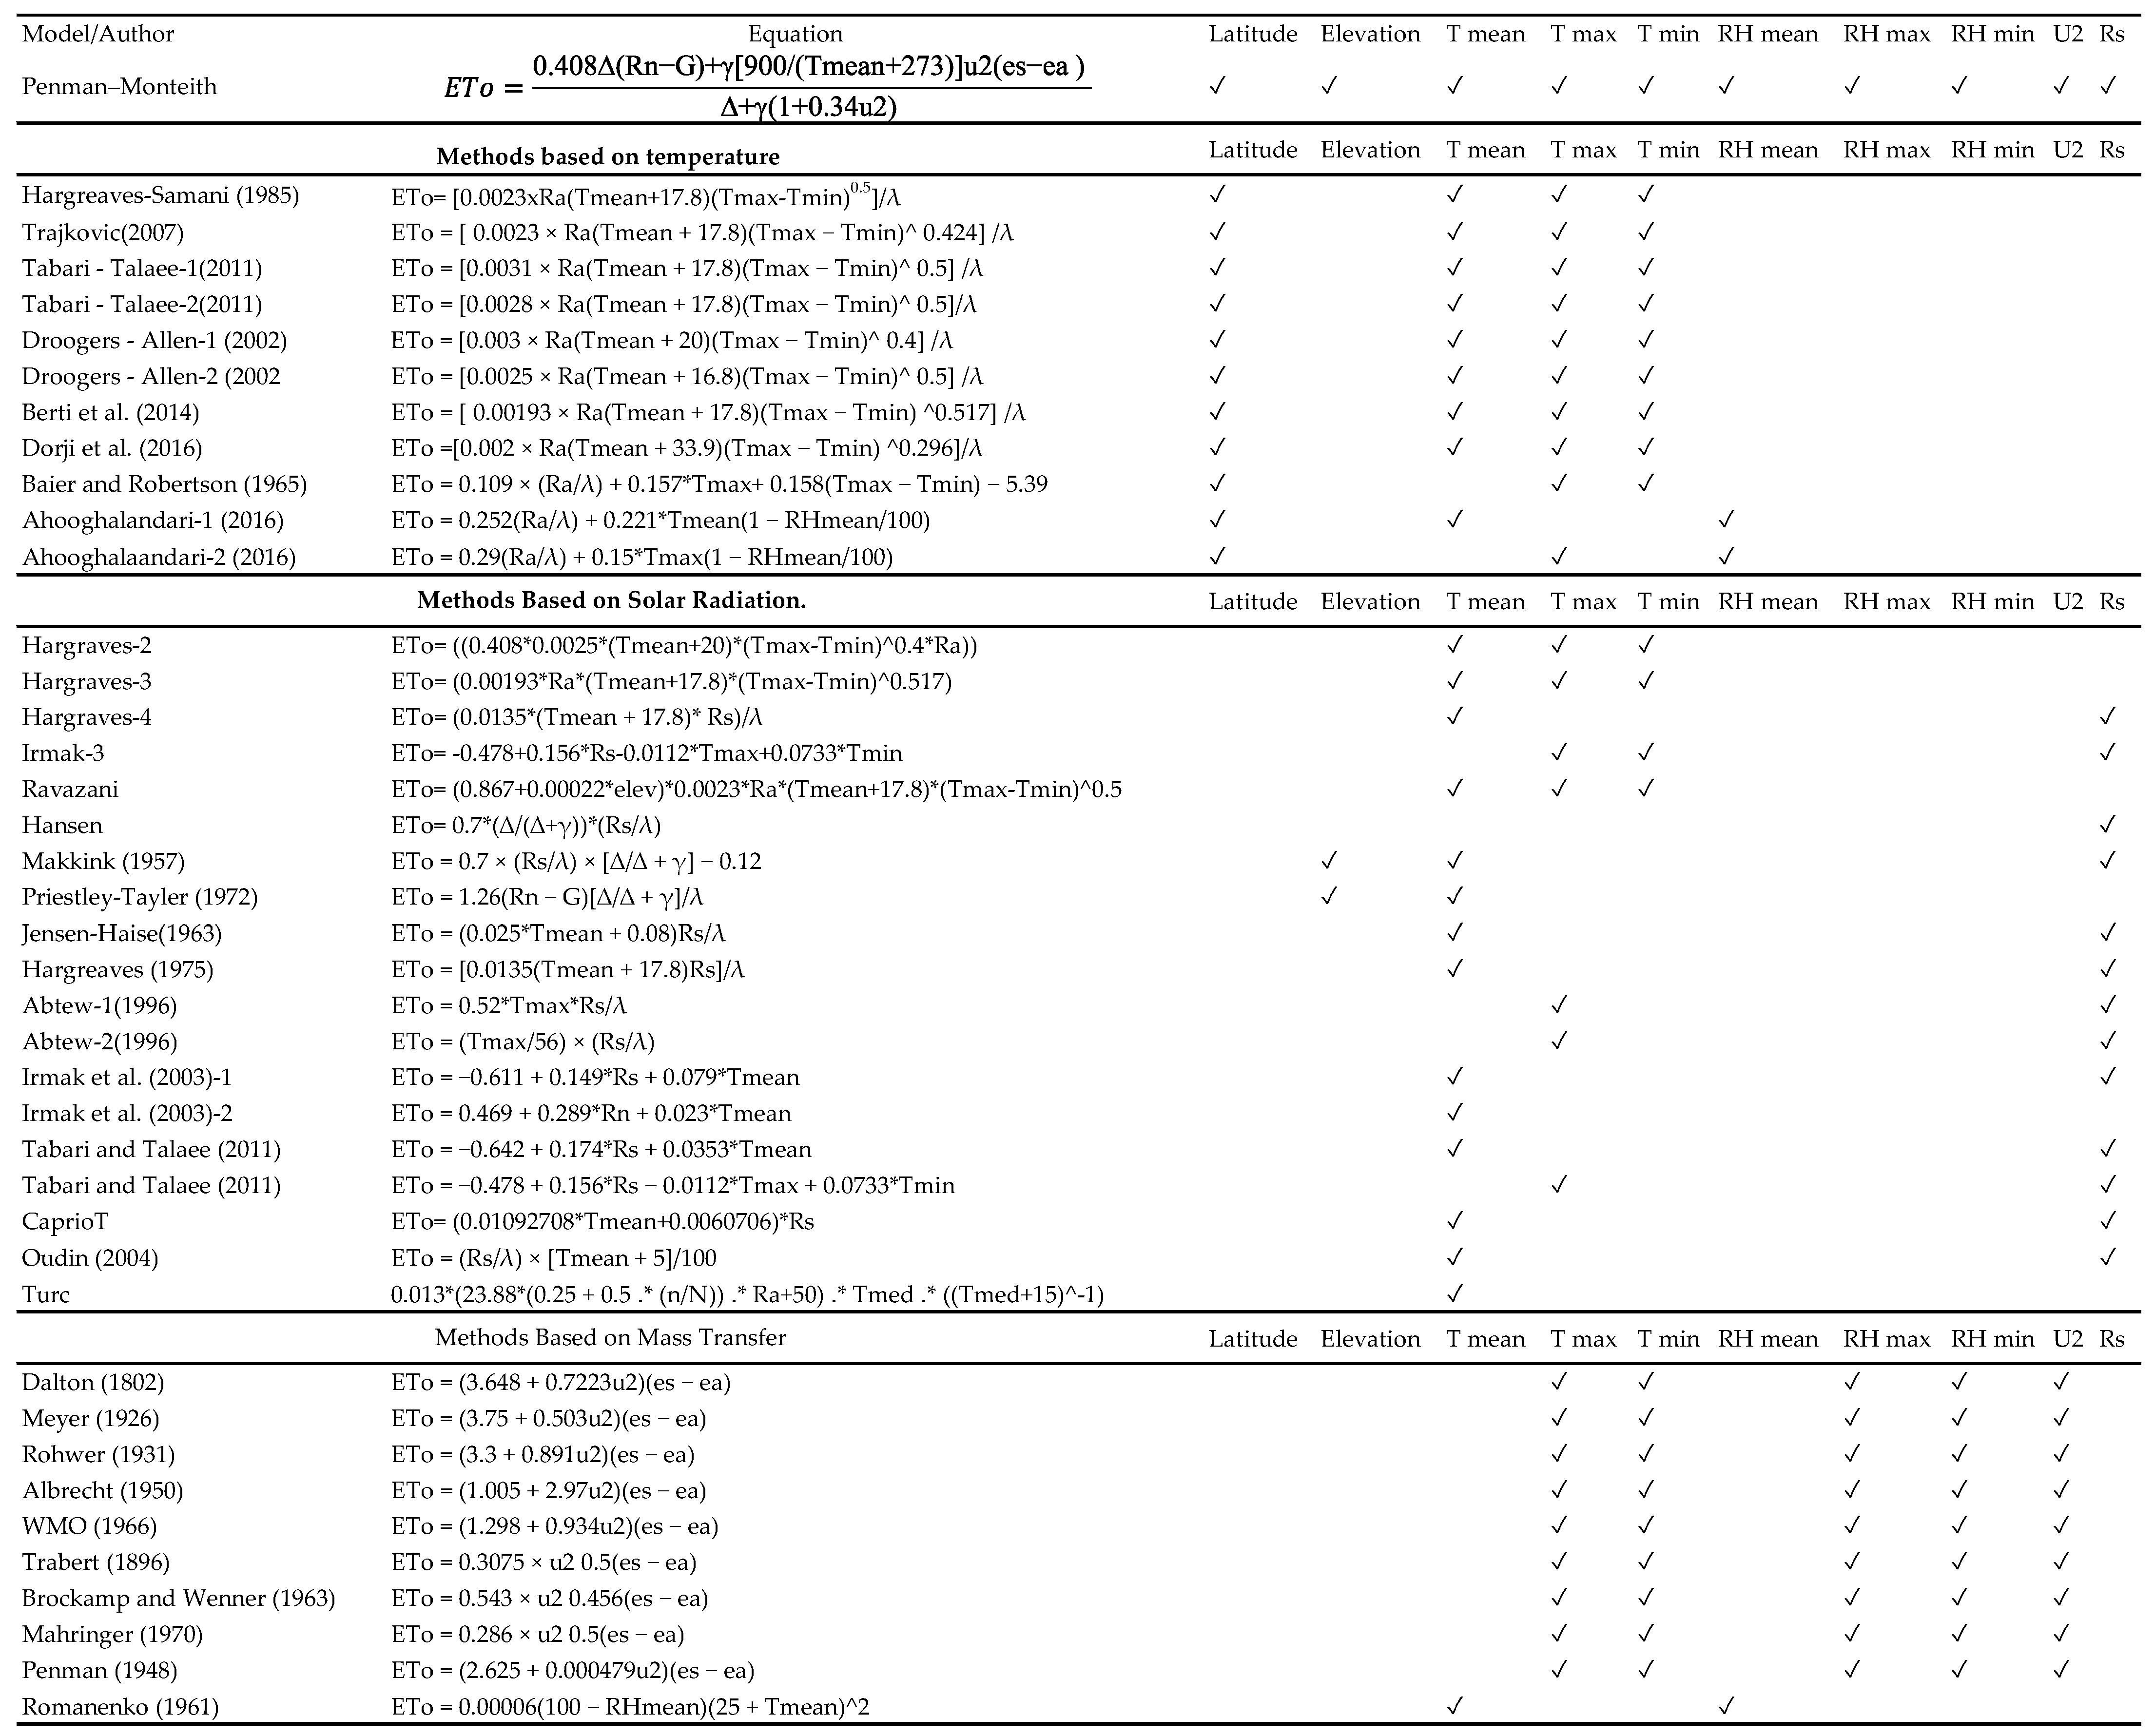
Figure 1. Formulas for calculating ETo that have been validated against the requirements of the FAO method. ETo: reference evapotranspiration; elev: station elevation; Δ: pressure curvature gradient; λ: latent heat of vaporization, 2.45 (MJ); γ: psychrometric constant; G: soil heat flux; Rn: net solar radiation; u2: average wind speed; Tmean: daily mean temperature; Tmax: daily maximum average temperature; Tmin: daily minimum average temperature; Ra: extraterrestrial radiation; Rs: solar radiation (MJ m−2 day−1); e0 (T): saturation pressure for a given temperature; es: actual vapor pressure; ea: saturated vapor pressure; (es-ea): vapor pressure deficit; n: actual sunshine duration in a day; N: daylight hours; RH mean: relative humidity; RH max: maximum relative humidity; RH min: minimum relative humidity.
Agriculture 15 00703 g001
Figure 2. Location of the study area along with the utilized weather stations.
Agriculture 15 00703 g002
Figure 3. Methods based on temperature without regional calibration for the Morelia station include (1) Hargreaves, (2) Baier–Robertson, (3) Trajovic, (4) Tabari–Tale, (5) Tabari–Tale-2, (6) Droogers–Allen, (7) Droogers-Allen-2, (8) Berti, (9) Dorji, (10) Ahooghalandari, and (11) Ahooghalandari-2.
Agriculture 15 00703 g003
Figure 4. Methods based on solar radiation without regional calibration for the Morelia station include (12) Priestley, (13) Hargreaves-1, (14) Hargreaves-2, (15) CaprioT, (16) Imark-1, (17) Imark-2, (18) Imark-3, (19) Ravazani, (20) Makk, (21) Hansen, (22) Hargreaves-3, (23) Jensen–Haise.
Agriculture 15 00703 g004
Figure 5. Methods based on solar radiation without regional calibration for the Morelia station include (24) Harves-4, (25) Abtew-1, (26) Abtew-2, (27) Tabaritalaee, (28) Tabaritalaee-2, (29) Outdin, and (30) Turc.
Agriculture 15 00703 g005
Figure 6. Methods based on mass transfer without regional calibration for the Morelia station include (31) Dalton, (32) Meyer, (33) Rohnwer, (34) Albrecht, (35) WMO, (36) Trabert, (37) Brockamp–Wenner, (38) Mahringer, (39) Penman, and (40) Romanenko.
Agriculture 15 00703 g006
Figure 7. Methods based on temperature without regional calibration for the RUOA station include (1) Hargreaves, (2) Baier–Robertson, (3) Trajovic, (4) Tabari–Tale, (5) Tabari–Tale-2, (6) Droogers–Allen, (7) Droogers–Allen-2, (8) Berti, (9) Dorji, (10) Ahooghalandari, and (11) Ahooghalandari-2.
Agriculture 15 00703 g007
Figure 8. Methods based on solar radiation without regional calibration for the RUOA station include (12) Priestley, (13) Hargreaves-1, (14) Hargreaves-2, (15) CaprioT, (16) Imark-1, (17) Imark-2, (18) Imark-3, (19) Ravazani, (20) Makk, (21) Hansen, (22) Hargreaves-3, (23) Jensen–Haise.
Agriculture 15 00703 g008
Figure 9. Methods based on solar radiation without regional calibration for the RUOA station include (24) Harves-4, (25) Abtew-1, (26) Abtew-2, (27) Tabaritalaee, (28) Tabaritalaee-2, (29) Outdin, and (30) Turc.
Agriculture 15 00703 g009
Figure 10. Methods based on mass transfer without regional calibration for the RUOA station include (31) Dalton, (32) Meyer, (33) Rohnwer, (34) Albrecht, (35) WMO, (36) Trabert, (37) Brockamp–Wenner, (38) Mahringer, (39) Penman, and (40) Romanenko.
Agriculture 15 00703 g010
Figure 11. Methods based on temperature with regional calibration for the Morelia station include (1) Hargreaves, (2) Baier–Robertson, (3) Trajovic, (4) Tabari–Tale, (5) Tabari–Tale-2, (6) Droogers–Allen, (7) Droogers–Allen-2, (8) Berti, (9) Dorji, (10) Ahooghalandari, and (11) Ahooghalandari-2.
Agriculture 15 00703 g011
Figure 12. Methods based on solar radiation with regional calibration for the Morelia station include (12) Priestley, (13) Hargreaves-1, (14) Hargreaves-2, (15) CaprioT, (16) Imark-1, (17) Imark-2, (18) Imark-3, (19) Ravazani, (20) Makk, (21) Hansen, (22) Hargreaves-3, (23) Jensen–Haise.
Agriculture 15 00703 g012
Figure 13. Methods based on solar radiation with regional calibration for the Morelia station include (24) Harves-4, (25) Abtew-1, (26) Abtew-2, (27) Tabaritalaee, (28) Tabaritalaee-2, (29) Outdin, and (30) Turc.
Agriculture 15 00703 g013
Figure 14. Methods based on mass transfer with regional calibration for the Morelia station include (31) Dalton, (32) Meyer, (33) Rohnwer, (34) Albrecht, (35) WMO, (36) Trabert, (37) Brockamp–Wenner, (38) Mahringer, (39) Penman, and (40) Romanenko.
Agriculture 15 00703 g014
Figure 15. Methods based on temperature with regional calibration for the RUOA station include (1) Hargreaves, (2) Baier–Robertson, (3) Trajovic, (4) Tabari–Tale, (5) Tabari–Tale-2, (6) Droogers–Allen, (7) Droogers–Allen-2, (8) Berti, (9) Dorji, (10) Ahooghalandari, and (11) Ahooghalandari-2.
Agriculture 15 00703 g015
Figure 16. Methods based on solar radiation with regional calibration for the RUOA station include (12) Priestley, (13) Hargreaves-1, (14) Hargreaves-2, (15) CaprioT, (16) Imark-1, (17) Imark-2, (18) Imark-3, (19) Ravazani, (20) Makk, (21) Hansen, (22) Hargreaves-3, (23) Jensen–Haise.
Agriculture 15 00703 g016
Figure 17. Methods based on solar radiation with regional calibration for the RUOA station include (24) Harves-4, (25) Abtew-1, (26) Abtew-2, (27) Tabaritalaee, (28) Tabaritalaee-2, (29) Outdin, and (30) Turc.
Agriculture 15 00703 g017
Figure 18. Methods of mass transfer with regional calibration for the Morelia station include (31) Dalton, (32) Meyer, (33) Rohnwer, (34) Albrecht, (35) WMO, (36) Trabert, (37) Brockamp–Wenner, (38) Mahringer, (39) Penman, and (40) Romanenko.
Agriculture 15 00703 g018
Figure 19. SPEI calculations on a monthly scale evaluated with temperature methods for the Morelia station (atypical values +).
Agriculture 15 00703 g019
Figure 20. SPEI calculation on a monthly scale evaluated with radiation methods for the Morelia station (atypical values +).
Agriculture 15 00703 g020
Figure 21. SPEI calculation on a monthly scale evaluated with mass transfer methods for the Morelia station (atypical values +).
Agriculture 15 00703 g021
Figure 22. SPEI calculations on a 3-month scale evaluated with temperature methods (atypical values +).
Agriculture 15 00703 g022
Figure 23. SPEI calculation on a 3-month scale evaluated with radiation methods (atypical values +).
Agriculture 15 00703 g023
Figure 24. SPEI calculations on a 3-month scale evaluated with mass transfer methods (atypical values +).
Agriculture 15 00703 g024
Figure 25. SPEI calculation on a 6-month scale evaluated with temperature methods (atypical values +).
Agriculture 15 00703 g025
Figure 26. SPEI calculation on a 6-month scale evaluated using radiation methods (atypical values +).
Agriculture 15 00703 g026
Figure 27. SPEI calculation on a 6-month scale evaluated with mass transfer methods (atypical values +).
Agriculture 15 00703 g027
Table 1. Classification of SPEI values.
CategorizationSPEI Values
Extreme drought≤−2
Severe drought−2
Moderate drought−1.5
Mild drought−1
Normal±≤0.5
Mildly wet0.5
Moderately wet1≤
Severely wet1.5≤
Extremely wet≥2
Table 2. Study area data.
LatitudeLongitudeAltitude
19.7030° N101.1920° W1920 mbsl
Table 3. Summary of the weather stations utilized within the study area.
Station DataAnnual Mean Climatic Variables
NameLatitudeLongitudePeriodT Mean (°C)T max (°C)T min (°C) RH Mean (%)RH max (%)RH min (%)U2 (m/s)
Morelia, Michoacán19.7214−101.18282010–202218.78627.973411.466.867489.960339.1261.063
Red Universitaria de Observatorios Atmosfericos (RUOA)19.6493−101.2222016–202217.40223.332111.5861.22583.448635.3691.702
Table 4. Statistical analysis of different ETo methods applied to the Morelia station.
Methods Based on Temperature Mean Error (mm/day)Standard Deviation Error (mm/Day)Correlation Coefficient (Dimensionless)RMSE MAE PE
Hargreaves–Samani−0.0003−0.13500.81300.42380.32560.0001
Baier–Robertson0.0000−0.14110.80780.43260.33660.0000
Trajovic−0.0005−0.13560.81160.42560.32430.0001
Tabari–Tale−0.0003−0.13500.81300.42380.32560.0001
Tabari–Tale-2−0.0003−0.13500.81300.42380.32560.0001
Droogers–Allen−0.0006−0.13540.81130.42570.32440.0002
Droogers–Allen-2−0.0003−0.13490.81310.42360.32500.0001
Berti−0.0003−0.13520.81290.42400.32650.0001
Dorji−0.0011−0.13430.81020.42630.32470.0003
Ahooghalandari0.0000−0.19620.75140.52060.36780.0000
Ahooghalandari-20.0000−0.17920.76790.49450.35390.0000
Priestley−0.0136−0.45420.53000.88880.69474.27 × 10−3
Hargreaves-1−0.0006−0.13540.81130.42570.32441.79 × 10−4
Hargreaves-2−0.0006−0.13540.81130.42570.32441.79 × 10−4
CaprioT0.0000−0.16260.78460.46840.35207.60 × 10−6
Imark-1−0.0013−0.21960.72440.56000.45524.10 × 10−4
Imark-2−0.0012−0.16410.77780.47580.37913.85 × 10−4
Imark-3−0.0028−0.14960.78620.45890.34718.83 × 10−4
Ravazani−0.0003−0.13500.81300.42380.32561.02 × 10−4
Makk−0.0007−0.15300.79190.45550.36042.05 × 10−4
Hansen−0.0007−0.15300.79190.45550.36042.05 × 10−4
Hargreaves-3−0.0003−0.13520.81290.42400.32659.32 × 10−5
Jensen–Haise−0.0001−0.15180.79580.45090.33952.30 × 10−5
Harves-4−0.0003−0.13500.81300.42380.32561.02 × 10−4
Abtew-1−0.0014−0.24910.69880.60220.49224.29× 10−4
Abtew-20.0000−0.13670.81260.42520.32798.37 × 10−16
Tabaritalaee−0.0012−0.16410.77780.47580.37913.85 × 10−4
Tabaritalaee-2−0.0017−0.30770.65230.68260.56095.29 × 10−4
Outdin−0.0001−0.14650.80130.44230.33373.45 × 10−5
Turc0.0000−0.47770.55380.89130.66694.04 × 10−6
Dalton0.0000−0.07290.89050.30290.21551.39 × 10−16
Meyer0.0000−0.08890.86970.33650.24064.18 × 10−16
Rohnwer0.0000−0.06020.90780.27390.19411.39 × 10−16
Albrecht0.0000−0.02520.95920.17480.12514.18 × 10−16
WMO0.0000−0.03010.95160.19140.13546.97 × 10−16
Trabert0.0000−0.02790.95510.18400.12934.18 × 10−16
Brockamp–Wenner0.0000−0.03080.95060.19360.13550.00
Mahringer0.0000−0.02790.95510.18400.12932.79 × 10−16
Penman0.0000−0.14590.80250.44080.31895.58 × 10−16
Romanenko0.0000−0.19550.75210.51960.36874.18 × 10−16
Table 5. Statistical analysis of different ETo methods applied to the RUOA station.
Methods Based on Temperature Mean Error (mm/day)Standard Deviation Error (mm/Day)Correlation Coefficient (Dimensionless)RMSE MAE PE
Hargreaves–Samani−0.0007−0.15480.8252201930.4774275370.38284040.000224394
Baier–Robertson−0.0002−0.16630.8162090170.4910374180.39340986.75 × 10−5
Trajovic−0.0010−0.14940.8295454732.9620914970.37173250.0002969
Tabari–Tale−0.0007−0.15480.8252201930.9733725420.38284040.000224394
Tabari–Tale-2−0.0007−0.15480.8252201930.6411855960.38284040.000224394
Droogers–Allen−0.0011−0.14980.8286879760.4633496020.37261540.000347701
Droogers–Allen-2−0.0007−0.15330.8266933240.4342042880.37991690.000214787
Berti−0.0007−0.15640.8239067420.7198270910.3858910.000208174
Dorji−0.0021−0.15130.8246135311.078592830.37652990.000659308
Ahooghalandari0.0000−0.05920.9260797211.0339909580.22655191.25 × 10−15
Ahooghalandari-20.0000−0.05860.9268210461.3296027910.22764662.77 × 10−16
PMFAO56001000
Priestley−0.1275−0.94740.3324371360.9682233111.31507610.038246666
Hargreaves-1−0.0011−0.14980.8286879760.4632609880.37261540.000347701
Hargreaves-2−0.0011−0.14980.8286879760.69391740.37261540.000347701
CaprioT−0.0002−0.16910.8135373390.5093458360.39710557.64 × 10−5
Imark-1−0.0030−0.30870.6993885441.5871825570.60368150.000944022
Imark-2−0.0023−0.22170.7638880390.836410620.48683980.000730176
Imark-3−0.0034−0.16010.8131769930.9914147750.38740030.001047757
Ravazani−0.0007−0.15480.8252201936.4644639990.38284040.000224394
Makk−0.0014−0.19990.7838531790.9000330360.45637280.000447721
Hansen−0.0014−0.19990.7838531790.542264880.45637280.000447721
Hargreaves-3−0.0007−0.15640.8239067423.3493761270.3858910.000208174
Jensen–Haise−0.0003−0.15570.8254985610.4273986930.37719.77 × 10−5
Harves-4−0.0007−0.15480.8252201930.5564291190.38284040.000224394
Abtew-1−0.0034−0.35050.6719019980.556198650.65490320.001066803
Abtew-2−0.0001−0.15490.8271036790.7374586110.3807461.78 × 10−5
Tabaritalaee−0.0023−0.22170.7638880390.836410620.48683980.000730176
Tabaritalaee-2−0.0044−0.42730.6260028791.7531674370.74275380.001377527
Outdin−0.0004−0.15060.8300979061.9247880730.36970720.000110196
Turc−0.1442−1.23360.3518629361.7194389431.61059940.043031417
Dalton0.0000−0.02280.9702279162.7874108280.13585845.54 × 10−16
Meyer0.0000−0.02910.962298212.4125705550.15219629.70 × 10−16
Rohnwer0.0000−0.01850.9756949122.7653188710.12351516.93 × 10−16
Albrecht0.0000−0.01760.9768633474.8962974460.12509658.31 × 10−16
WMO0.0000−0.01240.9835169270.8795461280.10479495.54 × 10−16
Trabert0.0000−0.01320.982567952.806800980.10672689.70 × 10−16
Brockamp–Wenner0.0000−0.01410.9814031622.4624922490.10882131.11 × 10−15
Mahringer0.0000−0.01320.982567952.8404612870.10672688.31 × 10−16
Penman0.0000−0.05880.9266034260.6012322370.21548119.70 × 10−16
Romanenko0.0000−0.05690.9287589261.6689426350.22332381.11 × 10−15
Table 6. Comparison of regional calibration methods with the FAO method.
MethodsMean Error (mm/Day)Standard Deviation Error (mm/Day)Correlation Coefficient (Dimensionless)RMSEMAEPE
Temperature−0.0007−0.13710.84350.96410.35300.0002
Radiation−0.0145−0.30960.73761.20940.57310.0043
Mass transfer0.0000−0.02330.97002.19280.12750.0000
Disclaimer/Publisher’s Note: The statements, opinions and data contained in all publications are solely those of the individual author(s) and contributor(s) and not of MDPI and/or the editor(s). MDPI and/or the editor(s) disclaim responsibility for any injury to people or property resulting from any ideas, methods, instructions or products referred to in the content.