Article

The Design and Research of the Bolt Loosening Monitoring System in Combine Harvesters Based on Wheatstone Bridge Circuit Sensor

1
School of Transportation Engineering, Jiangsu Shipping College, Nantong 226010, China
2
School of Agricultural Engineering, Jiangsu University, Zhenjiang 212013, China
3
School of Energy and Power Engineering, Jiangsu University, Zhenjiang 212013, China
4
Key Laboratory of Modern Agricultural Equipment and Technology, Ministry of Education, Jiangsu University, Zhenjiang 212013, China
*
Author to whom correspondence should be addressed.
Agriculture 2025, 15(7), 704; https://doi.org/10.3390/agriculture15070704
Submission received: 27 February 2025 / Revised: 24 March 2025 / Accepted: 24 March 2025 / Published: 26 March 2025
(This article belongs to the Section Agricultural Technology)

Abstract

:
The combine harvester, as a multi-component machine comprising a cutting table, a conveyor, a threshing cylinder, and other components, experiences significant stress and bolt failures in cutting table-conveyor structures due to inherent excitation and the cutting table’s cantilevered design. To address bolt loosening monitoring in the critical joint, this paper designed a Wheatstone bridge circuit-based wireless monitoring system and a multi-channel Wheatstone bridge sensor, enabling multi-bolt monitoring on combine harvesters. Utilizing LoRa wireless communication, the system effectively overcomes the wiring complexity and deployment difficulties of traditional agricultural machinery bolt monitoring systems. The Wheatstone bridge sensor can precisely monitor pre-tightening forces up to 150 kN for M12–M24 bolts. A calibration test based on dynamic time warping (DTW) accurately fitted the sensor’s response to pressure and displacement with determination coefficients of 0.9780 and 0.9753. Then, a validation test focusing on connection bolts revealed a 95.12% overlap between the simulated measurement range and the calibration range under pre-tightening conditions. Furthermore, fitting curves for simulated measurements against tightening torque and angle yielded coefficients of determination of 0.9945 and 0.9939, which demonstrated accurate fitting of pre-tightening conditions and defined the monitoring range of 3.02 × 10¹² to 3.49 × 10¹². Finally, combined with simulation results, a field performance test confirmed the sensor’s ability to detect minute 5% pre-load reductions, achieve 200 ms data transmission to a host computer, and maintain lossless data transmission over 1.2 km. This sensor and system design provided a valuable reference for bolt loosening monitoring in combine harvesters and other agricultural machinery.

1. Introduction

As a type of multi-component combined machinery, combine harvesters have complex working devices with intricate working structures, such as cutter platforms, conveying troughs, and vibrating screens [1,2,3]. Due to their inherent severe vibration, components of these devices are prone to premature damage, significantly impacting harvesting efficiency and the overall safety and reliability of the machine [3,4,5]. During harvesting, the contact between crops and working components generates intense excitation, which in turn impacts various parts of the machine. This subjects components like bolted structures to continuous shocks, making them susceptible to failure [6,7]. The excitation characteristics of harvesters vary depending on the type and working conditions. Therefore, monitoring bolt failure in harvesters can enhance operator safety, extend machine lifespan, and prevent damage to devices caused by failures [8,9,10].
The cutter platform and conveying trough, with their unique overhanging structures, rely heavily on their connecting structures. These connections are crucial not only for the normal operation of each device but also for the harvesting efficiency and quality of the combine harvester [11,12,13]. Failure of bolted structures can further intensify vibrations in the entire combine harvester, leading to stronger vibrations. The superposition of noise and vibration radiation can negatively affect the working performance and service life of all working devices in the combine harvester [14,15]. Furthermore, strong vibrations from each device can generate even greater vibrations, subjecting the bolted connections of working devices to more intense impacts, creating safety hazards for the machine. Therefore, monitoring bolt loosening in combine harvesters is of paramount importance for their safe operation [16,17,18,19]. In recent years, with combine harvesters increasingly developing towards a larger scale, higher speed, higher efficiency, and greater intelligence, researching bolt loosening monitoring methods for various devices in combine harvesters has become extremely urgent for ensuring safe operation and promoting the intelligent development of these machines [20,21].
Currently, many scholars are employing neural network methods to identify the mechanical behavior of devices. Others are studying the loosening behavior of bolted structures by analyzing characteristic changes in excitation vibration signals from devices [22,23,24]. Mechanical analysis is also a vital method for investigating the loading forms of devices and determining structural strength. Some researchers are focusing on sensor design to monitor the mechanical behavior of structures, aiming to track changes in structural characteristics during operation [25,26,27,28]. Designing automatic fault monitoring systems for machines is highly beneficial for improving machine safety. Some scholars have designed multi-sensor fusion systems to effectively enhance machine adaptability and safety [29,30,31]. To address sensor accuracy issues in machine systems, some researchers are using generalized polynomial fitting controls and the least squares fitting method to improve the system’s effective reading of sensor data [32,33]. Regarding device fault monitoring, some scholars have proposed multi-sensor coupled fault diagnosis methods, with sensor implementation improving machine working efficiency [34,35,36,37,38]. For monitoring bolt loosening in machine structures, some scholars are using the “Percussion method”, combined with bolt loosening characteristic values, to construct standardized loosening indices for measurement [39,40,41]. Others are using axial force change characteristics and ultrasonic wave change characteristics to judge bolt structure loosening behavior [42,43,44,45]. A common monitoring approach for bolt loosening is to combine finite element simulation calculations to quantify characteristic parameters of bolted joint loosening [46,47,48]. Simultaneously, visual monitoring methods for bolt loosening are also being applied to monitor bolt structures in complex machine structures, often based on establishing a baseline and monitoring the rotation angle of bolt structures [49,50,51]. Although sensor and sensor fusion research methods are already widely used in system monitoring studies, research specifically on bolt structure monitoring and system development for combine harvesters remains limited.
This paper presents a vibration monitoring system for combine harvester augers, based on a Wheatstone bridge circuit. A simplified model, derived from the dynamic parameters of the harvester components, identifies the weak coupling points of the auger. A Wheatstone bridge-based sensor, coupled with a digital-to-analog conversion principle, enables precise fitting of the sensor’s signal change curve. Utilizing an STM32F103CBT6 microcontroller, multi-channel switching circuits, and LoRa wireless communication, a multi-auger monitoring system is developed. Validation experiments demonstrate a 95.12% overlap between the simulated and experimental ranges. The coefficients of determination for the fitted curves of simulated torque and torsion angle are 0.9945 and 0.9939, respectively, confirming the accuracy under pre-tightening conditions. Performance tests show that the sensor detects subtle vibrations with a 5% reduction in pre-tightening force. The system achieves data transmission to the host computer within 200 ms and a communication range of up to 1.2 km without data loss. This sensor and monitoring system design can provide a reference for loosening monitoring of bolt structures in combine harvesters and other agricultural machinery.

2. Material and Methods

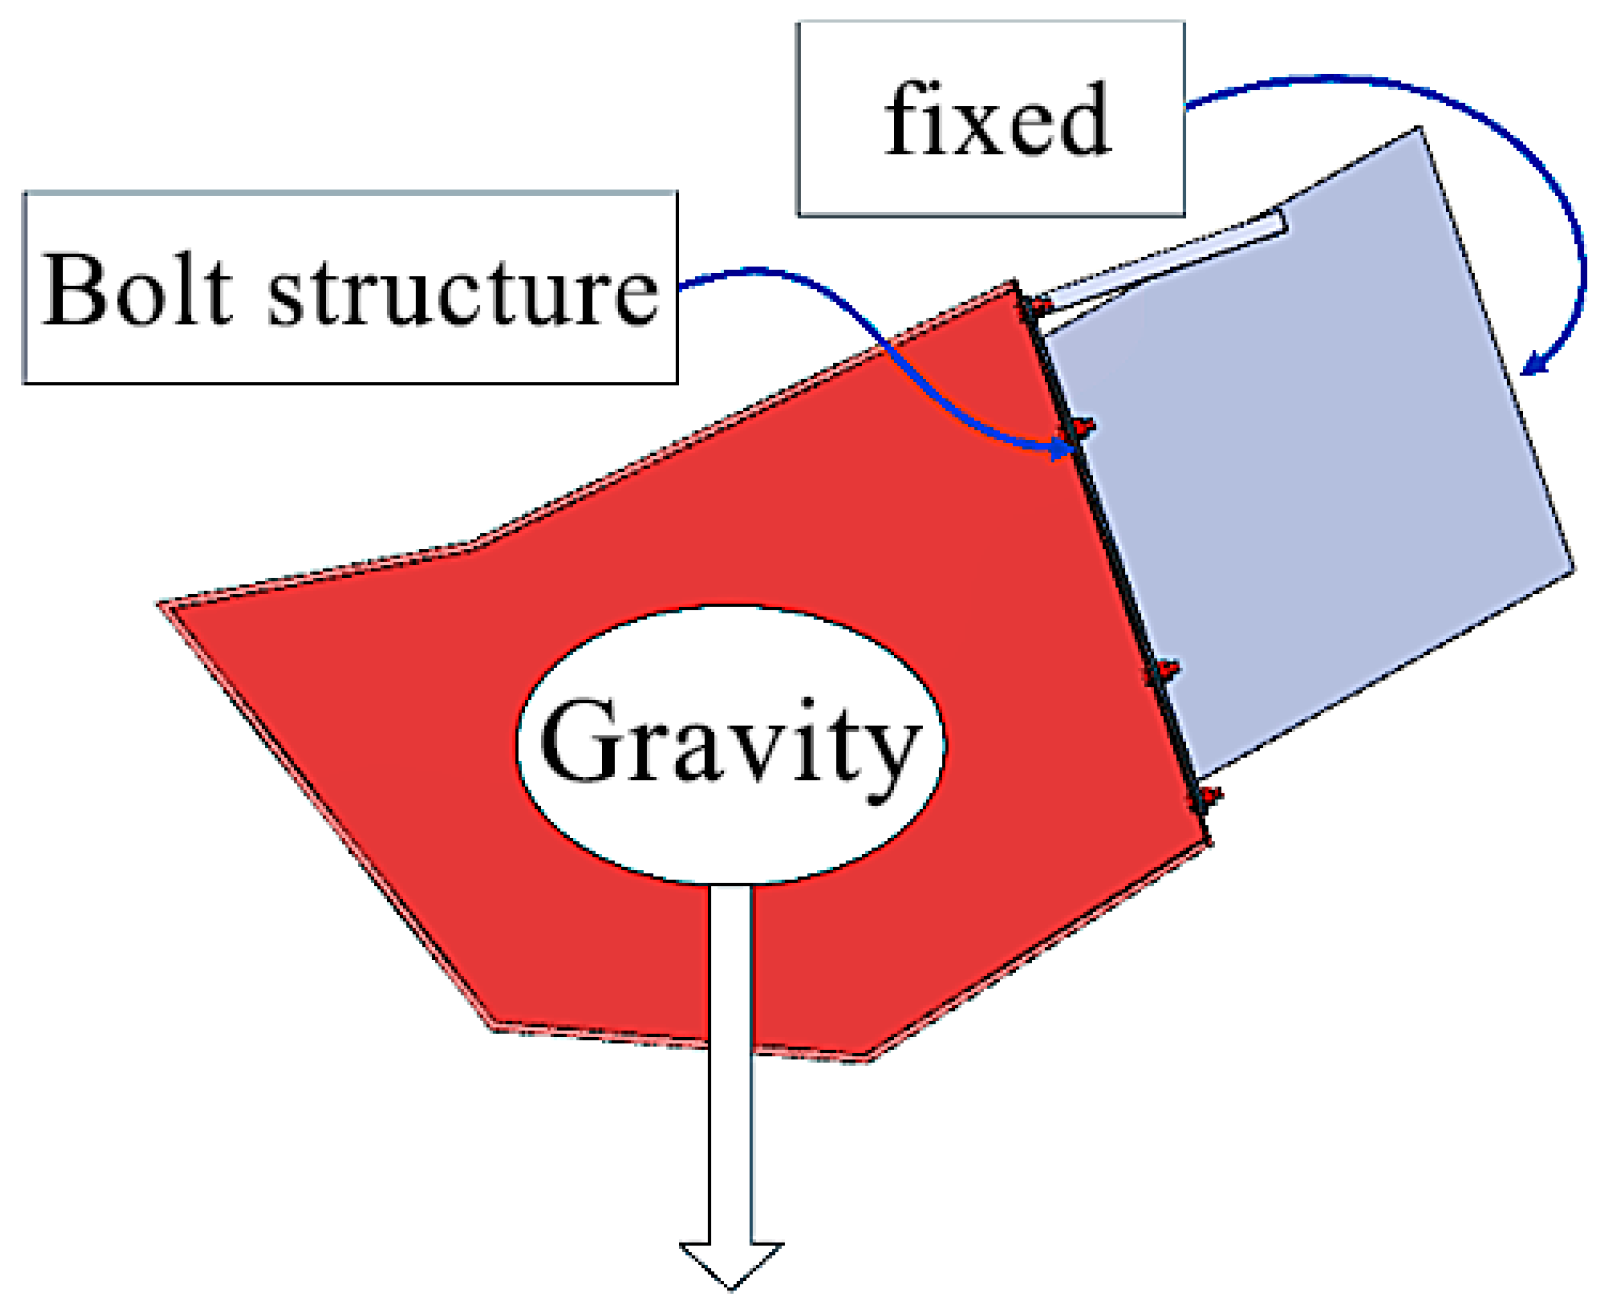
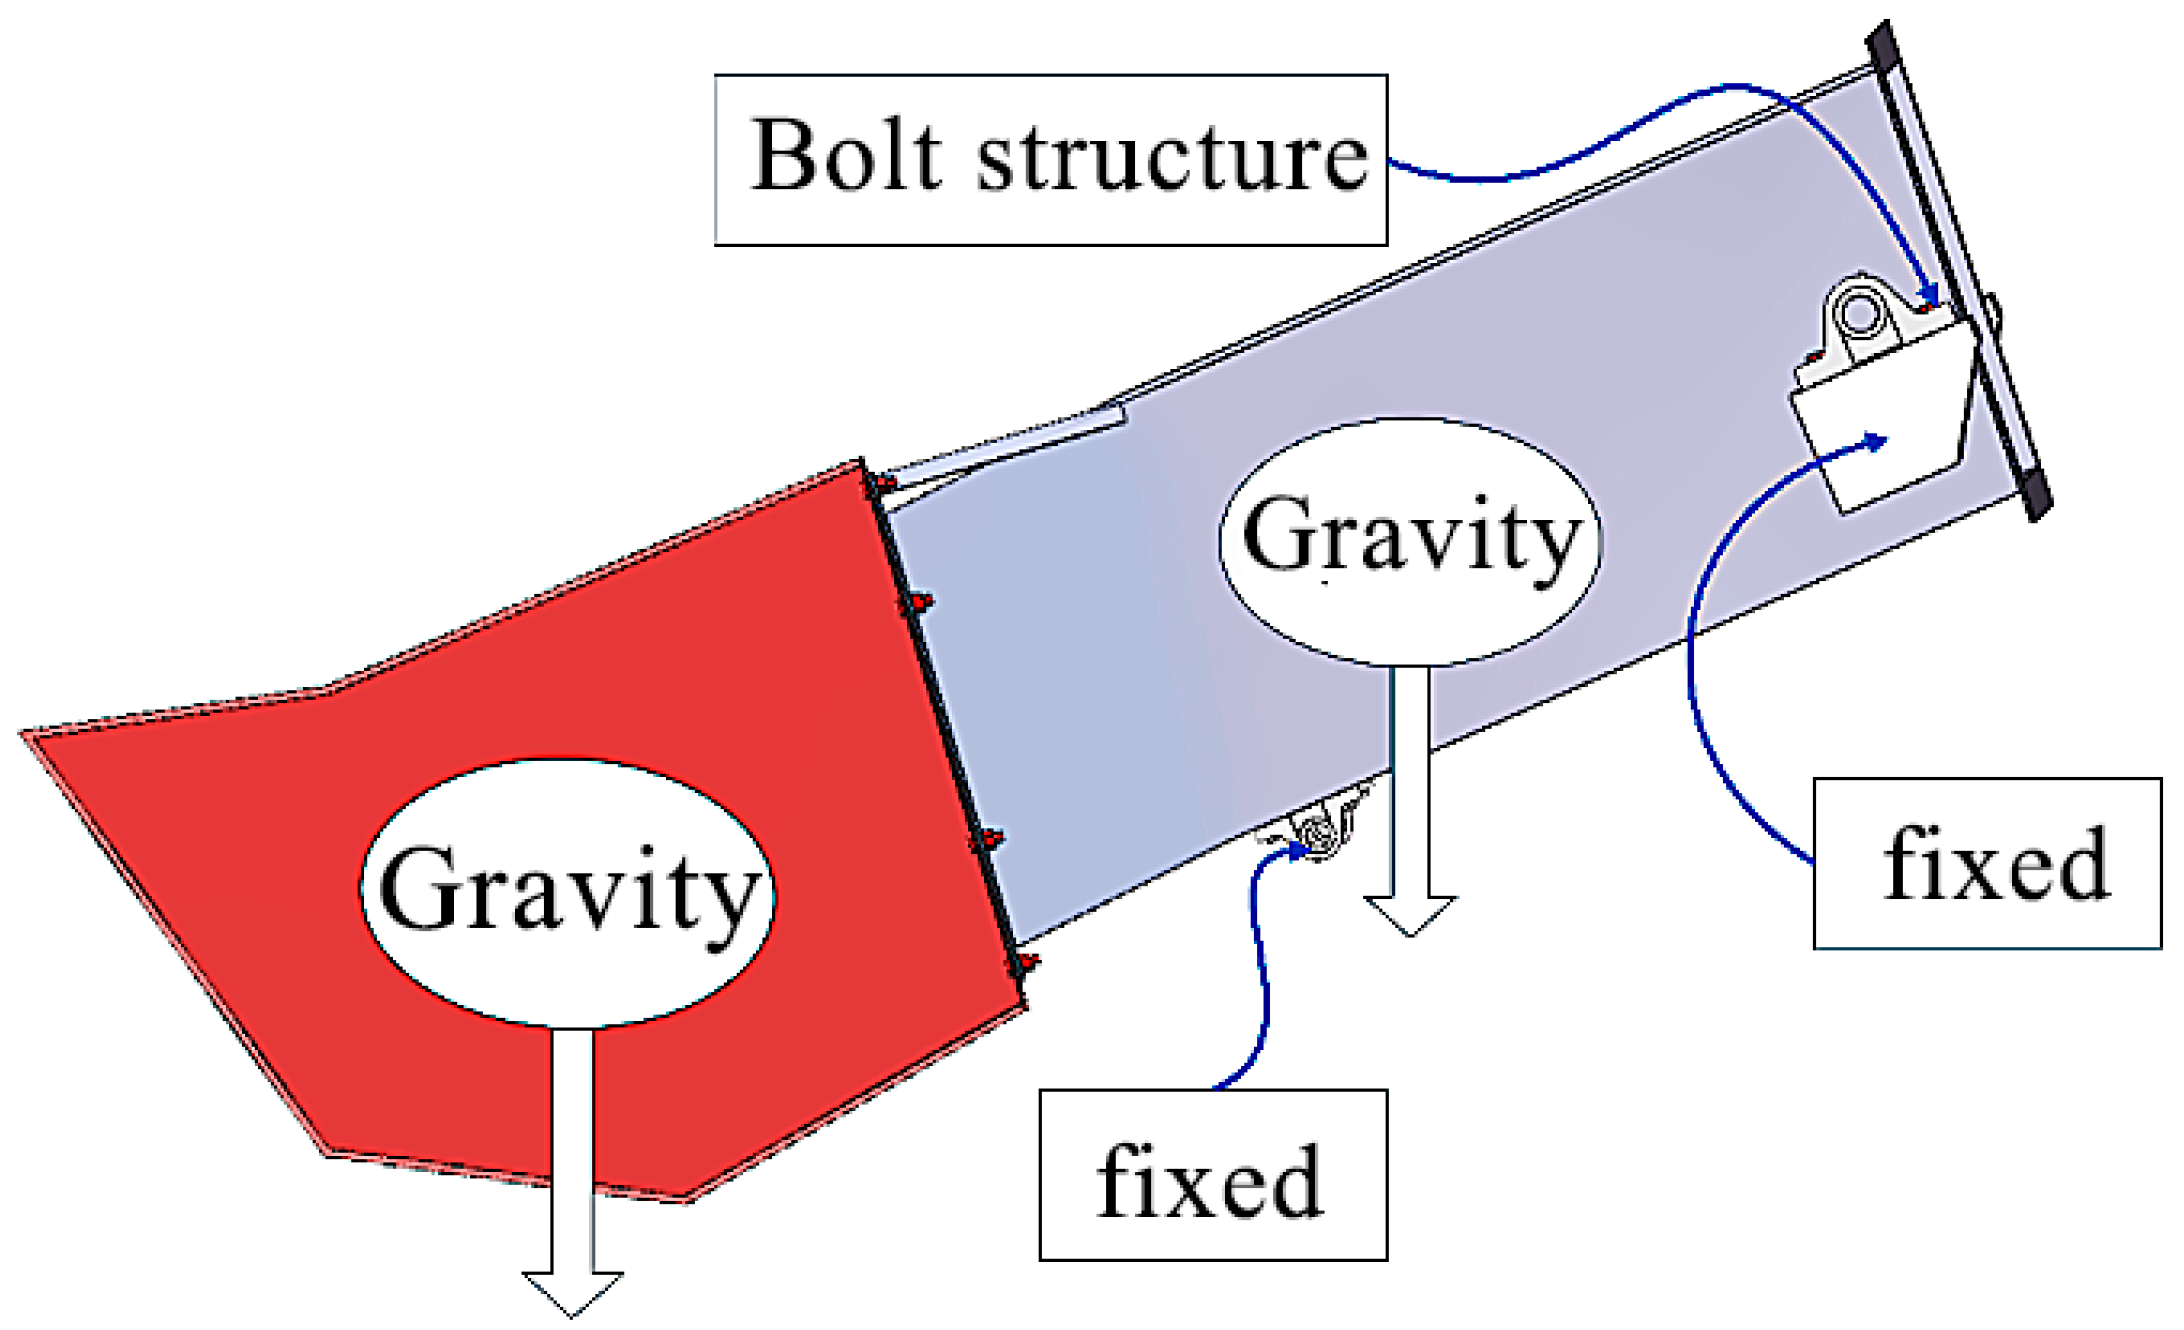
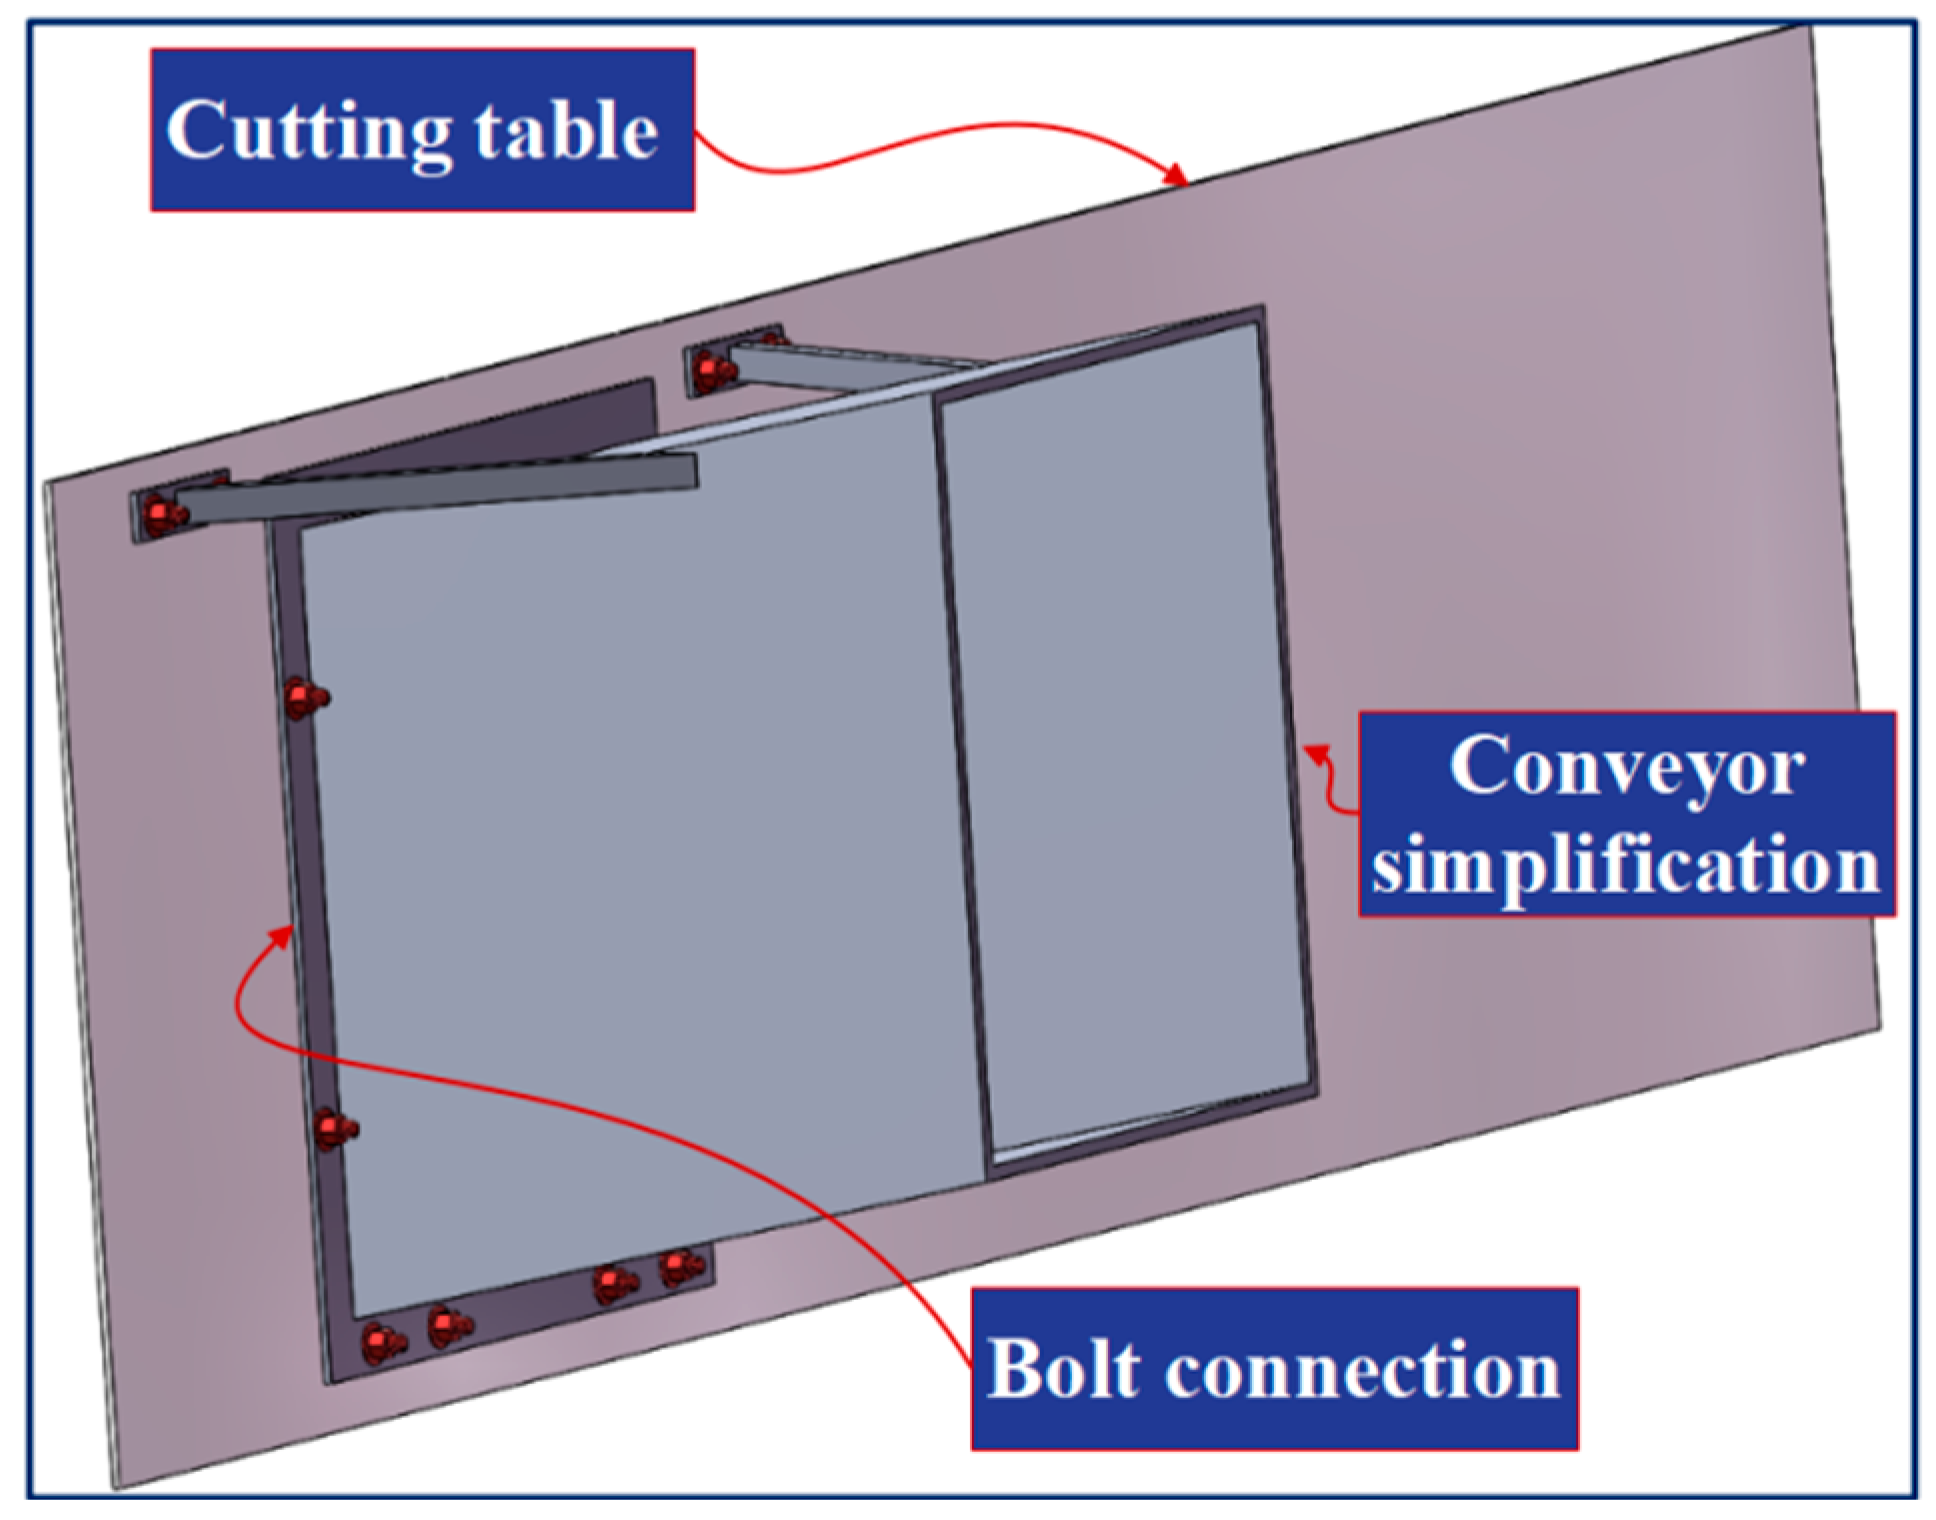
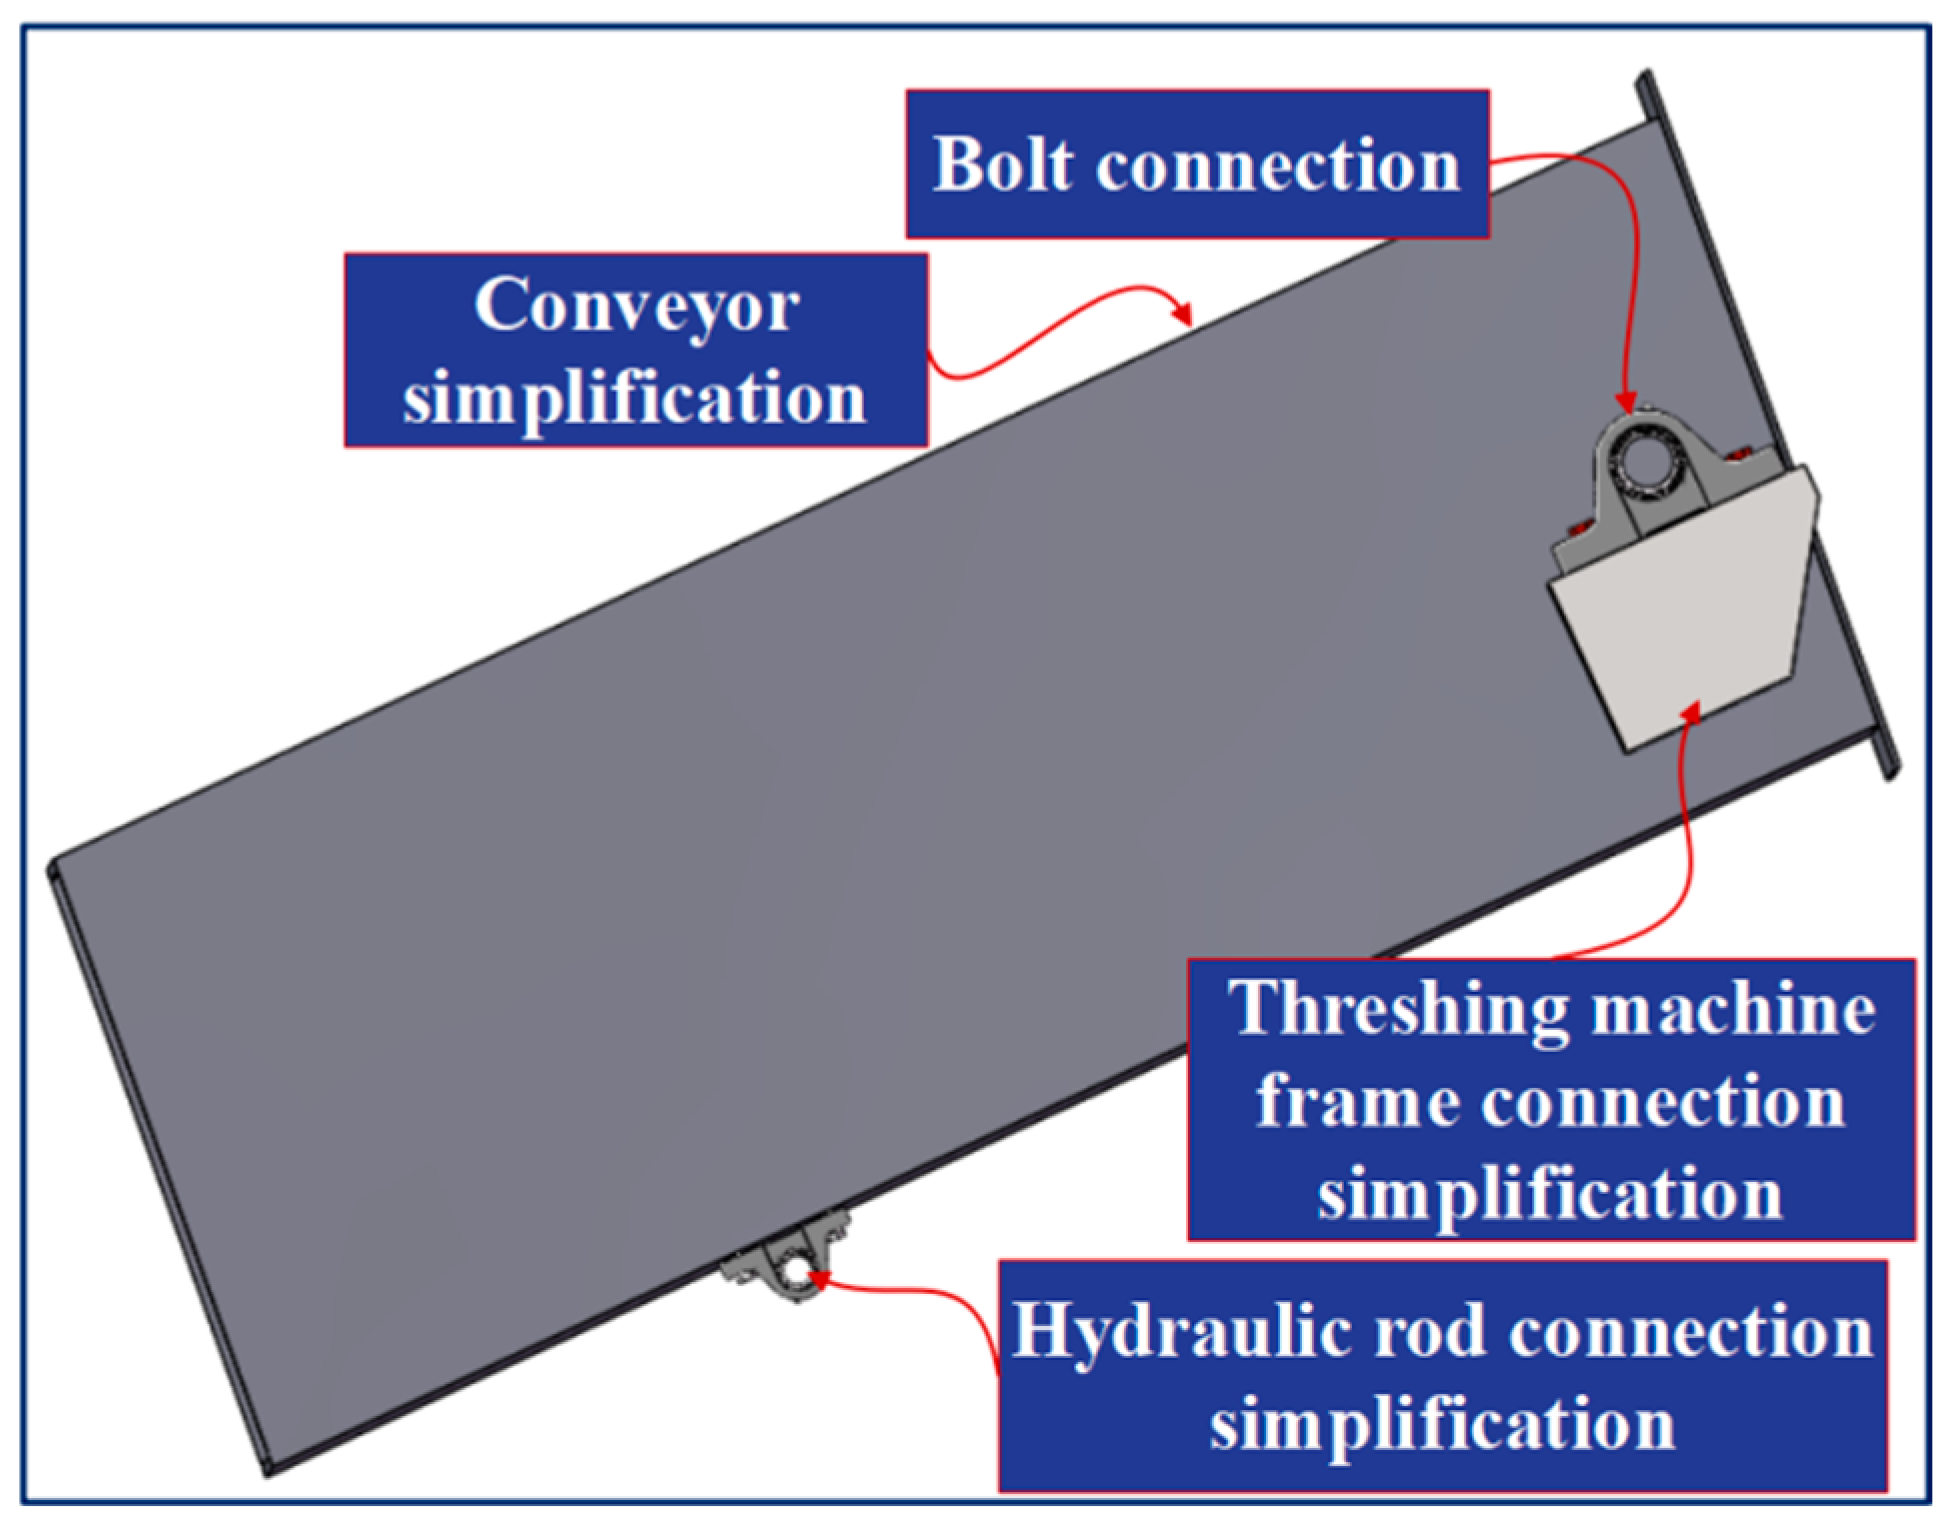
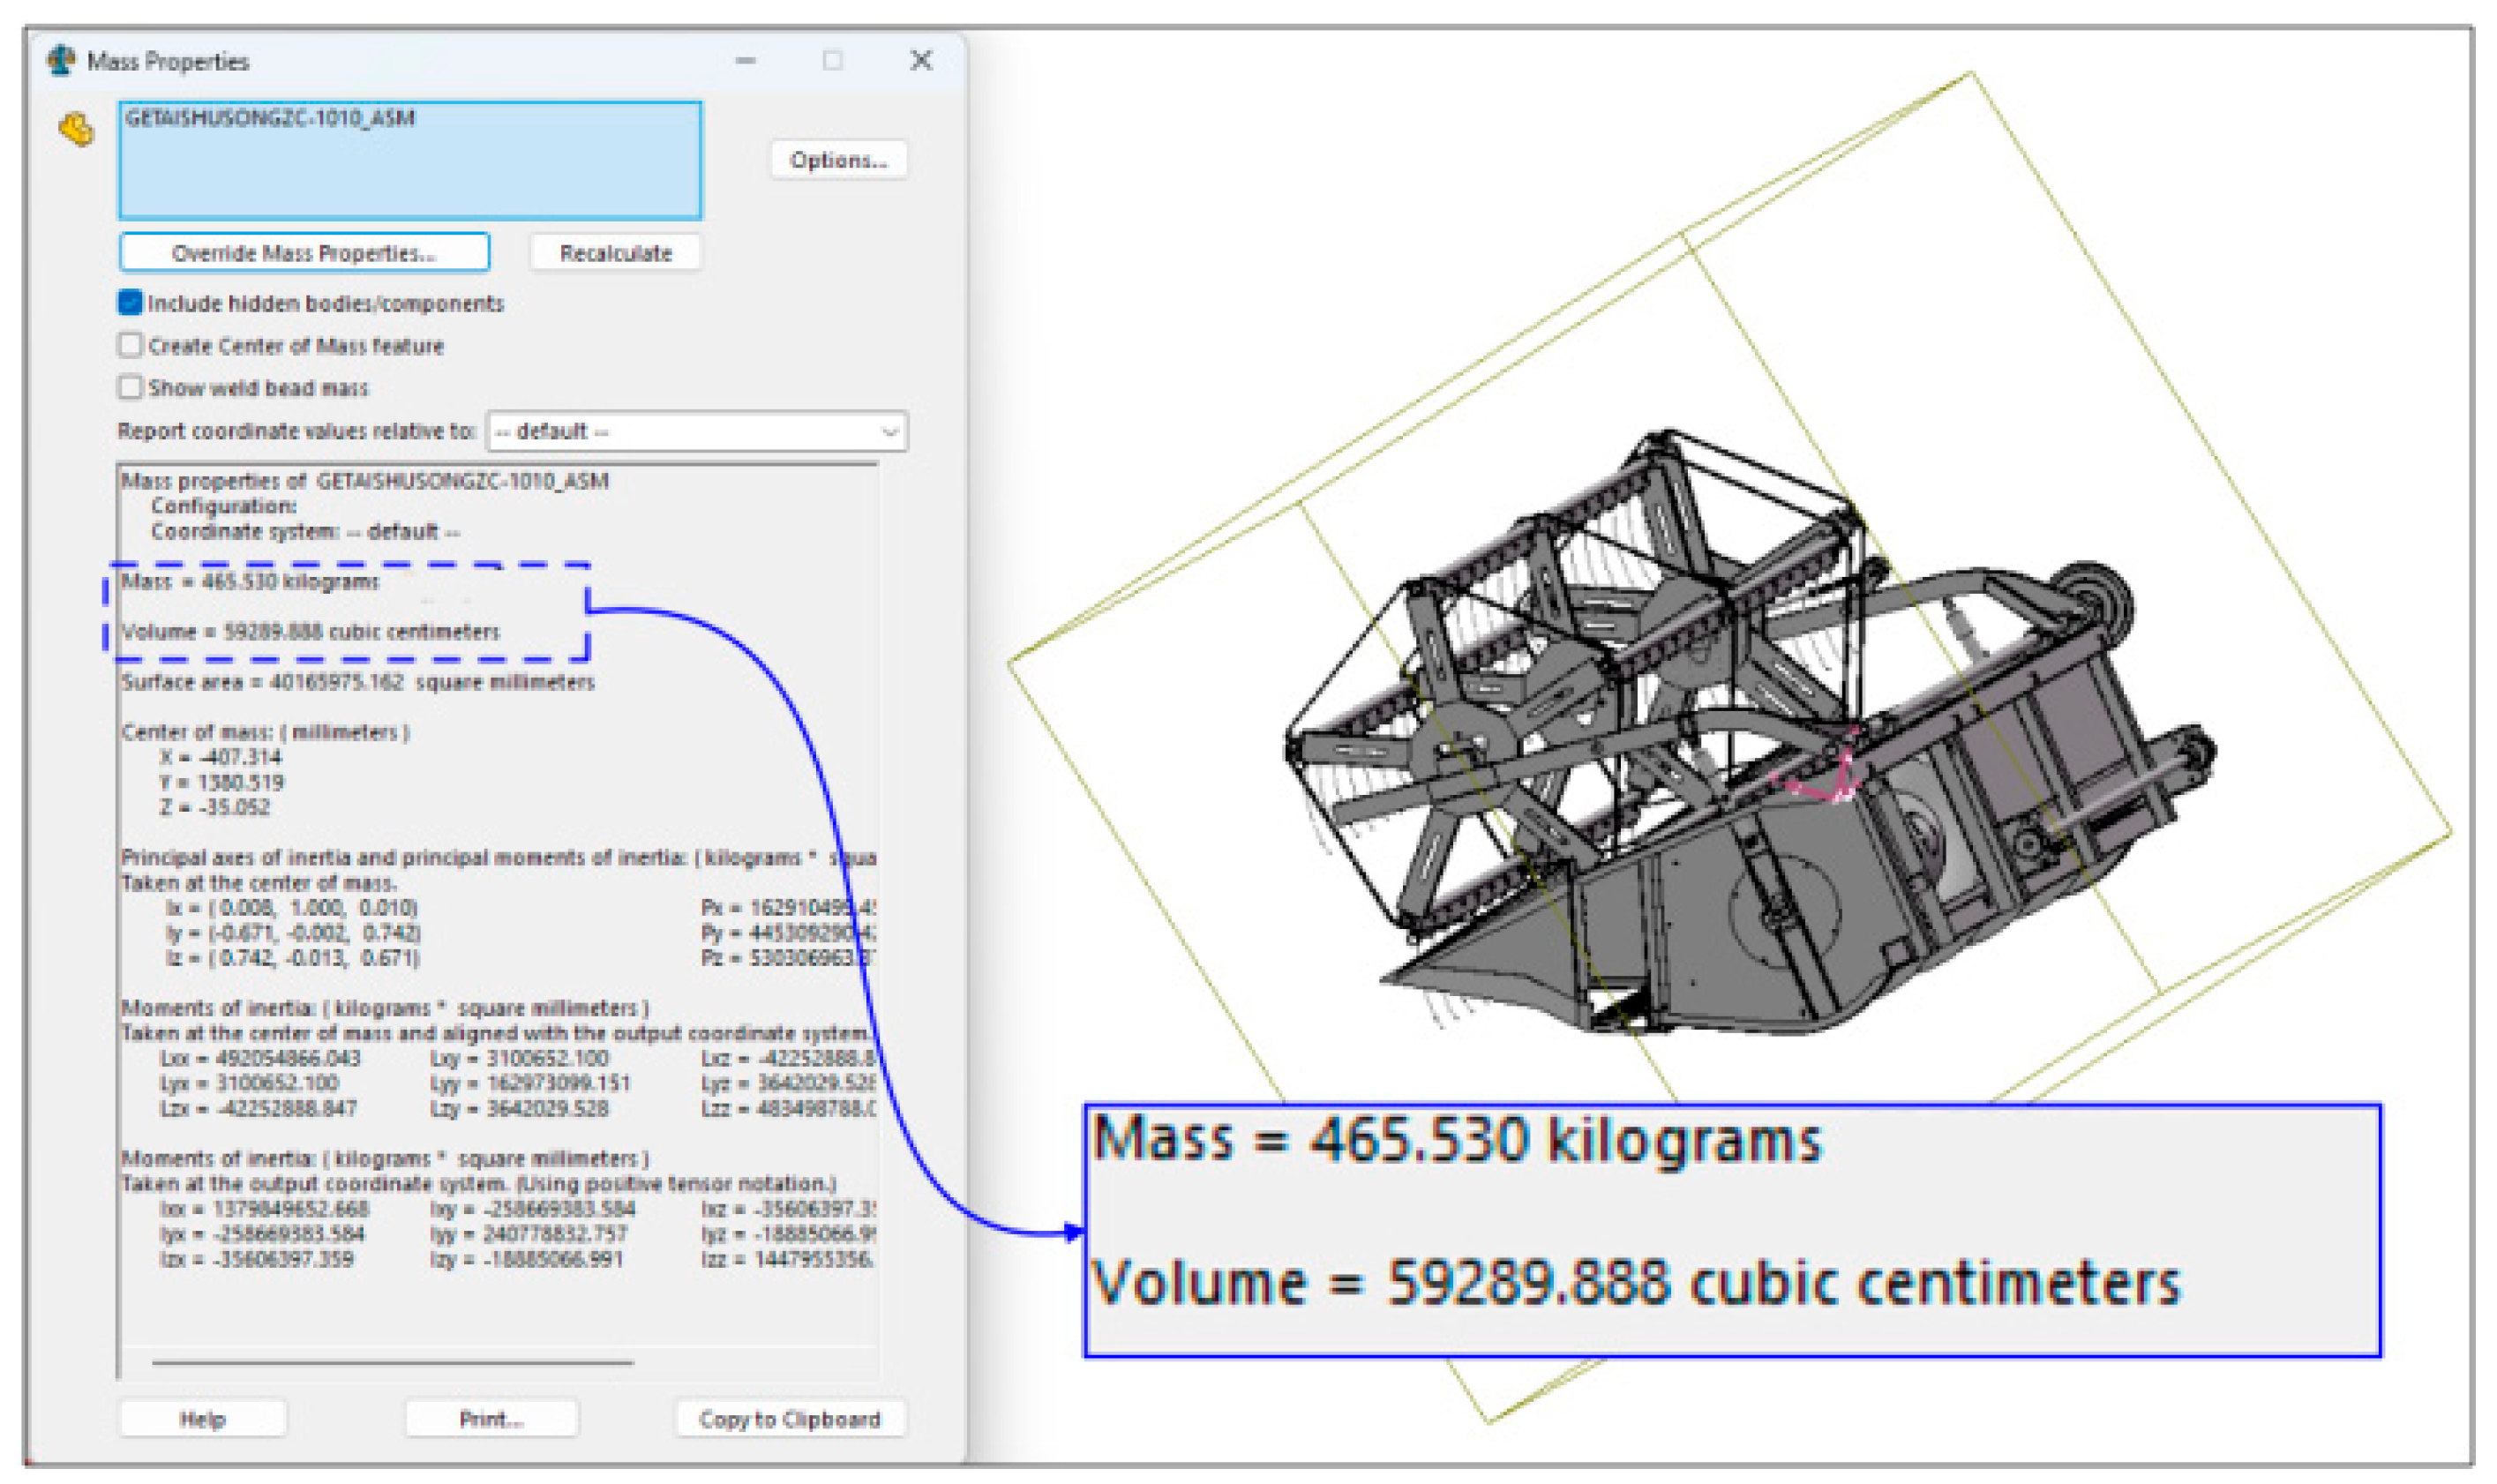
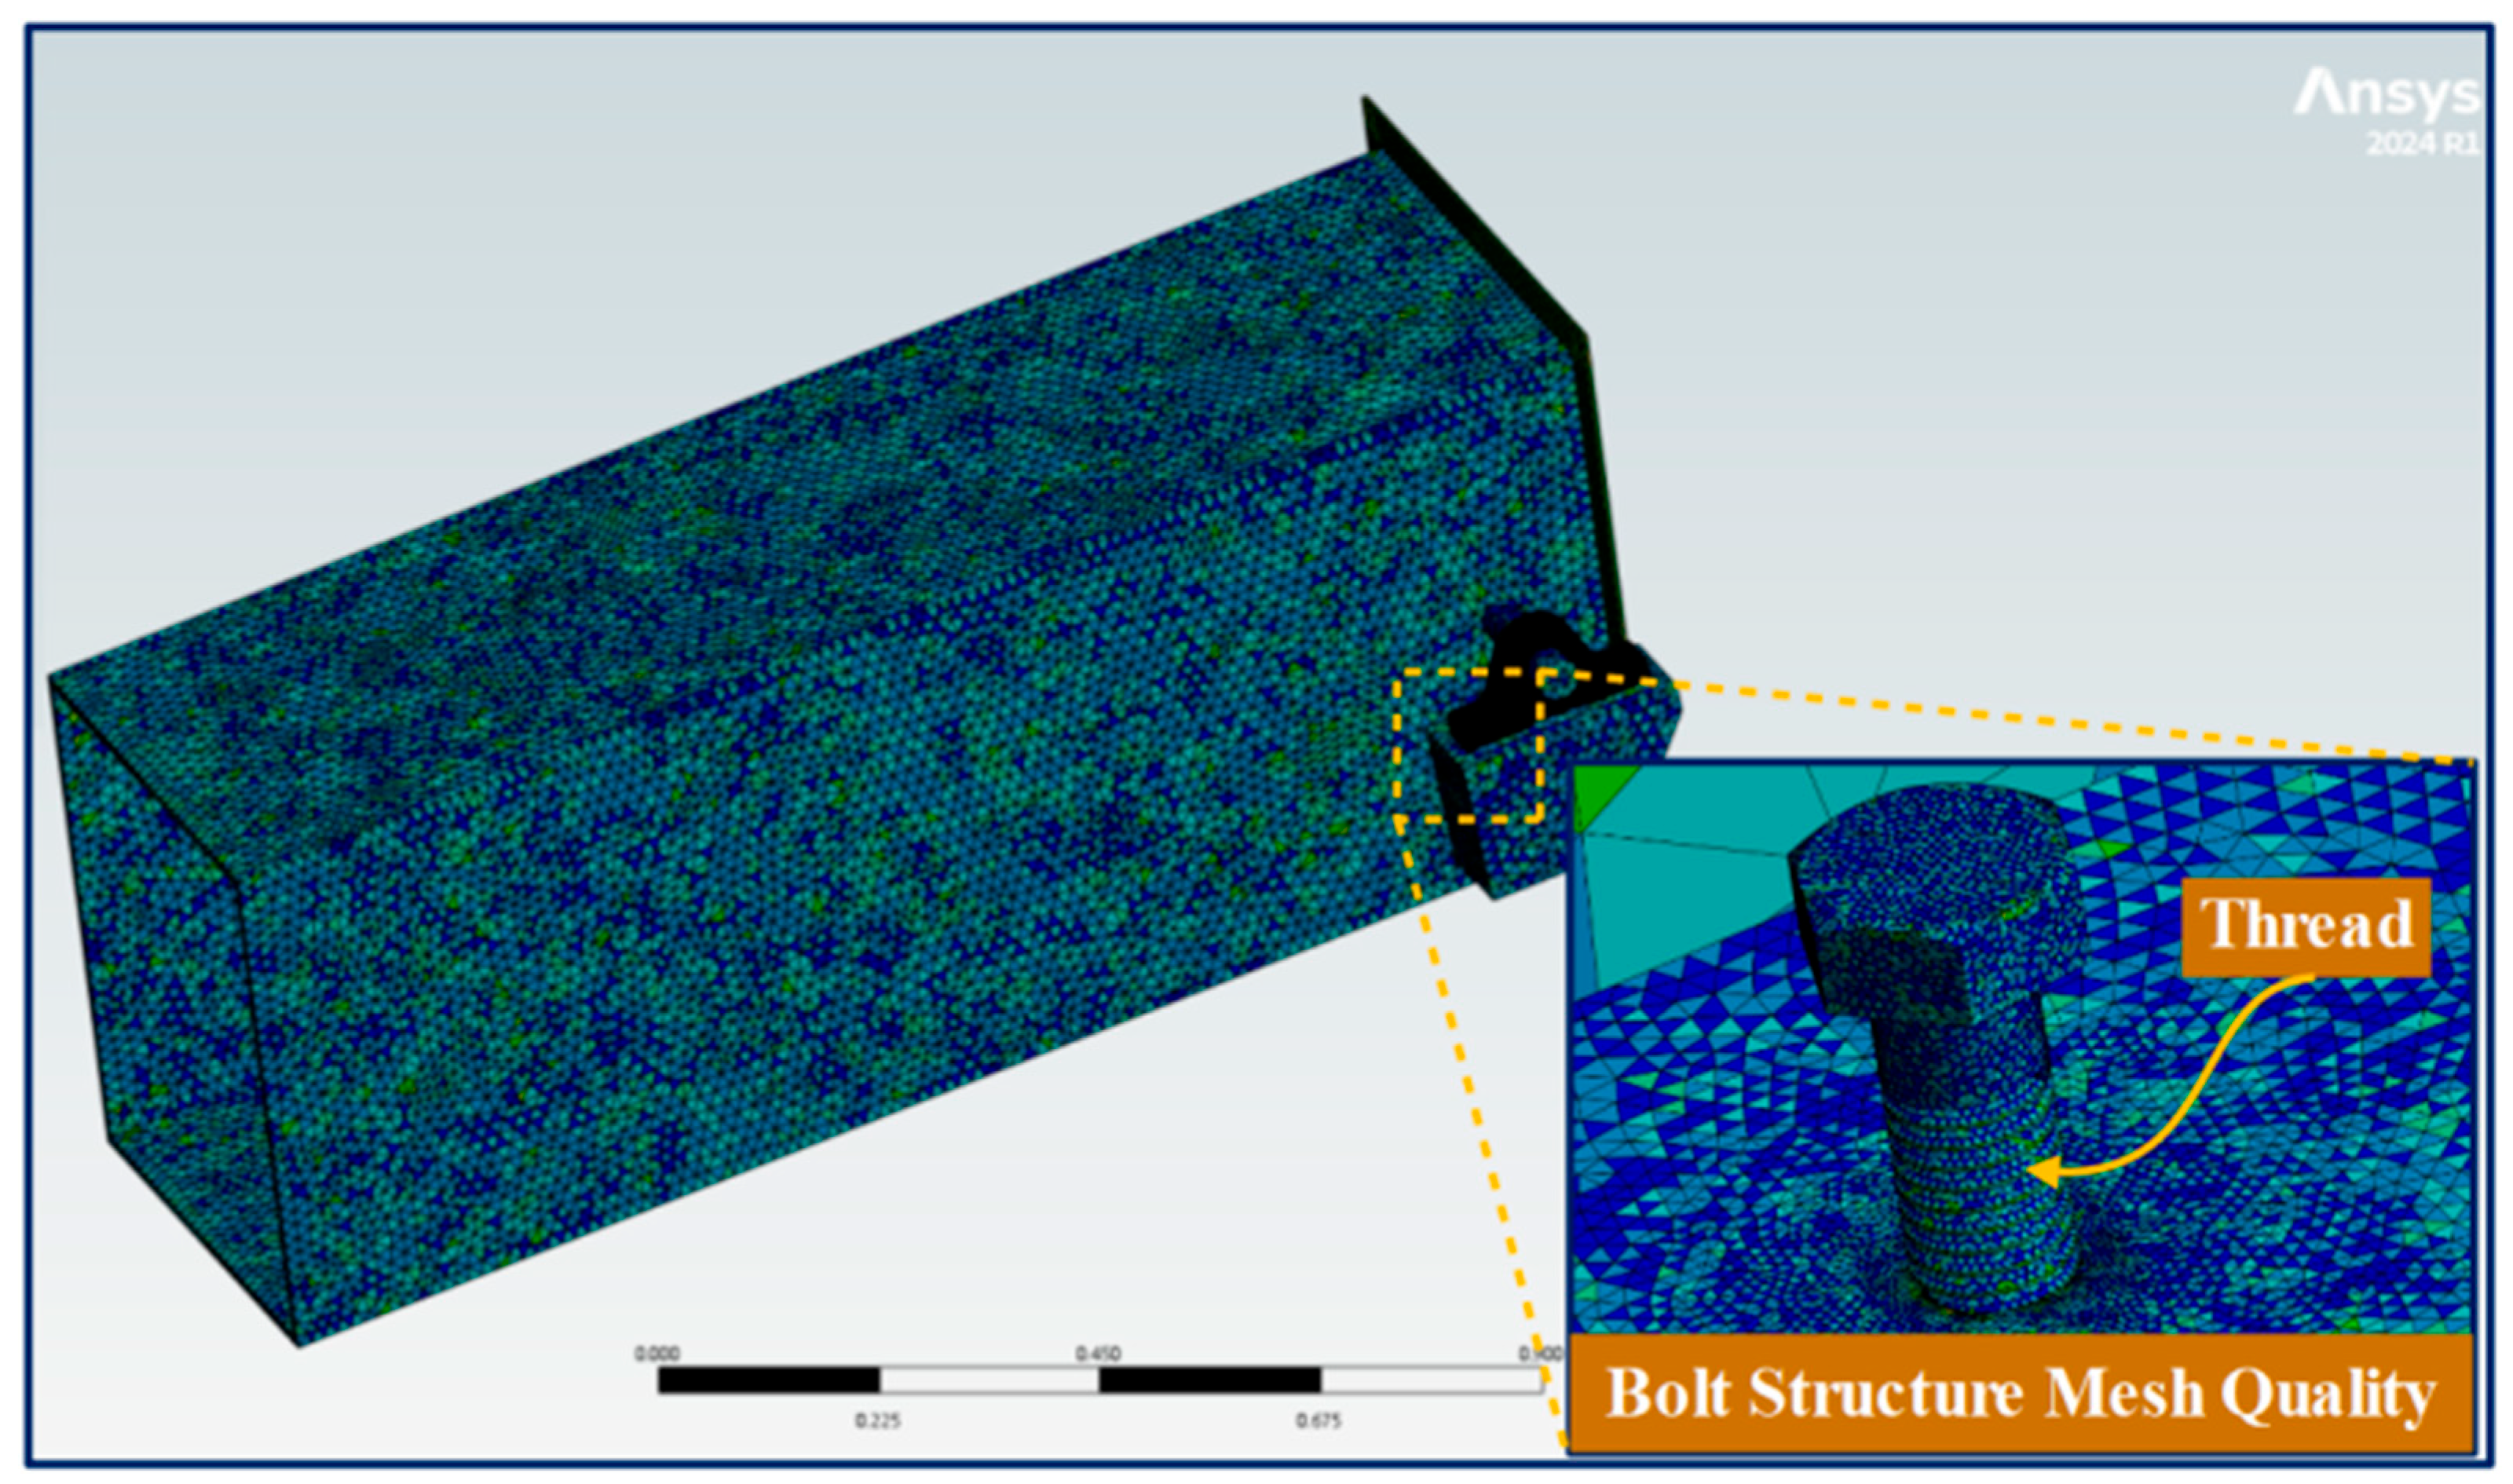
2.1. Load Analysis of Bolt Structures and Acquisition of Mechanical Parameters

The loading behavior at the connection points of the cutting table and conveyor and the conveyor and threshing frame are shown in Figure 1 and Figure 2, respectively. For the cutting table–conveyor connection, the conveyor is considered a fixed frame, and the bolt structure at the connection is only affected by the load generated by the cutting table’s weight. For the conveyor connection to the upper part of the threshing frame, the threshing frame is considered fixed, and the bolt structure at the connection is affected by the load generated by the weights of both the cutting table and the conveyor. Measurements indicate that the angle of the conveyor with the ground is approximately 39.4°.
To investigate the bolt tightening process simulation at the connection points of the combine harvester and to study the mechanical behavior characteristic model of the bolt structure at the connection, Ansys Workbench 2024 R1 was used to perform static and dynamic load simulations on the bolted connection structure of the combine harvester’s conveyor. Based on the relevant model previously established in SolidWorks 2016, the CAD Configuration Manager was used to seamlessly integrate Workbench and SolidWorks for importing the model into Ansys Workbench 2024 R1 for simulation analysis. A simplified model of the bolted connection between the conveyor and the cutting table is shown in Figure 3, and a simplified model of the bolted connection structure between the conveyor and the threshing frame is shown in Figure 4. All bolt structures have solid thread models.
Static load analysis of the combine harvester’s main bolted joints required determining the approximate mass and angular adjustment capabilities of each component. Technical manuals indicated a total harvester mass of 2800–3000 kg , with high-strength steel (density: 7850 kg / m 3 ) commonly used for the cutting table and conveyor. Three-dimensional modeling software was employed to estimate the cutting table and conveyor mass by calculating the volume and centroid as needed for analyzing the bolted joint mechanical characteristics. These mass estimations are presented in Figure 5 and Figure 6, respectively.
Based on the design experience of the combine harvester, the total weight of the combine harvester is 2800 kg . The cutting table is usually one of the heavier components, possibly accounting for 15% to 20% of the total weight; therefore, the weight is approximately between 400 and 600 kg . The conveyor is usually lighter, possibly accounting for 5% to 10% of the total weight, with an approximate weight between 150 and 280 kg .
The first module selected for this simulation test is static structural analysis, used to simulate the response of the structure under dynamic loads that change over time. It can capture the mechanical response of the structure in the time domain. Bolt loosening behavior involves complex contact behaviors (sliding and wear between threads), material nonlinearities (plastic deformation and fatigue damage), and geometric nonlinearities (large deformations), which can provide a preliminary prediction of the stress characteristics of the conveyor’s bolt structure.
Next, the contact of the bolt structure is processed, and materials are added. Then, frictional contact (friction coefficient of 0.2) is set between the two plates connected by the bolts, frictionless contact is set between the bolt hole and the bolt shank, and frictional contact is set between the bolt thread and the hole thread. When setting the contact between the nut and the bolt, due to the presence of threads, it is necessary to manually select the surfaces of the threads for contact and perform multi-zone meshing. After meshing the two models, the number of mesh nodes are 6,239,678 and 2,650,596, and the number of meshes are 4,498,231 and 1,478,509, respectively. The average mesh quality is 0.82 and 0.81, respectively, which meets the mesh quality requirements. The meshes of the two structures are shown in Figure 7 and Figure 8, and the material properties are shown in Table 1.

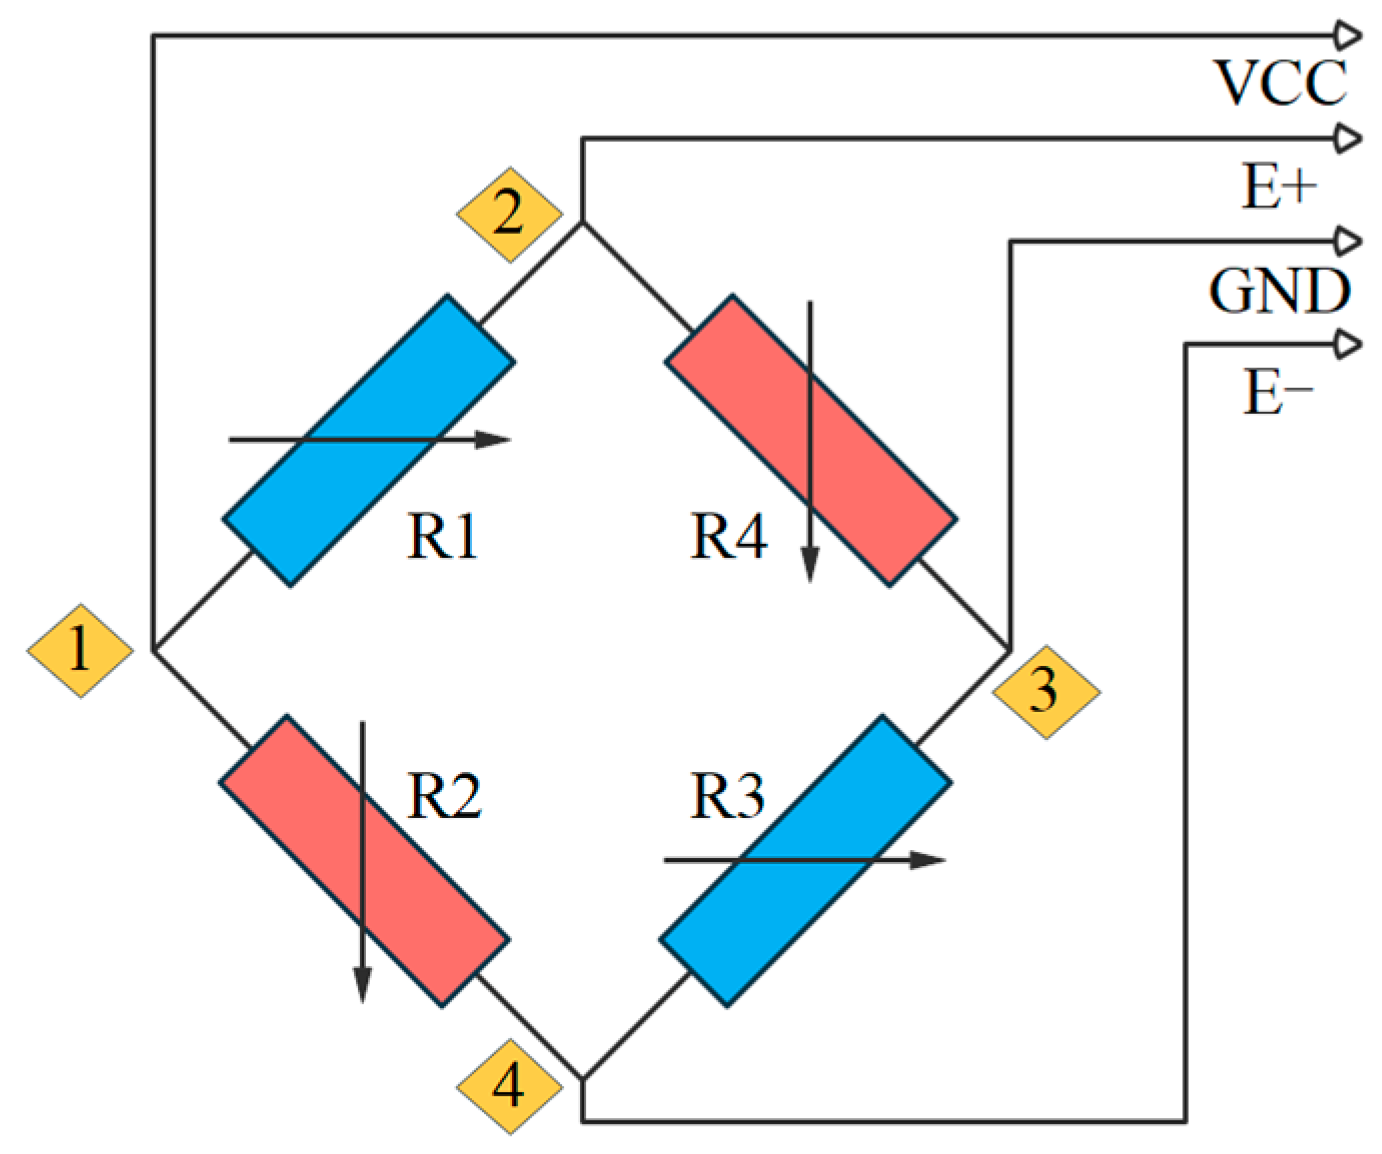
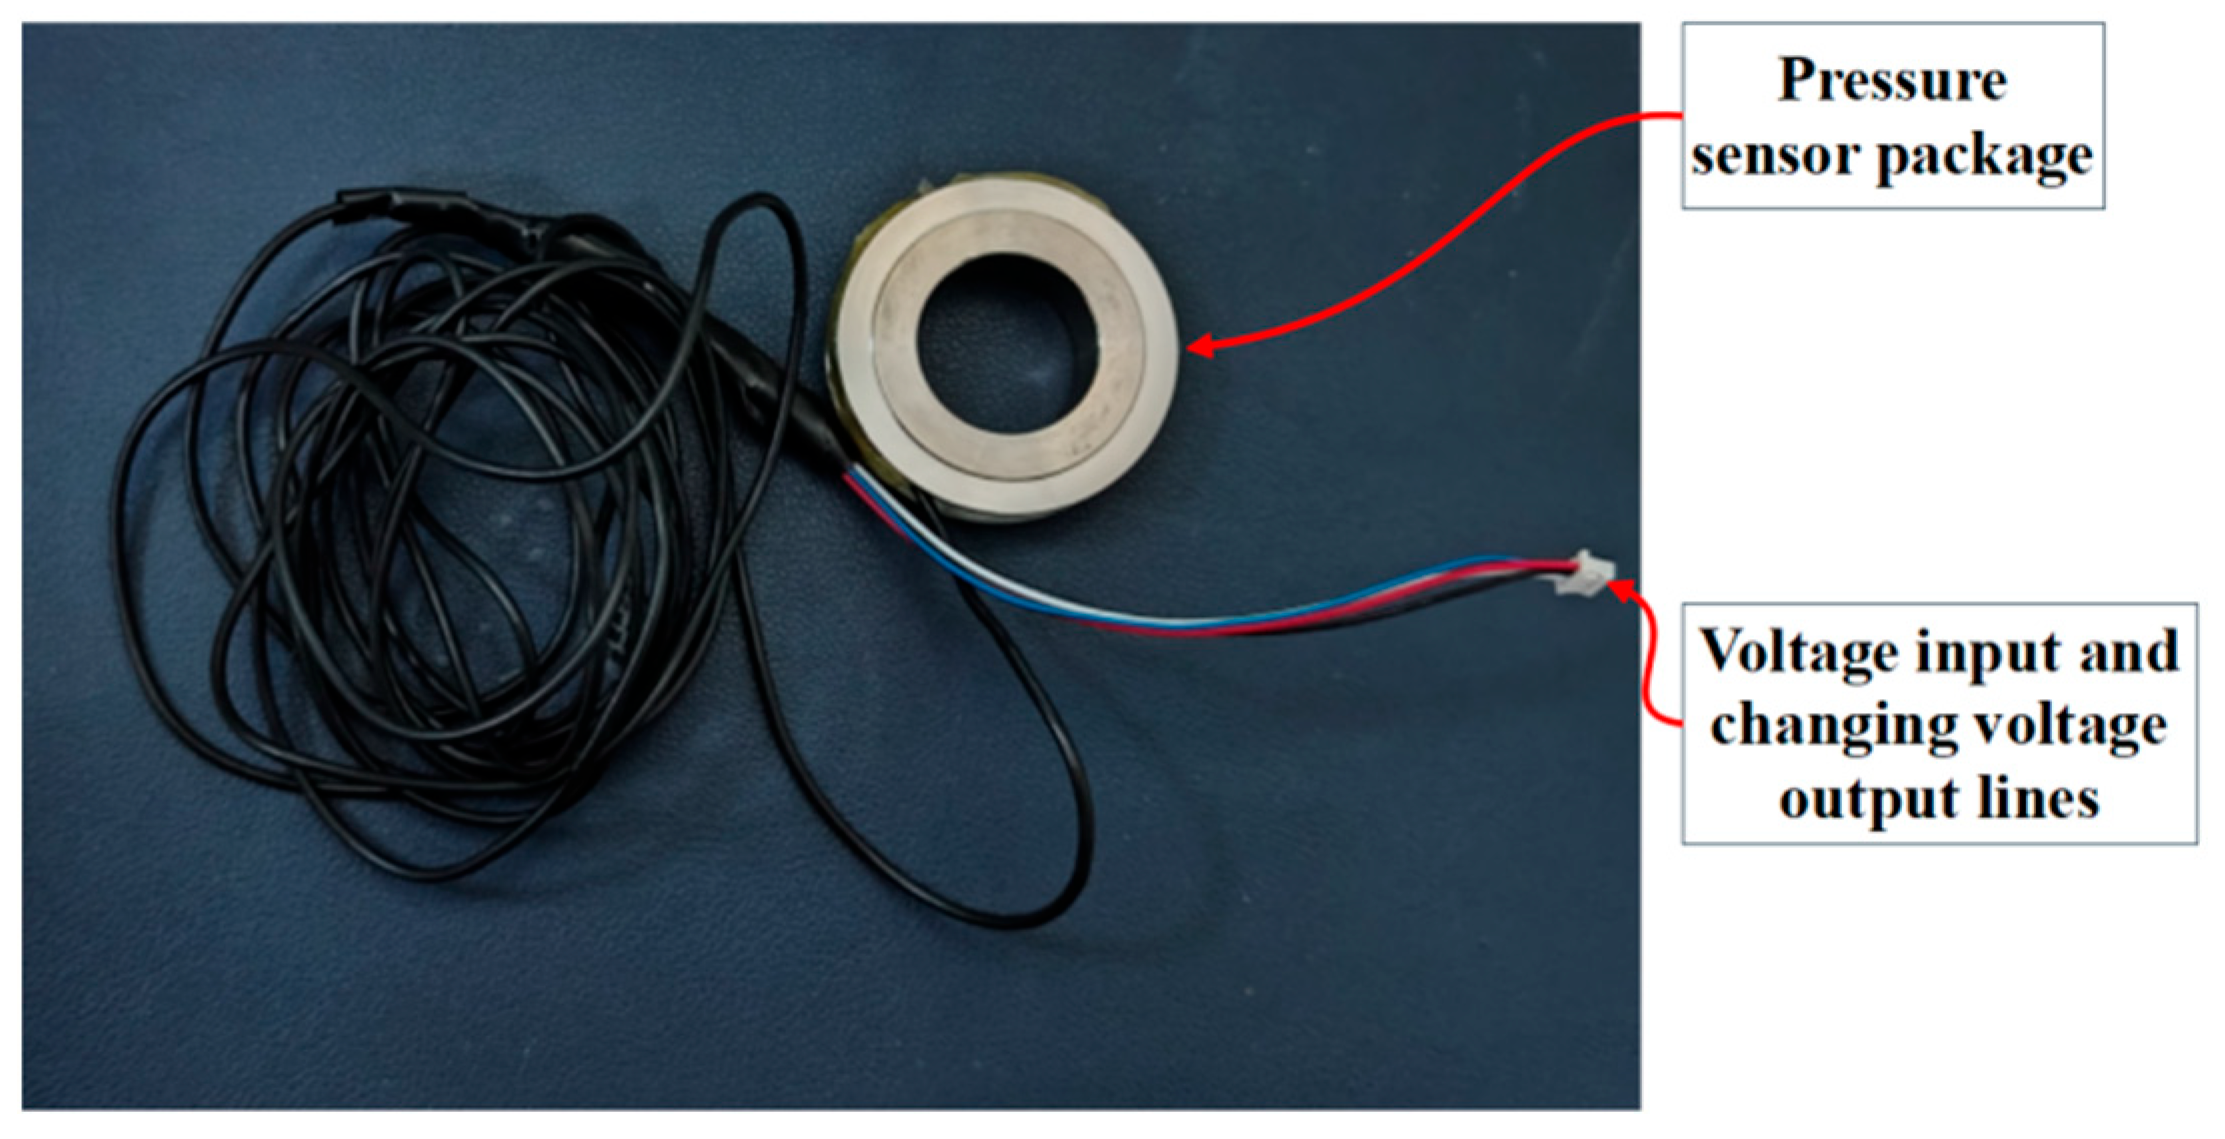
2.2. Design of Wheatstone Bridge-Based Sensor for Monitoring Looseness

To accurately monitor the characteristics of pre-load force changes in bolted structures, this sensor utilizes a Wheatstone bridge. This circuit is commonly used either to determine absolute resistance values by comparison with a known resistance or to measure relative changes in resistance; this paper employs the latter approach. When the bolted structure is subjected to pre-load force, the strain gauges of the sensor (acting as resistive sensors) deform. This deformation causes a minute change in the resistance of the strain gauges, which in turn affects the voltage output of the bridge. As shown in Figure 9 and Figure 10, R1, R2, R3, and R4 are the four arm resistances of the Wheatstone bridge. The VCC is the bridge’s input voltage (typically 5 V).
The E+ and E- are the output terminals of the bridge. The Wheatstone bridge changes the resistance of R1 and R3 due to pressure, causing the output voltage (E+ and E−) to vary with pressure. In the Wheatstone bridge, the resistance of R1 increases with increasing pressure; the resistance of R3 decreases with increasing pressure. The R2 and R4 are fixed resistors, serving as a reference. The following equation describes the condition for the bridge balance:
R 1 R 2 = R 3 R 4
The output voltage of the Wheatstone bridge (E+ and E−) is determined by the following equation:
V out = ( R 3 R 3 + R 4 R 1 R 1 + R 2 )
Therefore, the magnitude of the pre-load force in the bolted structure can be converted into a voltage change in the Wheatstone bridge. This allows the circuit to be connected to a microcontroller unit (MCU) for monitoring the bolted structure. However, because the V out voltage signal is very small, signal conditioning is often required in practical applications. Therefore, the HX710A, a high-precision analog-to-digital converter (ADC), was employed to process the acquired bridge voltage.
The HX710A integrates a programmable gain amplifier (PGA). The gain is typically set to 64 or 128, selected based on the strength of the sensor output signal. The gain formula is as follows:
V out - H = G ain × V in
In the equation, V in is the differential analog output signal from the sensor; V out - H is the signal after amplification by the PGA. Assuming that a gain of 128 is selected, the amplified signal is 128 times the original signal. Because Wheatstone bridges are designed to detect minute changes in resistance, and strain caused by pressure typically leads to very small resistance changes, thus producing very small voltage signals, a gain of 128 times is therefore chosen.
The analog-to-digital converter (ADC) transforms the amplified analog signal into a digital signal. The relationship between the resulting digital value, D , and the PGA output voltage, V out - H , is given by the following equation:
D = V out - H V ref ( 2 Resolution 1 )
The D is the digital output value from the ADC. Resolution refers to the ADC’s resolution. For the HX710A, this is generally 24 bits, and this paper uses a 24-bit Resolution . V ref is the reference voltage, which is typically 2.5 V.
The sensor output has a linear relationship with the measured physical quantity (preload/pressure), and a linear equation can be used to calculate the physical quantity. The relationship between the sensor output and the actual measured value is as follows:
F Measure Value = ( D 2 Resolution 1 ) × ( V max V min ) + V min
F Measure Value is the actual measured preload, and the V max and V min are the maximum and minimum output voltages, respectively, of the Wheatstone bridge circuit.

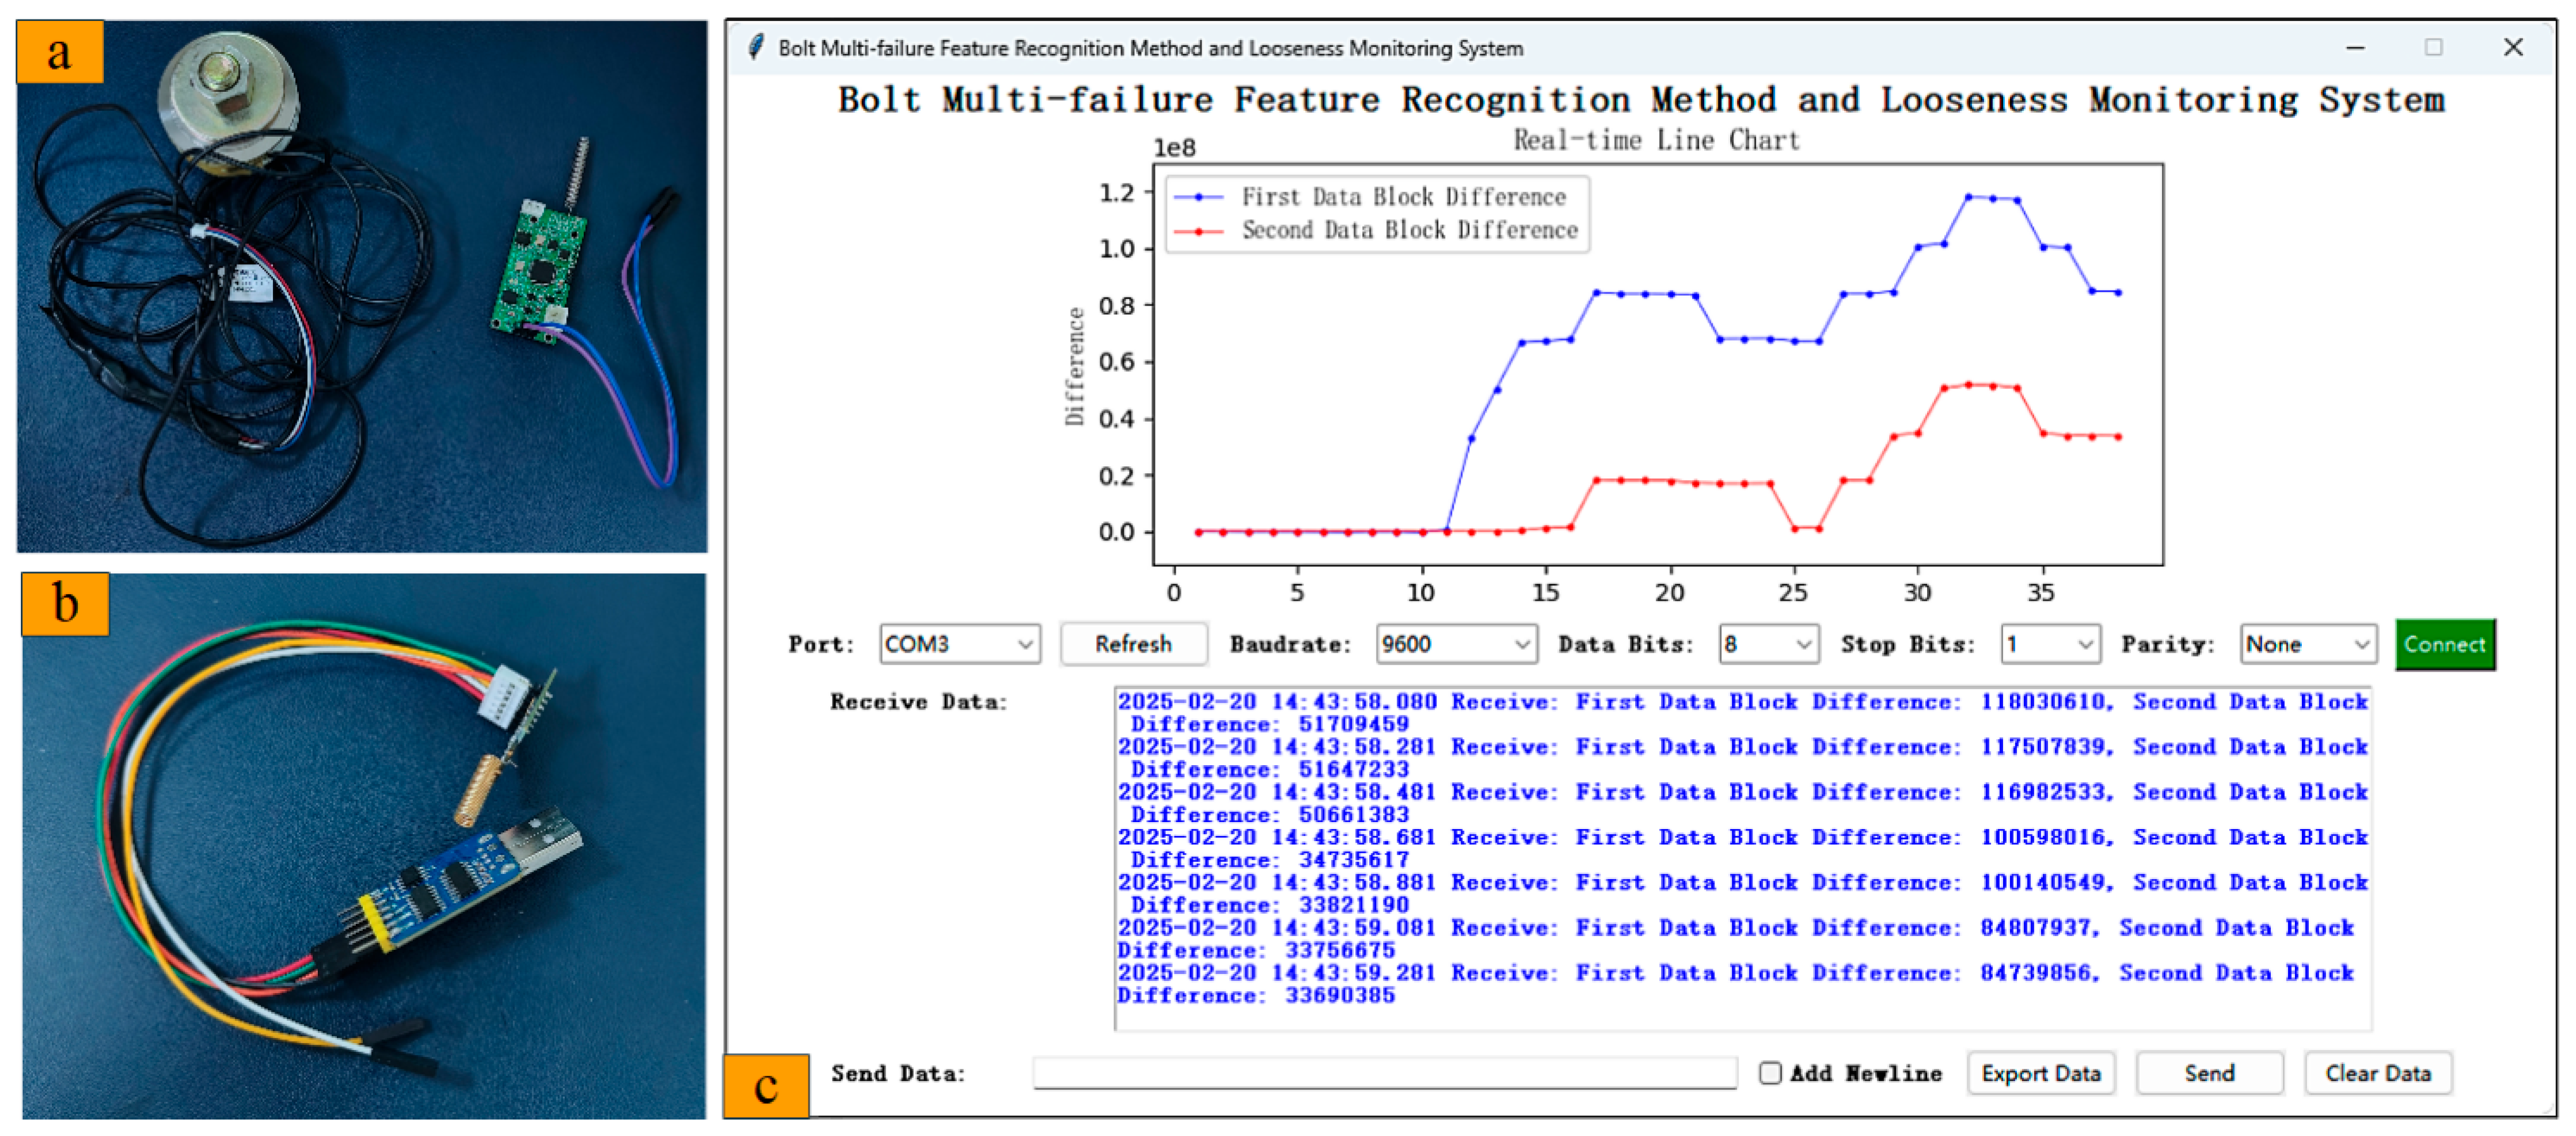
2.3. Design of Wireless Monitoring System for Loose Conveying Tank Bolt Structure

Due to the structural complexity of combine harvesters, a wireless transmission approach is required for the bolt loosening dynamic monitoring device. This approach mitigates the issues of complex wiring, facilitates easier installation and maintenance, and permits remote, real-time monitoring. In the preliminary development stage, a central control center is not necessary at the receiving end. Conversely, the monitoring end requires a central control center for sensor data processing and control of the wireless communication circuits. The central control center at the monitoring end is based on the STM32F103CBT6 microcontroller and incorporates power supply and filtering circuitry, an external crystal oscillator circuit, and a mode selection circuit, as illustrated in Figure 11.
Furthermore, to ensure optimal power delivery to the sensors and wireless transmission circuits on the monitoring end, a lithium battery charging and protection circuit is implemented, as depicted in Figure 12. This circuit incorporates a TP4056 management IC, an LED for charging status indication, and a DW01 module that works in conjunction with a dual MOSFET 8205A (China, Shenzhen, Shenzhen Fuman Electronics Group Co., Ltd.) to safeguard against overcharge, over-discharge, and overcurrent events.
Furthermore, as the lithium battery has a nominal voltage of 3.7 V, a step-down converter circuit is necessary to efficiently reduce the 3.7 V battery voltage to a stable 3.3 V. As depicted in Figure 13, the step-down converter employs a CJ9221T5 regulator IC (China, Jiangsu, Jiangsu Changdian), accompanied by a ferrite bead and filter capacitors for noise suppression, thereby providing a clean power supply to downstream circuits. Because the preload monitoring sensor produces an analog voltage output, a high-accuracy ADC acquisition circuit is implemented, as shown in Figure 14. This circuit incorporates the HX710A (China, Xiamen, Haixin Technology Co., Ltd.), a high-precision ADC, together with bias resistors and filtering capacitors. This configuration enables the acquisition of the low-level analog sensor signal and its subsequent conversion into a digital signal, facilitating processing by the microcontroller. The communication protocol between the HX710A and the STM32F103CBT6 microcontroller is serial communication.
The LoRa is a long-range, low-power wireless communication technology that offers significant advantages within the Internet of Things (IoT) domain. It enables communication over distances exceeding several kilometers in unobstructed environments, and its low power consumption permits battery-powered device operation for extended periods, often several years. LoRa employs a star network topology, facilitating management and scalability, and operates in a license-exempt spectrum, thereby minimizing operational costs. Its applications frequently include smart cities, agriculture, logistics, industrial settings, and similar fields. Consequently, the wireless transmission module is based on the ANT6303_1 wireless communication chip, as illustrated in Figure 15. Communication between the ANT6303_1 wireless communication chip and the central control center is established via a serial interface. To accommodate potential future functional expansion, a number of ports are reserved on the control center.
During the preliminary phase, debugging operations can be carried out by connecting a debugger to a computer; therefore, no supplementary circuitry is incorporated. The circuitry for the monitoring receiver, depicted in Figure 16, utilizes a 16 MHz crystal oscillator as its clock source. Connection to the antenna (ANT1, utilizing an IPEX connector) is achieved via an RF filtering network composed of inductors FB1–FB6 and capacitors C8 and C10–C13, facilitating wireless signal transmission and reception. This circuit operates from a +3.3 V power supply, with capacitors C16–C21 providing power supply filtering to ensure operational stability. Capacitors such as C9 and C15 are employed for digital pin filtering. Debugging is then facilitated through the use of a debugging assistant tool.
To enable a single central control system to acquire data from multiple sensors, a switching circuit is implemented, as depicted in Figure 17. This circuit, interfaced with the STM32F103CBT6 central control center through pins P2.3~P2.6, provides control over MOSFET modules Q1~Q4, thereby enabling line switching. The P0.0 (ADC) interface is connected to the ADC acquisition circuit of the aforementioned monitoring end device. Because the HX710A module measures the differential voltage between the INN and INP inputs, each sensor requires a pair of INN and INP connections. Consequently, eight MOSFET modules are necessary to perform sequential readings from four sensors.
For data monitoring purposes, a preliminary design of the monitoring system’s host computer software is necessary. The host computer software is developed using Python (3.12.5). As the system’s wireless receiver communicates data through a USB interface, the host computer programming is primarily developed around serial communication protocols. The overall system architecture is illustrated in Figure 18, enabling real-time feedback of sensor data variation characteristics. Figure 18a depicts the wireless data transmitting end of the monitoring system, Figure 18b depicts the wireless data receiving end, and Figure 18c depicts the graphical user interface of the monitoring system’s host computer software. This monitoring system communicates with the previously described hardware structure using the serial communication protocol.

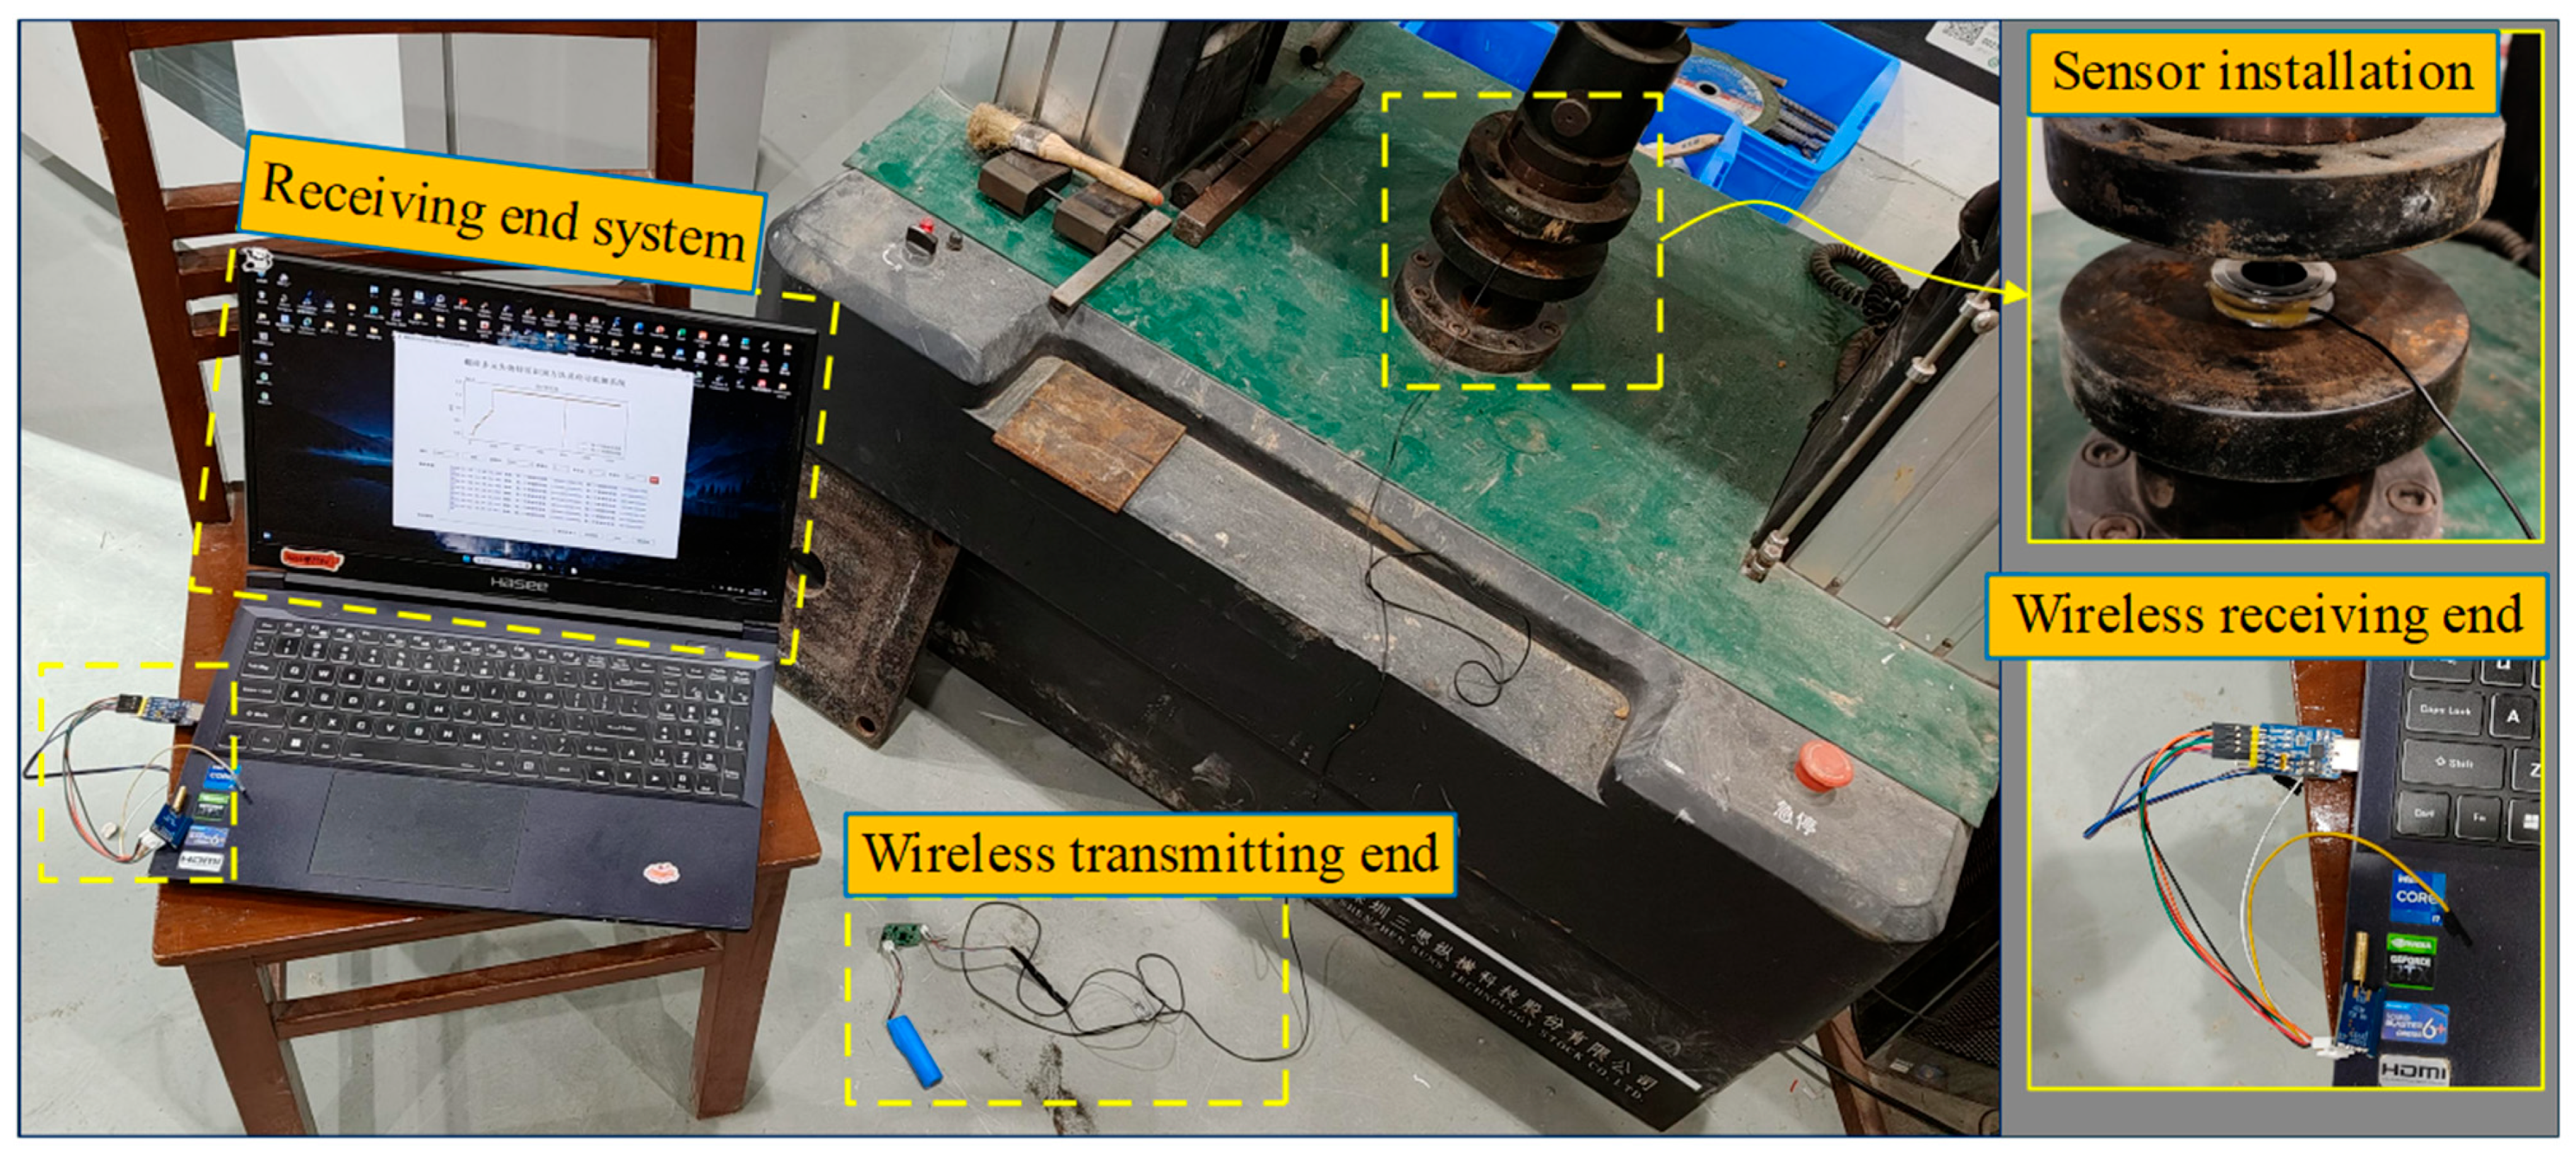
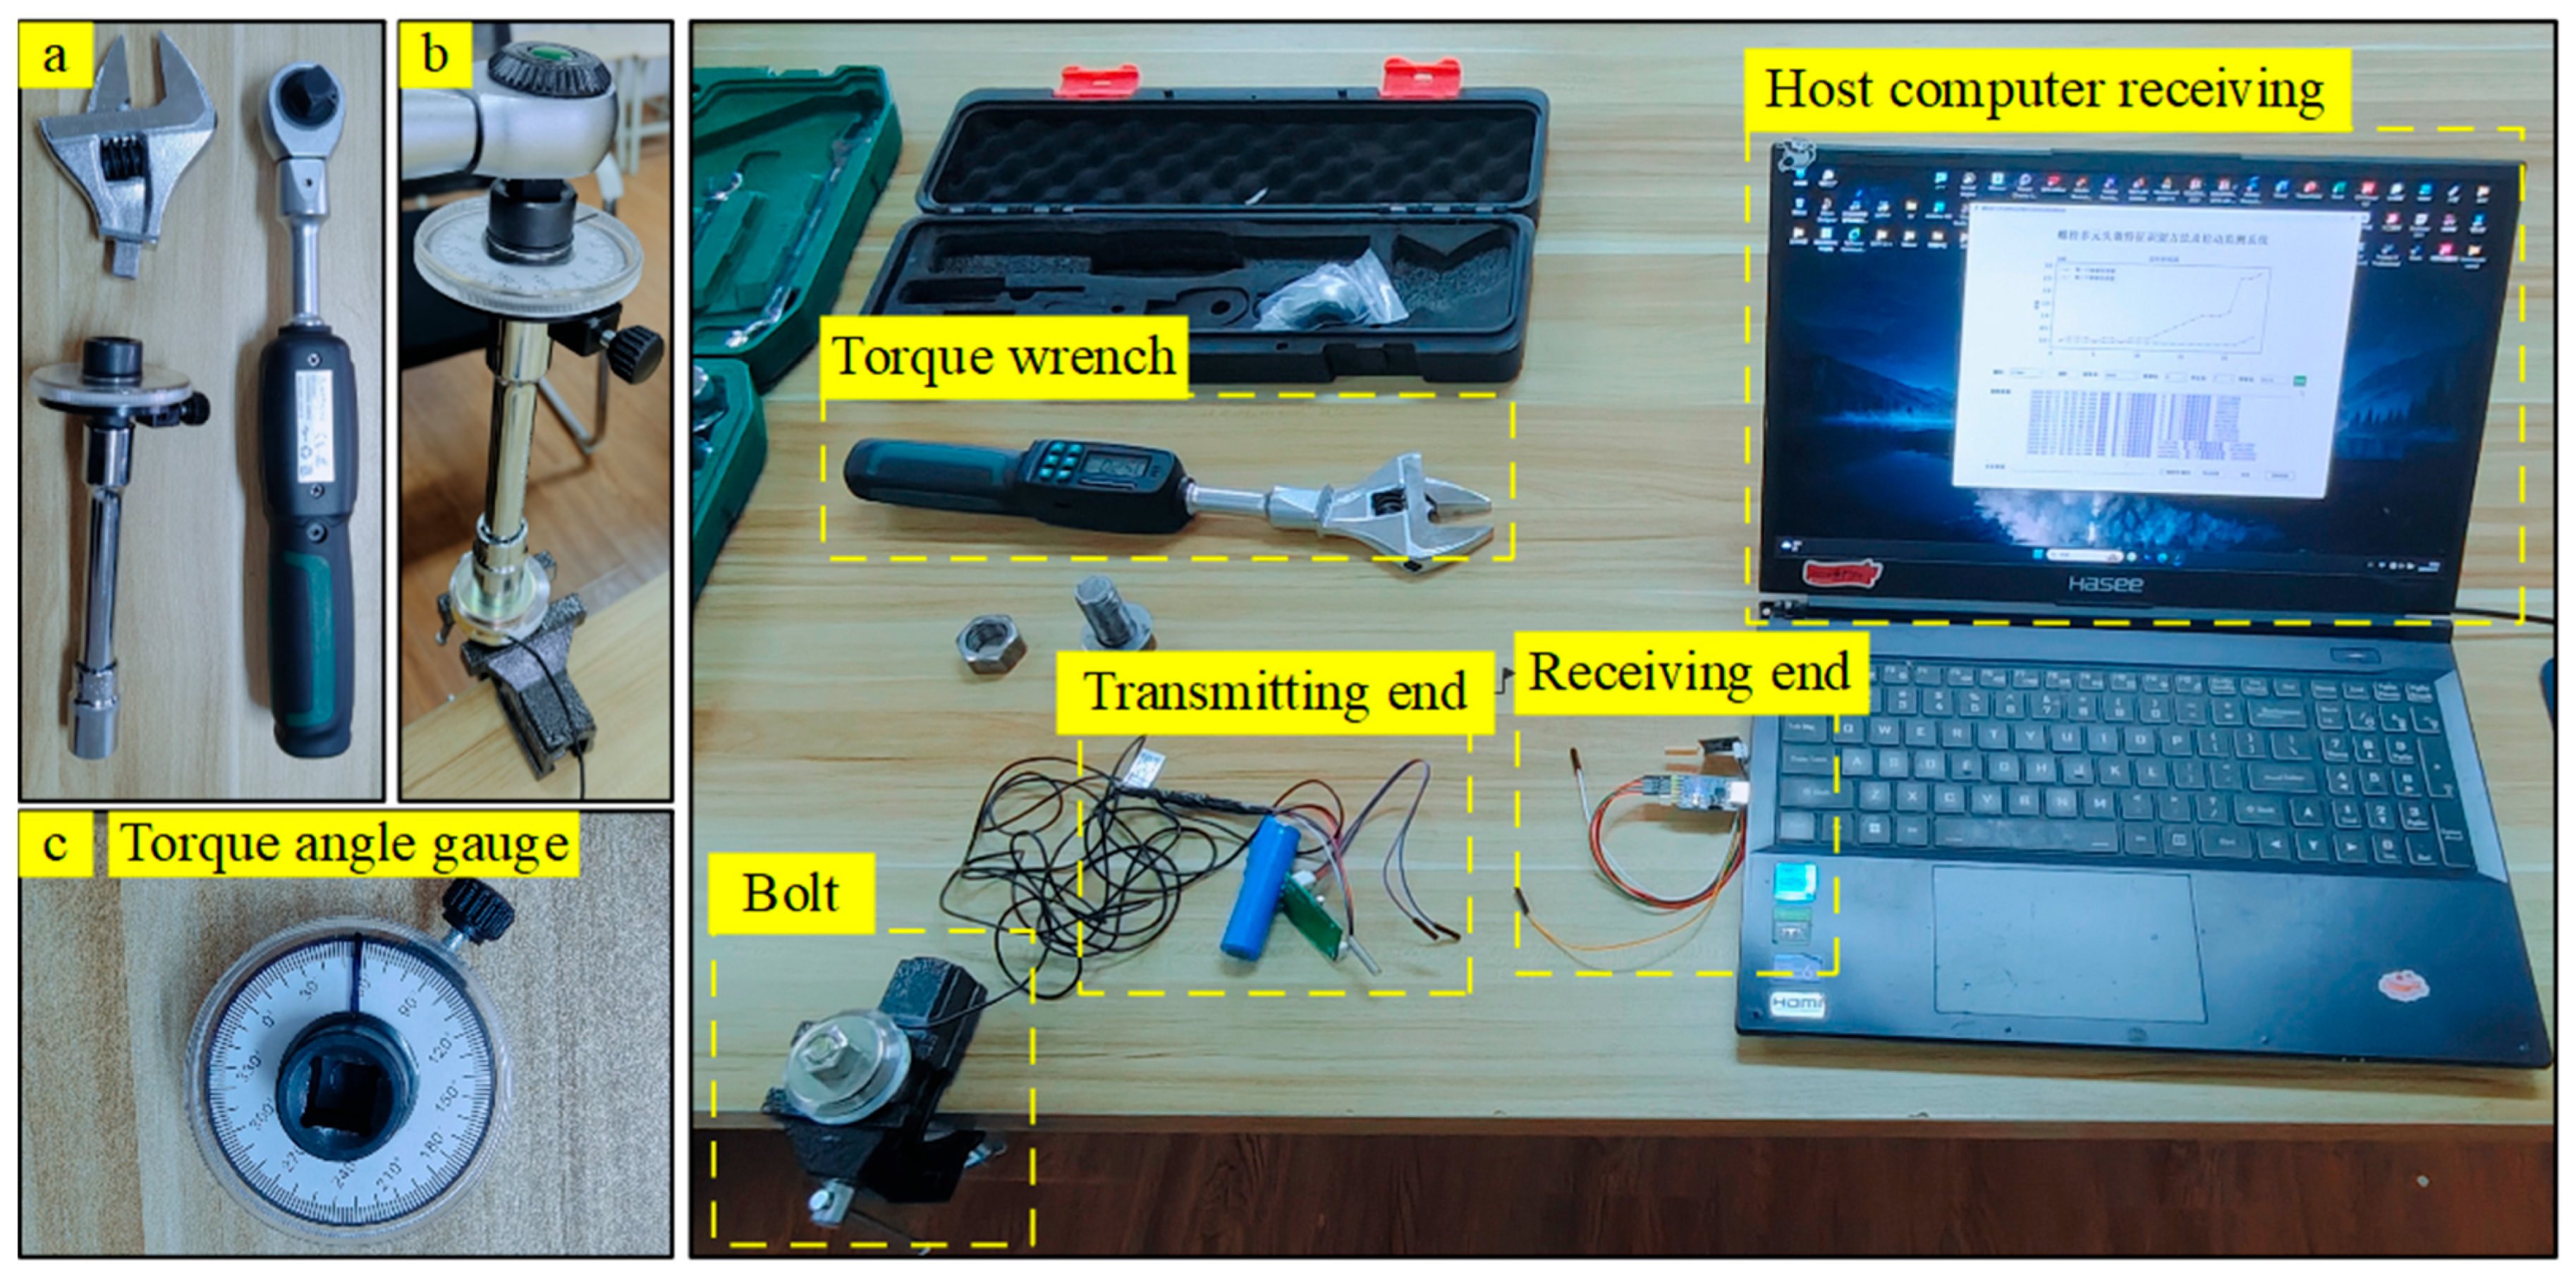
2.4. Design of the Sensor Monitoring and Verification Test of the Wireless Monitoring System

To establish the correlation between sensor output and applied pressure (preload force), calibration of the sensor was performed using a UTM5305 universal testing machine (Shenzhen, Guangdong, China). The detailed specifications of the testing machine are presented below (Table 2):
Given that the majority of the bolt structures on combine harvesters are of size M12, with critical components utilizing M18 bolts, and bolts exceeding M24 are uncommon, the aforementioned testing machine is adequate for calibration purposes. The preload force for M24 bolts generally falls within the range of 80 kN to 150 kN.
As illustrated in Figure 19, the sensor is affixed to the universal testing machine, which is controlled through its associated operating software. To mitigate experimental error, the testing procedure is divided into eight groups: four groups each for pressure loading and displacement loading. The sensor is interfaced with a wireless data acquisition and transmission module, which in turn is connected to a separate computer via a serial-to-USB converter. A purpose-built serial port utility is employed to acquire the analog sensor data. To enhance data accuracy, the serial data transmission frequency is configured to be trigger-based; specifically, data transmission occurs immediately upon completion of the previous transmission (when a change in the analog value is detected), and the current analog value is updated and stored.
Within the control software of the universal testing machine, the loading profile was configured to terminate upon reaching a pressure of 150 kN. Because the sensor is mounted axially along the bolt, the preload force is exerted as a compressive force on the sensor; consequently, a compression testing mode was employed. The experimental procedure is illustrated in Figure 20 and Figure 21. Subsequently, the data were exported. By performing a curve fitting of the pressure and analog output data within a common time domain, a correlation between the sensor’s analog output and the applied pressure and displacement can be determined.

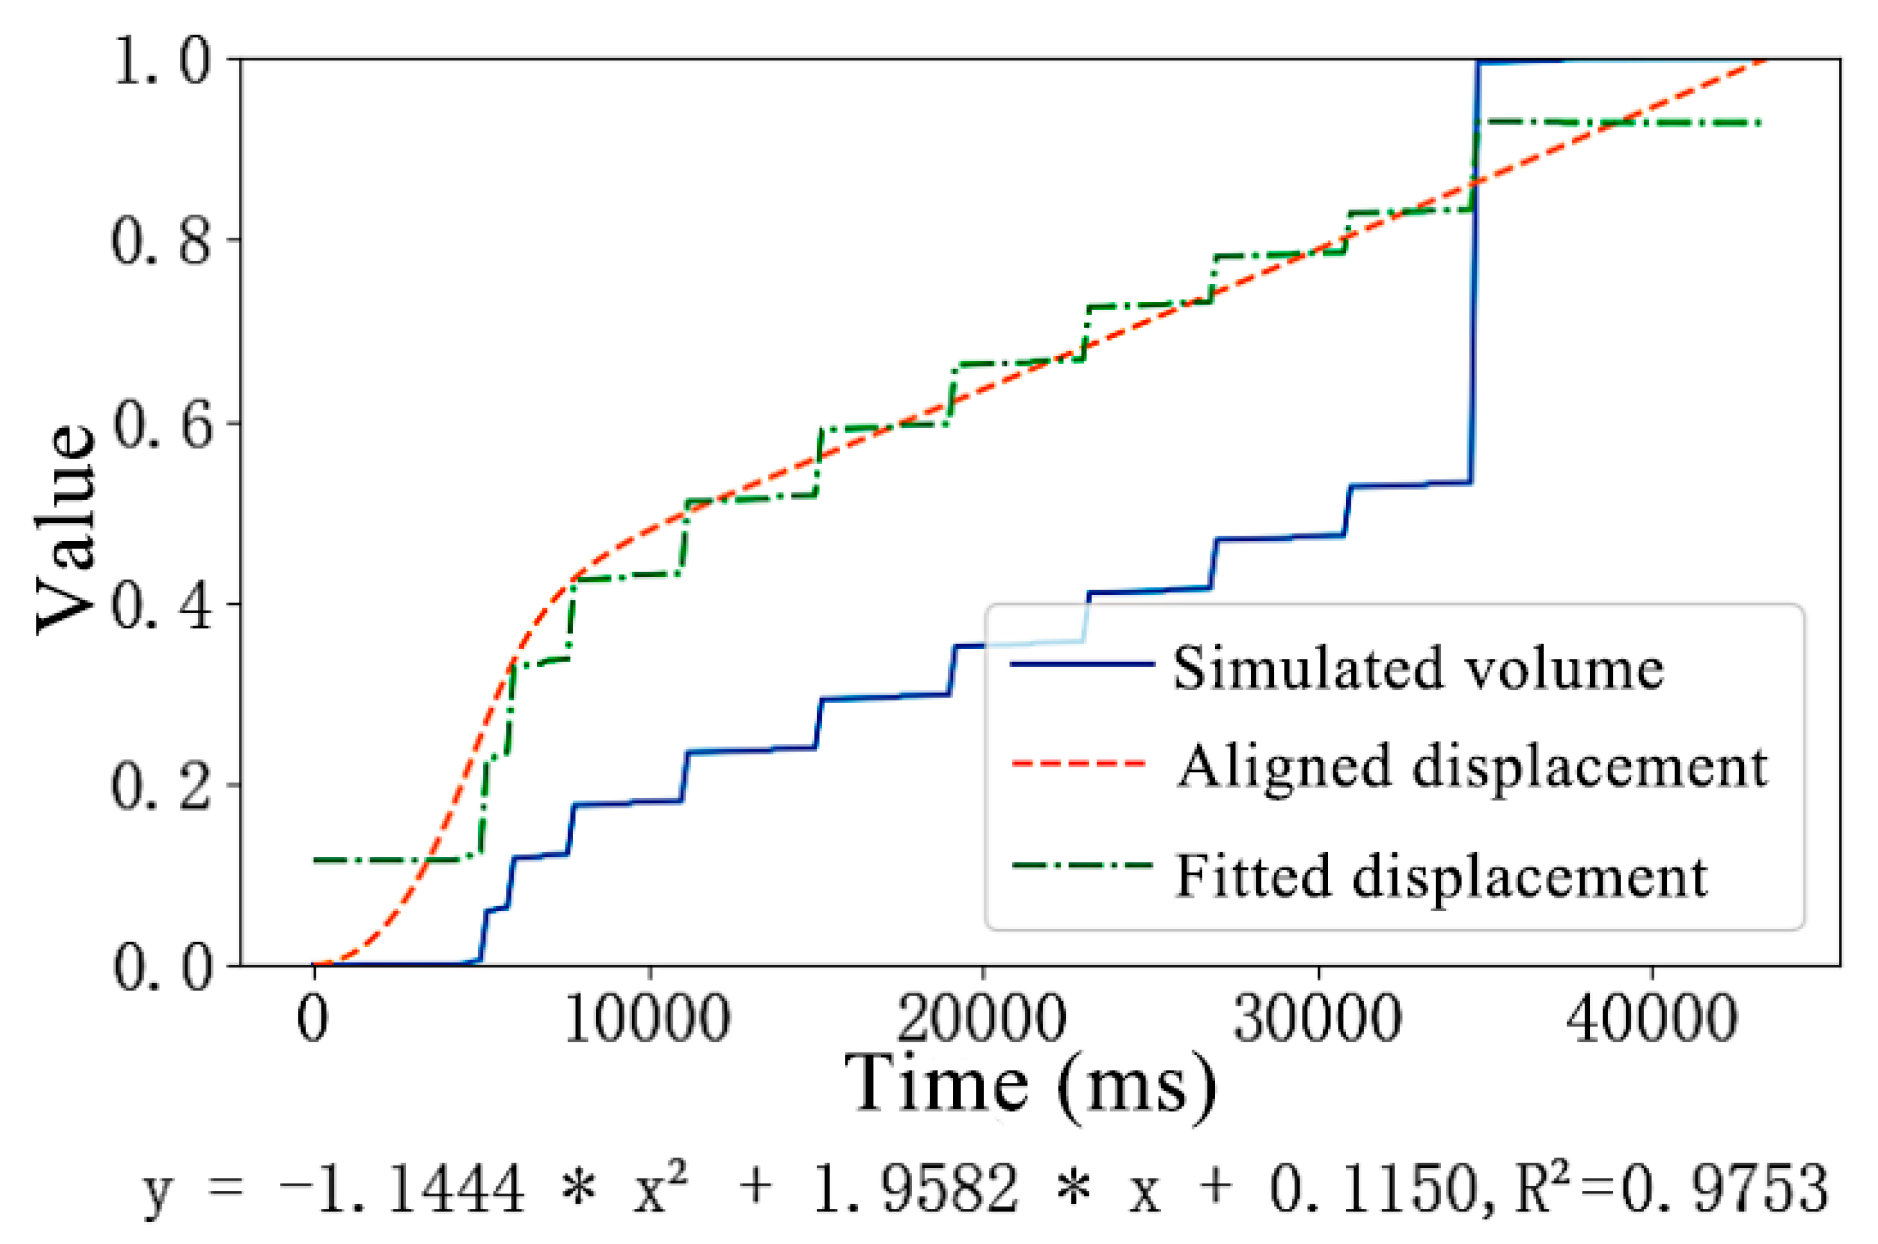
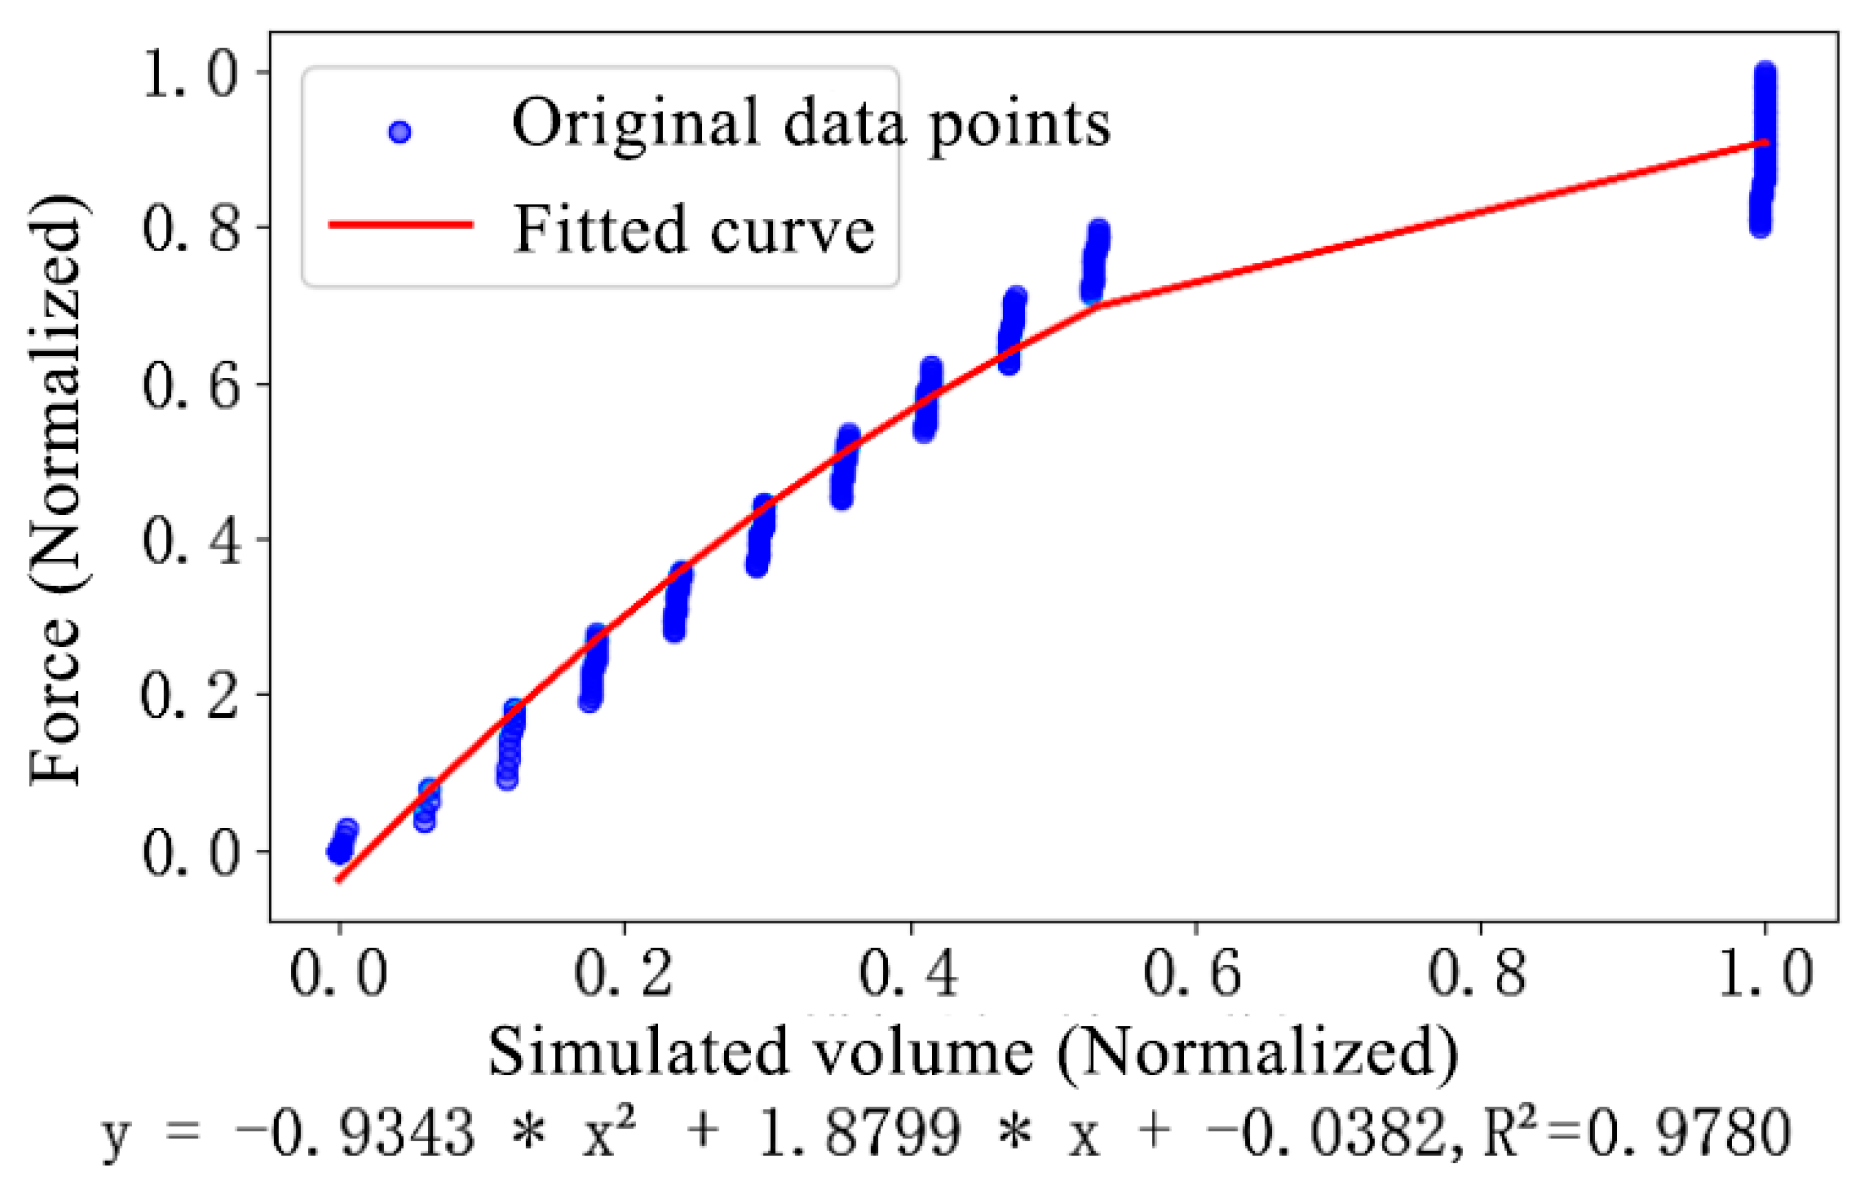
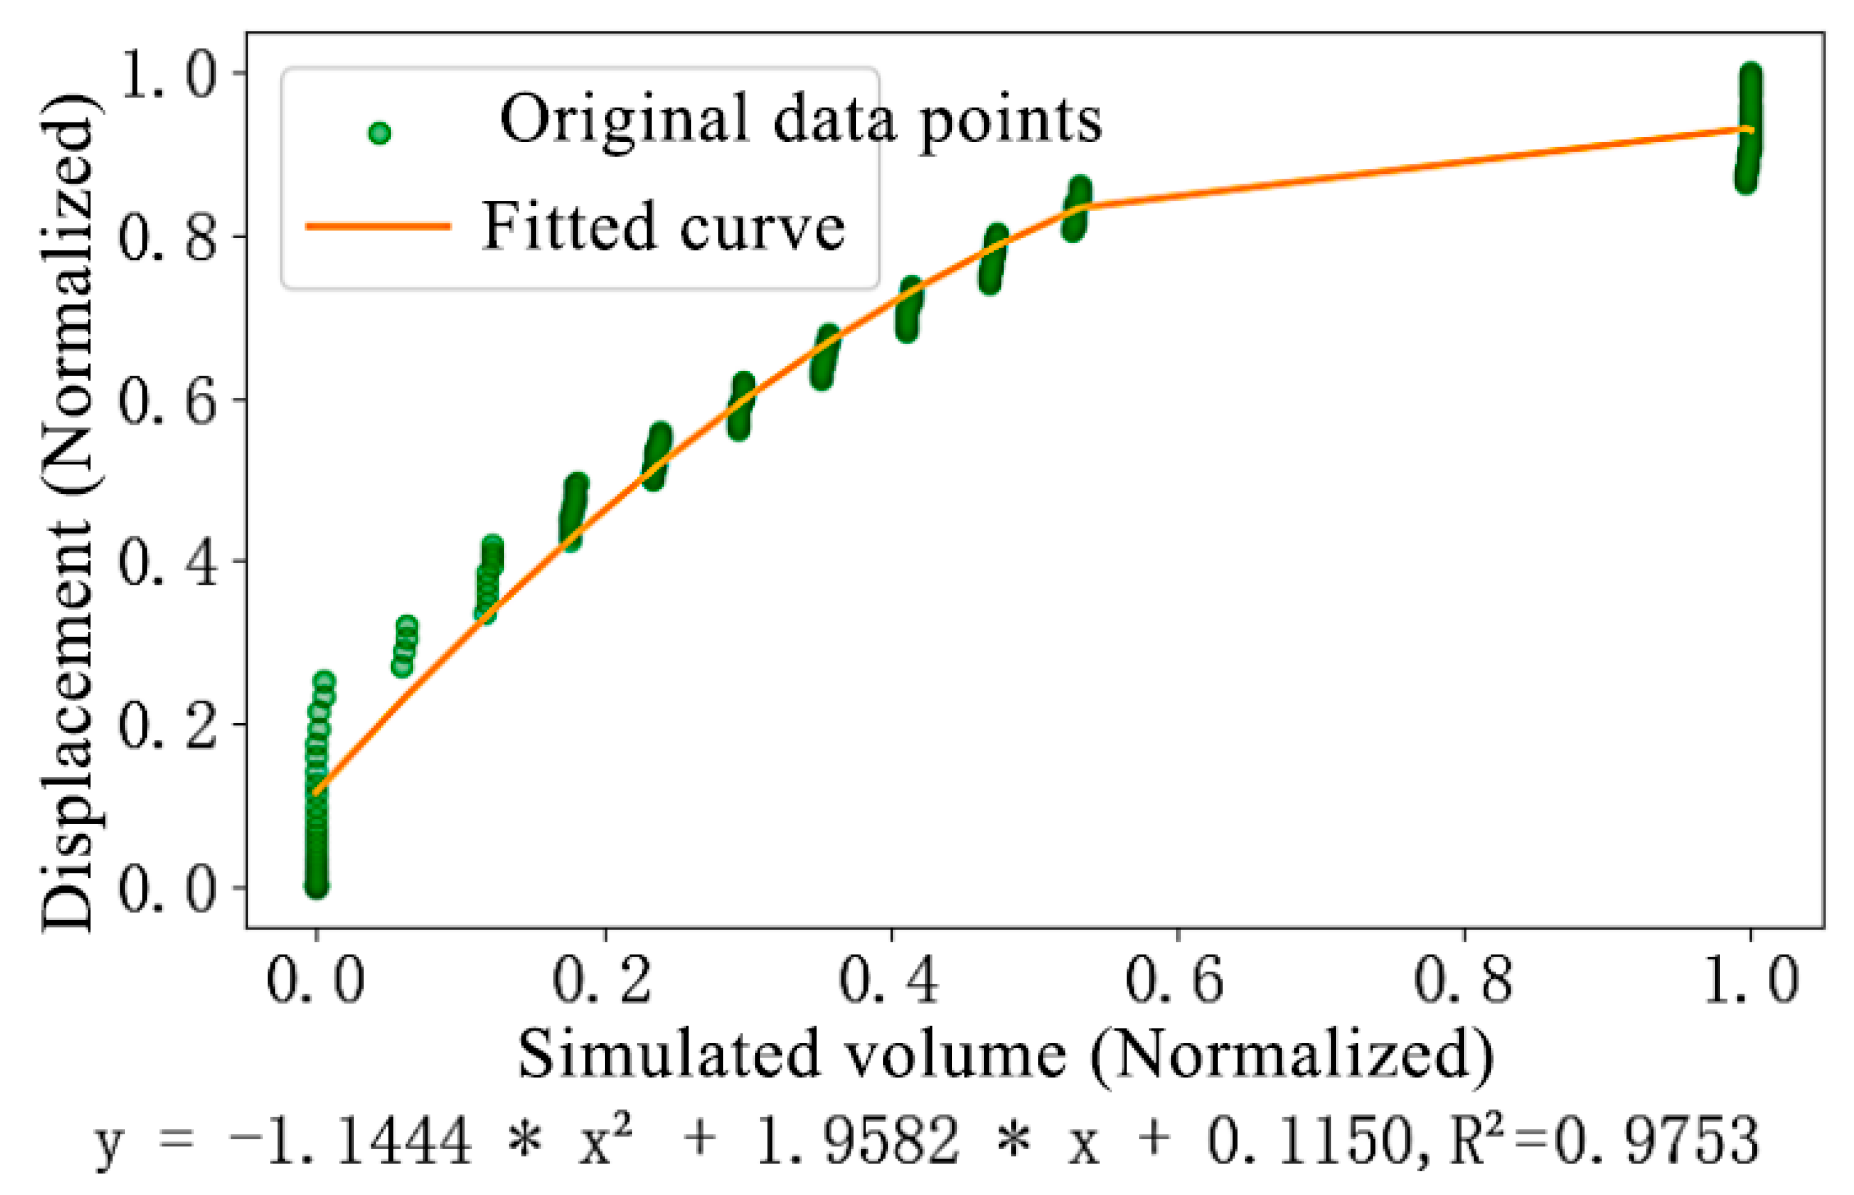
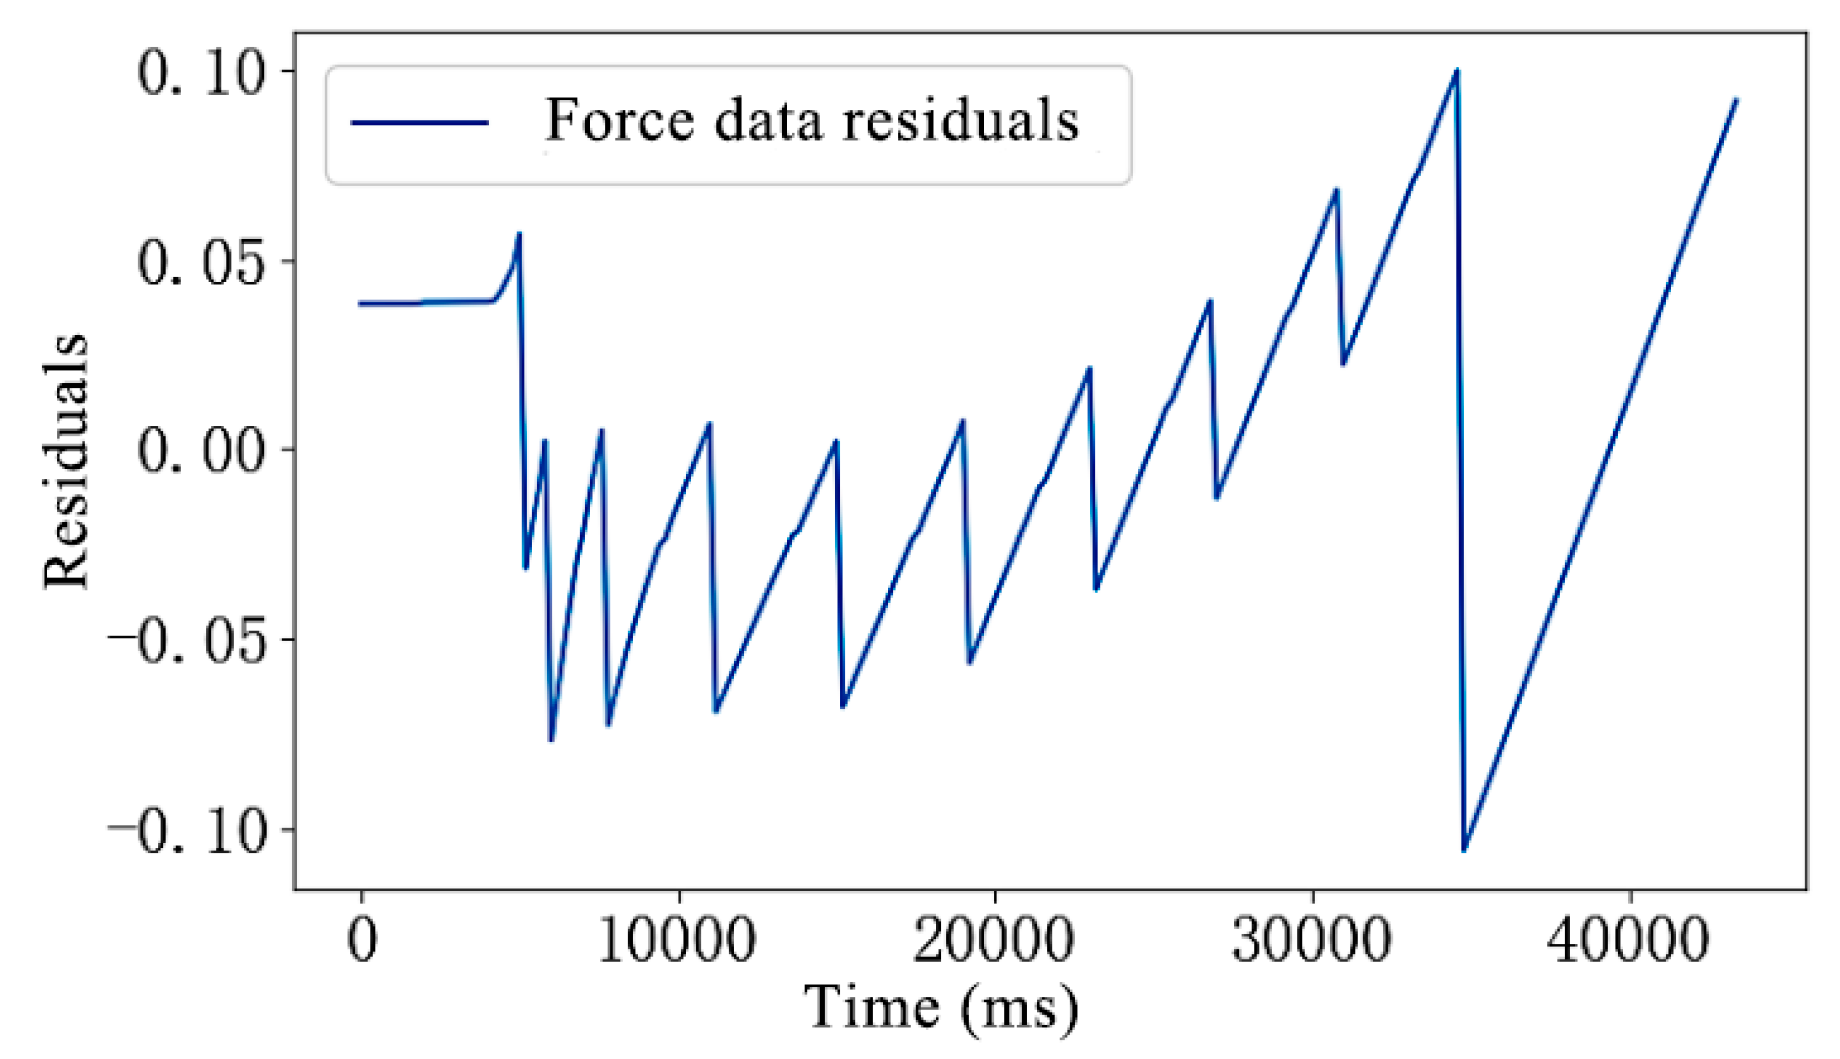
2.5. Data Fitting Method for Sensors in a Conveyor Trough Bolt Structure System

To avoid discrepancies due to the different dimensions of the analog output, pressure, and displacement and to allow data with different units to be processed and compared on the same scale, the data are normalized. Normalization also makes the data more suitable for alignment and fitting, avoiding the influence of dimensional differences on the results. The normalization formula is as follows:
X normalized i = X i X min X max X min
To enhance data smoothness and mitigate the influence of noise on subsequent analysis, a local averaging technique can be employed to reduce noise within the data. The resulting smoothed data is better suited for DTW alignment and curve fitting, thereby increasing the precision of the analysis. The method is as follows:
X smoothed i = 1 ω j = i k i + k X i
where ω is the window size, set to ω = 5 , and k is the data radius within the window, k = ω 1 2 .
Because of discrepancies between the time series of the acquired analog output and the time series of the applied pressure, dynamic time warping (DTW) is employed to align the “time-analog output” and “time-pressure” data. Following alignment, linear or non-linear regression techniques (e.g., support vector regression (SVR)) are utilized to model the relationship between the analog output and pressure. Dynamic time warping (DTW) is an algorithm used to quantify and align the similarity between two time series, even if their temporal axes are not synchronized. DTW achieves optimal temporal alignment by permitting elastic stretching and compression of the time axis. Given two time series, X = ( x 1 ,   x 2 , x n - 1 ,   x n ) and Y = ( y 1 ,   y 2 , y n - 1 ,   y n ) , the central principle of the DTW algorithm involves computing a distance matrix D ( i ,   j ) , which represents the minimum accumulated distance from x i to y i . The recursive formula is defined as follows:
D ( i ,   j ) = dist   ( x i ,   y i ) + min   ( D ( i - 1 ,   j ) ,   D ( i ,   j - 1 ) )
In the formula, dist   ( x i ,   y i ) is the distance between x i and y i (typically the Euclidean distance):
dist   ( x i ,   y i ) = x i ,   y i
The above boundary conditions are as follows:
D ( 0 , 0 ) = 0
The calculations of the first row and the first column are as follows:
D ( i ,   0 ) = k = 1 i dist   ( x k ,   y 0 )
D   ( 0 ,   j ) = k = 1 i dist   ( x 0 ,   y k )
Following DTW alignment, the length of the target sequence may not be equal to the length of the reference sequence. To align the target sequence to the temporal points of the reference sequence, thus ensuring equal lengths for both sequences, interpolation is necessary.
y aligned [ i ] = y round ( ( N 1 ) i M 1 )
In the equation, N is the length of the target sequence, M is the length of the reference sequence, y is the target sequence, and the round ( x ) function rounds the input value x to the nearest integer.
The aforementioned data alignment addresses the issues of differing time series lengths or temporal shifts, ensuring comparability on a common time axis. Subsequently, a model is constructed to model the relationship between the “analog output” and “pressure.” The linear regression model is expressed as follows:
y = β 0 + β 1 x + ε
In the equation, y is the pressure value, x is the analog output value, β 0 is the intercept, β 1 is the slope, which represents the relationship between the analog output and the pressure, and ε is the error term. The general form of a quadratic polynomial model is as follows:
y = β 0 + β 1 x + β 2 x 2 + ε
In the equation, y is the pressure value, x is the analog output value, β 0 is the intercept, β 1 is the coefficient of the linear term, β 2 is the coefficient of the quadratic term, which represents the relationship between the analog output and pressure, and ε represents the error term.
Subsequently, by employing ordinary least squares (OLS), the optimal values for the coefficients β 0 , β 1 , and β 2 in both the linear regression model and the quadratic polynomial model can be determined through the minimization of the sum of squared errors:
min β 0 ,   β 1 = i = 1 n y [ i ] β 0 + β 1 x [ i ] 2
min β 0 ,   β 1 ,   β 2 = i = 1 n y [ i ] β 0 + β 1 x [ i ] + β 2 x [ i ] 2 2
y [ i ] is β 0 + β 1 x [ i ] + β 2 x [ i ] 2 , which represents the predicted value. A common approach to validate the goodness of fit of the model is to employ evaluation metrics to quantify the model’s accuracy. The coefficient of determination (R2) and the mean squared error (MSE) are frequently utilized metrics:
R 2 = 1 ( y i y ) 2 ( y i y ) 2
M S E = 1 n ( y i y ) 2

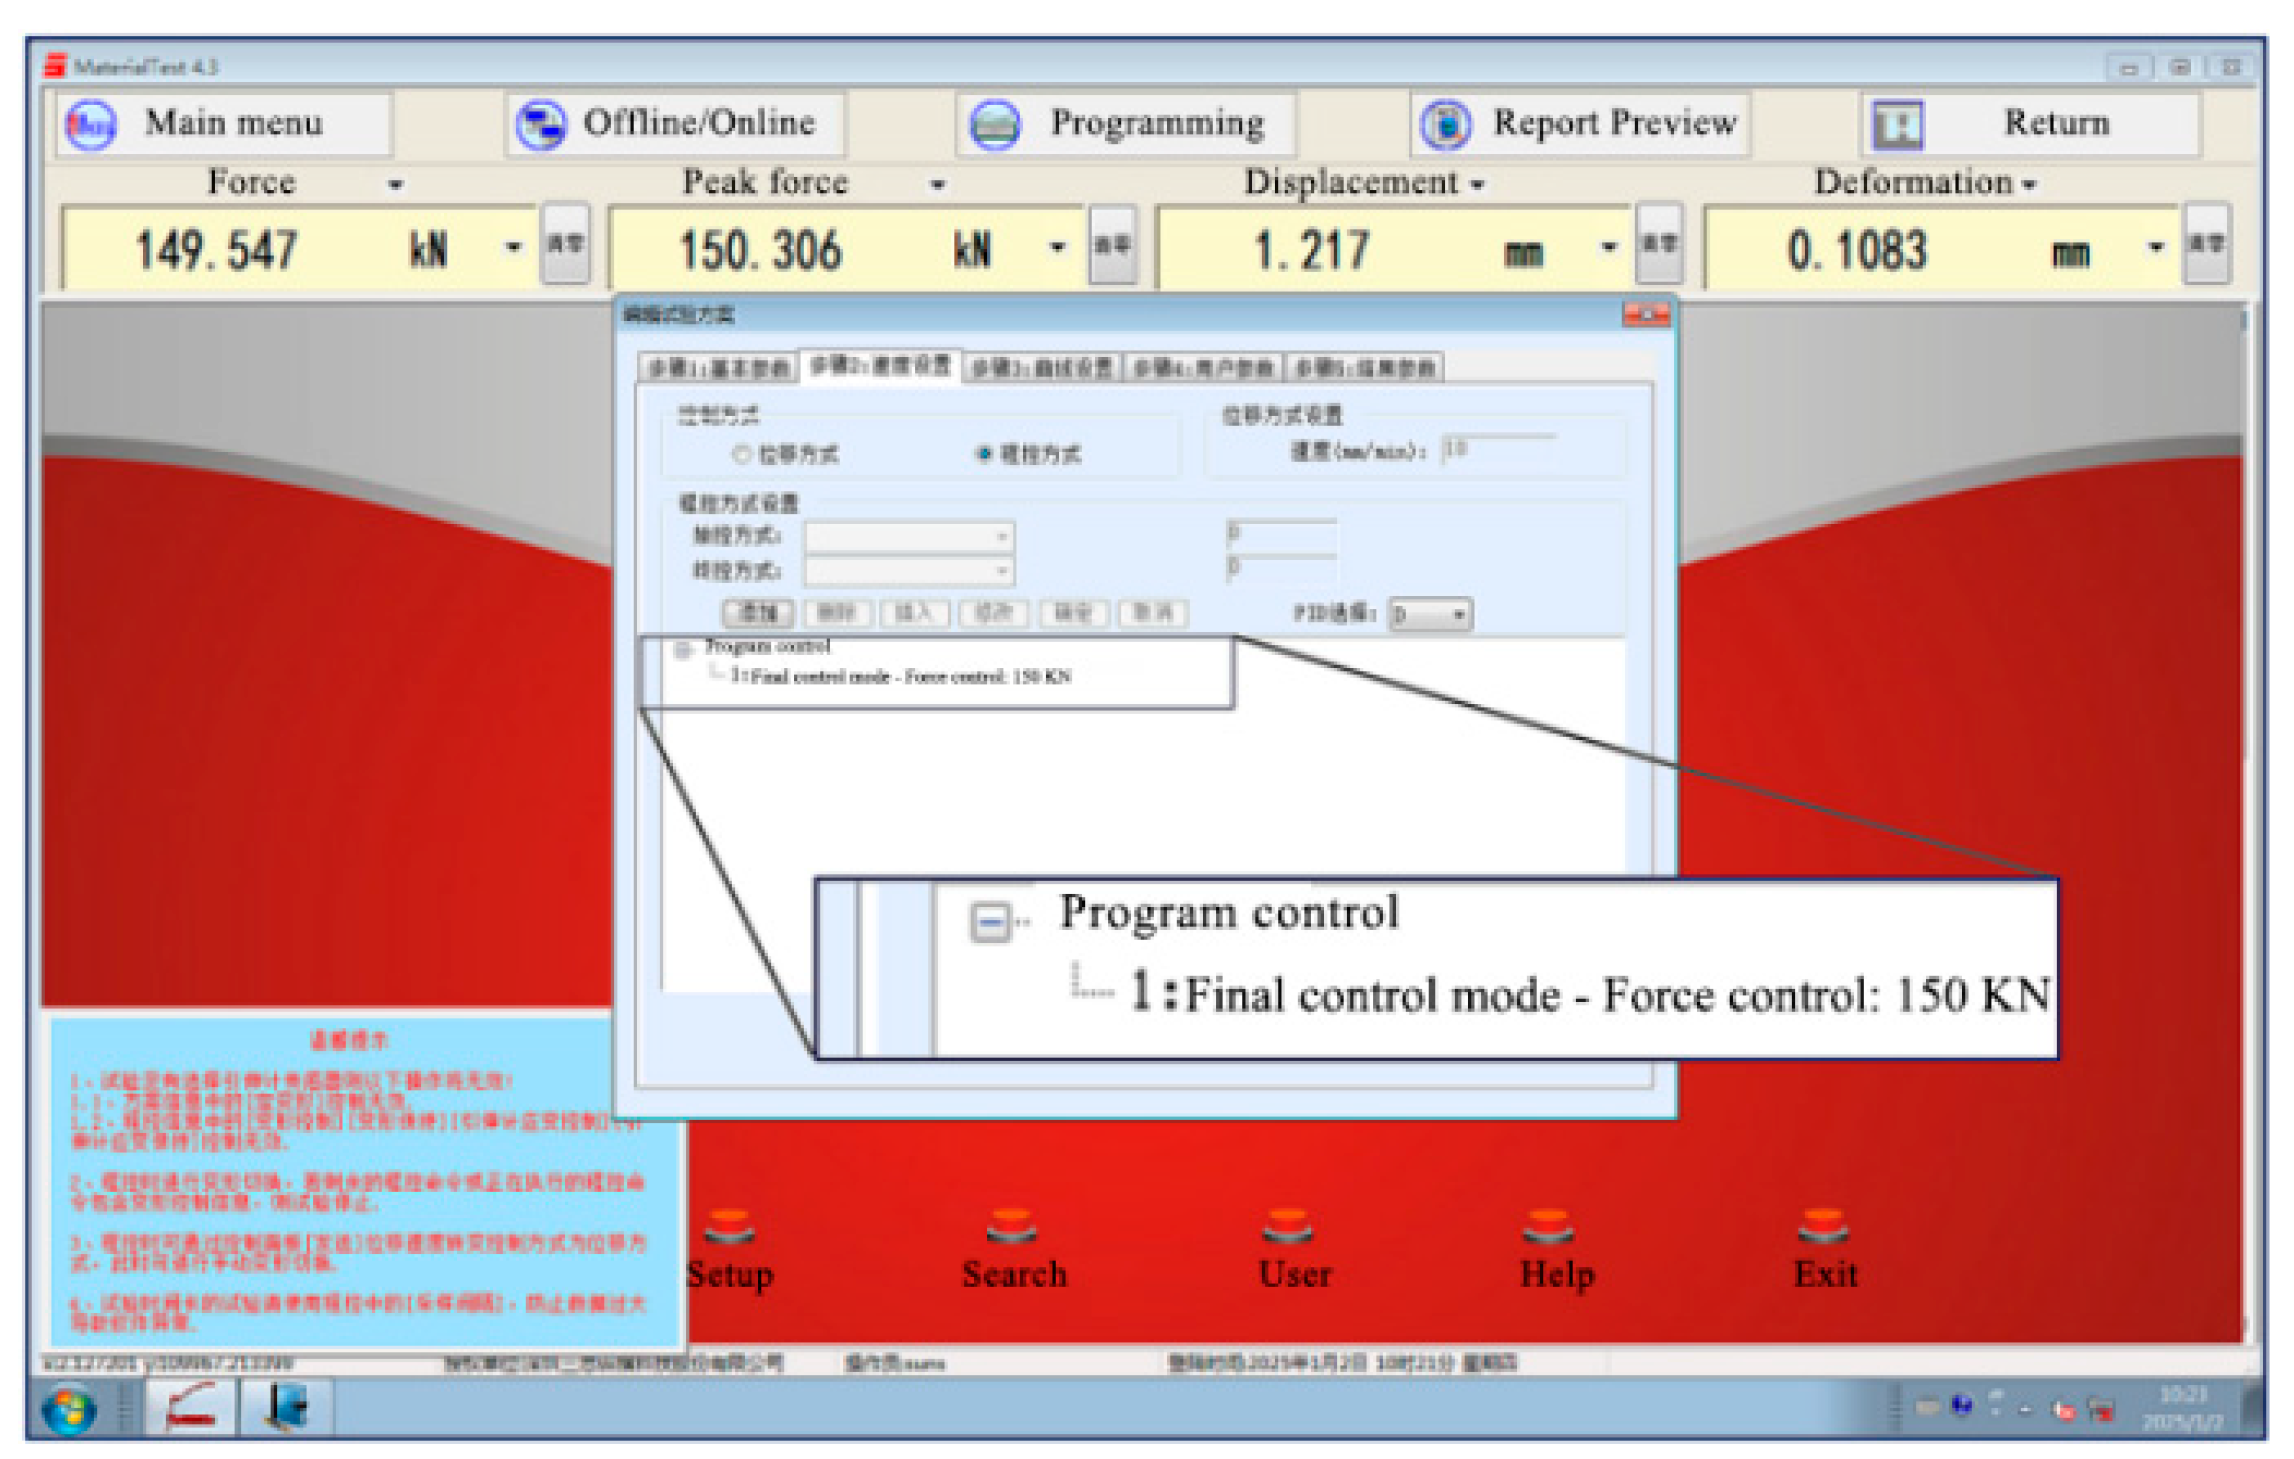
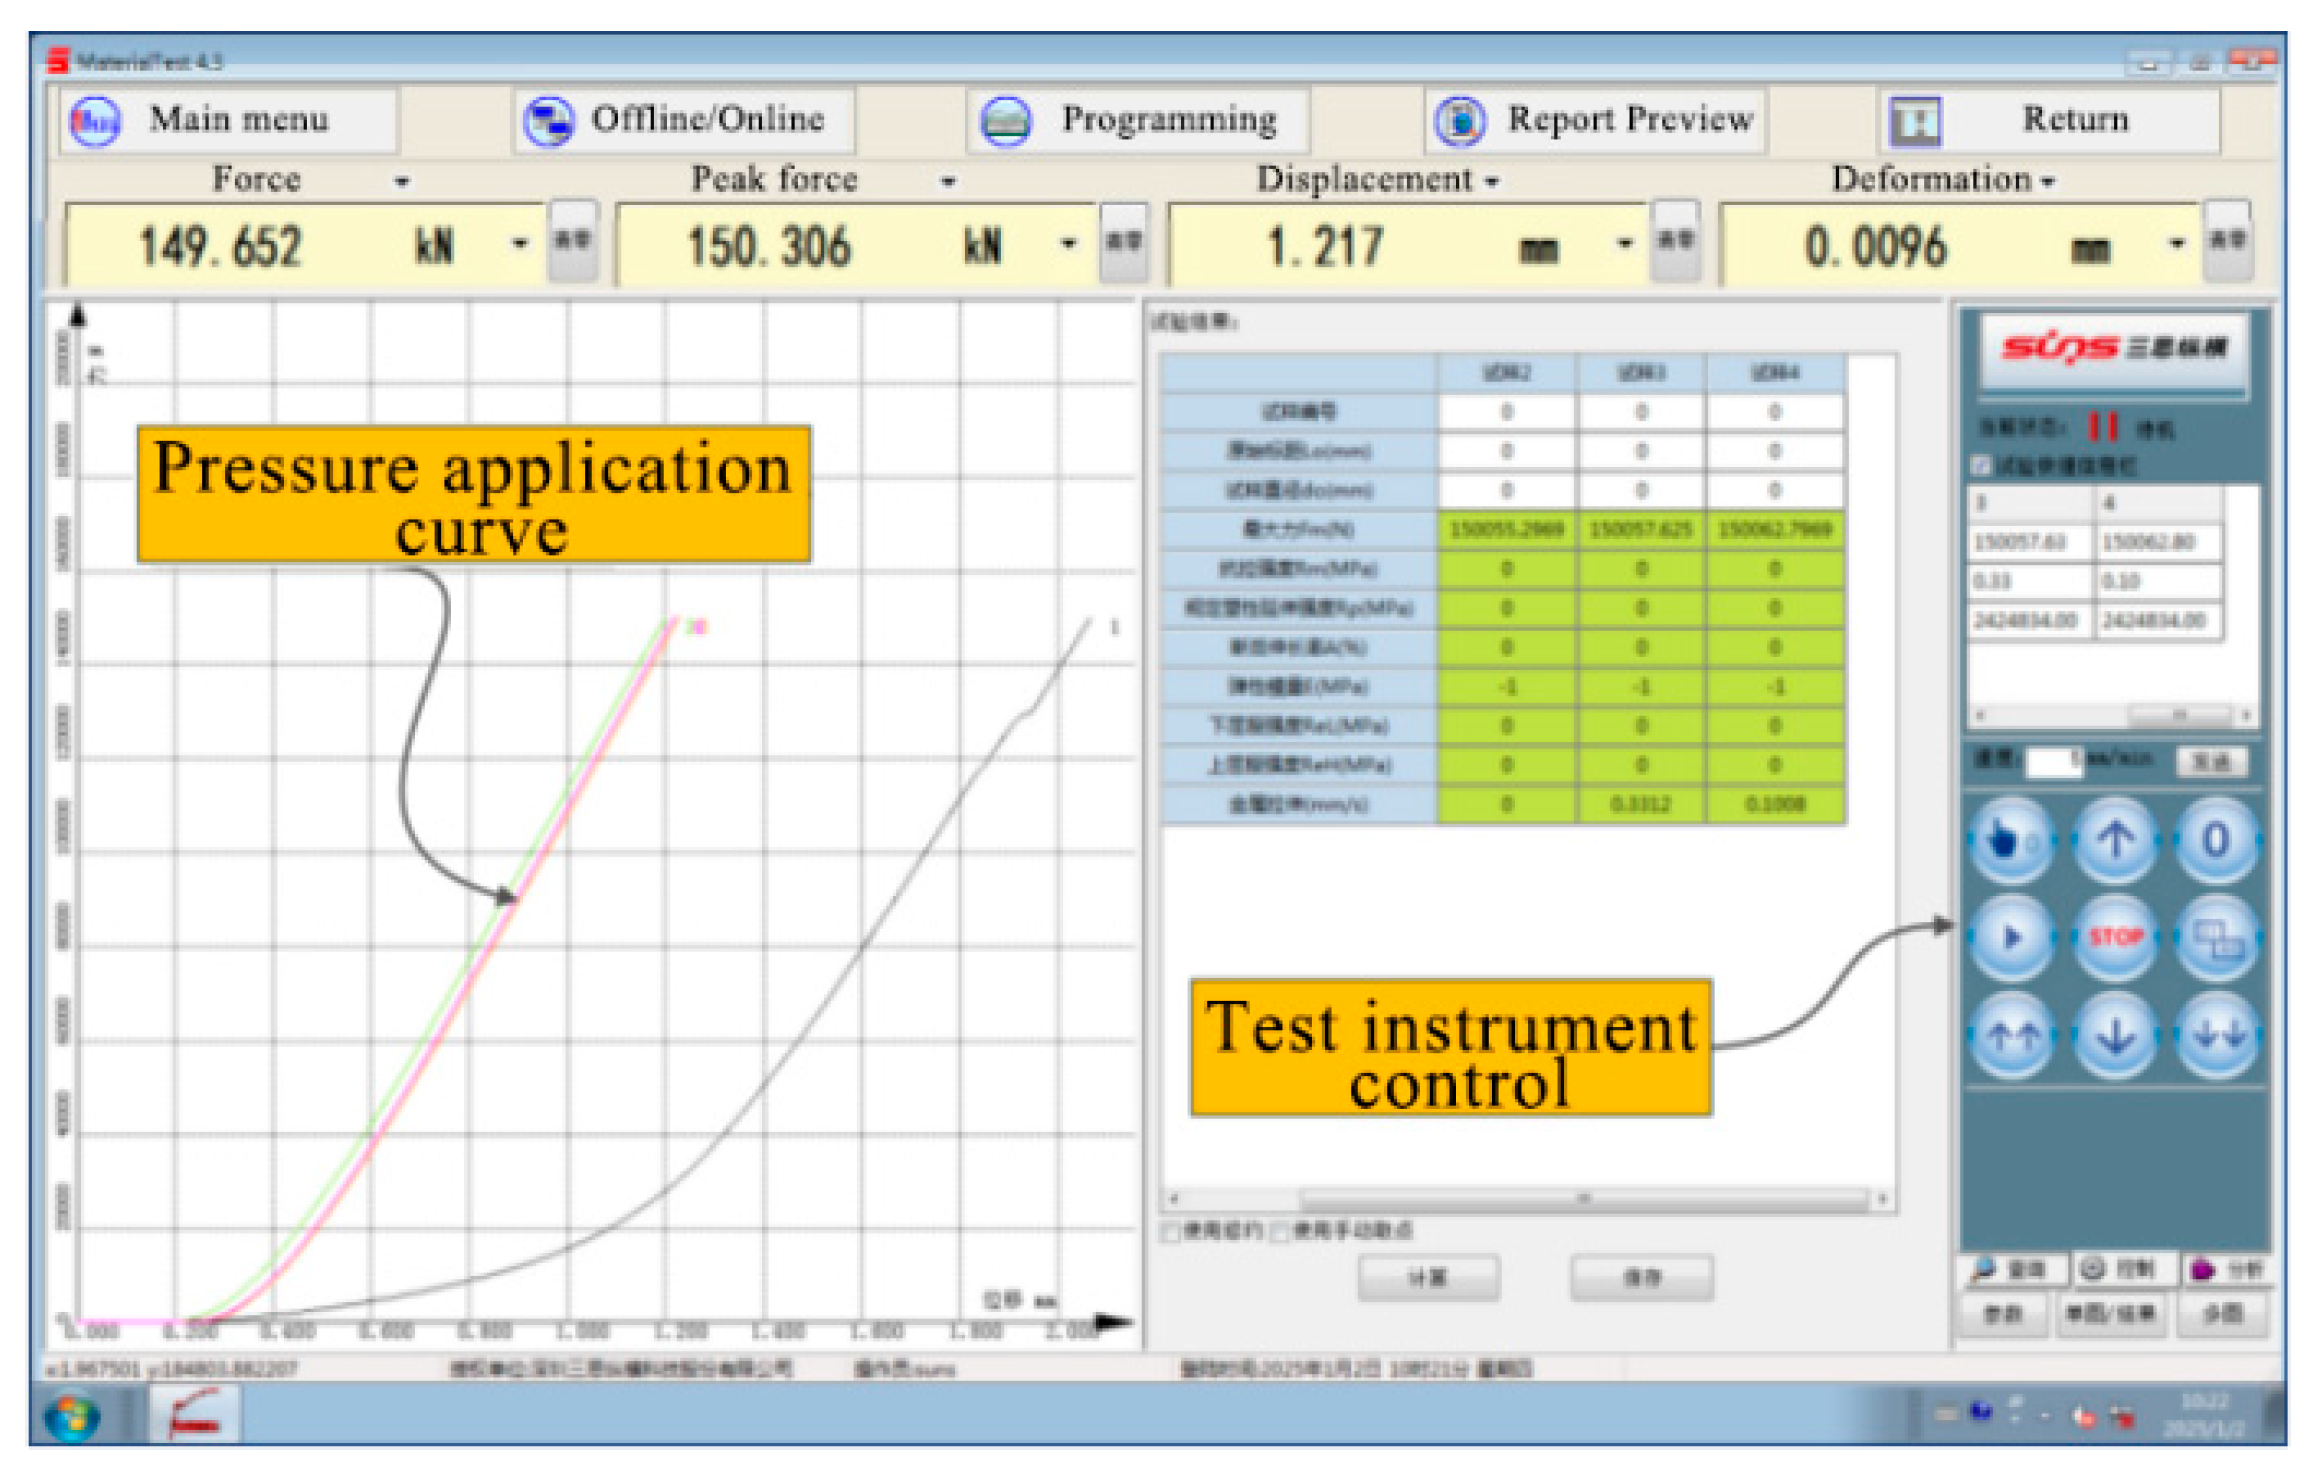
2.6. Sensor Loosening Test Experiment for the Conveyor Trough Bolt Structure System

To establish the correlation between bolt loosening angle, preload force, and sensor measurements, a test experiment was performed to evaluate the sensor’s analog output under varying states of bolt looseness. The bolt was secured within a bench vise. A torque wrench, used in combination with a torque angle gauge, was employed to tighten the bolt, thereby capturing the range of the sensor’s analog output from a loosened to a fully tightened condition. Parameters such as torque wrench readings, nut rotation angles, and other relevant data were recorded. The experimental setup is illustrated in Figure 22. The receiver was interfaced with the host computer software on a laptop, with the sensor transmitting data to the receiver via the transmitter. Throughout the test procedure, the torque wrench was connected to the bolt structure via the torque angle gauge, and the torque wrench recorded torque data in real time.
The torque wrench employed was a high-precision digital WT9-85 model manufactured by Wite in Shanghai, China. Its torque range is 8.5 to 85 N m , with a resolution of 0.01 and an accuracy of ±3% in the clockwise direction and ±4% in the counterclockwise direction. It offers bidirectional operation, peak hold functionality, four-unit conversion ( N m , ft lb , in lb , kgf cm ), and storage capacity for 50 data sets. Additionally, it incorporates a buzzer and LED alarm system. Detailed performance parameters are presented in Table 3.
Grade 8.8 M12 bolts possess a yield strength of 640 MPa and an effective stress area of 84.3 mm 2 . The preload force is typically specified as 70–80% of the yield strength. As per the General rules of tightening for threaded fasteners (GB/T 16823.2-1997 [52]), the standard range for the tightening factor K is 0.10–0.30, although a value between 0.15 and 0.25 is commonly adopted. In agricultural machinery applications, a K value of 0.2 is frequently used:
F = 0.7 × 640 × 84.3 37700 N
F = 0.8 × 640 × 84.3 43100 N
For grade 8.8 M12 bolts, taking into account the practical operating conditions of agricultural machinery, the typical tightening force range of 37,700–43,100 N is regarded as the normal tightening zone. In the previously established relationship between analog output and preload force, the corresponding calculated range for the analog output is 3.129 × 10¹² to 3.570 × 10¹². Values below this range may be interpreted as indicating an abnormal bolt loosening condition. The tightening torque for the bolt assembly can be calculated using the following equation:
T = F d 2 ( P π d + μ s sec α + μ ω r ω )
where T is the tightening torque, N m ; F is the preload force, N ; d is the nominal bolt diameter, which for M12 bolts is 12 mm; P is the thread pitch, which for M12 bolts is 1.75 mm; μ s is the thread friction coefficient, typically 0.2; α is the half-angle of the thread, typically 30°; μ ω is the friction coefficient between the nut and the workpiece, set to 0.15; and r ω is the contact radius between the nut and the workpiece, set to 1.5 d . The rotation angle formula of the bolt structure is as follows:
θ = F P k
In the equation, θ is the tightening angle, °. F is the preload force, N. P is the thread pitch, which for M12 bolts is 1.75 mm . k is the bolt stiffness, set to 1.5 × 10⁸  N / m . Based on the preceding equations and parameters, the calculated tightening torque range for the bolt assembly under normal operating conditions and specified preload is 68.7 N m to 78.6. The corresponding tightening angle range is 25.2° to 28.6°.

3. Results and Discussion

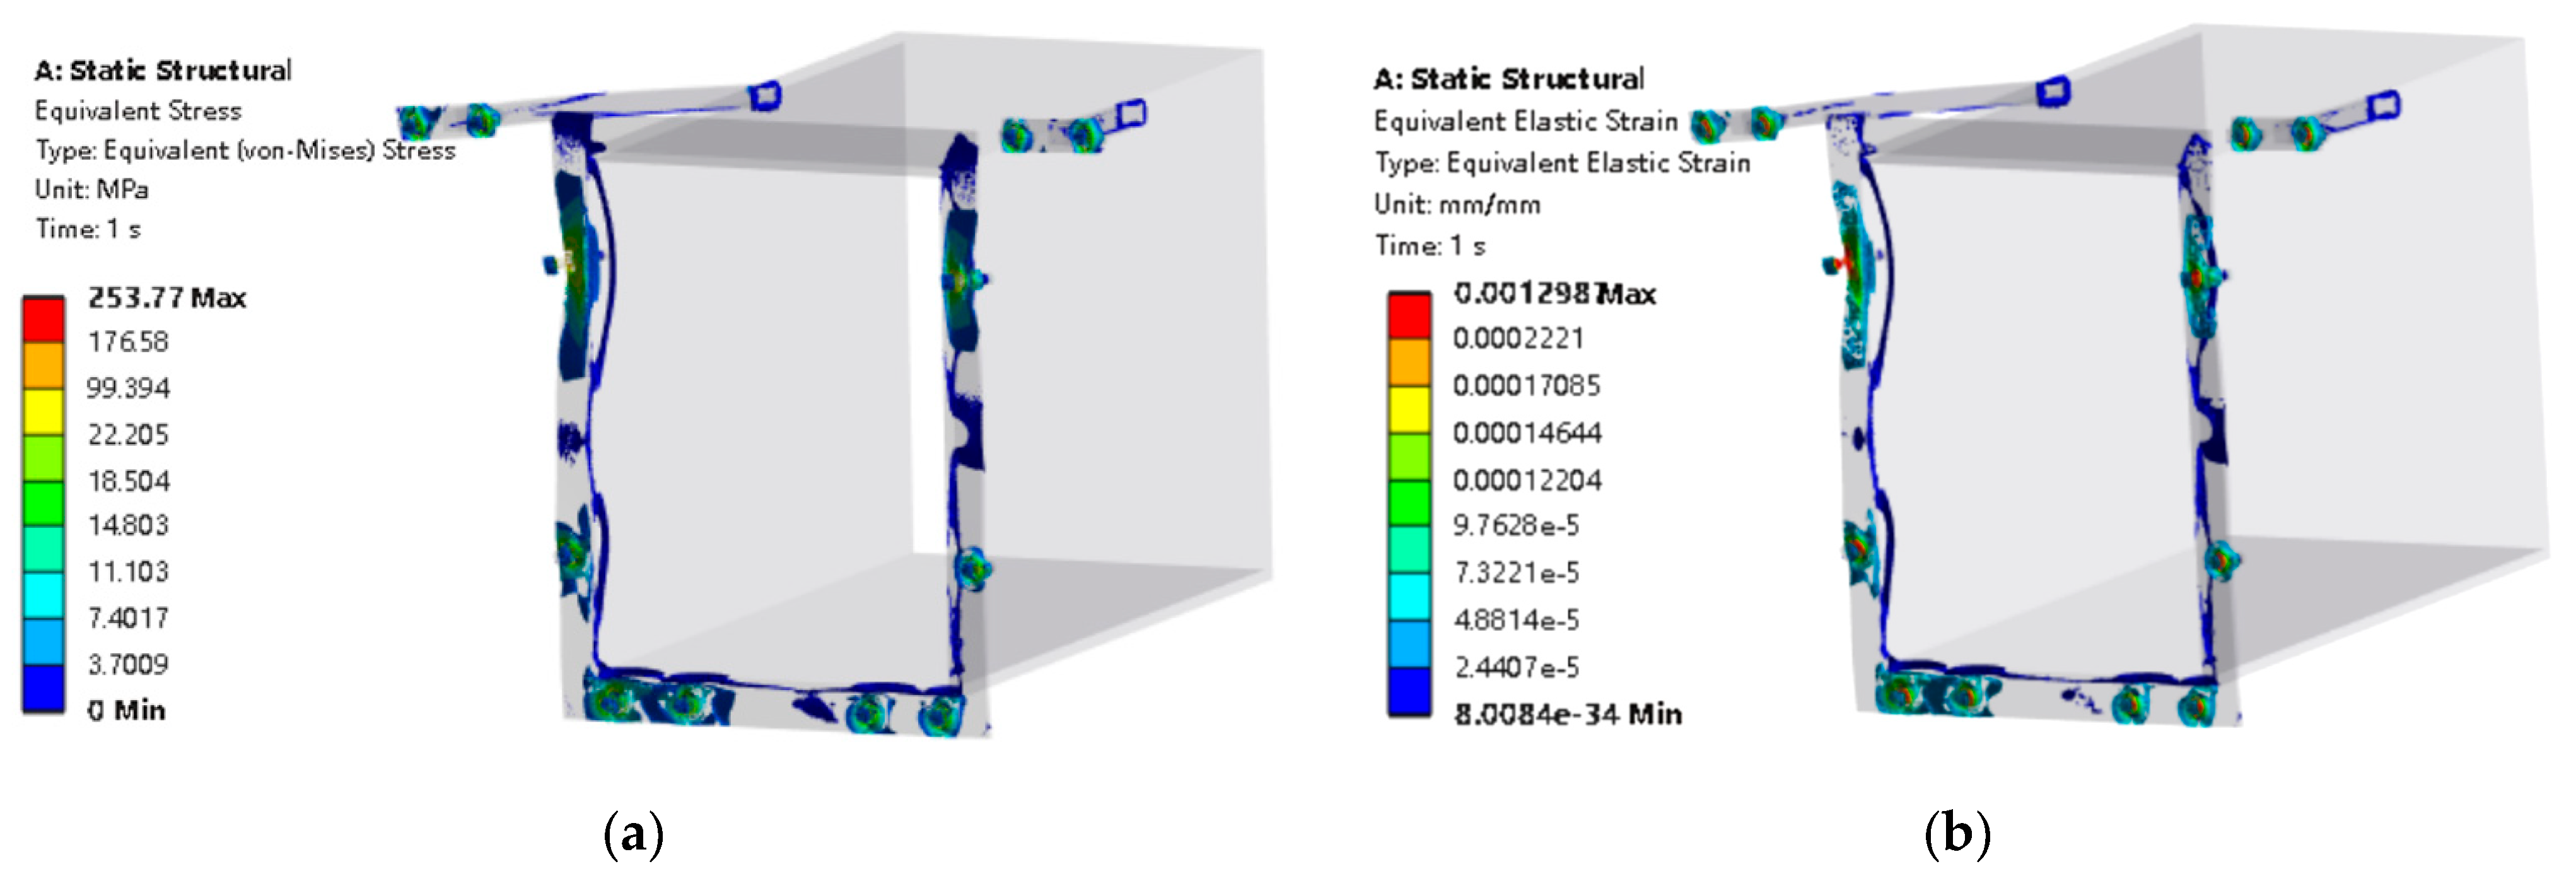
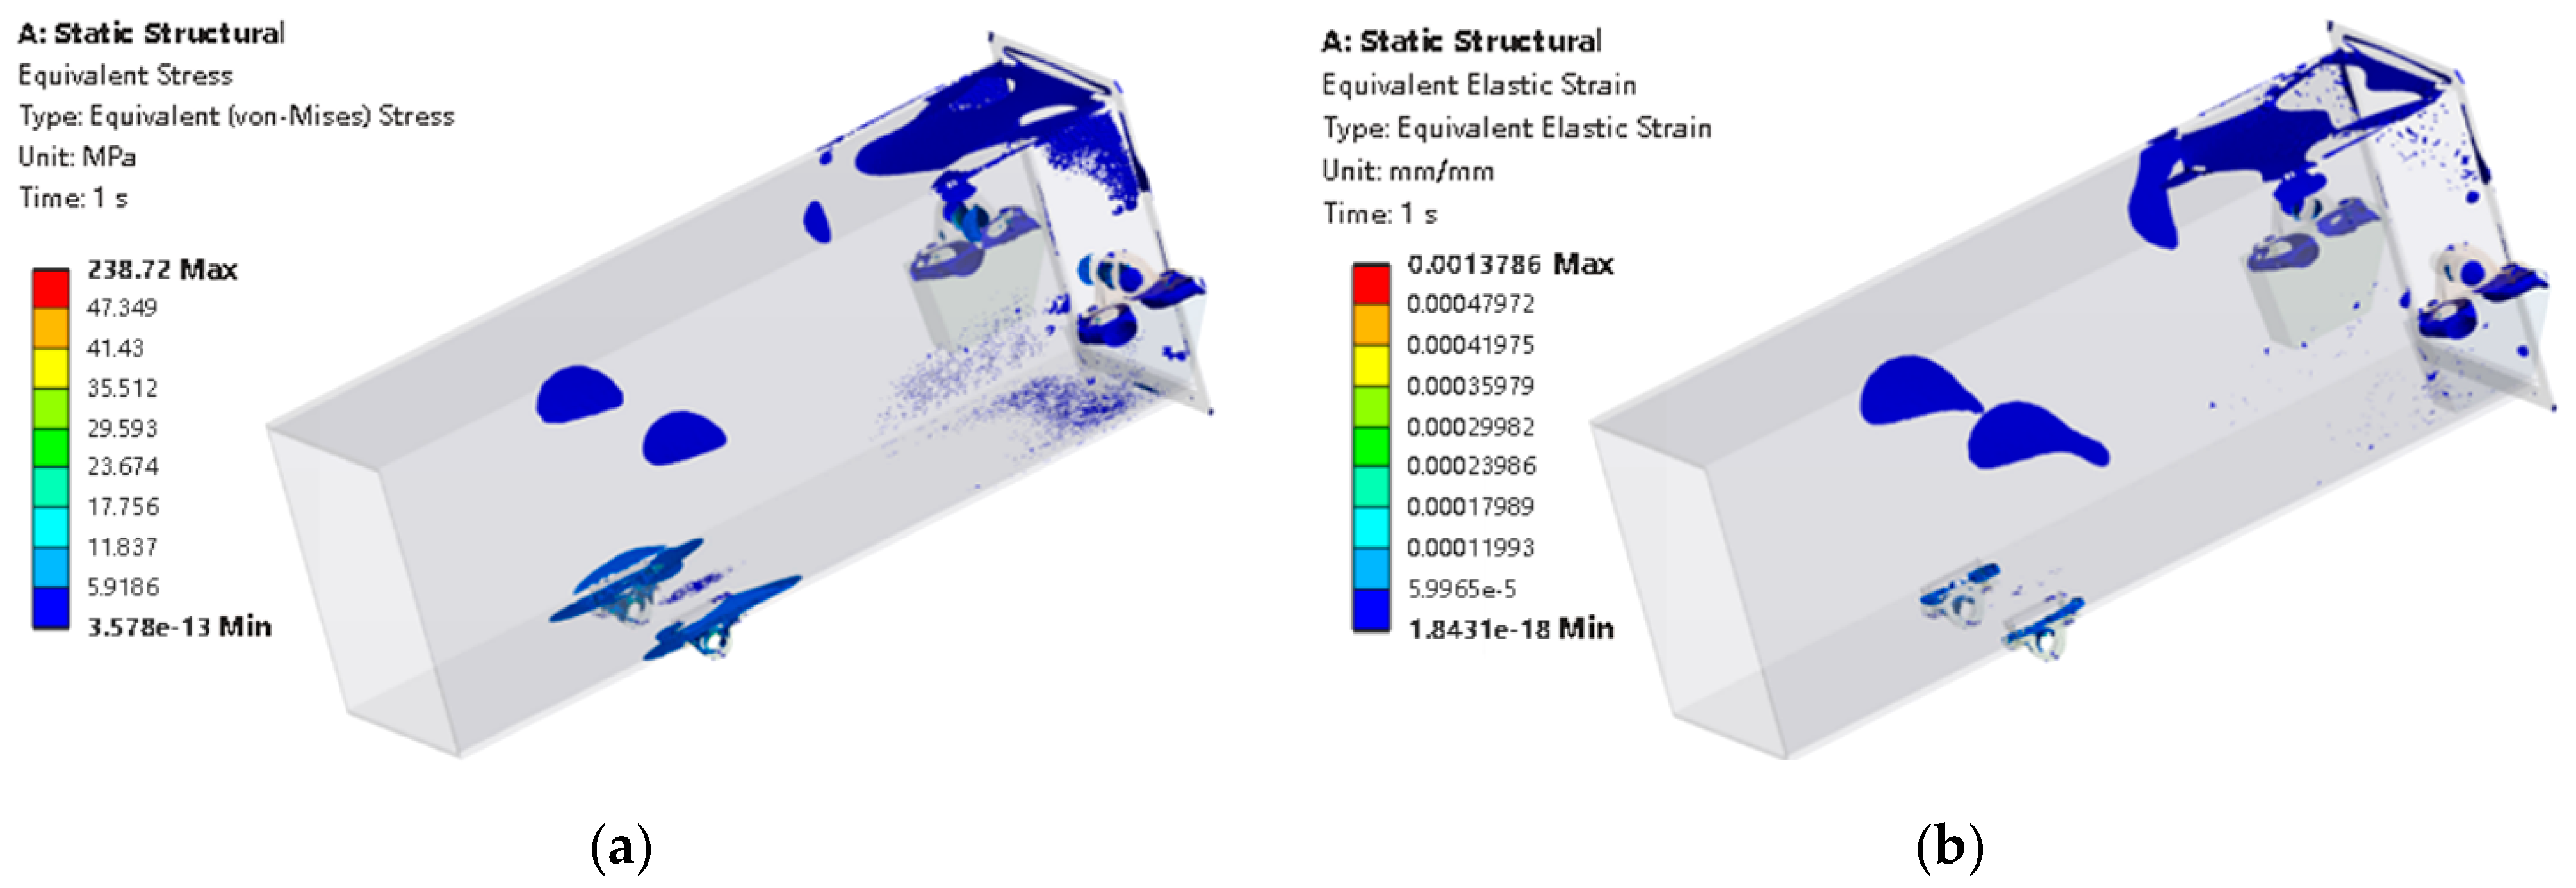
3.1. Load Results of the Bolt Structure at the Connection of the Conveyor Trough Ends

The connection between the combine harvester’s cutting platform and the conveyor trough utilizes grade 8.8 M12 bolts (in accordance with GB/T 3098.1-2010). The tensile strength is approximately 800 Mpa, and the yield strength is approximately 640 Mpa. The permissible stress for the bolted connection is typically specified as 60~70% of the yield strength, resulting in a range of approximately 384–448 Mpa. Finite element analysis results for the bolted connection at the interface between the cutting platform and the conveyor trough are presented in Figure 23a. The maximum stress concentration is observed at the bolt connection located on the upper left side of the main body. The maximum stress value obtained from the simulation is 253.77 Mpa. As can be observed in the strain contour plot in Figure 23a, the maximum strain also occurs at this bolted connection, with a value of 1.299 × 10⁻³. This suggests that this location represents the structurally weakest point and may be susceptible to fracture and plastic deformation.
While the maximum stress and strain concentrations are observed at the connecting bolts on the upper left side of the connection, the bolts situated on the same horizontal plane on the right side also exhibit stress and strain concentration. Consequently, the critical bolt structures at the interface between the cutting platform and the conveyor trough are primarily the connecting bolts located on the upper left and upper right sides. The finite element analysis results for the bolted connection at the interface between the threshing unit and the conveyor trough are presented in Figure 24a. In comparison to the bolted connection between the cutting platform and the conveyor trough, the bolted connection between the conveyor trough and the threshing unit experiences reduced loading due to the presence of two hydraulic cylinders supporting the lower end of the conveyor trough. The maximum von Mises stress and maximum elastic strain within the overall structure are located at the hydraulic cylinder connection points, with values of 238.72 Mpa and 1.379 × 10⁻³, respectively. The maximum von Mises stress and maximum elastic strain for the bolted connection are 39.12 Mpa and 2.32 × 10⁻⁴, respectively. Therefore, the bolted connection between the cutting platform and the conveyor trough constitutes the primary area of interest for this investigation.
Due to the relatively high stress levels within the connection structure between the cutting platform and the conveyor trough, specifically at the connecting bolts located on the upper left, and given that the bolts situated on the same horizontal plane on the right side also represent points of stress and strain concentration, sensors will subsequently be installed at the upper left, upper right, lower left, and lower right locations of the interface between the cutting platform and the conveyor trough to facilitate sensor monitoring and experimental validation.

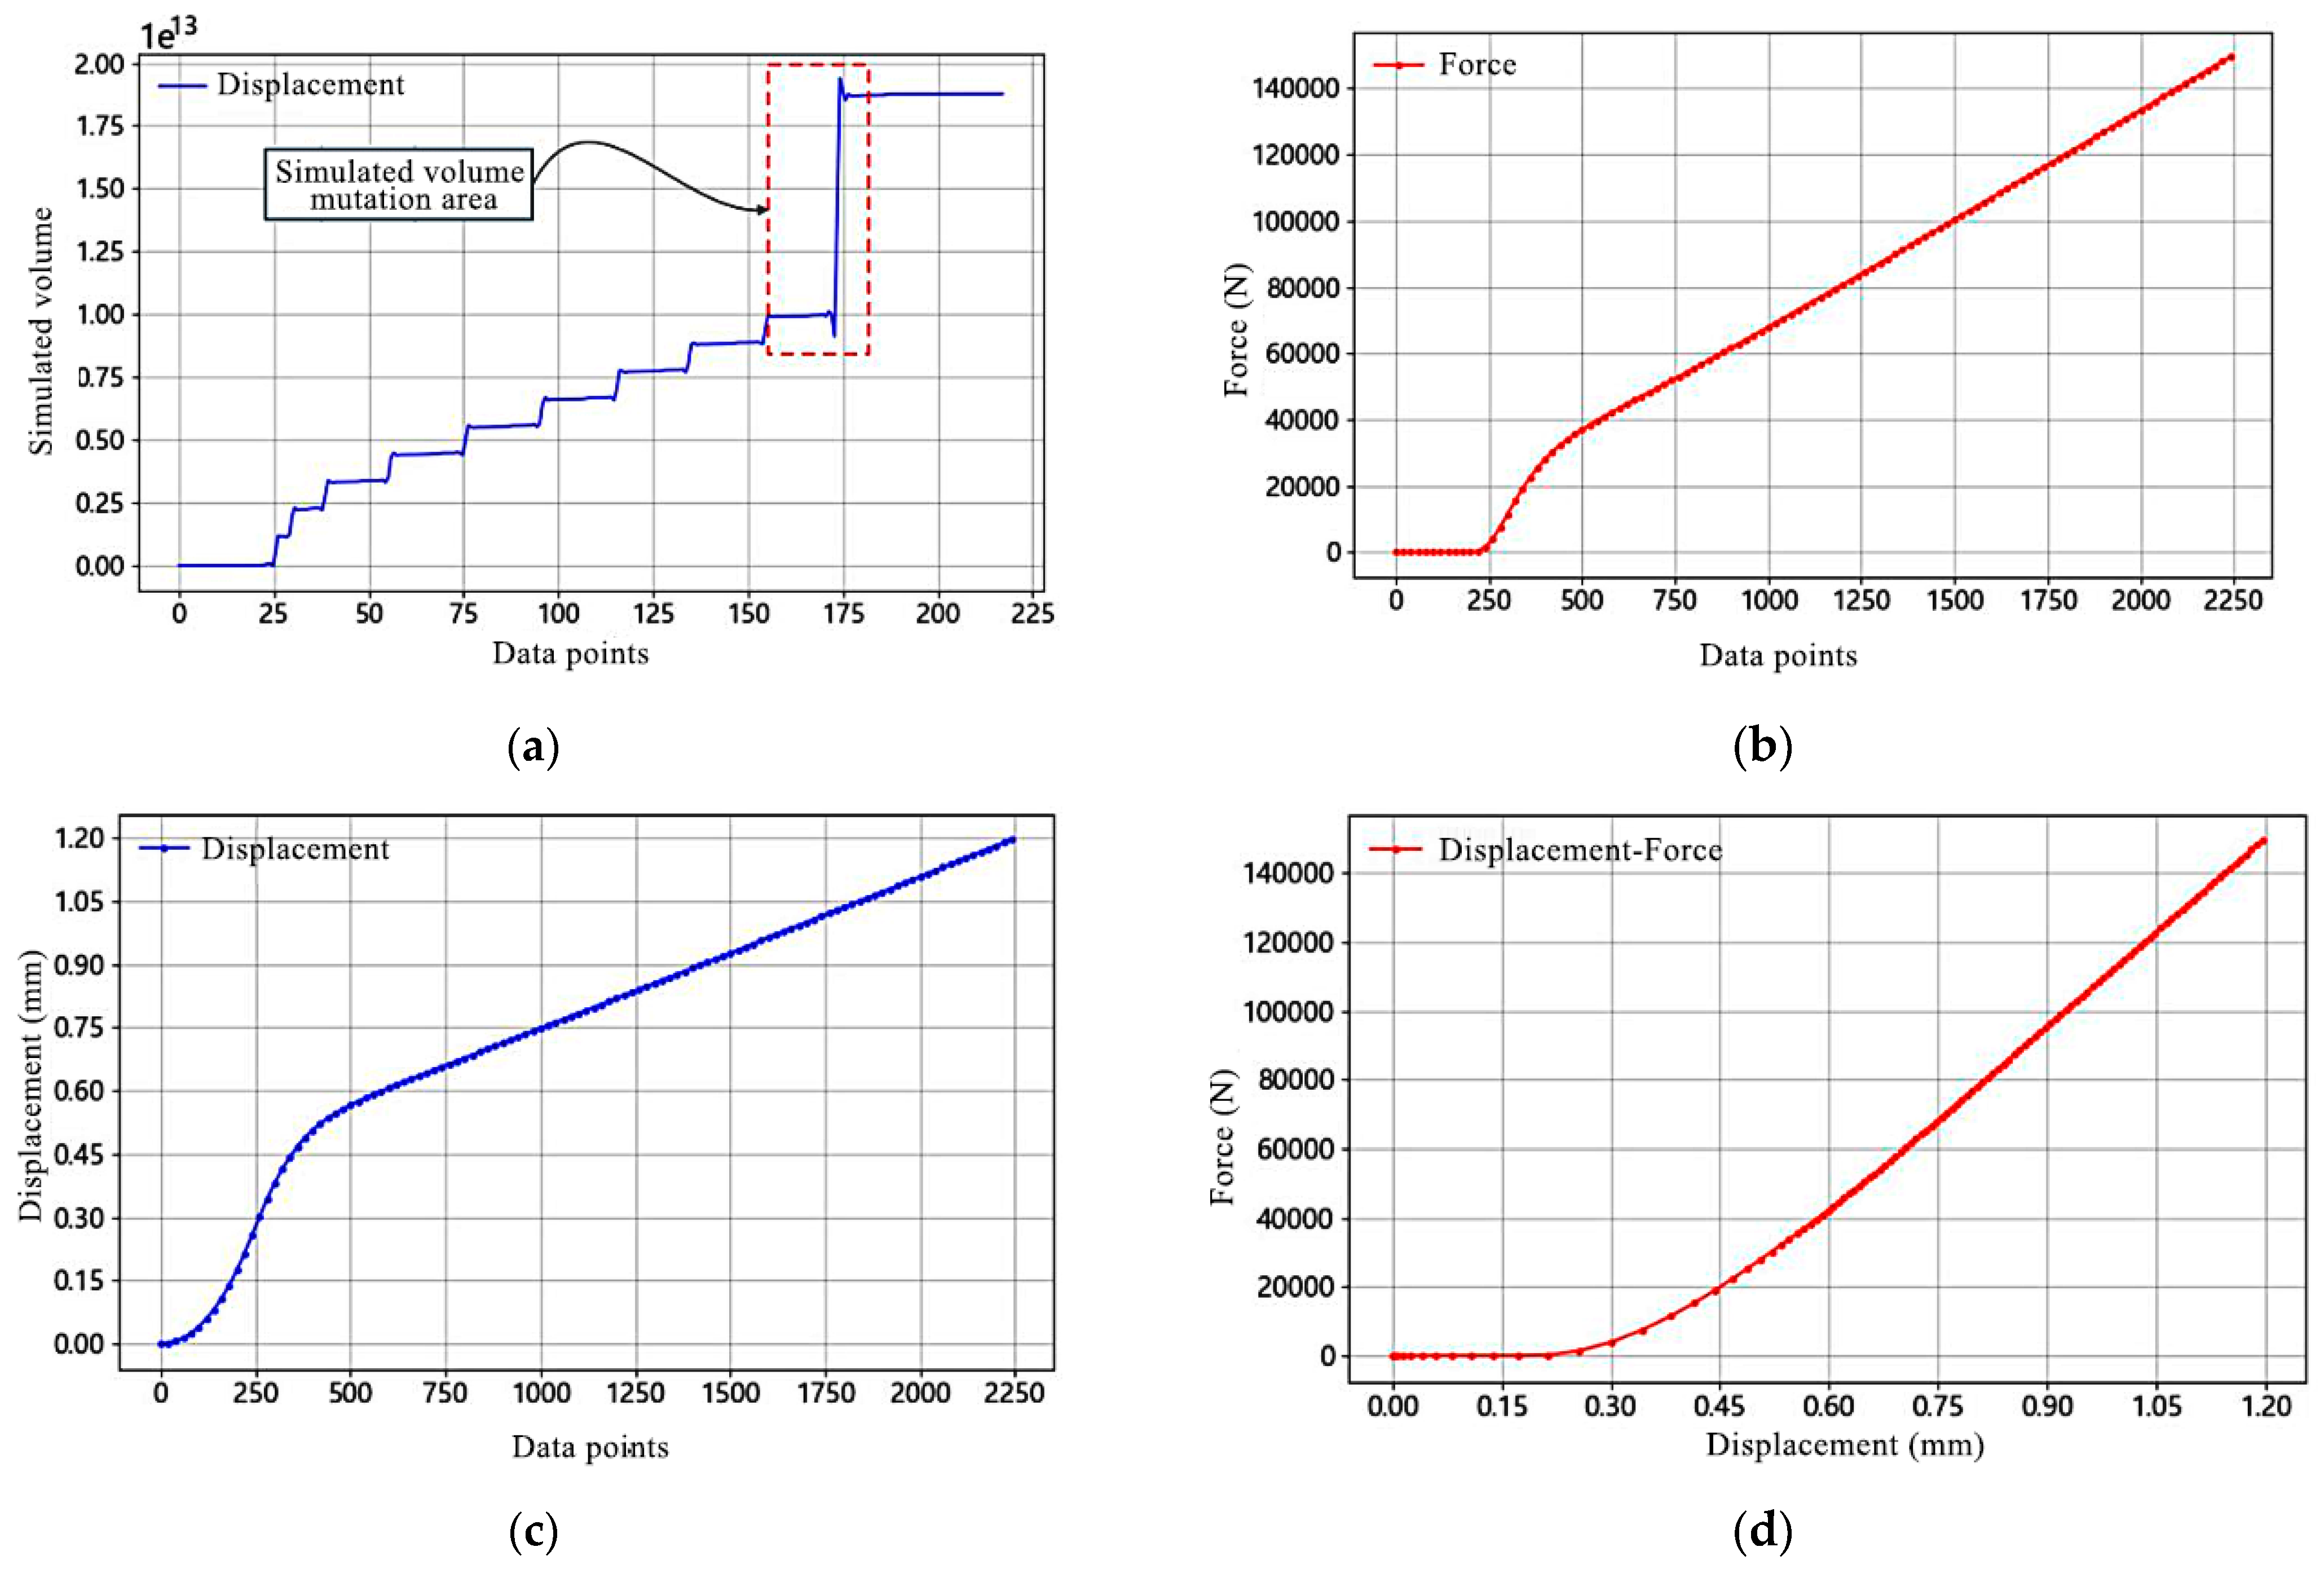
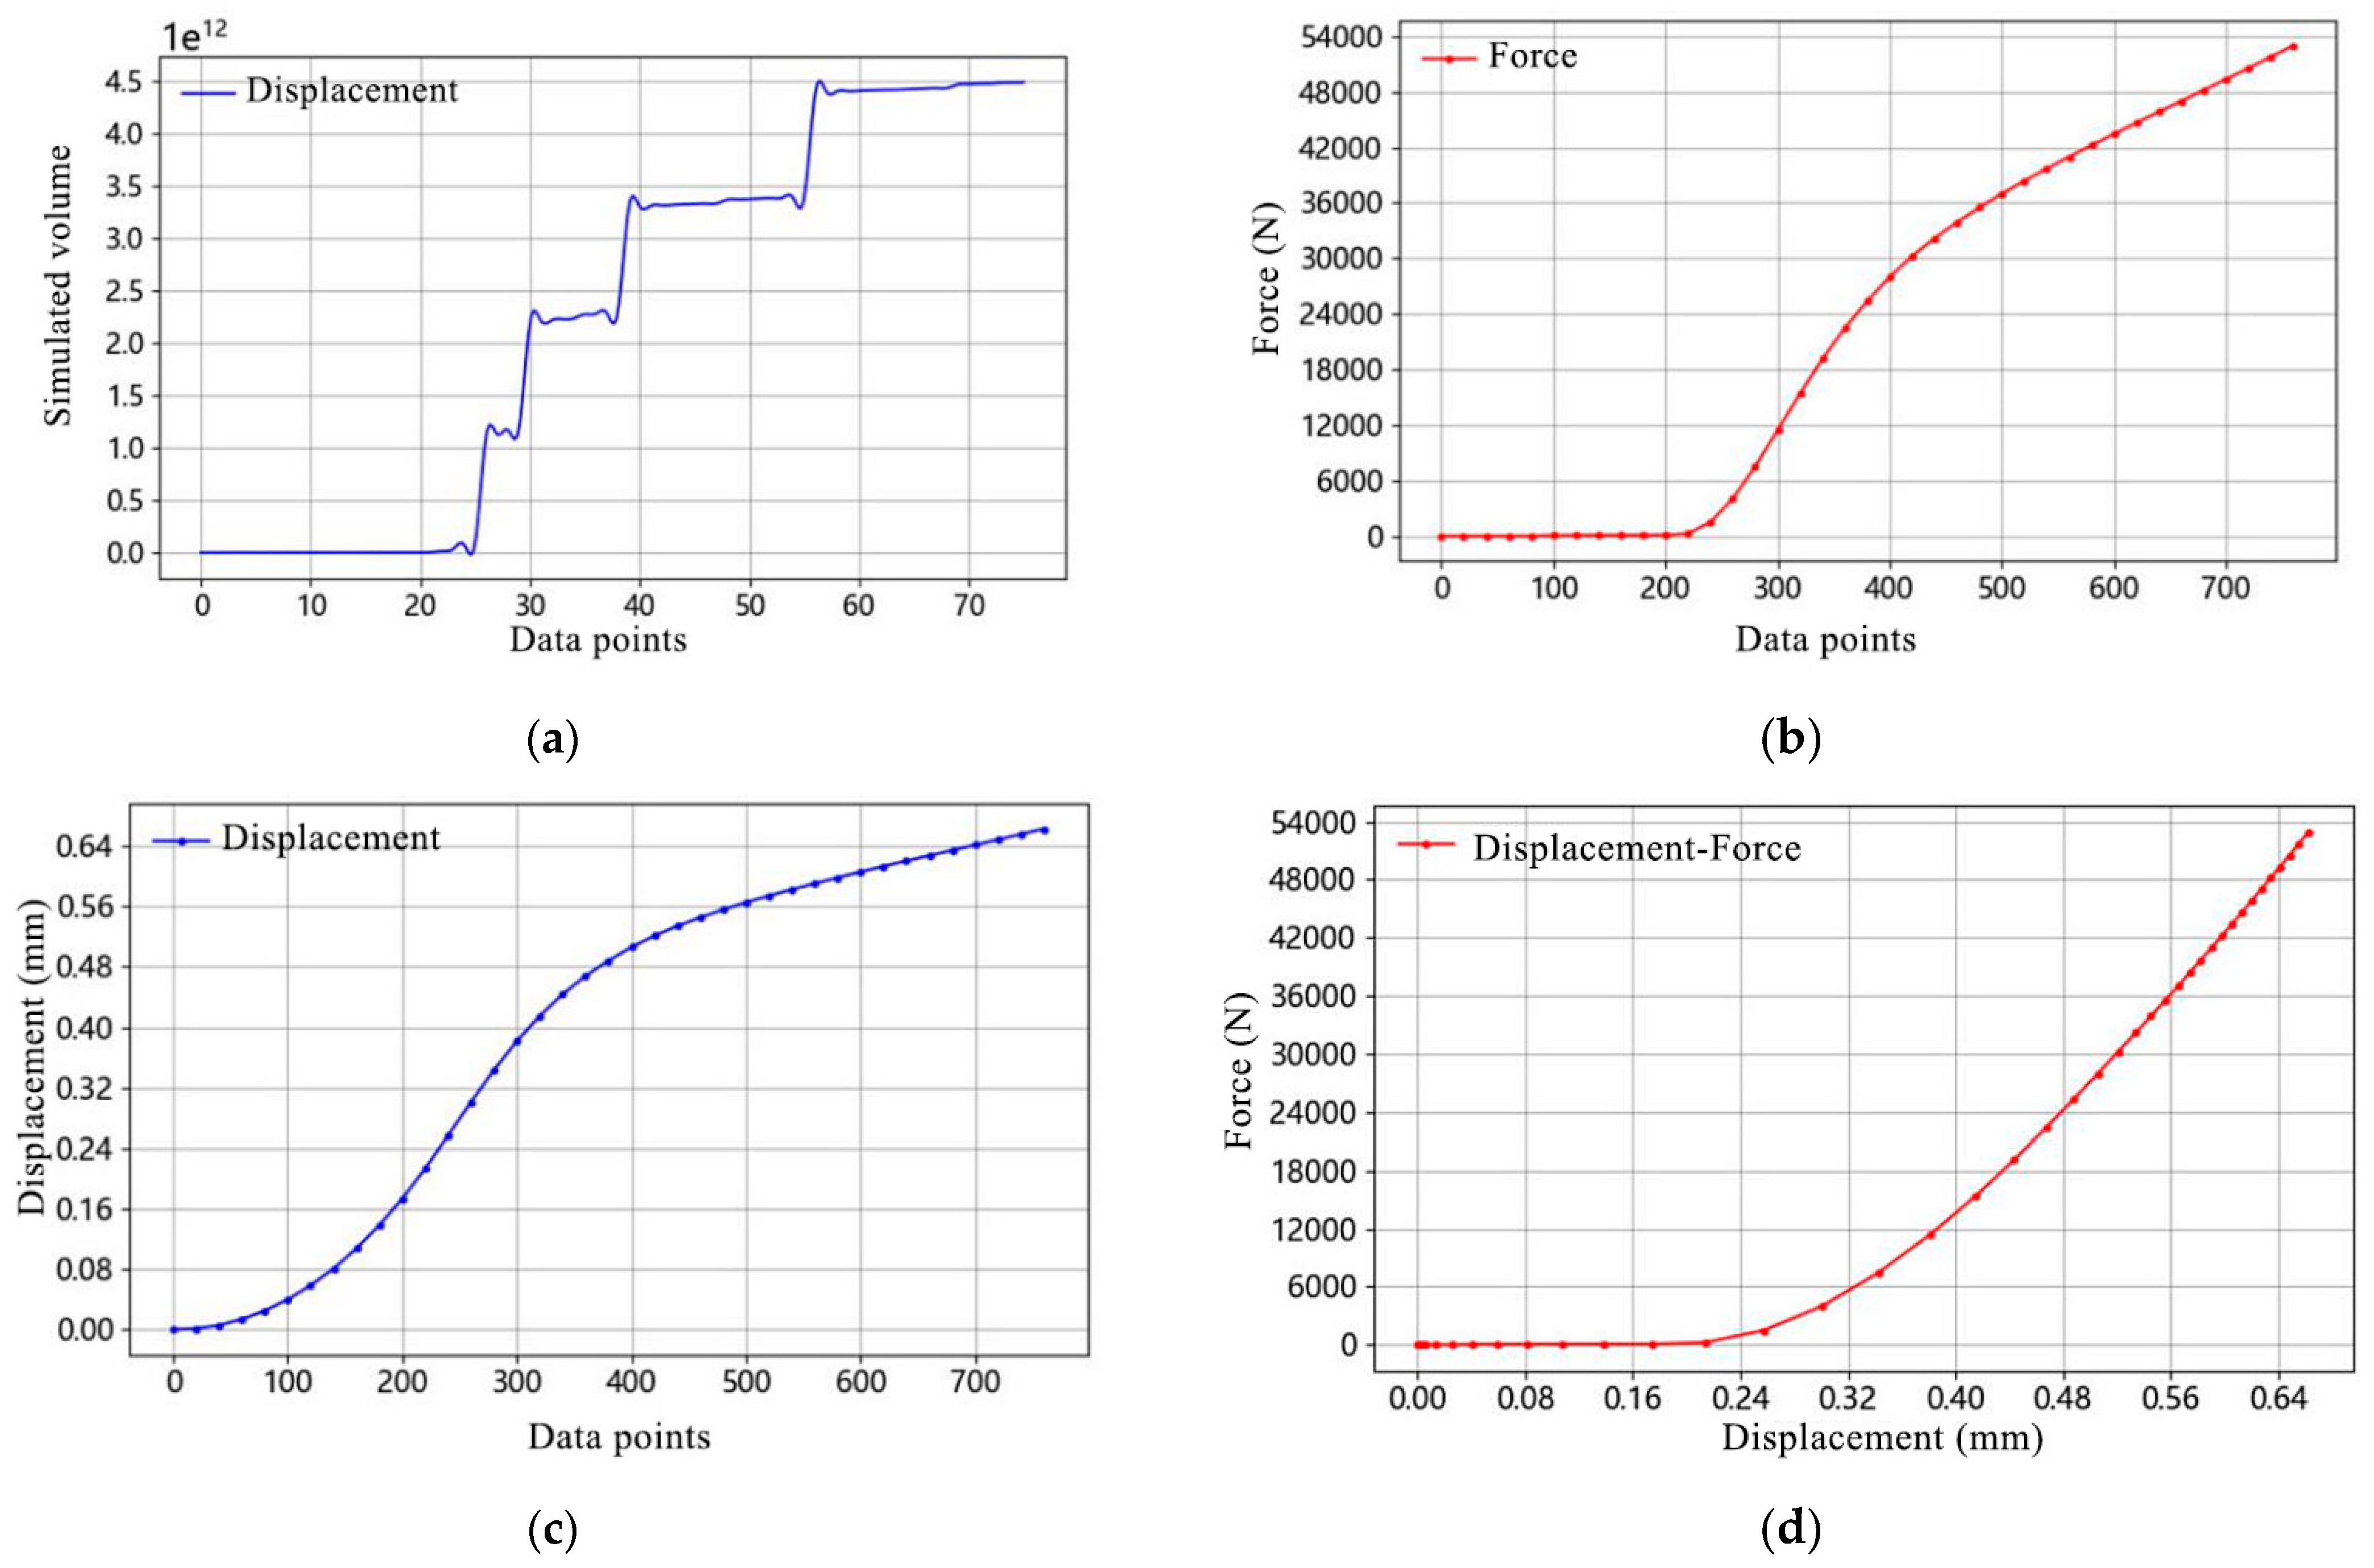
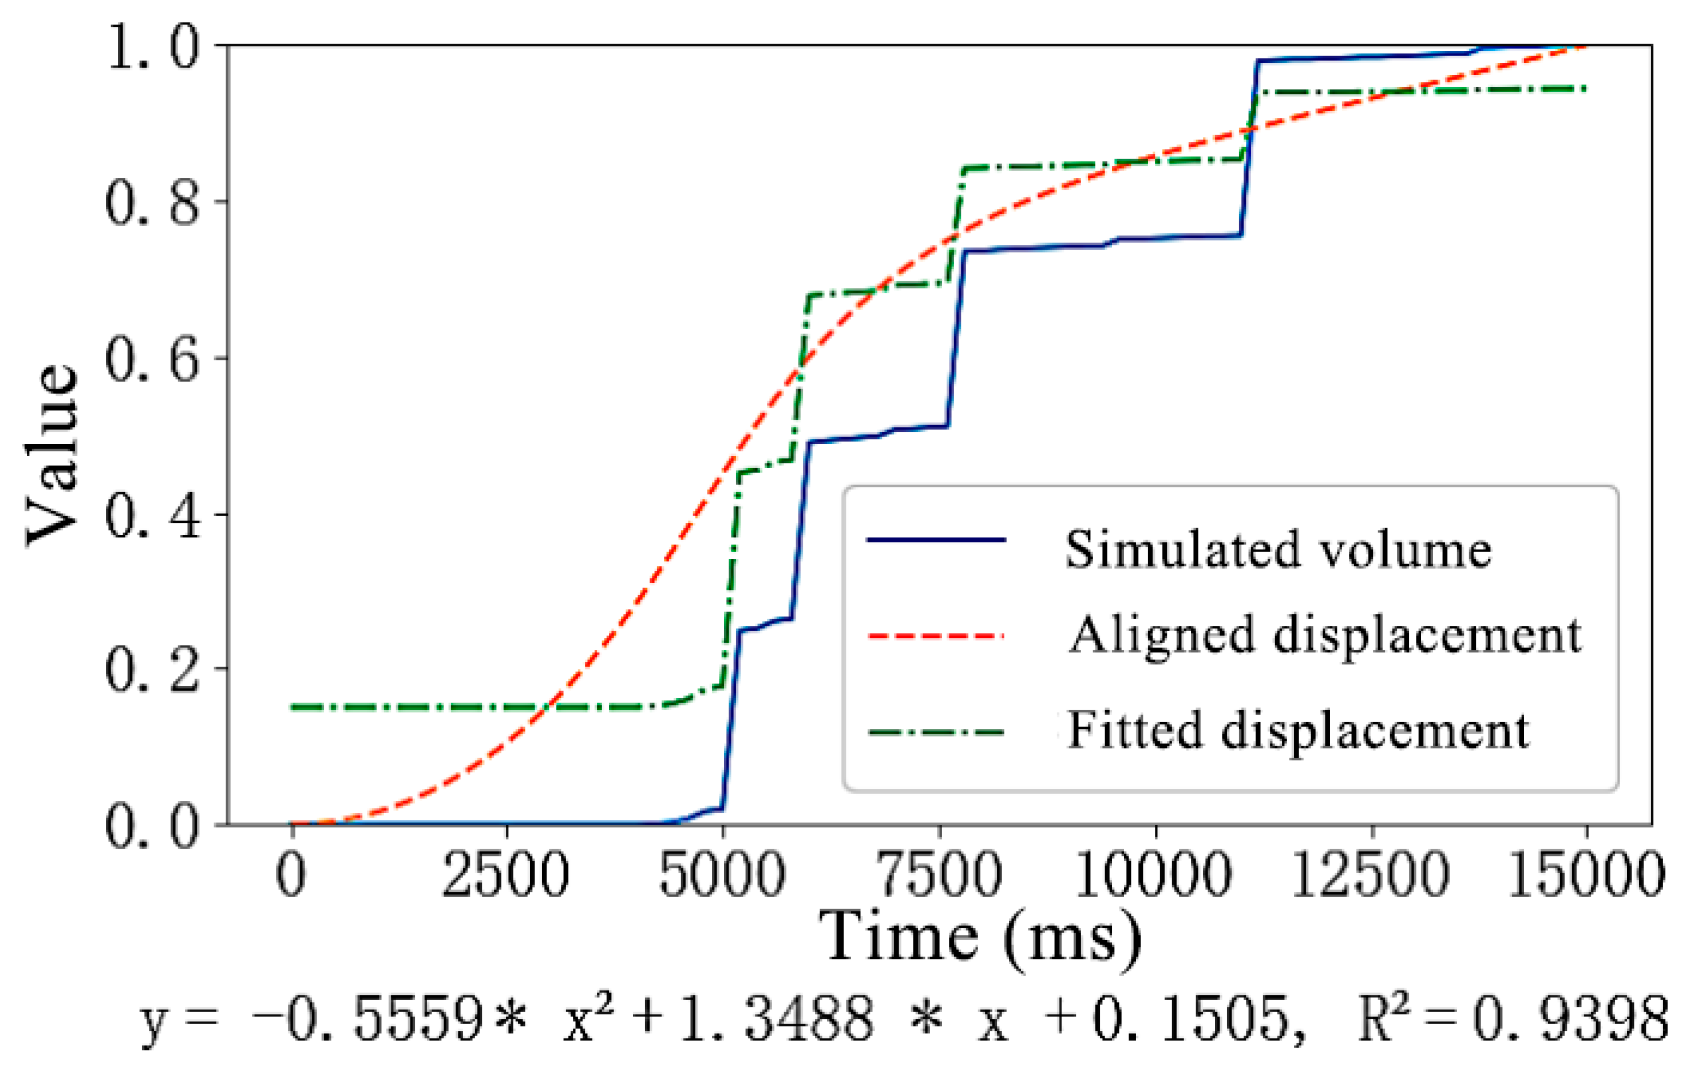
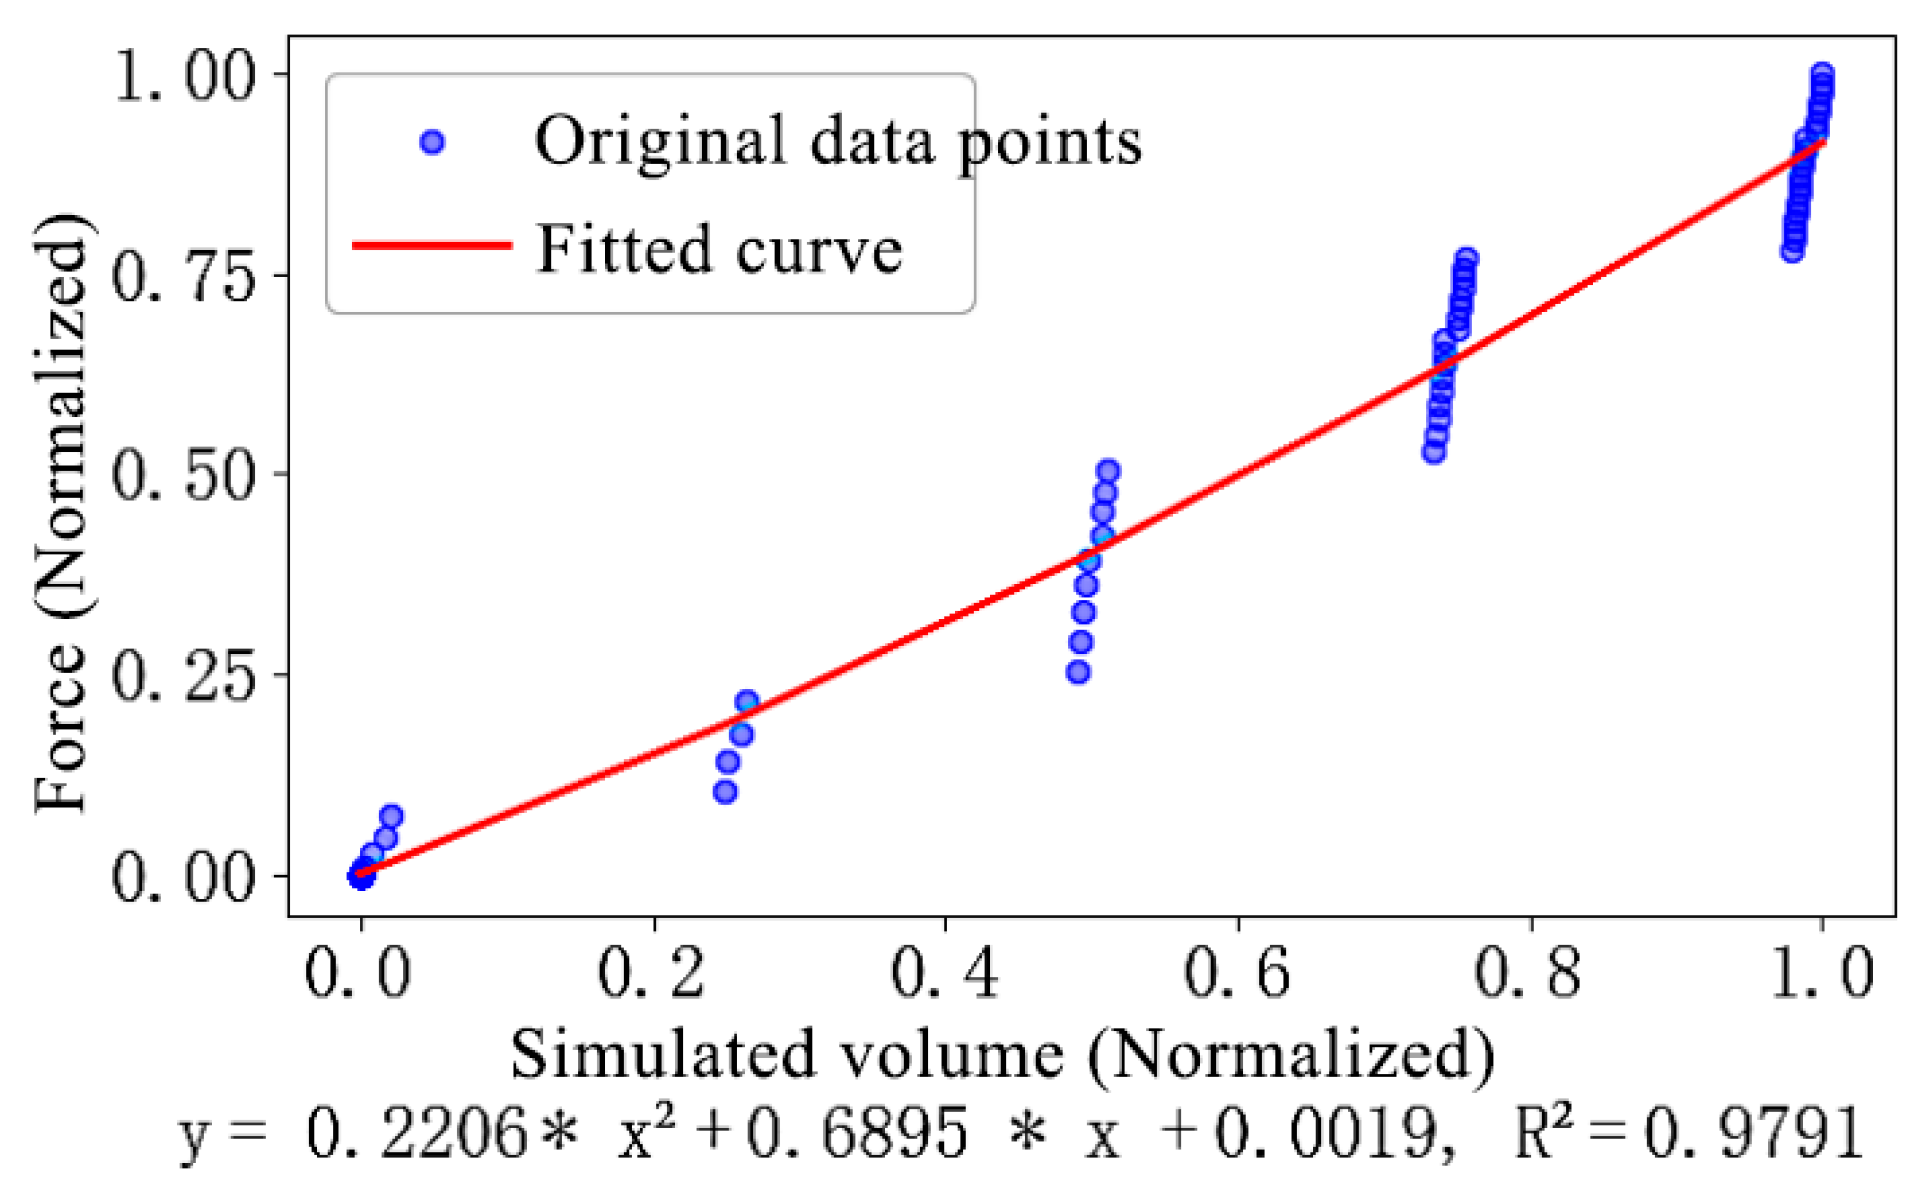
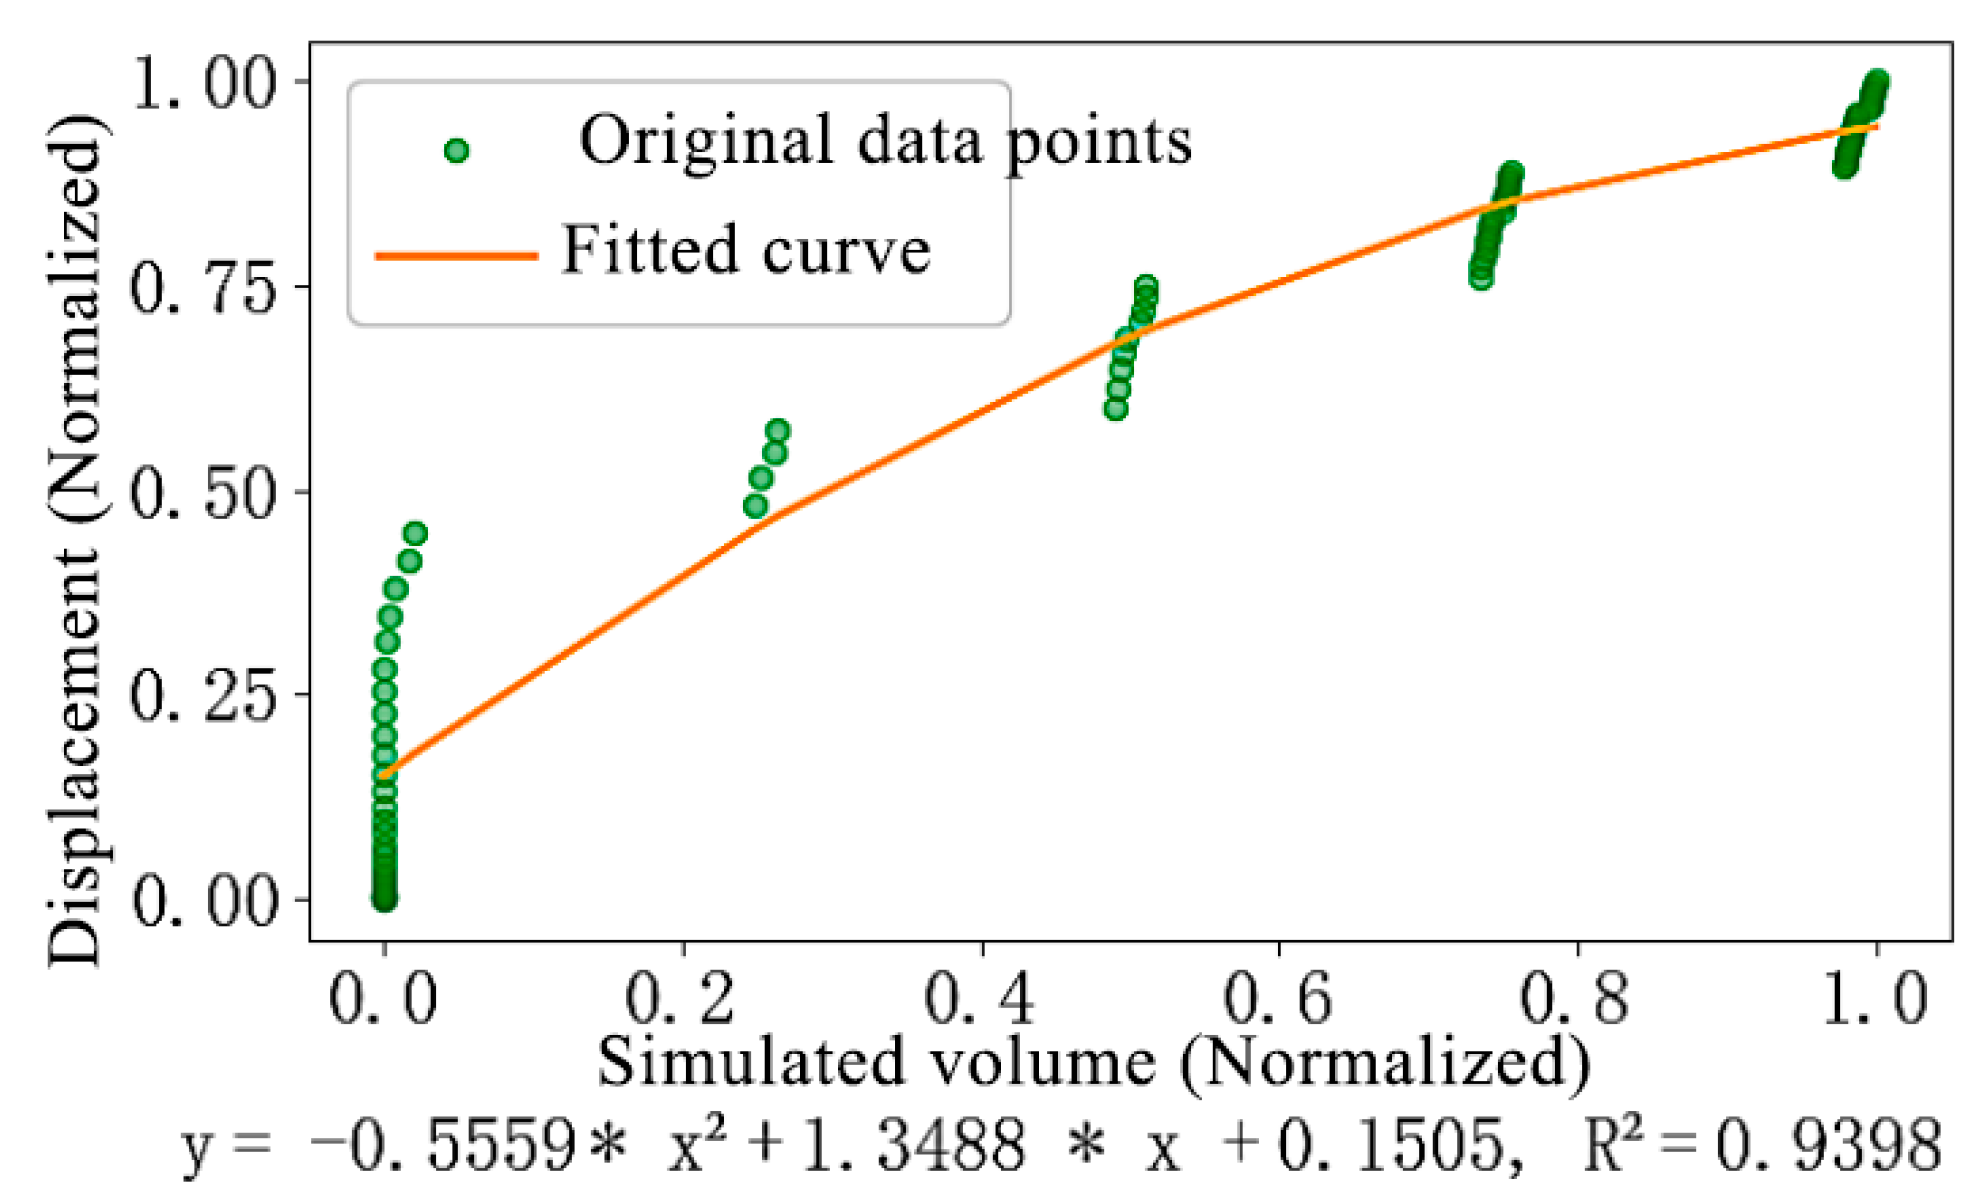
3.2. Analysis of Sensor Data Fitting Results for the Conveyor Trough Bolt Structure System

The results of the data fitting are presented in Figure 25. The subsequent data comprises analog output data points and corresponding pressure values acquired within the same time frame. An abrupt change is observed in the acquired analog output, suggesting that the applied pressure has reached the sensor’s operational range limit. Beyond this limit, the sensor is unable to provide reliable measurements. Consequently, this segment of data should be re-evaluated in the context of the monitoring system design.
Under ideal conditions, the analog output from the sensor should exhibit a relatively smooth variation. However, due to limitations imposed by the ADC resolution, the dynamic range of the analog signal, the sampling rate, and other factors, the changes in the analog output manifest as a step-like pattern. Consequently, to compensate for errors in preload readings introduced by these limitations, additional data fitting techniques are required. Dynamic time warping (DTW) is applicable for aligning time-series data, particularly when sampling rates are inconsistent or time points are misaligned. It is suitable for aligning time series of differing lengths or temporal resolutions. Based on the preceding DTW analysis, data fitting is performed on the analog output-pressure and analog output-displacement data, as illustrated in Figure 26 and Figure 27. A significant issue arising from the step-like variations is the non-uniform distribution of data points along the time axis. Direct regression analysis may be inappropriate; thus, ordinary least squares (OLS) is employed to achieve an optimized fit.
As indicated by the DTW distance curves, for both force and displacement data, the DTW distance increases progressively with increasing sequence length, but the rate of this increase diminishes gradually. This suggests that the discrepancy is greater in the initial portion of the sequence and relatively smaller in the latter portion. The cumulative distribution curve of the fitted force data closely approximates the cumulative distribution curve of the original data, demonstrating the model’s ability to accurately capture the overall distribution characteristics of the force. An R2 value of 0.9780 signifies a good fit for the quadratic polynomial model, indicating its capacity to explain the majority of the variance within the data. The cumulative distribution fitting results for the displacement data exhibit a similarity to those of the pressure data. The high degree of correspondence between the fitted curve and the original data curve, characterized by an R2 value of 0.9753, further confirms the efficacy of the quadratic polynomial model. The force range under consideration is 0–150 kN, and the corresponding range of the analog output is 0~1.877 × 10¹³.
As observed in Figure 28 and Figure 29, a strong linear correlation exists between the predicted values and the actual values, and the fitted curve accurately reflects this correlation. However, within the range of lower force values, the data points exhibit greater scatter, suggesting that the predictive accuracy of the model is comparatively lower in this region. A strong non-linear correlation is present between the predicted and actual values, with the fitted curve generally capturing the relationship between force and the analog output. It is noteworthy that in the region of higher displacement values, the data points are concentrated near the fitted curve, whereas in the region of lower displacement values, the data points exhibit increased scatter. This behavior is in contrast to the scatter plot characteristics observed for the pressure data. This suggests that the model’s predictive accuracy is higher for larger displacements and comparatively lower for smaller displacements.
Examination of Figure 30 and Figure 31 reveals that the residual values primarily fluctuate within the range of −0.1 to 0.1, exhibiting no discernible overall trend and oscillating around zero. This suggests that the linear model provides a good fit to the force data. According to the previously referenced standard, the preload force is typically calculated as 70–80% of the yield strength. Consequently, the preload range that the sensor must monitor for grade 8.8 M12 bolts can be calculated to be 37.8 kN to 43.1 kN. To improve monitoring precision, the maximum monitoring range is adopted, corresponding to 70–100% of the yield strength, resulting in a range of 37.8 kN to 54.0 kN. The sensor and coefficient functions are refitted, with data points below 54.0 kN fitted proportionally according to their temporal variation. Future work may involve further fitting procedures for different bolt sizes. The results are presented in Figure 32.
An R2 value of 0.9791 signifies a good fit for the quadratic polynomial model, demonstrating its capacity to explain the majority of the variance within the data. The cumulative distribution fitting results for the displacement data exhibit a similarity to those of the pressure data. The high degree of correspondence between the fitted curve and the original data curve, characterized by an R2 value of 0.9398, further confirms the efficacy of the quadratic polynomial model, as illustrated in Figure 33 and Figure 34.
As observed in Figure 35 and Figure 36, a strong linear correlation exists between the predicted pressure values from the sensor and the actual pressure values, with the fitted curve accurately reflecting this correlation. Furthermore, the cumulative distribution curve of the fitted data closely approximates that of the original data, consistent with the preceding analysis, demonstrating the ability of the model derived from the previous data segments to accurately capture the overall distribution characteristics of the force. The residual values primarily fluctuate within the range of −0.1 to 0.1. The force range under consideration is 0–54 kN, and the corresponding range of the analog output is 0~4.493 × 10¹².

3.3. Analysis of Sensor Loosening Test Results for the Bolt Structure System

Within a bolted connection, the relationship between the preload force, denoted as F p , and the nut rotation angle, denoted as θ , can be represented by the following equation:
F p = k b × k m k b + k m θ P 360
T = K F p d
In the equation, F p is the bolt preload, N. k b is the bolt stiffness, expressed in N/mm. k m is the stiffness of the clamped members, N/mm. θ is the nut rotation angle, °. p is the thread pitch of the bolt, mm. T is the applied torque, N m . K is the torque coefficient, ranging from 0.15 to 0.25. It is evident that there should theoretically exist a linear relationship between preload and rotation angle, as well as between torque and rotation angle.
The experimental results are presented in Figure 37 and Figure 38. After excluding data points exhibiting significant errors, during the same time period from the initial contact of the bolt with the connected members to the completion of the tightening process, both the tightening torque and the tightening angle demonstrate a linear relationship with time. By indicating the ranges of tightening torque and angle on the graph, the preload range of the bolt can be inferred.
Utilizing the host computer software, the variation curve of the sensor’s analog output during the tightening process can be acquired, as depicted in Figure 39. It is observed that the analog output continues to exhibit a step-like pattern, attributable to limitations in the ADC resolution, the dynamic range of the analog signal, and the sampling rate. Through curve fitting, the functional relationship between the analog output and time during the test duration can be determined as y = 649 x 2 + 8.1103208 × 10 7 x + C . Excluding the variations near the zero point, the relationship between the analog output and time can be represented by a quadratic function.
Based on the preceding fitting results, at a torque of 68.7~78.6 N m , the theoretically predicted range for the analog output is 3.08 × 10¹²~3.49 × 10¹². The analog output range, as determined through experimental testing with a tightening torque of 68.7 N m to 78.6 N m , is 3.12 × 10¹²~3.51 × 10¹². The overlap between the fitted analog output range and the experimentally determined range is 95.12%.
Following normalization, the relationship curves between the analog output and the tightening angle and between the analog output and the tightening torque are obtained for the condition where the bolt structure reaches the designated preload, as depicted in Figure 40. The relationships between tightening torque, tightening angle, and the sensor’s analog output are given by and y = 0.1324 x 2 + 0.7904 x 0 . 0205 , respectively. Within the fitting results, the tightening torque range is 0 to 79.88, the tightening angle range is 0~29.40°, and the analog output range is 0~4.0 × 10¹². The coefficients of determination are 0.9945 and 0.9939, respectively, signifying a good data fit.
At a tightening torque ranging from 68.7~78.6 N m , the corresponding analog output values are 3.03 × 10¹² to 3.55 × 10¹². Concurrently, when the tightening angle varies between 25.2° and 28.6°, the analog output range is 3.02 × 10¹² to 3.49 × 10¹². It is observed that the analog output range during the bolt’s transition from a tightened to a loosened state (corresponding to an angle change of 25.2°~28.6°) is slightly lower than the range corresponding to the tightening torque. Consequently, monitoring the bolt structure using the range of 3.02 × 10¹² to 3.49 × 10¹² provides a more conservative approach. Nevertheless, the relationship between the analog output and preload and between the analog output and tightening torque during the loosening process remains reliable for detecting bolt loosening. The tightening torque from initial nut contact with the connecting surface to the attainment of the pre-tightened state is 0~68.7 N m . Validation of the bolt loosening status, analog output, and angle through experimental testing establishes a foundation for subsequent monitoring efforts and the design of monitoring devices.

3.4. Loosening Monitoring Experiment of Sensor for the Bolt Structure System

To verify the monitoring performance of the monitoring system, based on the preceding simulation results, sensors will be installed at the upper left, upper right, lower left, and lower right positions of the connection between the cutting platform and the conveyor trough, corresponding to the locations of stress and strain concentration, for experimental validation. In the experiment, we started the machine and loosened the bolt structure using a torque wrench., as illustrated in Figure 41.
Experimental testing, based on the data feedback from the sensor, demonstrates that the sensor is capable of detecting minor instances of loosening when the preload force decreases by 5% (within 2000 N). Data transmission to the host computer can be accomplished within 200 ms, and an alarm is triggered upon approaching the loosening threshold. The wireless communication module enables reliable data transmission over a distance of approximately 1.2 km. Bolt loosening monitoring is achievable within a preload range of 0 to 150 kN. By incorporating a switching MOSFET circuit, concurrent monitoring of a minimum of four sensors is feasible. This provides a conceptual framework and reference for the design of a monitoring and supervision system for bolt loosening in combine harvesters.

4. Conclusions

Utilizing the three-dimensional model of the combine harvester, the Solidworks statistics tool was employed to acquire the mechanical parameters of the various components of the combine harvester. Based on the statistical data, the mass of the cutting platform is 465.530 kg, and the mass of the conveyor trough is 187.150 kg. The connection between the cutting platform and the conveyor trough, as well as the connection between the conveyor trough and the frame of the threshing unit, were simplified. Finite element analysis was conducted on the two bolted connections using ANSYS simulation software. The location of the maximum stress concentration at the interface between the cutting platform and the conveyor trough is at the connecting bolts situated on the upper left side. Within the simulation, the stress at this location is 253.77 MPa, and the corresponding strain is 1.299 × 10⁻³. The maximum stress and strain values for the connection structure between the conveyor trough and the frame of the threshing unit are 39.12 MPa and 2.32 × 10⁻⁴, respectively. This indicates that the bolted connection between the cutting platform and the conveyor trough represents the structurally weakest point within the connection and may be susceptible to fracture and plastic deformation.
A bolt loosening monitoring sensor was designed based on the Wheatstone bridge circuit principle, utilizing an HX710A analog-to-digital converter (ADC). The sensor’s operational principle was analyzed, and a sensor response curve fitting test was conducted. dynamic time warping (DTW) was employed for optimal alignment of the monitoring data, and the relationships between the analog output and the applied pressure, as well as between the analog output and displacement, were fitted. The coefficients of determination (R2) for these fits were 0.9780 and 0.9753, respectively. Using the preload range of 0–54 kN for M12 bolts as an illustrative example, the relationships between the analog output and applied pressure/displacement were subjected to interval fitting, yielding R2 values of 0.9791 and 0.9398, respectively. This demonstrates accurate fitting of the sensor’s response curve based on the Wheatstone bridge circuit.
Building upon the Wheatstone bridge circuit-based sensor monitoring principle and employing an STM32F103CBT6 microcontroller as the primary control unit, a multi-channel switching circuit was designed. Integrating LoRa wireless communication technology, a multi-bolt loosening monitoring system for combine harvesters was developed. To assess the performance of the Wheatstone bridge circuit-based sensor, a sensor monitoring validation experiment was performed. The overlap between the fitted analog output range and the calibrated test range was found to be 95.12%. Furthermore, the coefficients of determination for the fitted curves relating monitored analog output to tightening torque and monitored analog output to tightening angle were 0.9945 and 0.9939, respectively, demonstrating accurate fitting that met the specified preload conditions. Finally, in conjunction with the simulation results, real-world performance tests were carried out on the combine harvester. The sensor demonstrated the capability to detect minor instances of loosening corresponding to a 5% reduction in preload, transmit data to the host computer within 200 ms, and maintain reliable data transmission over distances of up to 1.2 km without data loss.

Author Contributions

Conceptualization, Z.T. and Y.L.; methodology, Y.L., Z.T. and M.S.; validation, S.X., B.W. and K.Q.; formal analysis, Y.L. and Z.T.; data curation, S.X., B.W. and K.Q.; investigation, Z.H. and B.W.; writing—original draft preparation, S.X., B.W. and K.Q.; writing—review and editing, B.W., K.Q. and Y.L.; supervision, Z.H. All authors have read and agreed to the published version of the manuscript.

Funding

This research work was supported by the High-level Talents Research Start-up Fund supported by Jiangsu Shipping College (HYRC/202404), Nantong Social Livelihood Science and Technology Project (MS2023016), Natural Science Foundation of Jiangsu Basic Research Program (BK20221368), College Student Innovation Practice Fund of the School of Artificial Intelligence and Intelligent Manufacturing, Jiangsu University (RZCX2024001), The Jiangsu Province University Students Practical Innovation Training Program Project (202410299060Z), and Key Laboratory of Modern Agricultural Equipment and Technology of Ministry of Education, Jiangsu University (MAET202326).

Data Availability Statement

The data used to support the findings of this study are available from the corresponding author upon request.

Conflicts of Interest

The authors declare no conflicts of interest.

References

  1. Ma, Z.; Wu, Z.P.; Li, Y.F.; Song, Z.Q.; Yu, J.; Li, Y.M.; Xu, L.Z. Study of the grain particle-conveying performance of a bionic non-smooth-structure screw conveyor. Biosyst. Eng. 2024, 238, 94–104. [Google Scholar] [CrossRef]
  2. Li, Y.; Xu, L.Z.; Lv, L.Y.; Shi, Y.; Yu, X. Study on Modeling Method of a Multi-Parameter Control System for Threshing and Cleaning Devices in the Grain Combine Harvester. Agriculture 2022, 12, 1483. [Google Scholar] [CrossRef]
  3. Hou, J.; Xie, F.; Wang, X.; Liu, D.; Ji, B. Design and test of multi-crop harvester header. J. Hunan Agric. Univ. Nat. Sci. 2023, 49, 223–230. [Google Scholar]
  4. Li, Y.M.; Liu, Y.B.; Ji, K.Z.; Zhu, R.H. A Fault Diagnosis Method for a Differential Inverse Gearbox of a Crawler Combine Harvester Based on Order Analysis. Agriculture 2022, 12, 1300. [Google Scholar] [CrossRef]
  5. Li, H.B.; Chen, L.W.; Zhang, Z.Y. A Study on the Utilization Rate and Influencing Factors of Small Agricultural Machinery: Evidence from 10 Hilly and Mountainous Provinces in China. Agriculture 2023, 13, 51. [Google Scholar] [CrossRef]
  6. Wu, X.; Zhang, Z.; Tian, R.; Li, Y.; Zhou, J.; Liu, J.; Zhu, M. Effects of Lubricating Greases on Self-loosening Behaviour of Bolted Joints Subject to Dynamic Shear Load. Surf. Technol. 2020, 49, 198. [Google Scholar]
  7. Chandio, F.A.; Li, Y.; Xu, L.; Ma, Z.; Xu, L.Z. Predicting 3D forces of disc tool and soil disturbance area using fuzzy logic model under sensor based soil-bin. Int. J. Agric. Biol. Eng. 2020, 13, 77–84. [Google Scholar]
  8. Wang, J.; Hu, B.; Huang, Q.; Zhu, R.; Fu, Q. Simulation analysis and experimental verification on bearings fatigue life of a centrifugal pump. J. Drain. Irrig. Mach. Eng. 2024, 42, 865–871. [Google Scholar]
  9. Fan, J.; Zhang, W.; Jiao, T.; Zhao, Y. Failure mechanism of fatigue fracture and life analysis for bolted joint of aircraft structure. J. Mech. Strength 2023, 45, 1459–1464. [Google Scholar]
  10. Fang, P.J.; Cai, Y.F.; Chen, L.; Wang, H.; Li, Y.C.; Sotelo, M.A.; Li, Z.X. A high-performance neural network vehicle dynamics model for trajectory tracking control. Proc. Inst. Mech. Eng. Part D-J. Automob. Eng. 2023, 237, 1695–1709. [Google Scholar] [CrossRef]
  11. Li, J.; Zhou, F.; Zhang, A.; Sun, Y.; Lei, Z.; Zhu, J. Accurate Finite Element Modeling and Validity Analysis of Thread Structure. Adv. Eng. Sci. 2022, 54, 220–229. [Google Scholar]
  12. Ma, Z.; Zhang, Z.L.; Zhang, Z.H.; Song, Z.Q.; Liu, Y.B.; Li, Y.M.; Xu, L.Z. Durable Testing and Analysis of a Cleaning Sieve Based on Vibration and Strain Signals. Agriculture 2023, 13, 2232. [Google Scholar] [CrossRef]
  13. Zhang, X.; Wen, Z.; Zhang, Z.; Sun, Z.; Zhang, H.; Liu, J. Design and Test of Automatic Rubber-tapping Device with Spiral Movement. Trans. Chin. Soc. Agric. Mach. 2023, 54, 169–179. [Google Scholar]
  14. Teng, S.; Wang, Y.; Wei, X.; Du, D. Optimization of forming process for bracket welded parts based on star point design and response surface method. J. Plast. Eng. 2024, 31, 50–59. [Google Scholar]
  15. Wang, Y.; Li, H.; Jiang, W.; Wang, R.; Li, Y. Dynamic characteristics of an underframe inerter-based suspended equipment for high speed trains. J. Vib. Shock 2022, 41, 246–254. [Google Scholar]
  16. Wang, S.; Zhang, Q.; Shi, D.; Yin, C.; Li, C. Analysis of nonlinear vibration response characteristics of hybrid transmission system with dual-planetary gear sets. J. Jilin Univ. Eng. Technol. Ed. 2024, 54, 890–901. [Google Scholar]
  17. Du, W.; Li, W.; Jiang, S.; Sheng, L. Flexural-torsional coupled vibration analysis of shearer permanent magnet motor rotor system under load excitation. J. Vib. Shock 2023, 42, 237. [Google Scholar]
  18. Chen, X.; Peng, D.; Hou, Y.; Yang, L. Study on Torsional Vibration Active Control of Hybrid Electric Vehicle Transmission System in Pure Electric Mode. Mech. Sci. Technol. Aerosp. Eng. 2021, 40, 1114–1119. [Google Scholar]
  19. Ma, Q.J.; Wang, K.; Liu, H.L.; Cheng, Z.M. Influence of shaft combined misalignment on vibration and noise characteristics in a marine centrifugal pump. J. Low Freq. Noise Vib. Act. Control 2022, 41, 1286–1306. [Google Scholar] [CrossRef]
  20. Ren, N.; Qiu, Z.; Wang, Y.; He, K. Analysis of Acoustic Field Characteristics of Irregular Multi-inclinedWall Cavity Based on Analytical Method. Noise Vib. Control 2020, 40, 54. [Google Scholar]
  21. Feng, Q.; Yang, Z.; Guo, W.; Lu, J.; Liang, Y.; Lei, X. Analysis of vertical vibration band gap characteristics of periodic discrete support rail. Sci. Sin. Technol. 2020, 50, 1563–1576. [Google Scholar]
  22. Li, L.; Yue, C.; Fan, J.; Zhou, S. Research on Multi-Axial Excitation Test System and Assembly Deviation Identification of Aero-Engine. Aeronaut. Manuf. Technol. 2022, 65, 86–91. [Google Scholar]
  23. Hu, S.; Dong, L.; Zhu, J.; Chen, Y.; Cheng, M. Experimental study on typical faults recurrence in vertical centrifugal pump. J. Drain. Irrig. Mach. Eng. 2024, 42, 563–569. [Google Scholar]
  24. Zhao, B.; Liu, Q.; Fu, Y.; Zhao, Y.; Liao, W.; Xie, Y. Boundary vorticity flux prediction of the centrifugal pump impeller based on artificial neural network. J. Drain. Irrig. Mach. Eng. 2020, 38, 127–132. [Google Scholar]
  25. Yu, W.; Wang, T.; Deng, S.; Lu, M.; Lu, G.; Yang, D. Bolt Connection State Monitoring Method Based on Fiber Grating Bolt Loosening Angle Measurement. Chin. J. Sens. Actuators 2023, 36, 549–554. [Google Scholar]
  26. Ma, Z.; Li, B.; Song, Z.; Liu, Y.; Pan, Y. Lightweight Design and Test of Cleaning Sieve for Combine Harvester. Trans. Chin. Soc. Agric. Mach. 2024, 55, 201–211. [Google Scholar]
  27. Xu, Z.; Wang, C.; Bai, B.; Tu, Y.; Yu, X.; Jia, J. Study of Two Types of Fiber Bragg Grating Strain Sensors Packaged Using Adhesive for Monitoring of Bolt Load in Flange Joints. Intstrument Tech. Sens. 2022, 13, 13–19+24. [Google Scholar]
  28. Shen, C.; Jin, K.; Zhu, Y.; Hu, Z.; Guo, E. Influence of sensor volume on vortex precession flowmeter based on CFD. J. Drain. Irrig. Mach. Eng. 2024, 42, 895–899. [Google Scholar]
  29. Wang, C.; Wang, G.; Wang, K. Design and Application of Real-time Monitoring System for Load of Cutter Replacement Device under Atmospheric Pressure of Extra-Large Diameter Slurry Shield. Tunn. Constr. 2021, 41, 1404–1411. [Google Scholar]
  30. Wang, X.; Chen, Y.; Zhao, G.; Han, Q. Bolts Tightening Technology of Angle-Steel Tower. Trans. Beijing Inst. Technol. 2024, 44, 395–402. [Google Scholar]
  31. Cai, Y.; Lu, Z.; Li, Y.; Chen, L.; Wang, H. Tightly Coupled SLAM System Based on Multi-Sensor Fusion. Automot. Eng. 2022, 44, 350–361. [Google Scholar]
  32. Wang, W.; Li, J.; Li, Y.; Wang, Y.; Hua, X.; Ma, Y.; Li, T. On-line alignment method for large-scale thin-walled case based on the laser rapid measurement. J. Solid Rocket Technol. 2020, 43, 237–242. [Google Scholar]
  33. Wen, H.; Tang, Y.; Tang, L. Program design of pump experiment non-collected data display based on LabVIEW. J. Drain. Irrig. Mach. Eng. 2021, 39, 128–131. [Google Scholar]
  34. Ge, X.; Zhang, J.; Zhu, S.; Qian, J.; Zhao, L.; Zheng, S.; Zheng, Y.; Xu, X.; Binama, M. Stress characteristics of top cover bolts of hydraulic turbine. J. Vib. Shock 2021, 40, 55–62. [Google Scholar]
  35. Li, S.; Liu, Y.; Lin, Z.; Shutin, D.; Luo, Y. Rotor vibration signal recognition method based on coupling source error analysis. Chin. J. Sci. Instrum. 2023, 44, 75–83. [Google Scholar]
  36. Tang, D.; Li, T.; Shi, S. Research on Fault Diagnosis Strategy of Diesel Particulate Filter Coupled with Particle Sensor. J. Xi’an Jiaotong Univ. 2023, 57, 87–97. [Google Scholar]
  37. Zhu, L.; Liang, H.; Zhang, H.; Shi, J.; Hong, J. Contact Performance Model for Bolted Joint Interfaces Considering Macro-Micro Morphology. J. Xi’an Jiaotong Univ. 2024, 58, 148–159. [Google Scholar]
  38. Yang, S.; Wang, X.; Gao, Y.; Chen, L.; Zhai, C.; Dou, H. Design of On-line Seed Spacing Monitoring and Miss Seeding Warning System for Maize Precision Planting. Trans. Chin. Soc. Agric. Mach. 2021, 52, 17. [Google Scholar]
  39. Wu, J.; Shao, J.; Zhou, G.; Yang, D.; Cheng, Y. Detecting Method for Bolt Looseness with Average Vibration Response Energy. Mech. Sci. Technol. Aerosp. Eng. 2022, 41, 992–997. [Google Scholar]
  40. Tao, H.; He, G.; Yang, J.; Ai, P. Status identification of transmission tower bolts based on MIMU. J. Vib. Shock 2023, 42, 98–104. [Google Scholar]
  41. Wang, S.; Kong, Q.; Zhou, Y. Percussion-based bolt loosening detection method in a single-row multi-bolted steel beam-column joint. J. Earthq. Eng. Eng. Vib. 2024, 44, 95–103. [Google Scholar]
  42. Wan, Y.; Xue, J.; Zhang, D.; Han, X.; Lyu, J.; Miao, W. Research on bolts fault diagnosis of diaphragm compressor cylinder head in nuclear power plant based on KPCA. Fluid Mach. 2024, 52, 87–96. [Google Scholar]
  43. Chen, P.; Shang, Q.; Yu, X.; Yin, A. Ultrasonic multi-feature fusion bolt stress measurement method based on ELM. Chin. J. Sci. Instrum. 2024, 45, 46–56. [Google Scholar]
  44. Liang, J.; Ge, J.; Song, J.; Xu, Y.; Liu, H.; Zhong, L.; Liu, Q. Looseness detection method of gas insulated switchgear basin insulator bolts based on convolutional neural network. J. Appl. Acoust. 2023, 42, 566–576. [Google Scholar]
  45. Ge, J.; Wang, W.; Song, J.; Jiao, G.; Li, P.; Gao, J.; Ren, H. Detection on Looseness of Flange Bolt of Insulating Spacer Based on Critical Refraction Longitudinal Wave Method. High Volt. Appar. 2024, 60, 165–172. [Google Scholar]
  46. Sun, W.; Guan, Z.; Pan, J.; Zeng, Y. Dynamic response analysis of rocket connection structure considering discrepancy of bolt preloads. J. Natl. Univ. Def. Technol. 2024, 46, 59–69. [Google Scholar]
  47. Sun, A.; Liu, B.; Hu, X. Bolt Loosening Anomaly Detection Method of Solid Motor Vibration Test. Instrum. Tech. Sens. 2024, 12, 112–119. [Google Scholar]
  48. Jiang, G.; Lu, L.; Zhang, M.; Zeng, D. Study on the characteristic parameters of the loosening of bolt-fastened structures under transverse load. J. Railw. Sci. Eng. 2024, 21, 3310–3320. [Google Scholar]
  49. Zeng, F.; Liu, X.; Wang, T.; Deng, S.; Yu, W. Bolt-loosening visual detection based on curvature change of elastic line between bolts. Transducer Microsyst. Technol. 2023, 42, 131–134. [Google Scholar]
  50. Wang, Z.; Gu, F.; Zeng, Z. Research on the Detection Method of Loose Roof Bolts of Low-quality Rail Vehicles. Mach. Des. Res. 2024, 40, 220–224. [Google Scholar]
  51. Zhou, J.; Liu, Y.; Huo, L. Machine Vision-Based Rotation Angle Measurement of Bolt Looseness. Mach. Des. Res. 2021, 37, 159. [Google Scholar]
  52. GB/T 16823.2-1997; General Rules of Tightening for Threaded Fasteners. China Machinery Industry Federation: Beijing, China, 2017.
Figure 1. The bolted connection structure of the conveying tank and the cutter table is loaded.
Agriculture 15 00704 g001
Figure 2. The bolt connection structure of the delivery tank and the threshing rack is loaded.
Agriculture 15 00704 g002
Figure 3. Simplified model of the bolting connection between the conveyor tank and the cutting table.
Agriculture 15 00704 g003
Figure 4. Simplified model of bolt connection structure of the delivery tank and threshing rack.
Agriculture 15 00704 g004
Figure 5. Statistical parameters of approximate 3D design software.
Agriculture 15 00704 g005
Figure 6. Statistical parameters of the conveyor tank with rough 3D design software.
Agriculture 15 00704 g006
Figure 7. The bolt model mesh division of the conveying tank and the header.
Agriculture 15 00704 g007
Figure 8. Grid division of conveying tank and threshing rack bolt structure model.
Agriculture 15 00704 g008
Figure 9. The Wheatstone bridge circuit of the pressure sensor.
Agriculture 15 00704 g009
Figure 10. Bolt structure pretightening force analog acquisition circuit.
Agriculture 15 00704 g010
Figure 11. Preliminary development circuit for bolt structure looseness dynamics monitoring device. (a) External crystal oscillator circuit. (b) Power supply and filtering circuit. (c) Mode selection circuit. (d) Main control center.
Agriculture 15 00704 g011
Figure 12. Power management circuit for bolt structure looseness dynamics monitoring device.
Agriculture 15 00704 g012
Figure 13. Step-down circuit for the monitoring end of the monitoring device.
Agriculture 15 00704 g013
Figure 14. ADC acquisition circuit for the monitoring device.
Agriculture 15 00704 g014
Figure 15. Wireless transmitting circuit of the monitoring device. (a) Reserved port for the monitoring end. (b) Wireless transmission circuit for the monitoring end.
Agriculture 15 00704 g015
Figure 16. Wireless receiving circuit of the monitoring device.
Agriculture 15 00704 g016
Figure 17. Multi-sensor monitoring switching circuit.
Agriculture 15 00704 g017
Figure 18. Graphical user interface (GUI) of the monitoring system host software. (a) Sensor transmitting circuit, (b) Data receiver, (c) Host program.
Agriculture 15 00704 g018
Figure 19. Calibration test of sensor universal mechanical testing machine.
Agriculture 15 00704 g019
Figure 20. Test parameter settings.
Agriculture 15 00704 g020
Figure 21. Test control settings.
Agriculture 15 00704 g021
Figure 22. Sensor pre-tension monitoring bolt structure loosening test. (a) Torque wrench, (b) Installation diagram, (c) Torque angle gauge.
Agriculture 15 00704 g022
Figure 23. Stress and strain results of bolted connection structure of cutting table and conveying trough. (a) Stress of bolted connection structure. (b) Strain of bolted connection structure.
Agriculture 15 00704 g023
Figure 24. Stress and strain results of bolted connection structure of conveying trough and threshing frame. (a) Stress of bolted connection structure. (b) Strain of bolted connection structure.
Agriculture 15 00704 g024
Figure 25. Diagram of the sensor calibration test 1 data. (a) Simulated volume change curve. (b) Force change curve. (c) Force displacement curve. (d) Force-displacement change curve.
Agriculture 15 00704 g025
Figure 26. Simulated volume—force alignment and fitting.
Agriculture 15 00704 g026
Figure 27. Simulated volume—displacement alignment and fitting.
Agriculture 15 00704 g027
Figure 28. Fitting result of simulated volume—force I.
Agriculture 15 00704 g028
Figure 29. Fitting result of simulated volume—displacement I.
Agriculture 15 00704 g029
Figure 30. Simulated volume—pressure fitting residual plot.
Agriculture 15 00704 g030
Figure 31. Simulated volume—displacement fitting residual plot.
Agriculture 15 00704 g031
Figure 32. Diagram of the sensor calibration test 2 data. (a) Simulated volume change curve. (b) Force change curve. (c) Force displacement curve. (d) Force-displacement change curve.
Agriculture 15 00704 g032
Figure 33. Fitting result of simulated volume—force II.
Agriculture 15 00704 g033
Figure 34. Fitting result of simulated volume—displacement II.
Agriculture 15 00704 g034
Figure 35. Simulation quantity—pressure fitting result.
Agriculture 15 00704 g035
Figure 36. Simulation quantity—pressure fitting result.
Agriculture 15 00704 g036
Figure 37. The relationship curve between tightening torque and time.
Agriculture 15 00704 g037
Figure 38. The relationship curve between tightening angle and time.
Agriculture 15 00704 g038
Figure 39. Sensor test simulated quantity variation curve. (a) Simulated quantity variation curve. (b) Simulated quantity fitting curve.
Agriculture 15 00704 g039
Figure 40. Bolt structure pre-tightening state simulated quantity—tightening angle, tightening torque relationship curve. (a) Simulated quantity and tightening torque fitting relationship. (b) Simulated quantity and tightening angle fitting relationship.
Agriculture 15 00704 g040
Figure 41. Performance test of bolt pre-tightening condition monitoring system.
Agriculture 15 00704 g041
Table 1. Bolted connection structural mechanical change model material properties.
Structure( Density   kg / m 3 )( Young   Modulus   kg / m 3 )Poisson Ratio( Yield   Strength   MPa )( Tensile   Strength   MPa )
Bolts78502100.3640800
Other7.8502100.3370630
Table 2. Primary specifications of the UTM5305 300 kN universal testing machine (Shenzhen, Guangdong, China).
OrderQualification SpecificationsOrderQualification Specifications
1Measuring force range0~300 kN6Displacement errorWithin ±0.5% of indicated value
2Accuracy class0.57Displacement resolution0.04 μm
3Relative error of reading0.4~100%f.s.8Deformation measurement range0.2~100%f.s. (Full scale)
4Test force errorWithin ±0.5% of indicated value9Deformation errorWithin ±0.5% of indicated value
9Test force resolution1/1,000,000 (No grading throughout the range)
Table 3. WT9-85 model torque wrench performance parameters.
Parameter NameValueUnitParameter NameValueUnit
Torque Range8.5~85N·mWorking Temperature−10~50°C
Resolution0.01N·mAccuracy±3% (Clockwise),
±4% (Counterclockwise)
Square Drive Size3/8 in Unit Conversion N m , ft lb , in lb , kgf cm
(Four unit conversions)
Total Length271 mm Data StorageCan store 50 sets of torque data
Weight0.52 kg Operating DirectionBidirectional operation
Disclaimer/Publisher’s Note: The statements, opinions and data contained in all publications are solely those of the individual author(s) and contributor(s) and not of MDPI and/or the editor(s). MDPI and/or the editor(s) disclaim responsibility for any injury to people or property resulting from any ideas, methods, instructions or products referred to in the content.

