Article

Physiological and Ecological Responses of Anoectochilus formosanus to Different Light Intensities

1
Mechanical and Electrical Engineering Institute, Zhongkai University of Agricultural and Engineering, Guangzhou 510550, China
2
United Graduate School of Agriculture, Tokyo University of Agriculture and Technology, 3-8-1, Fuchu 183-0054, Japan
3
College of Engneering, South China Agricultural University, Guangzhou 510642, China
*
Author to whom correspondence should be addressed.
Agriculture 2025, 15(7), 705; https://doi.org/10.3390/agriculture15070705
Submission received: 16 February 2025 / Revised: 12 March 2025 / Accepted: 16 March 2025 / Published: 26 March 2025
(This article belongs to the Section Crop Production)

Abstract

:
Anoectochilus formosanus is a rare medicinal plant with anti-inflammatory, antioxidant, hepatoprotective, and immunomodulatory properties. Its morphological growth and accumulation of medicinal compounds are strongly influenced by environmental factors such as light intensity. To investigate the physiological and ecological responses of Anoectochilus formosanus to varying light intensities, we examined physiological, morphological, and growth parameters across different growth stages under five different light intensities. Correlation, plasticity, and principal component analysis (PCA) were performed. The results showed that high and low light intensities altered physiological and biochemical indicators at different stages. Leaf area, fresh weight, dry weight, stem thickness, and non-photochemical quenching (NPQ) increased with increasing light intensity, whereas chlorophyll fluorescence parameters (Fv, Fm, and Fv/Fm) and flavonoid content decreased, reflecting reduced light capture and consumption under high light intensities. The phenotypic plasticity index of the morphological traits (<0.5) was lower than that of the photosynthetic physiological parameters (>0.5), indicating a greater plasticity of the photosynthetic traits. Biomass indicators—leaf area ratio and relative growth rate—were strongly correlated, driving the response to light intensity. Growth and biomass allocation peaked at moderate light intensity (70 μmol·m−2·s−1). These findings highlight the conservative strategy employed by A. formosanus for slow carbon use under low-light conditions, and the adventurous strategy employed for rapid carbon use under strong light, offering insights into efficient cultivation practices.

1. Introduction

Light plays a significant role in plant growth, as it provides the energy source for photosynthesis. In the natural world, alternating cycles of day and night as well as seasonal changes cause fluctuations in light intensity. To achieve optimal growth, plants rapidly respond to highly heterogeneous light intensities by continuously adjusting processes such as morphological development, photosynthetic physiology, and biomass production and distribution [1,2,3] to achieve optimal growth. Therefore, we investigated the physiological processes and regulatory mechanisms of plant responses to light intensity, which are of crucial importance in plant science.
Phenotypic plasticity is a critical mechanism by which plants adapt to heterogeneous light environments without genetic variation [4] (Pearcy 2007). Relevant studies have shown that, in most crops, under bright-light conditions, plants reduce light absorption by decreasing shoot morphological features such as individual leaf area and leaf number [5,6,7]. Under low-light conditions, plants can enhance light absorption and utilization by increasing their chlorophyll content, apparent quantum efficiency, the actual photochemical quantum yield of photosystem II (PSII), and their electron transfer rate, while reducing energy waste by lowering their light compensation point and dark respiration, photorespiration, and heat dissipation rates [8,9]. These adaptive strategies highlight the significance of light-responsive mechanisms in plant survival and growth. In addition, the regulation of light intensity in the shoot parts of plants influences carbon acquisition, thereby adjusting the accumulation of root biomass and enabling better adaptation to changes in the aboveground light environment. Moreover, plants respond to light by adjusting their accumulation and distribution of biomass, leaf area ratio, specific leaf area, and other parameters to alter relative growth rates, which is another important strategy used to respond to light conditions.
Anoectochilus formosanus is a rare medicinal plant with significant economic and medicinal value, and is commonly used to treat hyperglycemia, tumors, immune system disorders, vascular inflammation, and diabetes. Its growth and accumulation of secondary metabolites are greatly influenced by environmental factors, particularly light conditions. However, wild A. formosanus resources are facing extinction owing to overexploitation, low seed germination rates, slow growth rates, specific growth conditions, and increasingly severe environmental stressors. In its natural habitat, A. formosanus typically grows in low-light environments under forest canopies, which makes it highly sensitive to changes in light intensity. Simulating the growth environment of A. formosanus through artificial cultivation is an effective way of meeting market demand and preventing the extinction of wild resources. In recent years, several studies have investigated the effects of artificial light on the growth, photosynthetic capacity, and accumulation of metabolites in A. formosanus [10,11,12,13,14]. However, previous research has mainly focused on studying specific aspects of the morphological, physiological, and growth characteristics of A. formosanus under different light intensities. A significant gap remains in our understanding of the comprehensive mechanisms underlying its long-term adaptation to changing light environments. Additionally, the cumulative effects of prolonged exposure to different light conditions on its overall fitness, stress tolerance, and medicinal quality are yet to be fully elucidated. Addressing these gaps is crucial for obtaining a holistic understanding of how A. formosanus adapts to light variations and optimizes its cultivation in controlled environments.
Different light intensities not only affect photosynthetic efficiency but may also regulate stomatal opening and closing, hormone synthesis, and the accumulation of secondary metabolites. Therefore, in this study, we employed A. formosanus plants as the experimental materials to establish a series of growth environments with different light intensities (30, 50, 70, 90, and 110 μmol·m−2·s−1) in order to analyze the associated morphological characteristics, biomass accumulation and distribution, and photosynthetic physiological characteristics of A. formosanus. Furthermore, correlation, plasticity, and principal component analyses were performed to elucidate the response strategies of A. formosanus under different light environments. The primary aim of the present study was to provide a comprehensive understanding of how A. formosanus adapts to varying light conditions, thereby offering a theoretical foundation for its artificial high-quality and efficient cultivation. This research also aims to support conservation efforts and the sustainable utilization of this valuable medicinal plant by optimizing its growth conditions and enhancing its medicinal properties.

2. Materials and Methods

2.1. Plant Materials and Light Treatments

The experiment was conducted in an artificial climate chamber at Zhongkai University of Agriculture and Engineering in Guangzhou, China. Tissue-cultured plantlets of A. formosanus with a growth period of 6 months were selected to analyze their phenotypic response to growth conditions. Before the experiment, A. formosanus tissue-cultured plantlets were acclimated in a climate chamber for two weeks. Seedlings of similar height and good growth were selected for transplantation. The cultivation substrate was prepared by mixing peat soil, bark, and vermiculite at a ratio of 3:2:1. The temperature in the climate chamber was maintained at 25 ± 2.0 °C, and the relative humidity was set at 70 ± 5%. Standardized fertilization and irrigation management were also conducted.
An LED plant lighting system was used to conduct the light treatments. The light conditions for A. formosanus growth were set at a light quality of R1B1 (ratio of red light to blue light is 1:1), a photoperiod of 12 h per day, and five different light intensities: 30, 50, 70, 90, and 110 μmol·m−2·s−1. Light intensity was measured using a spectrophotometer (LI-180, LI-COR, Lincoln, NE, USA). Each treatment consisted of 45 plants, and the experiment was repeated three times. To minimize the edge effects caused by uneven lighting, the plant trays were rotated every 14 days to exchange their positions. Samples were collected for various physiological analyses. Each treatment was replicated at least five times, and samples were collected once per month.

2.2. Plant and Stomatal Morphology

For each treatment, ten plants were selected to measure plant height, stem diameter, stem number, leaf number, leaf area, root length, fresh weight, dry weight, dry weight ratio, shoot fresh weight, root fresh weight, and root–crown ratio. Root parameters were measured using a root scanner (GXY-A, TOP Instrument, Hangzhou, China). Image-Pro Plus software (version 6.0) was used to conduct the leaf area analysis. Stomatal parameters were obtained using scanning electron microscopy (SEM). Small leaf samples (approximately 2 mm × 5 mm) were collected and immediately immersed in a 3% glutaraldehyde solution buffered with 0.05 M sodium cacodylate buffer (pH 7.2) and then fixed in 1% osmium tetroxide. The samples were examined using a KYKY-EM3200 scanning electron microscope (KYKY Technology Development Co., Ltd., Beijing, China) [15].

2.3. Chlorophyll Content

The second and third fully expanded leaves of each plant were collected, and 0.3 g leaf fragments were used to determine the chlorophyll A, chlorophyll B, carotenoid, and total chlorophyll contents. Chlorophyll was extracted by grinding the leaves in 80% acetone in the dark at 25 °C. A UV–visible spectrophotometer (UV-1800, Shimadzu, Kyoto, Japan) was employed to measure the relevant parameters. The chlorophyll concentrations were calculated using the equation described by Porra and expressed as mg-1FW [16].

2.4. Chlorophyll Fluorescence Parameters

The chlorophyll fluorescence parameters were measured using a portable photosynthesis system (LI-6800, LI-COR, Lincoln, NE, USA). The minimum initial fluorescence (Fo), maximum fluorescence in the dark-adapted state (Fm), difference between Fm and Fo (Fv), and maximum photochemical quantum yield of PSII (Fv/Fm) were measured between 04:00 and 06:00. Parameters such as the electron transport rate (ETR), non-photochemical quenching (NPQ), maximum quantum efficiency of PSII open centers when thermal dissipation was present (Fv/Fm), and photochemical fluorescence quenching coefficient (qP) were measured in fully light-adapted plants from 8:00 to 11:00.

2.5. Measurement of Polysaccharide and Flavonoid Contents

To measure their flavonoid contents, samples were dried and ground into powders, then mixed with anhydrous ethanol (20 mL) and treated with ultrasound (temperature 80 °C) for 1.5 h to obtain flavonoid sample solutions. A suitable amount of quercetin standard was weighed and dissolved in anhydrous ethanol to obtain a standard solution with a mass concentration of 0.2 g/L. A standard curve was drawn using a previously described method [17], and the absorbance of the color-developed sample was measured.
To determine their polysaccharide contents, samples were dried, ground into powders, and sieved through a 40-mesh sieve. Samples of 0.5 g of powder were accurately weighed and added to a 10 mL volumetric flask to prepare the polysaccharide sample solutions. Anhydrous glucose was used as the standard to draw the curves. The samples were colored using the phenol–sulfuric acid method, and their absorbances were measured using a UV-1800 instrument.

2.6. Statistical Analysis

The Tukey–Kramer test was used for multiple comparisons. All data were organized using WPS Office (Excel), and statistical analyses and chart drawing were performed using IBM SPSS Statistics 26 and Origin 2018. Our principal component analysis methods were as follows: To optimize the indicators (including morphological characteristics, biomass, chemical composition, stomatal characteristics, and chlorophyll fluorescence parameters), IBM SPSS Statistics 26 software was used to perform factor analysis on the data. The factor analysis obtained the rotation component matrix and the component matrix. The indicators with a load number for each component in the rotation component matrix less than 0.4 were eliminated, and the indicators with loads greater than 0.6 in the component matrix were retained. The indicators were screened based on our experience in the field of Anoectochilus research; the remaining indicators were subjected to secondary factor analysis and indicator screening, and finally 17 indicators were selected as the indicator optimization results. The optimized indicators were subjected to principal component analysis.

3. Results

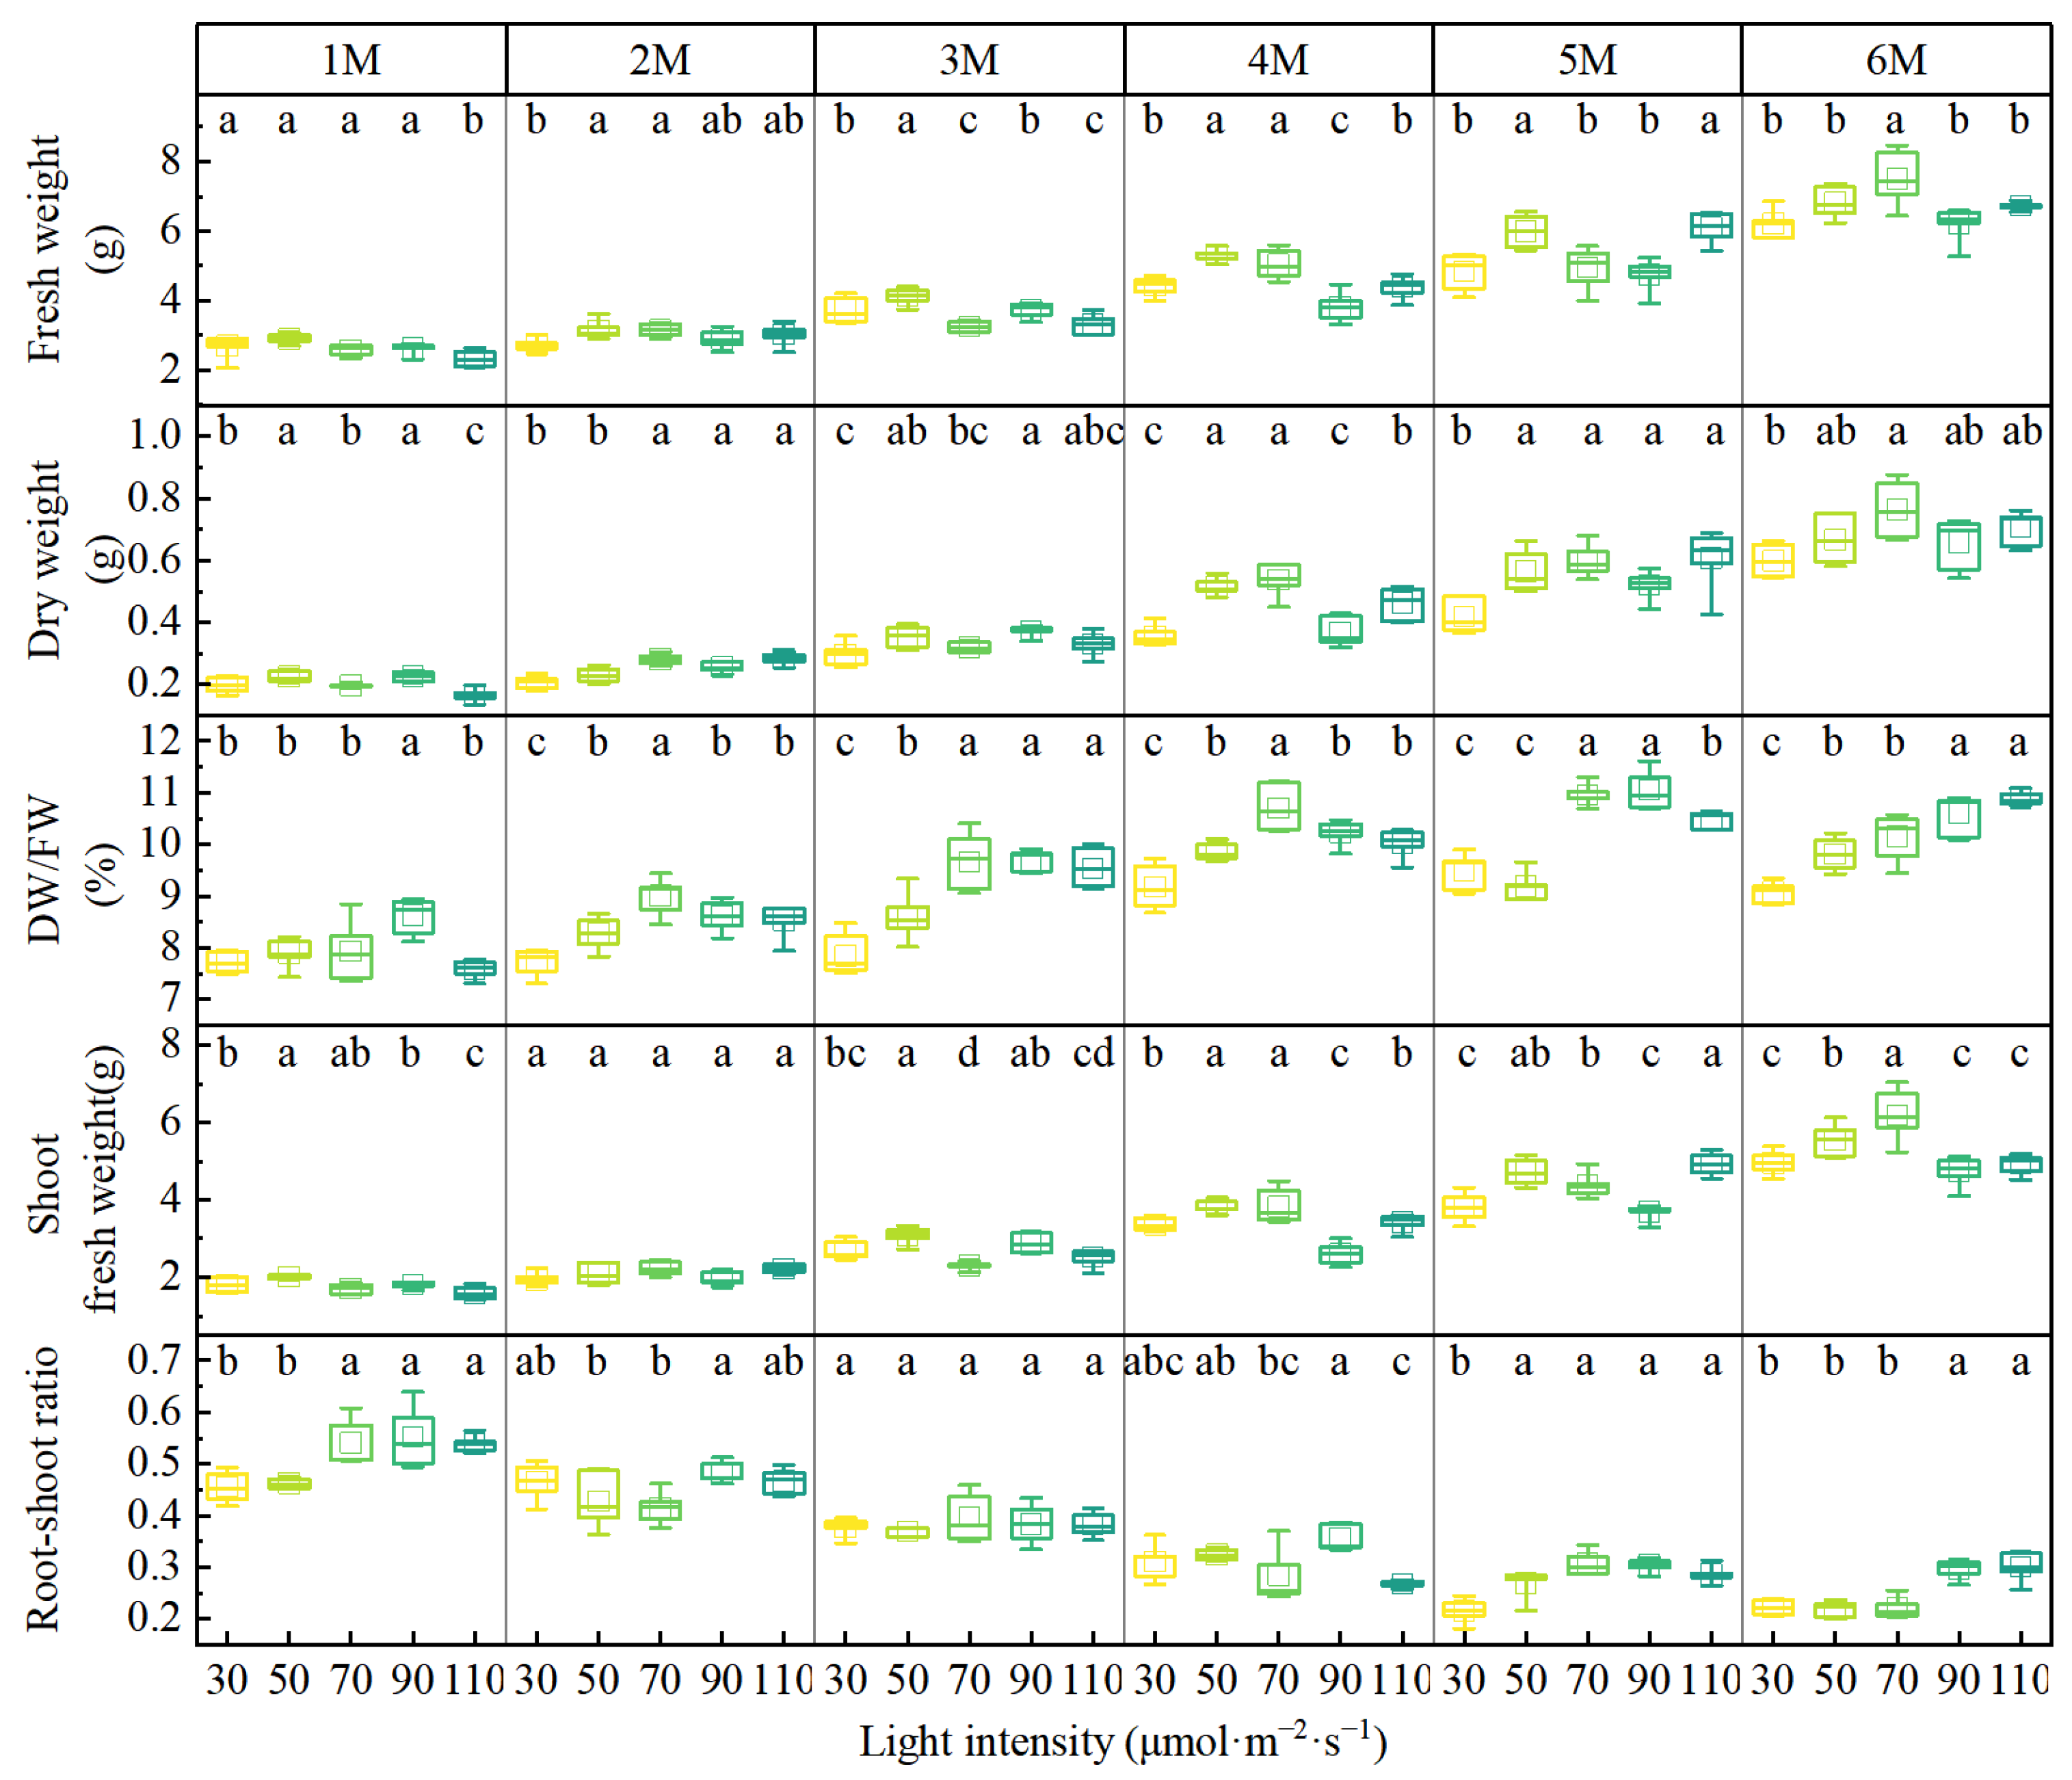
3.1. The Effects of Different Light Intensities on the Morphological Characteristics and Biomass Accumulation of A. formosanus

There were no significant differences in plant height, leaf area, number of leaves, fresh weight, or root–crown ratio under different light intensities in the seedlings at two months of age. After three months of age, plant height decreased with increasing light intensity and reached a maximum under the low-light-intensity treatment; therefore, light intensity significantly affected plant height (p < 0.05). The number of leaves, leaf area per plant, fresh weight, and shoot fresh weight showed similar trends, all reaching a maximum at a light intensity of 70 μmol·m−2·s−1. The increased drying rate and root–crown ratio in the high-light-intensity group were more obvious (Figure 1 and Figure 2). A comprehensive analysis of the effects of light intensity on A. formosanus’ morphological characteristics and biomass accumulation showed significant effects on plants after three months of cultivation, except for their dry weight and stem thickness.

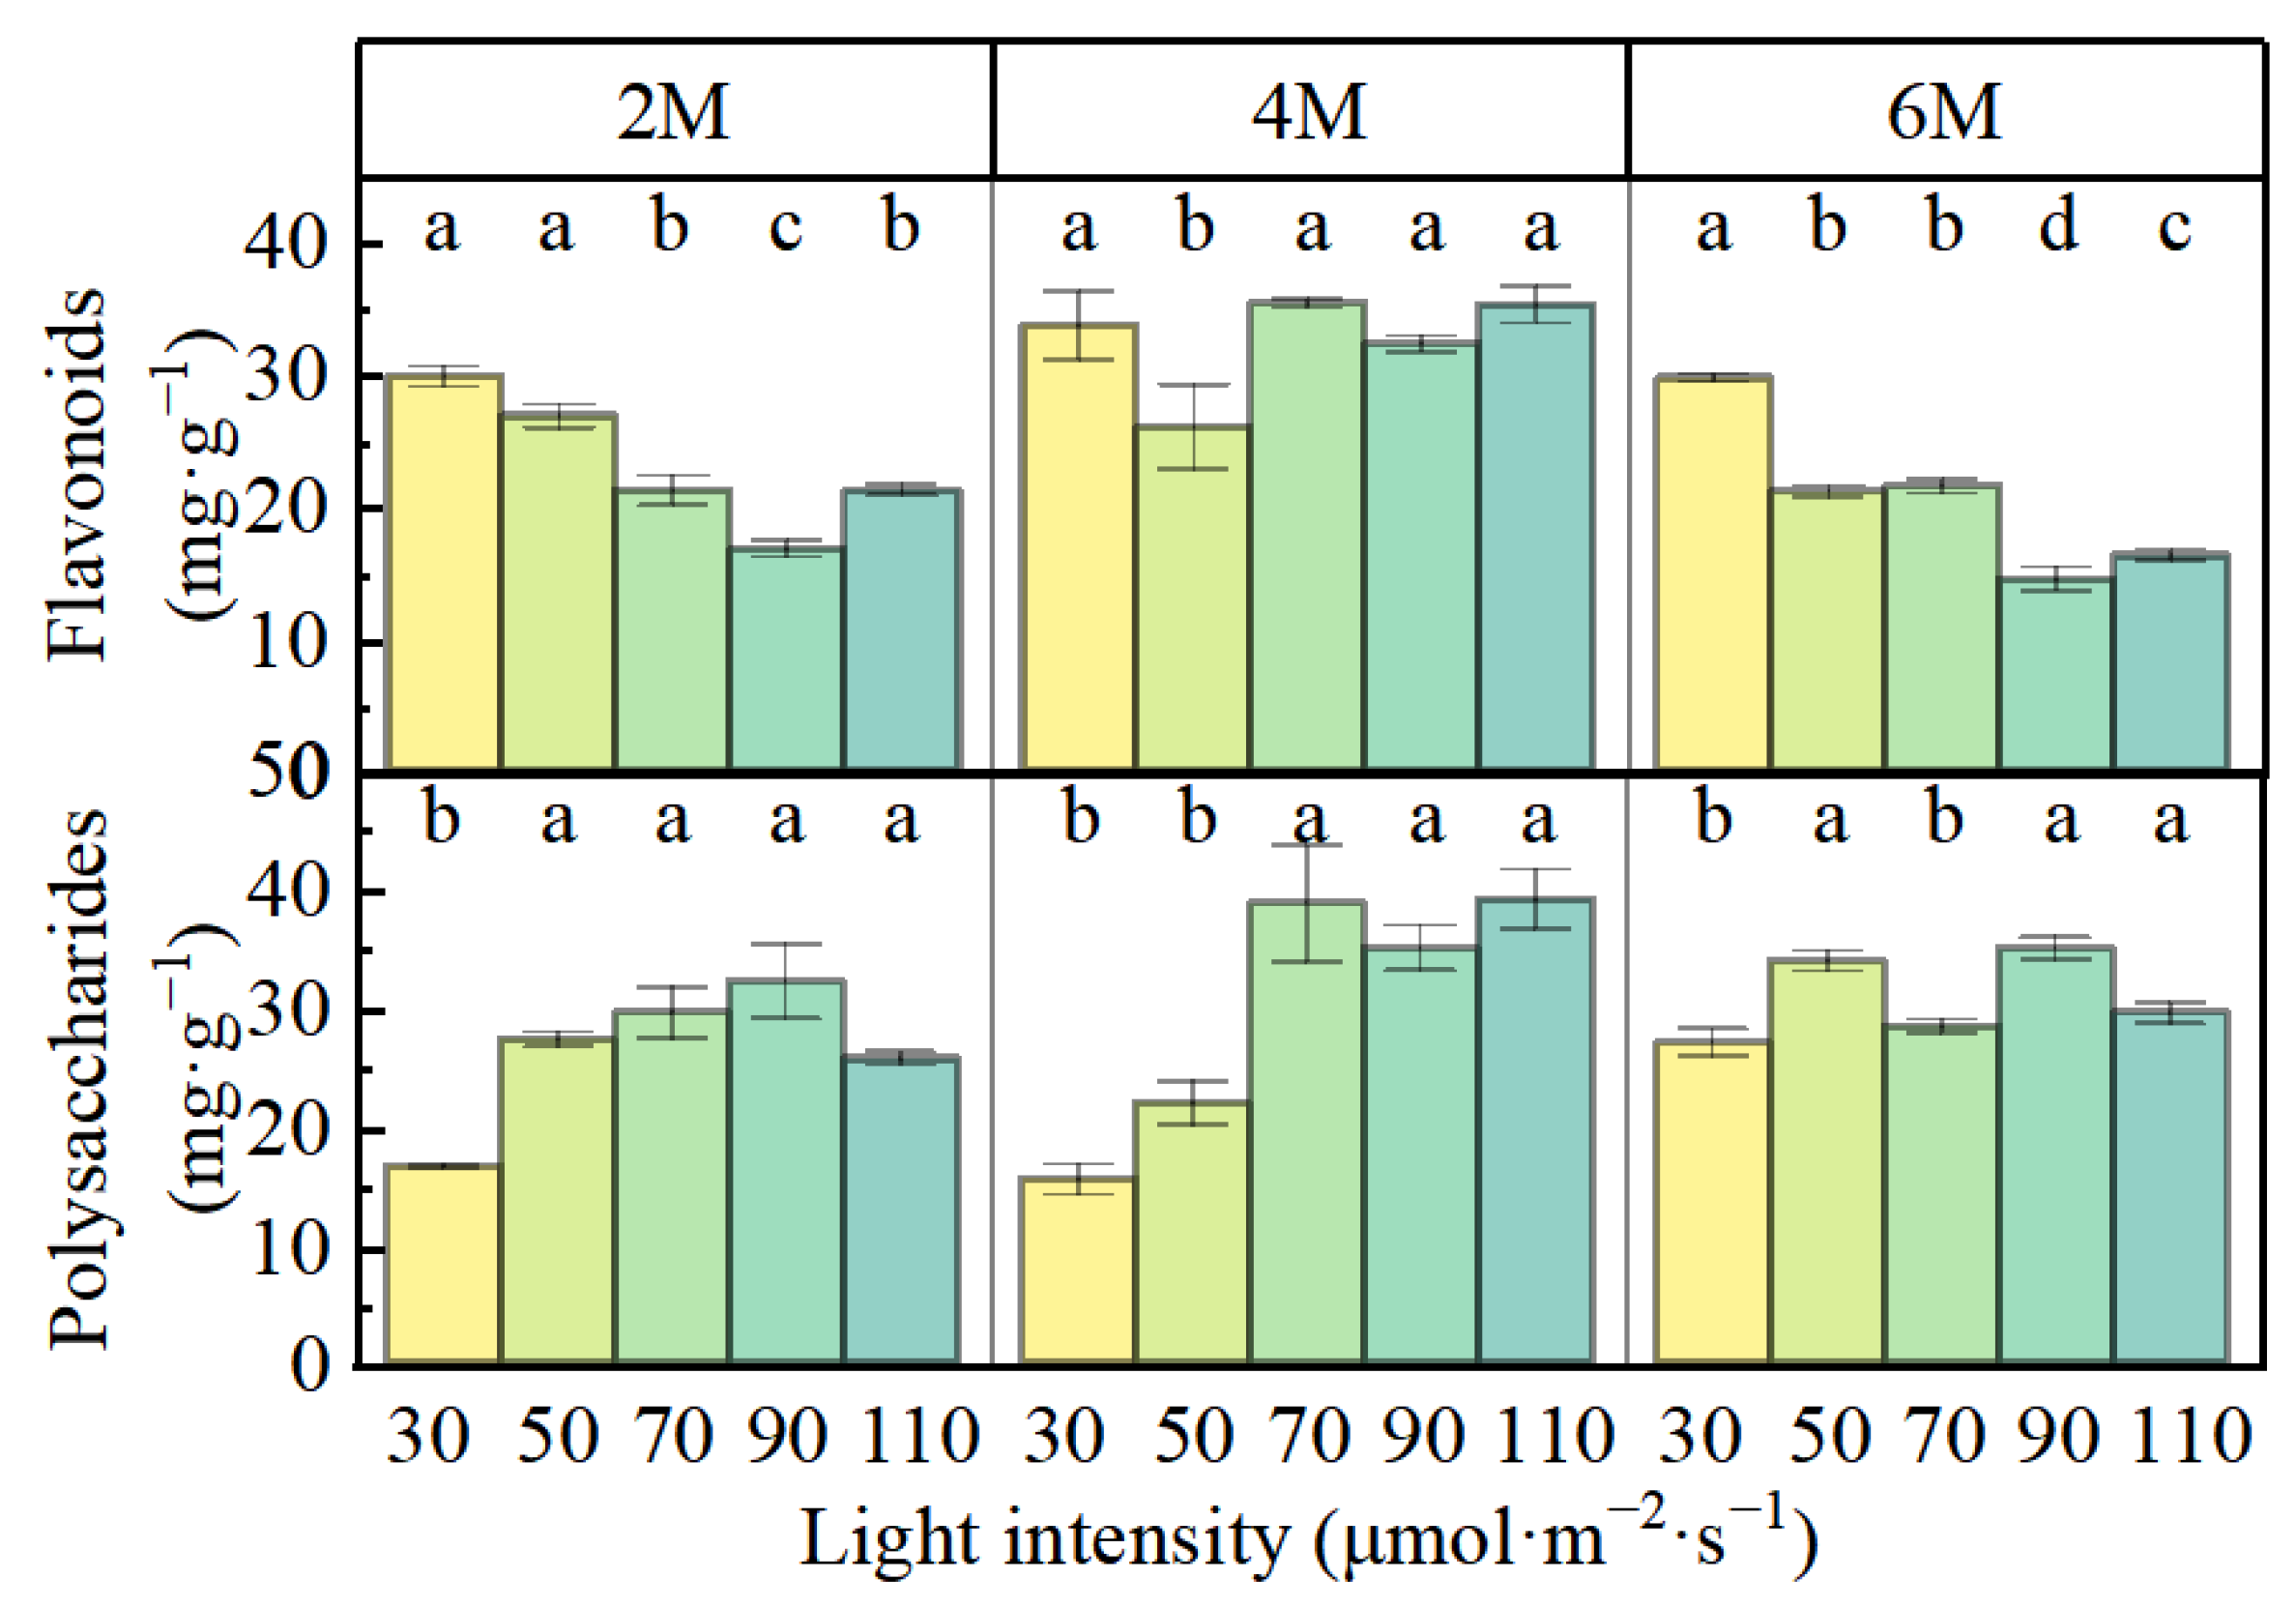
3.2. Flavonoid and Polysaccharide Contents

From February to April, the flavonoid contents in the 70, 90, and 110 μmol·m−2·s−1 light intensity groups showed significant changes, with increases of 66.48%, 84.01%, and 58.25%, respectively (Figure 3). However, from April to June, their flavonoid contents decreased.

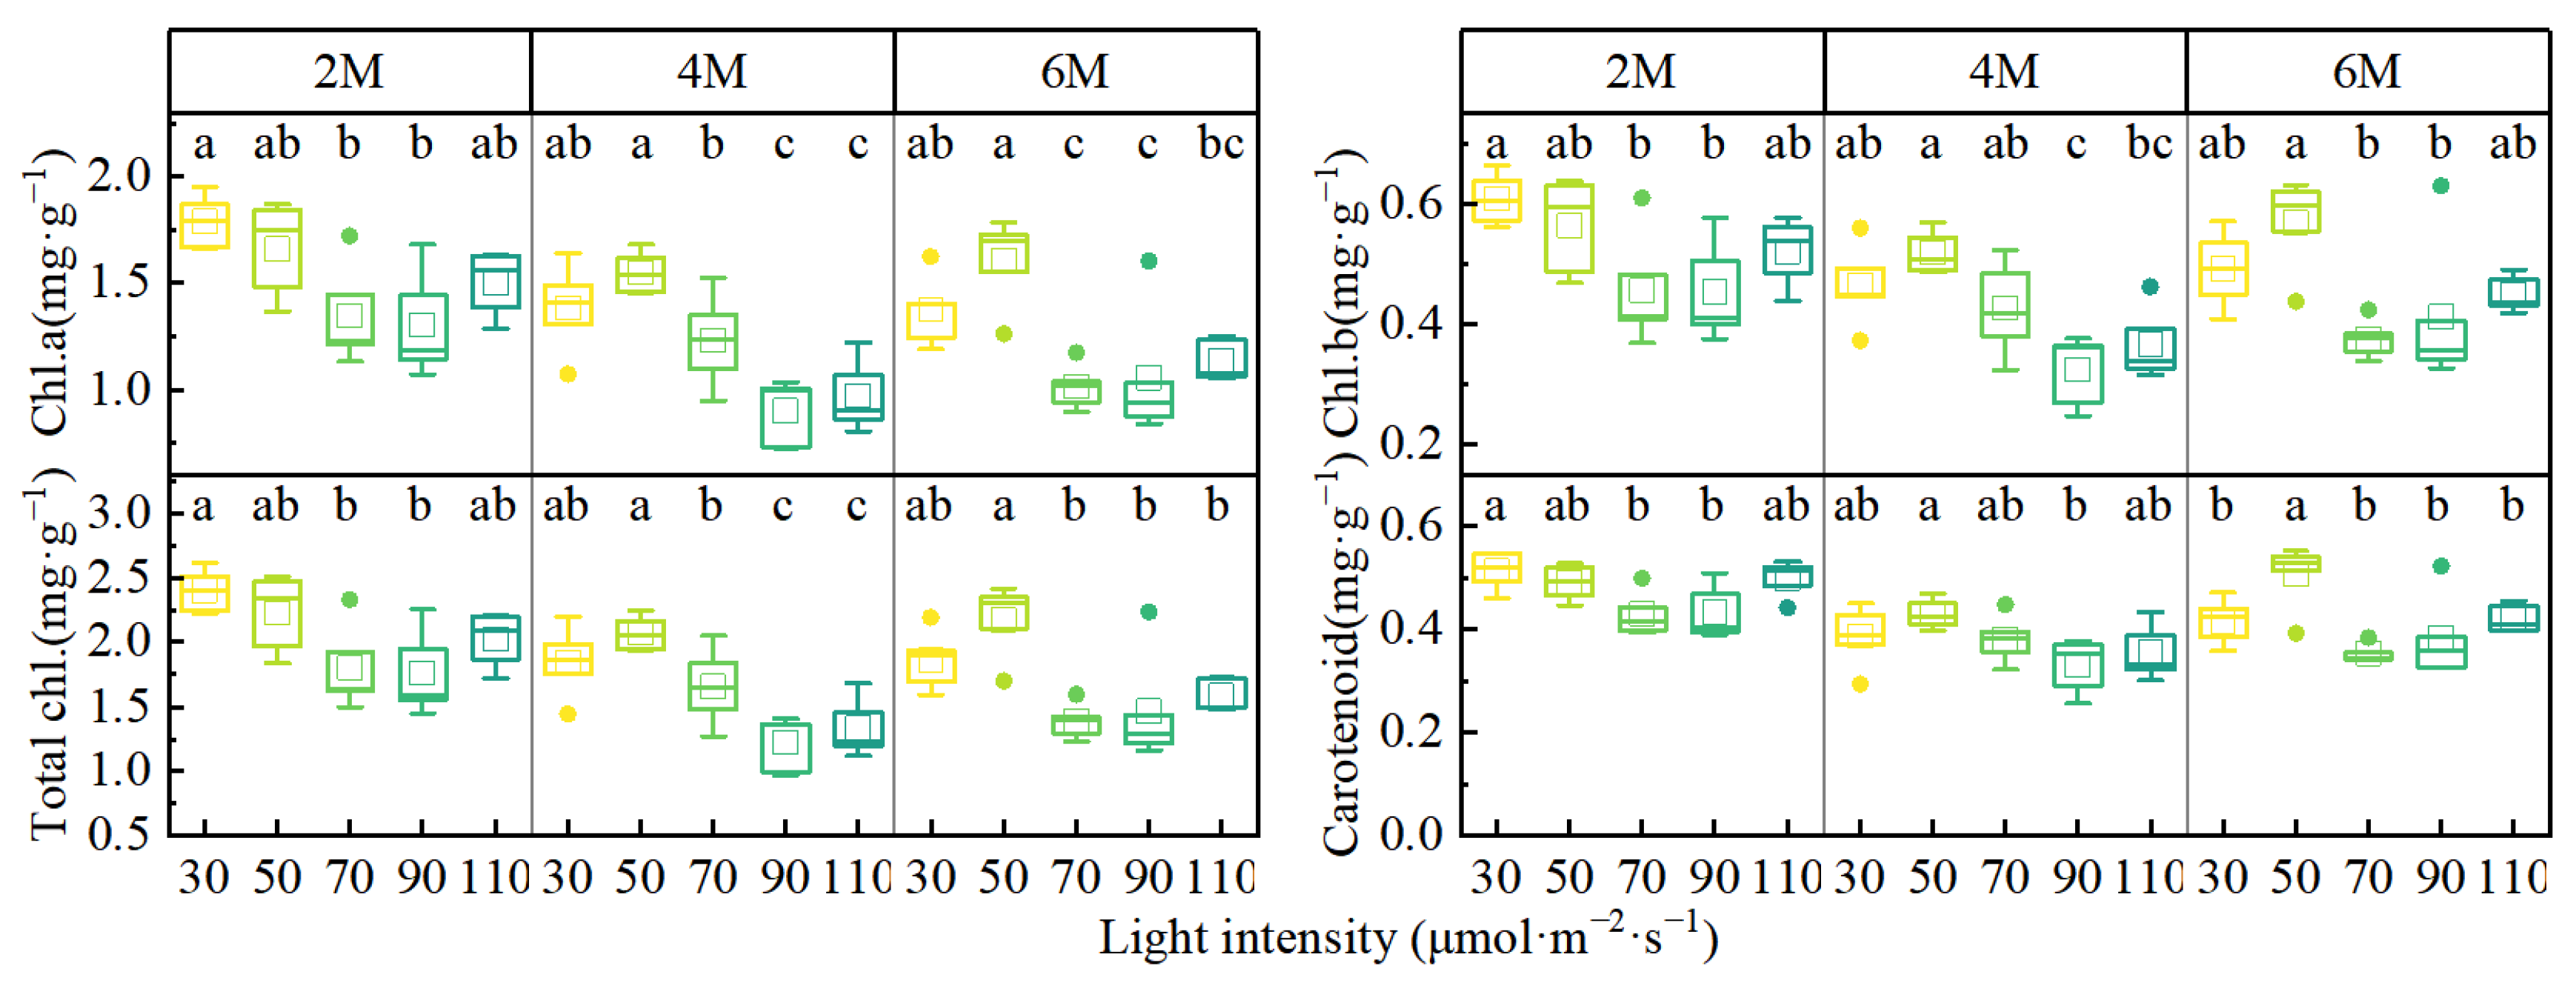
3.3. Chlorophyll Content

The results of three samplings consistently showed that a lower light intensity favored the synthesis of chlorophyll A, B, and the total chlorophyll content, with the optimal effect observed at a light intensity of 50 μmol·m−2·s−1. Carotenoid contents initially increased and then decreased with increasing light intensity. When the light intensity was approximately 90 μmol·m−2·s−1, the chlorophyll and carotenoid contents of the leaves were at their lowest. However, for the plants in the 110 μmol·m−2·s−1 group, the chlorophyll and carotenoid contents of the leaves were higher than in the 90 μmol·m−2·s−1 group (Figure 4).

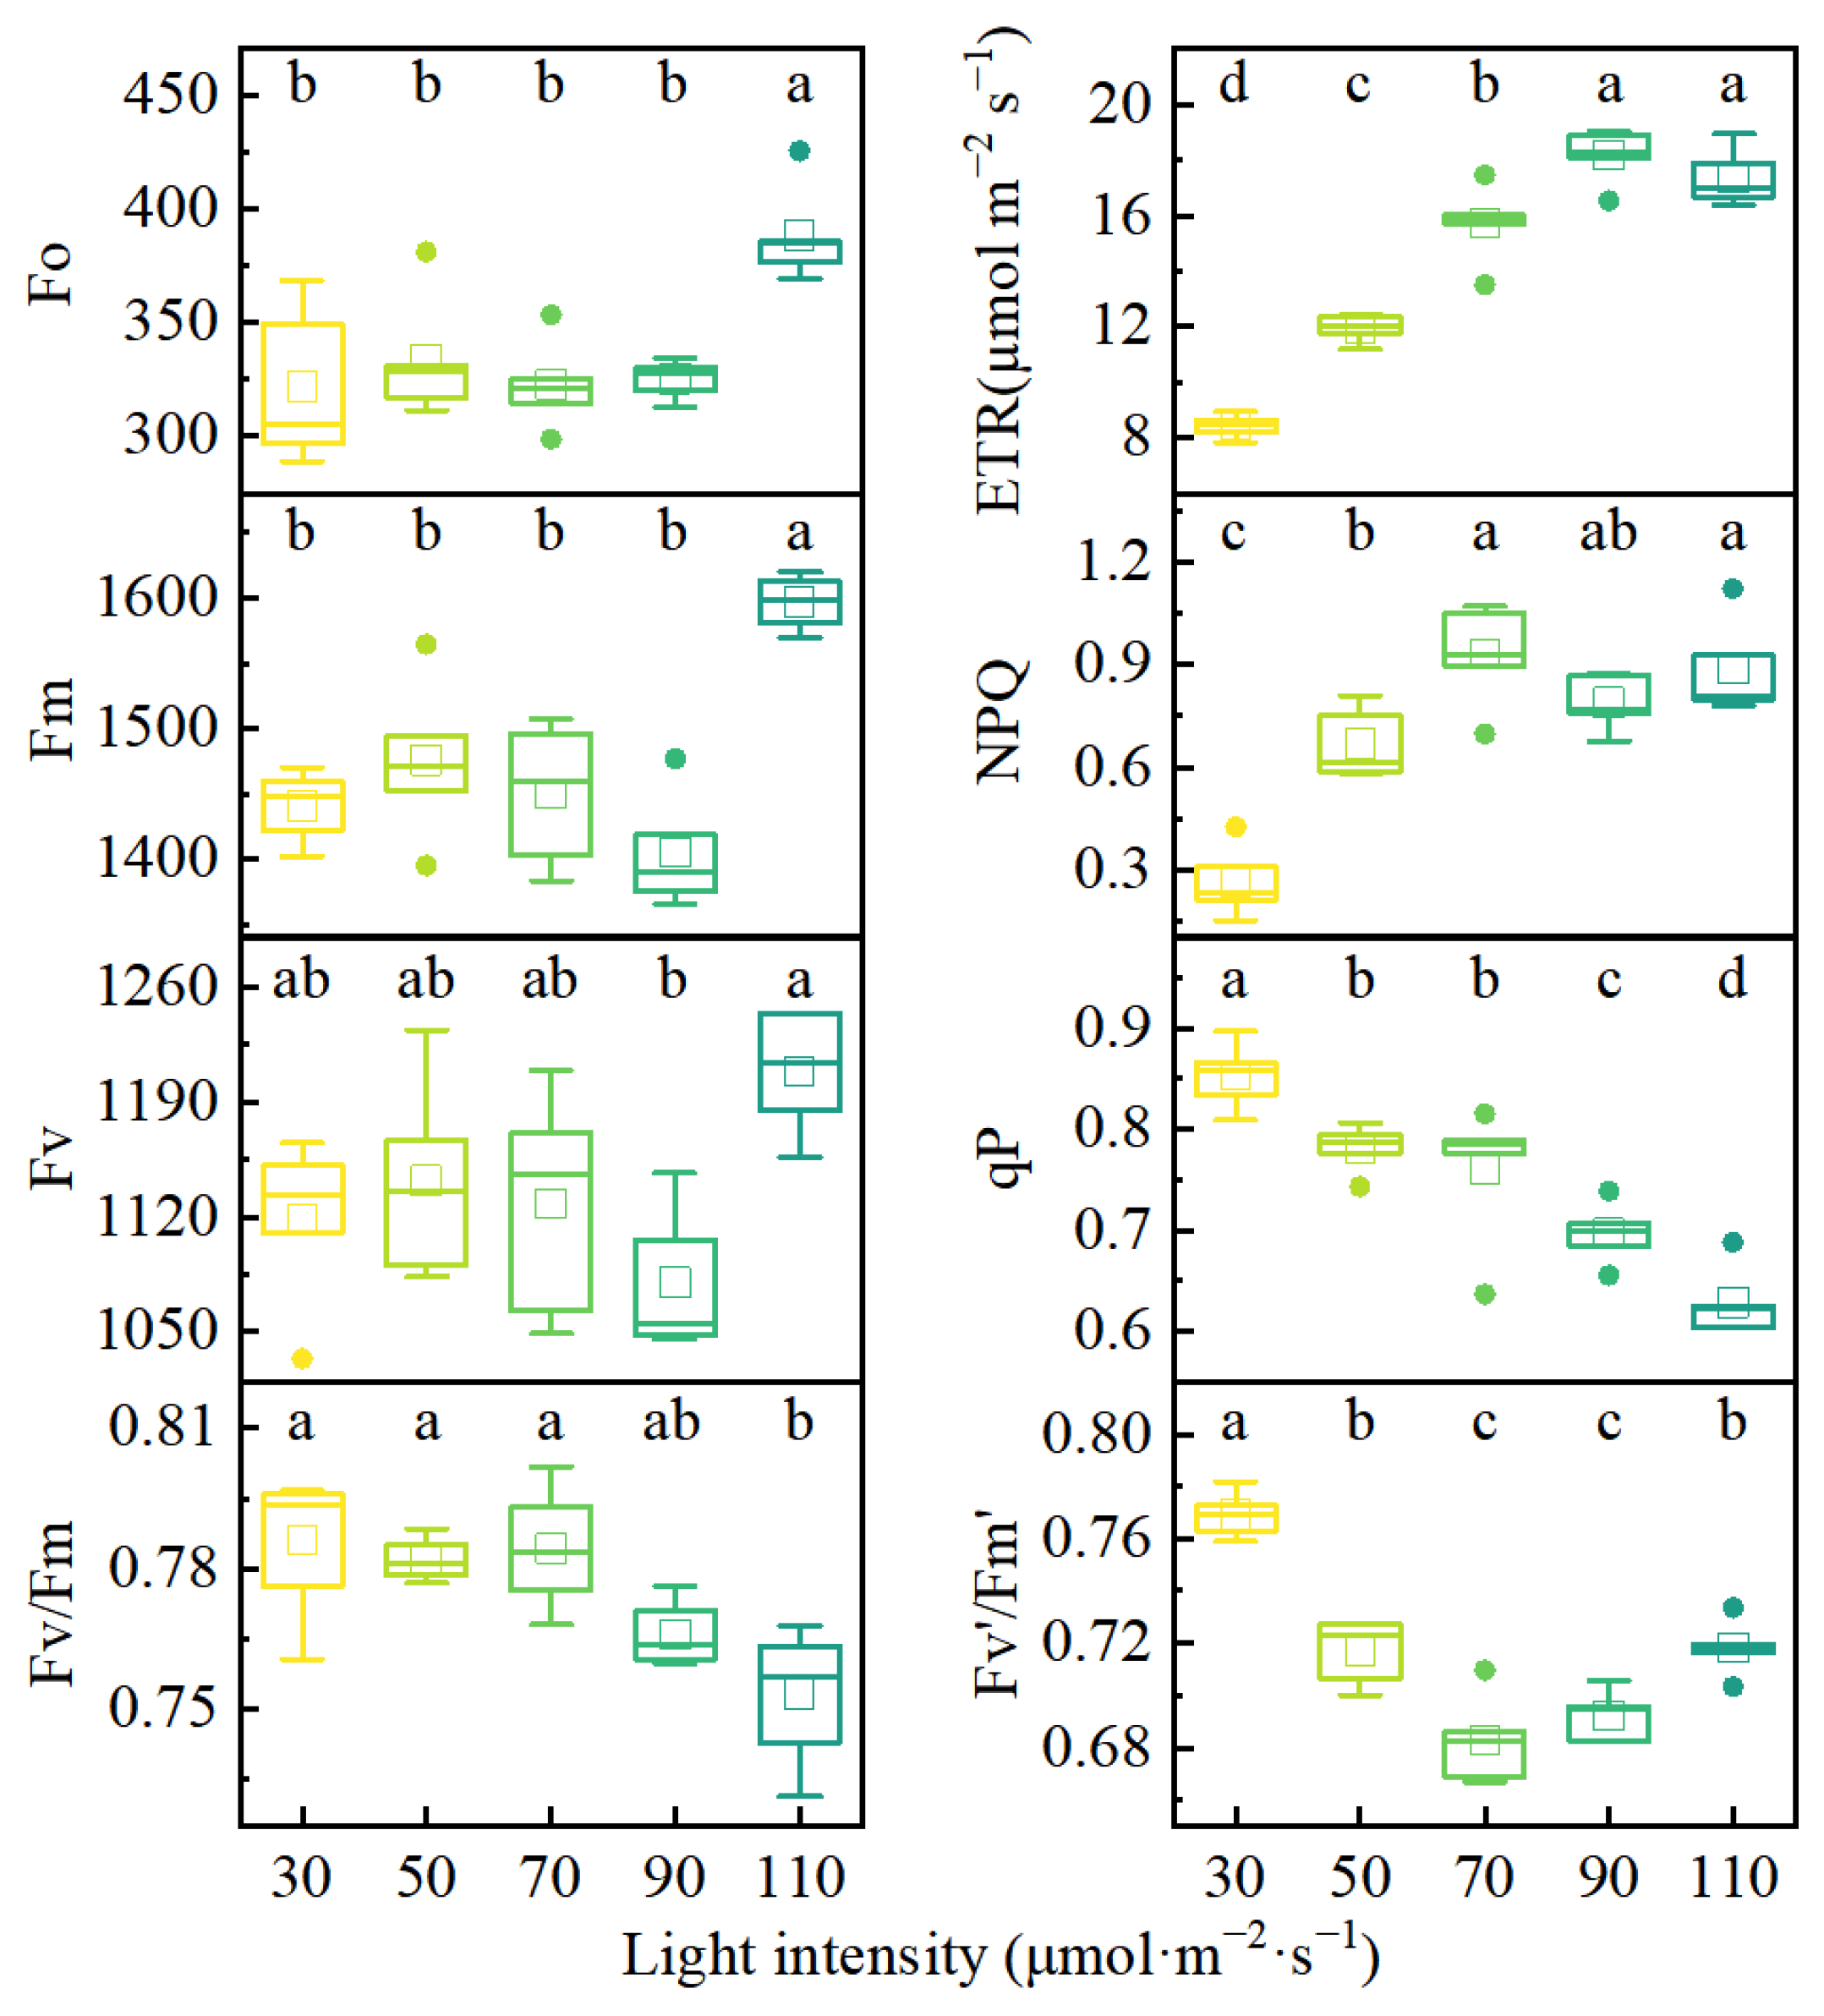
3.4. Changes in Fluorescence Parameters

Fo, Fm, and Fv all showed a trend toward normal distribution before 90 μmol·m−2·s−1, but no significant differences were observed. However, when the light intensity increased from 90 μmol·m−2·s−1 to 110 μmol·m−2·s−1, all three parameters exhibited a sharp upward trend, resulting in significant differences. Variation in the chlorophyll fluorescence parameters of A. formosanus after six months of cultivation were examined under the 30, 50, 70, 90, and 110 μmol·m−2·s−1. Under high light intensities, the values of Fo, Fm, and Fv differed significantly from those of the other treatments, reaching their maximum values. The qP values decreased with increasing light intensity, whereas those of NPQ showed the opposite trend. The ETRs reached their highest values at light intensities of 90 and 110 μmol·m−2·s−1 (Figure 5). Morphologically, this was manifested by increased organic matter accumulation and maximum dry weight ratio. Under lower light intensities, the photosynthetic rates were the lowest, and the dry weight ratios exhibited the opposite trend.

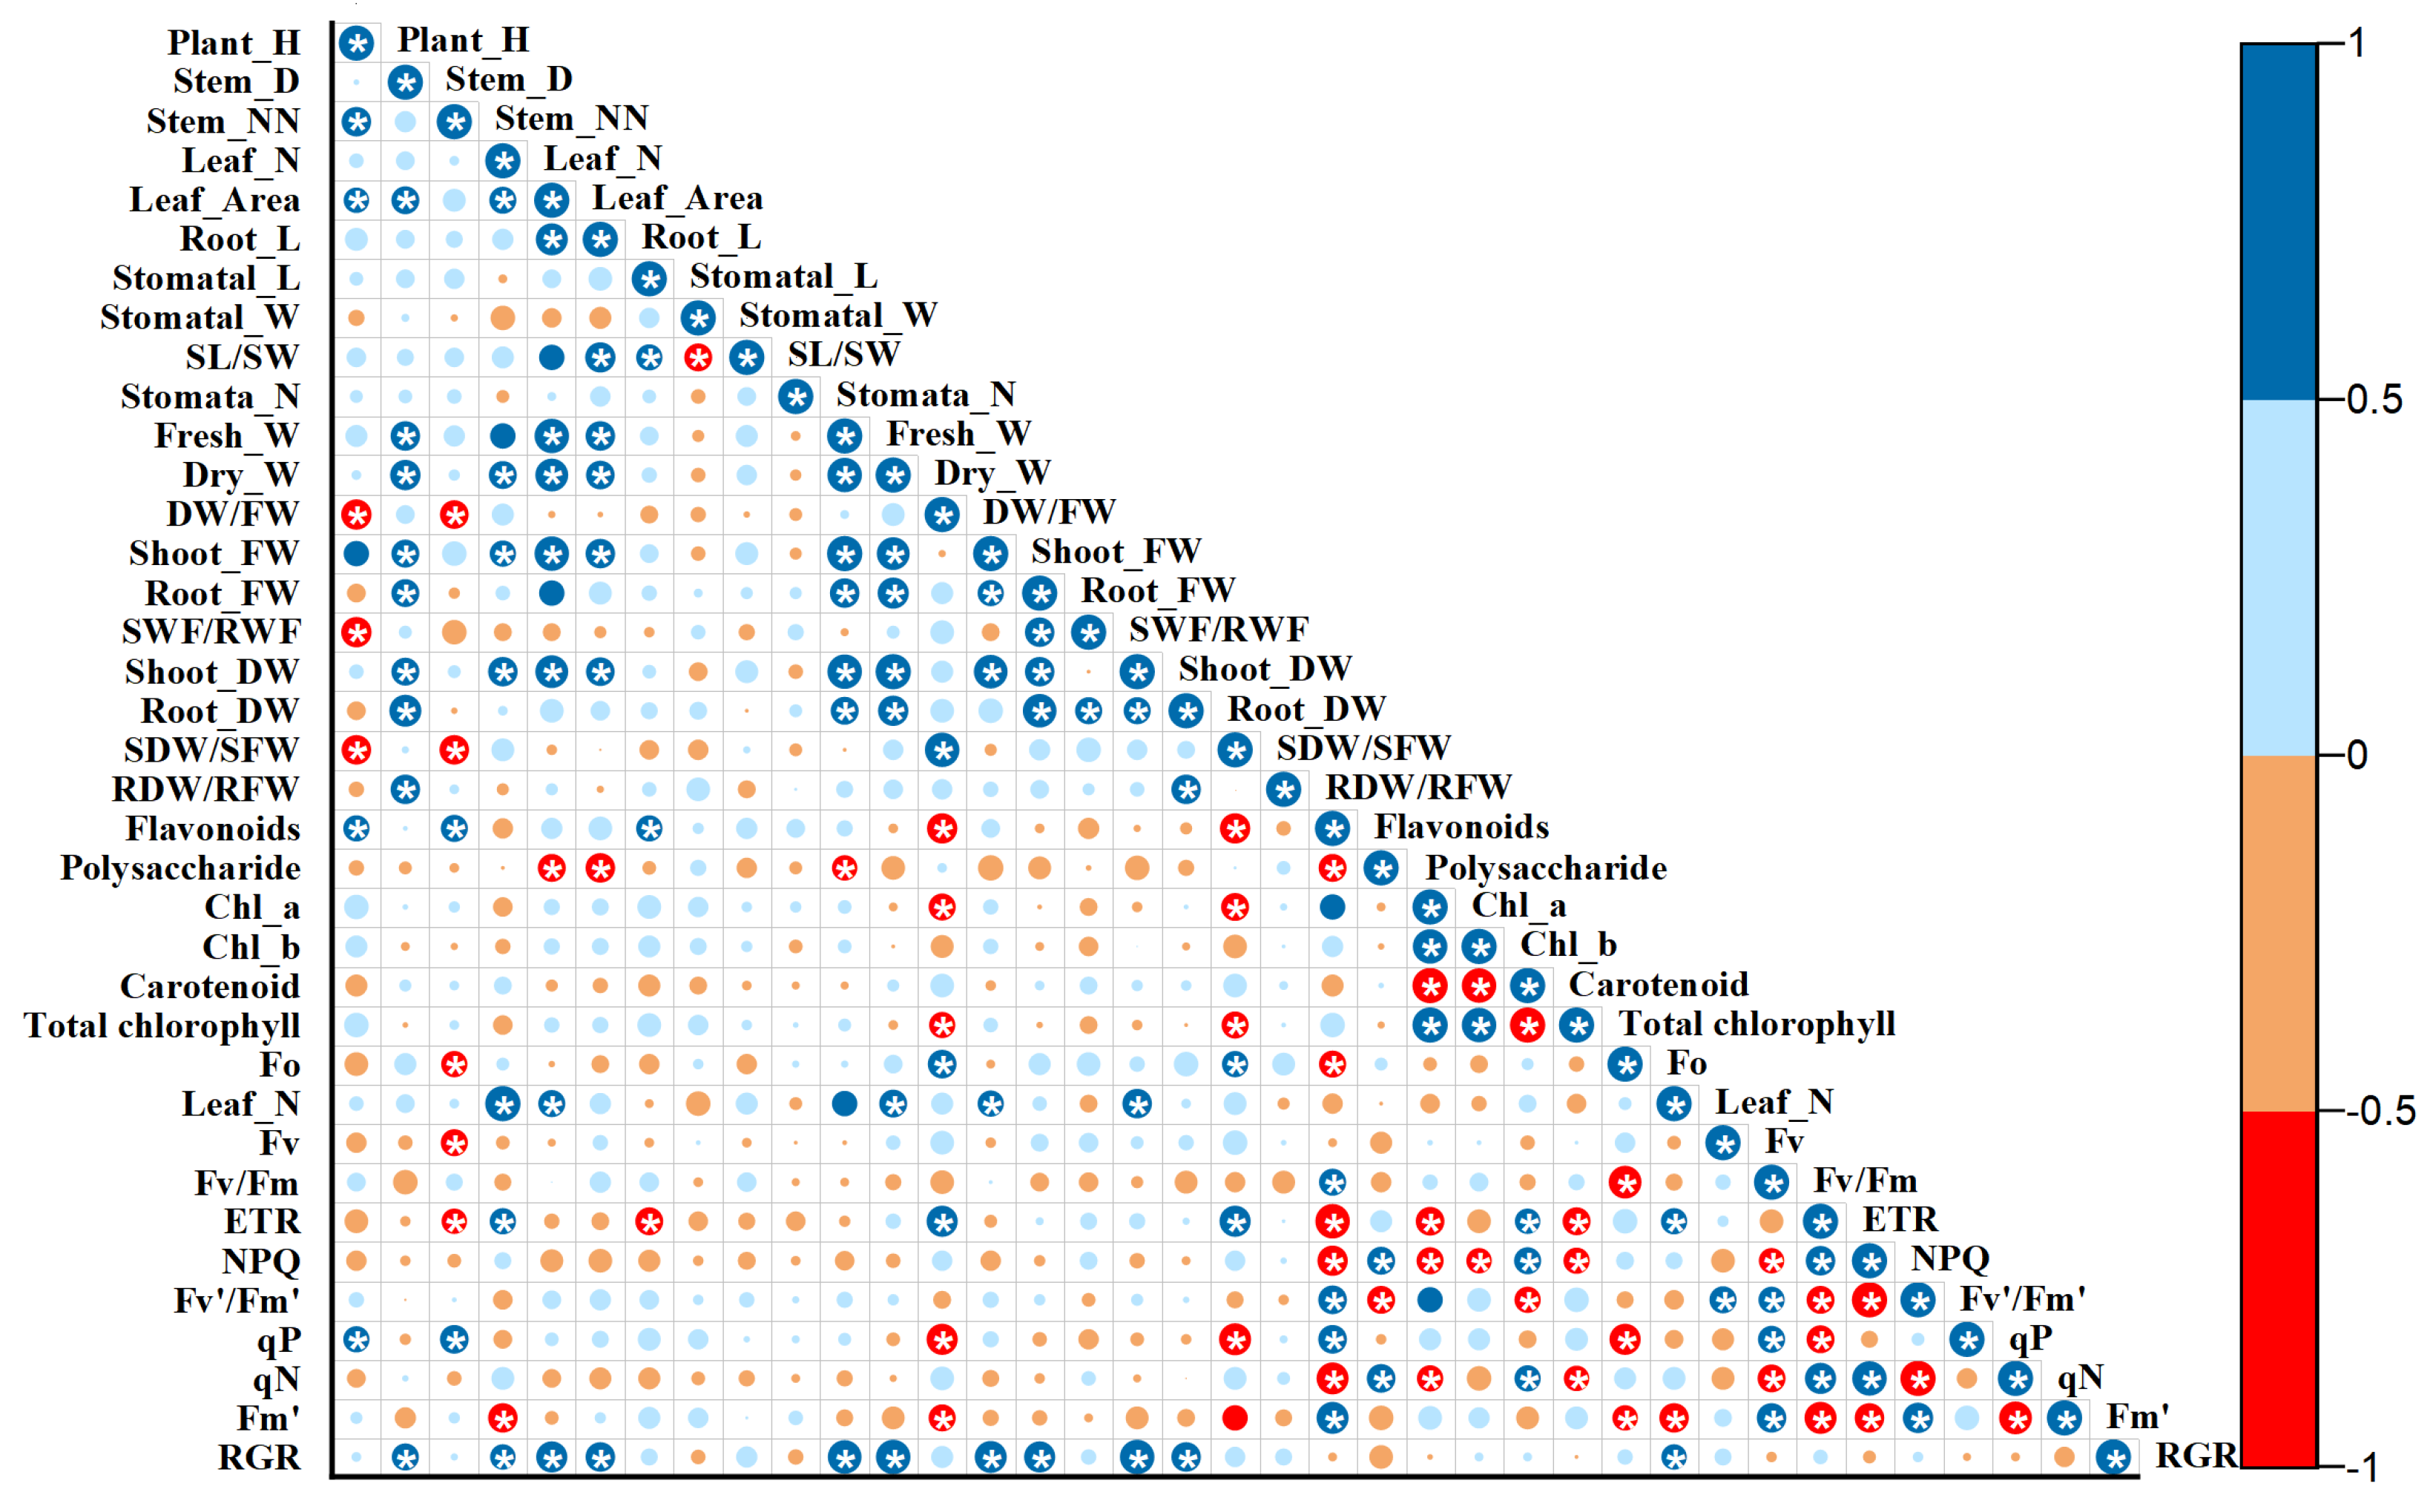
3.5. Correlation Analysis

Under different light intensities, plant height, stem number, dry weight ratio, and root biomass were negatively and positively correlated with qn, respectively (Figure 6). The stem diameter and leaf morphological characteristics were positively correlated with biomass. The stomatal parameters showed no significant relationships with other indicators. In terms of biomass allocation, the dry weight ratio was positively correlated with Fo and ETR and negatively correlated with the flavonoid, chlorophyll A, and total chlorophyll contents, as well as qP. The shoot dry weight ratio exhibited a trend similar to that of the total dry weight ratio. Flavonoids were negatively correlated with polysaccharides, Fo, ETR, and NPQ and positively correlated with Fv/Fm and qP. Total chlorophyll content was negatively correlated with the shoot dry weight ratio, ETR, NPQ, and qn. The chlorophyll A, chlorophyll B, and total chlorophyll contents were negatively correlated with carotenoid content.
The graph shows significant correlations between the relative growth rate (RGR) and morphological characteristics, biomass, and chlorophyll fluorescence. Among the morphological characteristics, individual leaf area was the main factor influencing the growth and development of A. formosanus, whereas other morphological parameters showed relatively weaker correlations with RGR, indicating a weaker impact on plant growth and development. Both shoot and root biomasses show highly significant positive correlations with RGR, indicating that A. formosanus mainly responds to different light intensities through biomass allocation.

3.6. Principal Component Analysis

Dimensionality reduction was performed for the 31 indicators of A. formosanus under different light intensities, including morphological, biomass, chemical composition, stomatal, and chlorophyll fluorescence parameters. This resulted in the identification of 17 optimized indicators. The experimental points on the PC plane were divided into five clusters according to different light intensities. The PC1/PC2 plane clearly distinguished the 30Li and 110Li points, whereas the PC1/PC3 plane separated the 30Li points from the 70Li and 110Li points (Figure 7a).
The loadings numbers showed that ETR, stem-to-dry weight ratio, NPQ, carotenoid content, and stem thickness were positively correlated with PC1, while Fv’/Fm’, chlorophyll content, and flavonoid content were negatively correlated with PC1, all contributing significantly to PC1. Individual leaf area, shoot fresh weight, fresh weight, and flavonoid content were positively correlated with PC2, whereas polysaccharide content was negatively correlated with PC2 and contributed significantly to PC2. The chlorophyll content and dry weight were positively correlated with PC3 and significantly contributed to PC3. The flavonoid content also made a relatively large contribution to PC3 but showed a negative correlation (Figure 7b). This analysis verified the correlations between various attributes of A. formosanus ecological types.

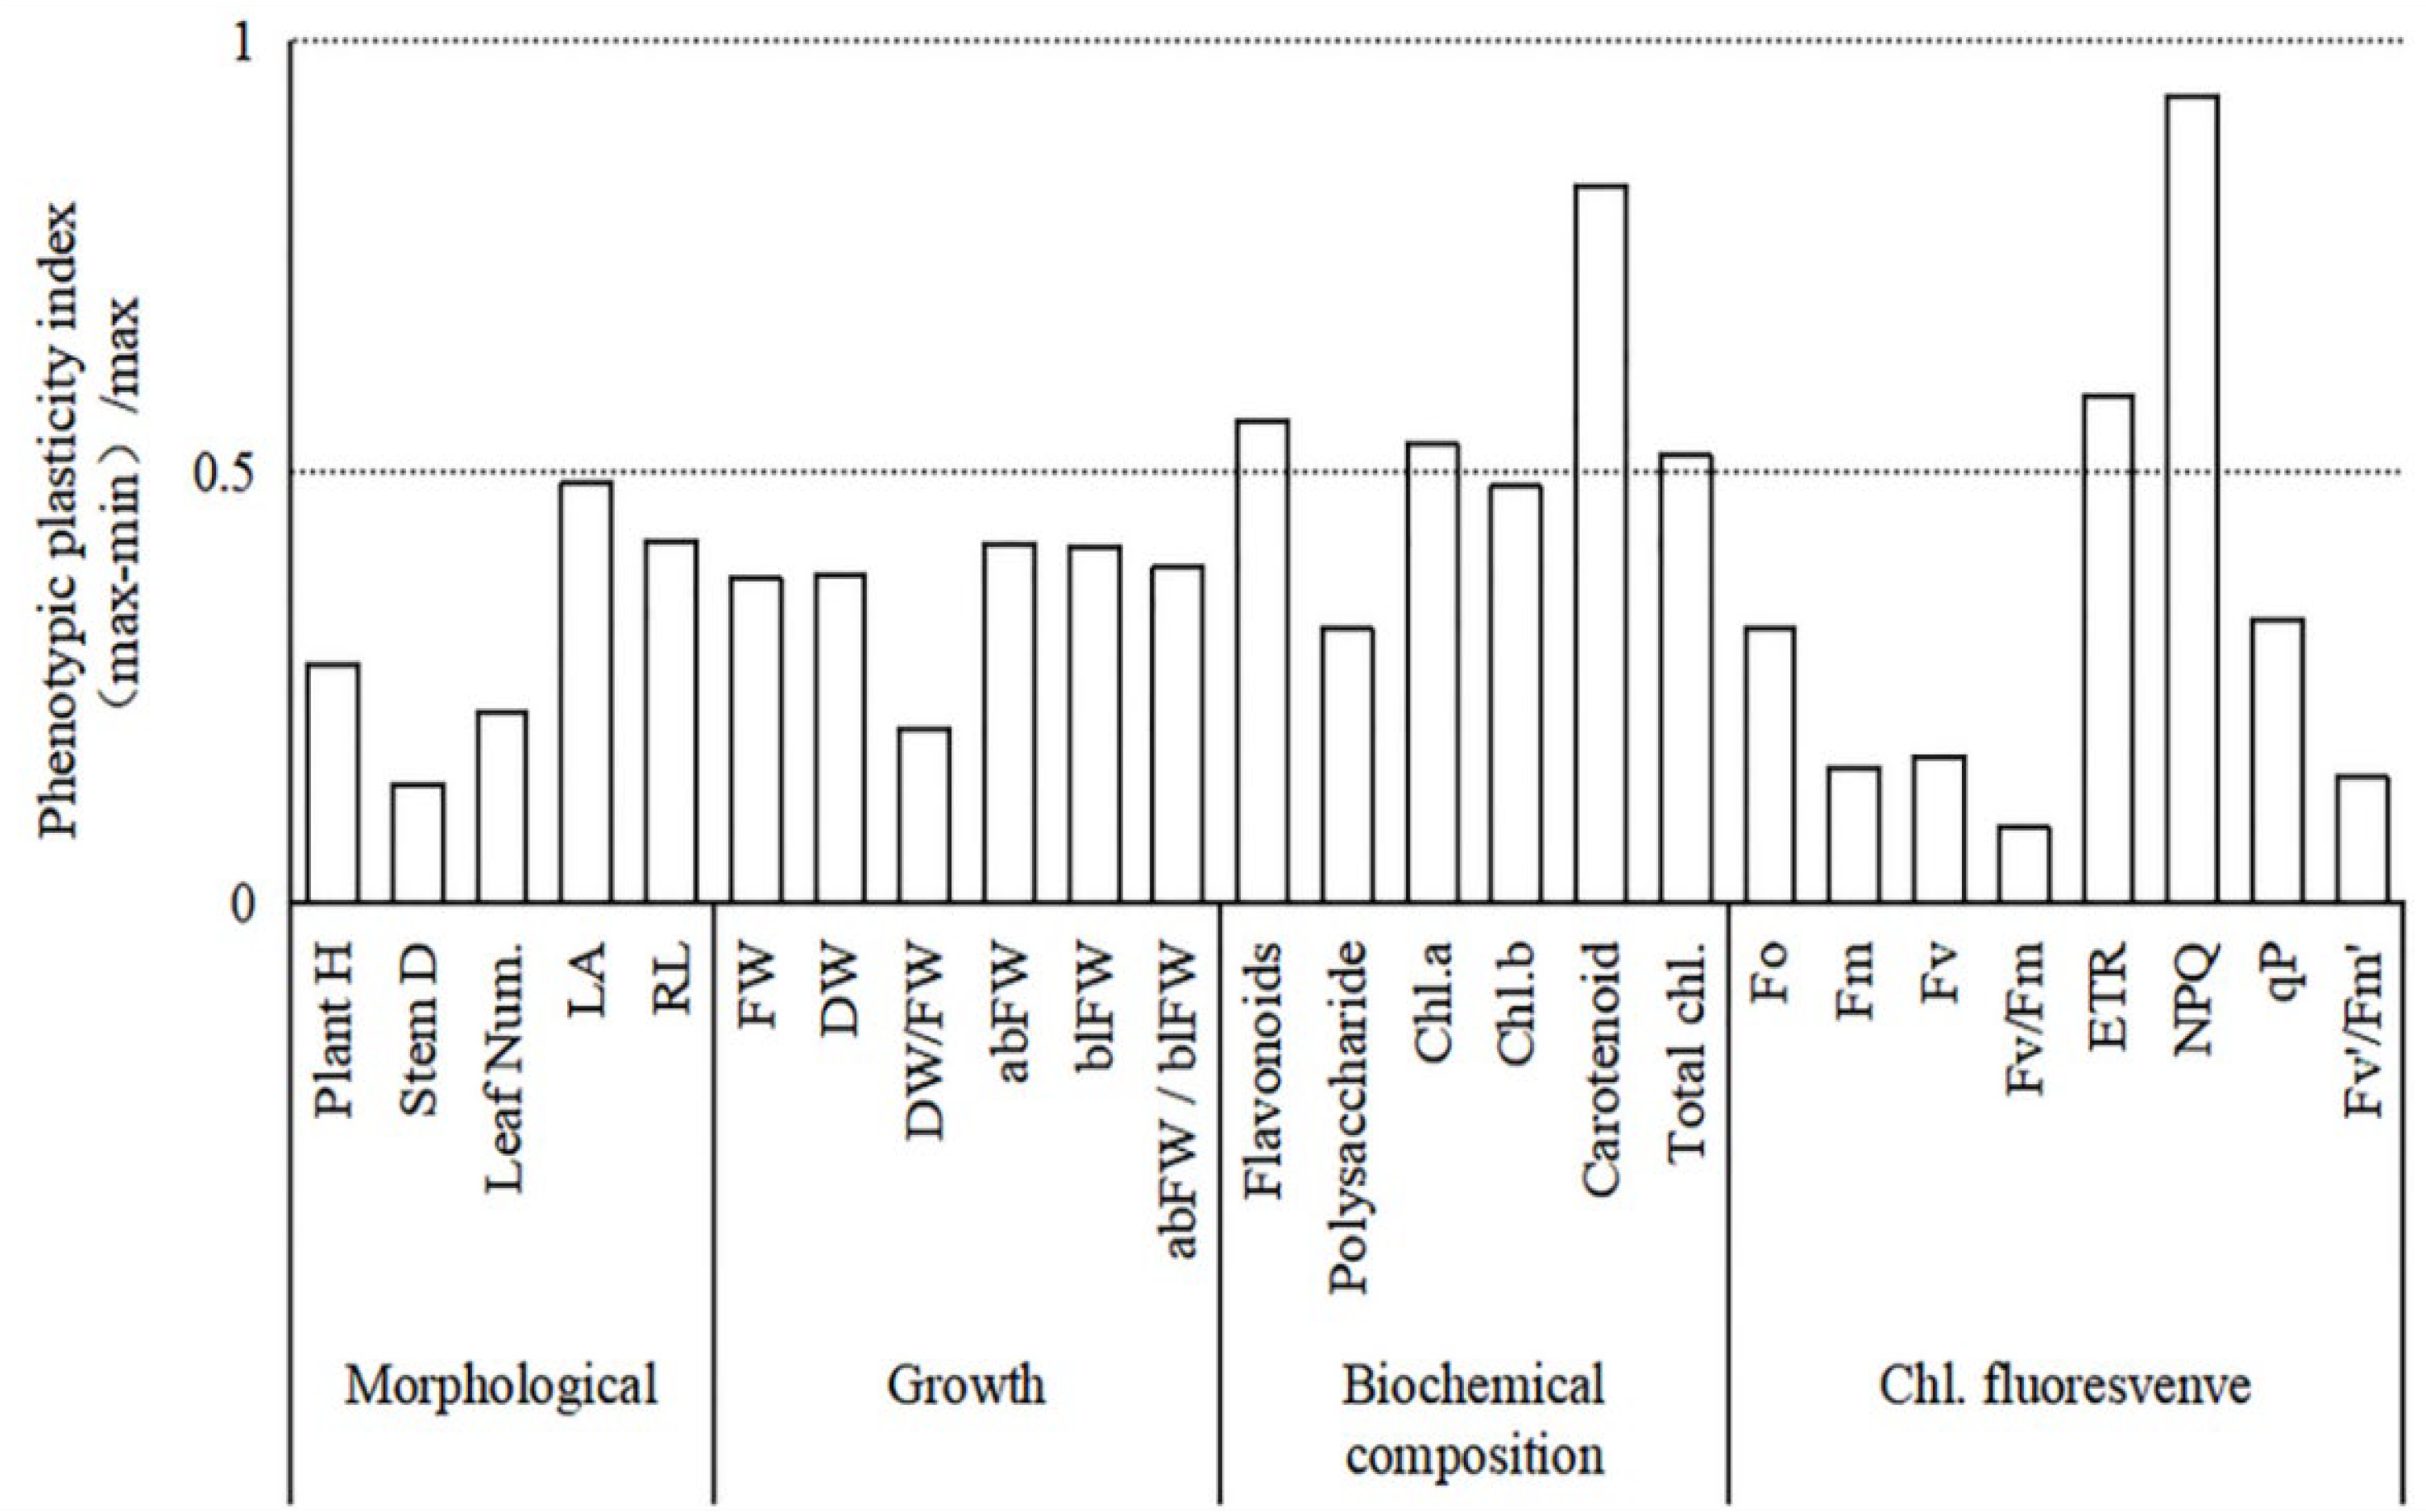
3.7. Plasticity Analysis

The phenotypic plasticity indices of the various indicators of A. formosanus were identified (Figure 8). None had a plasticity index greater than 0.5; the parameter with the lowest plasticity index was stem diameter at 0.14, and the highest plasticity index was individual leaf area at 0.48. The plasticity indices of the growth characteristic indicators were all below 0.5, and the dry weight ratio and shoot fresh weight had the lowest and highest plasticity values at 0.20, and 0.42, respectively.
In terms of the chemical composition indicators, the plasticity indices of the flavonoid, chlorophyll A, total chlorophyll, and carotenoid contents were all greater than 0.5. Among the indicators reflecting the photosynthetic potential of A. formosanus, the plasticity index of NPQ was the highest, at 0.94, followed by that of ETR at 0.59. The plasticities of the remaining chlorophyll fluorescence parameters and stomatal characteristic indicators were relatively poor.

4. Discussion

Morphological characteristics are important indicators for assessing the growth and developmental status of plants, and they can intuitively reflect a plant’s adaptability to different light environments. Changes in the morphological characteristics of plants are achieved through the accumulation of biomass and local specialization in biomass allocation. Therefore, biomass allocation between different organs reflects adjustments in plant growth strategies.
Under bright-light conditions, A. formosanus exhibited an increased plant height and stem diameter and a lower leaf area and leaf number, consistent with other reported trends in plant morphological changes under high light intensities [9]. Meanwhile, more biomass was allocated to the roots of A. formosanus, suppressing shoot growth. This allocation favored increased water and inorganic nutrient absorption, providing more material for plant transpiration and photosynthesis, while simultaneously coordinating reduced leaf sizes and decreased transpiration, which represents an important strategy for a shade-loving plants in response to high-light conditions. Under low-light conditions, insufficient light energy leads to a significant decrease in carbon acquisition, resulting in reduced biomass accumulation in plants. This phenomenon is similar to the findings of previous studies [18,19,20]. Additionally, under low-light conditions, A. formosanus reduces its allocation of root biomass and directs more resources to the root. This promotes an increase in leaf area, allowing the plant to capture more light energy and synthesize more photosynthetic products, thereby enhancing shade tolerance and adaptation to low-light conditions. In this study, the highest biomass and plant trait values were observed under 70 μmol·m−2·s−1 treatment, which may have been caused by the relatively high photosynthetic rate of leaves under this treatment. The increase in the photosynthetic rate directly promoted plant growth and biomass accumulation, indicating that this light intensity was more favorable for the photosynthetic efficiency of A. formosanus. However, when light intensity exceeds a plant’s tolerance range, the function of its photosynthetic system is significantly affected [21] (Allahverdiyeva and Aro, 2012). Our results showed that under a light intensity of 110 μmol m−2·s−1, the Fo increased significantly and was higher than in the other treatments. Simultaneously, NPQ increased with increasing light intensity, whereas photochemical qP decreased. This suggests that when light intensity exceeds a plant’s tolerance capacity, the photochemical efficiency of PSII decreases, and excess light energy is dissipated as heat to mitigate photodamage. Furthermore, analysis of the ETR and the maximum photochemical efficiency of PSII (Fv/Fm) further supports this conclusion. ETR gradually increased with rising light intensity and peaked at 90 μmol m−2·s−1, indicating that the electron transport capacity required for photosynthesis could be maintained under moderate light intensity. However, when the light intensity reached 90 μmol m−2·s−1, Fv/Fm significantly declined, suggesting that this light intensity may lead to photoinhibition, negatively affecting the photosynthetic efficiency and growth performance of the plant. In contrast, 70 μmol m−2·s−1 conditions demonstrated the optimal critical light intensity, with higher biomass and plant trait values, indicating the most favorable conditions for photosynthesis and growth in A. formosanus. Extreme light intensity affects chlorophyll synthesis [22], and similar results have been observed in soybeans, rice, cotton, American grapevines, and Chinese tea trees. Plants generally prefer weaker light intensities, which leads to potential chlorophyll accumulation under shade conditions. However, in tea trees, genes related to chlorophyll and carotenoid synthesis are downregulated under high-light-intensity conditions but upregulated under shading or reduced-light-intensity conditions [23]. The response of chlorophyll to light intensity varies among species. Therefore, further research on plant responses to shade is required. With regard to light energy dissipation as a photoprotective mechanism, it has been reported that the photosynthetic rate increases or remains constant under full-day exposure to sunlight [24,25,26,27,28]. However, electron flow decreases under high-exposure conditions [29]. In the present study, A. formosanus maintained a higher photosynthetic rate and ETR under bright-light conditions, consuming more light energy and producing more organic compounds, leading to higher biomass accumulation.
Polysaccharides, the primary metabolites involved in flavonoid synthesis, play a pivotal role in regulating flavonoid content, which is essential for the stress response and survival of plants. Under high light intensities, the accelerated accumulation and consumption of polysaccharides [30] indicate a rapid metabolic turnover aimed at sustaining flavonoid production. Flavonoids, known for their antioxidant properties, help to mitigate oxidative stress induced by intense light, thereby protecting cellular structures and maintaining photosynthetic efficiency. Conversely, under lower light intensities, the slower consumption of flavonoids and reduced transformation of polysaccharides into flavonoids suggest a shift in metabolic priorities. Under these conditions, A. formosanus accumulates polysaccharides, which is likely a strategy to store energy reserves for future stress responses or growth demands. This metabolic flexibility highlights the ability of plants to adapt to varying light environments by modulating resource allocation between immediate stress responses and long-term energy storage. Furthermore, under bright-light conditions, A. formosanus exhibited larger Fo and Fm values, resulting in a higher consumption of compounds such as flavonoids and polysaccharides. This helps to maintain a high ETR level, prevents damage to photosynthetic organization, and enhances plant survival and adaptability to intense light. These findings underscore the importance of flavonoids and polysaccharides in maintaining photosynthetic efficiency and stress tolerance, and provide a mechanistic understanding of how A. formosanus adapts to different light environments.
Plasticity indices provide an intuitive reflection of the adaptability of plants to environmental changes. In previous studies, sun-loving plants demonstrated greater phenotypic plasticity than shade-loving plants, and the mechanisms of plasticity varied. For example, sun-loving woody plants exhibit greater plasticity indices for leaf area, plant height, crown width, lateral aspect ratio (LAR), and stem and leaf biomass [31], indicating that they respond to different environments by adjusting their plant morphology and biomass allocation. In contrast, our study found that the morphological characteristics of the shade-loving plant A. formosanus showed relatively lower plasticities, but the plasticity indices of its photosynthetic physiology, flavonoids, polysaccharides, and chlorophyll fluorescence parameters were all higher, showing higher loadings on principal components. Therefore, it can be inferred that A. formosanus, as a typical shade-loving plant, relies mainly on changes in its photosynthetic physiology and biomass allocation in response to variations in the light environment.

5. Conclusions

Under a growth environment of varying light intensities, the shade-loving plant A. formosanus shows limited morphological plasticity but significant plasticity in photosynthetic physiology and biomass allocation. Its leaf number, leaf area, fresh weight, dry weight, root dry weight, Fm, and RGR were strongly correlated, indicating that changes in photosynthetic physiology, LAR, and root biomass were primarily driven by variations in light intensity. Overall, 70 μmol m−2·s−1 conditions demonstrated the optimal critical light intensity, with higher biomass and plant trait values, indicating the most favorable conditions for photosynthesis and growth in A. formosanus. To adapt to unfavorable low-light conditions, A. formosanus adopts a conservative strategy of enhancing its light capture ability and employing slow carbon acquisition and consumption processes. Conversely, under bright-light conditions, it reduces its light capture area and increases root biomass while employing a risk-taking strategy with rapid carbon acquisition and consumption.

Author Contributions

R.L. and C.C. conducted the experiments. X.C., H.L. and H.W. designed the experiments and modified the manuscript. R.L. wrote and modified the manuscript. C.C., Y.M. and S.G. analyzed the experimental results. Z.M. was the major advisor of students and supervised the design of the experiments, analyzed the experimental results, and played a key role in manuscript preparation. All authors have read and agreed to the published version of the manuscript.

Funding

This work was supported by the Guangdong Province Key Area Research Department Accounting Items [2023B0202110001] and the Guangzhou City Science and Technology Accounting Items [2023B03J1354].

Institutional Review Board Statement

Not applicable.

Data Availability Statement

The original contributions of this study are included in the article. Further inquiries can be directed to the corresponding author.

Acknowledgments

We sincerely thank all members of the Precision Agriculture Intelligent Equipment Laboratory for their technical support.

Conflicts of Interest

All contributing authors affirm that they have no known interpersonal or financial conflicts that might have influenced the research presented in this study.

References

  1. Rodríguez-López, N.F.; Cavatte, P.C.; Silva, P.E.; Martins, S.C.; Morais, L.E.; Medina, E.F.; DaMatta, F.M. Physiological and biochemical abilities of robusta coffee leaves for acclimation to cope with temporal changes in light availability. Physiol. Plant. 2013, 149, 45–55. [Google Scholar] [CrossRef] [PubMed]
  2. Shi, Y.; Ke, X.; Yang, X.; Liu, Y.; Hou, X. Plants response to light stress. J. Genet. Genom. 2022, 49, 735–747. [Google Scholar]
  3. Zhang, R.; Kong, Z.; Chen, S.; Ran, Z.; Ye, M.; Xu, J.; Zhou, C.; Liao, K.; Cao, J.; Yan, X. The comparative study for physiological and biochemical mechanisms of Thalassiosira pseudonana and Chaetoceros calcitrans in response to different light intensities. Algal Res. 2017, 27, 89–98. [Google Scholar]
  4. Pearcy, R.W. Functional Plant Ecology, 2nd ed.; Responses of Plants to Heterogeneous Light Environments; Taylor & Francis Group: Boca Raton, FL, USA, 2007; pp. 213–258. ISBN 9780429122477. [Google Scholar]
  5. Jiang, H.; Tian, X.; Dong, S.; Bao, J. Effects of temperature and light intensity on the growth and biochemical composition of Sargassum thunbergii. Yingyong Shengtai Xuebao 2009, 20, 185. [Google Scholar] [PubMed]
  6. Zhao, N.; Xu, Q.; Wang, X. Ecological and physiological characteristics of Pinellia ternata under different shade conditions. Pak. J. Agric. Sci. 2022, 59, 925. [Google Scholar]
  7. Schumann, T.; Paul, S.; Melzer, M.; Dörmann, P.; Jahns, P. Plant growth under natural light conditions provides highly flexible short-term acclimation properties toward high light stress. Front. Plant Sci. 2017, 8, 681. [Google Scholar]
  8. Campbell, W.; Black, C. The relationship of CO2 assimilation pathways and photorespiration to the physiological quantum requirement of green plant photosynthesis. BioSystems 1978, 10, 253–264. [Google Scholar]
  9. Gao, Z.; Khalid, M.; Jan, F.; Jiang, X.; Yu, X. Effects of light-regulation and intensity on the growth, physiological and biochemical properties of Aralia elata (miq.) seedlings. South Afr. J. Bot. 2019, 121, 456–462. [Google Scholar]
  10. Chen, C.; Luo, X.; Jin, G.; Cheng, Z.; Pan, X.; Zhu, G.; Li, S.; Zhu, Y.; Tang, N. Shading effect on survival, growth, and contents of secondary metabolites in micropropagated Anoectochilus plantlets. Braz. J. Bot. 2017, 40, 599–607. [Google Scholar]
  11. Chen, M.; Zeng, X.; Liu, Y.; Zhang, H.; Hu, Q. An orthogonal design of light factors to optimize growth, photosynthetic capability and metabolite accumulation of Anoectochilus roxburghii (Wall.) Lindl. Sci. Hortic. 2021, 288, 110272. [Google Scholar] [CrossRef]
  12. Gam, D.T.; Khoi, P.H.; Ngoc, P.B.; Linh, L.K.; Hung, N.K.; Anh, P.T.L.; Thu, N.T.; Hien, N.T.T.; Khanh, T.D.; Ha, C.H. LED lights promote growth and flavonoid accumulation of Anoectochilus roxburghii and are linked to the enhanced expression of several related genes. Plants 2020, 9, 1344. [Google Scholar] [CrossRef] [PubMed]
  13. Wang, W.; Su, M.; Li, H.; Zeng, B.; Chang, Q.; Lai, Z. Effects of supplemental lighting with different light qualities on growth and secondary metabolite content of Anoectochilus roxburghii. PeerJ 2018, 6, e5274. [Google Scholar]
  14. Ye, S.; Shao, Q.; Xu, M.; Li, S.; Wu, M.; Tan, X.; Su, L. Effects of light quality on morphology, enzyme activities, and bioactive compound contents in Anoectochilus roxburghii. Front. Plant Sci. 2017, 8, 857. [Google Scholar]
  15. Heumann, H.G. Microwave-Stimulated Glutaraldehyde and Osmium Tetroxide Fixation of Plant Tissue: Ultrastructural Preservation in Seconds. Histochemistry 1992, 97, 341–347. [Google Scholar] [PubMed]
  16. Porra, R.J. The Chequered History of the Development and Use of Simultaneous Equations for the Accurate Determination of Chlorophylls a and b. Photosynthesis Research 2002, 73, 149–156. [Google Scholar]
  17. Huang, Y.; Chen, J. Comparison of polysaccharide and flavonoid contents in Anoictochilus roxburghii (wall.) lindl under different cultivation forms and harvest time. J. Trop. Org. 2012, 3, 174–176. [Google Scholar]
  18. Li, Y.; Kong, D.; Liang, H.-L.; Wu, H. Alkaloid content and essential oil composition of Mahonia breviracema cultivated under different light environments. J. Appl. Bot. Food Qual. 2018, 91, 171–179. [Google Scholar]
  19. Niinemets, Ü. A review of light interception in plant stands from leaf to canopy in different plant functional types and in species with varying shade tolerance. Ecol. Res. 2010, 25, 693–714. [Google Scholar]
  20. Nishimura, E.; Suzaki, E.; Irie, M.; Nagashima, H.; Hirose, T. Architecture and growth of an annual plant Chenopodium album in different light climates. Ecol. Res. 2010, 25, 383–393. [Google Scholar]
  21. Allahverdiyeva, Y.; Aro, E.-M. Photosynthetic responses of plants to excess light: Mechanisms and conditions for photoinhibition, excess energy dissipation and repair. In Photosynthesis: Plastid Biology, Energy Conversion and Carbon Assimilation; Springer: Berlin/Heidelberg, Germany, 2012; pp. 275–297. [Google Scholar]
  22. Demmig, B.; Björkman, O. Comparison of the effect of excessive light on chlorophyll fluorescence (77K) and photon yield of O2 evolution in leaves of higher plants. Planta 1987, 171, 171–184. [Google Scholar]
  23. Chen, J.; Wu, S.; Dong, F.; Li, J.; Zeng, L.; Tang, J.; Gu, D. Mechanism underlying the shading-induced chlorophyll accumulation in tea leaves. Front. Plant Sci. 2021, 12, 779819. [Google Scholar] [CrossRef]
  24. Demmig-Adams, B.; Cohu, C.M.; Muller, O.; Adams, W.W. Modulation of photosynthetic energy conversion efficiency in nature: From seconds to seasons. Photosynth. Res. 2012, 113, 75–88. [Google Scholar] [CrossRef] [PubMed]
  25. Dumlao, M.R.; Darehshouri, A.; Cohu, C.M.; Muller, O.; Mathias, J.; Adams, W.W.; Demmig-Adams, B. Low temperature acclimation of photosynthetic capacity and leaf morphology in the context of phloem loading type. Photosynth. Res. 2012, 113, 181–189. [Google Scholar] [CrossRef] [PubMed]
  26. Nicotra, A.B.; Atkin, O.K.; Bonser, S.P.; Davidson, A.M.; Finnegan, E.J.; Mathesius, U.; Poot, P.; Purugganan, M.D.; Richards, C.L.; Valladares, F. Plant phenotypic plasticity in a changing climate. Trends Plant Sci. 2010, 15, 684–692. [Google Scholar] [CrossRef]
  27. Valladares, F.; Gianoli, E.; Gómez, J.M. Ecological limits to plant phenotypic plasticity. New Phytol. 2007, 176, 749–763. [Google Scholar] [CrossRef]
  28. Verhoeven, A.; Adams Iii, W.; Demmig-Adams, B. The xanthophyll cycle and acclimation of Pinus ponderosa and Malva neglecta to winter stress. Oecologia 1999, 118, 277–287. [Google Scholar] [CrossRef] [PubMed]
  29. White, A.J.; Critchley, C. Rapid light curves: A new fluorescence method to assess the state of the photosynthetic apparatus. Photosynth. Res. 1999, 59, 63–72. [Google Scholar] [CrossRef]
  30. You, T.; Barnett, S.M. Effect of light quality on production of extracellular polysaccharides and growth rate of Porphyridium cruentum. Biochem. Eng. J. 2004, 19, 251–258. [Google Scholar] [CrossRef]
  31. Duan, B.; Lu, Y.; Yin, C.; Li, C. Morphological and physiological plasticity of woody plant in response to high light and low light. Chin. J. Appl. Environ. Biol. 2005, 11, 238–245. [Google Scholar]
Figure 1. Effects of light intensity on morphological characteristics of A. formosanus. M: month; 1M presents first month of cultivation after starting treatment, etc. Vertical bars are standard error bars (n = 5). Different letters above bars indicate significant differences (p < 0.05) determined using Tukey–Kramer’s test.
Agriculture 15 00705 g001
Figure 2. Effects of light intensity on biomass allocation in A. formosanus. M: month; 1M presents first month of cultivation after starting treatment, etc. Vertical bars are standard error bars (n = 5). Different letters above bars indicate significant differences (p < 0.05) determined using Tukey–Kramer’s test.
Agriculture 15 00705 g002
Figure 3. Effects of light intensity on flavonoid and polysaccharide contents of A. formosanus. M: month; 1M presents first month of cultivation after starting treatment, etc. Vertical bars are standard error bars (n = 5). Different letters above bars indicate significant differences (p < 0.05) determined using Tukey–Kramer’s test.
Agriculture 15 00705 g003
Figure 4. The effects of light intensity on the photosynthetic pigment content of A. formosanus. M: month; 1M presents the first month of cultivation after starting treatment, etc. The points in the boxes can be interpreted as “outliers” in the data. The vertical bars are standard error bars (n = 5). The different letters above the bars indicate significant differences (p < 0.05), determined using Tukey–Kramer’s test.
Agriculture 15 00705 g004
Figure 5. Effect of light intensity on chlorophyll fluorescence parameters of A. formosanus. Samples obtained from plants after 6 months of treatment. Points of the box can be interpreted as “outliers” in data. Vertical bars are standard error bars (n = 5). Different letters above bars indicate significant differences (p < 0.05) determined using Tukey–Kramer’s test.
Agriculture 15 00705 g005
Figure 6. Correlation analysis. Samples obtained from plants after 6 months of treatment. Asterisks (*) indicate p < 0.05 in the Pearson correlation plot.
Agriculture 15 00705 g006
Figure 7. The principal component analysis of each index of A. formosanus under different light intensities. (a) shows the distribution of each variable on PC1 and PC2, illustrating their contributions to these two main axes. (b) shows the distribution of each variable on PC1 and PC3, highlighting additional variations captured by PC3. (a,b) help reveal the major sources of variation among samples. The different colors in the figure represent the different treatment groups; the ellipses are the confidence intervals of the parameters for each treatment group; the arrows represent the correlation coefficients between each indicator and the principal components.
Agriculture 15 00705 g007
Figure 8. Phenotypic plasticity indices of A. formosanus. The dotted line represents a phenotypic plasticity index of 0.5, which is used as a threshold in this study. Indexes greater than 0.5 are considered highly plastic.
Agriculture 15 00705 g008
Disclaimer/Publisher’s Note: The statements, opinions and data contained in all publications are solely those of the individual author(s) and contributor(s) and not of MDPI and/or the editor(s). MDPI and/or the editor(s) disclaim responsibility for any injury to people or property resulting from any ideas, methods, instructions or products referred to in the content.

