Article

Combined Physiology and Transcriptome Analyses Provide Insights into Malformed Fruit of Cocos nucifera L.

Hainan Key Laboratory of Tropical Oil Crops Biology/Coconut Research Institute, Chinese Academy of Tropical Agricultural Sciences, Wenchang 571339, China
*
Author to whom correspondence should be addressed.
These authors contributed equally to this work.
Agriculture 2025, 15(7), 723; https://doi.org/10.3390/agriculture15070723
Submission received: 8 February 2025 / Revised: 19 March 2025 / Accepted: 25 March 2025 / Published: 27 March 2025
(This article belongs to the Section Crop Genetics, Genomics and Breeding)

Abstract

:
Malformed coconut fruit occurrence exhibits dual impacts on agricultural productivity and economic returns, primarily through substantial yield reduction and compromised commercial value resulting from morphological defects. To elucidate the molecular determinants underlying this developmental anomaly, we conducted a systematic investigation integrating physiological profiling and transcriptomic sequencing on pulp tissues from malformed (MF) and normal (NF) coconut fruits. Notably, MF specimens displayed marked depletion in carbohydrate reserves, with soluble sugars (SS), reducing sugars (RS), starch (SH), soluble proteins (SP), and fat (FA) declining by 28.57%, 20.43%, 15.51%, 36.78%, and 50.18%, respectively, compared to NF controls. Conversely, a coordinated upregulation of phytohormones was observed, where indole acetic acid (IAA), abscisic acid (ABA), cytokinin (CK), gibberellic acid (GA), brassinosteroid (BR), jasmonic acid (JA), and salicylic acid (SA) levels increased by 31.82–92.97%, while ethylene (ETH) exhibited a paradoxical 30.09% reduction. Transcriptomic dissection revealed 6370 functionally annotated differentially expressed genes (DEGs), comprising 4235 upregulated and 2135 downregulated transcripts. These DEGs were predominantly enriched in critical pathways including plant hormone signal transduction, flavonoid/phenylpropanoid biosynthesis, and carbohydrate metabolic networks. Particularly noteworthy was the enhanced activity of cell wall remodeling enzymes—cellulase (CEL), polygalacturonase (PG), and pectinesterase (PE)—accompanied by differential expression of nine cell wall-associated gene families (CEL, PE, PG, PEL, URG, UTR, VTC2, EXP, XET/XTH) and eight phytohormone-related gene clusters. Functional stratification analysis further identified key transcriptional regulators, with MYB, ERF/AP2, BHLH, WRKY, bZIP, and MADS transcription factors demonstrating significant expression divergence, suggesting their pivotal regulatory roles in MF pathogenesis. This multi-omics integration not only deciphers the molecular choreography of coconut fruit malformation but also establishes a novel conceptual framework for developmental disorder research in perennial crops.

1. Introduction

Malformation is the result of imbalanced cell division during the process of female flower pollination to fruit development [1,2]. Fruit malformation is a complex process in molecular regulation of plant development from flower to fruit. Multifactorial etiologies, including external disturbances from environmental factors and internal molecular signals, may cause malformation in morphogenesis [3]. Fruit malformation is precisely controlled by physiological, biochemical, and molecular mechanisms, finally causing malformation in plant fruits [4].
Phytohormones play a crucial role in fruit development, and the balance of plant hormones is considered highly relevant to fruit malformation occurrence [4]. Among these signals, phytohormones are endogenous compounds involved in flower and fruit development [5]. Some classic phytohormones, such as GA, IAA, CK, ETH, ABA, JA, SA, and BR, are related to the fruit development pathway [4,5]. Their mechanisms of function are also different. The relationship between endogenous hormones in different plants and their fruit development is similar, but there are also differences. GA can inhibit the division of ovarian wall cells, reduce fruit setting rate [6], and increase the sugar and vacuolar invertase activity in the ovary, thereby improving fruit yield [7]. It can increase fruit yield by promoting IAA synthesis [8]. GA3 promotes the genes involved in the cytoskeleton and cell wall in sweet cherries, thereby increasing fruit size [9]. IAA and GA are the main hormones that promote fruit initiation and stimulate growth to increase fruit yield [10,11]. 9-3-acetic acid 9 (sliaa9) TF controls the expression of auxin response factors (ARFs) through the IAA signaling pathway and participates in the regulation of fruit aggregation [12,13].
Fruit malformation predominantly originates from compromised developmental competence in ovarian tissues, with dysregulated morphogenetic processes frequently culminating in premature abscission or structural anomalies [4]. At the harvesting phase, auxin–gibberellin (IAA-GA) crosstalk emerges as a core regulatory axis, where IAA-mediated mitotic activation synergizes with GA-driven cell expansion to establish fruit growth trajectories [14]. This developmental program is counterbalanced by AUX/IAA-ARF repressor complexes, which impose transcriptional constraints on ovary-to-fruit transition across model species including Solanum lycopersicum and Arabidopsis thaliana. Notably, such repression can be physiologically overridden through pollination-induced signal cascades or exogenous auxin application, thereby reinstating cellular proliferation competence. Concomitantly with ethylene (ETH) and abscisic acid (ABA) downregulation [15,16], IAA-GA co-activation establishes a hormonal homeostasis critical for fruit set initiation. While the ABA-IAA-ETH triad dominates primary developmental control, emerging evidence implicates broader phytohormonal networks involving cytokinin (CK), jasmonate (JA), and brassinosteroids (BR) in fine-tuning fruit morphogenesis [17,18,19].
Fruit malformation implicate a complex network containing numerous genes. These genes are relevant to cell wall synthesis, differentiation, and degradation. Fruit morphogenesis is critically governed by cell wall remodeling machinery, where expansion proteins (e.g., LcExp1/2, MdEXPA3, SlEXP) coordinate with structural regulators (SLPG, TBG6, β-Gal, LcXET1) to dynamically modulate wall plasticity [20,21,22,23,24,25]. This architectural recalibration operates through strategic modification of cellulose–pectin–hemicellulose matrices, particularly targeting interlamellar cohesion in separation zones. Malformation pathogenesis correlates with hyperactivation of cell wall hydrolases, notably cellulase (CEL) and polygalacturonase (PG), which enzymatically disrupt the middle lamella and primary wall integrity through controlled polysaccharide depolymerization [26]. Complementary to this degradative cascade, pectinesterase (PE) and pectate lyase (PEL) orchestrate pectin matrix reorganization, while expansins (EXP) and xyloglucan transglycosylases (XET/XTH) mediate wall stress relaxation, collectively establishing a mechanochemical continuum essential for developmental patterning [27,28]. Ethylene–auxin crosstalk exacerbates this process by transcriptional upregulation of wall-modifying enzymes, precipitating precocious floral organ abscission that propagates developmental defects into fruit maturation stages [29]. Such floral integrity loss fundamentally compromises fruit quality determination pathways, creating a permissive microenvironment for malformation establishment.
Plant fruit malformation involves multiple metabolic pathways and multifarious genes and compounds. Consequently, studying the intrinsic molecular mechanisms of plants by high-throughput sequencing has been favored by researchers, and researching fruit development and changes in transcriptomes is one of the common methods. Some genes that may be relevant to fruit malformation can be identified by transcriptome sequencing technology, and the most likely genes can be selected for validation by using experimental techniques [2,4]. For example, the MADS-box (ABC model) is a necessary TF gene family associated with flowering time, fruit development, and fruiting rate [30,31,32]. The ethylene signaling cascade exerts developmental control through SlERF52, a pivotal ERF family member functioning as a molecular integrator coordinating fruit morphogenetic programs [33]. This regulatory network interfaces with leucine-rich repeat (LRR) receptor kinases and IDA peptide signaling modules, while being transcriptionally modulated by KNOX-BHLH transcription factor complexes that establish developmental checkpoints during fruit ontogeny [34,35]. Transcriptomic profiling of ethylene-mediated citrus fruit expansion revealed a three-tiered regulatory architecture: (i) ethylene-responsive transcriptional activators, (ii) starch/sucrose metabolic flux controllers, and (iii) cell wall modification effectors [36,37].
Fruit malformation pathogenesis is fundamentally governed by metabolic homeostasis dynamics, where nutrient–carbohydrate equilibrium operates as a critical morphogenetic threshold [38,39]. During floral primordium specification, ovule developmental competence requires exceeding metabolic thresholds, particularly in carbohydrate flux and nitrogen partitioning, with suboptimal resource allocation constraining megasporogenesis and pollen–pistil recognition fidelity, ultimately manifesting as teratological floral structures [40]. Nutritional deficit induces bistable auxin signaling states through differential expression of PIN-FORMED transporters and AUX/IAA repressors, precipitating cytometabolic dysfunction that propagates from meristematic niches to developing organs. Concomitantly, photosynthate limitation triggers disproportionate ROS accumulation via mitochondrial electron transport chain uncoupling, establishing a pro-oxidant microenvironment conducive to developmental apoptosis in reproductive tissues [41].
A multidimensional regulatory axis emerges in hexose metabolism, where malformed fruits exhibit systemic depletion of glucose, sorbitol, sucrose, and fructose compared to normal counterparts [42,43]. Transcriptomic dissection reveals sucrose starvation-responsive regulons encompassing trehalose-6-phosphate UDP-glycosyltransferase, UDP-glucose-4-epimerase, and polyol transporter clusters, constituting an evolutionary conserved metabolic adaptation network [44,45,46].
The coconut, the only species of the genus Cocos in the palm family, is renowned for its economic, nutritional, and industrial value. The coconut is an important fresh tropical fruit and oil crop, and its quality directly affects the economic value of the commodity. However, in actual production, coconuts are often influenced by adverse factors such as low temperature, drought, and nutrient deficiency, resulting in malformed fruits, which seriously affect the commercial and nutritional quality of coconuts. Therefore, reducing the incidence of coconut fruit malformation is crucial for coconut production. Fruit malformation constitutes an orchestrated morphogenetic process governed by spatiotemporal interplay between endogenous signaling networks and environmental modulators [4,47,48]. Notwithstanding these advances, the etiological basis of Cocos nucifera fruit malformations remains enigmatic, particularly regarding its unique regulatory circuitry diverging from characterized model species. To decode this phytopathological enigma, we implemented an integrated multi-omics investigation combining systematic phenotyping, physiological profiling (antioxidant enzyme dynamics/phytoregulator quantitation), and transcriptomic dissection with quantitative real-time polymerase chain reaction (qRT-PCR) validation of differentially expressed genes (DEGs) across normal (NF) and malformed (MF) fruit morphotypes. This tripartite analytical framework enables: (i) precise mapping of cellular redox states and hormonal gradients, (ii) the identification of conserved versus species–specific regulatory modules, and (iii) the establishment of genotype–phenotype associations through metabolic–transcriptional network coupling. The resultant mechanistic blueprint not only elucidates coconut-specific developmental pathobiology but also provides a translational framework for yield enhancement through targeted manipulation of carbohydrate allocation and cell wall remodeling pathways.

2. Materials and Methods

2.1. Plant Materials

Using Huangai (Wenye No.2) coconuts grown in Wenchang City, Hainan Province, China, as the raw material, 8-month-old deformed fruits (MFs) and normal fruits (NFs) were taken from the same 8-year-old coconut tree. We selected three plants with similar growth vitality in the same park, and took three sets of biological replicates of abnormal and normal fruits. We observed the shape of the fruit, weighed the fruit in the laboratory, and collected coconut flesh. Some MF and NF fruit pulp samples were fixed in tissue fixative (FAA (formalin, glacial acetic acid and 50% alcohol in FAA was 8:58:7), Servicebio, Wuhan, China) to be used for observing the organizational structure. Some NF and MF fruit pulp samples were frozen in liquid nitrogen and then stored in a −80 °C freezer for subsequent analysis preparation.

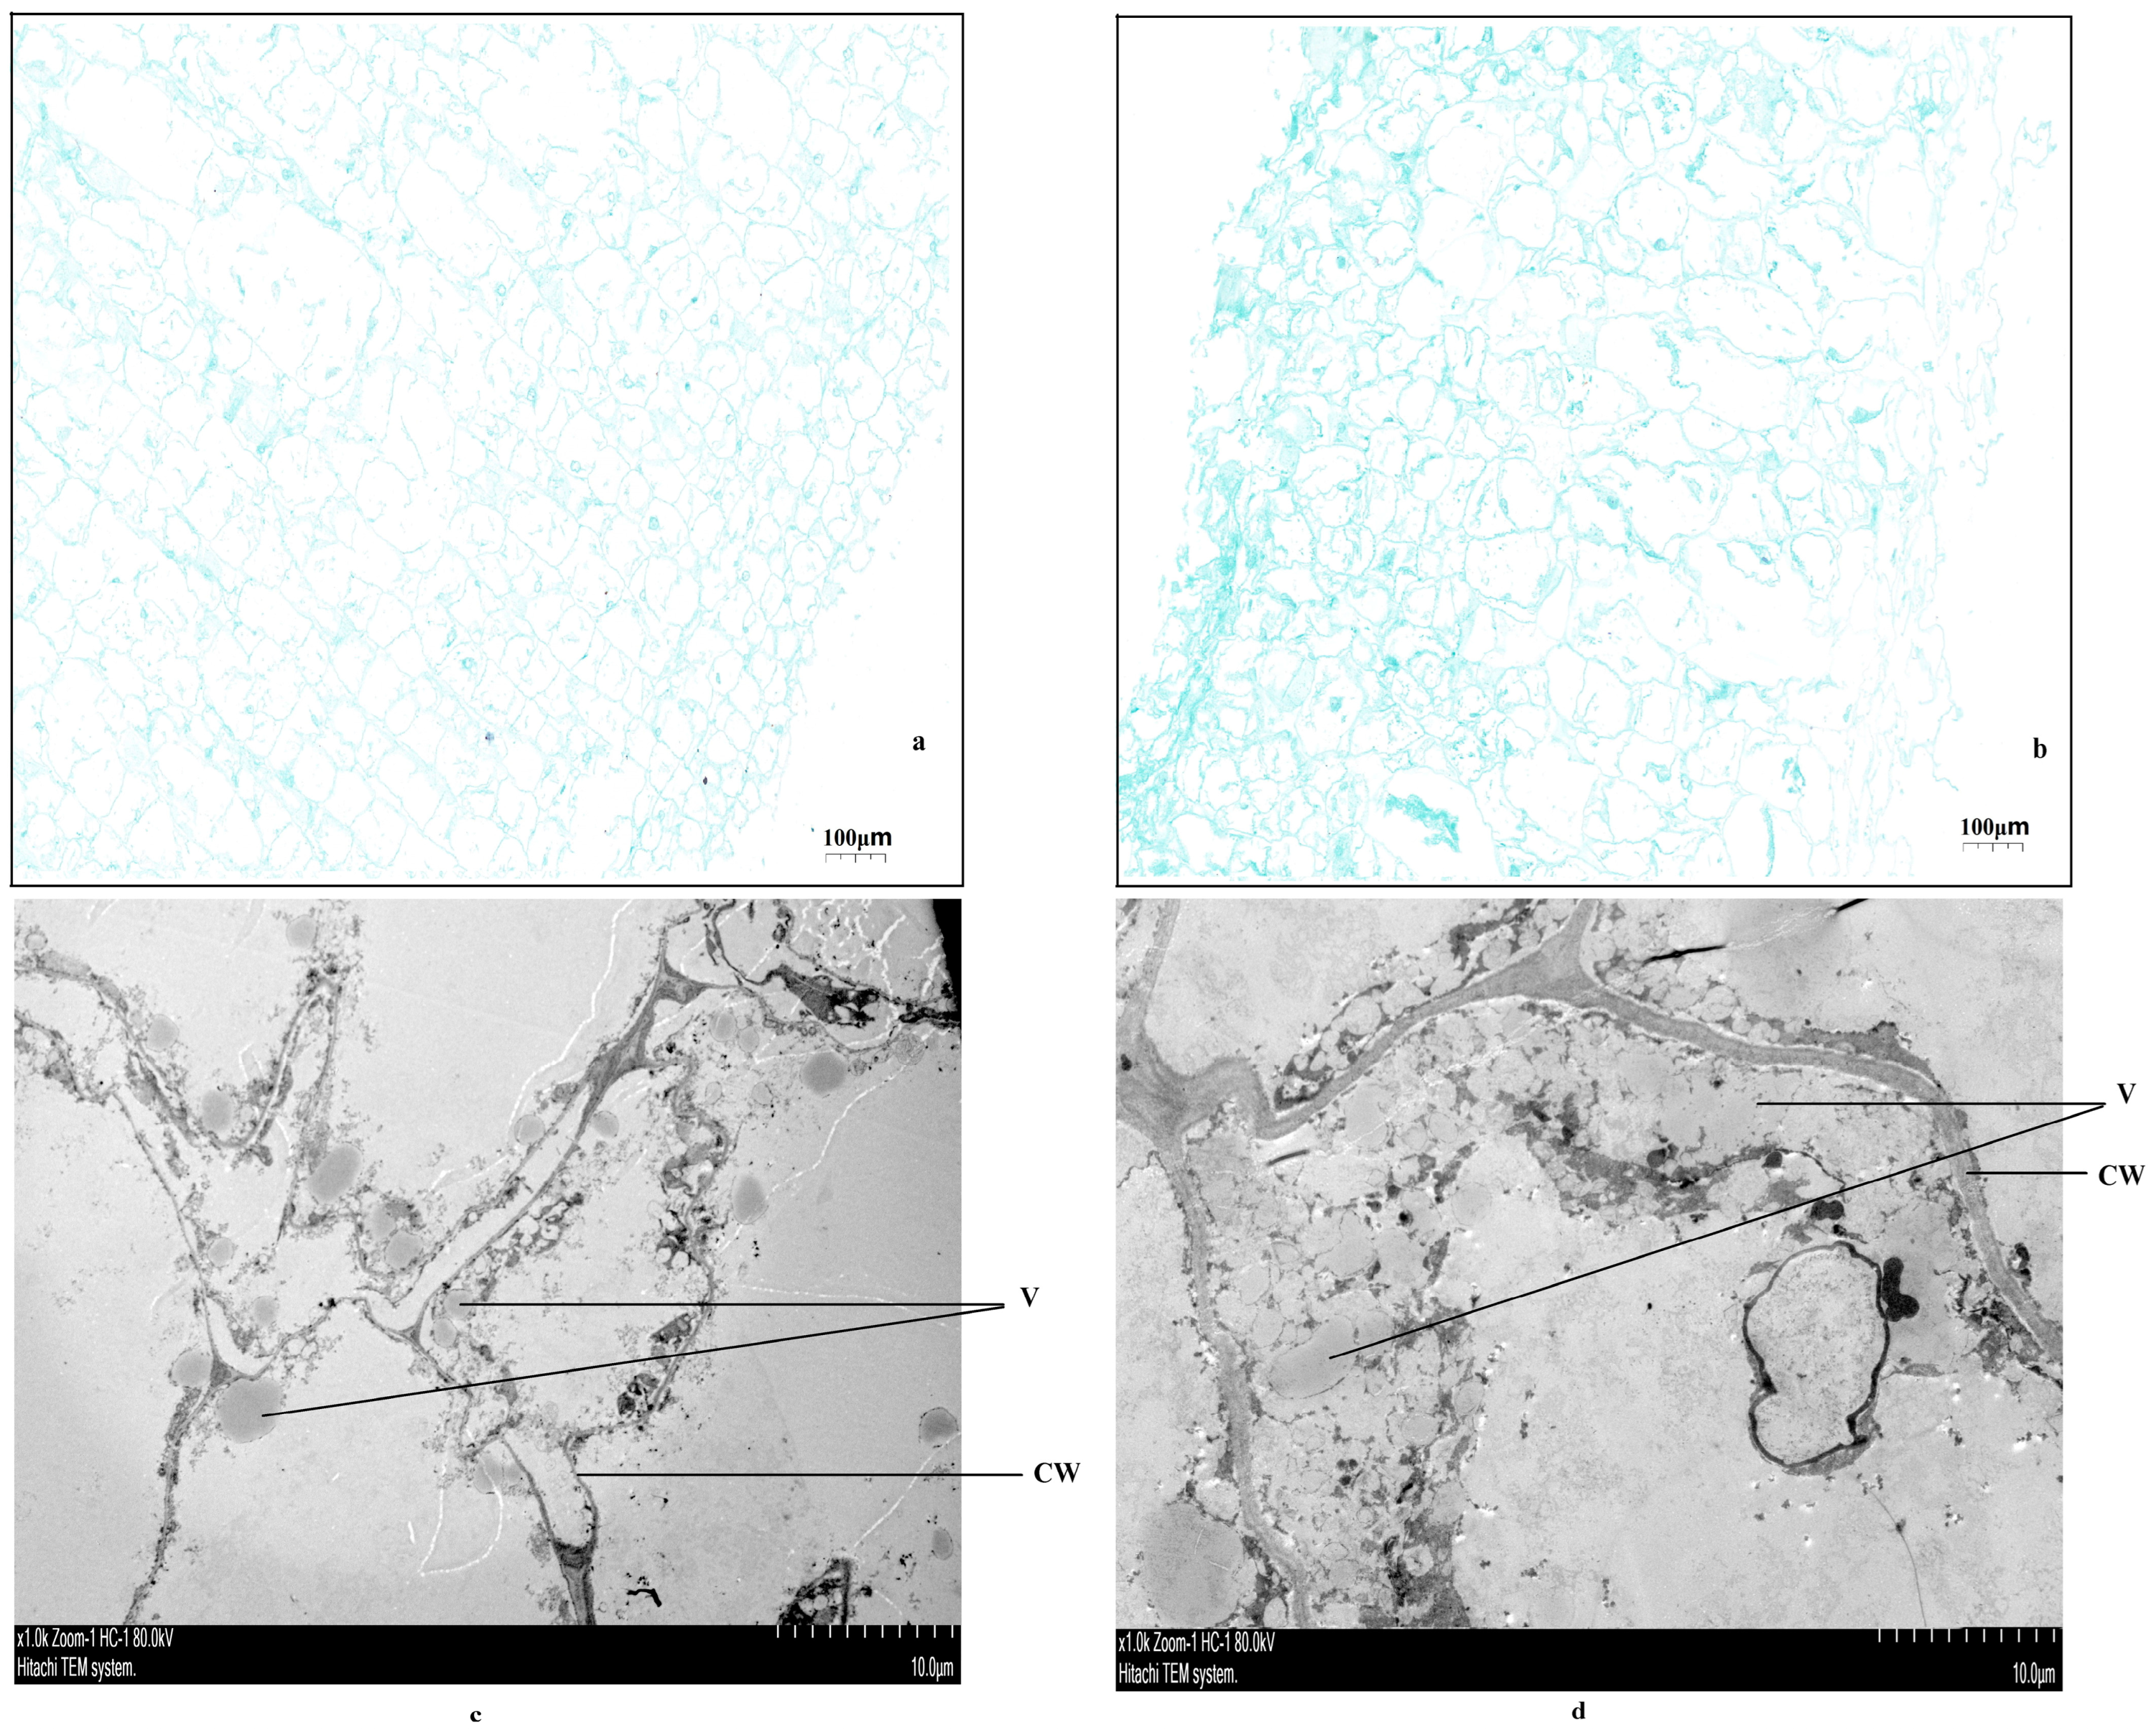
2.2. Observing the Microstructure of Coconut Pulp

To observe the visible microstructure of coconut pulp, we first used a surgical knife to remove small pieces of pulp and immediately fixed the tissue in formalin acetic acid alcohol (FAA) (Servicebio, Wuhan, China) buffer. Then, we dehydrated them with gradient ethanol series, soaked them in paraffin, embedded them, and sliced them. Then, we sequentially placed the slices into environmentally friendly dewaxing transparent solution I (G1128, Servicebio, Wuhan, China) for 20 min, environmentally friendly dewaxing transparent solution II for 20min, anhydrous ethanol I for 5 min, anhydrous ethanol II 5 min, and 75% alcohol for 5 min, then washed them with tap water. We sliced and stained the slices in plant safranin staining solution for 2 min, then rinsed them with tap water to remove excess dye. To create discoloration, the slices were sliced in a gradient of 50%, 70%, and 80% alcohol for 3–8 s. The slices were stained in plant solid green staining solution (G1031, Servicebio, Wuhan, China) for 6–20 s and dehydrated in anhydrous ethanol III tanks (time: 5/10/20 s). For transparent sealing, we put the slices into clean xylene for 5 min, then sealed them with neutral gum. Then, an upright optical microscope (Nikon Eclipse E100, Nikon, Tokyo, Japan) was used for examination, and an imaging system (Nikon DS-U3, Nikon, Tokyo, Japan) was used for image acquisition and analysis.
To observe the transmission structure of NF and MF pulp, small pieces of coconut pulp were taken using a surgical knife and immediately placed in a culture dish with electron microscope fixative. The surgical knife was then used to cut them into small 1 mm3 pieces in the fixative (G1102, Servicebio, Wuhan, China) of the culture dish. We transferred the cut tissue blocks to an EP tube containing a new electron microscope fixative for further fixation, and used a vacuum pump to evacuate the tube until the pieces sank to the bottom. After being stored at room temperature for 2 h, the pieces were fixed and transported at 4 °C. Then, 1% osmium acid (18456, Ted Pella Inc., Stockholm, Sweden) prepared with 0.1 M phosphate buffer PB (pH 7.4) was fixed at room temperature in the dark for 7 h. The samples were rinsed 3 times with 0.1M phosphate buffer PB (pH 7.4) for 15 min each time. The tissue underwent upward dehydration at room temperature with 30%, 50%, 70%, 80%, 95% and 100% alcohol in sequence, for 1 h each time. Anhydrous ethanol: acetone = 3:1 for 0.5 h, anhydrous ethanol: acetone = 1:1 for 0.5 h, anhydrous ethanol: acetone = 1:3 for 0.5 h, and acetone for 1 h. For permeation embedding, acetone: 812 embedding agent = 3:1 at 37 °C for 2–4 h, acetone: 812 embedding agent = 1:1 at 37 °C for overnight, acetone: 812 embedding agent = 1:3 at 37 °C for 2–4 h, and pure 812 embedding agent at 37 °C for 5–8 h. Pour pure 812 embedding agent into the embedding plate, insert the sample into the embedding plate, and bake overnight at 37 °C. For aggregation, the embedding plate was placed in a 60 °C oven for 48 h, and the resin block was removed for later use. The resin blocks were sliced into ultra-thin slices at 60–80 nm using an ultra-thin slicer. The copper mesh was stained in a 2% uranyl acetate saturated alcohol solution in the dark for 8 min, then washed with 70% alcohol three times, cleaned with ultrapure water three times, stained with 2.6% lead citrate solution in the absence of carbon dioxide for 8 min, cleaned with ultrapure water 3 times, and slightly absorbed with filter paper. Copper mesh slices were placed in a copper mesh box and dried at room temperature overnight. Then, images were observed and analyzed using a transmission electron microscope (HT7800/HT7700, Hitachi, Tokyo, Japan).

2.3. Measurement of Nutrient Substance

To study whether malformed fruits (MFs) had an impact on the nutritional content of coconut pulp or whether there was a necessary relationship between them, we measured the nutritional content of the coconut pulp. The soluble sugar content and starch content were determined by the anthrone colorimetric method, while the reducing sugar content was determined by the 3,5-dinitrosalicylic acid (DNS) method. The soluble protein content was determined using the Coomassie Brilliant Blue G-250 method, with specific steps referring to the method used by Gao (2006) [49]. Each treatment had 3 biological replicates. The crude fat content was determined using a Soxhlet extractor (fat analyzer) (JK-CFD-6, Shanghai Jingxue Scientific Instrument Co., Ltd., Shanghai, China) to determine the oil content of the crushed coconut pulp by the Soxhlet extraction method.

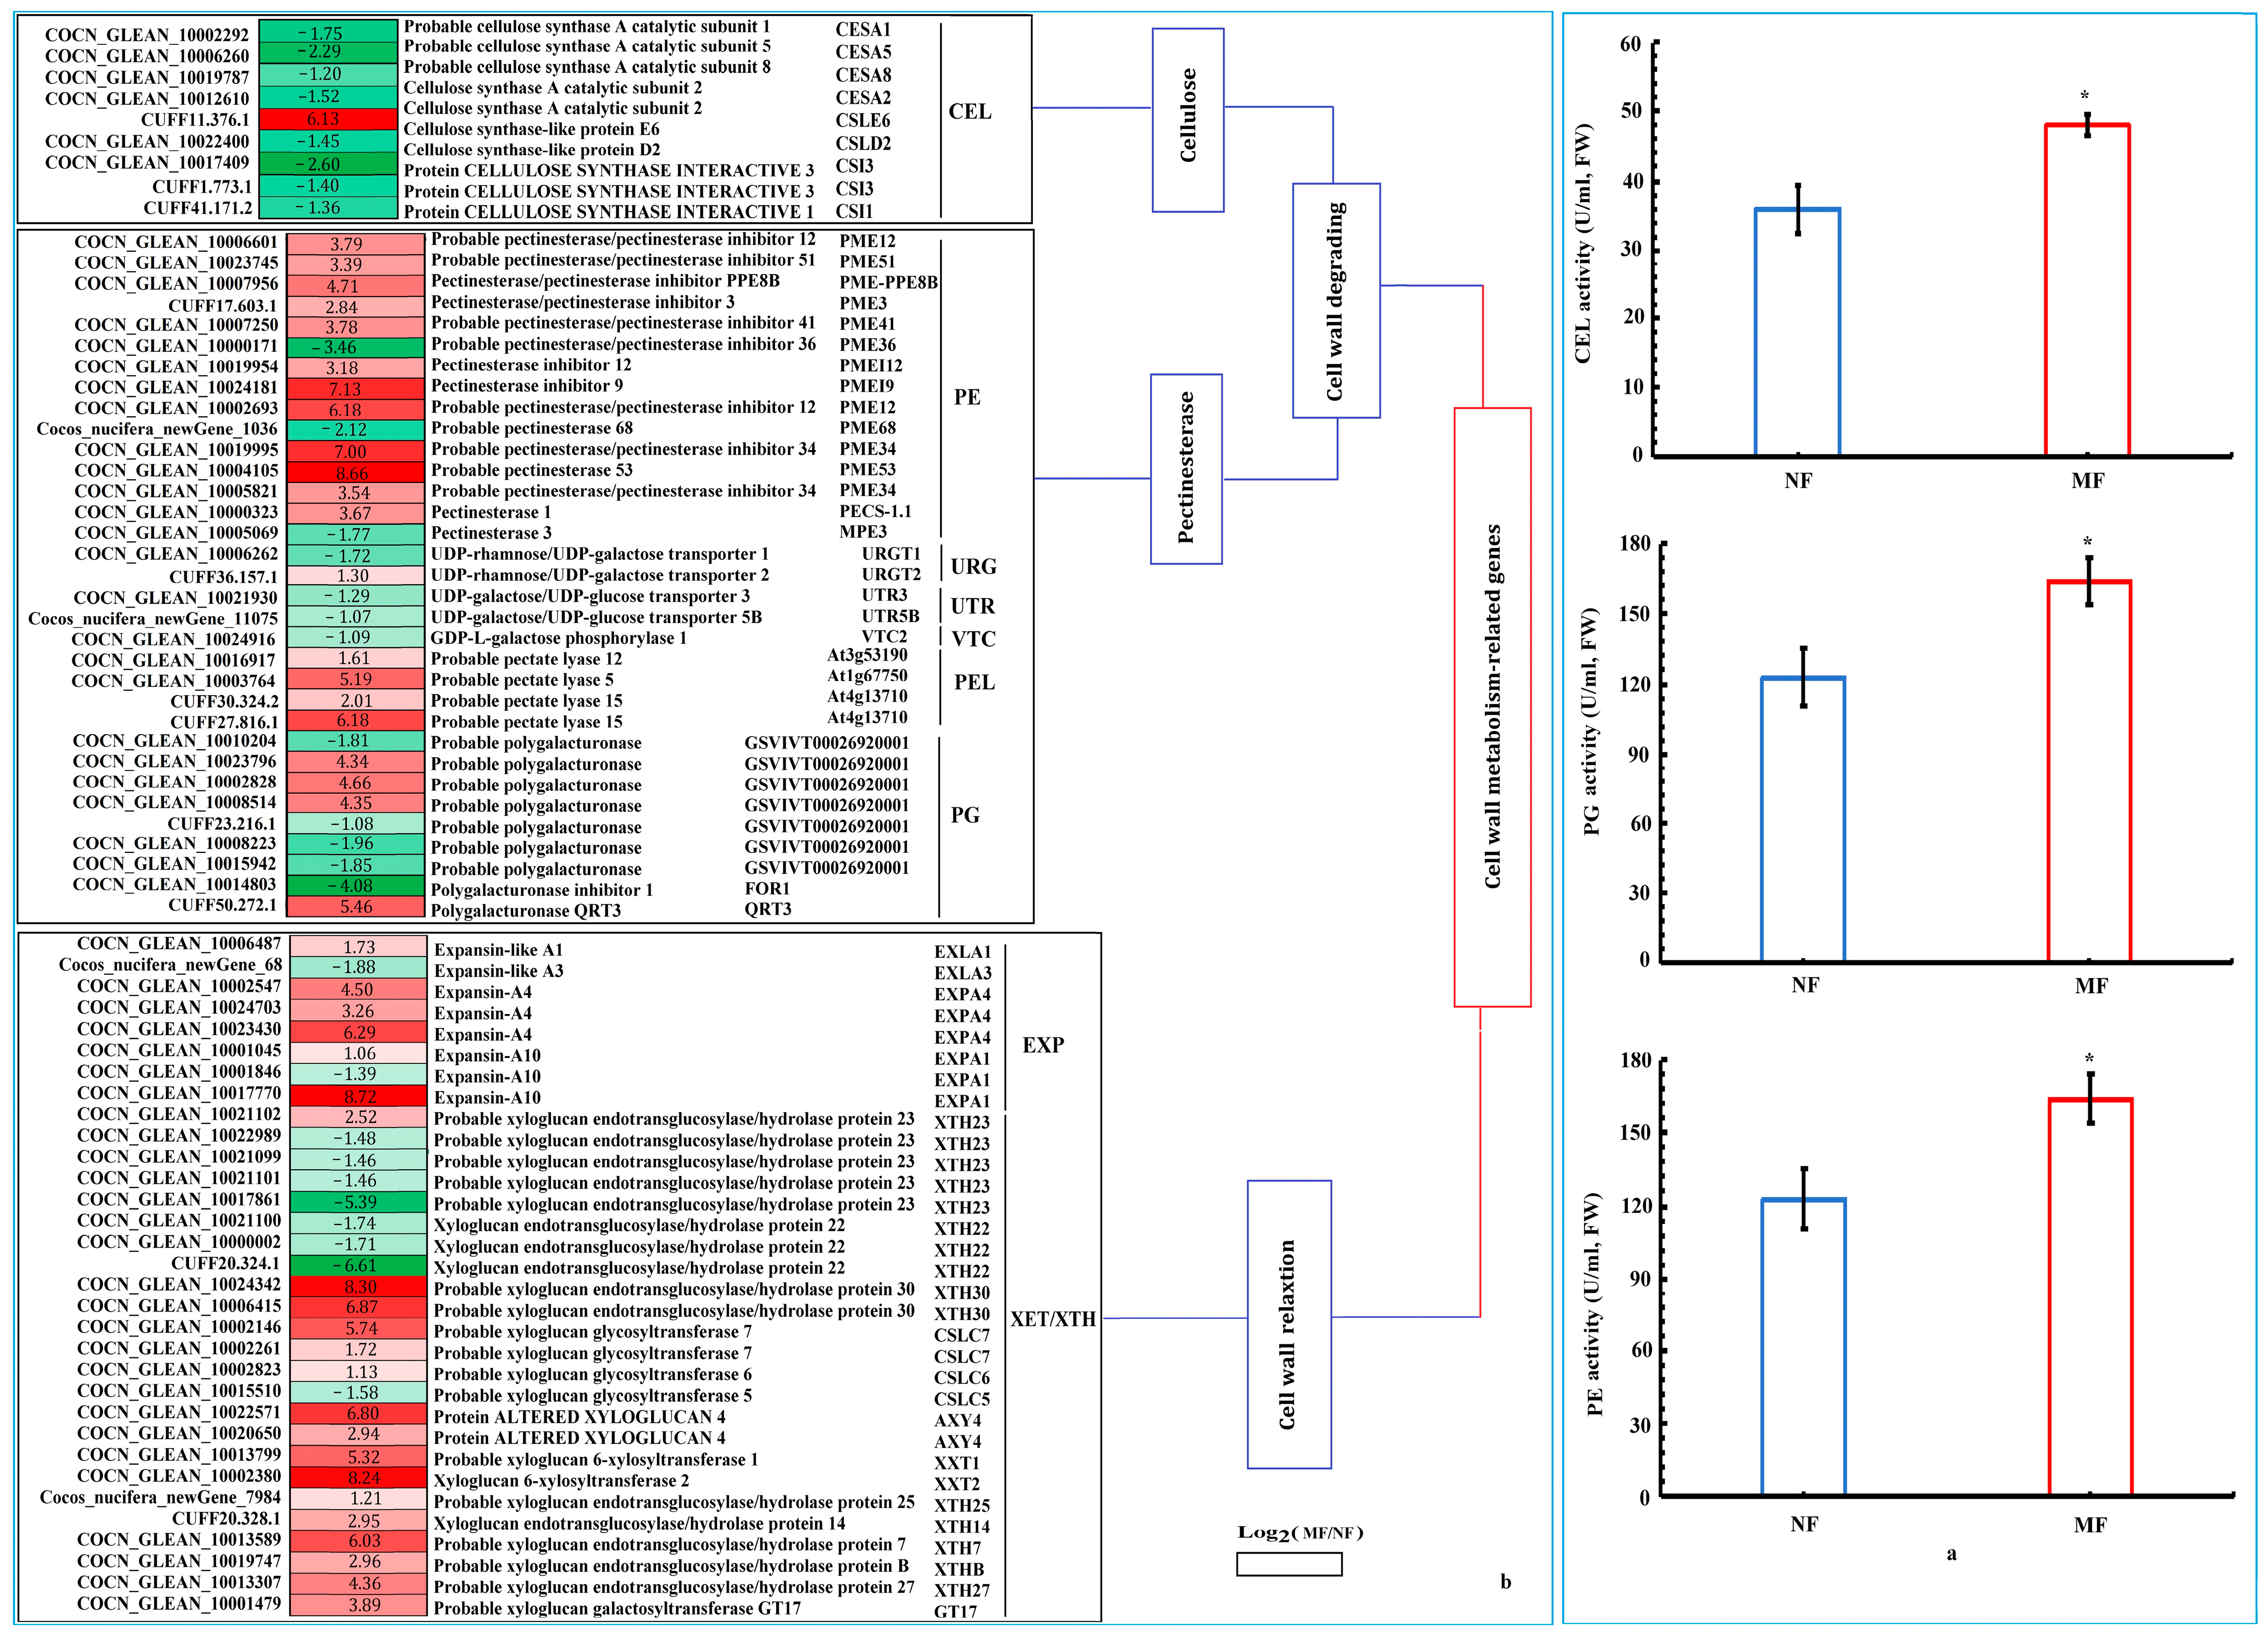
2.4. Measurement of Cell Wall Related to Enzyme Activity

The CEL, PE, and PG activities of MF and NF fruit pulp were determined using a reagent kit (Solario, Beijing, China). Each measurement indicator was tested three times. These indicators were developed by the Nanjing Jiancheng Biotechnology Research Institute (http://www.njjcbio.com/ (accessed on 15 August 2022) for testing. We accurately weighed a total of 0.1000 g of fruit pulp tissue and mixed it with pre-cooled PBS in a weight–volume ratio of 1:10. The sample was ground at high speed and centrifuged at 2500 rpm for 10 min, then measured with 50 µL supernatant and 0.2 mol/L pH 6.0 HAc-NaAc buffer. The reagent kit adopted a double antibody one-step sandwich enzyme-linked immunosorbent assay (ELISA). We added the sample, a standard antibody, and an HRP labeled detection antibody together with CEL, PE, and PG antibodies into pre-coated micropores, then incubated and washed it. Using substrate TMB for color development, TMB was converted to blue under peroxidase catalysis and to the final yellow under acid action. We used an enzyme-linked immunosorbent assay (ELISA) reader (DG5033A, Nanjing Huadong Electronic Group Medical Equipment, Nanjing, China) to measure the absorbance (OD values) of CEL, PE, and PG at wavelengths of 550, 540, and 450 nm, and calculated the sample activity. The active units of CEL, PE, and PG were U/mL. We strictly followed the instructions in the incubation manual for time, liquid dosage, and sequence. All liquid components should be thoroughly shaken before measurement. All measurement results were taken 10 min after adding the termination solution. The concentration/activity was calculated based on the absorbance value according to the manufacturer’s formula [50].

2.5. Measurement of Phytohormones

To further research the hormone changes in malformed coconut fruits, the levels of IAA, ABA, GA, CK, BR, JA, SA and ETH in the pulp of MF and NF were analyzed. The contents of phytohormones (IAA, GA, CK, BR, ABA, JA, SA and ETH) were determined using liquid chromatography mass spectrometry (LC-MS) (BioAccord LC-MS, Waters, Milford, MA, USA), following the methods of Balcke et al. (2012), Owen and Abrams (2009), and Lu et al. (2024) [50,51,52]. For transcriptome sequencing, 0.5–1.0 g of the same sample was powdered in liquid nitrogen and added to 5 mL of pre-cooled 80% methanol. Then, it was rinsed with 3 mL and 2 mL of methanol, transferred to a 50 mL centrifuge tube, placed in ice, and left for 12 h at 4 °C in the dark. Then, we centrifuged the sample at 10,000× g for 10 min, transferred the supernatant to a 50 mL centrifuge tube, and placed it at 4 °C in the dark. Then, we added 5 mL of pre-cooled 80% methanol and leached it for 12 h at 4 °C in the dark. We centrifuged it at 10,000× g for 10 min, collected the supernatant, mixed it with the supernatant for the first time, placed the sample containing the test tube in the refrigerator, and shook it well at 100 rpm/min for 1 h in the dark. Then, the sample was centrifuged at 10,000× g for 10 min, and the supernatant was poured into a C18 SPE column. The effluent solution was collected in a new 50 mL centrifuge tube. Then, we covered it with preservatives, made a precise hole in the middle with a toothpick, rapidly freeze-dried it in liquid nitrogen, and transferred it to a freeze dryer for more than 36 h. Then, 1 mL of pre-cooled methanol was added to completely dissolve the freeze-dried powder sample. Finally, the sample solution was aspirated using a 2.5 mL syringe and passed through a 0.45 μm organic ultrafiltration membrane to determine the levels of different hormones. Each organism underwent three repeated technical measurements [52].

2.6. Transcriptomics Analysis

RNA was extracted from frozen samples using enhanced cetyltrimethylammonium bromide (CTAB) method. The quality and integrity of the RNA were detected by agarose gel electrophoresis. Subsequently, the concentration of the RNA (values of A260/A280 at 1.9–2.1) was measured using a NanoDrop 2000 spectrophotometer (Thermo Fisher Scientific, Waltham, MA, USA), while the integrity of the RNA was quantified using an Agilent 2100 Bioanalyzer system (Agilent Technologies, Palo Alto, California, USA). Library construction and RNA seq analysis were conducted at Beijing Biomarker Biotechnology Company and Beijing Biomarker Cloud Technology Company, both located in Beijing, China, respectively. Using the NEBNext® Ultra™ II RNA library preparation kit generates an RNA library and adds index codes to individual samples. Subsequently, Illumina® Sequencing was performed by the HiSeq2500 platform (San Diego, CA, USA). Three replicates of the sequencing were performed for each sample. The raw reads were filtered to eliminate low-quality reads and adapters. We aligned the obtained clean reads with the reference coconut genome using the HISAT2 (Hierarchical Index of Transcriptional Splicing Alignment) program [53]. Using various databases for gene function annotation, including the homologous protein cluster (COG/KOG), the Kyoto Encyclopedia of Genes and Genomes (KEGG), Gene Ontology (GO), and so on [54,55]. The transcript fragment mapping per kilobase (FPKM) for each transcript region was calculated by RESM software (3.8.6) [56]. Differential gene expression analysis between samples was performed by DESeq software (1.6.3), and by using the Benjani–Hochberg method to determine the significance according to the significance level defined by |log2 (FC)| ≥ 1 and p < 0.01 [57]. Enrichment analysis of GO terms from the DEGs was performed by the GOseq R software package (2.18.0) [58,59]. The KEGG homology annotation system (KOBAS) software (3.0) was used for KEGG enrichment analysis of the DEGs [52,60]. Six samples (three biological replicates of two treatments (NF and MF)) were processed and subjected to sequencing quality control, resulting in a total of 43.35 GB of clean data. The Q30 base percentage of each sample was not less than 94.30% (Table S1).

2.7. Validation of DEGs in Coconut Fruit via qRT-PCR

DEGs in coconut fruits were detected by RN sequencing through real-time fluorescence quantitative polymerase chain reaction validation (qRT-PCR). We also designed gene-specific qRT-PCR primers (Table S2). qPCR light cycling was performed on a 96-well plate using a 480 II real-time system (Roche, Carlsbad, CA, USA) and Hieff qPCR SYBR green master mixture (NotRox) from Yasen Biotechnology (Shanghai, China) according to the manufacturer’s protocol. The thermal cycling scheme included initial denaturation for 5 min at 95 °C, followed by denaturation for 10 s at 95 °C and annealing/extension for 30 s at 60 °C. All analyses of qRT-PCR were performed using 3 biological replicates and 3 technical replicates. The data were normalized using the internal reference gene (β-actin). The relative gene expression level was calculated using the 2−∆∆ CT method [52,61].

2.8. Statistical Analysis of Data

The data represent the mean ± standard deviation (SD) obtained from three biological replicates. Statistics were conducted by SPSS software (version 20.0, SPSS, Chicago, IL, USA). One-way analysis of variance (ANOVA) was used to evaluate the differences between samples. A Student’s t-test was used to determine the significance of the difference. A significance level of p < 0.05 was considered statistically significant. Tables and graphs were generated using Excel 2020.

3. Results

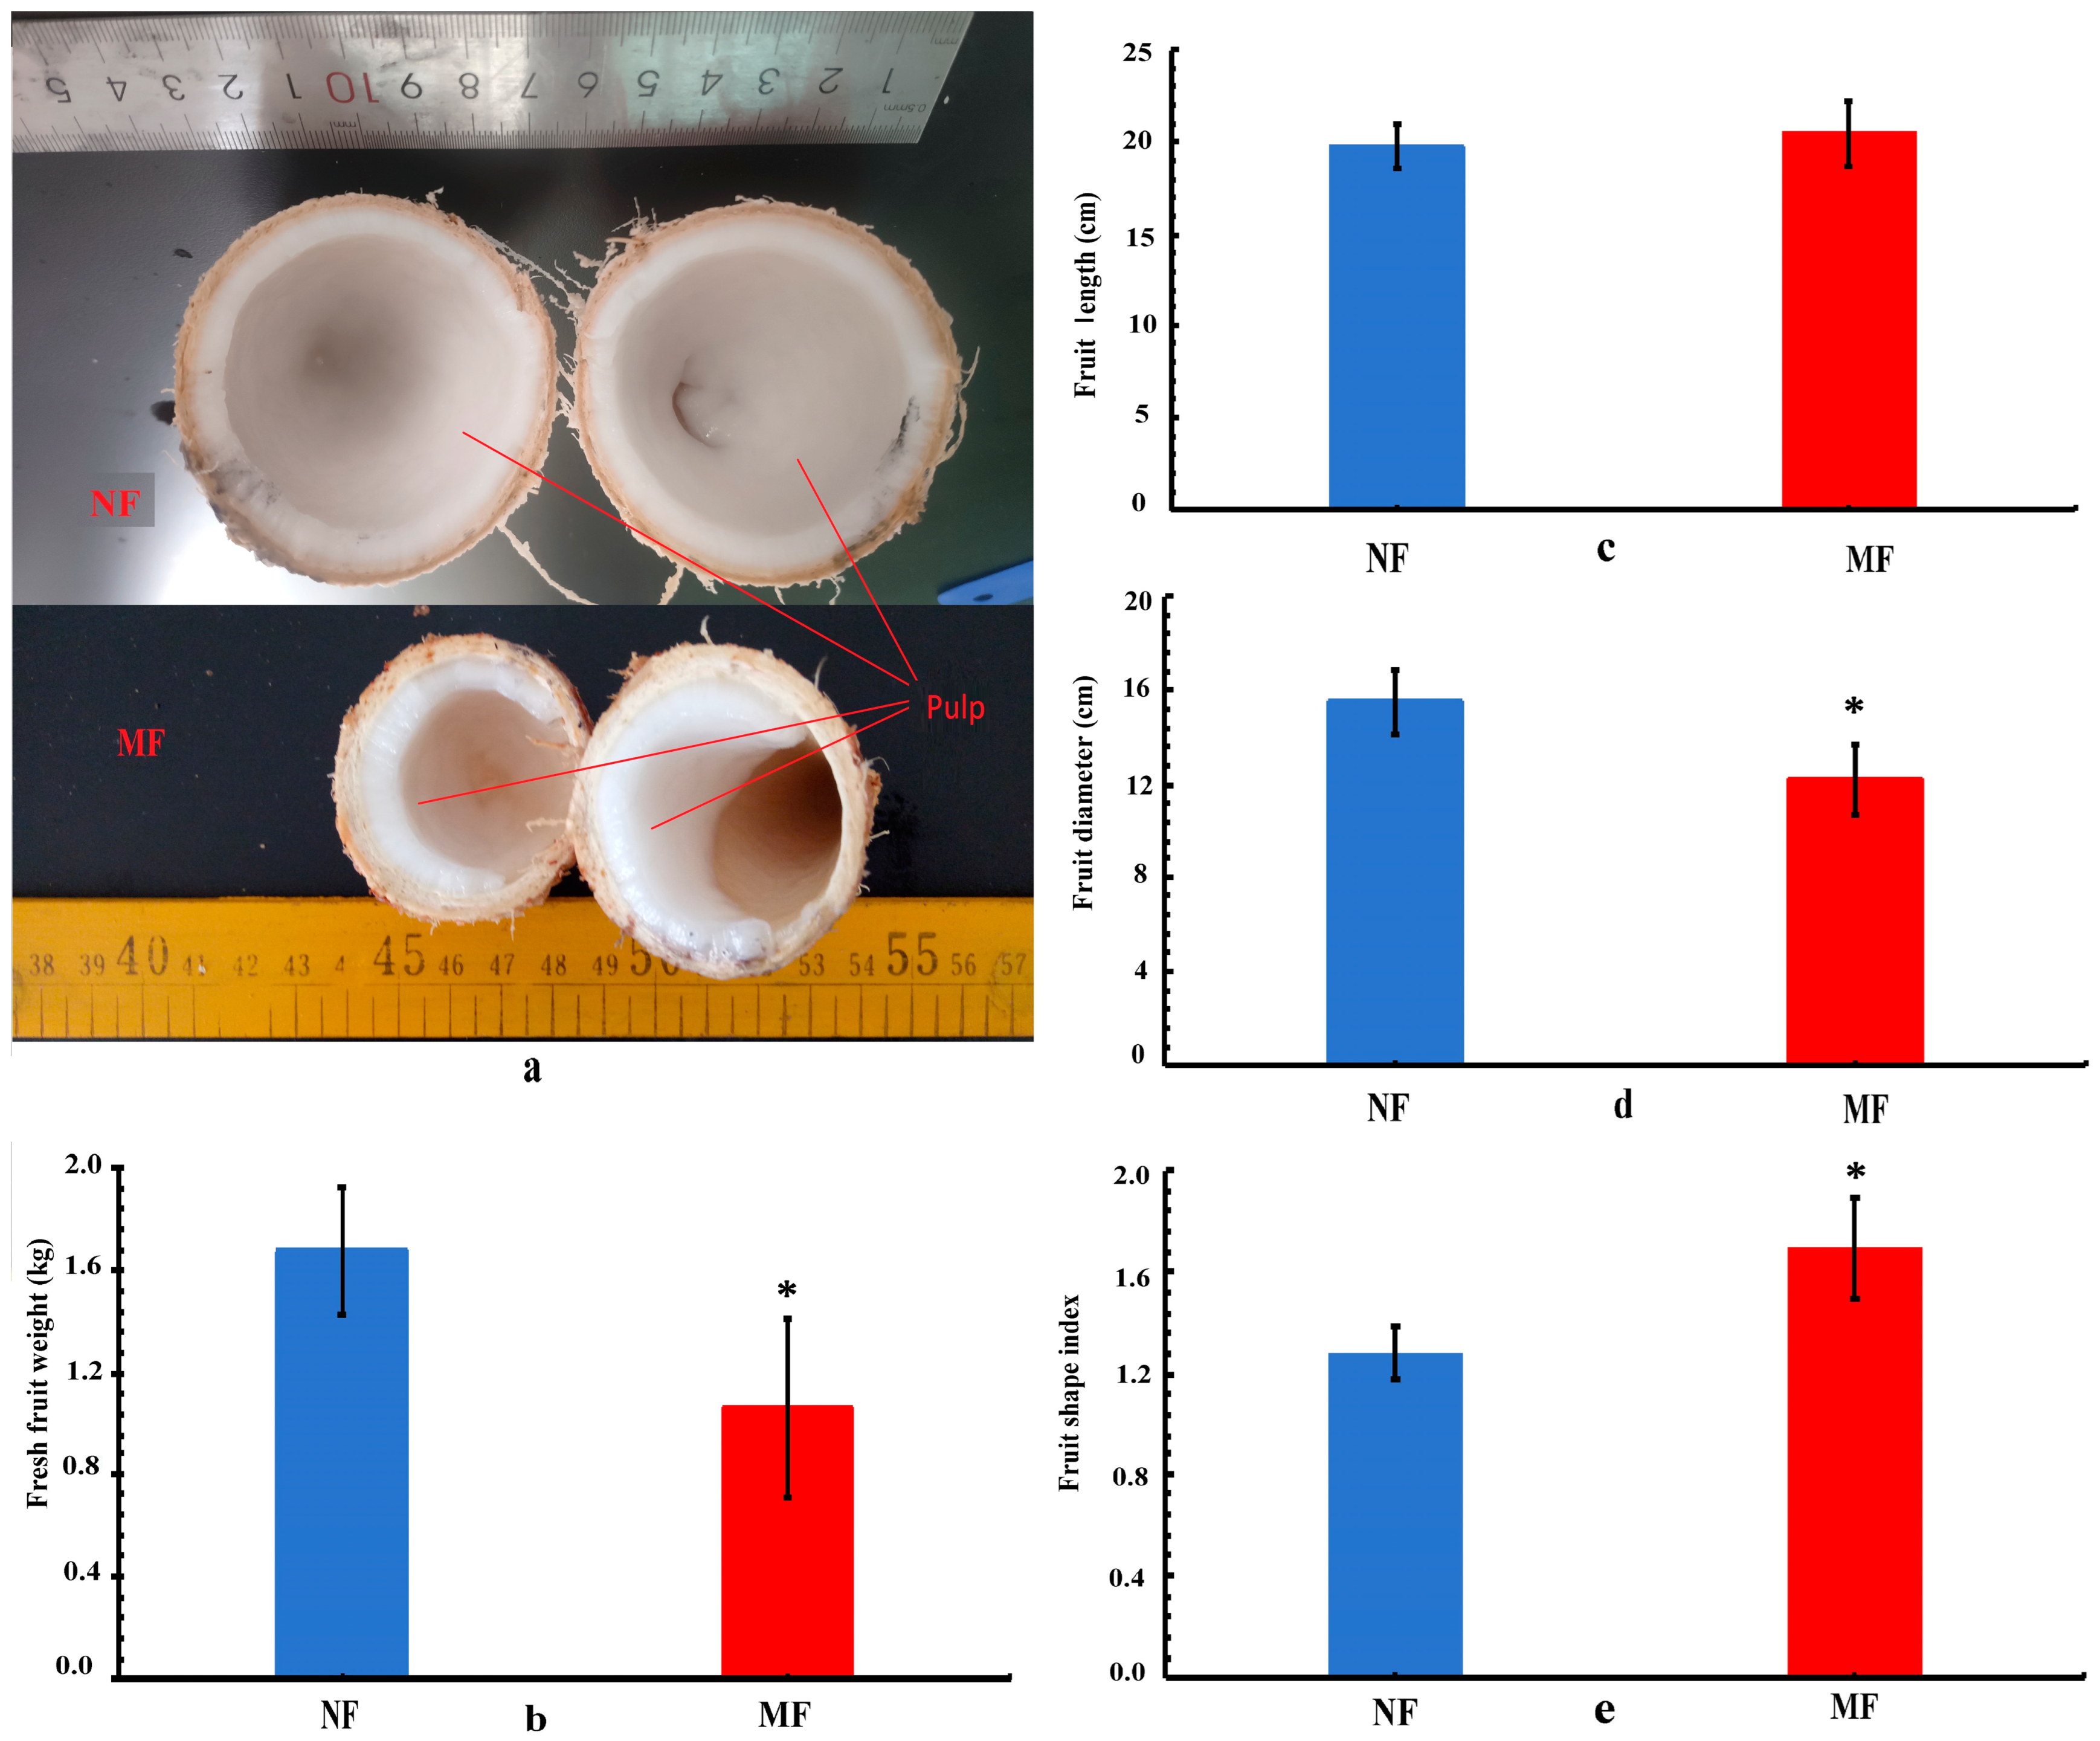
3.1. Morphological Comparison of Fruit

According to the observation of the morphological characteristics of 8-month-old fruits. NFs were elliptical in shape, with smooth and wrinkle-free skin. On the contrary, MFs were long and thin circular in shape, with slightly rough and wrinkled skin (Figure S1). The NF pulp was white, smooth, and tight, while the MF pulp was dull, rough, and uneven (Figure 1a). Moreover, the average weight of MF fruits (1.061 kg) was significantly lower than that of NF fruits (1.678 kg) (Figure 1b). The fruit diameter (FD), length (FL), and shape index (FSI: length by diameter ratio) of an NF were 15.51 cm, 19.80 cm, and 1.28 cm, respectively. The FD, FL, and FSI of an MF were 12.12 cm, 20.45 cm and 1.70 cm, respectively (Figure 1c–e). From this, it can be seen that the FSI of the MFs was greater than that of the NFs, which further indicates that the appearance of MFs and NFs is significantly different. In addition, observation of paraffin sections of the anatomical structure of coconut fruit pulp showed that NF pulp cells had a neat and dense shape, while MF pulp cells had a disordered and loose shape (Figure 2a,b). Using transmission electron microscopy to observe the ultrastructure of NF and MF pulp, the thickness of the cell wall in MF pulp was much larger than that in NF pulp. The cell vacuoles in MF pulp were larger, more numerous, and scattered, while the cells in NF pulp were smaller and more concentrated (Figure 2c,d). These results indicated that the MF pulp had undergone deformation. Meanwhile, it also indicated that there may be a significant correlation in the morphology and pulp cell structure between MFs and NFs.

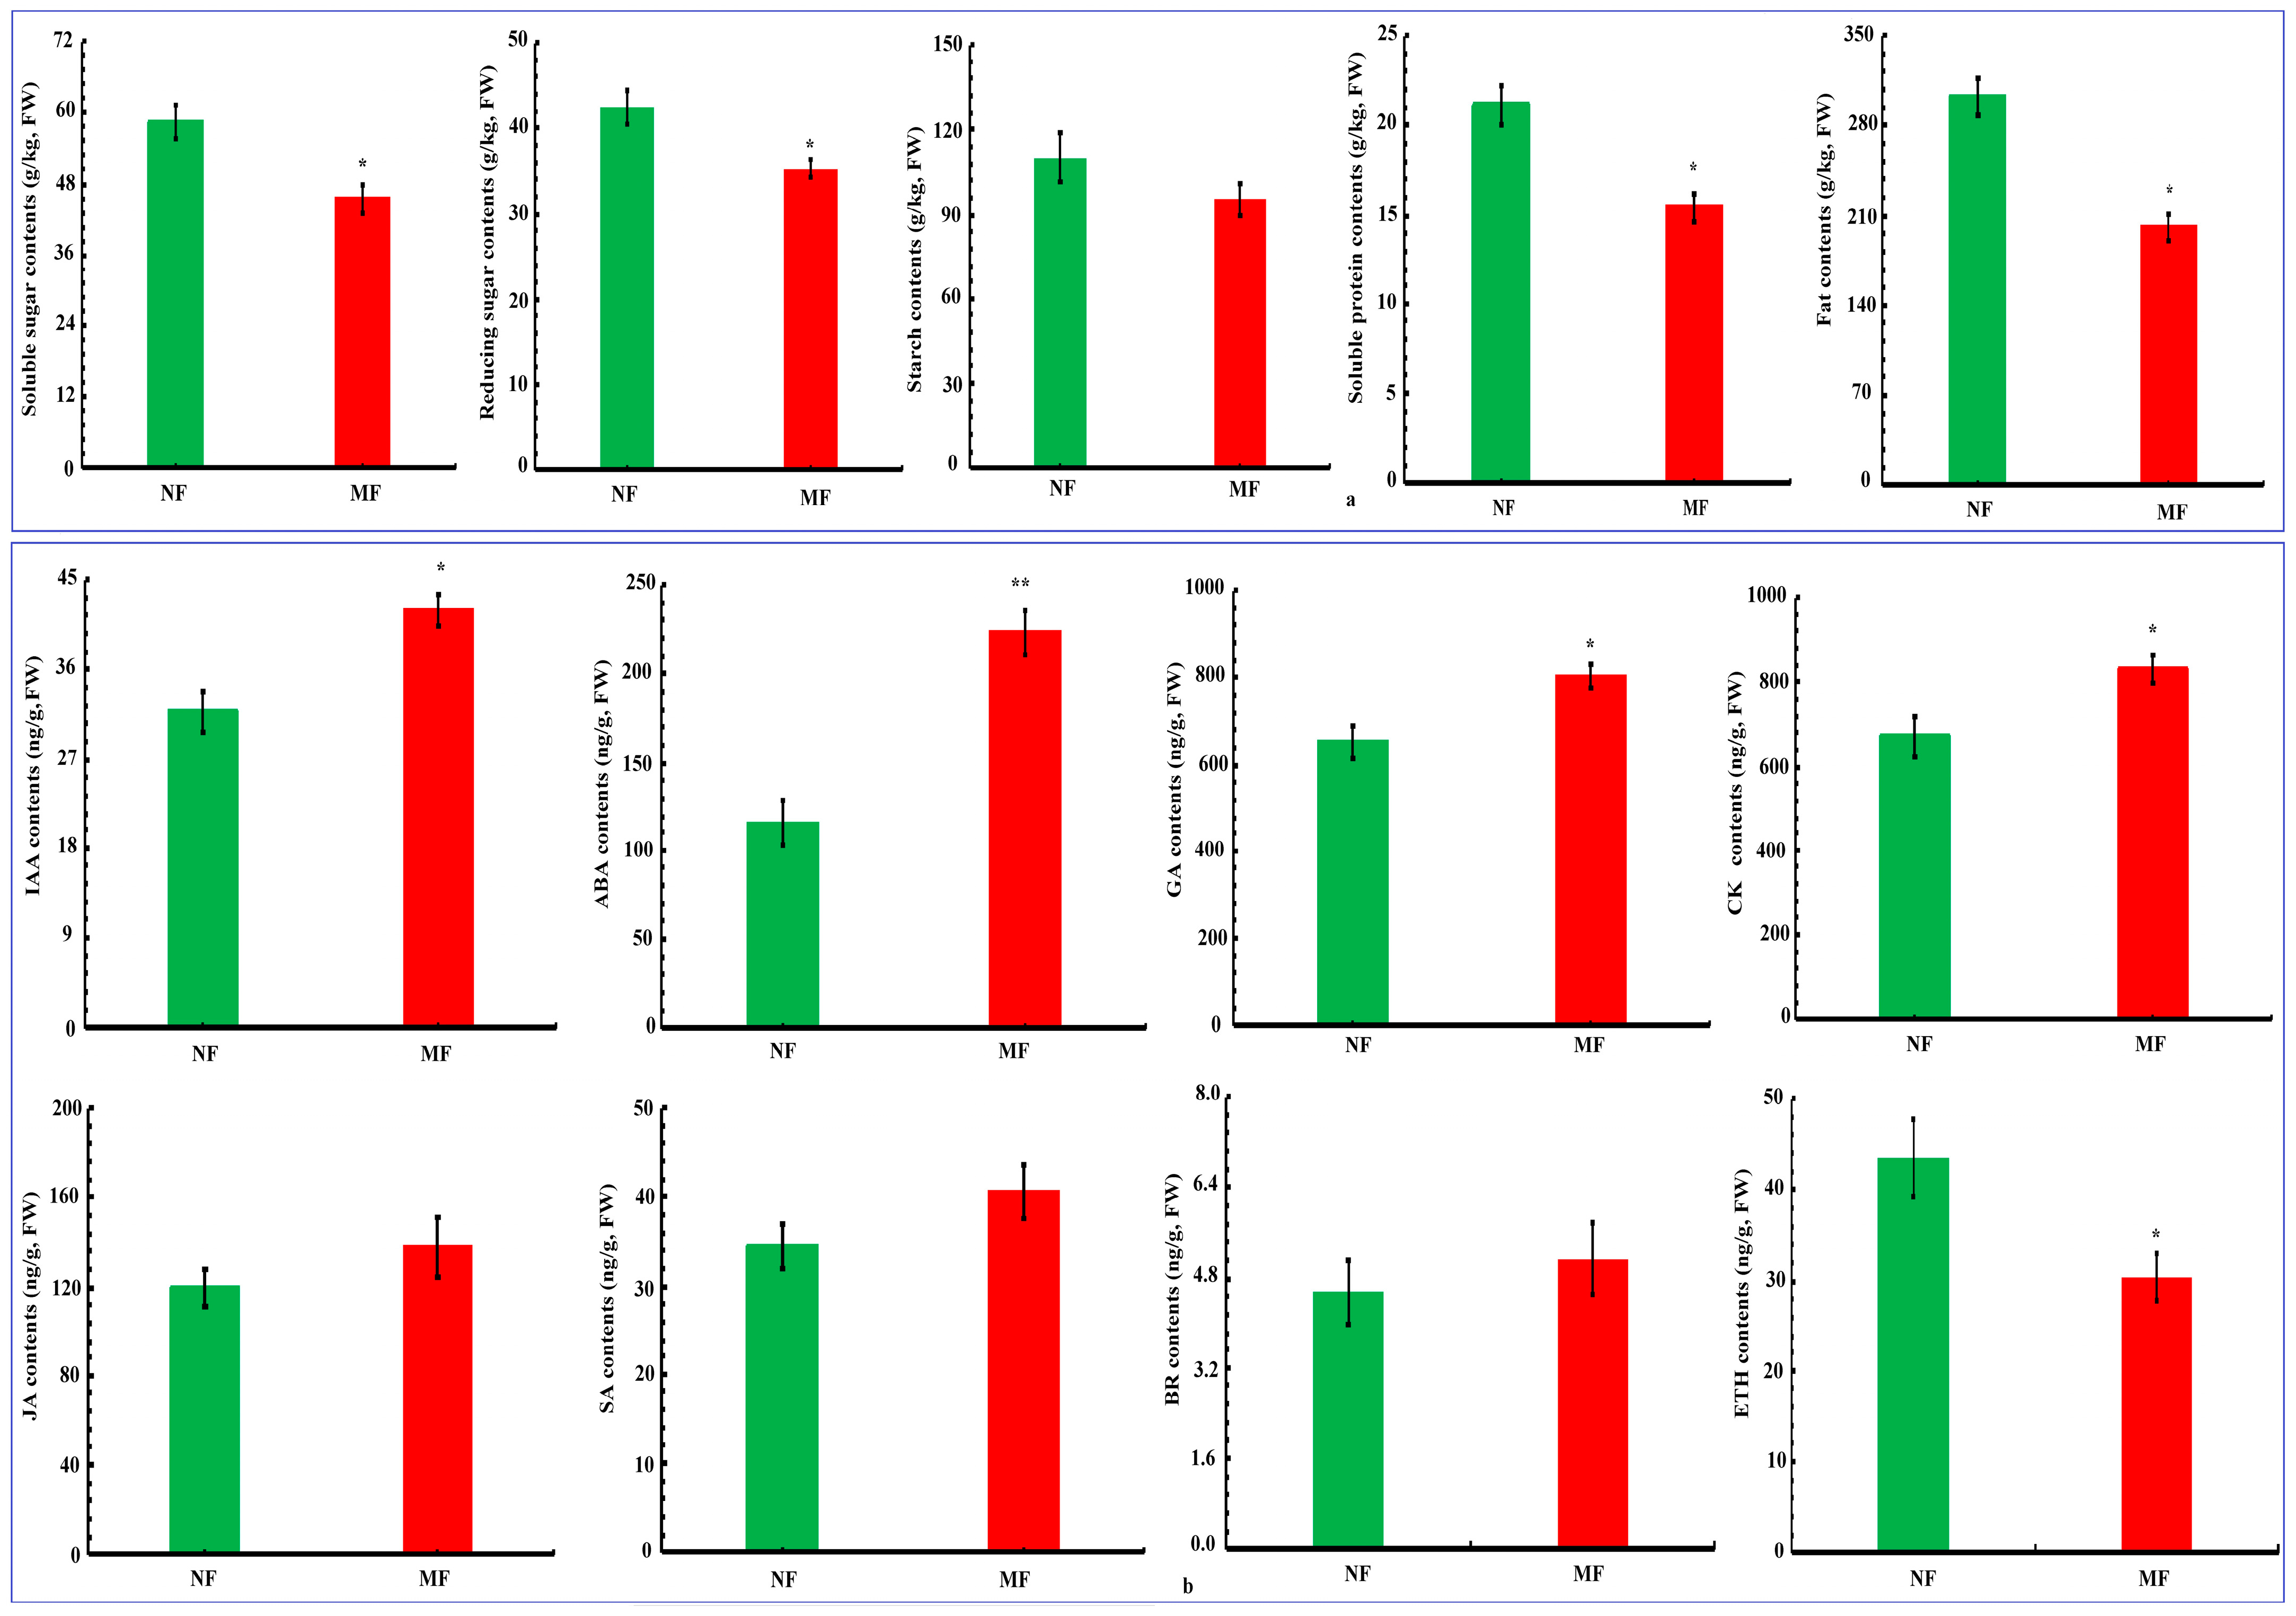
3.2. Nutrient Substance, Phytohormone Content in Fruit

To study whether malformed fruits (MFs) had an impact on the nutritional content of coconut pulp or whether there was a necessary relationship between them, we measured the nutritional content of coconut pulp. The research results showed that the SS, RS, SH, SP, and FA in the pulp of MFs were lower than in NFs, with reductions of 28.57%, 20.43%, 15.51%, 36.78%, and 50.18%, respectively. Among them, SS, RS, SP, and FA decreased the most significantly (Figure 3a). This result suggests that the decrease in nutrients in the pulp of malformed fruits is likely due to metabolic disorders within the fruits, leading to nutrient loss. These results indicate that the production of coconut malformed fruits may be inevitably relevant to the physiological, biochemical metabolism, and cellular structure of coconut pulp.
To further research the hormone changes in coconut malformed fruits, the levels of IAA, ABA, GA, CK, BR, JA, SA and ETH in the pulp of MFs and NFs were analyzed. The contents of IAA, ABA, CK, GA, and BR in the pulp of MFs were higher than those in the pulp of NFs. They increased by 31.82%, 92.97%, 23.10%, 23.69%, 12.72%, 15%, and 17.72% respectively. Compared to NFs, the content of IAA, ABA, CK, and GA in MFs significantly increased. However, the ETH content was significantly lower, decreasing by 30.09% (Figure 3b).

3.3. Transcriptome

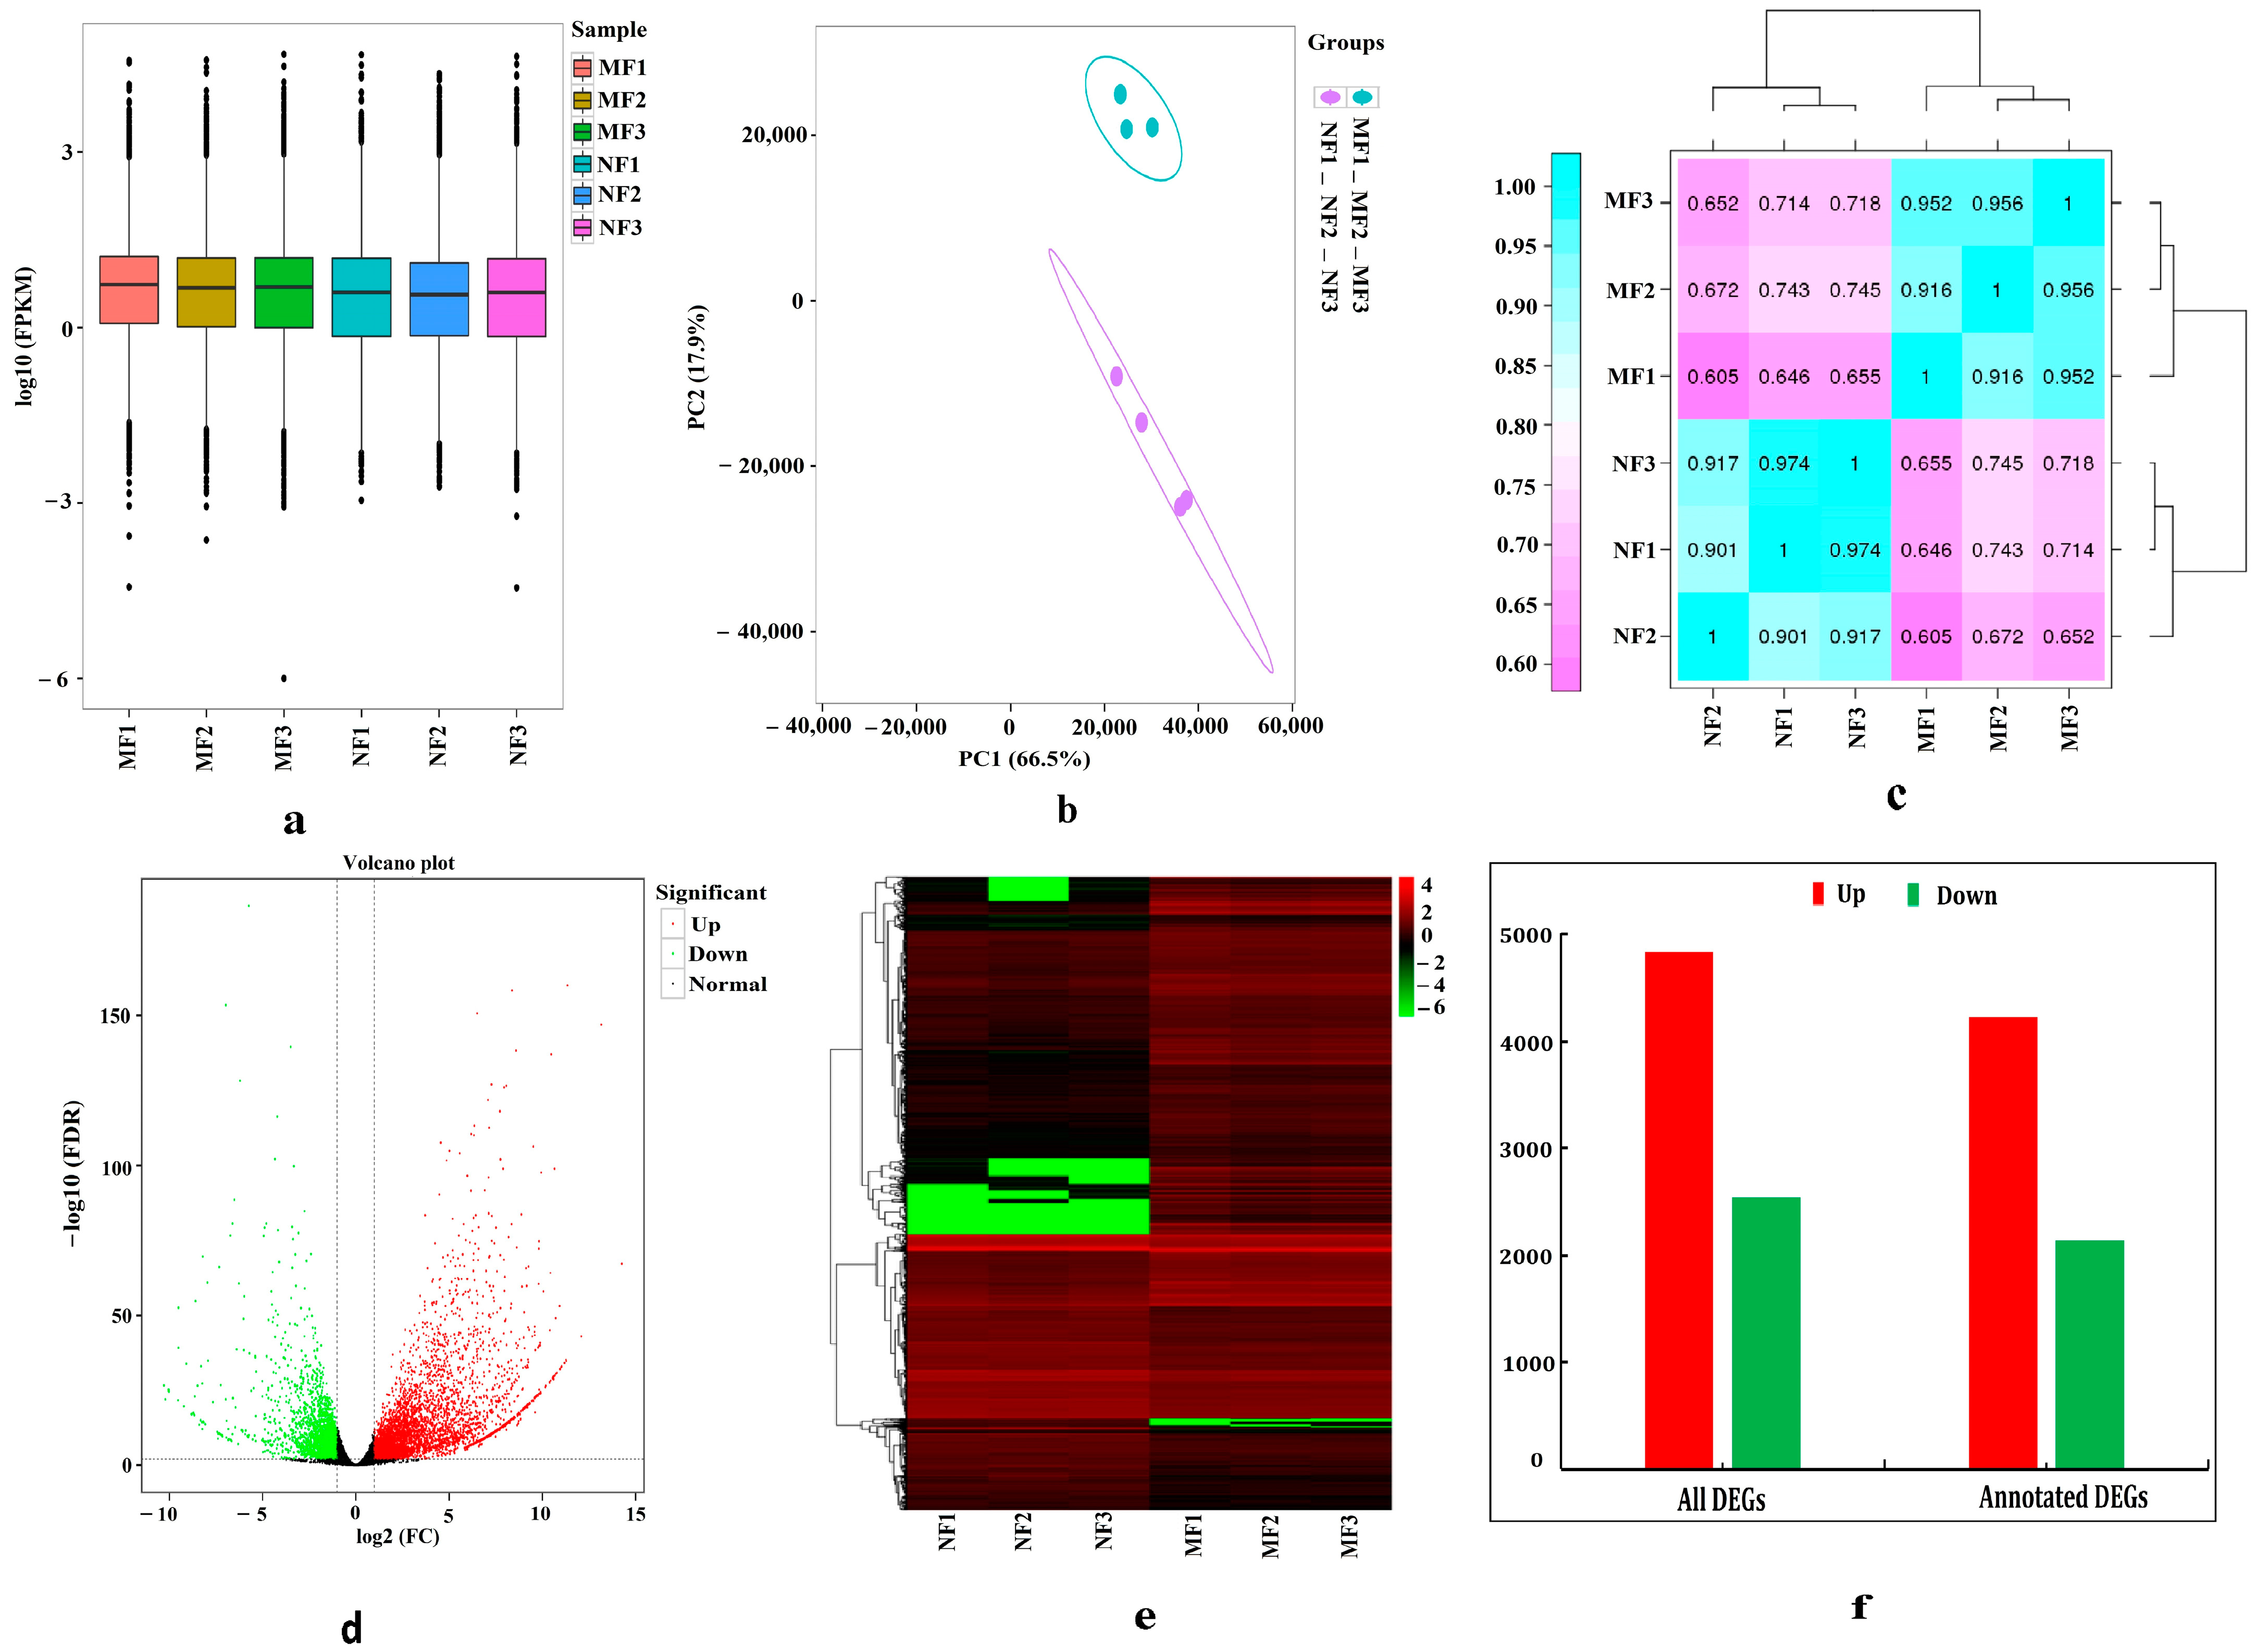
3.3.1. Evaluation of Transcriptome Sequencing Data

According to the comparison results, the alignment efficiency between the reads of each sample and the reference genome ranges from 90.39% to 94.43% (Table S3). RNA-seq detected 23,601 genes with FPKM in NFs vs. MFs (Table S4). Using FPKM > 1 as the threshold for determining gene expression, the log10 (FPKM) values in the MF sample had a wide distribution range, indicating that the FPKM values in the MF sample were relatively dispersed (Figure 4a). The PCA results showed that the NF and MF samples were clustered separately, indicating significant differences in gene expression between NFs and MFs. The three biological replicates in NFs and MFs were strictly clustered together, indicating high biological reproducibility of the samples processed in each group (Figure 4b). We used Spearman’s correlation coefficient as an evaluation index for biological repeat correlation. Spearman’s correlation coefficient further revealed the high correlation between all samples (Figure 4c). Figure 4d,f show more upregulated DEGs than downregulated ones. In addition, the results also showed some differences in the expression of DEGs in NFs vs. MFs (Figure 4e).

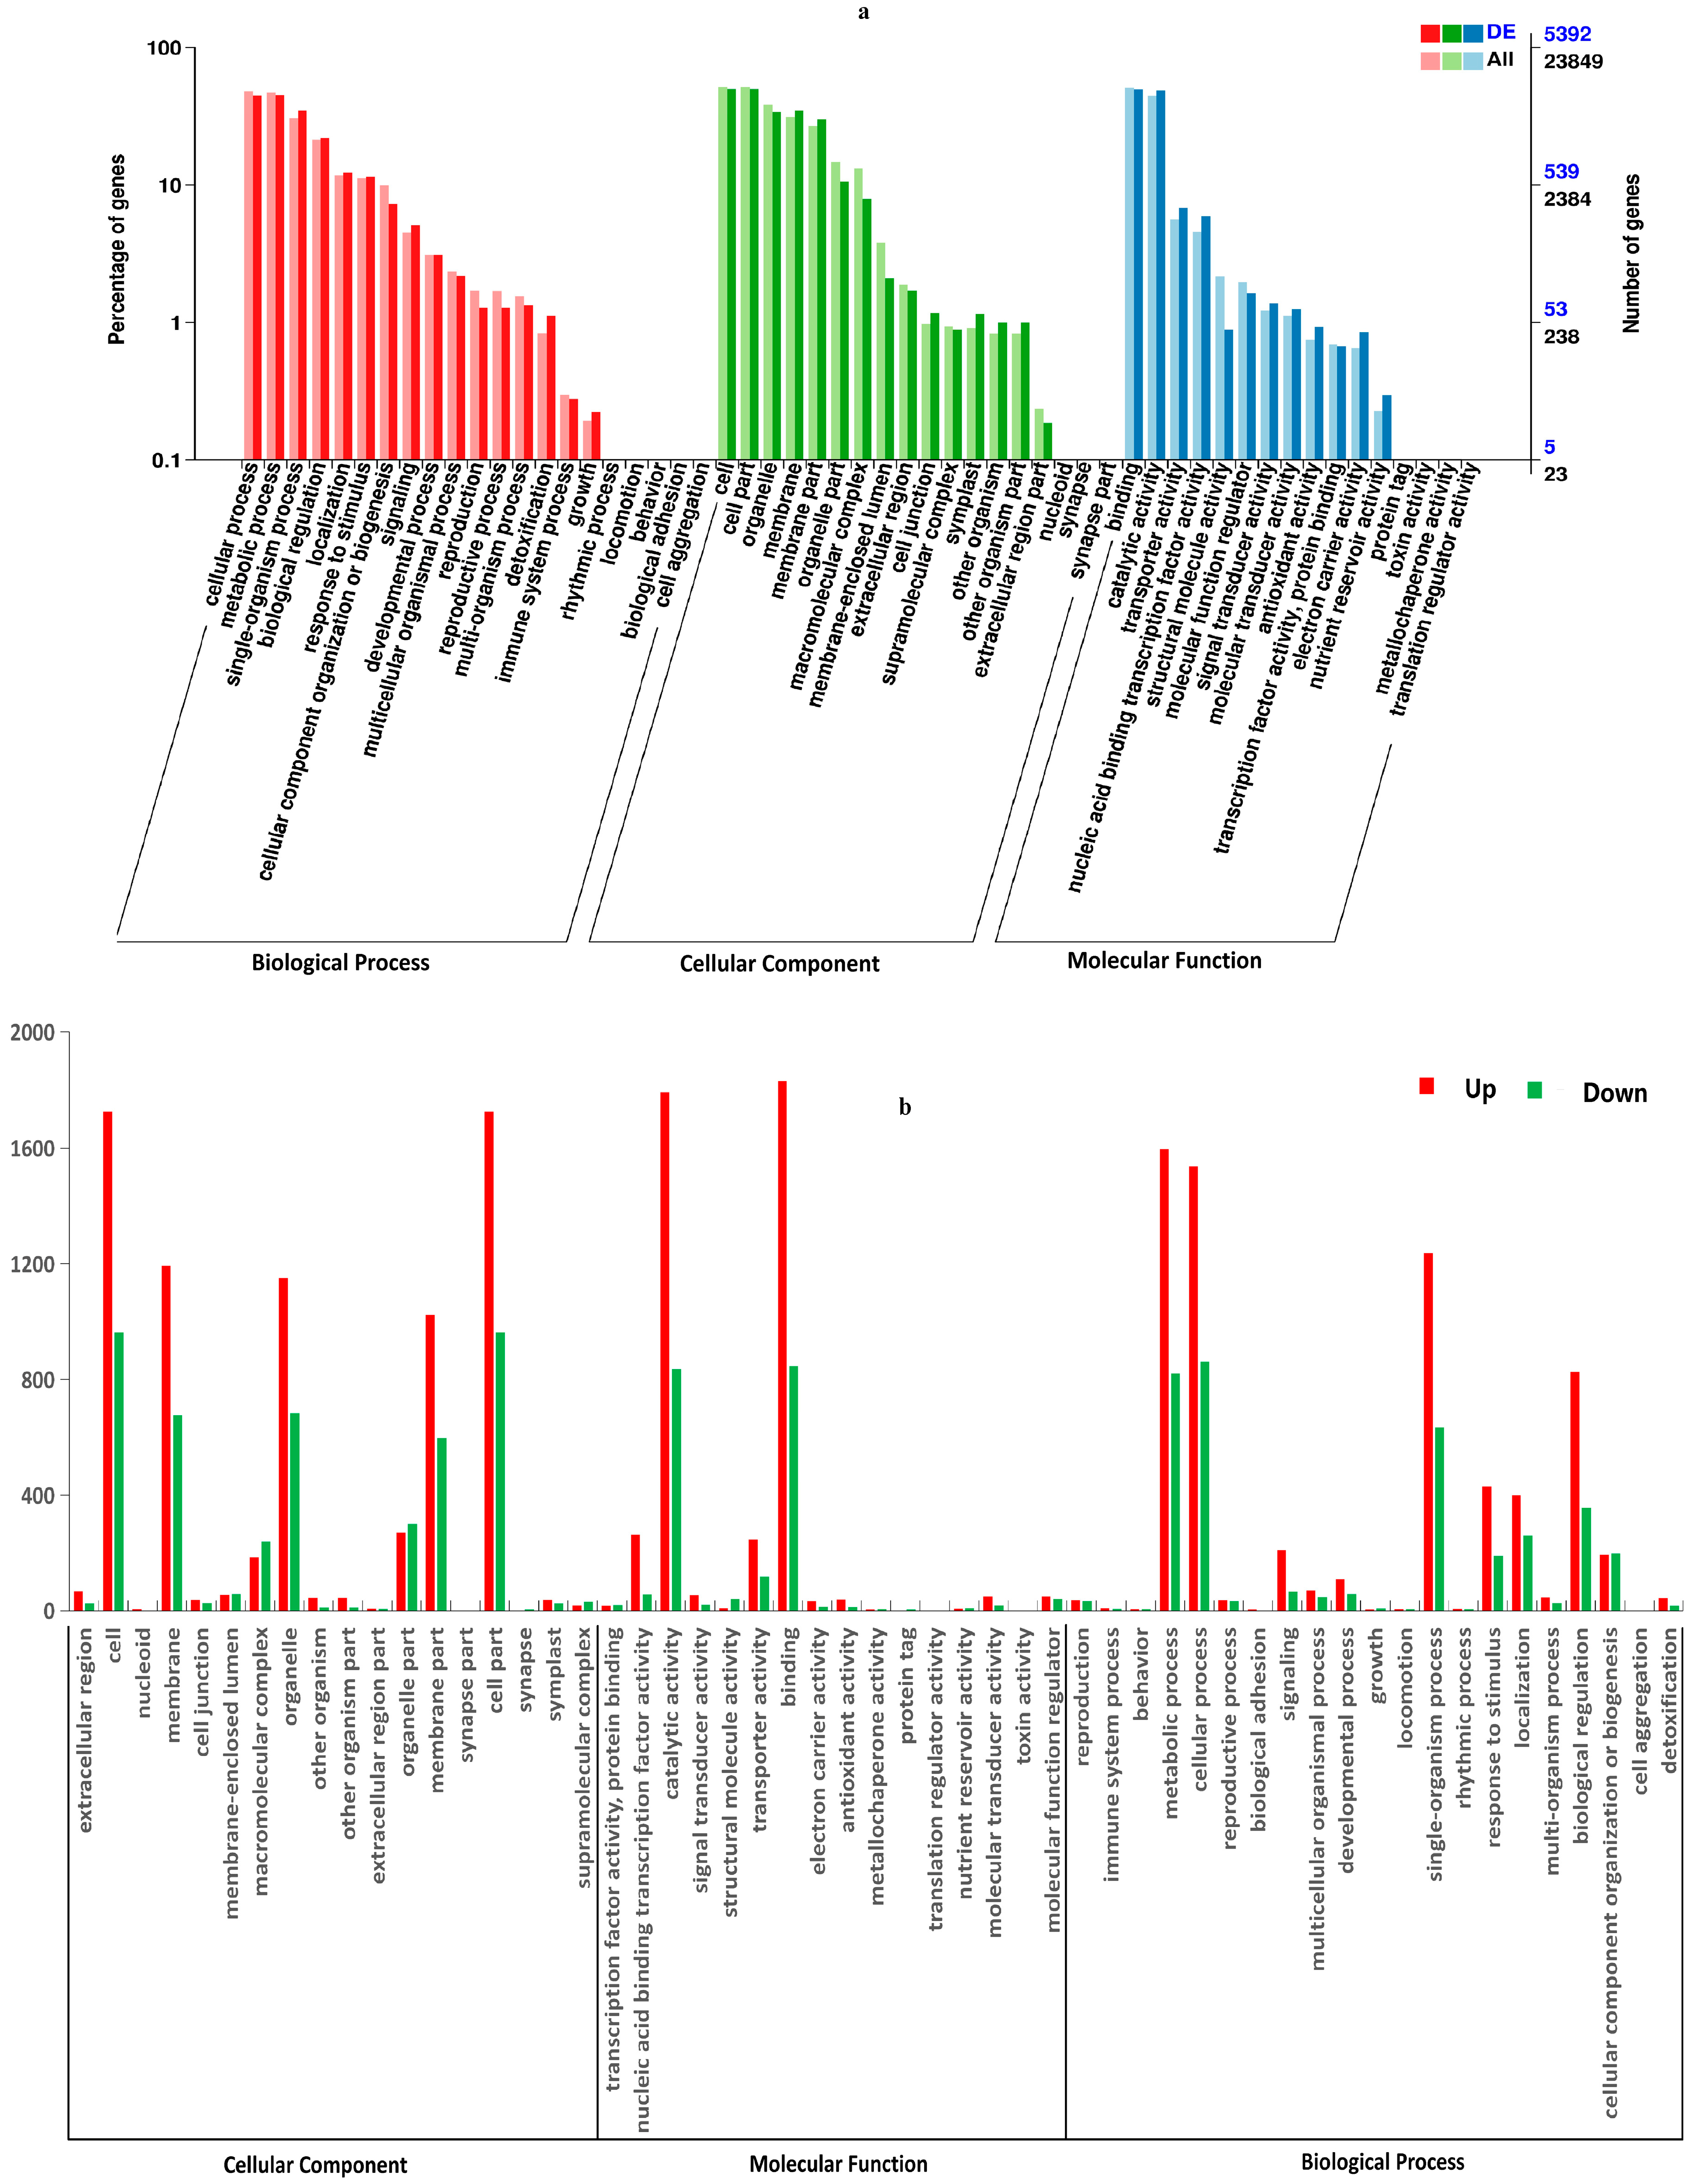
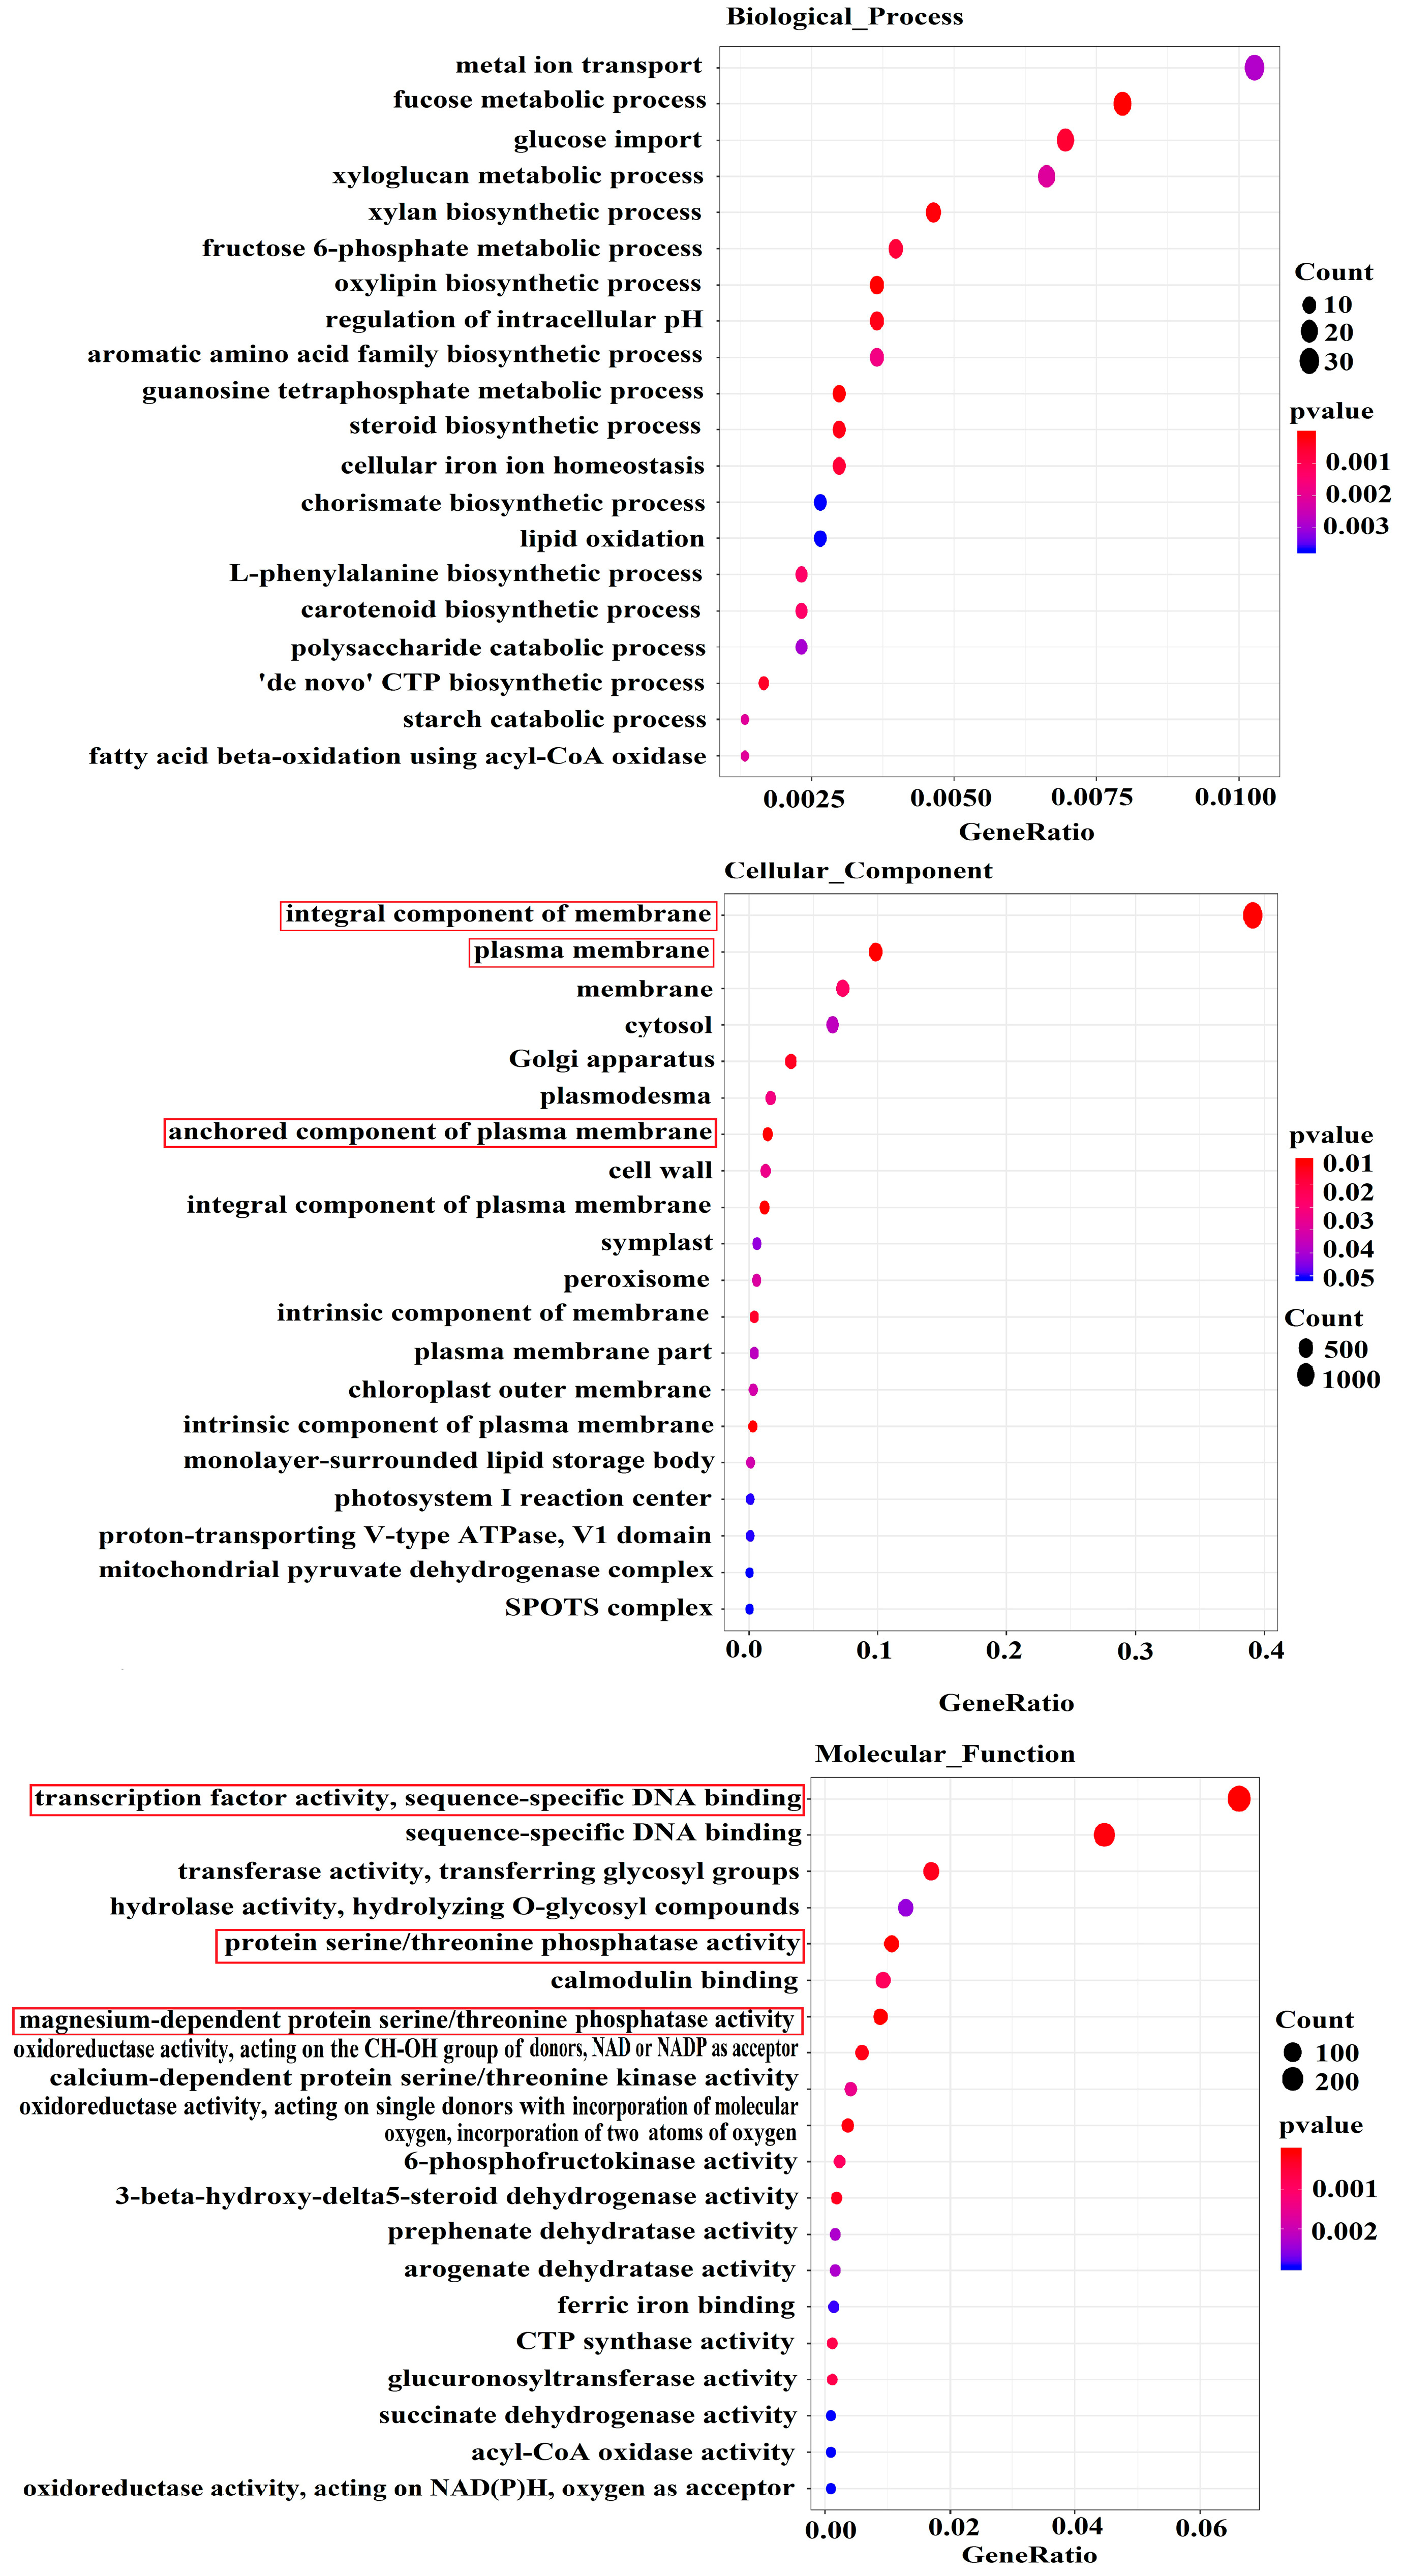
3.3.2. Gene Ontology (GO) and Kyoto Encyclopedia of Genes and Genomes (KEGG)

Analysis of DEGs

The screening of DEGs in the transcriptomes obtained from the MF and NF treatment groups was based on the criteria of |log2FC| ≥ 1 and FDR < 0.01 (Figure 4f, Tables S5 and S6). In NFs vs. MFs, a total of 7374 DEGs were detected, of which 4834 DEGs were upregulated and 2540 DEGs were downregulated (Figure 4f, Table S5). 6370 DEGs were functionally annotated, with 4235 DEGs upregulated and 2135 DEGs downregulated (Figure 4f, Table S6). A total of 5392 DEGs were annotated to 55 GO items, including 21 biological process (BP) categories. There are 18 categories of cellular components (CCs) and 16 categories of molecular function (MFT). In BP terms, the highest gene abundance belonged to “metabolic process” category (2417 genes), followed by “cellular process” (2398 genes), “single organism process” (1872 genes), and “biological regulation” (1182 genes). In CCs, the “cell” (2688 genes) and “cell part” (2688 genes) categories had the highest number of genes, followed by “membrane” (1869 genes), “organelle” (1833 genes), and “membrane part” (1620 genes). The main MFT categories were “binding” (2679 genes) and “catalytic activity” (2628 genes) (Figure 5). To classify the annotated functions of DEGs, GO enrichment analysis showed (p value < 0.01 and q value < 0.01) that “integral component of membrane”, “anchored component of plasma membrane”, and “plasma membrane” were the main enriched pathways in CCs. “Magnesium-dependent protein serine/threonine phosphatase activity”, “protein serine/threonine phosphatase activity”, and “transcription factor activity, sequence specific DNA binding” were the main enriched pathways in MFT (Figure 6, Table S7). In BP, the genes in the “oxylipin biosynthetic process” category were significantly upregulated. In CCs, most genes of the “plasma membrane”, “integral component of membrane”, “nucleus”, and “integral component of plasma membrane” categories were significantly upregulated. In MFT, significantly upregulated genes were mainly enriched in “transcription factor activity, sequence-specific DNA binding”, “sequence-specific DNA binding”, “magnesium dependent protein serine/threonine phosphate activity”, “protein serine/threonine phosphate activity”, and “calcium-dependent protein serine/threonine kinase activity” (Figure S2a, Table S7).
Moreover, the genes significantly downregulated in BP included those in the “guanosine tetraphosphate metabolic process” category. In CCs, significantly downregulated genes were mainly enriched in “endoplasmic reticulum”, “endoplasmic reticulum membrane”, and “golgi apparatus”. In addition, significantly downregulated genes in the MF terms contained “phosphofructokinase activity”, “diphosphate-fructose-6-phosphate 1-phosphotransferase activity”, “pyruvate kinase activity”, and “potassium ion binding” (Figure S2b, Table S7).
Through KEGG pathway enrichment analysis, a total of 4453 DEGs were assigned to 133 KEGG pathways in the NFs vs. MFs, involved in metabolism, genetic information, organismal systems, environmental information processing, and cellular processes (Figure 7a). A total of 1503 upregulated DEGs were allocated to 130 KEGG pathways, and 743 downregulated DEGs were allocated to 122 KEGG pathways (Table S8a). In the KEGG enrichment analysis of these DEGs (p value < 0.01 and q value < 0.05), “flavonoid biosynthesis”, “plant hormone signal transduction”, “carbon metabolism”, “biosynthesis of amino acids”, “arginine and proline metabolism”, “linoleic acid metabolism”, “MAPK signaling pathway – plant”, “phenylpropanoid biosynthesis”, and “starch and sucrose metabolism” were the main enriched pathways (Figure 7b, Table S8b).
Many upregulated DEGs were enriched in important pathways such as “flavonoid biosynthesis”, “plant hormone signal transduction”, “MAPK signaling pathway-plant”, “phenylpropanoid biosynthesis”, “linolenic acid metabolism”, and “starch and sucrose metabolism” (Figure S3a, Table S8b). However, downregulated DEGs were mainly enriched in the following key pathways: “glycation/gluconeogenesis”, “protein processing in endothelial reticulum”, “purify metabolism”, “carbon metabolism”, “biosynthesis of amino acids”, “pentose phosphate pathway”, “fatty acid biosynthesis”, and “arginine and proline metabolism” (Figure S3b, Table S8b). These results indicate that the above pathways were the significant regulatory ones in the occurrence of malformed fruits.
We mainly analyzed in detail the pathways of some important DEGs involved in the “plant hormone signal transduction”, “flavonoid biosynthesis”, “phenylpropanoid biosynthesis”, “starch and sucrose metabolism” and “carbon metabolism” pathways. In NFs vs. MFs, many crucial genes were significantly upregulated in the flavonoid biosynthesis pathway, such as two genes encoding flavanone 3-dioxygenase F3H1 (F3H-1), two genes encoding p-coumarate 3-hydroxylase (C3H), two genes encoding chalcone synthase (CHS1 and CHS3), three genes encoding chalcone–flavonone isomerase (CHI), three genes encoding anthocyanin reductase (ANR), one gene encoding leucoanthocyanidin dioxygenase (ANS), and two genes encoding leucoanthocyanidin reductase (LAR) (log2FC > 2, Table 1, Table S9).
In phenylpropanoid biosynthesis, five genes encoding phenylalanine ammonia lyase (PAL), four genes encoding trans-cinnamate 4-monooxygenase (CYP73A), fourteen genes encoding peroxidase (PER), three genes encoding cinnamyl alcohol dehydrogenase (CAD), ten genes encoding cinnamoyl-CoA reductase (CCR), three genes encoding 4-comarate-CoA ligase (4CL), one gene encoding caffeoyl-CoA O-methyltransferase, one gene encoding caffeic acid 3-O-methyltransferase (COMT), and one gene encoding shikimate O-hydroxycinnamoyltransferase were all significantly upregulated (log2FC > 2, Figure 8, Table S9).
In starch and sucrose metabolism, five genes encoding beta-amylase (BAM), seven genes encoding beta-glucosidase (BGLU), one gene encoding 4-alpha-glucosyltransferase (DPE2), one gene encoding fructokinase 2 (FRK2), one gene encoding sucrose synthase 2 (SUS2 (Cocos_nucifera_newGene_8455)), one gene encoding granule-bound starch synthase (GBSS), and one gene encoding hexokinase-2 (HXK2) were significantly upregulated. However, some genes encoding inactive beta-amylase 9 (BAM9), fructokinase (FRK1 and At1g66430), sucrose synthase (SUS1 and SUS2 (COCN_CLEAN_10020868 and COCN_CLEAN_10006864), and probable sucrose–phosphate synthase 1 (SPS1) were significantly downregulated (log2FC > 2, Table 2, Table S9).
In the carbon metabolism pathway, it is worth noting that some key genes encoding phosphoenolpyruvate carboxykinase (ATP) 1 (PCK1 (COCN_GLEAN_10009294)), alcohol dehydrogenase-like 7 (At5g42250 (CUFF40.301.1)), catalase isozyme 1 (CAT1), glucose-6-phosphate 1-dehydrogenase (G6PDH), glucose-6-phosphate isomerase (PGIC1), ATP-dependent 6-phosphofructokinase (PFK2 and PFK3 (COCN_GLEAN_10009250)), cysteine synthase (RCS1), fructose bisphosphate aldolase (ALDP) and fructose bisphosphate aldolase 1 (FBA1) were significantly downregulated. However, some genes encoding phosphoenolpyruvate carboxykinase (ATP) 1 (PCK1 (COCN_GLEAN_10017173)), alcohol dehydrogenase-like 7 (At5g42250 (COCN_GLEAN_10014124 and CUFF40.298.1)), catalase isozyme 2 (CAT2), ATP-dependent 6-phosphofructokinase (PFK3 (COCN_GLEAN_10010537, COCN_GLEAN_10011659 and COCN_GLEAN_10014631)) were found to be significantly upregulated (log2FC > 2, Table 3, Table S9).
In plant hormone signal transduction, 218 genes were differentially expressed. Among them, 46 DEGs were downregulated and 172 DEGs were upregulated. These DEGs were related to ABA (45), IAA (38), CK (28), ETH (10), GA (32), BR (42), JA (14), and SA (9) (Figure 9, Table S9).
For ABA, 35 DEGs were upregulated and 10 DEGs were downregulated. Among them, the expression of genes encoding abscisic acid receptor (PYL) and probable protein phosphatase 2C (PP2C) was significantly upregulated. However, most genes encoding abscisic acid insensitive 5-like protein 2 (ABF) and serine/threonine-protein kinase (RK) were significantly downregulated (log2FC > 2, the same below).
For IAA, thirty-two DEGs were upregulated and six DEGs were downregulated, and most genes encoding auxin-responsive protein (IAA), auxin-responsive protein (SAUR), auxin response factor (ARF), auxin transporter-like protein (AUX), and indole-3-acetic acid-amido synthetase (GH3) were significantly upregulated. However, only the expression of transport inhibitor response 1 (TIR1) was significantly downregulated.
For CK, twenty-five DEGs were upregulated, but three DEGs were downregulated, with significantly downregulated expression of those encoding probable histidine kinase (HK4) and two-component response regulator ORR2 (RR2).
For ETH, five DEGs were upregulated, but five DEGs were downregulated, and those encoding ethylene insensitive 3-like 3 protein (EIN), ethylene receptor 2 (ETR2), F-box/LRR-repeat MAX2 homolog (EBF), and mitogen-activated protein kinase kinase (MKK5) were significantly downregulated. However, the expression of DEGs encoding ethylene receptor 3 (ETR3) and mitogen-activated protein kinase kinase 4 (MKK4) was significantly upregulated.
For GA, twenty-four DEGs were upregulated, but eight DEGs were downregulated, with most DEGs encoding gibberellin receptor (GID1), F-box protein (GID2), DELLA protein (DELLA), and transcription factor PIF being significantly upregulated. However, some DEGs encoding gibberellin receptor (GID1), DELLA protein (DELLA), and transcription factor PIF were significantly downregulated.
For BR, thirty-three DEGs were upregulated, but nine DEGs were downregulated, among which DEGs encoding protein BZR1 homolog (BZR), brassinosteroid LRR receptor kinase (BRI), BRI kinase inhibitor 1 (BKI), cyclin-D3-2 (CYCD3-2), and leucine-rich repeat protein (BAK1) were significantly upregulated. However, a small number of DEGs encoding leucine-rich repeat protein (BAK1) and most DEGs encoding xyloglucan endotransglucosylase/hydrolase protein (TCH4) were significantly downregulated.
For JA, thirteen DEGs were upregulated, but one DEG was downregulated, and almost all DEGs encoding protein TIFY (JAZ) and transcription factor MYC2 were significantly upregulated.
For SA, five DEGs were upregulated, but four DEGs were downregulated, and one gene encoding BTB/POZ domain and ankyrin repeat-containing protein (NPR1), three encoding transcription factor TGA (COCN_GLEAN_10014305, COCN_GLEAN_10008331 and CUFF45.691.1), and one encoding pathogenesis-related protein (PR-1) were significantly upregulated. However, one gene encoding BTB/POZ domain and ankyrin repeat-containing protein (NPR5) and three encoding TGA (COCN_GLEAN_10023999, COCN_GLEAN_10010947 and COCN_GLEAN_10014667) were significantly downregulated.

3.3.3. Expression of Cell Wall-Related Genes During the Occurrence of Malformed Fruits

There may be significant differences in the cell wall content and cell wall-degrading enzyme activity of pulp tissues between malformed and normal fruits. The formation of fruit pulp may be closely related to the development of cell wall composition and decomposition in fruit pulp. CEL, PE, EXP, and XET/XTH were the main components of the cell wall. Our results show that the CEL, PG, and PE activities in the pulp of MFs were significantly higher than those in the pulp of NFs, with an increase of 33.33%, 33.33% and 48.69%, respectively (Figure 10a). Overall, there were 74 DEGs involved in cell wall loosening, cellulase metabolism, and pectin factor in the cell wall metabolic pathways (Figure 10b), and 9 cellulose synthase genes were enriched in the cellulose metabolism pathway, among which 8 CEL genes showed significantly lower expression levels in MF than in NF. This research result suggests that the metabolism of cellulase may be involved in the formation of fruit deformities. Some pivotal genes encoding pectinesterase/pectinesterase inhibitor (PE), pectate lyase (PEL), UDP-rhamnose/UDP-galactose transporter (URG), UDP-galactose/UDP-glucose transporter (UTR), GDP-L-galactose phosphorylase 1 (VTC2), polygalacturonase/ polygalacturonase inhibitor (PG), which were related to pectin metabolism and degradation, were analyzed. In NFs vs. MFs, 12 PE, 1 URG, 4 PEL, and 4 PG genes were significantly upregulated. However, there were also 3 PE, 1 URG, 2 UTR, 1 VTC2, and 5 PG genes that were significantly downregulated. These results indicate that the occurrence of malformed fruits may be related to the degradation of pectin. In addition, some important genes encoding expansion protein (EXP), xyloglucan transglycosyltransferase, and hydrolase (XET/XTH) were involved in cell wall hydrolysis or modification. Compared with NFs, 32 genes were differentially expressed in MFs. Therefore, during the formation of malformed fruits, some genes related to cell wall polysaccharides and metabolism may regulate the formation of fruit deformities.

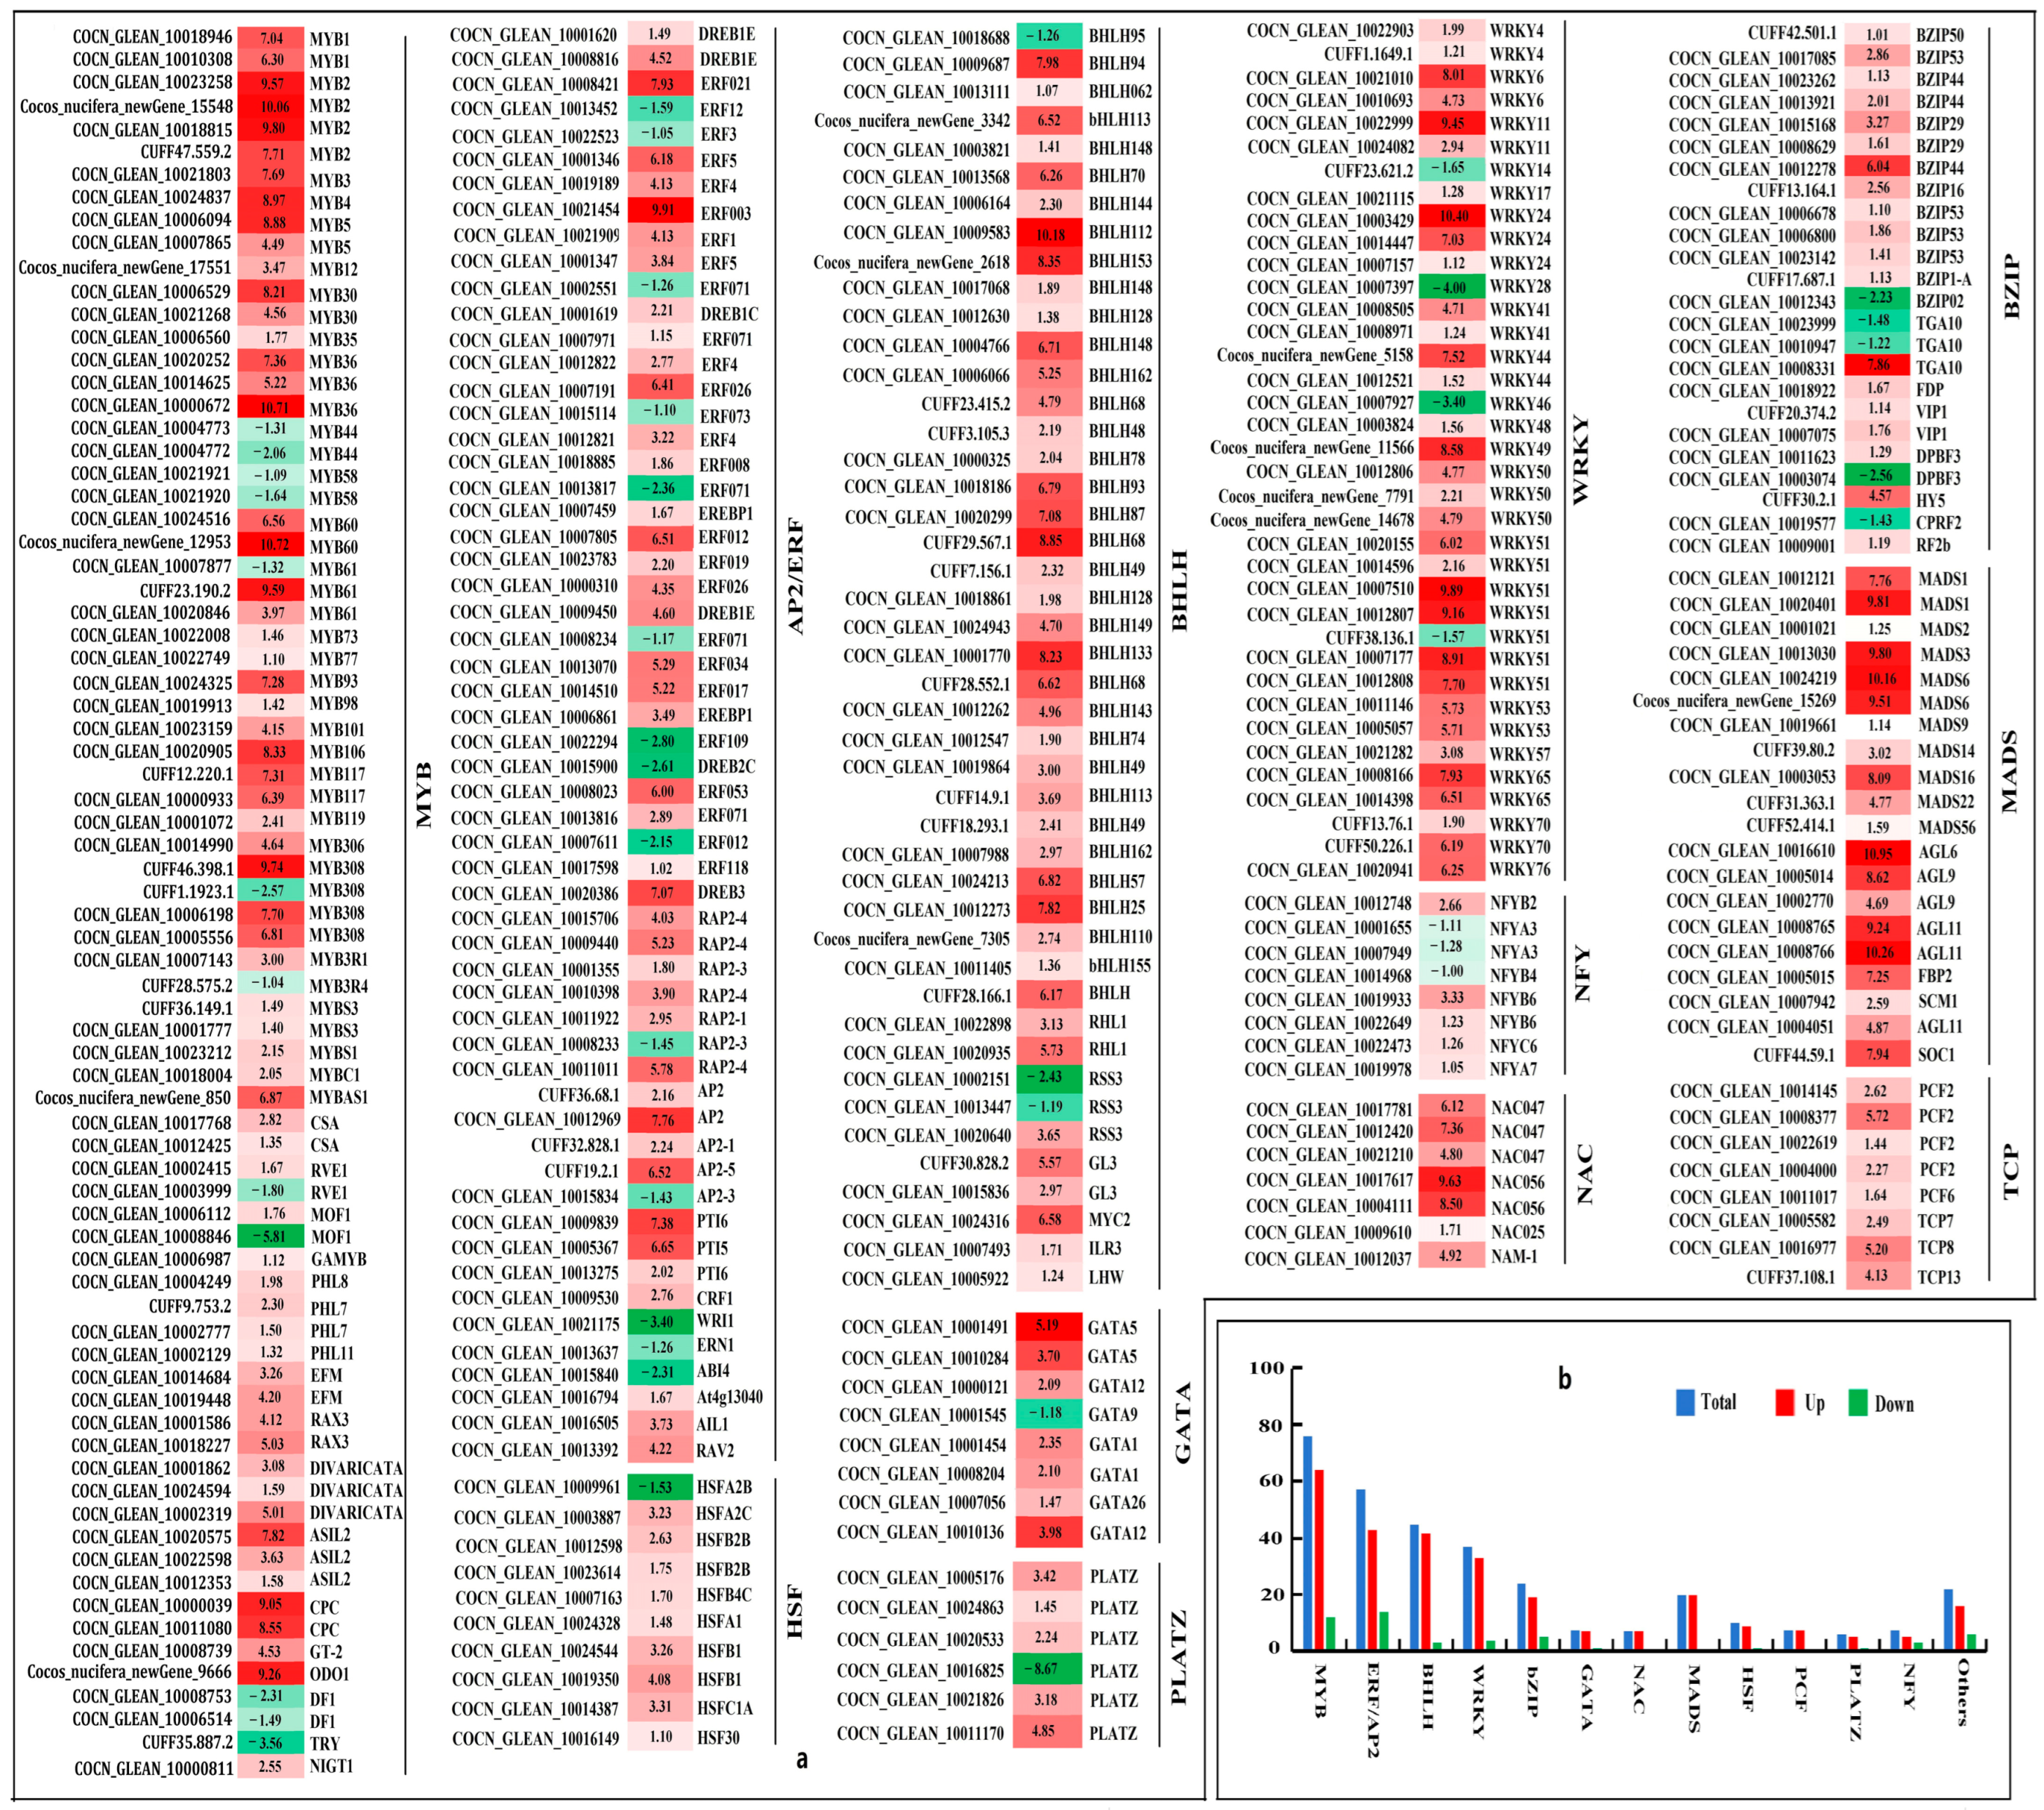
3.3.4. Transcription Factors

Transcriptional reprogramming emerges as the central regulatory node governing coconut fruit malformation, with MYB, ERF/AP2, and BHLH transcription factor families demonstrating predominant regulatory dominance. Comparative transcriptomic profiling identified 328 differentially expressed transcription factors in NFs vs. MFs (FDR < 0.01, |log2FC| > 1). These included MYB (76), ERF/AP2 (57), BHLH (45), WRKY (37), bZIP (24), MADS (20), HSF (10), GATA (8), NAC (7), PCF (8), NFY (8), PLATZ (6), and other TFs (22). For MYB, 64 genes were upregulated and 12 genes were downregulated. For ERF/AP2, 43 genes were upregulated and 14 genes were downregulated. For BHLH, 42 genes were upregulated and 3 genes were downregulated. For WRKY, 33 genes were upregulated and 4 genes were downregulated. For bZIP, 19 genes were upregulated and 5 genes were downregulated. For MADS, 20 genes were upregulated. For HSF, 9 genes were upregulated and 1 gene was downregulated. For GATA, 7 genes were upregulated and 1 gene was downregulated. For NAC, 7 genes were upregulated. For PCF, 8 genes were upregulated. For NFY, 5 genes were upregulated and 3 genes were downregulated. For PLATZ, 5 genes were upregulated and 1 gene was downregulated. For other TFs, 16 genes were upregulated and 6 genes were downregulated. The above results indicate that these transcription factor families played a crucial transcriptional regulatory role in the occurrence of coconut fruit deformities (Figure 11).

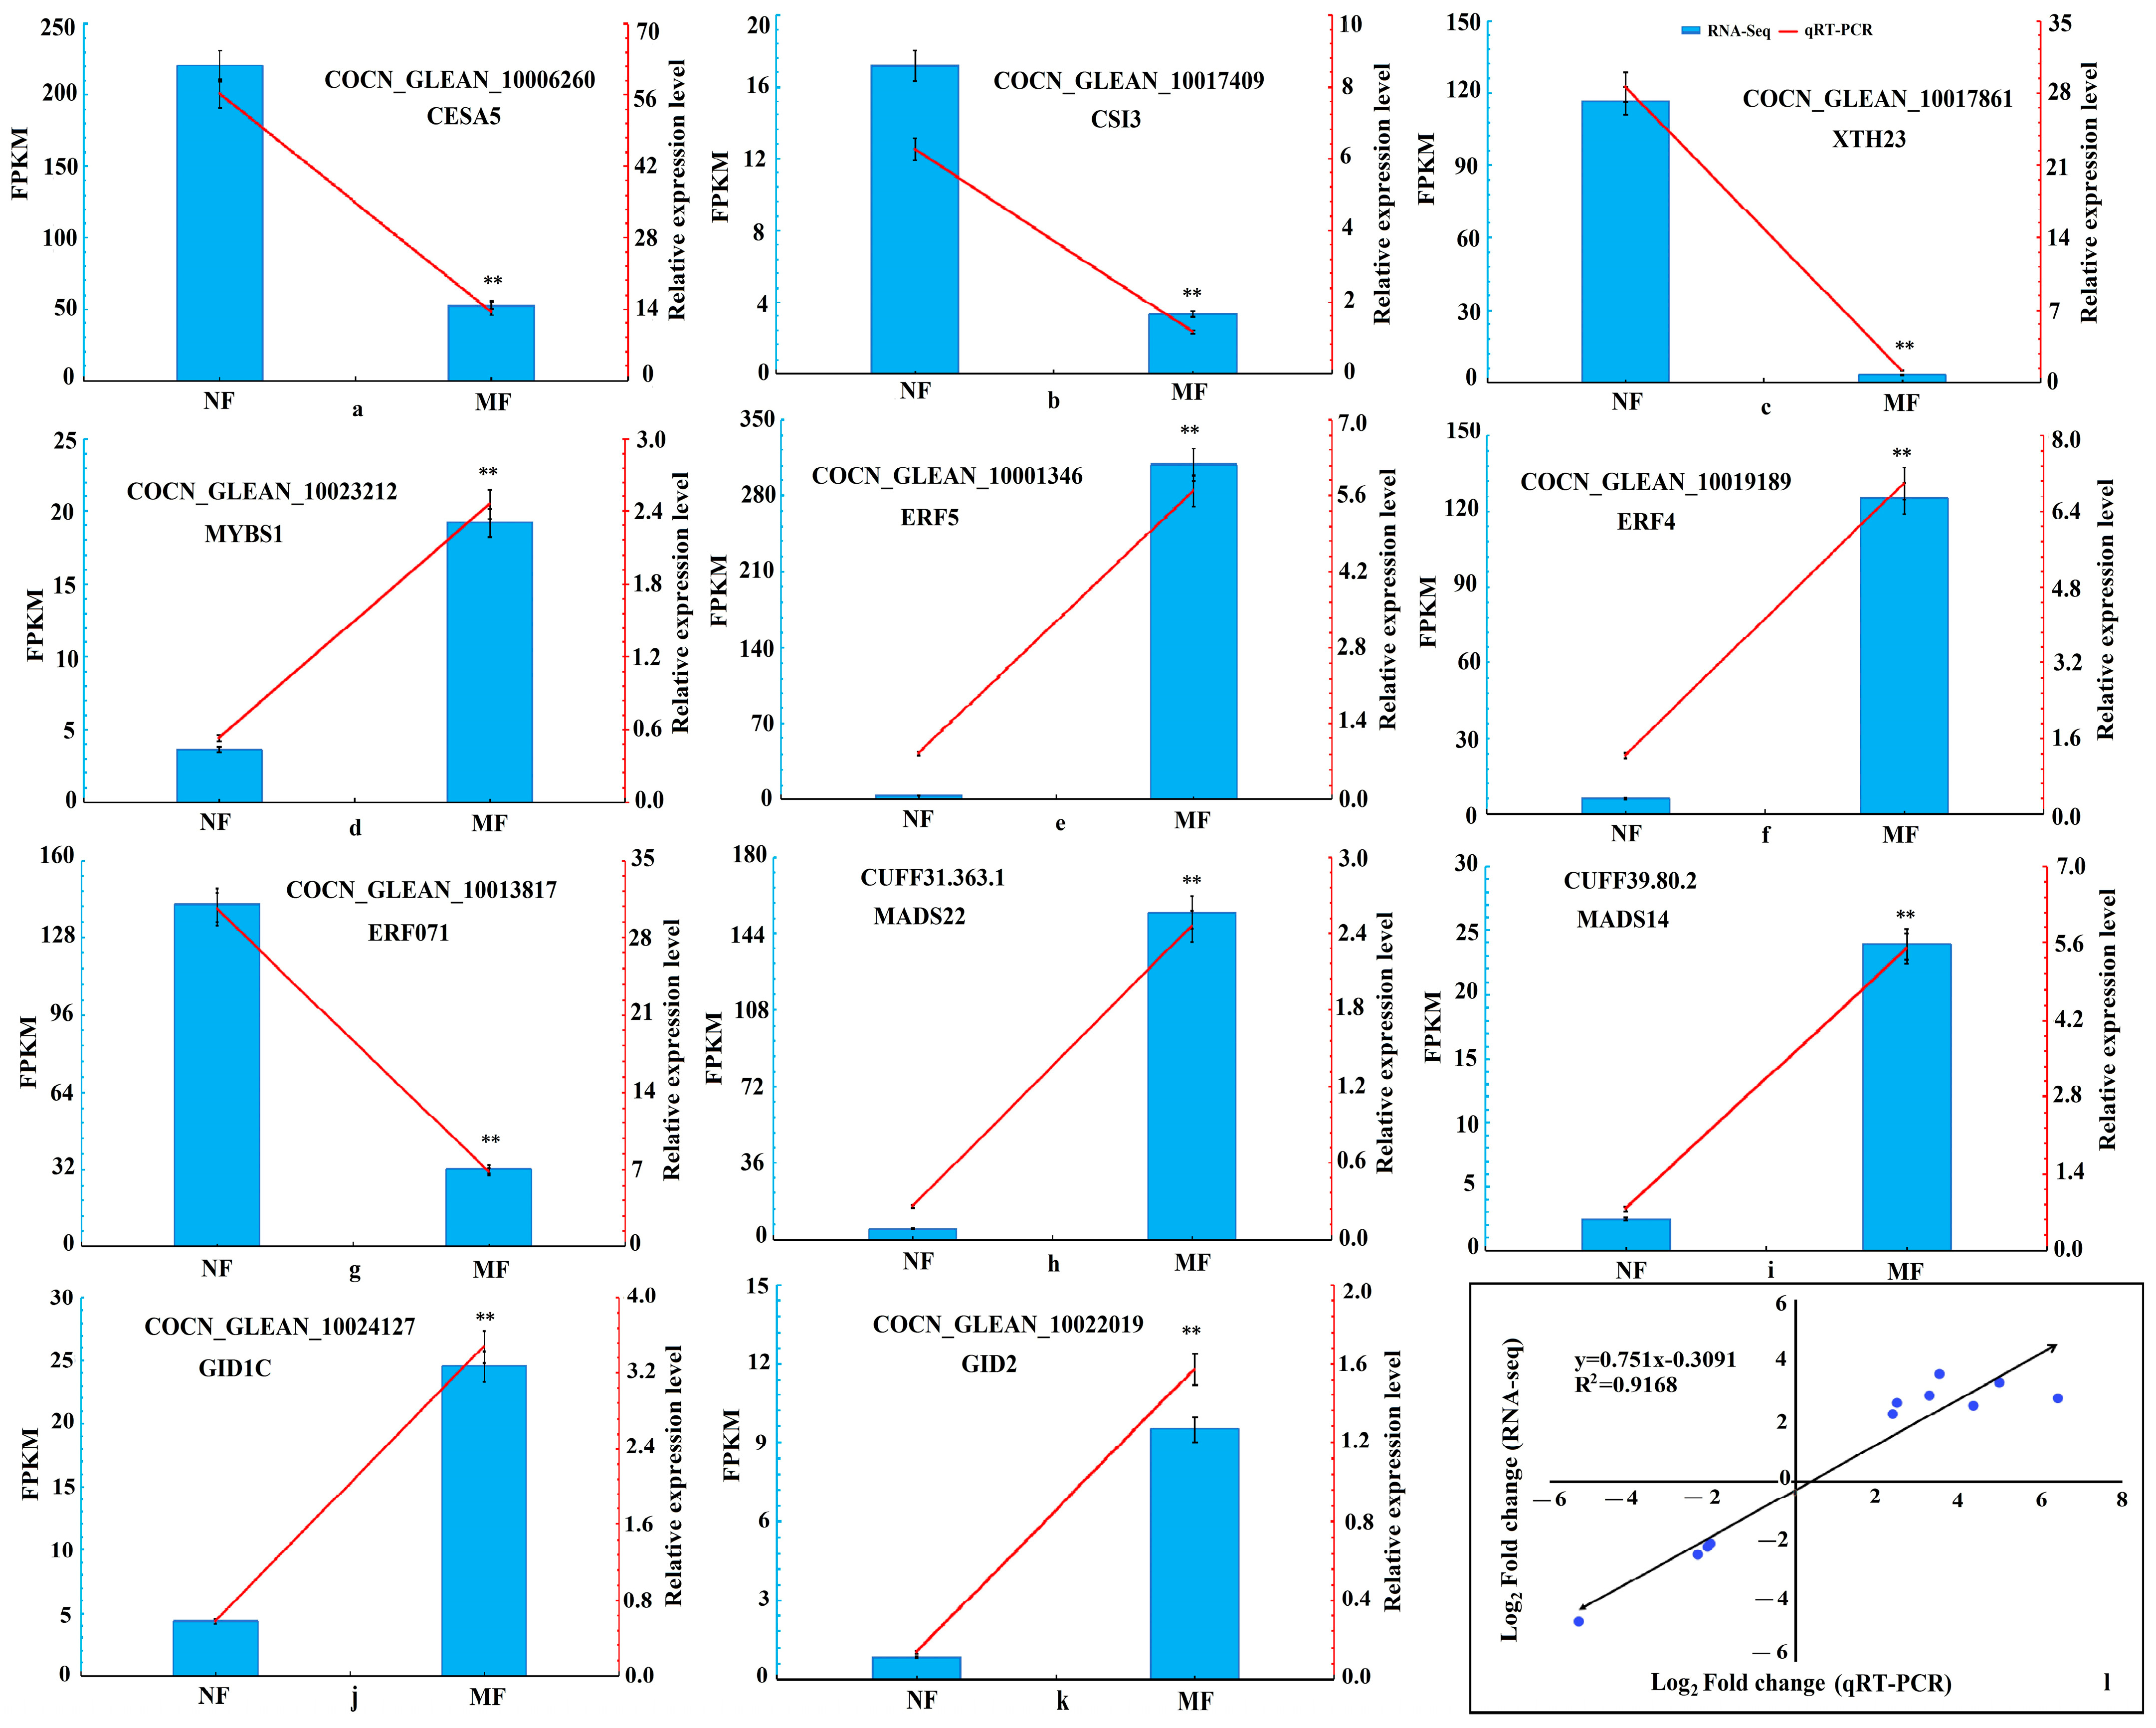
3.4. DEGs Validation by qRT-PCR

To confirm the gene expression results obtained from transcriptome data, we selected 11 DEGs associated with coconut fruit malformation for qRT-PCR (Table S2). These DEGs are mainly related to plant hormone signal transduction (GID1C and GID2), plant cell walls (CESA5, CSI3, and XTH23), and transcriptional regulation (MYBS1, ERF5, ERF4, ERF071, MADS22, and MADS14). Compared to NFs, MYBS1, ERF5, ERF4, MADS22, MADS14, GID1C, and GID2 in MF flesh tissue were upregulated, while CESA5, CSI3, XTH23, and ERF071 were downregulated. These may all be related to the occurrence of malformed coconut fruits. In addition, the qRT-PCR expression patterns of these 11 DEGs were consistent with the results of RNA-seq (R2 = 0.9168), indicating the accuracy of our transcriptome analysis (Figure 12).

4. Discussion

Occurrence of fruit deformity may be a response phenomenon of an important process in the regulation of the complex genetic imbalance of plants from flower to fruit development. External environmental disturbances and internal signals may lead to deformities in the fruit development [3,62]. Fruit deformities are precisely controlled by physiological, biochemical, and molecular mechanisms, ultimately causing occurrence of fruit deformities in plants [4,63]. Combined morphological, plant hormone, and transcriptomic analyses revealed the molecular mechanism of coconut fruit deformities. Our research suggests that the occurrence of coconut fruit deformities may be associated with plant hormone signal transduction, cell wall remodeling, and transcription factors. Understanding the molecular mechanisms underlying early fruit deformities in coconuts is of great significance for regulating fruit deformities.

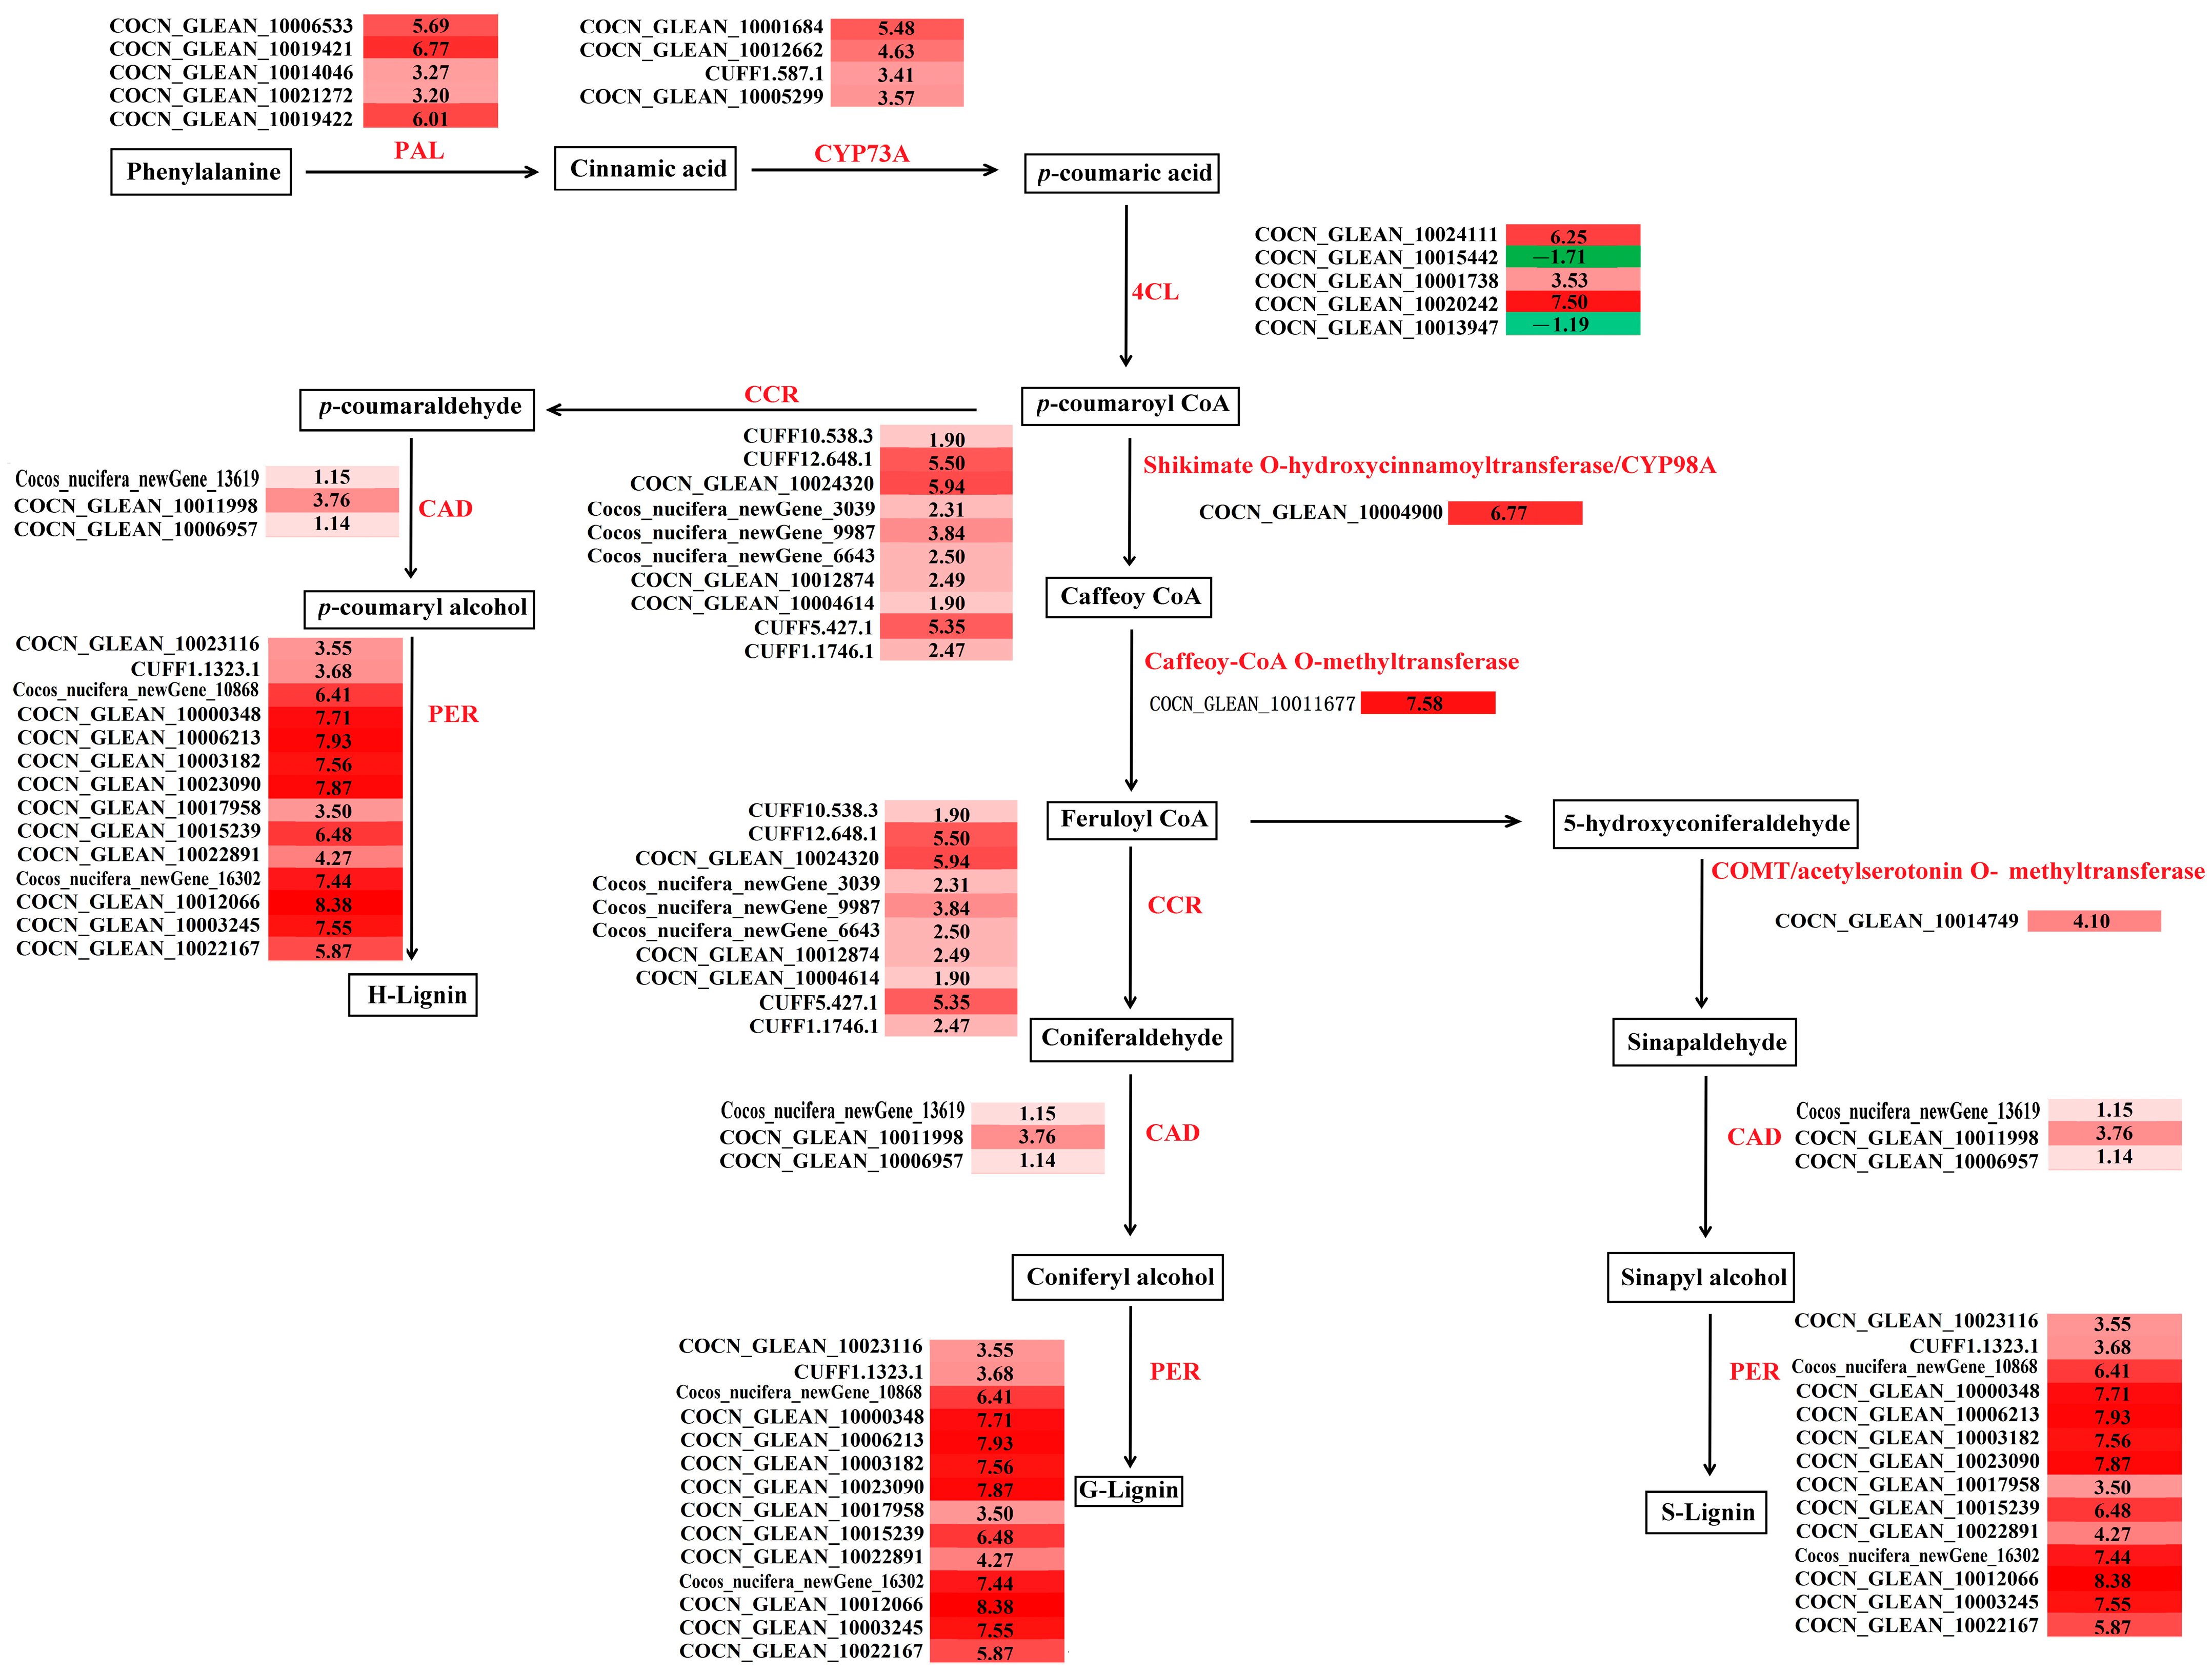
4.1. The Effects of Crucial Enrichment Pathways on Malformed Fruits

Plant fruit deformities involve multiple metabolic pathways, such as flavonoid biosynthesis, starch and sucrose metabolism, plant hormone signal transduction, and so on, which are associated with various genes and metabolic substances [64,65,66]. Consequently, transcriptomic dissection has emerged as a cornerstone methodology in plant developmental biology, enabling systematic decoding of molecular circuitry underlying fruit morphogenetic anomalies. By using transcriptome sequencing technology, a large number of genes that may be associated with fruit deformities can be identified, and the most likely genes can be selected from these possible genes for validation using experimental techniques [2,4]. In this study, in the KEGG enrichment analysis of the DEGs, flavonoid biosynthesis, plant hormone signal transduction, carbon metabolism, phenylpropanoid biosynthesis, and starch and sucrose metabolism were the main enrichment pathways (Figure 7b, Table S8b).
Flavonoid biosynthesis orchestrates dual morphogenetic functions in plant systems, principally mediating organ pigmentation dynamics through anthocyanin accumulation while concurrently modulating fruit developmental trajectories [67]. Similarly, in this study, many crucial genes were significantly upregulated in the flavonoid biosynthesis pathway, such as two F3H-1 genes, two C3H genes, two CHS1 and CHS3 genes, three CHI genes, three ANR genes, one ANS gene, and two LAR genes (Table 1, Table S9). Correspondingly, we also found significant differences in color and texture between deformed coconut flesh and normal coconut flesh (Figure 1).
Phenylpropanoids is a principal precursor for lignin synthesis. Lignin is a complex phenylpropane polymer which can fill the spaces between cell wall polysaccharides and impart mechanical strength to the cell wall. Some studies have reported that lignin is associated with fruit deformities and cracking in lychees and sweet cherries [68,69]. Lignin biosynthesis related to certain genes (C4H, PAL, HCT, and C3’H) increasing in the phenylpropanoid biosynthesis pathway may contribute to the deposition of lignin in the cell wall, strengthening the cell wall and limiting its extensibility, and thereby affecting the abnormal cracking of chili fruit [70]. In this study, compared to NFs, the lignin biosynthesis genes in the phenylpropanoid biosynthesis pathway of MFs also changed, with 5 PAL genes and 4 CYP73A genes, 14 PER genes, 3 CAD genes, 10 CCR genes, 3 4CL genes, one gene encoding caffeoyl CoA O-methyltransferase, one COMT gene, and one gene encoding shikimate O-hydroxycinnamoyltransferase being significantly upregulated (Figure 8, Table S9). These results suggest that the deformity of coconut fruit may be caused by an increase lignin content induced by lignin biosynthesis genes in the phenylpropanoid biosynthesis pathway.
Plant nutrition and carbohydrates also play important roles in fruit development [38,39]. During the flower bud development stage of fruit trees, the development of ovules requires a large amount of nutrients. During this period, insufficient nutrition for bud development can lead to deformities of flowers and fruits. Nutrient deficiency induces the diversity of auxin-signaling-related genes in plants, leading to cellular metabolic disorders, cell mutations, and flower and fruit deformities [41]. In addition, low sugar in plants can induce excess ROS, leading to flower and fruit deformities and premature death [71]. In this study, the soluble sugars, reducing sugars, starch, protein, and fat in the flesh of MFs were lower than those in NFs, with the most significant decline in soluble sugars, reducing sugars, protein, and fat (Figure 3a). This result suggests that the decrease in carbohydrates, proteins, and fats in the flesh of malformed fruits is likely due to metabolic disorders within the fruit, leading to nutrient loss. These results indicate that the production of coconut malformed fruits is closely associated with the physiology, biochemical metabolism, and cellular structure of coconut flesh. Correspondingly, some pivotal genes such as PCK1 (COCN_GLEAN_10009294), At5g42250 (CUFF40.301.1), CAT1, G6PDH, PGIC1, PFK2, PFK3 (COCN-GLEAN_10009250), RCS1, ALDP, and FBA1 in the carbon metabolism pathway also underwent changes and were significantly downregulated. Nevertheless, other genes, e.g., PCK1 (COCN_GLEAN_10017173), At5g42250 (COCN_GLEAN_10014124 and CUFF40.298.1), CAT2, and PFK3 (COCN_GLEAN_10010537, COCN_GLEAN_10011659 and COCN_GLEAN_10014631) were upregulated (Table 3, Table S9). It was also found that some important carbohydrates such as protein, fat, and carbohydrates were significantly reduced in MFs. Consequently, it can be seen that the changes and balance of nutrients and carbohydrates also played an important role in fruit development and deformities.
Sugar metabolism also plays an important role in fruit development [72]. The contents of sucrose, sorbitol, fructose, and glucose in malformed fruits are lower than those in continuous fruits [42,43]. Transcriptomic analysis has shown that genes encoding trehalose-6-phosphate synthase, sorbitol transporter, UDP-glycosyltransferase, and UDP-GLC-4-exoisomerase were upregulated in apples. These enzyme genes are also controlled by sugar starvation and participate in resource mobilization in other species [44,45,46]. In this study, there were five BAM genes, seven BGLU genes, one DPE2 gene, one FRK2 gene, one SUS2 gene (Cocos_nucifera_newGene_8455), one GBSS gene, and one HXK2 gene in significantly upregulation in the starch and sucrose metabolism pathway. However, some crucial genes such as BAM9, FRK1, At1g66430, SUS1, SUS2 (COCN_GLEAN_10020868 and COCN_GLEAN_10006864) and SPS1 were downregulated (Table 2, Table S9). It can be seen that genetic changes in the starch and sucrose metabolism pathway were associated with the occurrence of fruit deformities.

4.2. The Effect of Crucial Phytohormones on Malformed Fruits

Plant hormones play a crucial role in fruit development. Among these signals, plant hormones are endogenous compounds involved in flower and fruit development [4,5]. Some classic phytohormones, such as GA, IAA, CK, ETH, ABA, JAs, SA, and BRs, are related to the fruit development pathway [4,5]. Their mechanisms of function are also different. The relationship between endogenous hormones in different plants and their fruit development is similar, but there are also differences. Previous research has shown that the main phytohormones that influence fruit deformities are IAA, GA, CK, ABA, ETH, and SA [4]. In this study, 218 DEGs were enriched in the plant hormone signaling pathway between MFs and NFs. Further evidence shows that many hormones regulate the maturation and development of MFs, and their hormone levels are different from those of NFs. In the plant hormone signal transduction pathway, 46 DEGs were downregulated and 172 DEGs were upregulated. These DEGS were related to ABA (45), IAA (38), CK (28), ETH (10), GA (32), BR (42), JA (14), and SA (9) (Figure 9, Table S9).
Most malformed fruits occur during the transformation of ovary tissue into fruit. If problems arise during this process, it may lead to fruit shedding and deformities. As is well known, IAA and GA play a crucial role in the induction stage of fruit harvest. Some studies have shown that auxin triggers cell division, and its interaction with GA maintains cell expansion [14]. Negative regulation of AUX/IAA and ARF proteins can inhibit the transformation of tomato and Arabidopsis ovaries into fruits. This negative regulation can be eliminated through pollination/fertilization or IAA treatment, leading to cell proliferation and outcome. If the biosynthesis and function of ABA and ETH are significantly reduced, the biosynthesis and action of GA and IAA will be activated [15,16]. This indicates that plant hormones play an important role in fruit development. There are reports indicating that hormones such as ABA, IAA, and ETH in plants seem to play important roles in fruit development, while GA, CK, and JA have also been reported to be associated with fruit development [17,18,19]. In this study, for IAA, thirty-two DEGs were upregulated, six DEGs were downregulated, and genes such as IAA, SAUR, ARF, AUX, and GH3 were significantly upregulated. Only TIR1 was significantly downregulated. For ABA, thirty-five DEGs were upregulated and ten DEGs were downregulated, with significant upregulation of PYL and PP2C. However, most ABF and RK genes were significantly downregulated. For CKs, twenty-five DEGs were upregulated, but three DEGs were downregulated, with significant downregulation of HK4 and RR2. For ETH, five DEGs were upregulated, but five DEGs were downregulated, among which EIN, ETR2, EBF, and MKK5 were significantly downregulated. However, ETR3 and MKK4 were significantly upregulated. For BR, thirty-three DEGs were upregulated and nine DEGs were downregulated, among which BZR, BRI, BKI, CYCD3-2, and BAK1 was significantly upregulated. However, a small number of DEGs (BAK1) and most DEGs (TCH4) were significantly downregulated. For JA, thirteen DEGs were upregulated, one DEG was downregulated, and almost all JAZ and MYC2 DEGs were significantly upregulated. For SA, five DEGs were upregulated, but four DEGs were downregulated, and one NPR1 gene, three TGA genes (COCN_GLEAN_10014305, COCN_GLEAN_10008331 and CUFF45.691.1), and one PR-1 gene were significantly upregulated. However, one NPR5 and three TGA (COCN_GLEAN_10023999, COCN_GLEAN_10010947 and COCN_GLEAN_10014667) genes were significantly downregulated (Figure 9, Table S9). Furthermore, hormonal changes in malformed coconut fruits were also confirmed, such as the higher levels of IAA, ABA, CK, BR, JA, and SA in the flesh of MFs; among these, the content of IAA, ABA, and CK in MFs significantly increased compared to NF flesh. However, the ETH content was significantly lower than that of NF flesh (Figure 3b). Accordingly, this study indicates that phytohormones such as IAA, ABA, CK, BR, ETH, JA, and SA may play important roles in fruit development. Hormonal imbalance is a key factor leading to malformed coconut fruits.
In addition, GA can inhibit the division of ovarian wall cells, reduce the fruit setting rate [6], and increase vacuolar invertase activity and sugar in the ovary, thereby improving fruit yield [7]. It can increase fruit yield by promoting IAA synthesis [8]. In sweet cherries, GA3 promotes genes involved in the cytoskeleton and cell wall, thereby increasing fruit size [9]. IAA and GA are the main hormones that promote fruit initiation, stimulate growth, and increase fruit yield [10,11]. Sliaa9 controls ARFs through the IAA signaling pathway and participates in the regulation of fruit aggregation [12,13]. The mature fruits of sweet cherries still contain a large amount of GA, and the GA content of deformed fruits is seven times that of normal fruits. It is speculated that the formation of malformed fruits may be related to the presence of GA [4]. The same result was also found in coconuts. In this study, the GA content in the flesh of malformed fruits significantly increased (Figure 3b). We focused on studying the genes involved in the GA biosynthesis pathway, where 24 DEGs were upregulated, 8 DEGs were downregulated, and the expression of most GID1, GID2, DELLA, and PIF DEGs was significantly upregulated (Figure 9, Table S9). We also speculate that the formation of malformed coconut fruits may be related to the presence of GA. However, further research is needed on how GA regulates the formation of malformed fruits. The qRT-PCR analysis verified that the DEGs involved in plant hormone signal transduction (GID1C and GID2) in MF flesh tissue were upregulated (Figure 12).

4.3. The Effects of Crucial Cell Wall Remodeling-Related Genes on Malformed Fruits

During the process of fruit deformation in plants, a large amount of cell wall hydrolytic enzymes are synthesized, and enzyme activity is increased. This may be the reason for the degradation of the intermediate layer and the loosening of the primary separation layer in the cell wall [26]. CEL and PG are two main cell wall hydrolases. In addition, PE and PEL are also important cell wall pectin polysaccharides that have been widely studied in different plants and play an important role in the occurrence of fruit deformities in plants [27]. In addition, EXP, XET/XTH, and POD also play important roles in the occurrence of plant fruit deformities [28]. In this study, a total of 74 DEGs were involved in cellulase metabolism, pectin, and cell wall loosening factor in the cell wall metabolic pathway (Figure 10a). In the cellulose metabolism pathway, 9 cellulose synthase genes were enriched, among which 8 CEL genes had significantly lower expression levels in MFs than in NFs. This study also suggested that the metabolism of cellulase may be involved in the formation of fruit deformities. Single genes related to pectin metabolism were analyzed, and it was found that genes such as PE, PEL, URG, UTR, VTC2, and PG were related to pectin degradation. In NFs vs. MFs, 12 PE, 1 URG, 4 PEL, and 4 PG genes were significantly upregulated. However, there were also 3 PE, 1 URG, 2 UTR, 1 VTC2, and 5 PG genes that were significantly downregulated. Fruit deformity involves a complex network containing many genes. These genes are involved in the synthesis, differentiation, and degradation of cell walls. Cell wall-modifying proteins such as LcExp1 and LcExp2 [20], MdEXPA3 [21], and SlEXP [22], as well as cell wall-related genes such as SLPG [22], TBG6 [23], β-Gal [24], and LcXET1 [25], have been shown to play important roles in fruit development. This study also suggests that the occurrence of malformed fruits may be related to the degradation of pectin. Some single genes, such as EXP and XET/XTH, are involved in cell wall hydrolysis or modification. Compared with NFs, 32 genes were differentially expressed in MFs (Figure 10b). Therefore, during the formation of malformed fruits, some genes related to cell wall polysaccharides and metabolism may be involved in regulating the formation of fruit deformities. It can be seen that the occurrence of coconut fruit deformities is closely related to cell wall metabolism. The above results indicate that cell wall-related genes played an important role in the occurrence of fruit deformities. Furthermore, we found that the activities of CEL, PE, and PEL enzymes in the flesh of MFs were significantly enhanced compared to NFs (Figure 10a), which may indicate that the occurrence of malformed fruits is accompanied by a large amount of cell wall degradation in the flesh. At the same time, cell wall-related genes (CEL, PE, PEL, EXP and XET/XTH) also played a corresponding regulatory role. As for how to regulate the process, it will be further explored in future research.

4.4. The Effect of Crucial Transcription Factors on Malformed Fruits

Transcription factors also play an important role in this process. The MADS-box (ABC model) is an important TF gene family associated with flowering time assessment, fruit development, and fruit rate [30,31,32]. The ERF-family gene SlERF52 has been identified as a linker between fruit development processes [33], while KNOX, bHLH, and LRR receptor-like kinases, and IDA factors regulating fruit development, have also been reported [34,35]. Transcriptome analysis revealed that genes regulated during ETH induced citrus fruit enlargement and ripening include genes involved in ethylene responsive transcription factor activation, cell wall degradation, and starch/sugar biosynthesis and metabolism [36,37]. We identified 328 transcription factors with differential expression, and most of them showed a significant difference in expression. This includes MYB (76), ERF/AP2 (57), BHLH (45), WRKY (37), bZIP (24), MADS (20), HSF (10), GATA (8), NAC (7), PCF (8), NFY (8), PLATZ (6), and other (22) TFs (Figure 11). The qRT-PCR analysis also verified that the DEGs mainly involved in transcriptional regulation (MYBS1, ERF5, ERF4, MADS22, and MADS14) were upregulated (Figure 12).The above results indicate that these transcription factor families play a crucial transcriptional regulatory role in the occurrence of coconut fruit deformities. Similar to previous studies, we found that MADS, ERF/AP2, and bHLH are involved in the regulation of malformed coconut fruit occurrence. In addition, we found that the transcriptional regulation of MYB, WRKY, and bZIP is also important in the molecular mechanism of malformed fruit occurrence in coconuts.

5. Conclusions

We conducted transcriptome comparative analysis on the pulp of MFs and NFs. The transcriptome analysis showed that the main pathways such as “plant hormone signal transduction”, “flavonoid biosynthesis”, “phenylpropanoid biosynthesis”, “starch and sucrose metabolism”, and “carbon metabolism” were regulated during the occurrence of malformed coconut fruits (MFs). There were significant differences in CEL, PG, and PE activity, cell wall-related genes (CEL, PG, PE, PEL, EXP, XET/XTH), and the contents of endogenous hormones (IAA, GA, CK, BR, ABA, JA, SA, and ETH) and their related genes between NFs and MFs. In addition, some important TFs (e.g., MYB, ERF/AP2, BHLH, WRKY, bZIP, and MADS) also showed a significant difference. Besides, observations under optical and transmission electron microscopes revealed detailed differences in the morphology and structural characteristics of MFs and NFs fruit pulp. These differential regulatory processes may be closely relevant to the formation of malformed coconut fruits. Based on the results of this study, we propose a hypothetical model for malformed coconut fruits (Figure 13). This study combined morphological, cytological, and transcriptome analysis to preliminarily reveal the molecular mechanism of coconut fruit deformities. This provides a theoretical basis and reference for further research on the molecular mechanism of coconut fruit deformity formation.

Supplementary Materials

The following supporting information can be downloaded at: https://www.mdpi.com/article/10.3390/agriculture15070723/s1. Figure S1. Morphology of NFs and MFs. (a) Photos of natural fruits. (b) Photos of fruits with removed outer and middle skin. NF, normal fruit; MF, malformed fruit. Figure S2. GO enrichment pathway analysis of DEGs in NF vs. MF. (a) Upregulated DEGs classified into the functional categories of biological processes, cellular components, and molecular function in NFs vs. MFs. (b) Downregulated DEGs classified into the functional categories of biological processes, cellular components, and molecular function in NFs vs. MFs. NF, normal fruit; MF, malformed fruit. Figure S3. KEGG analysis of DEGs from NFs vs. MFs. (a) The KEGG classification chart of upregulated DEGs from NFs vs. MFs. (b) The KEGG classification chart of downregulated DEGs from NFs vs. MFs. (c) KEGG enrichment analysis of upregulated DEGs from NFs vs. MFs. (d) KEGG enrichment analysis of downregulated DEGs from NFs vs. MFs. NF, normal fruit; MF, malformed fruit. Table S1. Overview of RNA-seq data statistics from NFs and MFs. Table S2. Overview of compared statistics from sequence alignment results of seq data and selected reference genomes between NFs and MFs samples. Table S3. Genes with FPKM values in RNA-seq in NF vs. MF groups. Table S4. Differentially expressed genes (DEGs) with FPKM values in RNA-seq in NF vs. MF groups. Table S5. Annotatable DEGs with FPKM values in RNA-seq in NF vs. MF groups. Table S6. Analyses of top 20 GO enrichment pathways in NF vs. MF groups. Table S7. Analyses of KEGG enrichment pathways in NF vs. MF groups. Table S8. Identified (DEGs) involved in the main KEGG enrichment pathways in NF vs. MF groups. Table S9. Primers used in qRT-PCR validation of NF vs. MF groups.

Author Contributions

Conceptualization, L.L. and Z.D.; Methodology, L.L.; Validation, L.L. and S.C.; Investigation, L.L., Y.Z., S.C. and Q.W.; Resources, Z.D. and Q.W.; Data curation, L.L. and Y.Z.; Writing—original draft preparation, L.L. and Z.D.; Writing—review and editing, L.L.; Visualization, Y.Z.; Supervision, S.C.; Project administration, L.L.; Funding acquisition, Z.D. and Q.W. All authors have read and agreed to the published version of the manuscript.

Funding

This research was supported by Hainan Provincial Natural Science Foundation of China (323RC523) and Hainan Provincial Major Science and Technology Plan Project (zdkj201902).

Institutional Review Board Statement

Not applicable.

Data Availability Statement

Data will be made available at https://www.ncbi.nlm.nih.gov/bioproject/PRJNA1185135 (accessed on 13 November 2024).

Conflicts of Interest

The authors declare no conflicts of interest.

References

  1. Ashok, Y.; Jayaswa, P.K.; Raman, K.V.; Singh, B.; Singh, N.K.; Usha, K. Correction to: Transcriptome analysis of flowering genes in mango (Mangifera indica L.) in relation to floral malformation. J. Plant Biochem. Biotechnol. 2020, 29, 571–572. [Google Scholar] [CrossRef]
  2. Liu, K.; Li, H.; Li, W.; Zhong, J.; Chen, Y.; Shen, C.; Yuan, C. Comparative transcriptomic analyses of normal and malformed flowers in sugar apple (Annona squamosa L.) to identify the differential expressed genes between normal and malformed flowers. BMC Plant Biol. 2017, 17, 170. [Google Scholar] [CrossRef] [PubMed]
  3. Jong, M.; Wolters-Arts, M.; Feron, R.; Mariani, C.; Vriezen, W.H. The Solanum lycopersicum auxin response factor 7 (SlARF7) regulates auxin signaling during tomato fruit set and development. Plant J. 2009, 57, 160–170. [Google Scholar] [CrossRef] [PubMed]
  4. Zhang, W.; Xu, Y.; Jing, L.; Jiang, B.; Wang, Q.; Wang, Y. Preliminary Study on the Formation Mechanism of Malformed Sweet Cherry (Prunus avium L.) Fruits in Southern China Using Transcriptome and Metabolome Data. Int. J. Mol. Sci. 2024, 25, 153. [Google Scholar] [CrossRef]
  5. Davis, S.J. Integrating hormones into the floral-transition pathway of Arabidopsis thaliana. Plant Cell Environ. 2009, 32, 1201–1210. [Google Scholar] [CrossRef]
  6. Mesejo, C.; Yuste, R.; Reig, C.; Martínez-Fuentes, A.; Iglesias, D.J.; Muñoz-Fambuena, N.; Bermejo, A.; Germanà, M.A.; Primo-Millo, E.; Agustí, M. Gibberellin reactivates and maintains ovary-wall cell division causing fruit set in parthenocarpic Citrus species. Plant Sci. 2016, 247, 13–24. [Google Scholar] [CrossRef]
  7. Lu, L.; Liang, J.J.; Chang, X.; Yang, H.T.; Li, T.Z.; Hu, J.F. Enhanced vacuolar invertase activity and capability for carbohydrate import in GA-treated inflorescence correlate with increased fruit set in grapevine. Tree Genet. Geno. 2017, 13, 21–33. [Google Scholar] [CrossRef]
  8. Jiang, S.; Luo, J.; Xu, F.J.; Zhang, X.Y. Transcriptome Analysis Reveals Candidate Genes Involved in Gibberellin-Induced Fruit Setting in Triploid Loquat (Eriobotrya japonica). Front. Plant Sci. 2016, 7, 1924. [Google Scholar] [CrossRef]
  9. Wen, B.B.; Song, W.L.; Sun, M.Y.; Chen, M.; Mu, Q.; Zhang, X.H.; Wu, Q.J.; Chen, X.D.; Gao, D.S.; Wu, H.Y. Identification and characterization of cherry (Cerasus pseudocerasus G. Don) genes responding to parthenocarpy induced by GA3 through transcriptome analysis. BMC Genet. 2019, 20, 65. [Google Scholar] [CrossRef]
  10. Srivastava, A.; Handa, A.K. Hormonal regulation of tomato fruit development: A molecular perspective. J. Plant Growth Regul. 2005, 24, 67–82. [Google Scholar] [CrossRef]
  11. Bassel, G.W.; Mullen, R.T.; Bewley, J.D. Procera is a putative DELLA mutant in tomato (Solanum lycopersicum): Effects on the seed and vegetative plant. J. Exp. Bot. 2008, 59, 585–593. [Google Scholar] [CrossRef]
  12. Audran-Delalande, C.; Bassa, C.; Mila, I.; Regad, F.; Zouine, M.; Bouzayen, M. Genome-wide identification, functional analysis and expression profiling of the Aux/IAA gene family in Tomato. Plant Cell Physiol. 2012, 53, 659–672. [Google Scholar] [CrossRef]
  13. Wang, H.; Jones, B.; Li, Z.; Frasse, P.; Delalande, C.; Regad, F.; Chaabouni, S.; Latché, A.; Pech, J.C.; Bouzayen, M. The tomato Aux/IAA transcription factor IAA9 is involved in fruit development and leaf morphogenesis. Plant Cell 2005, 17, 2676–2692. [Google Scholar] [CrossRef] [PubMed]
  14. Jong, M.; Mariani, C.; Vriezen, W.H. The role of auxin and gibberellin in tomato fruit set. J. Exp. Bot. 2009, 60, 1523–1532. [Google Scholar] [CrossRef]
  15. Nitsch, L.M.; Oplaat, C.; Feron, R.; Ma, Q.; Wolters-Arts, M.; Hedden, P.; Mariani, C.; Vriezen, W.H. Abscisic acid levels in tomato ovaries are regulated by LeNCED1 and SlCYP707A1. Planta 2009, 229, 1335–1346. [Google Scholar] [CrossRef] [PubMed]
  16. Vriezen, W.H.; Feron, R.; Maretto, F.; Keijman, J.; Mariani, C. Changes in tomato ovary transcriptome demonstrate complex hormonal regulation of fruit set. New Phytol. 2008, 177, 60–76. [Google Scholar] [CrossRef] [PubMed]
  17. Kuhn, N.; Serrano, A.; Abello, C.; Arce, A.; Espinoza, C.; Gouthu, S.; Deluc, L.; Arce-Johnson, P. Regulation of polar auxin transport in grapevine fruitlets (Vitis vinifera L.) and the proposed role of auxin homeostasis during fruit abscission. BMC Plant Biol. 2016, 16, 234. [Google Scholar] [CrossRef]
  18. Eccher, G.; Begheldo, M.; Boschetti, A.; Ruperti, B.; Botton, A. Roles of ethylene production and ethylene receptor expression in regulating apple fruitlet abscission. Plant Physiol. 2015, 169, 125–137. [Google Scholar] [CrossRef]
  19. Zhang, J.; Wang, T.; Zhang, F.; Liu, Y.; Wang, G. Comparative Analysis of the Transcriptomes of Persisting and Abscised Fruitlets: Insights into Plant Hormone and Carbohydrate Metabolism Regulated Self-Thinning of Pecan Fruitlets during the Early Stage. Curr. Issues Mol. Biol. 2022, 44, 176–193. [Google Scholar] [CrossRef]
  20. Wang, Y.; Lu, W.J.; Li, J.G.; Jiang, Y.M. Differential expression of two expansin genes in developing fruit of cracking-susceptible and resistant Litchi Cultivars. J. Amer. Soc. Hort. Sci. 2006, 131, 118–121. [Google Scholar] [CrossRef]
  21. Kasai, S.; Hayama, H.; Kashimura, Y.; Kudo, S.; Osanai, Y. Relationship between fruit cracking and expression of the expansin gene MdEXPA3 in ‘Fuji’ apples (Malus domestica Borkh.). Sci. Hortic. 2008, 116, 194–198. [Google Scholar] [CrossRef]
  22. Jiang, F.; Lopez, A.; Jeon, S.; Freitas, S.T.; Yu, Q.; Wu, Z.; Labavitch, J.M.; Tian, S.; Powell, A.L.T.; Mitcham, E. Disassembly of the fruit cell wall by the ripening-associated polygalacturonase and expansin influences tomato cracking. Hortic. Res. 2019, 6, 17. [Google Scholar] [CrossRef] [PubMed]
  23. Moctezuma, E.; Smith, D.L.; Gross, K.C. Antisense suppression of a beta-galactosidase gene (TBG6) in tomato increases fruit cracking. J. Exp. Bot. 2003, 54, 2025–2033. [Google Scholar] [CrossRef]
  24. Moctezuma, E.; Smith, D.L.; Gross, K.C. Effect of ethylene on mRNA abundance of three β-galactosidase genes in wild type and mutant tomato fruit. Postharvest Biol. Technol. 2003, 28, 207–217. [Google Scholar] [CrossRef]
  25. Lu, W.; Wang, Y.; Jiang, Y.; Li, J.; Liu, H.; Duan, X.; Song, L. Differential expression of litchi XET genes in relation to fruit growth. Plant Physiol. Biochem. 2006, 44, 707–713. [Google Scholar] [CrossRef]
  26. Mishra, A.; Khare, S.; Trivedi, P.K.; Nath, P. Effect of ethylene, 1-MCP, ABA and IAA on break strength, cellulase and polygalacturonase activities during cotton leaf abscission. S. Afr. J. Bot. 2008, 74, 282–287. [Google Scholar] [CrossRef]
  27. Roberts, J.A.; Gonzalez-Carranza, Z.H. Pectinase functions in abscission. Stewart Postharvest Rev. 2009, 5, 1–4. [Google Scholar] [CrossRef]
  28. Tsuchiya, M.; Satoh, S.; Iwai, H. Distribution of XTH, expansin, and secondary-wall-related CesA in floral and fruit abscission zones during fruit development in tomato (Solanum lycopersicum). Front. Plant Sci. 2015, 6, 1–9. [Google Scholar] [CrossRef]
  29. Patterson, S.E.; Bleecker, A.B. Ethylene-Dependent and -Independent Processes Associated with Floral Organ Abscission in Arabidopsis. Plant Physiol. 2004, 134, 194–203. [Google Scholar] [CrossRef]
  30. Honma, T.; Goto, K. Complexes of MADS-box proteins are sufficient to convert leaves into floral organs. Nature 2001, 409, 525–529. [Google Scholar] [CrossRef]
  31. Vrebalov, J.; Ruezinsky, D.; Padmanabhan, V.; White, R.; Medrano, D.; Drake, R.; Schuch, W.; Giovannoni, J. A MADS-box gene necessary for fruit ripening at the tomato ripening-inhibitor (rin) locus. Science 2002, 296, 343–346. [Google Scholar] [CrossRef]
  32. Molesini, B.; Dusi, V.; Pennisi, F.; Pandolfini, T. How hormones and mads-box transcription factors are involved in controlling fruit set and parthenocarpy in tomato. Genes 2020, 11, 1441. [Google Scholar] [CrossRef] [PubMed]
  33. Nakano, T.; Fujisawa, M.; Shima, Y.; Ito, Y. The AP2/ERF transcription factor SlERF52 functions in flower pedicel abscission in tomato. J. Exp. Bot. 2014, 65, 3111–3119. [Google Scholar] [CrossRef]
  34. Ma, C.; Meir, S.; Xiao, L.; Tong, J.; Liu, Q.; Reid, M.S.; Jiang, C.Z. A KNOTTED1-LIKE HOMEOBOX protein, KD1, regulates abscission in tomato by modulating the auxin pathway. Plant Physiol. 2015, 167, 844–853. [Google Scholar] [CrossRef] [PubMed]
  35. Jinn, T.L.; Stone, J.M.; Walker, J.C. HAESA, an Arabidopsis leucine-rich repeat receptor kinase, controls floral organ abscission. Genes Dev. 2000, 14, 108–117. [Google Scholar] [CrossRef]
  36. Cheng, C.; Zhang, L.; Yang, X.; Zhong, G. Profiling gene expression in citrus fruit calyx abscission zone (AZ-C) treated with ethylene. Mol. Genet. Genom. 2015, 290, 1991–2006. [Google Scholar] [CrossRef] [PubMed]
  37. Merelo, P.; Agustí, J.; Arbona, V.; Costa, M.L.; Estornell, L.H.; Gómez-Cadenas, A.; Coimbra, S.; Gómez, M.D.; Pérez-Amador, M.A.; Domingo, C. Cell wall remodeling in abscission zone cells during ethylene promoted fruit abscission in citrus. Front. Plant Sci. 2017, 8, 1–20. [Google Scholar] [CrossRef]
  38. Ran, E.; Yermiyahu, U.; Yasuor, H.; Dan, C.C.; Schwartz, A.; Ben-Gal, A.; Dag, A. Phosphorous Nutritional Level, Carbohydrate Reserves and Flower Quality in Olives. PLoS ONE 2016, 11, e0167591. [Google Scholar] [CrossRef]
  39. Yang, Z.; Zhong, X.; Fan, Y.; Wang, H.; Li, J.; Huang, X. Burst of reactive oxygen species in pedicel-mediated fruit abscission after carbohydrate supply was cut off in longan (Dimocarpus longan). Front. Plant Sci. 2015, 6, 360. [Google Scholar] [CrossRef]
  40. Li, C.; Wang, Y.; Huang, X.; Li, J.; Wang, H.; Li, J. An improved fruit transcriptome and the identification of the candidate genes involved in fruit abscission induced by carbohydrate stress in litchi. Front. Plant Sci. 2015, 6, 439. [Google Scholar] [CrossRef]
  41. Kuang, J.F.; Wu, J.Y.; Zhong, H.Y.; Li, C.Q.; Chen, J.Y.; Lu, W.J.; Li, J.G. Carbohydrate stress affecting fruitlet abscission and expression of genes related to auxin signal transduction pathway in litchi. Int. J. Mol. Sci. 2012, 13, 16084–16103. [Google Scholar] [CrossRef] [PubMed]
  42. Celton, J.M.; Dheilly, E.; Guillou, M.C.; Simonneau, F.; Juchaux, M.; Costes, E.; Laurens, F.; Renou, J.P. Additional amphivasal bundles in pedicel pith exacerbate central fruit dominance and induce self-thinning of lateral fruitlets in apple. Plant Physiol. 2014, 164, 1930–1951. [Google Scholar] [CrossRef] [PubMed]
  43. Kusano, M.; Worarad, K.; Fukushima, A.; Kamiya, K.; Mitani, Y.; Okazaki, Y.; Higashi, Y.; Nakabayashi, R.; Kobayashi, M.; Mori, T.; et al. Transcriptomic, Hormonomic and Metabolomic Analyses Highlighted the Common Modules Related to Photosynthesis, Sugar Metabolism and Cell Division in Parthenocarpic Tomato Fruits during Early Fruit Set. Cells 2022, 11, 1420. [Google Scholar] [CrossRef]
  44. Rook, F.; Corke, F.; Baier, M.; Holman, R.; May, A.G.; Bevan, M.W. Impaired sucrose induction1 encodes a conserved plant-specific protein that couples carbohydrate availability to gene expression and plant growth. Plant J. 2006, 46, 1045–1058. [Google Scholar] [CrossRef] [PubMed]
  45. Rorat, T. Plant dehydrins–tissue location, structure and function. Cell. Mol. Biol. Lett. 2006, 11, 536–556. [Google Scholar] [CrossRef]
  46. Herrera-Rodriguez, M.B.; Maldonado, J.M.; Perez-Vicente, R. Light and metabolic regulation of HAS1, HAS1.1 and HAS2, three asparagine synthetase genes in Helianthus annuus. Plant Physiol. Biochem. 2004, 42, 511–518. [Google Scholar] [CrossRef]
  47. Wu, X. Study on the Regulatory Effect of Cytokinin on Tomato Multi Ventricular Malformation Fruit. Ph.D. Thesis, Shenyang Agricultural University, Shenyang, China, 2020. [Google Scholar]
  48. Wu, J.; Sun, W.; Sun, C.; Xu, C.; Li, S.; Li, P.; Xu, H.; Zhu, D.; Li, M.; Yang, L.; et al. Cold stress induces malformed tomato fruits by breaking the feedback loops of stem cell regulation in floral meristem. New Phytol. 2023, 237, 2268–2283. [Google Scholar] [CrossRef]
  49. Gao, J.F. Experimental Guidance for Plant Physiology; Higher Education Press: Beijing, China, 2006; pp. 144–200. [Google Scholar]
  50. Balcke, G.U.; Handrick, V.; Bergau, N.; Fichtner, M.; Henning, A.; Stellmach, H.; Tissier, A.; Hause, B.; Frolov, A. An UPLC-MS/MS method for highly sensitive high-throughput analysis of phytohormones in plant tissues. Plant Method. 2012, 8, 47. [Google Scholar] [CrossRef]
  51. Owen, S.J.; Abrams, S.R. Measurement of plant hormones by liquid chromatography—Mass spectrometry. In Plant Hormones; Humana Press: Totowa, NJ, USA, 2009; pp. 39–51. [Google Scholar]
  52. Lu, L.; Dong, Z.; Yin, X.; Chen, S.; Mehvish, A. Integration of Phenotypes, Phytohormones, and Transcriptomes to Elucidate the Mechanism Governing Early Physiological Abscission in Coconut Fruits (Cocos nucifera L.). Forests 2024, 15, 1475. [Google Scholar] [CrossRef]
  53. Xiao, Y.; Xu, P.X.; Fan, H.K.; Luc, B.; Xia, W.; Stephanie, B.; Xu, J.Y.; Li, Q.; Guo, A.P.; Zhou, L.X.; et al. The genome draft of coconut (Cocos nucifera). GigaScience 2017, 6, 1–11. [Google Scholar] [CrossRef]
  54. Tatusov, R.L.; Galperin, M.Y.; Natale, D.A. The COG database: A tool for genome scale analysis of protein functions and evolution. Nucleic Acids Res. 2000, 28, 33–36. [Google Scholar] [CrossRef] [PubMed]
  55. Finn, R.D.; Alex, B.; Jody, C.; Penelope, C.; Eberhardt, R.Y.; Eddy, S.R.; Andreas, H.; Kirstie, H.; Liisa, H.; Jaina, M.; et al. Pfam: The protein families database. Nucleic Acids Res. 2013, 42, D222–D230. [Google Scholar] [CrossRef] [PubMed]
  56. Li, B.; Dewey, C.N. RSEM: Accurate transcript quantification from RNA-seq data with or without a reference genome. BMC Bioinform. 2011, 12, 323. [Google Scholar] [CrossRef]
  57. Love, M.I.; Huber, W.; Anders, S. Moderated estimation of fold change and dispersion for RNA-seq data with DESeq2. Genome Biol. 2014, 15, 550. [Google Scholar] [CrossRef]
  58. Ashburner, M.; Ball, C.A.; Blake, J.A.; Botstein, D.; Butler, H.; Cherry, J.M.; Davis, A.P.; Dolinski, K.; Dwight, S.S.; Eppig, J.T.; et al. Gene ontology: Tool for the unification of biology. Nat. Genet. 2000, 25, 25–29. [Google Scholar] [CrossRef]
  59. Alexa, A.; Rahnenfuhrer, J. topGO: Enrichment analysis for gene ontology. In R Package Version 2.8; The Pennsylvania State University: University Park, TX, USA, 2010. [Google Scholar]
  60. Kanehisa, M.; Goto, S.; Kawashima, S.; Okuno, Y.; Hattori, M. The KEGG resource for deciphering the genome. Nucleic Acids Res. 2004, 32, D277–D280. [Google Scholar] [CrossRef]
  61. Livak, K.J.; Schmittgen, T.D. Analysis of relative gene expression data using real time quantitative PCR and the 2-DDCT method. Methods 2001, 25, 402–408. [Google Scholar] [CrossRef]
  62. Rong, Y.; Li, J.; Zhang, N.; Yu, Q.; Xu, W. Phenotypically abnormal cotyledonary Vitis vinifera embryos differ in anatomy, endogenous hormone levels and transcriptome proffles. Tree Physiol. 2023, 43, 467–485. [Google Scholar] [CrossRef]
  63. Li, H.; Suo, Y.; Li, H.; Sun, P.; Han, W.; Fu, J. Cytological, Phytohormone, and Transcriptome Analyses Provide Insights into Persimmon Fruit Shape Formation (Diospyros kaki Thunb.). Int. J. Mol. Sci. 2024, 25, 4812. [Google Scholar] [CrossRef]
  64. Ye, J.; Hu, T.; Yang, C.; Li, H.; Yang, M.; Ijaz, R.; Ye, Z.; Zhang, Y. Transcriptome Profiling of Tomato Fruit Development Reveals Transcription Factors Associated with Ascorbic Acid, Carotenoid and Flavonoid Biosynthesis. PLoS ONE 2015, 10, e0130885. [Google Scholar] [CrossRef]
  65. Gou, N.; Chen, C.; Huang, M.; Zhang, Y.; Bai, H.; Li, H.; Wang, L.; Wuyun, T. Transcriptome and Metabolome Analyses Reveal Sugar and Acid Accumulation during Apricot Fruit Development. Int. J. Mol. Sci. 2023, 24, 16992. [Google Scholar] [CrossRef] [PubMed]
  66. Yang, H.; Tian, C.; Ji, S.; Ni, F.; Fan, X.; Yang, Y.; Sun, C.; Gong, H.; Zhang, A. Integrative analyses of metabolome and transcriptome reveals metabolomic variations and candidate genes involved in sweet cherry (Prunus avium L.) fruit quality during development and ripening. PLoS ONE 2021, 16, e0260004. [Google Scholar] [CrossRef]
  67. Xie, W.; Xu, D.; Chen, F.; Wang, Z.; Luo, J.; He, Y.; Zheng, Q.; Liu, C. Integrated Cytological, Physiological, and Transcriptome Analyses Provide Insight into the Albino Phenotype of Chinese Plum (Prunus salicina). Int. J. Mol. Sci. 2023, 24, 14457. [Google Scholar] [CrossRef] [PubMed]
  68. Balbontín, C.; Ayala, H.; Rubilar, J.; Cote, J.; Figueroa, C.R. Transcriptional analysis of cell wall and cuticle related genes during fruit development of two sweet cherry cultivars with contrasting levels of cracking tolerance. Chil. J. Agric. Res. 2014, 74, 162–169. [Google Scholar] [CrossRef]
  69. Wang, J.; Gao, X.; Ma, Z.; Chen, J.; Liu, Y. Analysis of the molecular basis of fruit cracking susceptibility in Litchi chinensis cv. Baitangying by transcriptome and quantitative proteome profiling. J. Plant Physiol. 2019, 234–235, 106–116. [Google Scholar] [CrossRef]
  70. Liu, Y.L.; Chen, S.Y.; Liu, G.T.; Jia, X.Y.; Haq, S.; Deng, Z.J.; Luo, D.X.; Li, R.; Gong, Z.H. Morphological, physiochemical, and transcriptome analysis and CaEXP4 identiffcation during pepper (Capsicum annuum L.) fruit cracking. Sci. Hortic. 2022, 297, 110982. [Google Scholar] [CrossRef]
  71. Zhang, L.; Zhang, X.; Li, M.; Wang, N.; Qu, X.; Fan, S. Transcriptome Analysis of Elm (Ulmus pumila)Fruit to Identify Phytonutrients Associated Genes and Pathways. Forests 2019, 10, 738. [Google Scholar] [CrossRef]
  72. Cheng, H.; Kong, W.; Tang, T.; Ren, K.; Zhang, K.; Wei, H.; Lin, T. Identification of Key Gene Networks Controlling Soluble Sugar and Organic Acid Metabolism During Oriental Melon Fruit Development by Integrated Analysis of Metabolic and Transcriptomic Analyses. Front. Plant Sci. 2022, 13, 830517. [Google Scholar] [CrossRef]
Figure 1. Coconut fruit phenotype. (a) Fruit tissue morphology of NF and MF; (be) fruit characteristics of NF and MF. The data represent the mean ± standard deviation (SD) of 16 samples, and the significance of fruit characteristics between NF and MF was determined by student’s t-test. * significant at p < 0.05; NF, normal fruit; MF, malformed fruit.
Agriculture 15 00723 g001
Figure 2. Microstructure of NF and MF. (a) Optical microstructure of NF (10×); (b) Optical microstructure of MF (10×); (c) Transmission electron microscopy of NF (×1.0 k, Zoom-1, HC-1 80.0 kV); (d) Transmission electron microscopy of MF (×1.0 k, Zoom-1, HC-1 80.0 kV); CW, cell wall; V, vacuole; NF, normal fruit; MF, malformed fruit.
Agriculture 15 00723 g002
Figure 3. Analysis of NF and MF pulp nutrients and phytohormones. (a) Coconut pulp nutrients of NFs and MFs; (b) Coconut pulp phytohormones of NFs and MFs. The data represent the mean ± standard deviation (SD) of three biological replicates, and the significance of nutrient and phytohormone contents in the pulp between NFs and MFs was determined using Student’s t-test. * significant at p < 0.05; ** significant at p < 0.01. NF, normal fruit; MF, malformed fruit.
Agriculture 15 00723 g003
Figure 4. Gene expression analysis in NFs and MFs. (a) Gene expression distribution in NFs and MFs; (b) Principal component analysis (PCA) of genes expressed in NFs and MFs; (c) Correlation analysis of genes in NFs and MFs; (d) Volcanic map of DEGs; (e) Cluster analysis heatmap of DEG; (f) Bar chart of DEG statistical data. NF, normal fruit; MF, malformed fruit.
Agriculture 15 00723 g004
Figure 5. Statistical chart in GO annotation classification of all DEGs in NFs vs. MFs (a); Functional classification of all DEGs in biological processes (BPs), cellular components (CCs) and molecular function (MFT) categories in NFs vs. MFs (b). NF, normal fruit; MF, malformed fruit.
Agriculture 15 00723 g005
Figure 6. DEGs enriched in the top 20 GO terms of biological processes (BPs), cellular components (CCs) and molecular function (MFT) in NFs vs. MFs. The pathways in the red frame represent the ones of GO enrichment analysis at p value < 0.01 and q value < 0.01. NF, normal fruit; MF, malformed fruit.
Agriculture 15 00723 g006
Figure 7. KEGG analysis of DEGs in NFs vs. MFs. (a) KEGG classification chart for all DEGs. (b) Bubble chart of KEGG enrichment analysis from all DEGs in NFs vs. MFs. The pathways in the red frame represent the ones of KEGG enrichment analysis at p value < 0.01 and q value < 0.05. NF, normal fruit; MF, malformed fruit.
Agriculture 15 00723 g007
Figure 8. Expression analysis of the main genes involved in phenylpropanoid biosynthesis in NFs vs. MFs, and the expression profiles of DEGs related to crucial enzymes in this pathway. PAL, phenylalanine ammonia lyase; CYP73A, trans-cinnamate 4-monooxygenase; PER, peroxidase; CAD, cinnamyl alcohol dehydrogenase; CCR, cinnamoyl–CoA reductase; 4CL, 4-coumarate–CoA ligase; COMT, caffeic acid 3-O-methyltransferase. Red color indicates upregulation, and darker color indicates greater upregulation; Green color indicates the downregulation, and darker color indicates greater downregulation. NF, normal fruit; MF, malformed fruit.
Agriculture 15 00723 g008
Figure 9. Expression analysis of the main genes involved in plant hormone signal transduction in NFs vs. MFs, and the expression profiles of DEGs related to phytohormones (e.g., indole acetic acid (IAA), abscisic acid (ABA), cytokinin (CK), gibberellin acid (GA), brassinosteroid (BR), jasmonic acid (JA), and salicylic acid (SA) in this pathway. NF, normal fruit; MF, malformed fruit.
Agriculture 15 00723 g009
Figure 10. Heatmap of DEGs and enzyme Activity related to cell wall metabolism in NFs vs. MFs. (a) Enzyme Activity related to cell wall metabolism in NFs vs. MFs. (b) Heatmap of DEGs related to cell wall metabolism in NFs vs. MFs. The data represent the mean ± standard deviation (SD) of three biological replicates, and the significance of nutrient and phytohormone contents in the pulp between NFs and MFs was determined using Student’s t-test. * significant at p < 0.05. NF, normal fruit; MF, malformed fruit.
Agriculture 15 00723 g010
Figure 11. Transcriptional factor analysis in NFs vs. MFs. (a) The expression of DEGs involved in transcription factors in NFs vs. MFs. (b) Regulation of the distribution of expression of transcription factor families in NFs vs. MFs. NF, normal fruit; MF, malformed fruit.
Agriculture 15 00723 g011
Figure 12. The expression of 11 malformed coconut fruit (MF)-related genes was validated by qRT-PCR analysis. The bar chart represents the value of FPKM. The line graph represents the qRT-PCR values. The error bars represent the standard deviation of three biological replicates (ak). Correlation of expression changes observed through RNA-seq (y-axis) and qRT PCR (x-axis) (l). RNA-seq and qRT-PCR values between NFs and MFs were determined using Student’s t-test. ** significant at p < 0.01.
Agriculture 15 00723 g012
Figure 13. A hypothetical model for malformed coconut fruits in the NF and MF groups. SS, soluble sugars; RS, reducing sugar; SH, starch; SP, soluble proteins; FA, fat; IAA, indole acetic acid; ABA, abscisic acid; CK, cytokinin; GA, gibberellic acid; BR, brassinosteroid; JA, jasmonic acid; SA, salicylic acid; ETH, ethylene; CEL, cellulase; PG, polygalacturonase; PE, pectinesterase; cell wall-related genes (e.g., CEL, PE, PG, PEL, URG, UTR, VTC2, EXP, and XET/XTH), and phytohormone-related genes (e.g., IAA, GA, CK, BR, ABA, JA, SA, and ETH).
Agriculture 15 00723 g013
Table 1. Analysis of crucial DEGs involved in flavonoid biosynthesis in NFs vs. MFs.
GeneIDDescriptionSymbollog2 (MF/NF)p-Value
COCN_GLEAN_10001934Flavanone 3-dioxygenase F3H1F3H-15.9555.59 × 10−14
COCN_GLEAN_10013702Flavanone 3-dioxygenase F3H1F3H-16.5042.03 × 10−151
COCN_GLEAN_10017999p-coumarate 3-hydroxylaseC3H3.8636.96 × 10−39
COCN_GLEAN_10010266p-coumarate 3-hydroxylaseC3H3.5082.71 × 10−8
COCN_GLEAN_10023544Chalcone synthase 1CHS15.0336.36 × 10−10
COCN_GLEAN_10000658Chalcone synthase 3CHS34.9899.10 × 10−6
COCN_GLEAN_10008211Probable chalcone–flavonone isomerase 3CHI32.0593.60 × 10−4
COCN_GLEAN_10003476Chalcone–flavonone isomeraseCHI5.9629.33 × 10−63
COCN_GLEAN_10004414Probable chalcone–flavonone isomerase 3CHI34.5214.26 × 10−11
COCN_GLEAN_10003477Chalcone–flavonone isomeraseCHI5.5577.83 × 10−105
CUFF8.287.1Anthocyanidin reductaseANR3.5431.83 × 10−15
COCN_GLEAN_10000601Anthocyanidin reductaseANR3.7012.53 × 10−16
COCN_GLEAN_10006296Anthocyanidin reductaseANR3.0126.67 × 10−18
COCN_GLEAN_10022326Leucoanthocyanidin dioxygenaseANS5.9893.88 × 10−12
COCN_GLEAN_10024906Leucoanthocyanidin reductaseLAR1.1681.10 × 10−3
COCN_GLEAN_10012891Leucoanthocyanidin reductaseLAR4.7993.11 × 10−4
Note: Red color indicates upregulation, and darker color indicates greater upregulation.
Table 2. Analysis of crucial DEGs involved in starch and sucrose metabolism in NFs vs. MFs.
GeneIDDescriptionSymbollog2 (MF/NF)p-Value
COCN_GLEAN_10020022Beta-amylase 1BAM11.3011.37 × 10−5
COCN_GLEAN_10013727Beta-amylase 3BAM32.4841.02 × 10−10
COCN_GLEAN_10014734Beta-amylase 2BAM21.0102.05 × 10−3
CUFF24.74.1Beta-amylase 8BAM81.5631.03 × 10−9
COCN_GLEAN_10022348Beta-amylase 1BAM15.5551.83 × 10−33
COCN_GLEAN_10012930Inactive beta-amylase 9BAM9−2.6141.43 × 10−20
COCN_GLEAN_100175844-alpha-glucanotransferase DPE2DPE21.0154.20 × 10−4
Cocos_nucifera_newGene_9328Beta-glucosidase 26BGLU268.3423.58 × 10−16
COCN_GLEAN_10008735Beta-glucosidase 1BGLU18.2261.92 × 10−15
CUFF30.742.1Beta-glucosidase 4BGLU44.8761.03 × 10−17
COCN_GLEAN_10009626Beta-glucosidase 1BGLU12.6411.74 × 10−10
CUFF9.551.3Beta-glucosidase 20BGLU207.6589.59 × 10−13
CUFF28.239.1Beta-glucosidase 18BGLU182.8721.51 × 10−9
COCN_GLEAN_10021067Beta-glucosidase 18BGLU1810.5822.59 × 10−30
COCN_GLEAN_10002326Fructokinase-1FRK1−1.7218.30 × 10−14
CUFF47.25.2Probable fructokinase-6At1g66430−1.7473.50 × 10−28
COCN_GLEAN_10003025Fructokinase-2FRK21.4137.48 × 10−5
COCN_GLEAN_10020868Sucrose synthase 2SUS2−1.4043.89 × 10−8
COCN_GLEAN_10006864Sucrose synthase 2SUS2−1.7522.14 × 10−17
COCN_GLEAN_10007458Sucrose synthase 1SUS1−1.7212.68 × 10−33
Cocos_nucifera_newGene_8455Sucrose synthase 2SUS22.3319.76 × 10−15
CUFF36.91.2Probable sucrose–phosphate synthase 1SPS1−1.3428.43 × 10−10
COCN_GLEAN_10006080Granule-bound starch synthase 1GBSS2.0405.34 × 10−15
COCN_GLEAN_10009906Hexokinase-2HXK22.8031.62 × 10−13
Note: Red color indicates upregulation, and darker color indicates greater upregulation; Green color indicates the downregulation, and darker color indicates greater downregulation.
Table 3. Analysis of crucial DEGs involved in carbon metabolism in NFs vs. MFs.
GeneIDDescriptionSymbollog2 (MF/NF)p-Value
COCN_GLEAN_10009294Phosphoenolpyruvate carboxykinase (ATP) 1PCK1−1.0022.78 × 10−3
COCN_GLEAN_10017173Phosphoenolpyruvate carboxykinase (ATP) 1PCK13.7103.86 × 10−84
CUFF40.301.1Alcohol dehydrogenase-like 7At5g42250−7.9301.24 × 10−35
COCN_GLEAN_10014124Alcohol dehydrogenase-like 7At5g422509.5743.83 × 10−23
CUFF40.298.1Alcohol dehydrogenase-like 7At5g422506.9391.29 × 10−13
COCN_GLEAN_10019006Catalase isozyme 2CAT24.3111.48 × 10−16
COCN_GLEAN_10001533Catalase isozyme 1CAT1−1.8062.20 × 10−22
CUFF10.712.1Glucose-6-phosphate 1-dehydrogenaseG6PDH−1.2857.57 × 10−9
COCN_GLEAN_10004035Glucose-6-phosphate isomerasePGIC1−1.0841.25 × 10−9
COCN_GLEAN_10022495ATP-dependent 6-phosphofructokinase 2PFK2−1.7842.13 × 10−12
COCN_GLEAN_10010537ATP-dependent 6-phosphofructokinase 3PFK31.4045.06 × 10−10
COCN_GLEAN_10011659ATP-dependent 6-phosphofructokinase 2PFK21.8994.70 × 10−10
COCN_GLEAN_10014631ATP-dependent 6-phosphofructokinase 3PFK31.9953.12 × 10−16
COCN_GLEAN_10009250ATP-dependent 6-phosphofructokinase 3PFK3−1.4101.40 × 10−17
COCN_GLEAN_10013045Cysteine synthaseRCS1−1.6947.94 × 10−16
COCN_GLEAN_10021515Cysteine synthaseRCS1−1.3311.15 × 10−5
COCN_GLEAN_10016963Fructose bisphosphate aldolaseALDP−1.4512.11 × 10−3
COCN_GLEAN_10017469Fructose bisphosphate aldolase 1FBA1−1.5953.42 × 10−13
COCN_GLEAN_10006409Fructose bisphosphate aldolase 1FBA1−2.1792.46 × 10−19
Note: Red color indicates upregulation, and darker color indicates greater upregulation; Green color indicates the downregulation, and darker color indicates greater downregulation.
Disclaimer/Publisher’s Note: The statements, opinions and data contained in all publications are solely those of the individual author(s) and contributor(s) and not of MDPI and/or the editor(s). MDPI and/or the editor(s) disclaim responsibility for any injury to people or property resulting from any ideas, methods, instructions or products referred to in the content.

