Article

Estimation of Silage Maize Plant Moisture Content Based on UAV Multispectral Data and Ensemble Learning Methods

1
College of Water Conservancy and Hydropower Engineering, Gansu Agricultural University, Lanzhou 730070, China
2
State Key Laboratory of Crop Science in Arid Habitat Co-Constructed by Province and Ministry, Lanzhou 730070, China
3
College of Forestry, Gansu Agricultural University, Lanzhou 730070, China
*
Author to whom correspondence should be addressed.
Agriculture 2025, 15(7), 746; https://doi.org/10.3390/agriculture15070746
Submission received: 11 February 2025 / Revised: 20 March 2025 / Accepted: 25 March 2025 / Published: 31 March 2025
(This article belongs to the Section Digital Agriculture)

Abstract

:
Plant moisture content (PMC) serves as a crucial indicator of crop water status, directly affecting agricultural productivity, product quality, and the effectiveness of precision irrigation. Conventional methods for PMC assessment predominantly rely on destructive sampling techniques, which are labor-intensive and impede real-time monitoring. This study investigates silage maize cultivated in the Hexi region of China, leveraging multispectral data acquired via an unmanned aerial vehicle (UAV) to estimate PMC across different phenological stages. A stacked ensemble learning framework was developed, integrating Back Propagation Neural Network (BPNN), Random Forest Regression (RFR), and Support Vector Regression (SVR), with Partial Least Squares Regression (PLSR) employed for feature fusion. The findings indicate that incorporating vegetation indices into spectral variables significantly improved prediction performance. The standalone models demonstrated coefficient of determination (R2) values ranging from 0.43 to 0.69, with root mean square error (RMSE) spanning 0.61% to 1.43%. In contrast, the ensemble model exhibited superior accuracy, achieving R2 values between 0.61 and 0.87 and RMSE values from 0.54% to 1.38%. This methodology offers a scalable, non-invasive alternative for PMC estimation, facilitating data-driven irrigation optimization in regions facing water scarcity.

1. Introduction

Plant moisture content (PMC) is a fundamental parameter for assessing crop water status, playing a crucial role in determining yield, quality, and the effectiveness of precision irrigation strategies in modern agriculture [1]. Reliable and timely estimation of PMC is essential for optimizing water use efficiency and supporting sustainable agricultural practices, especially in response to escalating environmental pressures [2]. While irrigation remains indispensable for crop growth, inefficiencies in water application and excessive usage persist, particularly in arid regions such as the Hexi Corridor in China [3]. These challenges are further compounded by climate change, which exacerbates heat stress and alters precipitation dynamics, necessitating advanced monitoring techniques to mitigate water deficits and enhance adaptive capacity [4]. Traditional PMC measurement methods primarily depend on destructive sampling, requiring plant tissue collection, drying, and weighing to determine moisture content. Although these techniques ensure high accuracy, they are labor-intensive, time-consuming, and unsuitable for large-scale or high-frequency assessments [5]. This underscores the urgent need for innovative, non-invasive approaches to improve monitoring efficiency and facilitate sustainable water resource management [6]. Recent advances in remote sensing and unmanned aerial vehicle (UAV)-based monitoring have shown significant potential for providing real-time PMC data, offering a promising solution for precision irrigation and climate resilience strategies [7].
Conventional PMC assessment predominantly relies on destructive sampling, which, despite its precision, is impractical for large-scale agricultural applications due to extensive labor requirements and low temporal efficiency [8]. In contrast, remote sensing offers a rapid, non-destructive alternative, which can be categorized into three main modalities: satellite-based, UAV-based, and ground-based sensing. Ground-based remote sensing primarily utilizes hyperspectral imaging to assess vegetation water status. Prior research has successfully applied hyperspectral spectroscopy to estimate moisture content in harvested tobacco leaves [9], and recent studies have explored the feasibility of using smartphone-based imaging for tobacco water content assessment [10]. However, when compared to satellite and UAV-based methods, ground-based approaches demonstrate lower efficiency for large-scale crop monitoring. Significant progress has been made in vegetation water content retrieval using satellite remote sensing. Researchers have developed various retrieval models, including regression-based methods that correlate canopy water content with vegetation indices [11], the integration of the PROSAIL radiative transfer model with the Normalized Difference Water Index (NDWI) for estimating moisture levels in low-stature vegetation [12], and the INFORM model for assessing canopy moisture variations in fire-affected landscapes [13]. Additionally, the combination of the Enhanced Vegetation Index (EVI) with NDWI has proven effective in estimating winter wheat canopy water content and analyzing its water balance [14]. Despite these advancements, satellite-based approaches are constrained by long revisit cycles, limiting their temporal resolution. Furthermore, the spatial resolution of freely accessible satellite imagery is often inadequate for precision agriculture, while commercial high-resolution satellite data entail significant costs, restricting their widespread adoption. UAV-based remote sensing mitigates these limitations, offering superior spatial resolution, operational flexibility, and real-time data acquisition, making it increasingly valuable in precision agriculture. UAVs equipped with thermal infrared and multispectral sensors can capture key crop physiological parameters, including canopy temperature and vegetation indices, which can be utilized to estimate leaf area index, chlorophyll content, and water stress levels [15]. Additionally, UAV-mounted hyperspectral cameras, in combination with artificial neural networks, have achieved high-precision estimation of soil moisture content [16]. Other studies have demonstrated that integrating UAV-derived high-temporal-resolution multispectral data with soil moisture observations enables precise estimation of maize biomass and water-use efficiency at the field scale [17]. These findings highlight the significant potential of UAV-based remote sensing in precision agriculture and underscore the advantages of multi-sensor fusion in improving retrieval accuracy. Although hyperspectral and thermal infrared sensors provide higher measurement precision, their substantial cost remains a limiting factor. With the growing adoption of UAV-based multispectral imaging, this technology is expected to emerge as a more cost-effective, rapid, and efficient solution for non-destructive PMC estimation.
The application of machine learning in agricultural remote sensing has expanded significantly, driven by advances in computational techniques and the increasing availability of high-resolution datasets. Machine learning has demonstrated strong potential in tasks such as crop nutrient monitoring and canopy feature analysis, with models like Random Forest (RF) and Gaussian Process Regression (GPR) yielding promising results [18,19]. RF is particularly effective in handling high-dimensional data, identifying key feature variables, and accurately predicting crop nitrogen content [20]. Meanwhile, GPR has been recognized for its robustness in modeling uncertainties, making it a reliable approach for canopy characterization [21]. However, most existing research has focused on single-model applications, with limited exploration of ensemble learning techniques [22]. While individual models can achieve satisfactory results for specific datasets, they often suffer from limitations such as susceptibility to data distribution variations and a propensity for overfitting or underfitting [23]. The integration of multiple machine learning models presents an opportunity to enhance prediction accuracy and improve generalization capabilities in PMC estimation [24].
This study investigates PMC estimation in silage maize cultivated in the Hexi region, leveraging UAV-based multispectral imaging data collected at various growth stages under different irrigation treatments. Three machine learning models—Back Propagation Neural Network (BPNN), Random Forest Regression (RFR), and Support Vector Regression (SVR)—were employed for data fusion, and a stacked ensemble learning framework was implemented to enhance predictive performance. The specific objectives of this research are as follows: (1) to assess the potential of UAV-acquired multispectral imaging data across different growth stages for PMC estimation in silage maize, incorporating spectral bands and vegetation indices; (2) to evaluate the predictive performance of regression models, including BPNN, RFR, and SVR, in estimating PMC; and (3) to develop an ensemble learning approach to improve prediction accuracy and robustness in PMC estimation.

2. Materials and Methods

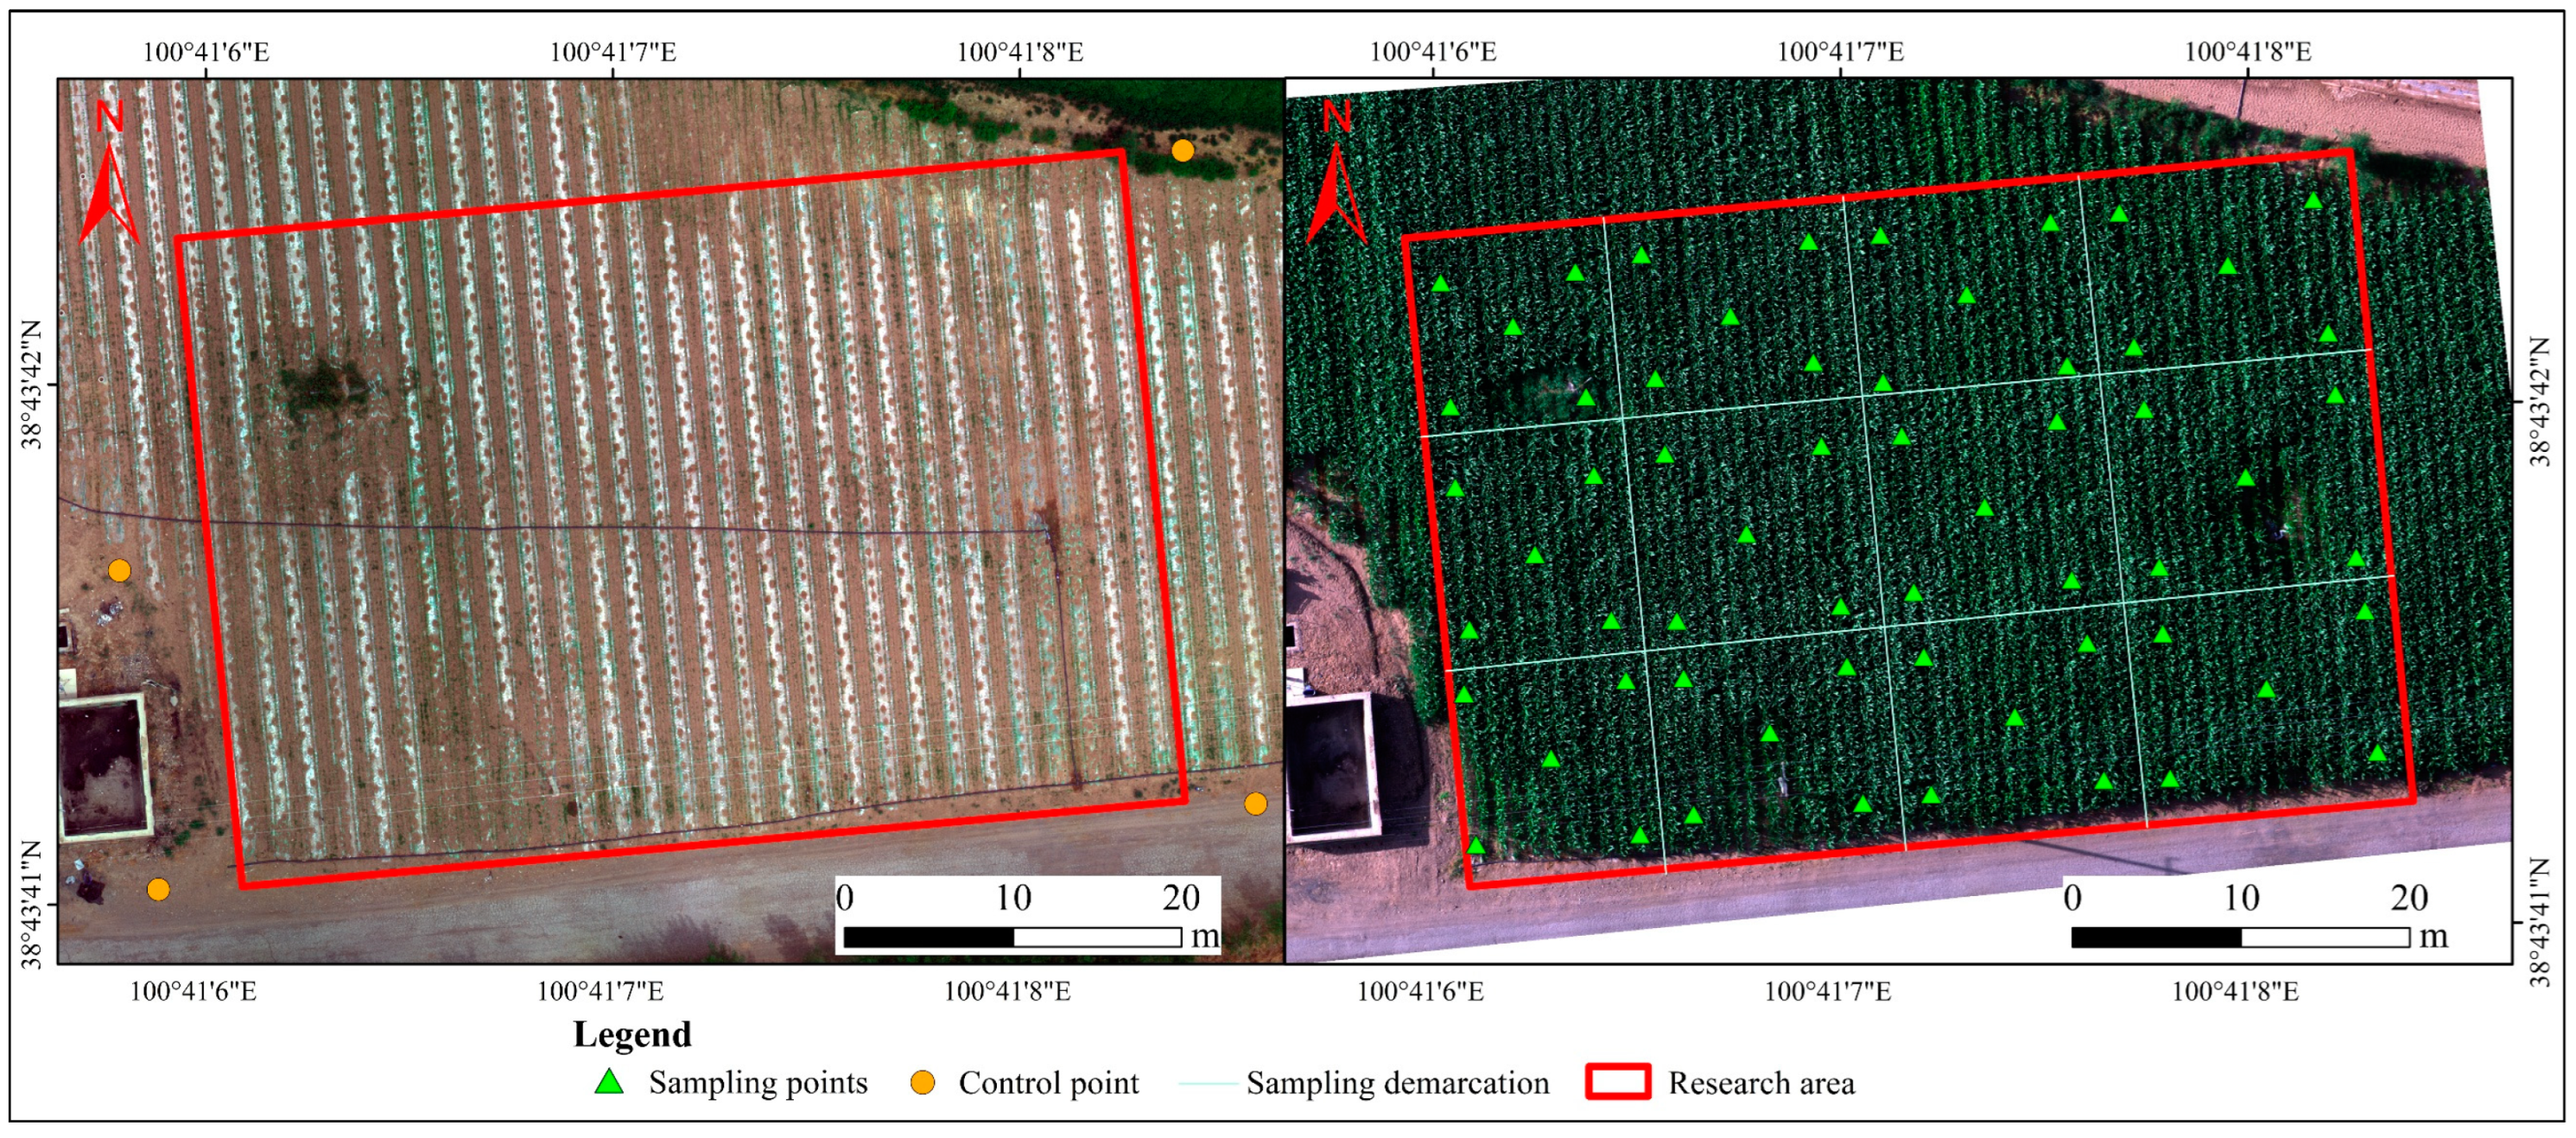
2.1. Overview of the Study Area and Experimental Design

The experiment was conducted at Huarui Ranch, Minle County, Zhangye City, Gansu Province, China (100°22′–101°13′ E, 37°56′–38°48′ N). This area is located within the Heihe River system and experiences a temperate continental desert–steppe climate [25]. The geographic location of the study area and plant sampling points are shown in Figure 1. The long-term average sunshine duration is 2794 h per year, with an average annual precipitation of 351 mm and an average annual temperature of 6.5 °C. During the 2022 silage maize growing season, the total precipitation was 181.4 mm, with a frost-free period of 140 days. To optimize water use, drip irrigation and sprinkler irrigation are commonly employed, with drip irrigation being the predominant method in silage maize cultivation. Crop rotation typically involves alternating maize with wheat or barley to maintain soil fertility and reduce pest pressure. In addition to silage maize, the region’s major crops include oats and alfalfa, with crop selection largely influenced by water availability and market demand. Climatic conditions during the silage maize growing season are shown in Figure 2.
The experiment was conducted from April to October 2022. Stratification was conducted based on soil texture, topographic gradient, and irrigation pattern. Given the dominance of sandy soil, minimal elevation variation, and proximity to drip irrigation pipelines, the sampling method followed an “S”-shaped five-point sampling approach. Sampling points were distributed throughout the field to capture spatial variability. The experiment consisted of four irrigation treatments: W1 (30% water-saving compared to the traditional irrigation rate, 4305 m3/hm2), W2 (20% water-saving, 4920 m3/hm2), W3 (10% water-saving, 5535 m3/hm2), and W4 (traditional drip irrigation rate, 6150 m3/hm2). Each treatment was replicated three times, resulting in a total of 12 experimental plots. Each plot measured 25 m in length and 1.6 m in width, covering an area of 40 m2. To minimize interference between adjacent plots, a 1 m buffer zone was established between them.
The maize variety used in the experiment was silage “Jinling No. 67”, provided by Silage Maize Seed Company (Gansu Huarui Agriculture Co., Ltd., Zhangye, China). The planting distance was 25 cm between plants and 50 cm between rows. Irrigation was carried out using subsurface drip irrigation, with tape emitters of the built-in patch type. The diameter of the laterals was 16 mm, with a wall thickness of 0.2 mm, and the distance between emitters was 300 mm, with a discharge rate of 2.2 L/h. The drip tape was laid parallel to the direction of silage maize rows, spaced 60 cm apart. Fertilization was performed using a hydraulic pump system, applied during irrigation. The nitrogen fertilizer used was urea (CO(NH2)2, N 46%), with a total application rate of 311 kg/hm2. Phosphorus and potassium fertilizers were applied as diammonium phosphate (containing 44% P2O5) and potassium sulfate (containing 57% K2O), respectively, with nitrogen fertilizer. They were applied in three stages: pre-jointing (5.9%), jointing stage (64.7%), and tasseling stage (29.4%). The total amounts applied were 146 kg/hm2 for phosphorus and 107 kg/hm2 for potassium.

2.2. Data Collection and Processing

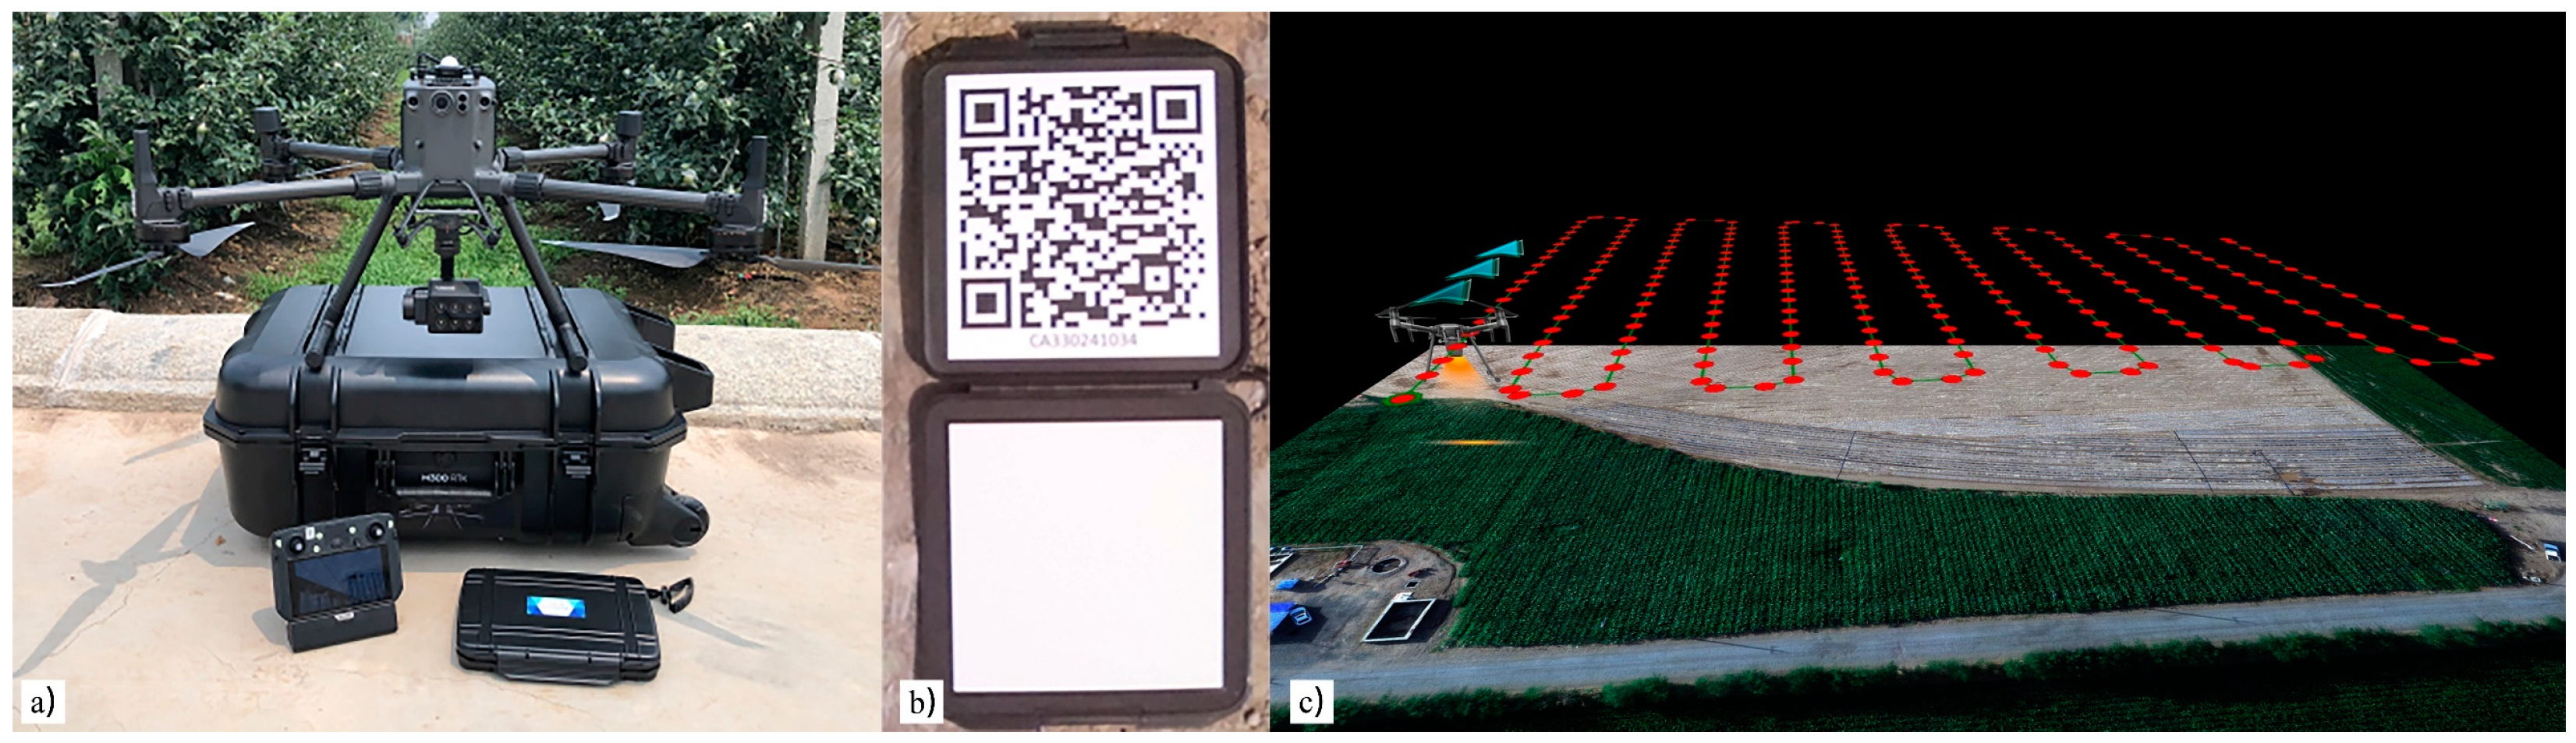
2.2.1. UAV Data Acquisition

In this study, multispectral remote sensing data were collected using a DJI M300 RTK quadcopter (DJI Technology Co., Ltd., Shenzhen, China) equipped with an MS600 Pro multispectral imaging system (Changguang Yuchen Information Technology Equipment Co., Ltd., Qingdao, China). This system comprises six independent CMOS image sensors, each featuring a resolution of 1.2 megapixels and configured to capture data across six distinct spectral bands: blue (450 nm @ 35 nm), green (555 nm @ 27 nm), red (660 nm @ 22 nm), red-edge 1 (720 nm @ 10 nm), red-edge 2 (750 nm @ 10 nm), and near-infrared (840 nm @ 30 nm). The data acquisition process was carried out under clear sky conditions between 10:00 AM and 12:00 PM using a structured vertical aerial imaging strategy. A preprogrammed flight route was executed to ensure systematic coverage of the study site, with radiometric calibration performed prior to data collection utilizing a standardized white reference panel. The UAV operated at a flight altitude of 30 m with a velocity of 2.5 m/s, yielding a ground sampling distance (GSD) of 2 cm. To ensure comprehensive scene coverage and minimize data gaps, the front and side overlap ratios were set to 80% and 75%, respectively. Figure 3 presents an overview of the UAV-mounted multispectral sensor, the calibration panel, and the predefined flight path, while the detailed UAV operational parameters are summarized in Table 1.

2.2.2. Plant Moisture Content Measurement

The study area was systematically divided into 12 sections, and sample collection was conducted using the “S” five-point sampling technique. On cloud-free days corresponding to the silking stage (16 July), tasseling stage (6 August), and physiological maturity stage (15 September) of silage maize, plant specimens exhibiting uniform growth characteristics were gathered from a 5 cm radius around designated sampling locations, concurrent with UAV-based multispectral data acquisition. Each collected plant was immediately placed into a sealed bag, and its fresh weight was measured and documented. The samples underwent an initial drying phase in an oven set at 105 °C for 30 min to remove surface moisture, followed by a secondary drying process at 70 °C for approximately 48 h until a constant mass was attained. Once fully dried, the final dry weight was recorded. The PMC was subsequently determined using the following equation, expressed in terms of wet weight:
P M C = F W D W D W × 100
where PMC is the plant moisture content (%), FW is the fresh weight (mg), and DW is the dry weight (mg).

2.2.3. UAV Image Preprocessing

Four ground control points (GCPs) were strategically positioned within the study site, with their precise coordinates determined using real-time kinematic (RTK) positioning technology. Image alignment and georeferencing were conducted using Pix4D Mapper 4.8.0, incorporating manually marked control points to enhance positional accuracy [26]. The final orthomosaic achieved a root mean square error (RMSE) of 0.05 m along the x-axis, 0.05 m along the y-axis, and 0.10 m along the z-axis, demonstrating a high degree of spatial precision. During UAV data acquisition, variations in solar illumination angles and sensor viewing geometry introduced shadow effects, which compromised the spectral fidelity of crop canopy reflectance. To mitigate these artifacts, supervised classification was performed in ENVI 5.3 using false-color composite imagery. The maximum likelihood classification method was applied to eliminate background soil interference and shadowed areas, followed by radiometric calibration [27]. Digital number (DN) values were converted into reflectance using pre-calibrated imagery with established reflectance references, ensuring spectral consistency across all bands. Additionally, manufacturer-provided calibration coefficients for the MS600 Pro multispectral sensor (Changguang Yuchen Information Technology Equipment Co., Ltd., Qingdao, China) were utilized to compensate for spectral response variations across six bands: blue, green, red, red-edge 1, red-edge 2, and near-infrared [28]. A standard reflectance panel was employed for in-field radiometric calibration to account for illumination fluctuations during UAV flight missions. To normalize lighting inconsistencies across different phenological stages, histogram matching was implemented, aligning spectral characteristics within the same growth phase. In ArcMap 10.8, a Shapefile was created to georeference plant sampling points, incorporating 60 uniquely labeled locations from which spectral data were extracted. The calculated PMC values were spatially integrated with corresponding GPS coordinates and converted into a point dataset, subsequently overlaid onto the UAV-derived multispectral imagery of the study area. Spectral indices were computed using the raster calculator in ArcMap 10.8, leveraging multispectral band data, and vegetation indices were retrieved based on the unique ID associated with each sampling site [29]. To minimize edge distortions in the imagery, a study area boundary mask was generated, and the dataset was cropped to retain only the designated region of interest. The distribution of sampling points and control points are shown in Figure 4.

2.3. Spectral Index Construction

To collect relevant spectral vegetation indices (VIs) for this study, an index database was referenced [30] Based on the spectral range of the UAV multispectral images, 14 spectral indices that have been proven to be highly correlated with plant moisture content in the literature were selected, as shown in Table 2.

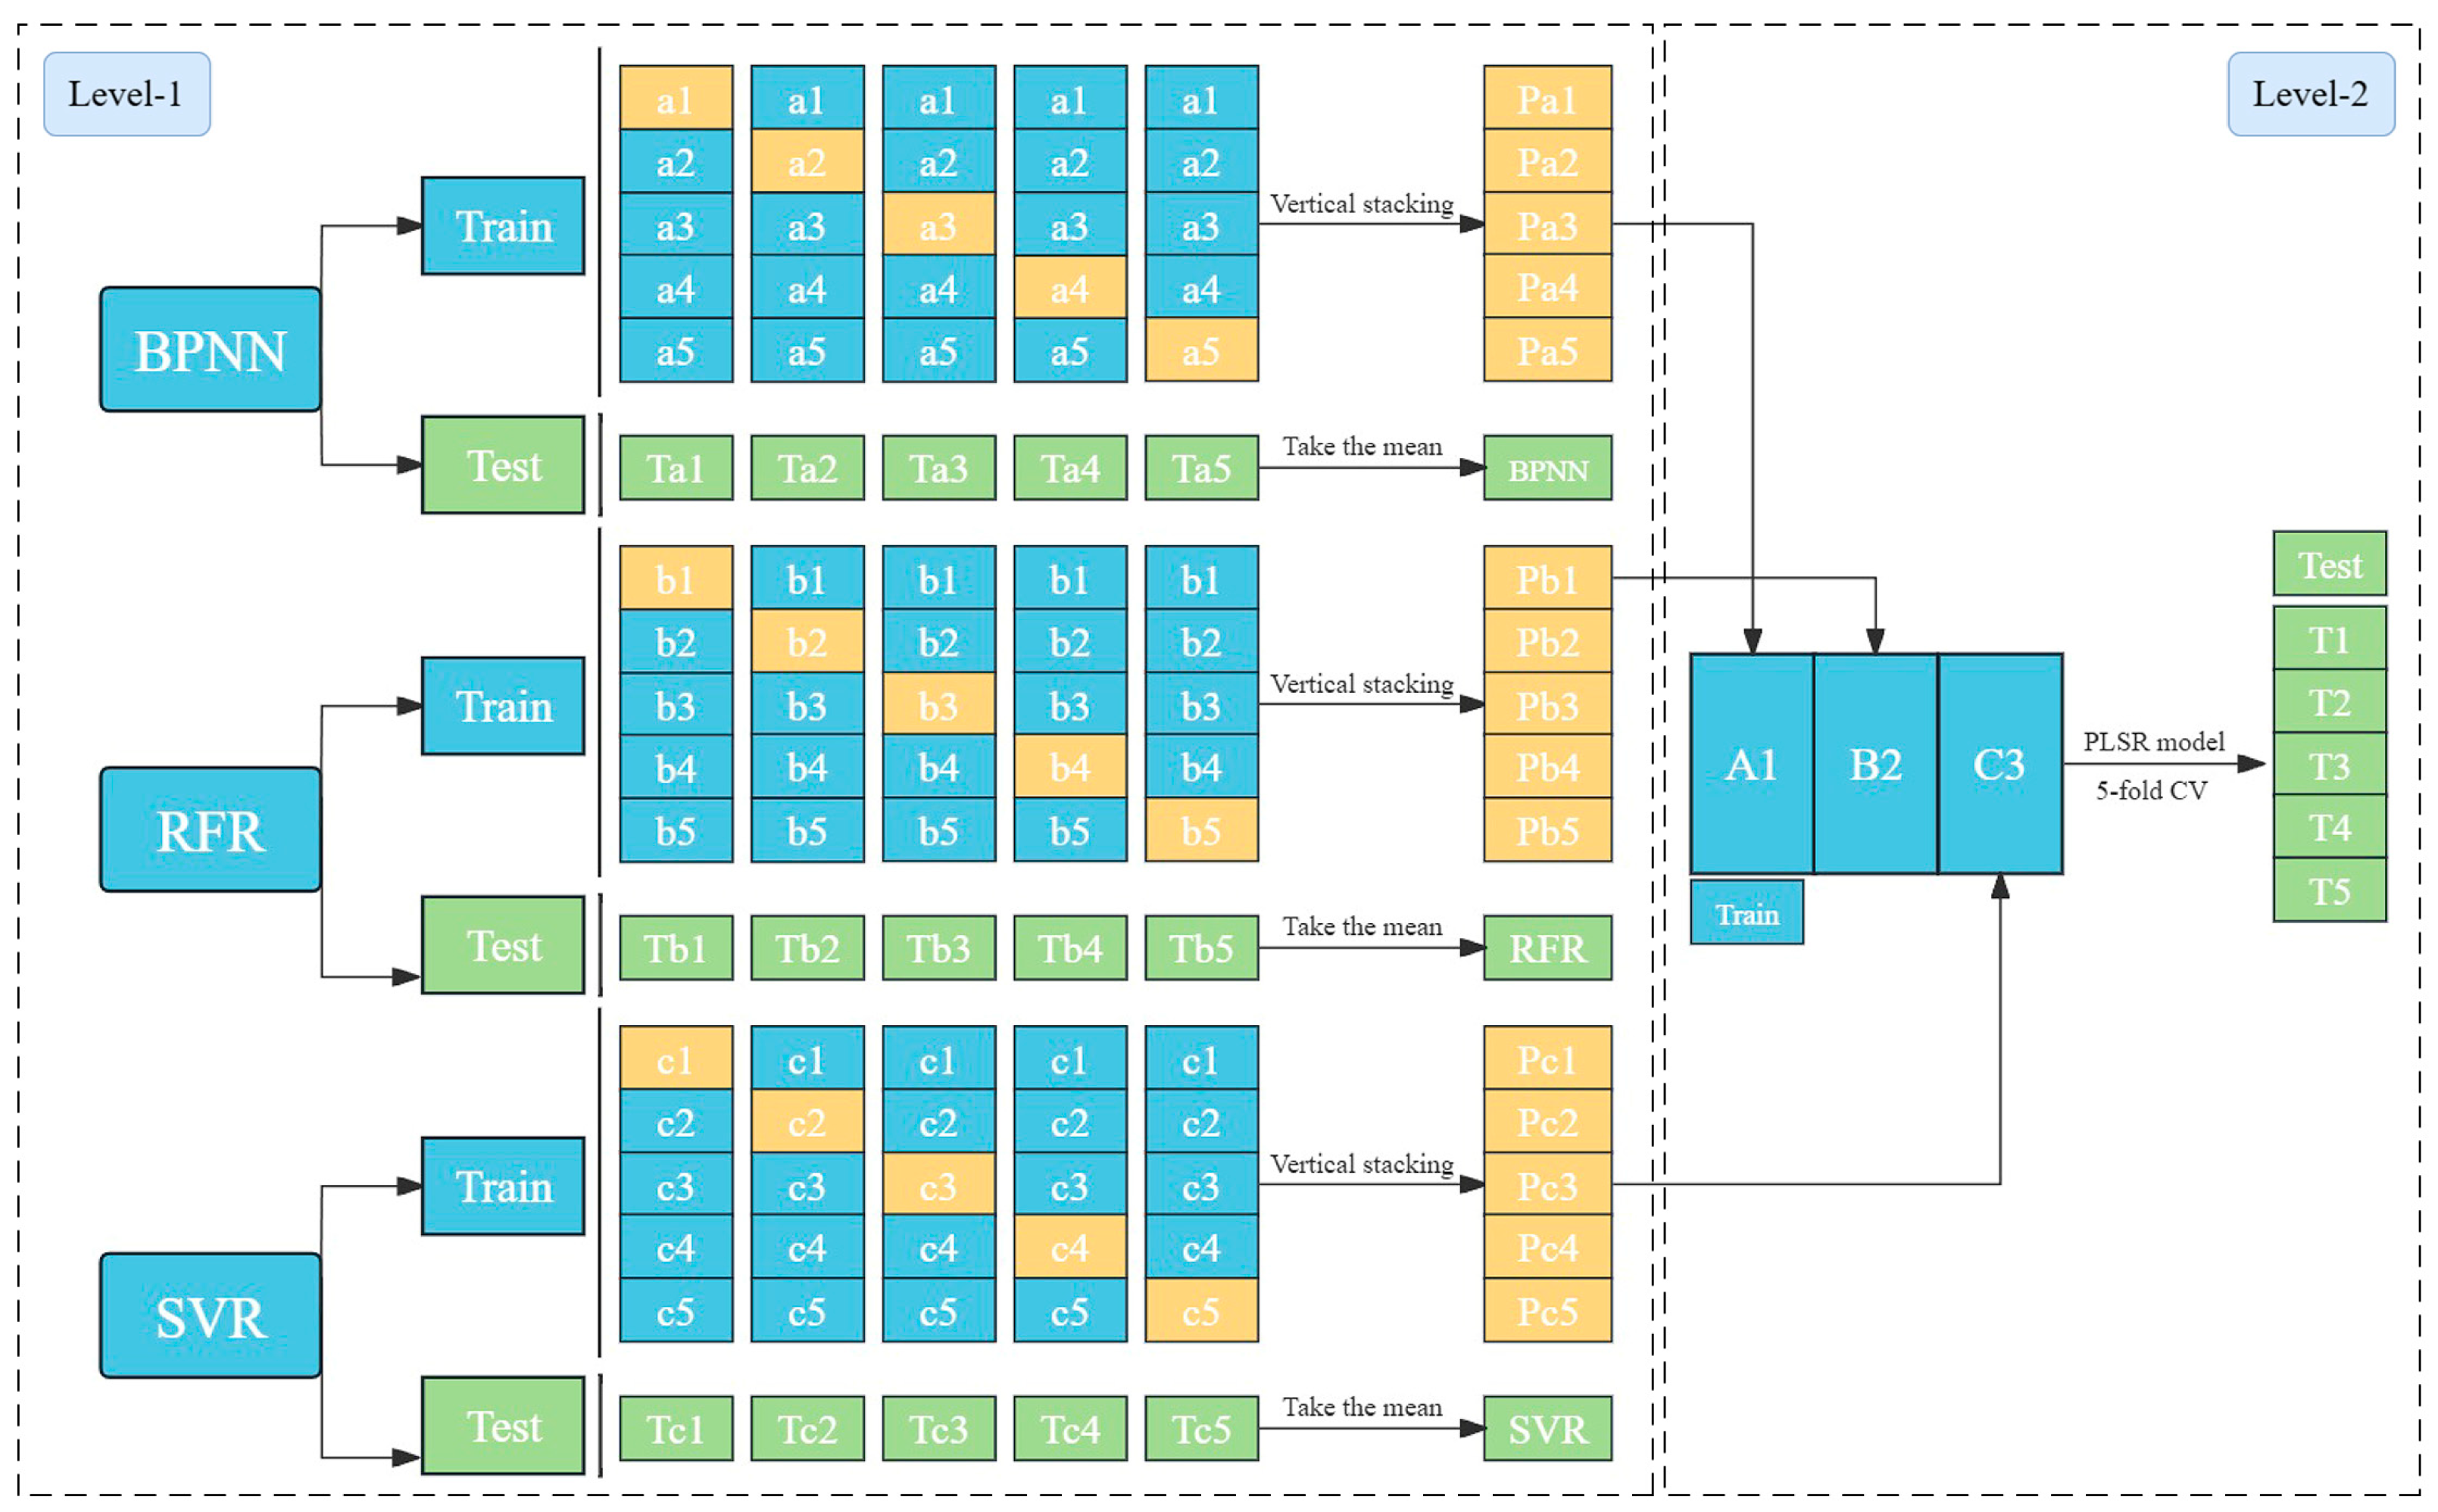
2.4. Model Development

To enhance the precision of PMC predictions, this study introduces a stacking-based ensemble learning framework comprising two primary phases. Initially, three independent PMC prediction models were developed utilizing multispectral data processed through distinct machine learning algorithms: Back Propagation Neural Network (BPNN), Random Forest Regression (RFR), and Support Vector Regression (SVR). Subsequently, predictions from these models were integrated using a Partial Least Squares Regression (PLSR) meta-learner. The selection of these three machine learning approaches is supported by extensive literature validating their efficacy in PMC estimation [39]. Each model contributes unique predictive insights, which are essential for constructing a robust ensemble learning system.
BPNN, a widely used artificial neural network, refines weight parameters iteratively through a backpropagation algorithm to minimize discrepancies between predicted and actual values [40]. Recent studies highlight its effectiveness in agricultural applications, including UAV-based crop yield estimation and hyperspectral remote sensing for soil and vegetation analysis [40,41]. RFR, a decision-tree-based ensemble method, models relationships between input and output variables through hierarchical decision rules. It excels in handling high-dimensional data, assessing variable importance, mitigating overfitting, and improving generalization performance [42]. SVR, on the other hand, performs regression by determining an optimal hyperplane in the feature space that minimizes the cumulative deviation of sample points from the hyperplane, thereby reducing overall prediction errors [43]. PLSR, serving as the meta-learner, integrates principal component analysis, correlation analysis, and multiple linear regression to facilitate multivariate statistical modeling. Its capability to manage collinearity and handle cases where the number of predictor variables exceeds sample size makes it particularly suitable for this study [44].
Stacked regression, an advanced ensemble learning methodology, enhances predictive accuracy by combining multiple base models to leverage complementary data representations [45]. As depicted in Figure 5, the stacking procedure was systematically implemented. The dataset was partitioned using a 5-fold cross-validation strategy, repeated 40 times to ensure model reliability. An out-of-fold (OOF) prediction approach was adopted, wherein the base learners (BPNN, RFR, SVR) were trained on four data folds while making predictions on the remaining fold. This iterative process generated OOF predictions for the entire training dataset, which were subsequently used as meta-features for PLSR training [46]. For the test dataset, meta-features were derived by applying base models—trained on the entire training dataset—to generate test predictions. Each base learner produced five sets of validation predictions corresponding to different training subsets, which were vertically concatenated to construct a test set prediction matrix. This matrix then served as input for the meta-learner. The predictive performance of individual base models was evaluated by averaging results across validation sets. Ultimately, PLSR was trained using the same 5-fold cross-validation scheme to integrate predictions from the base models [47]. The final prediction accuracy was determined by averaging validation results obtained from the test set prediction matrix.
The PMC inversion model was implemented in MATLAB 2022a. Hyperparameter optimization for BPNN, RFR, and SVR was conducted via a grid search strategy combined with 5-fold cross-validation, selecting optimal parameters based on the highest mean R2 value. Specifically, BPNN was structured with two hidden layers, each comprising 10 neurons. RFR was configured with 100 decision trees and a maximum depth of 20. For SVR, a radial basis function (RBF) kernel was employed, with regularization parameter C = 1.0 and tolerance ε = 0.1.

2.5. Model Accuracy Evaluation Parameters

The original dataset was partitioned into training and validation subsets, with the procedure repeated 40 times to enhance robustness. A five-fold cross-validation strategy was implemented for model training. Over the course of 40 iterations, a total of 200 test results were generated. The final model performance was assessed based on the average of these test outcomes, utilizing key evaluation metrics: the coefficient of determination (R2), root mean square error (RMSE), and the ratio of performance to deviation (RPD). RMSE quantifies the deviation between predicted and observed values, with lower values indicating greater predictive accuracy. The coefficient of determination (R2) measures the model’s goodness of fit, where values approaching 1 signify superior inversion performance. RPD, widely applied for evaluating agreement between predicted and actual values, serves as an indicator of predictive reliability. Specifically, an RPD exceeding 2 suggests strong predictive capability, values ranging from 1.5 to 2.0 indicate moderate performance, whereas an RPD below 1.5 denotes weak predictive power [48]. The mathematical expressions for these evaluation metrics are as follows:
R 2 = 1 i = 1 n ( y i ^ y i ) 2 i = 1 n ( y i y i ¯ ) 2
R M S E = i = 1 n ( y i y i ^ ) 2 N
R P D = S D R M S E
where y i is the actual PMC value, y i ^ is the predicted PMC value, y i ¯ is the mean PMC, N is the sample size, and SD is the standard deviation of the measurements in the prediction set.

3. Results and Analysis

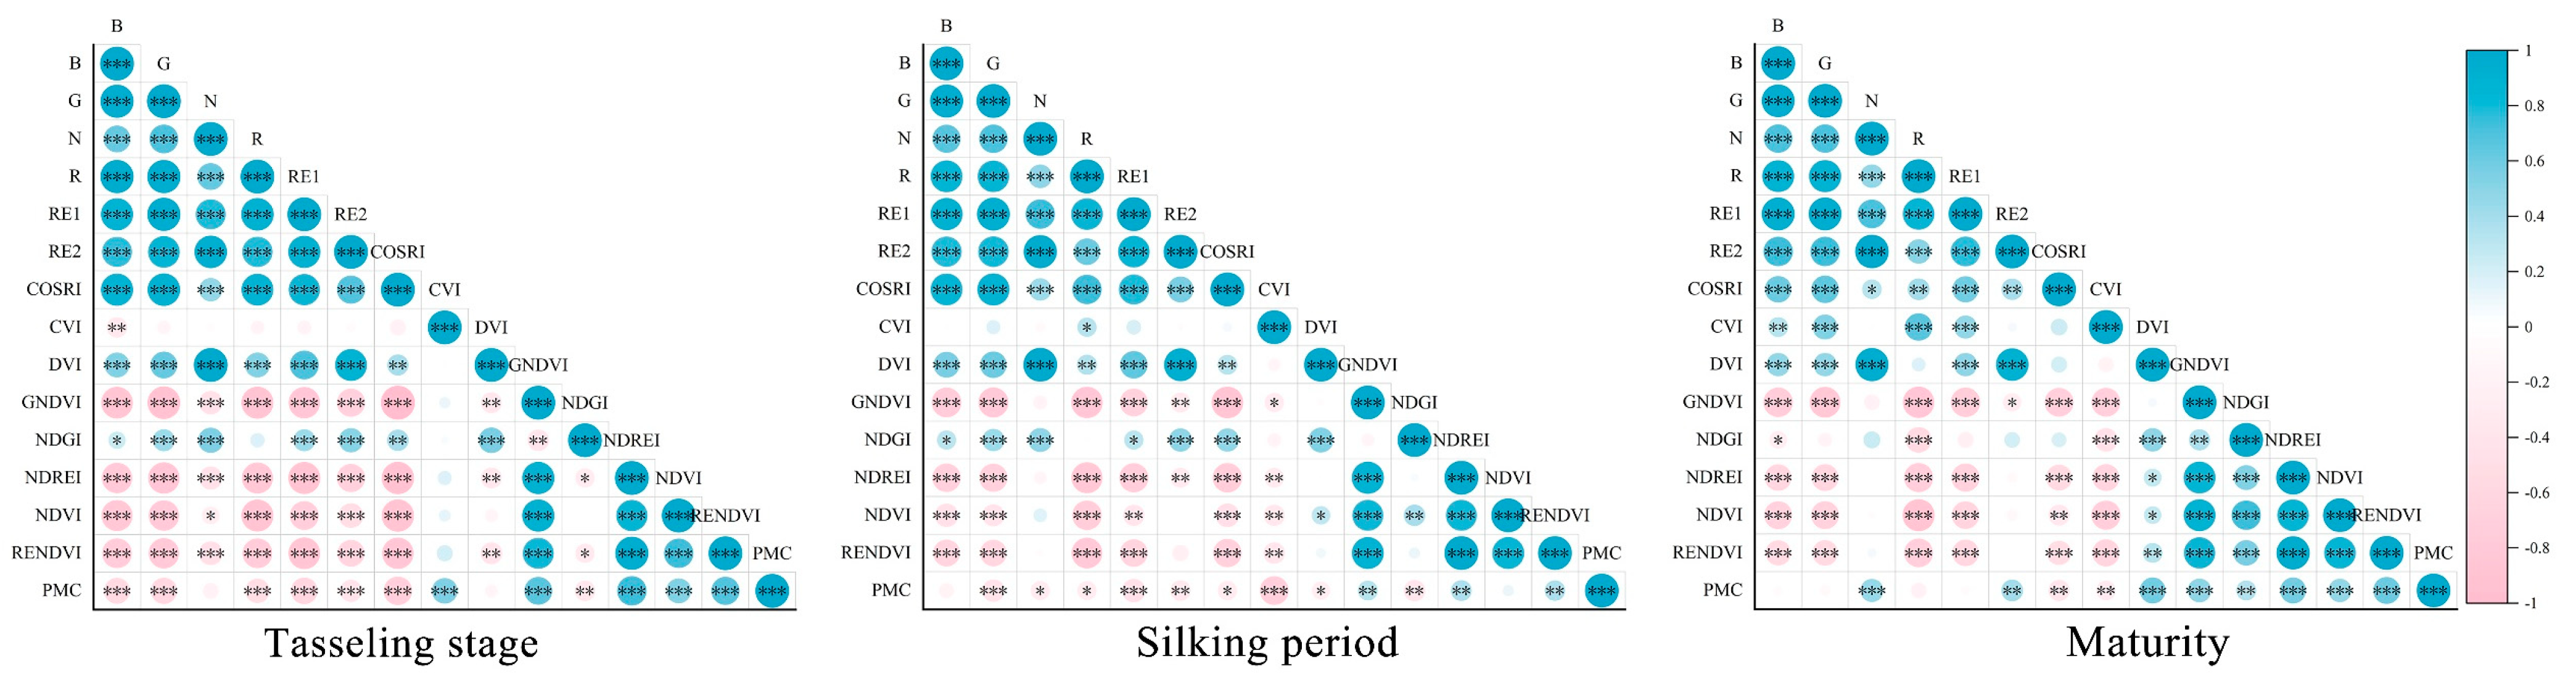
3.1. Correlation Analysis Between Plant Moisture Content and Spectral Indices

Environmental factors such as water stress, nutrient availability, and intrinsic growth characteristics can lead to variations in plant traits, resulting in differences in spectral reflectance properties within the same species. To account for these variations, this study selected plant samples from three distinct growth stages: tasseling, silk emergence, and maturity, with each stage comprising 60 samples. The statistical summary of PMC measurements across these growth stages is presented in Table 3. The analysis of range, standard deviation, and coefficient of variation—both for the overall dataset and for individual growth stages—reveals significant differences in PMC, indicating effective data stratification. As depicted in Figure 6, plant moisture content exhibits a declining trend throughout the growth stages, with all samples closely adhering to a normal distribution. To further examine the relationship between spectral indices and plant moisture content, a Pearson correlation analysis was performed, and the results are visualized in Figure 7. The spectral indices across different growth stages generally met statistical significance criteria, with certain variables exhibiting highly significant correlations (p < 0.001). These findings confirm that the selected spectral indices are suitable for predictive modeling.

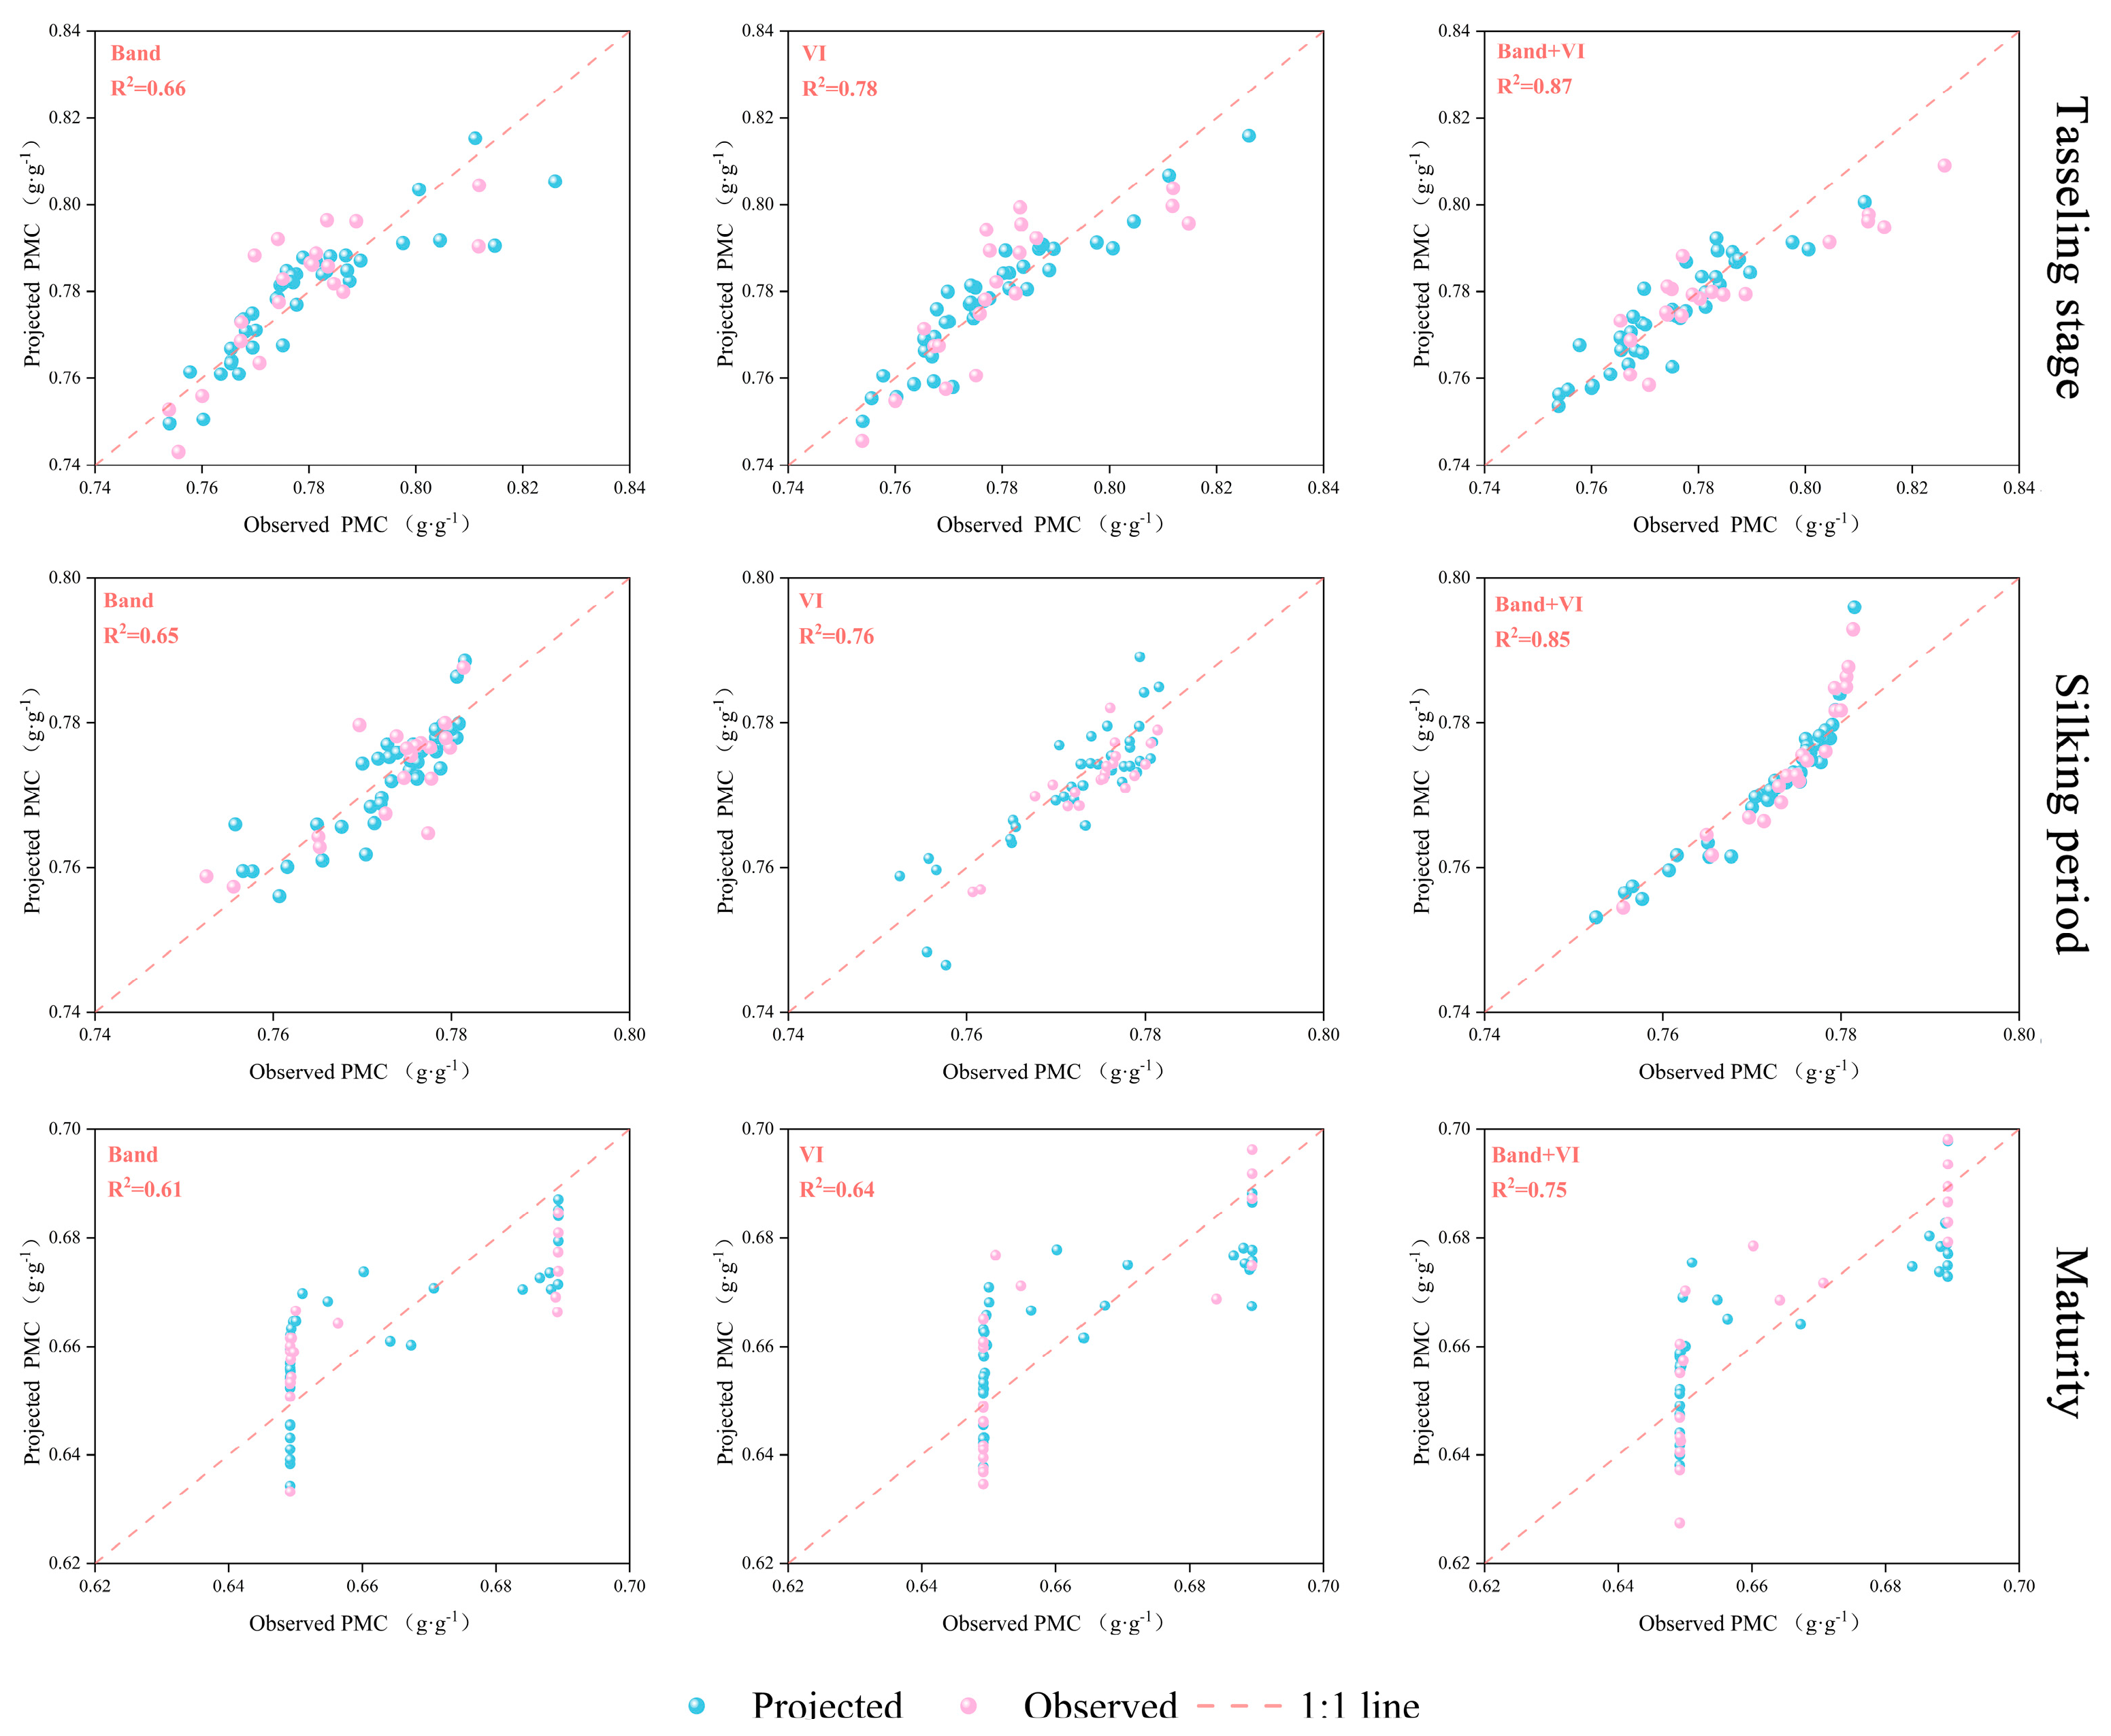
3.2. Comprehensive Evaluation of the Models

Three standalone machine learning models, along with one ensemble learning approach, were implemented to predict PMC from multispectral imagery of silage maize. The predictive performance of these models is summarized in Table 4. Among the individual models, Random Forest Regression (RFR) demonstrated the highest accuracy during the tasseling stage when using spectral bands as input features, achieving an R2 of 0.54, an RMSE of 1.19%, and an RPD of 1.49. When vegetation indices were incorporated as input variables at the same growth stage, RFR again outperformed other models, yielding an R2 of 0.60, an RMSE of 1.17%, and an RPD of 1.70. To assess the impact of vegetation indices on predictive accuracy, their inclusion was evaluated across all four machine learning models. Results indicated that the addition of vegetation indices improved the performance of all models, with Support Vector Regression (SVR) exhibiting the most notable increase in R2. Additionally, predictions from the three individual models were integrated using the stacking-based Partial Least Squares Regression (PLSR) ensemble approach, which consistently outperformed the standalone models when using the same input features.
Figure 8 illustrates the observed versus predicted PMC values for the optimal prediction model. During the tasseling stage, utilizing spectral bands alone yielded an R2 of 0.66, which improved to 0.87 upon incorporating vegetation indices. In the silk emergence stage, the R2 increased from 0.65 to 0.85, while in the maturity stage, it rose from 0.61 to 0.75 following the integration of vegetation indices. These results confirm that the ensemble learning model constructed with both spectral bands and vegetation indices achieved superior predictive accuracy, particularly excelling during the tasseling stage. Notably, RFR contributed the highest model weight within the ensemble, underscoring the significance of high-accuracy individual models in enhancing ensemble performance and reinforcing the interdependence between base and ensemble model effectiveness.

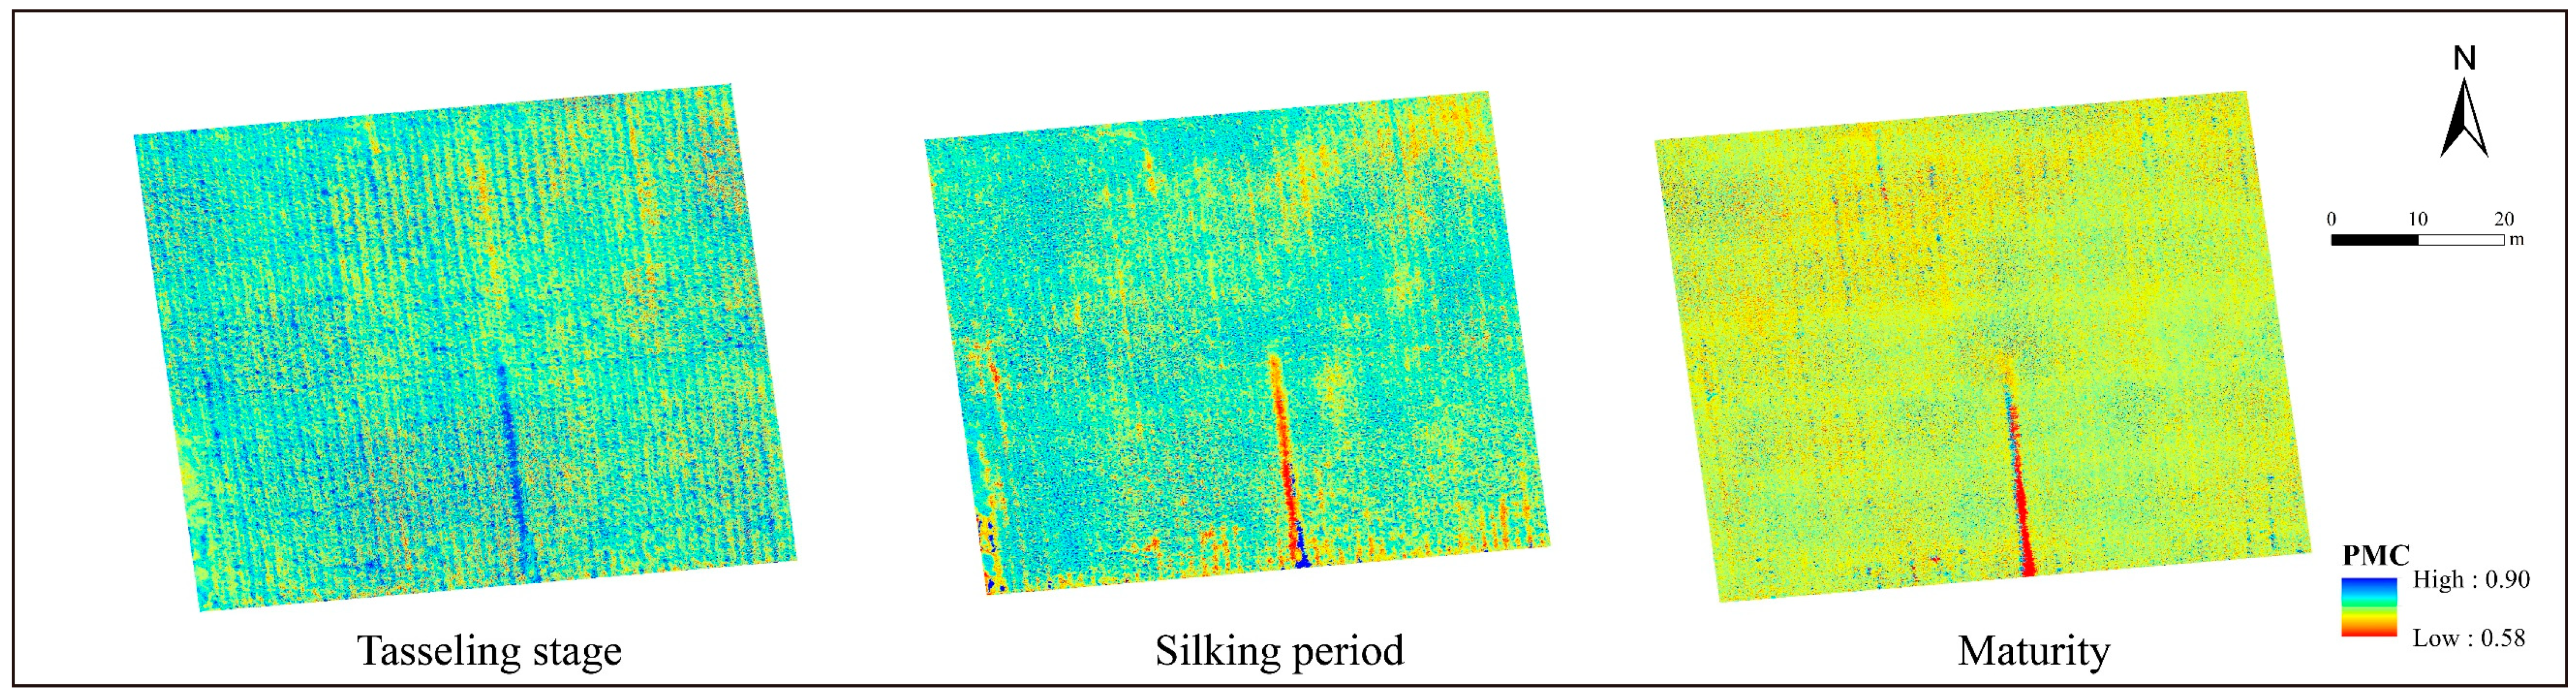
3.3. Spatial Distribution Map of Plant Moisture Content

In this study, the optimal model was employed to estimate the spatial distribution of PMC in silage maize, providing insights into its variations across different growth stages. The results revealed a progressive decline in PMC throughout the growth cycle, primarily driven by water consumption during maize development and the physiological redistribution of water in the maturity stage. As the plants advanced toward maturity, moisture content decreased steadily, leading to an overall reduction in PMC. The spatial distribution map presented in Figure 9 highlights significant heterogeneity in moisture content across the maize field. Notably, higher moisture levels were observed in the central regions, whereas a gradual decline was evident toward the field edges. This spatial variability can be attributed to multiple factors, including soil moisture redistribution, variations in agronomic management, and edge effects. The central areas of the field maintained relatively stable moisture conditions due to reduced exposure to external environmental fluctuations, facilitating higher plant moisture retention. Conversely, peripheral regions exhibited a marked decline in moisture content, likely influenced by factors such as increased wind exposure, elevated evaporation rates, and insufficient soil moisture replenishment. Additionally, disparities in irrigation practices and field management strategies may have contributed to localized variations in moisture availability, further accentuating spatial inconsistencies.

4. Discussion

4.1. Analysis of Spectral Indices

The sensitivity of PMC to various spectral bands and vegetation indices differs across growth stages, reflecting its close association with plant transpiration, water uptake efficiency, and cellular osmotic regulation [49]. During the early developmental phases, particularly the tasseling stage, maize exhibits a high transpiration rate due to extensive stomatal opening and intensified metabolic activity. This leads to pronounced reflectance variations in the near-infrared and red-edge spectral bands, which are highly responsive to leaf water content and chlorophyll concentration [50]. As the crop matures, PMC progressively declines due to senescence and reduced stomatal conductance, subsequently altering spectral reflectance properties. The most substantial reduction in PMC occurs during the maturation stage, aligning with prior research that has documented similar trends in wheat and rice [51]. Overall, fluctuations in PMC are predominantly influenced by chlorophyll activity and the leaf area index, both of which modulate light absorption and reflection in the visible spectrum [52]. This pattern has also been corroborated by Deng et al. [53] and Harris et al. [54], who demonstrated that water stress-induced variations in green leaf reflectance within the near-infrared region render this wavelength a crucial predictor of PMC. Furthermore, our findings underscore the importance of vegetation indices in PMC estimation. Among these, the Normalized Difference Vegetation Index (NDVI) and the Red-Edge Normalized Difference Vegetation Index (RENDVI) exhibited the highest correlations with PMC across different growth stages, reaffirming the sensitivity of the near-infrared and red-edge bands to plant water content [55]. The enhanced predictive accuracy of the integrated model highlights the efficacy of incorporating multiple spectral indices to better capture the nonlinear interactions between spectral reflectance and plant water dynamics [56]. These results further validate the potential of UAV-based remote sensing in precision agriculture, emphasizing the integration of multispectral data with advanced machine learning techniques for improved PMC assessment.

4.2. The Importance of Machine Learning Models in PMC Prediction

The novel aspect of this study lies in the application of bootstrap resampling and stacked ensemble learning models, offering a new approach for PMC prediction with limited sample sizes. The results indicate that integrating spectral bands and vegetation indices with ensemble learning methods significantly enhances the prediction accuracy of PMC in silage maize. The stacked ensemble learning approach achieved the highest predictive performance (R2 = 0.87, RMSE = 1.04%), outperforming individual machine learning models. This finding aligns with previous studies emphasizing the effectiveness of ensemble models in agricultural applications [57]. While individual models such as RFR and SVR perform well at specific growth stages, their predictive capabilities fluctuate depending on the dataset used. The ensemble approach effectively balances these inconsistencies by leveraging the strengths of multiple models, leading to more stable and accurate predictions [58]. Furthermore, this study provides insights into model selection for PMC prediction. The RFR model contributed the highest weight in the ensemble, indicating its superior capability in extracting key spectral features from high-dimensional data. This observation is consistent with prior findings in crop phenotyping, where RFR has been demonstrated to outperform other algorithms in handling spectral heterogeneity [59]. However, the combination of different learning algorithms further enhanced prediction robustness, suggesting that future PMC models should integrate multiple data sources and machine learning strategies to maximize accuracy [60]. Previous studies have explored the relationship between spectral indices and PMC, with many relying on single regression models such as RF, BPNN, and SVR [39,43,61]. While these models provide reasonable accuracy, they often suffer from overfitting or limited generalizability. Our study confirms that stacking multiple machine learning models can effectively mitigate these issues, providing more robust predictions across different growth stages. Compared to traditional regression methods, our approach, which integrates spectral features with vegetation indices, significantly improves prediction accuracy, particularly during the tasseling stage. This finding corroborates previous remote sensing studies on crop water stress [62].

4.3. Spatial Variability and Its Implications for Precision Agriculture

The spatial distribution analysis revealed significant heterogeneity in the PMC across the maize field, with higher water content observed in the central region and lower levels near the field edges. This pattern may be attributed to microclimatic variations, soil moisture heterogeneity, and differences in irrigation distribution [63]. Similar findings have been reported in studies on crop water stress, emphasizing the role of environmental factors in shaping water distribution patterns [60]. From an applied perspective, these results underscore the potential of UAV-based multispectral imaging for precision irrigation management. By identifying water-deficient areas, irrigation schedules can be optimized, ensuring precise water application while minimizing waste and maintaining crop health. This approach aligns with recent advancements in high-resolution remote sensing technologies developed for precision agriculture [64]. Furthermore, the findings of this study can be integrated with automated irrigation systems to optimize water allocation based on PMC estimations, thereby reducing water wastage and improving crop yield. The high accuracy of PMC predictions also enhances nutrient management strategies, ensuring that fertilization practices are tailored to the actual water status of plants rather than being based on empirical estimations [50].

4.4. Uncertainty Analysis and Future Directions

Despite the encouraging results of this study, certain limitations must be acknowledged. First, the dataset was collected from a single growing season and location, which may restrict the generalizability of the findings across different environmental and temporal conditions. Future research should integrate datasets from multiple seasons and regions to further validate the robustness of the proposed model [65]. Second, although this study utilized multispectral data, incorporating hyperspectral and thermal infrared imaging could further enhance the accuracy of PMC prediction. Hyperspectral sensors enable the capture of finer spectral characteristics, whereas thermal infrared data provide direct assessments of plant water stress [64]. Moreover, environmental conditions and agricultural management practices may also influence reflectance-based predictions. For instance, high temperatures or drought conditions may induce stress-related chlorophyll variations, consequently altering leaf reflectance. Strong winds can modify canopy structure, affect leaf angle distribution, and introduce noise into spectral data, ultimately reducing the accuracy of spectral indices. Additionally, rainfall before UAV flights may alter surface moisture levels, leading to fluctuations in reflectance values. Although data collection in this study was conducted under stable conditions to minimize these effects, future research should integrate real-time weather data and optimize flight scheduling strategies to improve model robustness and assess the impact of various irrigation and fertilization practices. Another limitation of this study is its dependence on machine learning models that require large training datasets. Although the bootstrap resampling method partially mitigated the small-sample effect, expanding the dataset through additional field measurements would enhance model stability. Future studies should investigate deep learning approaches, including convolutional neural networks (CNNs) and transformers, which have shown remarkable potential in remote sensing applications [66].

5. Conclusions

This study utilized UAV-based remote sensing to assess the predictive accuracy of BPNN, RFR, and SVR models under different input feature configurations, integrating spectral bands and vegetation indices. The predictive performance of these machine learning approaches for estimating PMC in silage maize was systematically evaluated, leading to the following key conclusions:
(1) Effect of Input Features on Model Accuracy: Models relying solely on individual spectral band reflectance exhibited lower predictive accuracy, whereas the incorporation of vegetation indices significantly improved performance. In particular, vegetation indices derived from the near-infrared and red-edge spectral regions demonstrated strong correlations with PMC, highlighting their relevance for predictive modeling.
(2) Performance of Individual Machine Learning Models: When both spectral bands and vegetation indices were used as input features, the individual machine learning models achieved the highest inversion accuracy during the tasseling stage. Among these models, RFR consistently outperformed BPNN and SVR, demonstrating superior predictive accuracy across different growth stages.
(3) Advantage of Ensemble Learning: The ensemble machine learning model, constructed by integrating spectral bands and vegetation indices, outperformed the individual models in predictive accuracy and generalization capability. The ensemble approach achieved a maximum R2 of 0.87 and the lowest RMSE of 0.54%, confirming its effectiveness in enhancing PMC estimation.

Author Contributions

Writing—original draft preparation, X.L.; project administration, J.Y. and C.H.; writing—review and editing, J.L. and X.Y.; supervision, W.M. and Z.G.; software, X.L., Q.D., H.Y. and K.C. All authors have read and agreed to the published version of the manuscript.

Funding

This work was sponsored in part by Gansu Provincial Science and Technology Major Project (24ZD13NA019); Central guide local science and technology development special funds (24ZYQA023); National Natural Science Foundation of China (42461060; 42307564); Gansu Provincial Ecological Civilization Construction Key R & D Project (24YFFA059; 24YFFA056); and Gansu Provincial Department of Education Industry Support Plan Project (2025CYZC-042; 2022CYZC-41).

Data Availability Statement

All data used during the study are proprietary or confidential and only limited data can be provided.

Acknowledgments

We sincerely thank the editor and reviewers for their time and effort in reviewing our work.

Conflicts of Interest

The authors declare no conflicts of interest.

References

  1. Ali, A.; Kaul, H.P. Monitoring Yield and Quality of Forages and Grassland in the View of Precision Agriculture Applications—A Review. Remote Sens. 2025, 17, 279. [Google Scholar] [CrossRef]
  2. Cai, X.; Zhang, X.; Noël, P.H.; Shafiee-Jood, M. Impacts of climate change on agricultural water management: A review. Agriculture 2015, 2, 439–455. [Google Scholar]
  3. Fakhar, M.S.; Nazari, B. Estimating Soil Moisture Using Vegetation Cover Indices and Soil Surface Temperature in Agricultural and Saline Fields of Qazvin Plain. Water Soil Manag. Model. 2024. [Google Scholar] [CrossRef]
  4. Fan, X.; Zhang, H.; Zhou, L.; Bian, L.; Jin, X.; Tang, L.; Ge, Y. Evaluating Drought Stress Response of Poplar Seedlings Using a Proximal Sensing Platform via Multi-Parameter Phenotyping and Two-Stage Machine Learning. Comput. Electron. Agric. 2024, 225, 109261. [Google Scholar]
  5. Singla, M.; Gupta, D.; Goyal, D.; Dang, R.K. Integrating Smart Farming with AI Techniques for Crop Disease Prediction. In Proceedings of the 2024 15th International Conference on Computing Communication and Networking Technologies (ICCCNT), Kamand, India, 24–28 June 2024; pp. 1–6. [Google Scholar]
  6. Mandal, D.; Yilma, W.; Atreya, M.; Kauzya, J.B.; Smock, N.; Khosla, R.; Whiting, G.L. Evaluation of Hybrid Biodegradable Sensor Node for Monitoring Soil Moisture. In Harnessing Data Science for Sustainable Agriculture and Natural Resource Management; Springer Nature: Singapore, 2024; pp. 271–298. [Google Scholar]
  7. Zhang, S.; Zhang, C.; Yang, C.; Liu, B. Artificial Intelligence and Internet of Things for Smart Agriculture. Front. Plant Sci. 2025, 14, 1494279. [Google Scholar]
  8. Franz, A.; Sowiński, J.; Głogowski, A.; Fiałkiewicz, W. A Preliminary Study on the Use of Remote Sensing Techniques to Determine the Nutritional Status and Productivity of Oats on Spatially Variable Sandy Soils. Agronomy 2025, 15, 616. [Google Scholar] [CrossRef]
  9. Liu, H.; Wu, X.; Li, D.; Zhang, F.; Zhang, D.; Huang, H. Study on the Moisture Content of Tobacco Leaves during the Picking Period Based on Hyperspectral Technology. J. Chin. Agric. Mech. 2021, 42, 157–163. [Google Scholar]
  10. Zhang, J.; Song, Z.; Han, W.; Shang, X.; Liu, Z. Nondestructive Testing of Tobacco Leaf Water Status by Using Digital RGB Images. J. Chin. Agric. Mech. 2019, 40, 62–68. [Google Scholar]
  11. Sun, G.; Xing, T.; Xing, Y.; Huang, J. Inversion of Vegetation Canopy Water Content in Jingyuetan Park Based on Remote Sensing Data. For. Eng. 2019, 35, 32–38. [Google Scholar]
  12. Jiang, H.; Chai, L.; Jia, K.; Liu, J.; Yang, S.; Zheng, J. Estimation of Water Content for Short Vegetation Based on PROSAIL Model and Vegetation Water Indices. Natl. Remote Sens. Bull. 2021, 25, 1025–1036. [Google Scholar]
  13. Rao, Y.; Liu, K.; Huang, H.; Lin, Q.; Wang, C. Inversion of Canopy Water Content of Fire Scars in Genhe County Based on INFORM Model and Google Earth Engine. J. Cent. South Univ. For. Technol. 2021, 41, 80–91. [Google Scholar]
  14. Cheng, X.-J.; Yang, G.-J.; Xu, X.-G.; Chen, T.-E.; Li, Z.-H.; Feng, H.-K.; Wang, D. Estimating Canopy Water Content in Wheat Based on New Vegetation Water Index. Spectrosc. Spect. Anal. 2014, 34, 3391–3396. [Google Scholar]
  15. Berni, J.A.J.; Zarco-Tejada, P.J.; Suárez, L.; Fereres, E. Thermal and Narrowband Multispectral Remote Sensing for Vegetation Monitoring from an Unmanned Aerial Vehicle. IEEE Trans. Geosci. Remote Sens. 2009, 47, 722–738. [Google Scholar]
  16. Hassan-Esfahani, L.; Torres-Rua, A.; Jensen, A.; McKee, M. Assessment of Surface Soil Moisture Using High-Resolution Multi-Spectral Imagery and Artificial Neural Networks. Remote Sens. 2015, 7, 2627–2646. [Google Scholar] [CrossRef]
  17. Han, W.; Tang, J.; Zhang, L.; Niu, Y.; Wang, T. Maize Water Use Efficiency and Biomass Estimation Based on Unmanned Aerial Vehicle Remote Sensing. Trans. Chin. Soc. Agric. Mach. 2021, 52, 129–141. [Google Scholar]
  18. Chlingaryan, A.; Sukkarieh, S.; Whelan, B. Machine Learning Approaches for Crop Yield Prediction and Nitrogen Status Estimation in Precision Agriculture: A Review. Comput. Electron. Agric. 2018, 151, 61–69. [Google Scholar]
  19. Akkem, Y.; Biswas, S.K.; Varanasi, A. Smart Farming Using Artificial Intelligence: A Review. Eng. Appl. Artif. Intell. 2023, 120, 105899. [Google Scholar]
  20. Reddy, D.J.; Kumar, M.R. Crop Yield Prediction Using Machine Learning Algorithm. In Proceedings of the 2021 5th International Conference on Intelligent Computing and Control Systems (ICICCS), Madurai, India, 6–8 May 2021; pp. 1466–1470. [Google Scholar]
  21. Hamrani, A.; Akbarzadeh, A.; Madramootoo, C.A. Machine Learning for Predicting Greenhouse Gas Emissions from Agricultural Soils. Sci. Total Environ. 2020, 741, 140338. [Google Scholar]
  22. Lin, G.; Huang, P.; Wang, M.; Xu, Y.; Zhang, R.; Zhu, L. An Inverse Kinematics Solution for a Series-Parallel Hybrid Banana-Harvesting Robot Based on Deep Reinforcement Learning. Agronomy 2022, 12, 2157. [Google Scholar] [CrossRef]
  23. Bu, F.; Wang, X. A Smart Agriculture IoT System Based on Deep Reinforcement Learning. Future Gener. Comput. Syst. 2019, 99, 500–507. [Google Scholar]
  24. Moghadas, D. One-Dimensional Deep Learning Inversion of Electromagnetic Induction Data Using Convolutional Neural Network. Geophys. J. Int. 2020, 222, 247–259. [Google Scholar] [CrossRef]
  25. Xie, M.; Li, G.; Ma, W.; Liu, S.; Chang, H.; Du, J.; Ding, N. Effects of water treatment on stoichiometric ratio and homeostasis of silage corn soil in Hexi. Arid Zone Res. 2022, 39, 1312–1321. [Google Scholar]
  26. Zhang, H. Uncrewed Aircraft Systems (UAS)-Based Detection of Organic Carbon with Hyper- and Multispectral Sensors in Cropland Soils. Ph.D. Thesis, Université Catholique de Louvain, Louvain-la-Neuve, Belgium, 2022. [Google Scholar]
  27. Wang, Y.; Kootstra, G.; Yang, Z.; Khan, H. UAV Multispectral Remote Sensing for Agriculture: A Comparative Study of Radiometric Correction Methods Under Varying Illumination Conditions. Biosyst. Eng. 2024, 248, 240–254. [Google Scholar] [CrossRef]
  28. Stott, E.; Williams, R.D.; Hoey, T.B. Ground Control Point Distribution for Accurate Kilometre-Scale Topographic Mapping Using an RTK-GNSS Unmanned Aerial Vehicle and SfM Photogrammetry. Drones 2020, 4, 55. [Google Scholar] [CrossRef]
  29. Chi, J.; Kim, J.I.; Lee, S.; Jeong, Y.; Kim, H.C.; Lee, J.; Chung, C. Geometric and Radiometric Quality Assessments of UAV-Borne Multi-Sensor Systems: Can UAVs Replace Terrestrial Surveys? Drones 2023, 7, 411. [Google Scholar] [CrossRef]
  30. IDB. Index DataBase. A Database for Remote Sensing Indices. The IDB Project, 2011–2024. Available online: https://www.indexdatabase.de/ (accessed on 8 September 2024).
  31. Fernandez-Buces, N.; Siebe, C.; Cram, S.; Palacio, J.L. Mapping soil salinity using a combined spectral response index for bare soil and vegetation: A case study in the former lake Texcoco, Mexic. J. Arid Environ. 2006, 65, 644–667. [Google Scholar]
  32. Datt, B.; McVicar, T.R.; Van Niel, T.G.; Jupp, D.L.; Pearlman, J.S. Preprocessing EO-1 Hyperion hyperspectral data to support the application of agricultural indexes. IEEE Trans. Geosci. Remote Sens. 2003, 41, 1246–1259. [Google Scholar] [CrossRef]
  33. Roujean, J.L.; Breon, F.M. Estimating PAR absorbed by vegetation from bidirectional reflectance measurements. Remote Sens. Environ. 1995, 51, 375–384. [Google Scholar] [CrossRef]
  34. Wang, F.M.; Huang, J.F.; Tang, Y.L.; Wang, X.Z. New vegetation index and its application in estimating leaf area index of rice. Rice Sci. 2007, 14, 195–203. [Google Scholar] [CrossRef]
  35. Hoffmann, H.; Jensen, R.; Thomsen, A.; Nieto, H.; Rasmussen, J.; Friborg, T. Crop water stress maps for an entire growing season from visible and thermal UAV imagery. Biogeosciences 2016, 13, 6545–6563. [Google Scholar] [CrossRef]
  36. Underwood, E.; Ustin, S.; DiPietro, D. Mapping nonnative plants using hyperspectral imagery. Remote Sens. Environ. 2003, 86, 150–161. [Google Scholar] [CrossRef]
  37. Gitelson, A.; Merzlyak, M.N. Quantitative estimation of chlorophyll-a using reflectance spectra: Experiments with autumn chestnut and maple leaves. J. Photochem. Photobiol. B 1994, 22, 247–252. [Google Scholar] [CrossRef]
  38. Gitelson, A.; Merzlyak, M.N. Spectral reflectance changes associated with autumn senescence of Aesculus hippocastanum L. and Acer platanoides L. leaves. Spectral features and relation to chlorophyll estimation. J. Plant Physiol. 1994, 143, 286–292. [Google Scholar] [CrossRef]
  39. Li, Z.; Zhou, X.; Cheng, Q.; Fei, S.; Chen, Z. A Machine-Learning Model Based on the Fusion of Spectral and Textural Features from UAV Multi-Sensors to Analyse the Total Nitrogen Content in Winter Wheat. Remote Sens. 2023, 15, 2152. [Google Scholar] [CrossRef]
  40. Ni, G.; Guan, Y.; Zhang, X.; Yang, Y.; Li, Y.; Liu, X.; Rong, Z. Selection of Landsat 8 OLI Levels, Monthly Phases, and Spectral Variables on Identifying Soil Salinity: A Study in the Yellow River Delta. Appl. Sci. 2025, 15, 2747. [Google Scholar] [CrossRef]
  41. Da, Q.; Yan, J.; Li, G.; Guo, Z.; Li, H.; Wang, W.; Li, J.; Ma, W.; Li, X.; Cheng, K. Inversion of Soil Moisture Content in Silage Corn Root Zones Based on UAV Remote Sensing. Agriculture 2025, 15, 331. [Google Scholar] [CrossRef]
  42. Jin, Z.; Liu, H.; Cao, H.; Li, S.; Yu, F.; Xu, T. Hyperspectral Remote Sensing Estimation of Rice Canopy LAI and LCC by UAV Coupled RTM and Machine Learning. Agriculture 2024, 15, 11. [Google Scholar] [CrossRef]
  43. Guo, F.; Huang, Z.; Su, X.; Li, Y.; Luo, L.; Ba, Y. Soil Moisture Content Inversion Model on the Basis of Sentinel Multispectral and Radar Satellite Remote Sensing Data. J. Soil Sci. 2024, 24, 7919–7933. [Google Scholar] [CrossRef]
  44. Yang, J.; Li, X.; Ma, X.; Ge, X. Potential of Hyperspectral Data Combined With Optimal Band Combination Algorithm for Estimating Soil Organic Carbon Content in Lakeside Oasis. Land Degrad. Dev. 2024, 35, 5874–5885. [Google Scholar] [CrossRef]
  45. Cheng, J.K.; Feng, X.L.; Chen, L.B.; Gao, T.Y.; Mei-Jin, D.U.; Liu, Z.Y. Optimal Inversion Model for Cultivated Land Soil Salinity Based on UAV Hyperspectral Data. Ying Yong Sheng Tai Xue Bao 2024, 35, 3085–3094. [Google Scholar]
  46. He, W.; Yao, Y.; Li, Y.; Yu, L.; Ni, L.; Fu, B.; Huang, J.; Li, D. Accurately Estimating and Revealing the Patterns of Leaf C:N:P Stoichiometry with Remote Sensing and Neural Network Methods in a Karst Area. Comput. Electron. Agric. 2025, 231, 110006. [Google Scholar]
  47. Liu, L.; Wei, G.; Zhou, P. Prediction and Mapping of Soil Total Nitrogen Using GF-5 Image Based on Machine Learning Optimization Modeling. Smart Agric. 2024, 6, 61. [Google Scholar]
  48. Ramírez, P.B.; Calderón, F.J.; Jastrow, J.D.; Ping, C.L.; Matamala, R. Applying NIR and MIR Spectroscopy for C and Soil Property Prediction in Northern Cold-Region Ecosystems. Which Approach Works Better? Geoderma Reg. 2023, 32, e00617. [Google Scholar]
  49. Serrano, J.; Shahidian, S.; Paixão, L.; Marques da Silva, J.; Paniágua, L.L. Pasture Quality Assessment Through NDVI Obtained by Remote Sensing: A Validation Study in the Mediterranean Silvo-Pastoral Ecosystem. Agriculture 2024, 14, 1350. [Google Scholar] [CrossRef]
  50. Yang, N.; Zhang, Z.; Ding, B.; Wang, T.; Zhang, J.; Liu, C.; Zhang, Q.; Zuo, X.; Chen, J.; Cui, N.; et al. Evaluation of Winter-Wheat Water Stress with UAV-Based Multispectral Data and Ensemble Learning Method. Plant Soil 2024, 491, 647–668. [Google Scholar]
  51. Joiner, J.; Yoshida, Y.; Anderson, M.; Holmes, T.; Hain, C.; Reichle, R.; Koster, R.; Middleton, E.; Zeng, F.W. Global Relationships Among Traditional Reflectance Vegetation Indices (NDVI and NDII), Evapotranspiration (ET), and Soil Moisture Variability on Weekly Time-scales. Remote Sens. Environ. 2018, 219, 339–352. [Google Scholar]
  52. Elshikha, D.E.M.; Hunsaker, D.; Bronson, K.; Sanchez, P. Using RGB-Based Vegetation Indices for Monitoring Guayule Biomass, Moisture Content, and Rubber. In Proceedings of the 2016 ASABE Annual International Meeting, Orlando, FL, USA, 17–20 July 2016. [Google Scholar]
  53. Deng, B.; Yang, W.N.; Mu, N.; Zhang, C. The Research of Vegetation Water Content Based on Spectrum Analysis and Angle Slope Index. Guang Pu Xue Yu Guang Pu Fen Xi 2016, 36, 2546–2552. [Google Scholar]
  54. Harris, A.; Bryant, R.G.; Baird, A.J. Detecting Near-Surface Moisture Stress in Sphagnum spp. Remote Sens. Environ. 2005, 97, 371–381. [Google Scholar]
  55. Serrano, J.; Shahidian, S.; Marques da Silva, J.; Paixão, L.; Carreira, E.; Carmona-Cabezas, R.; Nogales-Bueno, J.; Rato, A.E. Evaluation of Near Infrared Spectroscopy (NIRS) and Remote Sensing (RS) for Estimating Pasture Quality in Mediterranean Montado Ecosystem. Appl. Sci. 2020, 10, 4463. [Google Scholar] [CrossRef]
  56. Klemas, V.; Smart, R.; Klemas, V. The Influence of Soil Salinity, Growth Form, and Leaf Moisture on the Spectral Radiance of Vegetation. Photogramm. Eng. Remote Sens. 1983, 49, 77–83. [Google Scholar]
  57. Wu, Q.; Zhu, Z.; Ma, J.; Liu, S.; Chai, L.; Xu, Z. Soil Moisture Retrieval Based on Ensemble Learning Models Using Landsat8 Data in Areas of High Heterogeneity. Preprints 2024, 2024120464. [Google Scholar] [CrossRef]
  58. Sharma, S.; Khanal, P. Predicting Above-Ground Biomass of Forest in South Carolina: Integrating Remote Sensing, Machine Learning, and Interpolation Techniques. Preprints 2024, 2024091867. [Google Scholar] [CrossRef]
  59. Belloli, T.F.; de Arruda, D.C.; Guasselli, L.A.; Cunha, C.S.; Korb, C.C. Modeling Wetland Biomass and Aboveground Carbon: Influence of Plot Size and Data Treatment Using Remote Sensing and Random Forest. Land 2025, 14, 616. [Google Scholar] [CrossRef]
  60. Kim, Y.I.; Park, W.H.; Shin, Y.; Park, J.-W.; Engel, B.; Yun, Y.-J.; Jang, W.S. Applications of Machine Learning and Remote Sensing in Soil and Water Conservation. Hydrology 2024, 11, 183. [Google Scholar] [CrossRef]
  61. Sarkar, S.; Leyton, J.M.O.; Noa-Yarasca, E.; Adhikari, K.; Hajda, C.B.; Smith, D.R. Integrating Remote Sensing and Soil Features for Enhanced Machine Learning-Based Corn Yield Prediction in the Southern US. Sensors 2025, 25, 543. [Google Scholar] [CrossRef]
  62. Nadeem, A.A.; Zha, Y.; Shi, L.; Ali, S.; Wang, X.; Zafar, Z.; Afzal, Z.; Tariq, M.A.U.R. Spatial Downscaling and Gap-Filling of SMAP Soil Moisture to High Resolution Using MODIS Surface Variables and Machine Learning Approaches over ShanDian River Basin, China. Remote Sens. 2023, 15, 812. [Google Scholar] [CrossRef]
  63. Vinci, A.; Baiocchi, V.; Brigante, R.; Traini, C.; Farinelli, D. Use of Drones with Multispectral and Thermal Cameras to Assess the Biometric Characteristics and Water Status of Different Hazelnut Cultivars. Preprints 2024, 2024031201. [Google Scholar] [CrossRef]
  64. Dong, H.; Dong, J.; Sun, S.; Bai, T.; Zhao, D.; Yin, Y.; Shen, X.; Wang, Y.; Zhang, Z.; Wang, Y. Crop Water Stress Detection Based on UAV Remote Sensing Systems. Agric. Water Manag. 2024, 303, 109059. [Google Scholar]
  65. Yang, S.; Li, L.; Fei, S.; Yang, M.; Tao, Z.; Meng, Y.; Xiao, Y. Wheat Yield Prediction Using Machine Learning Method Based on UAV Remote Sensing Data. Drones 2024, 8, 284. [Google Scholar] [CrossRef]
  66. Liu, J.; Xiang, J.; Jin, Y.; Liu, R.; Yan, J.; Wang, L. Boost Precision Agriculture with Unmanned Aerial Vehicle Remote Sensing and Edge Intelligence: A Survey. Remote Sens. 2021, 13, 4387. [Google Scholar] [CrossRef]
Figure 1. (a,b) The study area is located in Minle Ecological Industrial Park, Zhangye City, Gansu Province, China. (c) Photos of silage maize cultivars.
Agriculture 15 00746 g001
Figure 2. Meteorological data during the 2022 silage maize growing season. (a) Daily average temperature, (b) Daily average radiation, (c) Daily average precipitation.
Agriculture 15 00746 g002
Figure 3. (a) DJI M300 RTK UAV equipped with MS600 Pro multi-spectral camera; (b) the calibrated reflection panel; (c) flight path planning of the study area.
Agriculture 15 00746 g003
Figure 4. Sampling point distribution. Note: four ground control points (GCPs) were strategically established within the study area, ensuring an even distribution of sample points across the region.
Agriculture 15 00746 g004
Figure 5. Ensemble learning model framework. BPNN Back Propagation Neural Network, RFR random forest regression, SVR Support Vector Regression p predictions from different models.
Agriculture 15 00746 g005
Figure 6. Statistical results of Plant Moisture Content (PMC) at different growth stages.
Agriculture 15 00746 g006
Figure 7. Pearson correlation analysis. Note: * p ≤ 0.05 ** p ≤ 0.01 *** p ≤ 0.001.
Agriculture 15 00746 g007
Figure 8. Observed and predicted values of the best PMC prediction model. Note: VI vegetation indices.
Agriculture 15 00746 g008
Figure 9. Spatial distribution of plant water content.
Agriculture 15 00746 g009
Table 1. DJI M300 RTK UAV and MS600 Pro multi-spectral camera specifications.
ParameterSpecification
UAV typeRotary wing
Size0.81 (width) × 0.67 (length) × 0.43 (height) m
Flight duration55.00 min
Maximum speed17.00 m/s
Maximum altitude7.00 km
Maximum take-off weight9.00 kg
Maximum flight range15.00 km
Payload capacity0.93 kg
MS600 Pro camera weight0.66 kg
Table 2. List of vegetation indices (VIs) used in the modelling of crop water content.
IndexFull NameFormulaReferences
COSRICombine spectroscopy index(B + G)/(R + NIR) × NDVI[31]
CVIChlorophyll vegetation index(NIR × R)/G2[32]
DVIDifference vegetation indexNIR − R[33]
GNDVIGreen normalized difference vegetation index(N − G)/(N + G)[34]
NDREINormalized difference red edge index(N − RE1)/(N + RE1)[35]
NDVINormalized difference vegetation index(NIR − R)/(NIR + R)[36]
NGRDINormalized difference green/red index(G − R)/(G + R)[37]
RENDVIRed edge normalized difference vegetation index(RE2 − RE1)/(RE2 + RE1)[38]
RblueBlueB/
RgreenGreenG/
RnirNirN/
RRE1RedEdge720RE1/
RRE2RedEdge750RE2/
RredRedR/
Note: B, G, R, RE1, RE2, and NIR are the spectral reflectance of MS600 Pro multispectral camera at wavelengths of 450, 555, 660, 720, 750 and 840 nm, respectively.
Table 3. Statistics on PMC characteristics at each fertility stage.
CategoryObservationsMinMaxMeanSDRCV
All datasets1800.650.830.740.060.1770.075
Tasseling stage600.750.830.780.020.0720.020
Silking period600.730.780.770.010.0530.014
Maturity600.650.690.660.020.0400.027
Note: Min minimum, Max maximum, SD standard deviation, R Range, CV coefficient of variation.
Table 4. PMC prediction accuracy based on different machine learning methods.
Growth StagesFeature TypeMetricsBPNNRFRSVRStacking (PLSR)
Tasseling stageBandR20.500.540.510.66
RMSE (%)1.301.191.271.30
RPD1.451.491.591.54
VIR20.540.600.590.78
RMSE (%)1.331.171.291.24
RPD1.501.701.551.61
Band + VIR20.630.690.670.87
RMSE (%)1.081.121.051.04
RPD1.871.791.901.93
Silking periodBandR20.460.530.490.65
RMSE (%)0.630.680.670.66
RPD1.591.471.481.51
VIR20.490.540.520.76
RMSE (%)0.660.650.670.60
RPD1.511.521.491.67
Band + VIR20.590.620.610.85
RMSE (%)0.620.610.620.54
RPD1.621.621.611.85
MaturityBandR20.430.490.460.61
RMSE (%)1.351.431.341.38
RPD1.481.401.491.45
VIR20.530.570.560.64
RMSE (%)1.241.241.081.29
RPD1.611.181.301.55
Band + VIR20.610.650.630.75
RMSE (%)1.241.181.191.15
RPD1.611.691.681.74
Disclaimer/Publisher’s Note: The statements, opinions and data contained in all publications are solely those of the individual author(s) and contributor(s) and not of MDPI and/or the editor(s). MDPI and/or the editor(s) disclaim responsibility for any injury to people or property resulting from any ideas, methods, instructions or products referred to in the content.

