Article

Influence of Biochar Organic Carbon Composition and Thermal Stability on Nitrate Retention and Tomato Yield on Soilless Biochar Amended Growth Media

1
School of Environment, Florida Agricultural & Mechanical University, Tallahassee, FL 32307, USA
2
Environmental Health & Safety, University of North Texas Health Science Center, Fort Worth, TX 76107, USA
3
College of Agriculture and Food Sciences, Florida Agricultural & Mechanical University, Tallahassee, FL 32307, USA
4
National High Magnetic Field Laboratory, Florida State University, 1800 E. Paul Dirac Drive, Tallahassee, FL 32310, USA
*
Author to whom correspondence should be addressed.
Agriculture 2025, 15(8), 865; https://doi.org/10.3390/agriculture15080865
Submission received: 25 January 2025 / Revised: 13 April 2025 / Accepted: 15 April 2025 / Published: 16 April 2025

Abstract

:
The application of biochar to traditional soil and soilless growth media in agriculture has been reported to increase plant production. However, it remains unclear which biochar component drives this process or which biogeochemical process is attributed to better plant productivity. Therefore, this study aims to determine how biochar organic carbon (C) composition and thermal stability influence nitrogen availability and tomato production. Soilless growth media composed of a mixture of 60% and 40% coconut coir (CC) (Cocos nucifera L.) and fine pine bark (PB) (Pinus genus), respectively, was amended with 0, 1, 2, 3, 4, 6, 8, 10, and 12% biochar per dry weight. The amended media were used to grow Red Bounty tomatoes (Lycopersicum esculentum) for three months. After harvesting tomatoes and determining yield, organic C composition and C thermal stability of the biochar amended soilless growth media mixtures were determined using solid-state 13C nuclear magnetic resonance (13C NMR) and multi-elemental scanning thermal analysis (MESTA), respectively. Thermal stability data were used to determine the “R400 index”, and nitrate (NO3) concentration was determined using the water extractable method. Results showed that biochar-amended media significantly increased pH (p < 0.0001) and NO3 (p = 0.0386) compared to the no-char control. Biochar amended soilless media organic C composition was dominated by O-alkyl-C as a result of a higher fraction of soilless media; however, total C, carboxyl-C, phenolic-C, and aromatic-C increased with increasing biochar content and related negatively to R400, which decreased with increasing biochar content. Nitrate retention and tomato yield increased with increasing total C, carboxyl-C, phenolic-C, and aromatic-C and decreasing R400. This indicates that the stable form of C, carboxyl-C, phenolic-C, aromatic-C, and low R400 enhanced NO3 sorption, reducing leaching and enhancing its availability for tomato growth.

1. Introduction

Nitrogen (N) is an important macronutrient for the plant metabolism system and a key constituent of protein, making up all living matter’s structural materials. Nitrogen is essential in ensuring energy availability for plants to increase yields [1]. It is an important and key agricultural soil input element that enhances plant growth [2]. In the early 1900s, bumper crop yields were observed because of the massive, relatively cheap N fertilizer due to the development of the Haber-Bosch process [3,4,5]. It has been reported that between 1950 and the beginning of the 21st century, N fertilizer used increased from less than 1 Tg N yr−1 (1 Tg = 1012 g) to more than 11 Tg N yr−1 in the United States [3,6]. Plants mainly take up soil nitrogen in the form of Ammonium (NH4+) or nitrate (NO3) [6,7]. Available N for crop uses usually depends on the amount of N fertilizer added to the growth media and/or mineralization occurring and the balance between mineralization and immobilization [6,8]. Ammonium ions from the mineralization process are rapidly converted to NO3 ions by a process called nitrification [9], a two-step process by which Nitrosomonas bacteria convert NH4⁺ to nitrite (NO2), and then Nitrobacter bacteria convert the NO2 to NO3 [6]. A rapidly occurring process is that one mostly finds NO3 rather than NH4⁺ and requires a well-aerated medium. In many cases, the available nitrogen from the mineralization process is not sufficient for plant growth, resulting in fertilizer application.
However, it has been observed that usage of inappropriate fertilizer configurations such as fraction, rate, and application time of NO3 and NH₄⁺ to agricultural lands could lead to N losses [3]. Agricultural N losses can significantly cause NO3 and NH4+ leaching and emission of N2O and NH3 into the environment [3,6]. Even though N inputs are beneficial for increasing productivity in agricultural systems, excess N can cause ozone-induced injury to crops, acidification, and eutrophication of aquatic ecosystems in the environment [10]. For example, N losses from Midwest U.S. agricultural fields are suggested to be the leading cause of the hypoxic zone in the Gulf of Mexico [11]. It is estimated that a regional average of 1.12 (0.64–1.67) Tg N−y of N losses from stable and unstable yield areas of N fertilizer lost into the environment is causing the U.S. approximately USD 485 (267–702) million dollars in fertilizer value equivalent [11]. In addition, N leaching from agricultural lands poses a significant threat to surface and groundwater quality, leading to the eutrophication of water bodies [12]. Toxins with paralytic, diarrheic, and neurotoxic effects that can have adverse effects on humans, animals, and aquatic species, according to [6], may be produced by algae that result from eutrophication. At high concentrations, these toxins can impact aquatic species’ reproduction, fishing industries, and coastal economies because of algal bloom [6]. Economically, eutrophication cost the United States of America and the United Kingdom approximately USD 2.2 billion and GBP 75–114 million [6,13], respectively, relating to issues such as drinking water treatment, biodiversity, and tourism [14]. One of the reported nutrient-leaching mitigation processes is the application of biochar to soil or growth media [15].
The soilless-biochar amendment system is gaining global attention [6,16,17]. Soilless systems, which involve the containerization of plant roots within a porous rooting medium, substrate, or growing medium, can be defined as any method of growing plants without the use of traditional soil as the rooting medium [18,19]. Soilless media have been reported to produce higher yields and prompt harvests from smaller areas, have higher water and nutrient use efficiency, and be more cost-effective than traditional soil systems [20]. However, there is a need to evaluate the nutrient retention capacity of the soilless media.
Biochar has been reported to enhance nutrient retention when amended with soil [21]. Biochar is the C-rich product obtained as a result of pyrolysis of biomass of plant or animal organic matter (OM) at temperatures greater than 250 °C in the absence or low oxygen environment [22,23,24]. Literature has shown that soil biochar amendment increases soil organic carbon (OC), improves water holding capacity, neutralizes acidic media pH, increases water retention, aeration, and cation exchange capacity (CEC), and improves microbial biomass [25,26,27,28]. Biochar has also been reported to potentially sequester C in soils and improve soil quality and plant growth [29,30]. Biochar plays an important role in soil fertility conservation [31]. Amending soilless media with specific percentages of biochar has been reported to increase plant growth [16]. Biochar-soilless amendment decreased phosphorus, NO3, and organic C runoff [32], improved growth and productivity [33,34,35], increased substrate pH, and improved hydraulic conductivity and water retention [6,36]. However, it remains unclear which component of biochar influences nutrient retention.
One of the most successful structural tools for in-depth analysis of complex organic solids in their natural state has been the solid state 13C nuclear magnetic resonance (NMR) technique [37]. The 13C NMR technique has evolved into one of the pervasive spectroscopic approaches for qualitative and quantitative chemical analyses [38]. 13C NMR data provide more detailed information and pictures of the structural properties of samples composed of a wide range of organic (aliphatic and aromatic) functional groups [39]. NMR techniques present high-resolution sample spectra with different constituents’ detection; however, this analysis method is expensive. Therefore, in complementarity to 13C NMR, the multi-elemental scanning thermal analysis (MESTA) technique provides a simple, inexpensive, rapid, and sensitive alternative routine for solid sample examination [40]. The MESTA technique heats a sample from ambient to 800 °C in an enclosed quartz tube under a given atmosphere. The sample volatile components are carried to a high-temperature combustion tube, oxidized to their respective oxides, and then detected by the elemental detectors [40]. Results of the samples of thermograms of simultaneous elements (C and N) are generated and used as chemical identification and characterization signatures [6,40]. A highly robust new OM quality indicator, the “R400” index, is deduced directly as a fraction of low thermal stable carbon values to the overall organic C composition values [41]. High R400 values, by molecular analyses, indicate samples richer in sugars and slightly oxidized lignin. Indication of higher R400 values in samples can be translated as OM preservation indicator [41]. It is clear that amending soilless media with biochar influences the C quality. However, it remains unclear how soilless media biochar amendment influences organic C composition and thermal stability and their influence on NO3 retention and tomato yield. Therefore, the objective of this research is to (i) determine the influence of soilless media biochar amendment on organic C composition and R400, (ii) evaluate the influence of organic C composition and R400 on NO3 retention, and (iii) determine the influence of NO3 retention on tomatoes yield.

2. Materials and Methods

2.1. Research Method

2.1.1. Media

A soilless growth media consisting of a mixture of 60% coconut coir and 40% fine pine bark was used to prepare eight biochar treatments containing 1, 2, 3, 4, 6, 8, 10, and 12% biochar per dry weight, respectively, plus a control, no-biochar. The compressed coconut coir brick of 20 × 10 × 5 cm was expanded and rehydrated by soaking it in water, giving a volume 5–7 times its original size. A cement mixer was used to mix the soilless media with biochar treatments and dispensed into nine 11-L plastic containers to give three composite replicates per treatment.

2.1.2. Tomato Production

Red Bounty hybrid tomato plants were acquired from Hopkins Farm: 272 Oak Hill Rd., Cairo, GA 39828, USA. Plants were grown at Hopkins Farms and bought as transplants. Transplants were planted one per 11-L container containing the appropriate percentage biochar treatment and the control. Each treatment had a total of nine plants. Plants were fertigated, incorporating nutrients and irrigation water with a hydroponic nutrient solution formulated by Verti-Gro® (http://www.vertigro.com/category-s/103.htm, accessed on 2 December 2021) via drip irrigation. UVA is a simple and common technique by which a pump on a timer delivers a slow solution feed to the base of each plant. Plants were fertigated 5 days a week and irrigated on weekends, 4 times a day, for 3-min duration. Tomato production occurred under a shade-protective structure, with the shade material providing up to 60% Ultraviolet (UV) protection.

2.1.3. Sample Collection and Laboratory Processing

Tomatoes were harvested when they first began to show signs of turning red and ripening. The harvested tomatoes were weighed and recorded for six weeks before the termination of the experiment. After tomatoes were harvested, the soilless + biochar samples and the control were composited, consistent with the nine treatments, including the control. Three samples were combined and homogenized under each treatment, and the composited samples were processed in triplicate. From the composited and homogenized samples, approximately 450 g of each composite sample was collected in labeled plastic zip lock bags and transported on ice in the cooler to FAMU’s main campus School of the Environment laboratory for processing and analysis.
In the laboratory, a sub-sample of each composited triplicate sample collected from nine treatments, including the control, was air-dried at 25 °C to constant weight prior to 13C NMR and MESTA analysis. The air drying ensured no alteration in organic C composition. Another sub-sample of each composited triplicate sample was oven-dried at 70 °C for three days before physical-chemical analysis.

2.2. Physicochemical Properties

Sample pH was determined with 1 g of sample in 20 mL of deionized water (DI) shaken for 1.5 h and left for 5 min equilibration time before pH measurement with Fisher Scientific Accumet Basic AB15 pH meter [15,21,42]. Sample elemental C and N were determined in triplicate using a CHN Elemental Analyzer (Carlo-Erba NA-1500) by Thermo Flash and Carlo Erba Analyzers, Okehampton, Devon, England, through high-temperature catalyzed combustion [15]. Loss on ignition (LOI) of samples was determined by heating pre-oven-dried samples at 550 °C for 4 h using Thermolyne Furnace 48000 (ThermoFisher Scientific, Waltham, MA, USA) [6,21]. Samples NO3 were determined using the water extractable method by agitating 1 g of the sample with 20 mL of DI water for 30 min. After allowing to settle for 15 min, the mixture was centrifuged at 6000 rpm for 10 min. The supernatant was then filtered through 0.45 µm pore size filter paper [6]. The NO3 concentration was analyzed using the ionic chromatography system Dionex ICS-2000 (Dionex, DX, Sprectralab Scientific Inc., Buffalo, NY, USA) coupled with an autosampler (Dionex, AS-DV).

2.3. 13C Solid—State Nuclear Magnetic Resonance Analysis

Sample organic C composition was determined using 13C NMR. Finely milled powder samples of soilless media amended with different percentages of biochar by weight were analyzed using the magic angle spinning 13C solid-state nuclear magnetic resonance technique (MAS 13C SSNMR). A Bruker 300 MHz AVANCE II NMR spectrometer equipped with a Bruker 4.0 mm double resonance MAS NMR probe was used to conduct the MAS 13C SSNMR analysis. Samples were packed into 4.0 mm zirconia rotors with Kel-F drive caps. Samples were spun to 9.5 kHz at RT using a Bruker pneumatic MAS unit. 13C signals of samples were enhanced by cross-polarization: a 4.0 ms 1H 90° pulse followed by a 1H spin-lock field of 45 kHz for 1.0 ms contact time, during which the 13C RF field was ramped from 35 to 50 kHz. All 13C signals were recorded under irradiation of the SPINAL 64 decoupling sequence with a 1H RF amplitude of 62.5 kHz. With a recycle delay of 3 s, the number of scans used to accumulate the signals was between 10,000 and 20,000, depending on the samples. The integrated MAS 13C SSNMR spectra regions were used to determine each C functional group (alkyl: 0–45 ppm; methoxyl: 45–60 ppm; O-alkyl: 60–110 ppm; aromatic: 110–140 ppm; phenolic: 140–160 ppm; and carboxyl: 160–220 ppm) contributed from the samples [21,43]). Using total carbon (TC) values of the samples, the percentage of C functional groups was converted to g C kg−1 functional groups [21].

2.4. Thermal Stability Analysis Using Multi-Elemental Scanning Thermal Analysis

To determine sample total C and N content, the multi-elemental scanning thermal analysis (MESTA) technique was employed, as used by [21,40]. Carbon and N contents were used to generate C and N thermograms, respectively. The MESTA device comprises a quartz pyrotube with connecting compartments for samples and combustion. Samples were placed in the sample chamber or compartment, heated from ambient temperature to 700 °C at a constant heating rate of 50 °C per minute; a 40% O2 and 60% He carrier gas was flushed through the sample compartment throughout the analysis.
The carrier gas carried the decomposed materials to the combustion compartment, oxidized to CO2, NO2, and SO2, and detected C, N, and S through a detector. A PC-based online multi-channel data logger connected to the device recorded the sample’s temperature and C and N signals. The temperature range in each run was calibrated using a cystine standard. The samples’ C and N concentrations were determined using a calibration curve generated from the arginine-KHP standard of known concentration. A mixture of sample and talc dilution in a ratio of 1:5 (sample: talc) by weight was applied before the MESTA analysis to obtain a better thermogram representative for the sample thermo-chemical analysis due to high C concentration in biochar [21], an amendment to the growth media. The low thermal stable C (LTSC) was considered as the carbon recovered at <400 °C, while high thermal stable C (HTST) was considered as the C recovered at >400 °C [21]. The R400 index was calculated; the R400 index is the ratio of the area defined below 400 °C normalized to its total surface [41,44]. Based on the data obtained from the low C thermal stability (<400 °C), R400 was calculated as the fraction of low thermal stability to total C of samples using the formula below:
“R400” = (C recovered at < 400 °C)/TC

2.5. Statistical Analysis

JMP software (version 13.2.1) was used to conduct Analysis of variance (ANOVA) and correlation analysis for this study. The responses considered were reported using the means and standard error of the mean (SEM). ANOVA, using all pairwise Tukey HSD tests, where α = 0.05, was used to determine significant differences among treatment variables. The independent variables include the biochar percentage, C composition, C thermal stability, and R400. The dependent variables include nitrate retention and tomatoes production.

3. Results

3.1. Biochar Amended Soilless Media Physicochemical Properties

Biochar-amended soilless media physical-chemical parameters are shown in Table 1. The amendment with biochar significantly influenced the soilless media parameters. The pH remained slightly acidic, ranging from 6.02–6.84; the acidity decreased with the increasing percentage of biochar (p < 0.0001; Table 1).
Total C increased significantly with increasing biochar percentage (p = 0.0006; Table 1), ranging from 443.0 to 514.5 g kg−1. Total N was highest in the soilless media with no biochar amendment and significantly differed between treatments but with no specific pattern ranging from 3.3 to 4.2 g kg−1 (p = 0.0044; Table 1). The C:N ratio increased with increasing biochar percentage, ranging from 106.5 to 139.4, which was above 25 in all treatments (p = 0.0024; Table 1). The NO3 retention significantly increased with increasing biochar percentage ranging from 97.5 –176 g kg−1 (p = 0.0386; Table 1), while NH4+ did not significantly differ between treatments (p = 0.1078; Table 1). However, there were no significant changes in loss on ignition (LOI) (p = 0.4618; Table 1).

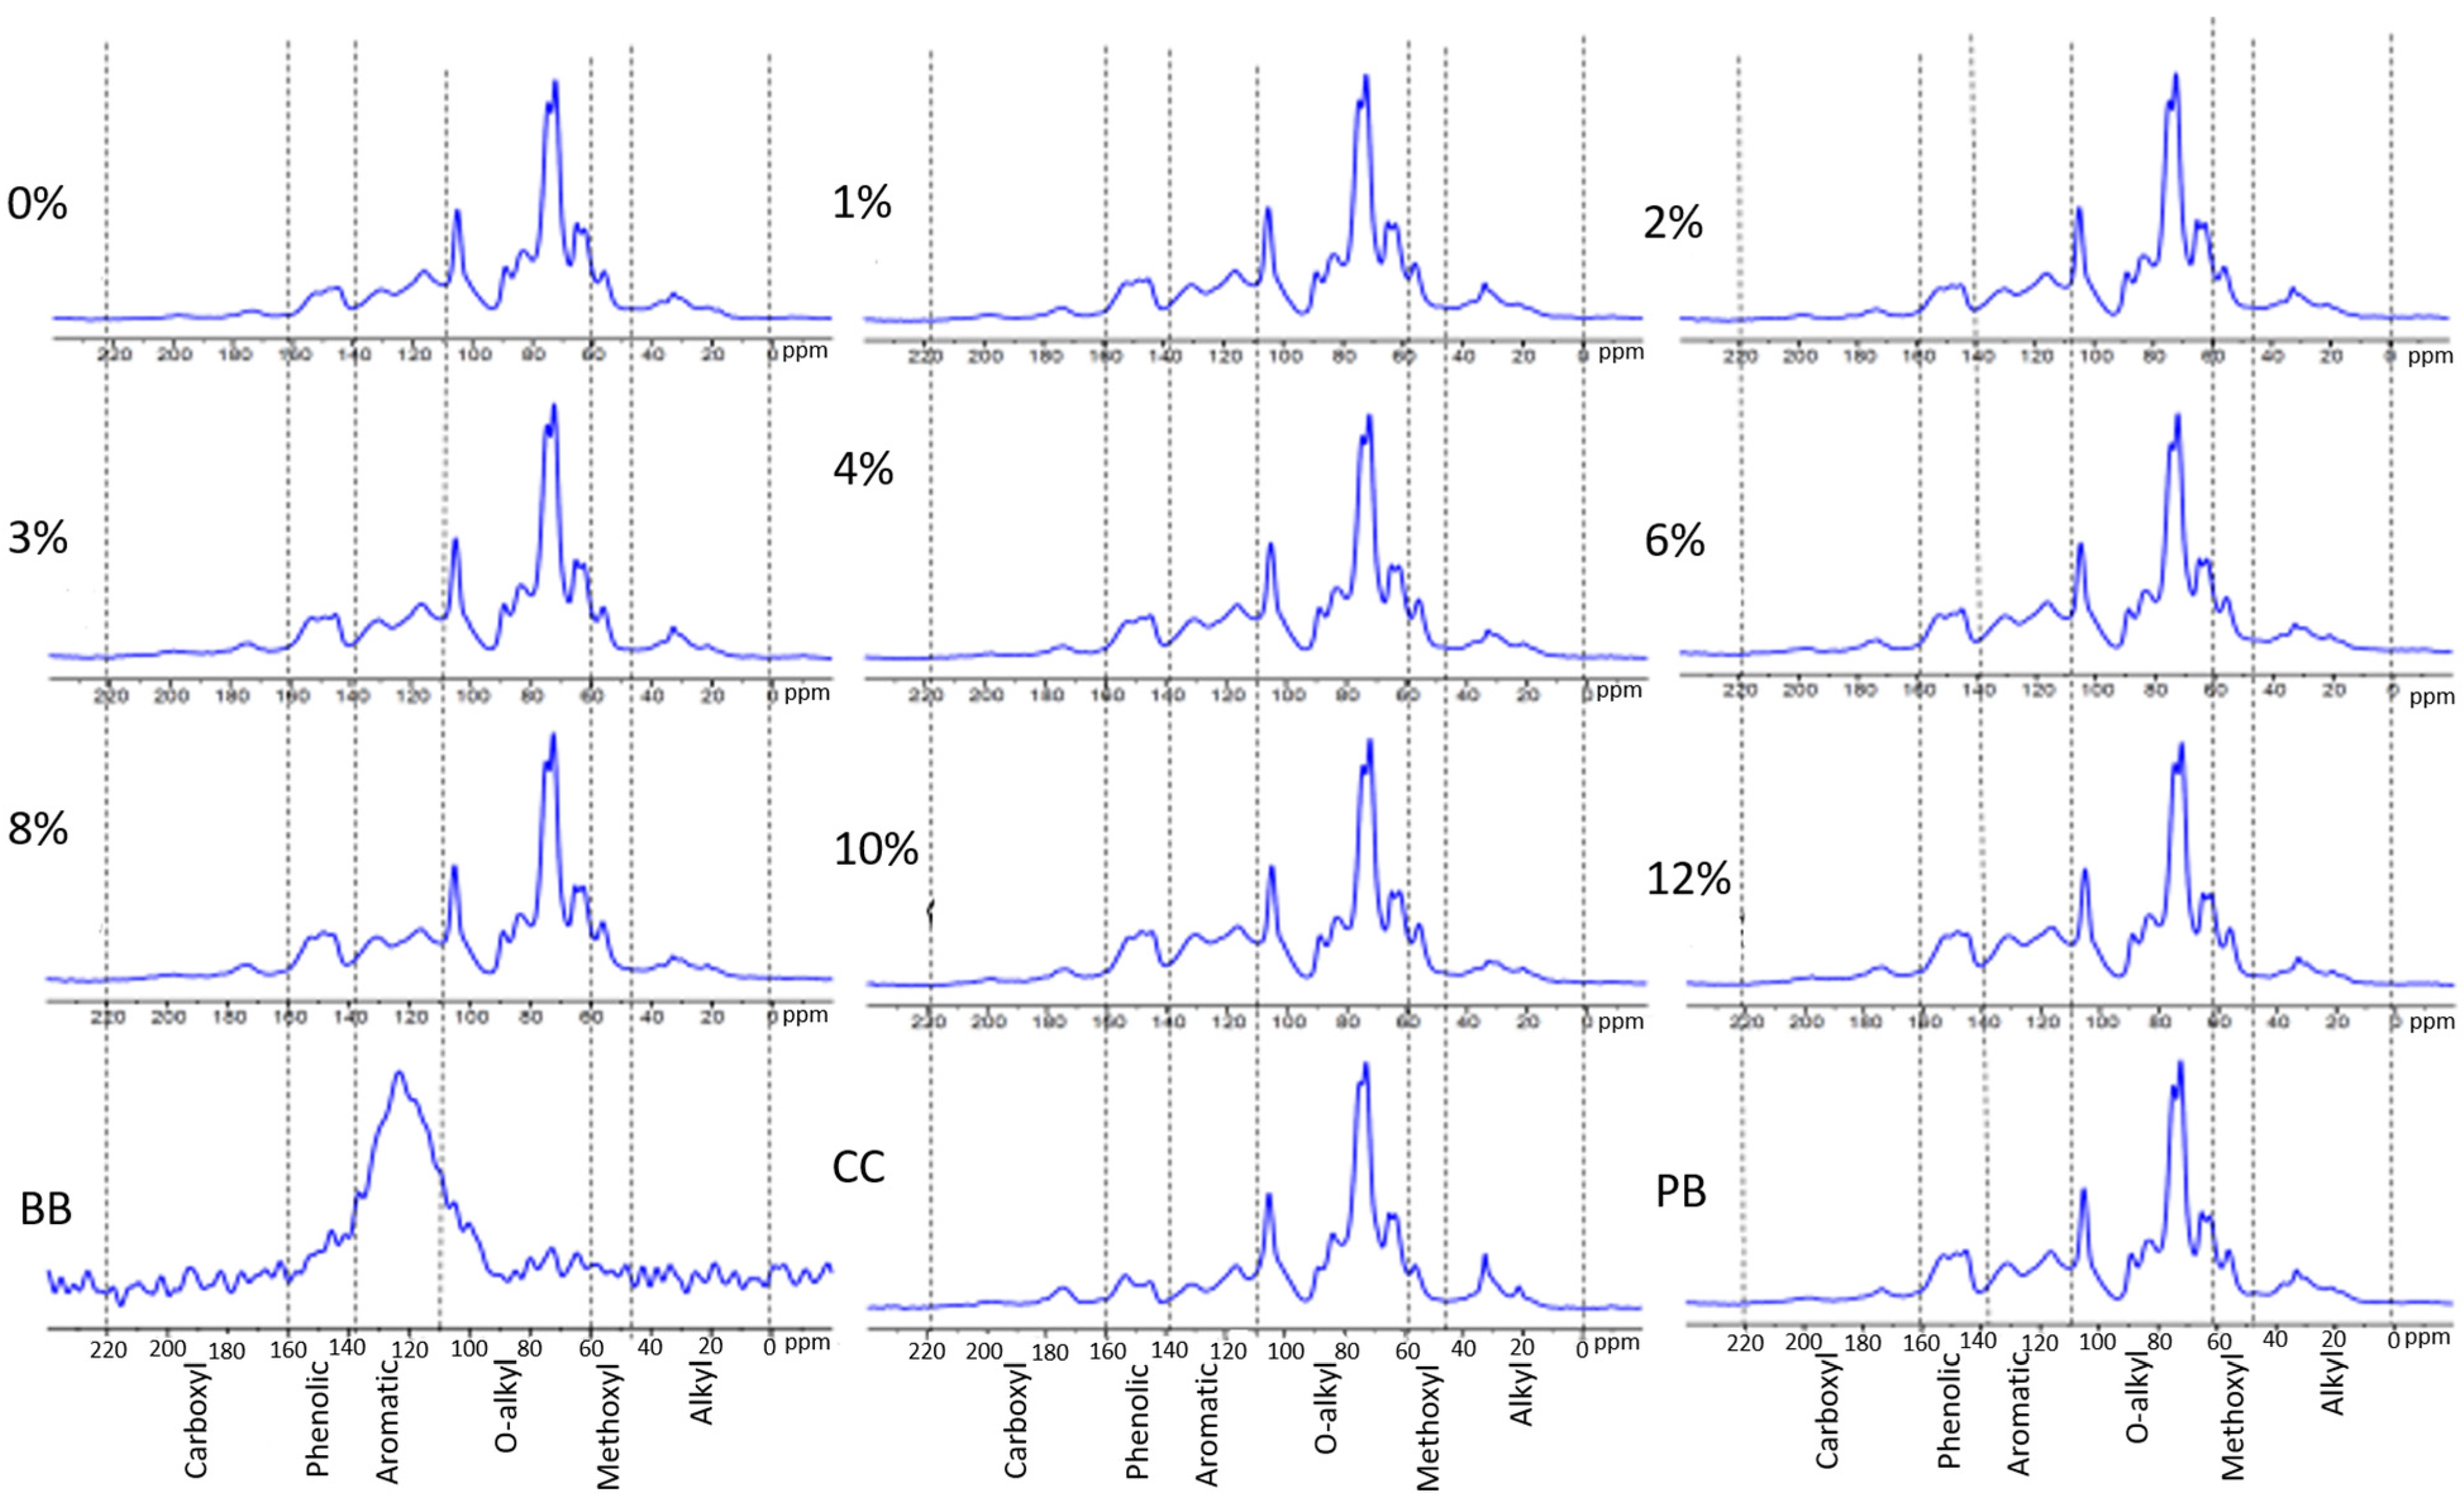
3.2. C Solid State Nuclear Magnetic Resonance

Both coir and fine pine bark used to make the soilless media and referenced in Figure 1 as CC and PB, respectively, were dominated by O-alkyl-C. In contrast, biochar (references as BB in Figure 1) by itself was dominated by aromatic-C (Figure 1). As a result, after soilless media was amended with biochar, the dominant carbon functional group for all the percentages of biochar-amended media and the control was O-alkyl-C (Figure 1). The O-alkyl ranged between 248–267 g kg−1 across all soilless media biochar amendments (Table 2). Across all biochar amendments, the dominance of the functional groups was in the order O-alkyl-C > aromatic-C > phenolic-C > alkyl-C > methoxyl-C > carboxyl-C (Table 2). It was evident that carboxyl-C, phenolic-C, and aromatic-C increased with increasing biochar percentage amendment in the order of aromatic > phenolic > carboxyl-C (Table 2) (Figure 1). Alkyl: O-Alkyl and aromatic: O-alkyl ratios ranged between 0.12–0.17 and 0.25–0.37, respectively.

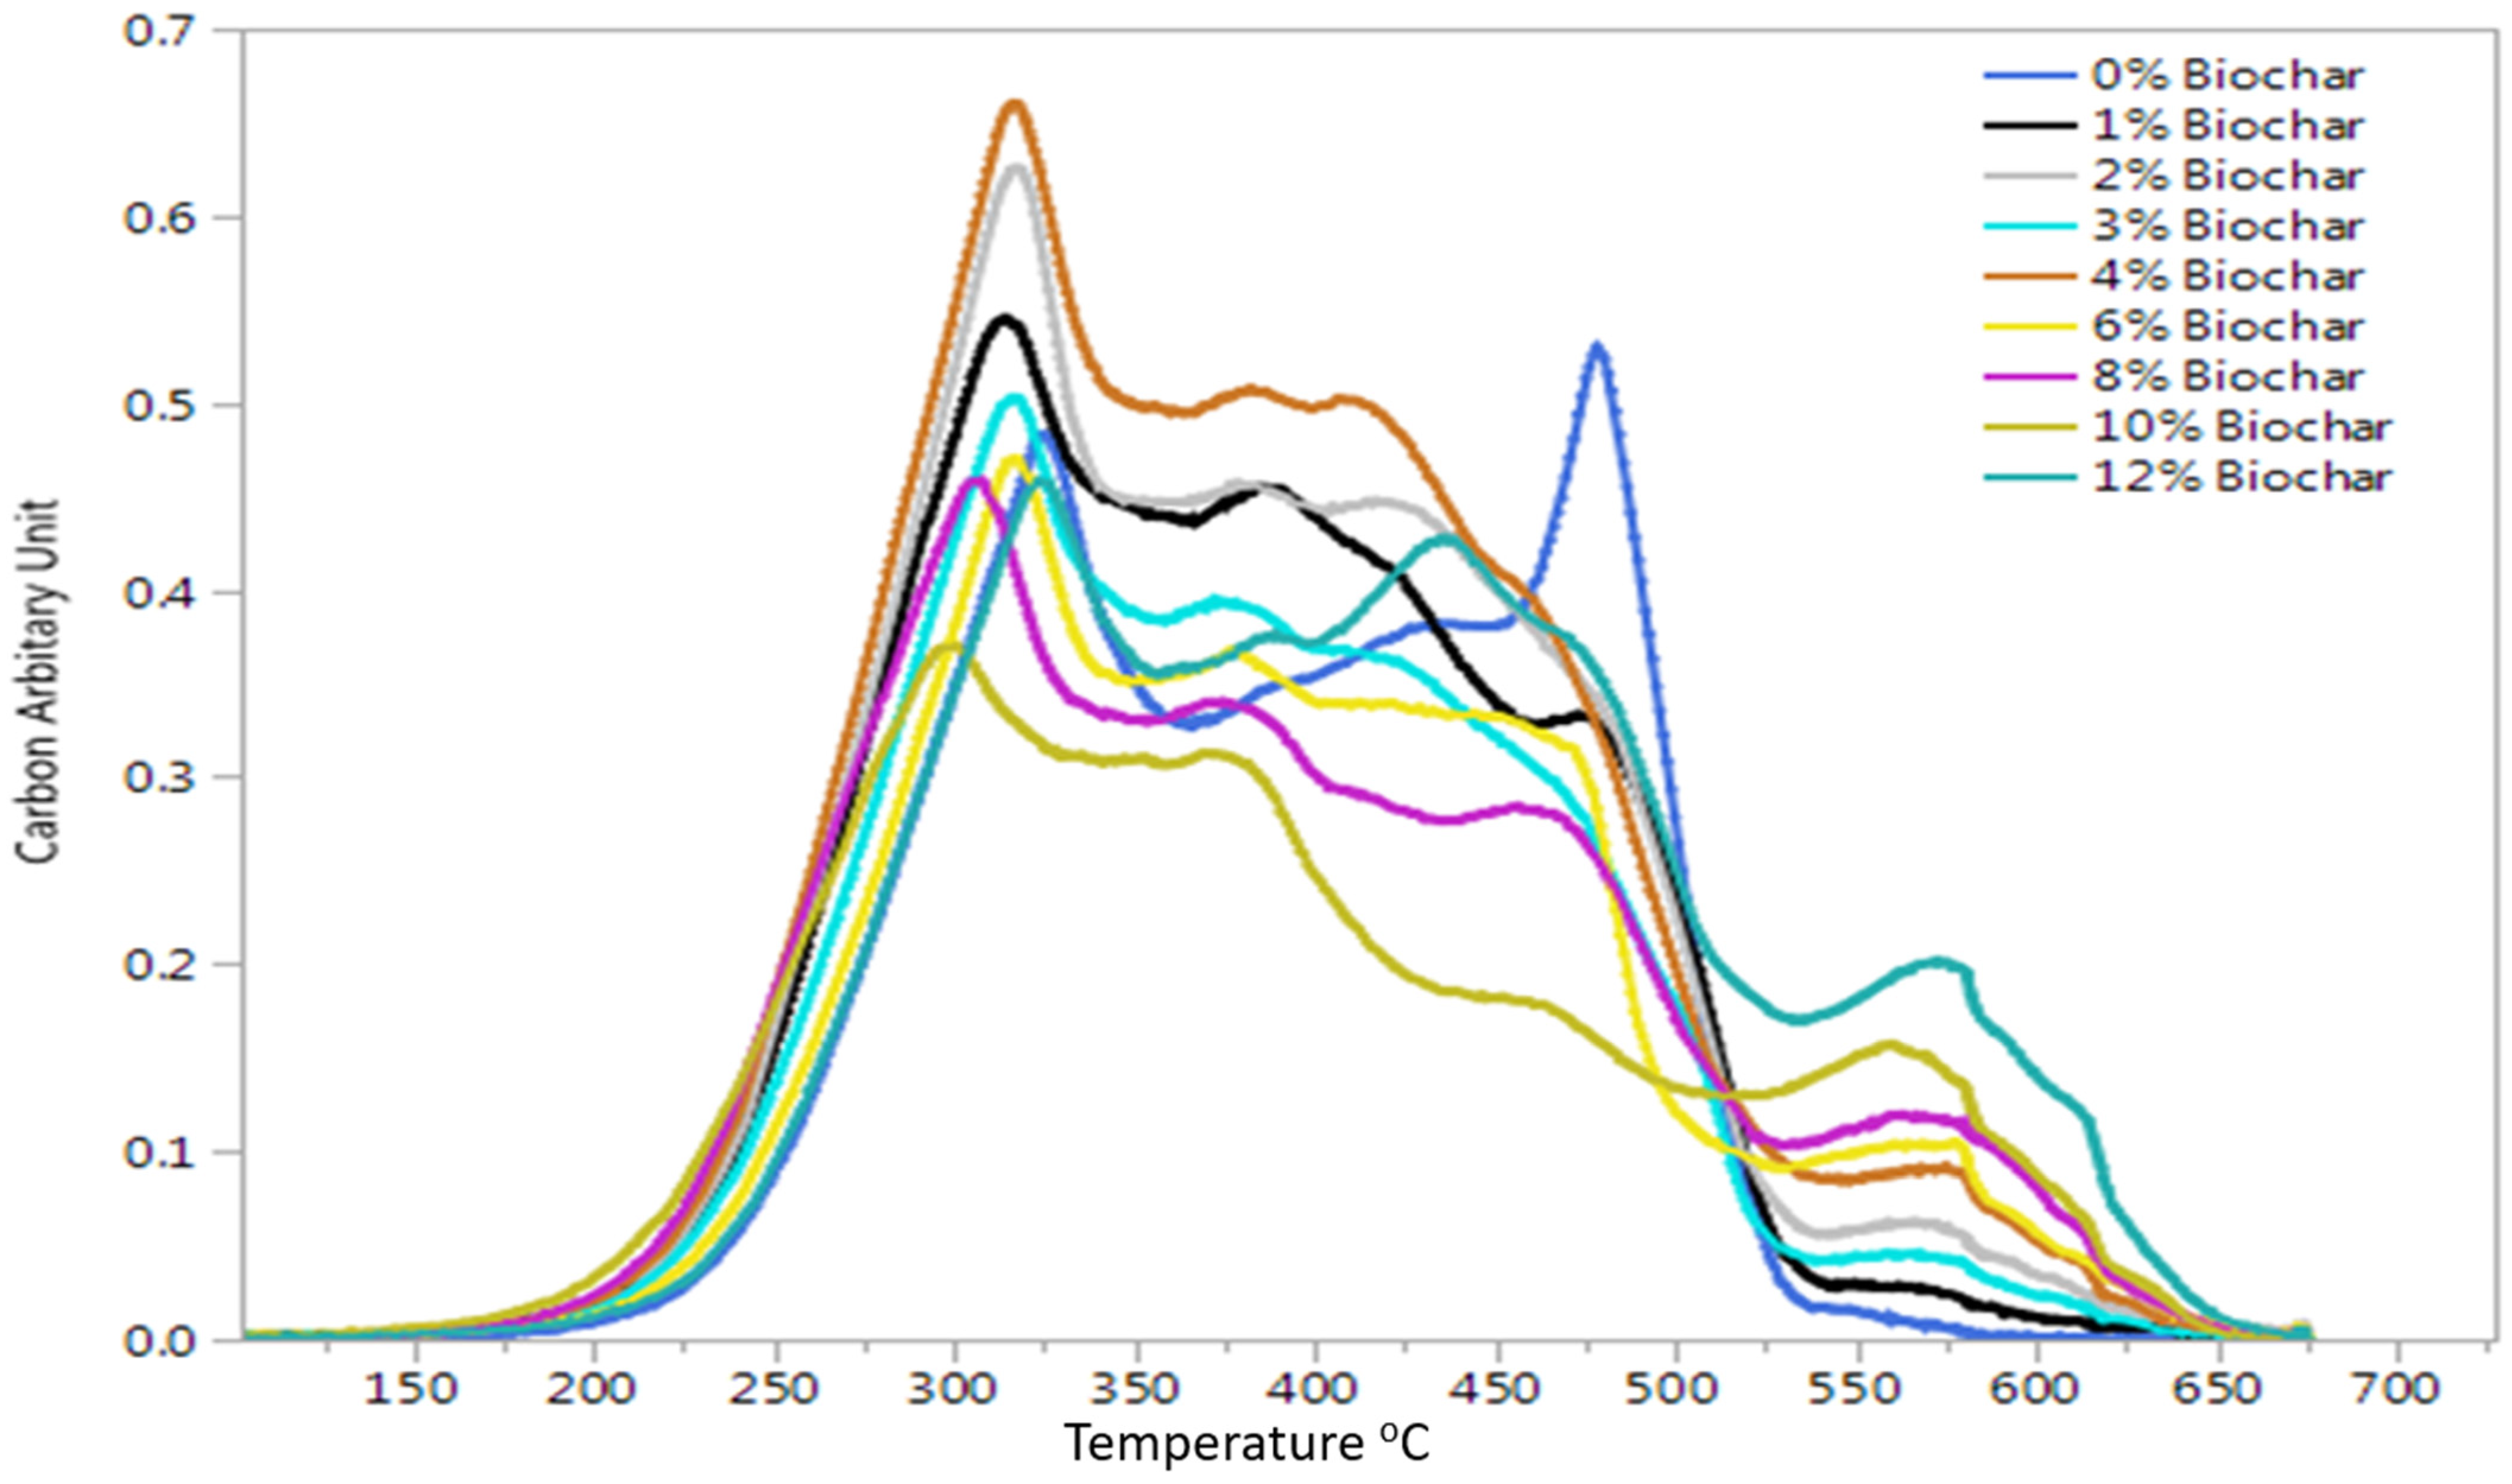
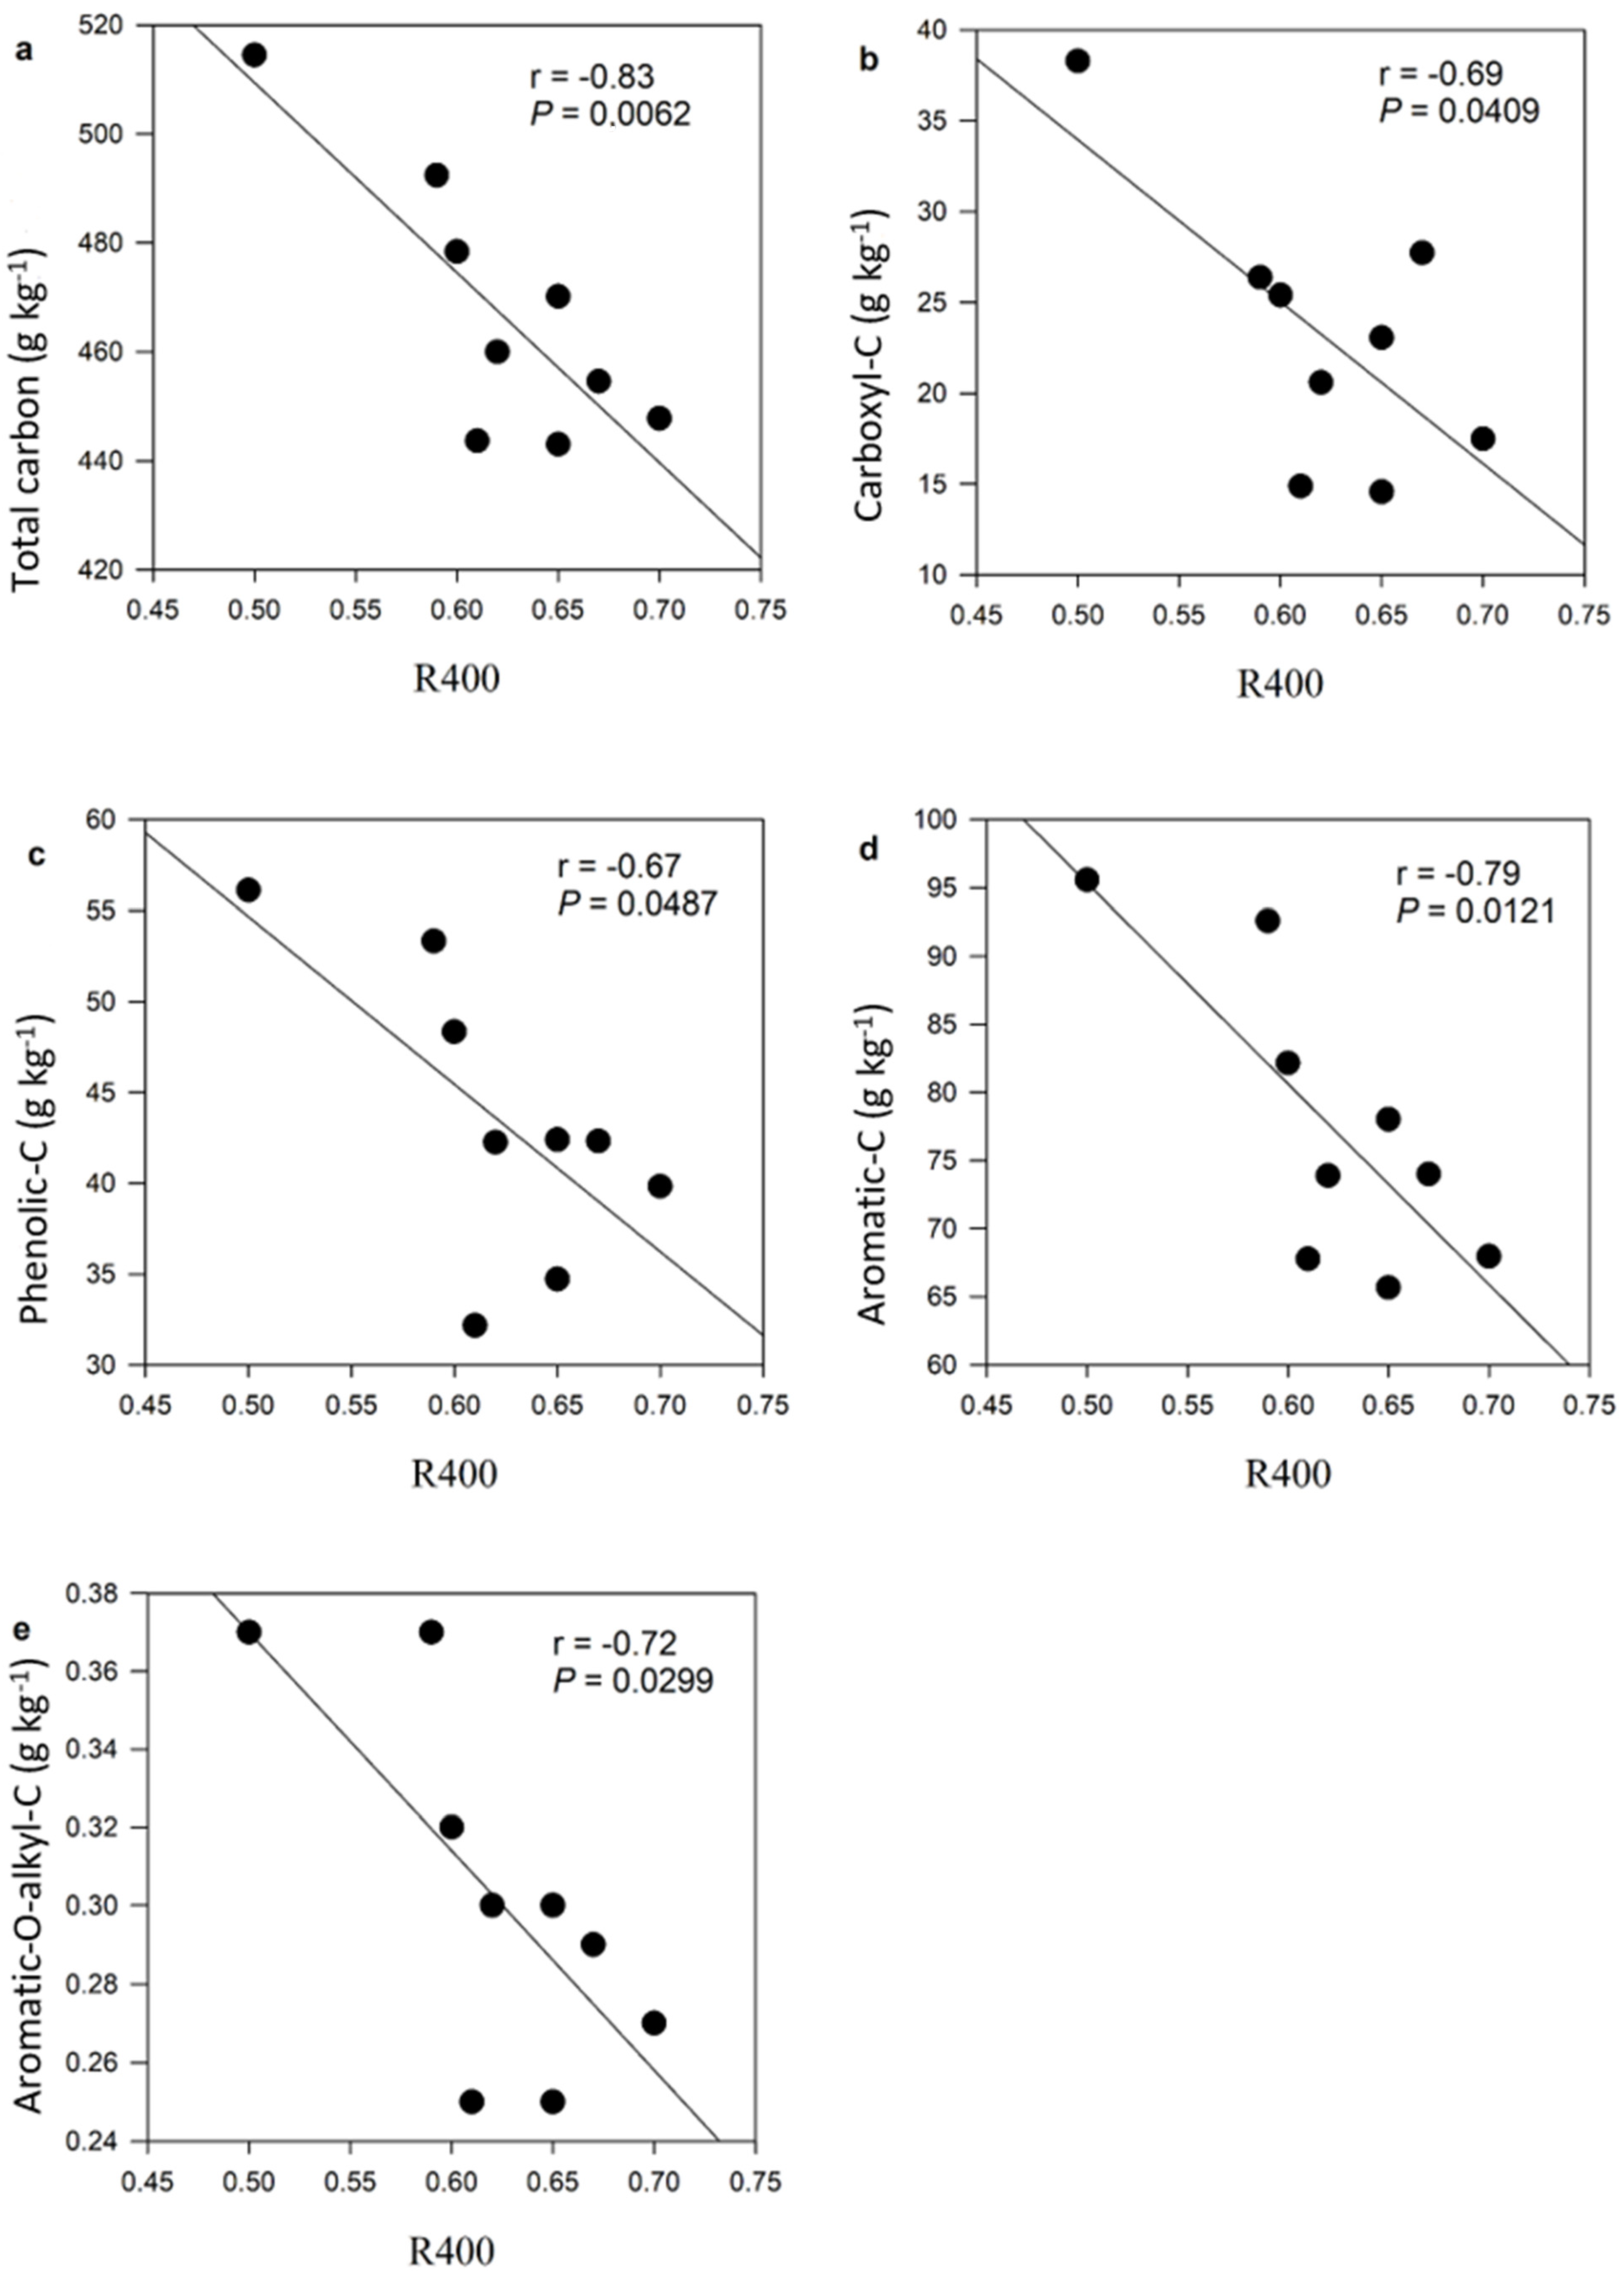
3.3. Multi-Elemental Scanning Thermal Analysis Results

The data indicated the dominance of LTSC in all samples apart from the 12% biochar amendment, where the quantities of LTSC and HTSC were equal (Table 3; Figure 2). This was evident from the R400 index, which was above 0.5, apart from biochar at 12%, which exhibited the 0.5 R400 index (Table 3). The R400 index decreased with increasing biochar percentage, decreasing from 0.7 for 1% biochar to 0.5 for 12% biochar (Table 3). It was clear that R400 values significantly correlated negatively with total carbon (r = −0.83; p = 0.0062; Figure 3a), carboxyl-C (r = −0.69; p = 0.0409; Figure 3b), phenolic-C (r = −0.67; p = 0.0487; Figure 3c), aromatic-C (r = −0.79; p = 0.0121; Figure 3d), and aromatic: O-alkyl ratio (r = −0.72; p = 0.0299; Figure 3e).

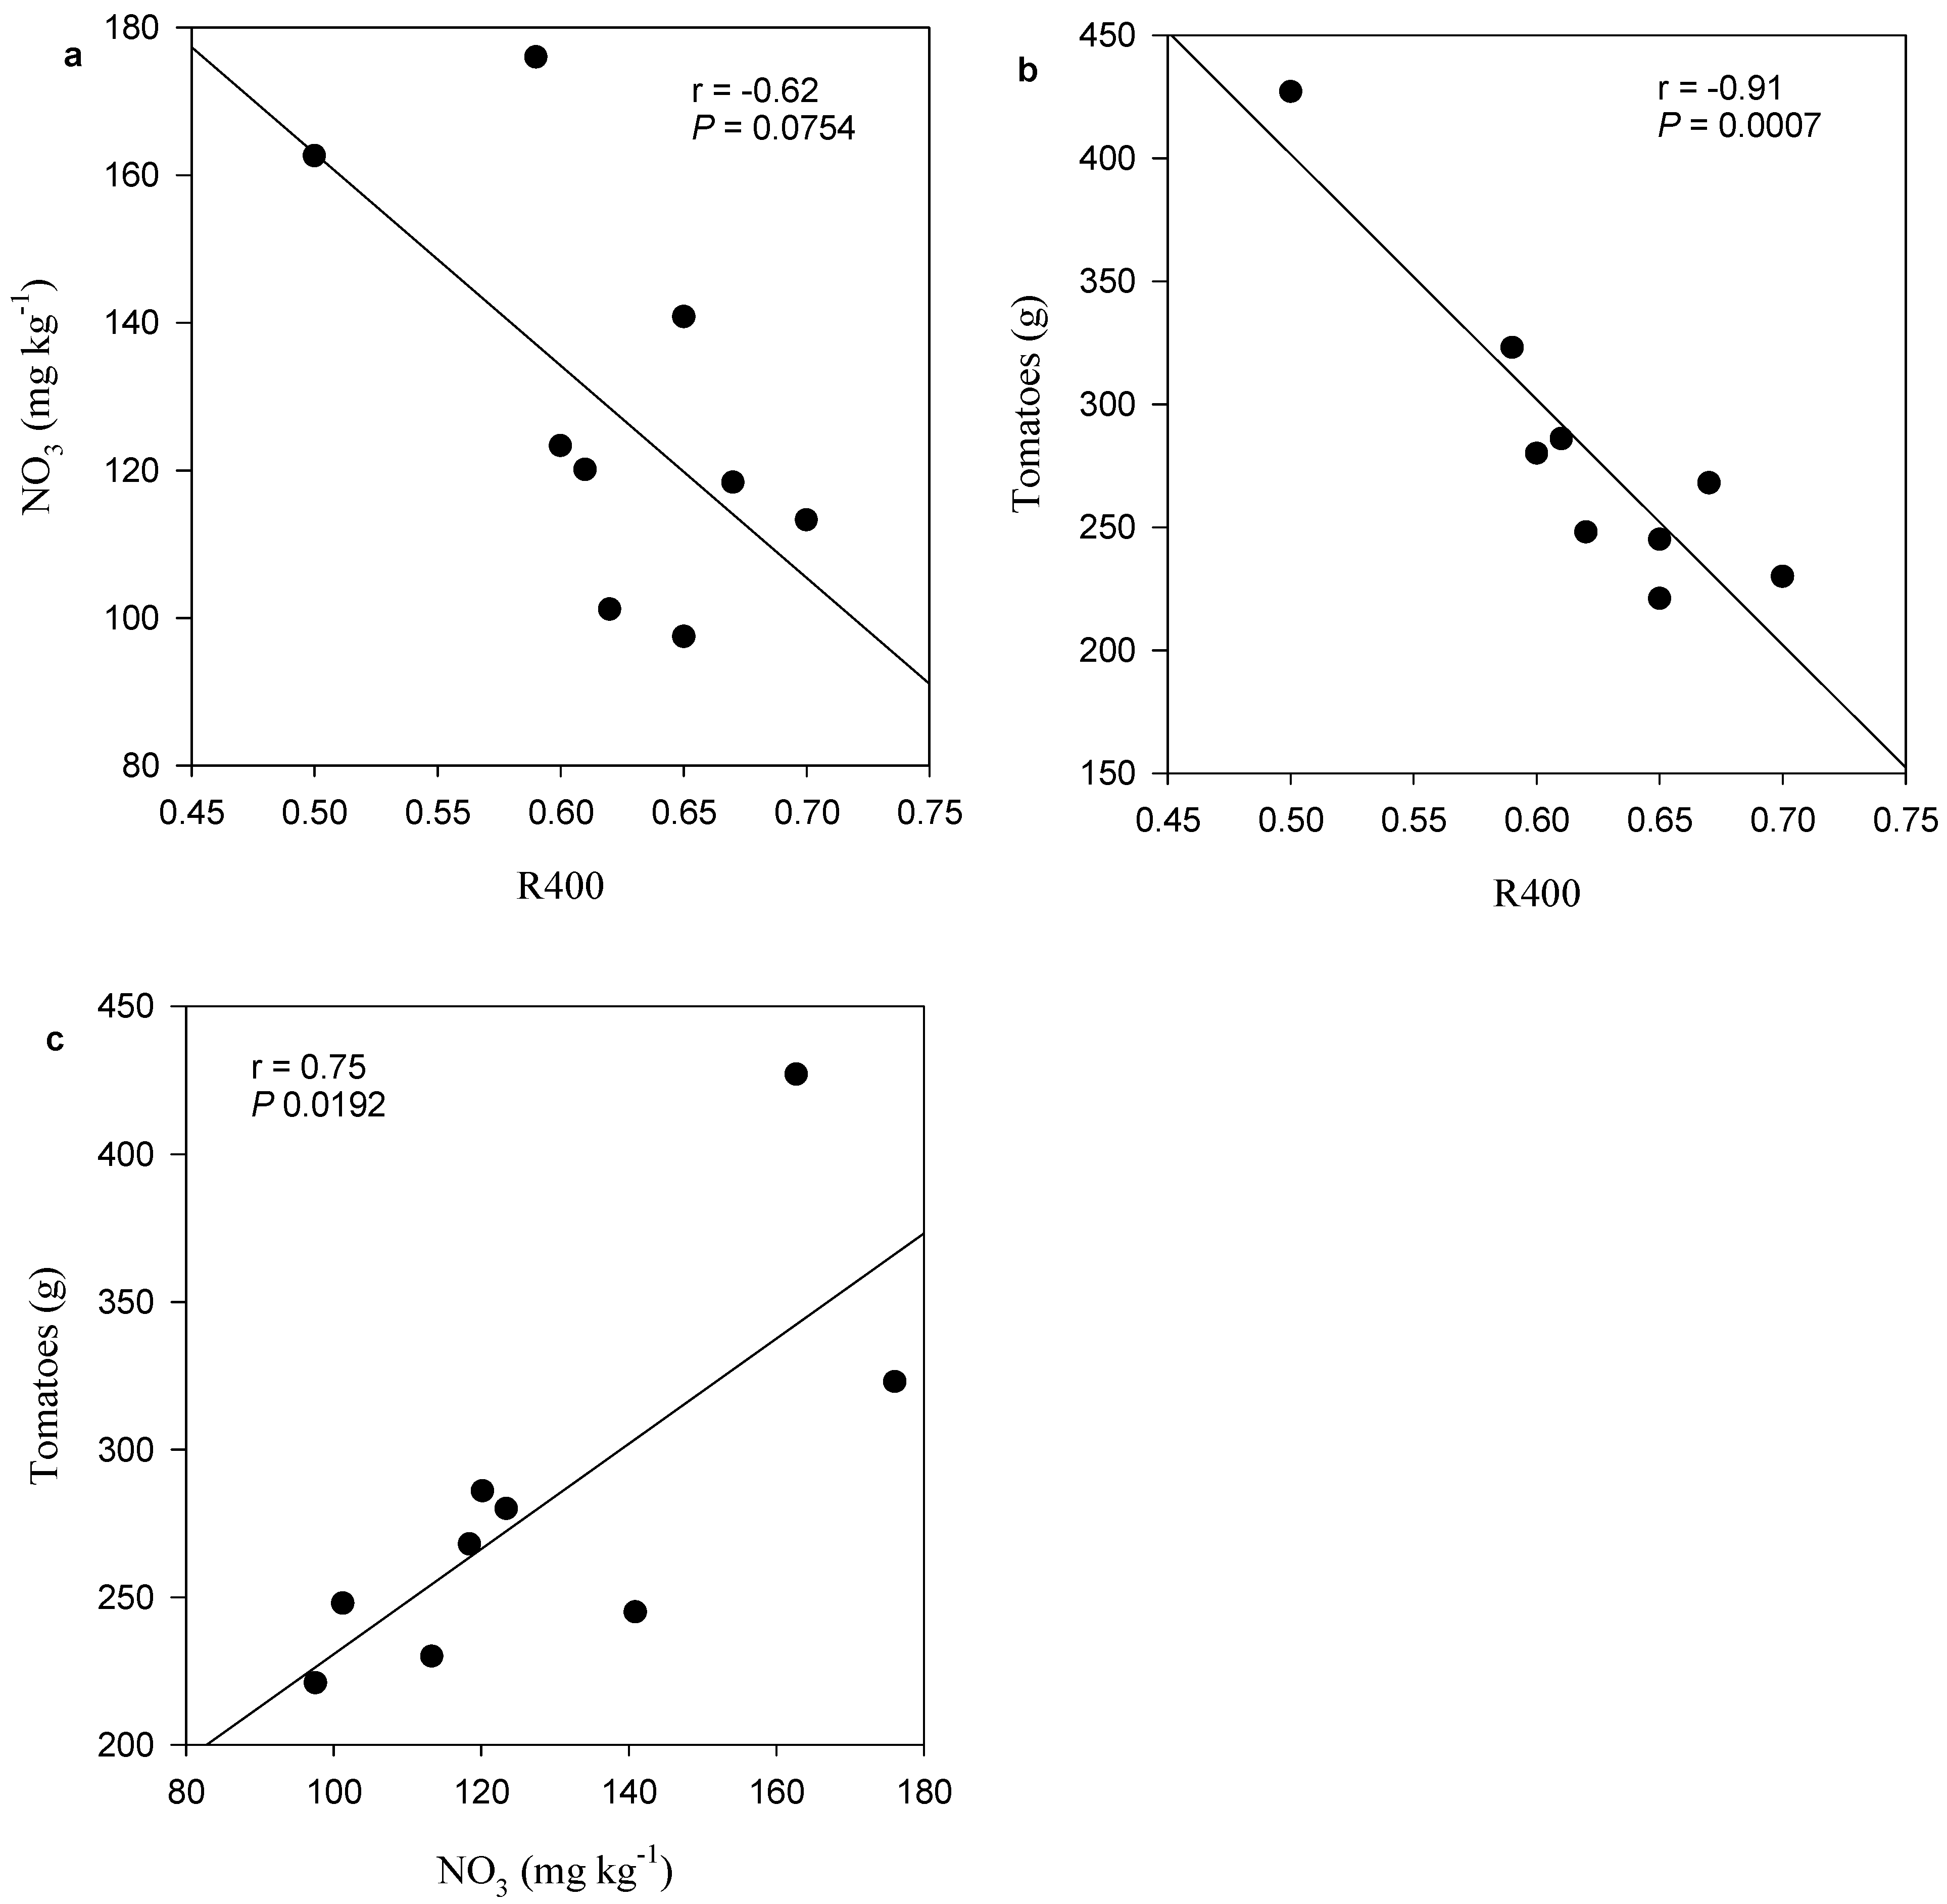
3.4. Nitrate Retention
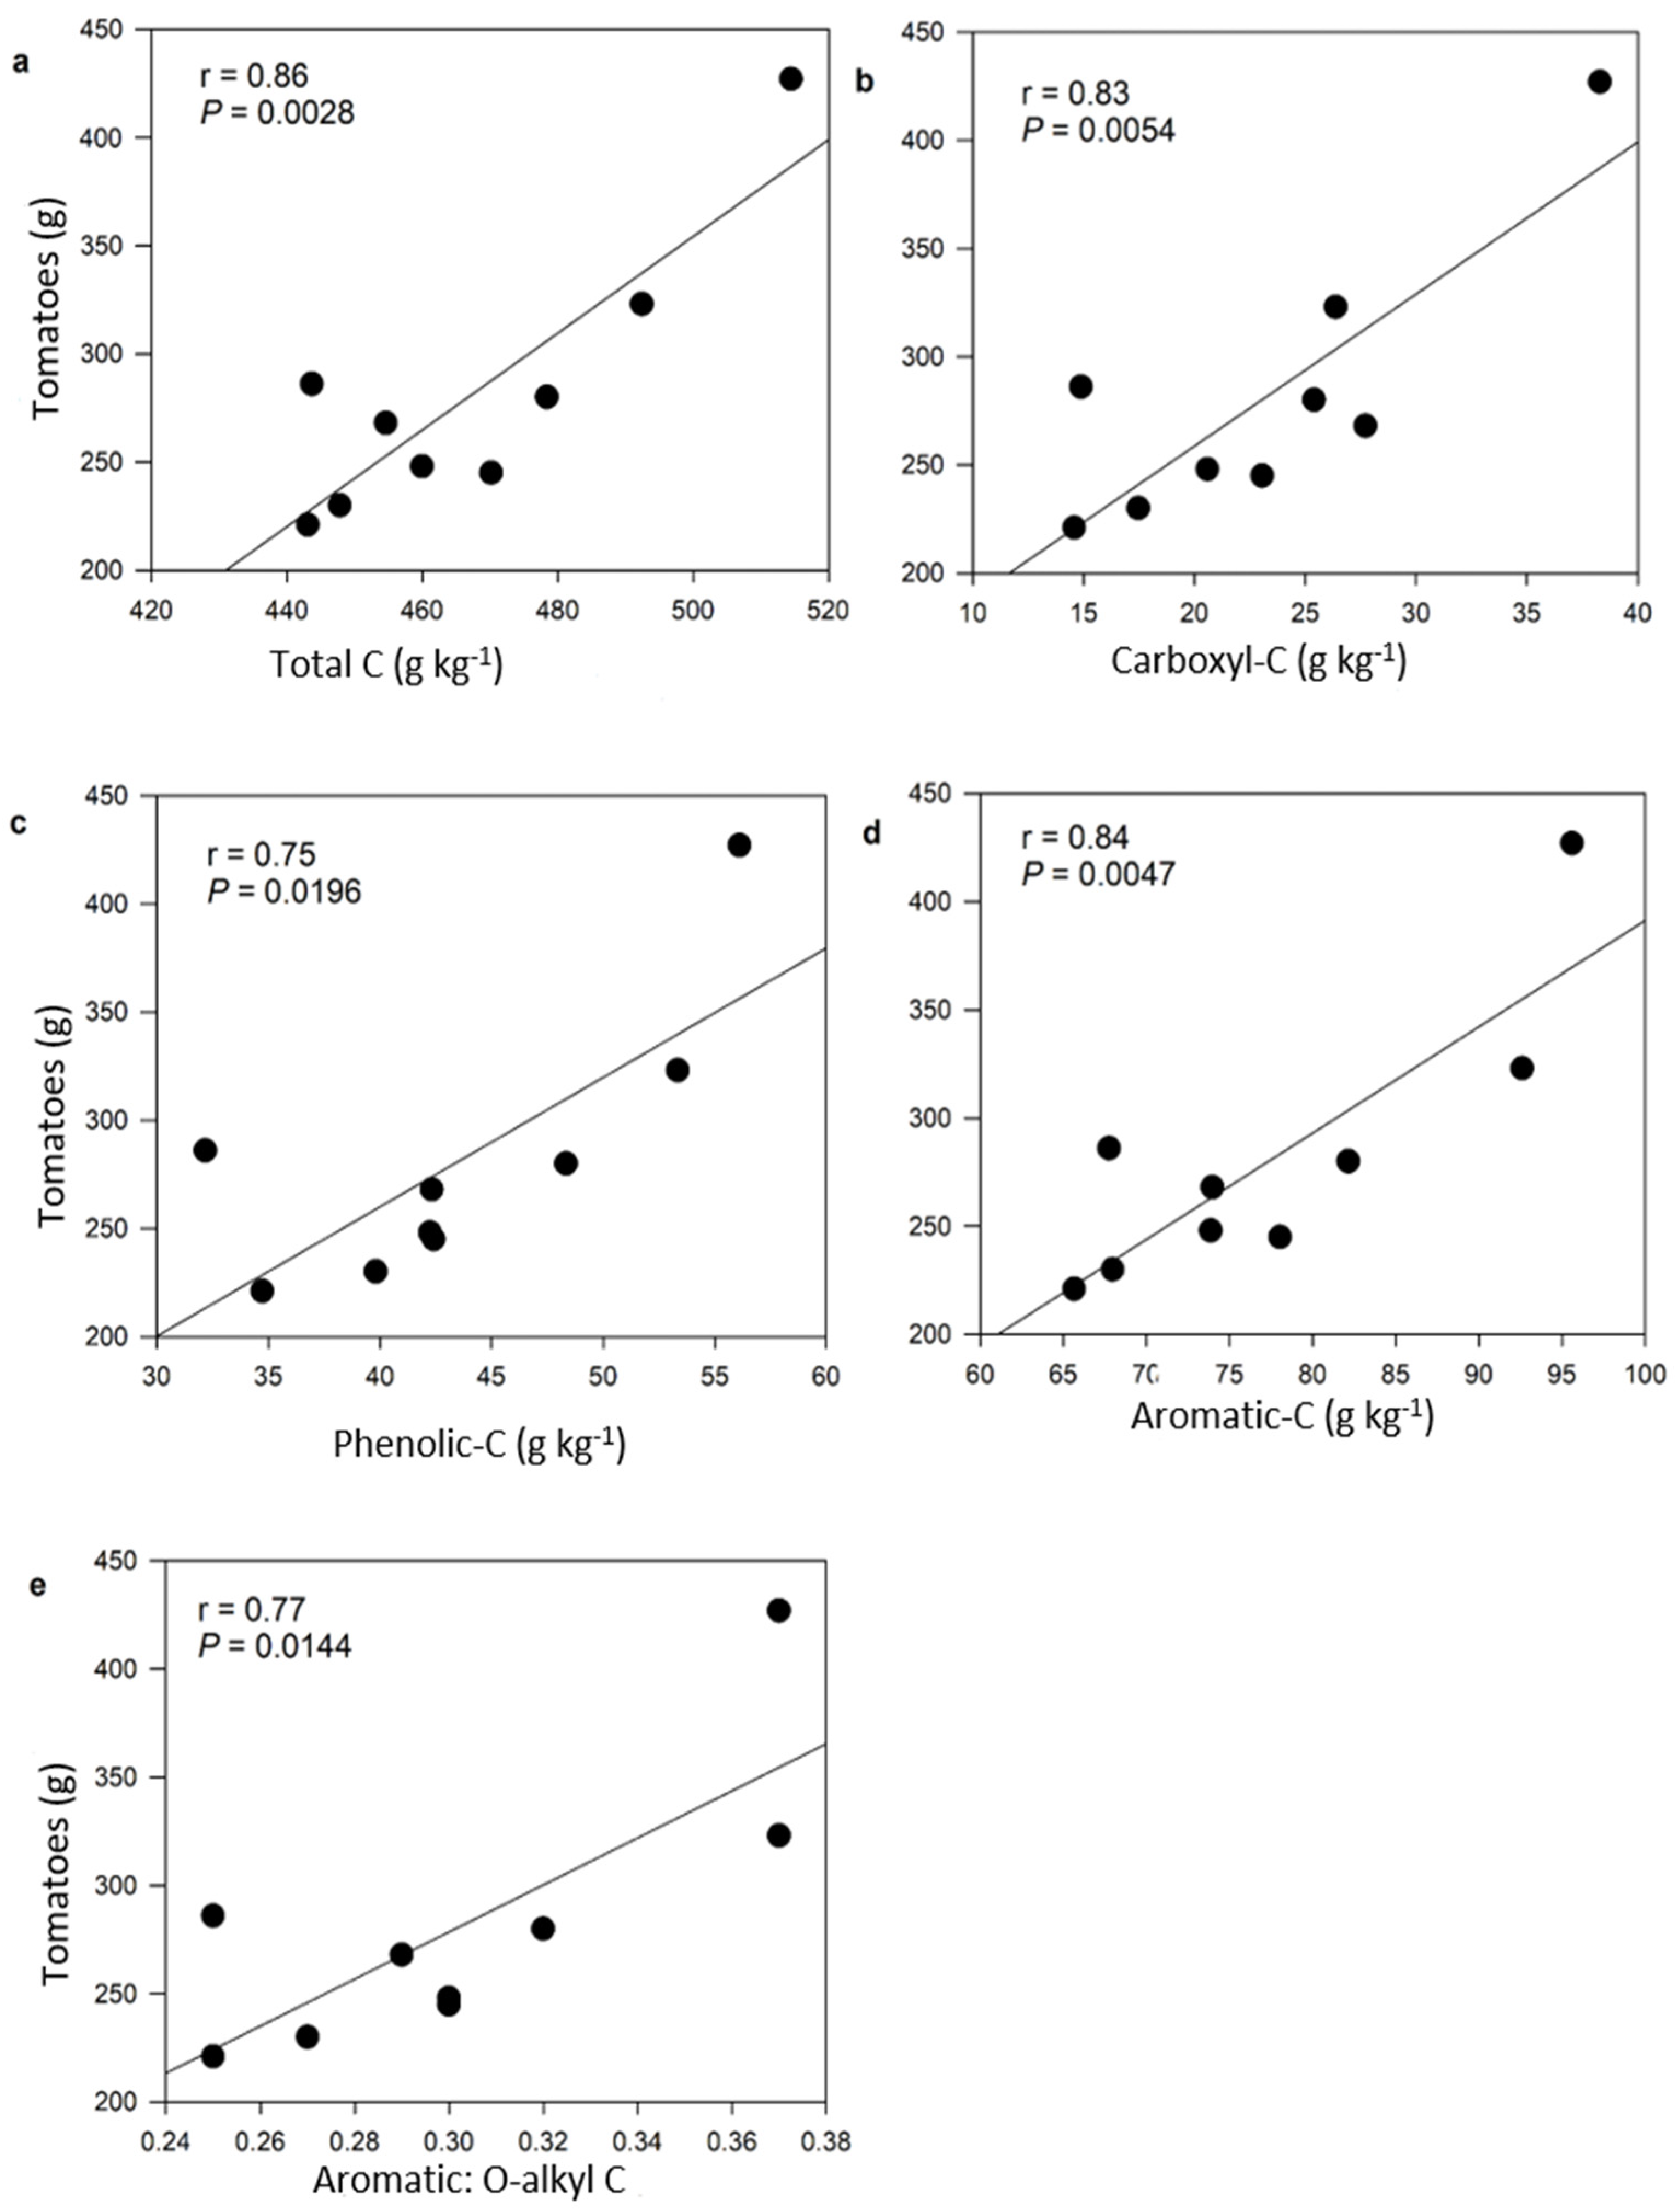
As previously indicated, NO3 increased with an increasing biochar percentage (Table 1). There was a significant positive relationship between NO3 and C (r = 0.84, p = 0.0048; Figure 4a), carboxyl-C (r = 0.69, p = 0.0394; Figure 4b), phenolic-C (r = 0.78, p = 0.0123; Figure 4c), aromatic-C (r = 0.89, p = 0.0014; Figure 4d), and aromatic: O-alkyl (r =0.85, p = 0.0039; Figure 4e). Notably, C (Table 1), carboxyl-C, phenolic-C, aromatic-C, and aromatic: O-alkyl-C ratios all increased with increasing biochar percentage (Table 2).

3.5. Tomatoes Yield

Tomato yield exhibited significantly high production under 12% biochar and generally had an increasing trend with increasing biochar percentage (Figure 5). In addition, tomatoes yield had significant positive correlation with C (r = 0.86, p = 0.0028; Figure 6a), carboxyl-C (r = 0.83, p < 0.0054; Figure 6b), phenolic-C (r = 0.75, p < 0.0196; Figure 6c), aromatic-C (r = 0.84, p < 0.0047; Figure 6d), and aromatic: O-alkyl ratio (r = 0.77, p < 0.0144; Figure 6e), respectively. Therefore, it is notable that both NO3 retention and tomato production exhibit a positive relationship with C, carboxyl-C, phenolic-C, aromatic-C, and aromatic: O-alkyl-C ratio. In contrast, it was evident that R400 exhibited a non-significant negative relationship with NO3 retention (r = −0.62; p = 0.0754; Figure 7a) and a significant negative relationship with tomatoes yield (r = −0.91, p = 0.0007; Figure 7b). Notably, tomato yield exhibited a significant positive relationship with NO3 (r = 0.75, p = 0.0192; Figure 7c).

4. Discussion

4.1. Biochar Amendment Altered the Soilless Media’s Physical-Chemical Properties

Amending soilless media with biochar significantly reduced the acidity of the media. This is consistent with results reported by [45,46] that biochar increased soil pH, highlighting the liming effects of biochar. It is notable that [21] indicated that the nutrient composition (especially calcium, iron, and aluminum) and biochar pyrolysis temperature influence the level of alkalinity introduced by biochar. The carbon content of the biochar amended soilless media increased with increased biochar percentage, consistent with [46]. This is because biochar is a carbon-rich coproduct of organic matter pyrolysis, which is a great soil amendment [47]. However, the biochar amended soilless media C:N exhibited an increased ratio with increasing percent biochar and ranged from 106–137. This indicates that N immobilization would dominate before mineralization [6,48]. Nitrate retention significantly increased with an increasing biochar percentage and concurred with findings in [49]. Nitrate has been reported to be minimally sorbed by biochar [50]. The sorption increases with pyrolysis temperature, which generally causes losses of aliphatic structures and gives rise to mostly poly-condensed aromatic [50,51].

4.2. Amendment of Soilless Media with Biochar Influences Organic Carbon Composition and Thermal Stability

This study demonstrates that soilless media exhibited O-alkyl-C dominance, a labile form of C [21,52]. This was further supported by the high R400 index (above 0.5), which exhibits the dominance of LTSC [21,41,53]. The biochar was dominated by aromatic C, which is considered a stable form of C [21,53]. It was evident that the biochar used in this study exhibited dominance of aromatic-C; in the previous studies, aromatic C has been attributed to the presence of a more significant amount of lignin in plant-derived feedstock biochar due to high poly-condensed aromatic moieties [23,54]. Notably, the C and HTSC increased, but the R400 index decreased with increasing biochar percentage in the biochar-amended soilless media. This is consistent with previous findings that preserved OM samples are reported to record high R400 values while degraded OM records low R400 values [39]. However, it was evident from the results of this study that the amendment of soilless media with biochar still resulted in the dominance of O-alkyl-C and LTSC because of the relatively higher proportion of the soilless media compared to biochar in the biochar-amended soilless media. Previous studies indicate that the dominant peaks shown within the 300–320 °C (Figure 2) were caused by the biological thermal labile compounds [44,55]. Furthermore, the major components of woody tissue, cellulose and or lignin, are reported to be attributed to the media peaks generated between the 360–370 °C of the MESTA analysis [44] (Figure 2).
However, even with the dominance of O-alkyl-C and LTSC in the biochar-amended soilless media, it was evident that there was an alteration of C content, organic C composition, and decreasing R400 index with increasing biochar percentage. This is consistent with recent literature that indicates that media quality indicators such as C content and stability exhibited improvement when amended with biochar [6,46,56,57]. This was further supported by [58], who argued that biochar characteristics could influence the organic C composition of biochar-amended media.
It was also evident that carboxyl-C, phenolic-C, and aromatic-C increased with an increasing biochar percentage. Carboxyl-C, phenolic-C, and aromatic-C are classified as stable C because of their complex structures [21,53,59,60].

4.3. Organic Carbon Composition and Thermal Stability Influence Nitrate Retention

It was evident that increasing biochar percentage resulted in increased carboxyl-C, phenolic-C, and aromatic-C, which are considered stable forms of C [6,61], which could undergo physiochemical disintegration into the formation of organic and inorganic composites with media biochar amendment particles. This formation has been ascribed to its ability to adsorb complex and fix inorganic ions and compounds [62]. It is reported that [63] accumulation of aromatic-C in soil amended with biochar exhibited high formation of NO3 activity, a scenario that could be attributed to the increased NO3 with increased stable C. The process of adsorption of nutrients to minerals and organic matter is a major way by which nutrients are retained and made available to plants [6,64]. This is an indication that biochar slowly releases N dominated with NO3 [65,66]. Aromatic-C has been reported to increase nutrients and water retention in biochar micropores, decreasing the leaching of NO3 and thereby leading to greater utilization of available NO3 by tomato plants [50,51].
The ability of biochar-amended soilless media to retain cation in exchangeable form for plant availability in proportion with the amount of media OM due to biochar organic C composition [6,64] is consistent with the findings of this study. Because of its greater surface area, greater negative surface charge, and greater charge density [6,67], biochar-amended soilless growth media has a more remarkable ability to adsorb cations per unit C than other OM media to retain NO3 [68]. The increase of NO3 with an increasing percentage of biochar amendments in this study implied that N leaching was reduced due to biochar’s large surface area and carboxylic functional groups [69], thereby sustaining nutrient (NO3) retention.

4.4. Enhanced Nitrate Retention Improves Tomatoes Yield

It was evident that increasing NO3 was consistent with increasing tomato yield, implying that tomato plants could access the available retained NO3. The unique characteristics of biochar to retain exchangeable nutrients (NO3) for plant intake availability offer the possibility for crop yield improvement while minimizing environmental pollution by reducing nutrient leaching [6,64]. The relationship between increasing tomato yields with increasing NO3 could be a function of N reduction through denitrification, which may lead to greater uptake of N (NO3) by tomato plants grown in the presence of biochar [50]. Media biochar amendments in both greenhouse [70,71] and field [72,73,74,75] studies have been reported to improve crop growth and yield [76]. The above could have resulted because media fertility improvement could happen either by enhanced nutrient supply or an increased nutrient use efficiency [77] through enhanced N supply due to reduced nutrient leaching [6,72,76,77,78].

5. Conclusions

Biochar-amended soilless media exhibited dominance of O-alkyl-C; however, C, aromatic-C, phenolic-C, and carboxyl-C increased, and R400 decreased with increasing biochar percentage. This demonstrates that increased biochar increases C content and increases C stability. It was clear that NO3 concentration related positively with the biochar-amended soilless media aromatic-C, phenolic-C, and carboxyl-C, indicating that these forms of stable C enhanced NO3 retention. In addition, the NO3 retention exhibited a positive relationship with tomato yield. This indicates that the amendment of soilless media with biochar enhanced the accumulation of more stable C in the form of aromatic-C, phenolic-C, and carboxyl-C and decreased the R400 index. However, the stable form of C enhanced NO3 retention, potentially reducing NO3 leaching, which promoted tomato production and had the potential to mitigate N eutrophication.

Author Contributions

Conceptualization, L.W.N., A.B. and G.K.O.; Methodology, L.W.N., A.B., C.J., G.K.O. and R.F.; Validation, L.W.N. and G.K.O.; Formal analysis, G.K.O., C.J., B.M. and R.F.; Investigation, L.W.N., M.D.A., A.B. and G.K.O.; Writing—original draft, G.K.O.; Writing—review and editing, L.W.N., M.D.A., A.B., C.J., M.A.O., B.M. and R.F.; Supervision, L.W.N., M.D.A. and M.A.O.; Funding acquisition, L.W.N. and A.B. All authors have read and agreed to the published version of the manuscript.

Funding

The work was funded by the U.S. Department of Agriculture (USDA) through the 1890 Land-Grant College Program (CBG), grant No. 2014-38821-22403. Additional funding for the research was provided by the USDA Forest Service grant 19 -CA-11330140-069. A portion of this work was performed at the National High Magnetic Field Laboratory, which is supported by National Science Foundation Cooperative Agreement No. DMR-1644779 and DMR-2128556 and the State of Florida.

Institutional Review Board Statement

Not applicable.

Data Availability Statement

The raw data supporting the conclusions of this article will be made available by the authors on request.

Acknowledgments

Fanny E. Ospina is greatly appreciated for assisting with fieldwork. Djanan Nemours is posthumously acknowledged and appreciated for assisting with laboratory analysis.

Conflicts of Interest

The authors declare no competing financial interests.

References

  1. Leghari, S.J.; Wahocho, N.A.; Laghari, G.M.; HafeezLaghari, A.; MustafaBhabhan, G.; HussainTalpur, K.; Bhutto, T.A.; Wahocho, S.A.; Lashari, A.A. Role of nitrogen for plant growth and development: A review. Adv. Environ. Biol. 2016, 10, 209–219. [Google Scholar]
  2. Zhang, A.; Bian, R.; Hussain, Q.; Li, L.; Pan, G.; Zheng, J.; Zheng, J. Change in net global warming potential of a rice–wheat cropping system with biochar soil amendment in a rice paddy from China. Agric. Ecosyst. Environ. 2013, 173, 37–45. [Google Scholar] [CrossRef]
  3. Cao, P.; Lu, C.C.; Yu, Z. Historical nitrogen fertilizer used in agricultural ecosystems of the contiguous United States during 1850–2015: Application rate, timing, and fertilizer types. Earth Syst. Sci. Data Discuss. 2018, 10, 969. [Google Scholar] [CrossRef]
  4. Follett, J.R.; Follett, R.F.; Herz, W.C. Environmental and human impacts of reactive nitrogen. In Advances in Nitrogen Management for Water Quality; Soil and Water Conservation Society: Ankeny, IA, USA, 2010; pp. 1–37. [Google Scholar]
  5. Erisman, J.W.; Sutton, M.A.; Galloway, J.; Klimont, Z.; Winiwarter, W. How a century of ammonia synthesis changed the world. Nat. Geosci. 2008, 1, 636. [Google Scholar] [CrossRef]
  6. Osei, G.K. Influence of Biochar Carbon Composition and Thermal Stability on Nitrogen Retention, Microbial Diversity and Radionuclides in Soilless Growth Media. Ph.D. Thesis, Agricultural and Mechanical University, Tallahassee, FL, USA, 2021. [Google Scholar]
  7. Ohyama, T. Nitrogen as a Major Essential Element of Plants. Nitrogen. Assim. Plants 2021, 37, 2–17. [Google Scholar]
  8. Benbi, D.K.; Richter, J. A critical review of some approaches to modelling nitrogen mineralization. Biol. Fertil. Soils 2002, 35, 168–183. [Google Scholar] [CrossRef]
  9. Aczel, M.R. What is the nitrogen cycle, and why is it key to life? Front. Young Minds 2019, 7, 14. [Google Scholar] [CrossRef]
  10. Ribaudo, M. Reducing agriculture’s nitrogen footprint: Are new policy approaches needed? Amber Waves Econ. Food Farming Nat. Resour. Rural. Am. 2011, 9, 34–39. [Google Scholar]
  11. Basso, B.; Shuai, G.; Zhang, J.; Robertson, G.P. Yield stability analysis reveals sources of large-scale nitrogen loss from the US Midwest. Sci. Rep. 2019, 9, 5774. [Google Scholar] [CrossRef]
  12. De Notaris, C.; Rasmussen, J.; Sørensen, P.; Olesen, J.E. Nitrogen leaching: A crop rotation perspective on the effect of N surplus, field management and use of catch crops. Agric. Ecosyst. Environ. 2018, 255, 1–11. [Google Scholar] [CrossRef]
  13. Chislock, M.F.; Doster, E.; Zitomer, R.A.; Wilson, A.E. Eutrophication: Causes, consequences, and controls in aquatic ecosystems. Nat. Educ. Knowl. 2013, 4, 10. [Google Scholar]
  14. Withers, P.J.; Neal, C.; Jarvie, H.P.; Doody, D.G. Agriculture and eutrophication: Where do we go from here? Sustainability 2014, 6, 5853–5875. [Google Scholar] [CrossRef]
  15. Yao, Y.; Gao, B.; Zhang, M.; Inyang, M.; Zimmerman, A.R. Effect of biochar amendment on sorption and leaching of nitrate, ammonium, and phosphate in a sandy soil. Chemosphere 2012, 89, 1467–1471. [Google Scholar] [CrossRef]
  16. Huang, L.; Gu, M. Effects of Biochar on Container Substrate Properties and Growth of Plants—A Review. Horticulturae 2019, 5, 14. [Google Scholar] [CrossRef]
  17. Méndez, A.; Cárdenas-Aguiar, E.; Paz-Ferreiro, J.; Plaza, C.; Gascó, G. The effect of sewage sludge biochar on peat-based growing media. Biol. Agric. Hortic. 2017, 33, 40–51. [Google Scholar] [CrossRef]
  18. Barrett, G.E.; Alexander, P.D.; Robinson, J.S.; Bragg, N.C. Achieving environmentally sustainable growing media for soilless plant cultivation systems–A review. Sci. Hortic. 2016, 212, 220–234. [Google Scholar] [CrossRef]
  19. Savvas, D.; Gianquinto, G.; Tuzel, Y.; Gruda, N. Soilless culture. In Good Agricultural Practices for Greenhouse Vegetable Crops. Principles for Mediterranean Climate Areas; FAO: Rome, Italy, 2013; pp. 303–354. [Google Scholar]
  20. Rezaei-Nejad, A.; Ismaili, A. Changes in growth, essential oil yield and composition of geranium (Pelargonium graveolens L.) as affected by growing media. J. Sci. Food Agric. 2014, 94, 905–910. [Google Scholar] [CrossRef]
  21. Ngatia, L.W.; Hsieh, Y.P.; Nemours, D.; Fu, R.; Taylor, R.W. Potential phosphorus eutrophication mitigation strategy: Biochar carbon composition, thermal stability and pH influence phosphorus sorption. Chemosphere 2017, 180, 201–211. [Google Scholar] [CrossRef]
  22. Prasad, M.; Tzortzakis, N.; McDaniel, N. Chemical characterization of biochar and assessment of the nutrient dynamics by means of preliminary plant growth tests. J. Environ. Manag. 2018, 216, 89–95. [Google Scholar] [CrossRef]
  23. Lehmann, J.; Joseph, S. (Eds.) Biochar for Environmental Management: Science, Technology and Implementation; Routledge: Oxfordshire, UK, 2015. [Google Scholar]
  24. Solaiman, Z.M.; Murphy, D.V.; Abbott, L.K. Biochars influence seed germination and early growth of seedlings. Plant Soil 2012, 353, 273–287. [Google Scholar] [CrossRef]
  25. Sun, L.; Li, L.; Chen, Z.; Wang, J.; Xiong, Z. Combined effects of nitrogen deposition and biochar application on emissions of N2O, CO2 and NH3 from agricultural and forest soils. Soil. Sci. Plant Nutr. 2014, 60, 254–265. [Google Scholar] [CrossRef]
  26. Ronsse, F.; Van Hecke, S.; Dickinson, D.; Prins, W. Production and characterization of slow pyrolysis biochar: Influence of feedstock type and pyrolysis conditions. Gcb Bioenergy 2013, 5, 104–115. [Google Scholar] [CrossRef]
  27. Karami, N.; Clemente, R.; Moreno-Jiménez, E.; Lepp, N.W.; Beesley, L. Efficiency of green waste compost and biochar soil amendments for reducing lead and copper mobility and uptake to ryegrass. J. Hazard. Mater. 2011, 191, 41–48. [Google Scholar] [CrossRef]
  28. Sohi, S.P.; Krull, E.; Lopez-Capel, E.; Bol, R. A review of biochar and its use and function in soil. In Advances in Agronomy; Academic Press: Cambridge, MA, USA, 2010; Volume 105, pp. 47–82. [Google Scholar]
  29. Brassard, P.; Godbout, S.; Raghavan, V. Soil biochar amendment as a climate change mitigation tool: Key parameters and mechanisms involved. J. Environ. Manag. 2016, 181, 484–497. [Google Scholar] [CrossRef]
  30. Windeatt, J.H.; Ross, A.B.; Williams, P.T.; Forster, P.M.; Nahil, M.A.; Singh, S. Characteristics of biochars from crop residues: Potential for carbon sequestration and soil amendment. J. Environ. Manag. 2014, 146, 189–197. [Google Scholar] [CrossRef]
  31. Konare, H.; Yost, R.S.; Doumbia, M.; McCarty, G.W.; Jarju, A.; Kablan, R. Loss on ignition: Measuring soil organic carbon in soils of the Sahel, West Africa. Afr. J. Agric. Res. 2010, 5, 3088–3095. [Google Scholar]
  32. Beck, D.A.; Johnson, G.R.; Spolek, G.A. Amending green roof soil with biochar to affect runoff water quantity and quality. Environ. Pollut. 2011, 159, 2111–2118. [Google Scholar] [CrossRef]
  33. Graber, E.R.; Harel, Y.M.; Kolton, M.; Cytryn, E.; Silber, A.; David, D.R.; Tsechansky, L.; Borenshtein, M.; Elad, Y. Biochar impact on development and productivity of pepper and tomato grown in fertigated soilless media. Plant Soil 2010, 337, 481–496. [Google Scholar] [CrossRef]
  34. Chan, K.Y.; Van Zwieten, L.; Meszaros, I.; Downie, A.; Joseph, S. Agronomic values of greenwaste biochar as a soil amendment. Soil Res. 2008, 45, 629–634. [Google Scholar] [CrossRef]
  35. Steiner, C.; Teixeira, W.G.; Lehmann, J.; Nehls, T.; de Macêdo, J.L.V.; Blum, W.E.; Zech, W. Long term effects of manure, charcoal and mineral fertilization on crop production and fertility on a highly weathered Central Amazonian upland soil. Plant Soil 2007, 291, 275–290. [Google Scholar] [CrossRef]
  36. Dumroese, R.K.; Heiskanen, J.; Englund, K.; Tervahauta, A. Pelleted biochar: Chemical and physical properties show potential use as a substrate in container nurseries. Biomass Bioenergy 2011, 35, 2018–2027. [Google Scholar] [CrossRef]
  37. Hatfield, G.R.; Maciel, G.E.; Erbatur, O.; Erbatur, G. Qualitative and quantitative analysis of solid lignin samples by carbon-13 nuclear magnetic resonance spectrometry. Anal. Chem. 1987, 59, 172–179. [Google Scholar] [CrossRef]
  38. Espina, R.; Yu, L.; Wang, J.; Tong, Z.; Vashishtha, S.; Talaat, R.; Scatina, J.; Mutlib, A. Nuclear magnetic resonance spectroscopy as a quantitative tool to determine the concentrations of biologically produced metabolites: Implications in metabolites in safety testing. Chem. Res. Toxicol. 2009, 22, 299–310. [Google Scholar] [CrossRef]
  39. Cody, G.D.; Alexander, C.O.D.; Tera, F. Solid-state (1H and 13C) nuclear magnetic resonance spectroscopy of insoluble organic residue in the Murchison meteorite: A self-consistent quantitative analysis. Geochim. Cosmochim. Acta 2002, 66, 1851–1865. [Google Scholar] [CrossRef]
  40. Hsieh, Y.P. A novel multi elemental scanning thermal analysis (MESTA) method for the identification and characterization of solid substances. J. AOAC Int. 2007, 90, 54–59. [Google Scholar]
  41. Disnar, J.R.; Jacob, J.; Morched-Issa, M.; Lottier, N.; Arnaud, F. Assessment of peat quality by molecular and bulk geochemical analysis: Application to the Holocene record of the Chautagne marsh (Haute Savoie, France). Chem. Geol. 2008, 254, 101–112. [Google Scholar] [CrossRef]
  42. Rajkovich, S.; Enders, A.; Hanley, K.; Hyland, C.; Zimmerman, A.R.; Lehmann, J. Corn growth and nitrogen nutrition after additions of biochars with varying properties to a temperate soil. Biol. Fertil. Soils 2012, 48, 271–284. [Google Scholar] [CrossRef]
  43. Knicker, H. Solid state CPMAS 13C and 15N NMR spectroscopy in organic geochemistry and how spin dynamics can either aggravate or improve spectra interpretation. Org. Geochem. 2011, 42, 867–890. [Google Scholar] [CrossRef]
  44. Disnar, J.R.; Guillet, B.; Kéravis, D.; Di-Giovanni, C.; Sebag, D. Soil organic matter (SOM) characterization by Rock-Eval pyrolysis: Scope and limitations. Org. Geochem. 2003, 34, 327–343. [Google Scholar] [CrossRef]
  45. Al-Rumaihi, A.; Shahbaz, M.; Mckay, G.; Mackey, H.; Al-Ansari, T. A review of pyrolysis technologies and feedstock: A blending approach for plastic and biomass towards optimum biochar yield. Renew. Sustain. Energy Rev. 2022, 167, 112715. [Google Scholar] [CrossRef]
  46. Oladele, S.O. Changes in physicochemical properties and quality index of an Alfisol after three years of rice husk biochar amendment in rainfed rice–Maize cropping sequence. Geoderma 2019, 353, 359–371. [Google Scholar] [CrossRef]
  47. Alvarez, J.M.; Pasian, C.; Lal, R.; Lopez, R.; Dıaz, M.J.; Fernandez, M. Morpho-physiological plant quality when biochar and vermicompost are used as growing media replacement in urban horticulture. Urban For. Urban Green. 2018, 34, 175–180. [Google Scholar] [CrossRef]
  48. Blok, C.; Van der Salm, C.; Hofland-Zijlstra, J.; Streminska, M.; Eveleens, B.; Regelink, I.; Fryda, L.; Visser, R. Biochar for Horticultural Rooting Media Improvement: Evaluation of Biochar from Gasification and Slow Pyrolysis. Agronomy 2017, 7, 6. [Google Scholar] [CrossRef]
  49. Dong, D.; Feng, Q.; Mcgrouther, K.; Yang, M.; Wang, H.; Wu, W. Effects of biochar amendment on rice growth and nitrogen retention in a waterlogged paddy field. J. Soils Sediments 2015, 15, 153–162. [Google Scholar] [CrossRef]
  50. Ippolito, J.A.; Laird, D.A.; Busscher, W.J. Environmental benefits of biochar. J. Environ. Qual. 2012, 41, 967–972. [Google Scholar] [CrossRef]
  51. Novak, J.M.; Lima, I.; Xing, B.; Gaskin, J.W.; Steiner, C.; Das, K.C.; Schomberg, H. Characterization of designer biochar produced at different temperatures and their effects on a loamy sand. Ann. Environ. Sci. 2009, 3, 195–206. [Google Scholar]
  52. Spielvogel, S.; Prietzel, J.; Kögel-Knabner, I. Soil organic matter stabilization in acidic forest soils is preferential and soil type-specific. Eur. J. Soil Sci. 2008, 59, 674–692. [Google Scholar] [CrossRef]
  53. Haumaier, L.; Zech, W. Black carbon—Possible source of highly aromatic components of soil humic acids. Org. Geochem. 1995, 23, 191–196. [Google Scholar] [CrossRef]
  54. Novak, J.M.; Busscher, W.J.; Laird, D.L.; Ahmedna, M.; Watts, D.W.; Niandou, M.A. Impact of biochar amendment on fertility of a southeastern coastal plain soil. Soil Sci. 2009, 174, 105–112. [Google Scholar] [CrossRef]
  55. Jocteur Monrozier, L.; Robin, A.M. Action de la faune du sol sur une litière de feuillu: Application de techniques pyrolytiques à l’étude des modifications subies par les feuilles de charme (Carpinus betulus) ingérées par Glomeris marginata. Rev. D’ecologie Biol. Sol. 1988, 25, 203–214. [Google Scholar]
  56. Schulz, H.; Dunst, G.; Glaser, B. No effect level of co-composted biochar on plant growth and soil properties in a greenhouse experiment. Agronomy 2014, 4, 34–51. [Google Scholar] [CrossRef]
  57. Laird, D.; Fleming, P.; Wang, B.; Horton, R.; Karlen, D. Biochar impact on nutrient leaching from a Midwestern agricultural soil. Geoderma 2010, 158, 436–442. [Google Scholar] [CrossRef]
  58. Lehmann, J.; Rillig, M.C.; Thies, J.; Masiello, C.A.; Hockaday, W.C.; Crowley, D. Biochar effects on soil biota–a review. Soil. Biol. Biochem. 2011, 43, 1812–1836. [Google Scholar] [CrossRef]
  59. Zhang, Y.; Liu, S.; Cheng, Y.; Cai, Z.; Müller, C.; Zhang, J. Composition of soil recalcitrant C regulates nitrification rates in acidic soils. Geoderma 2019, 337, 965–972. [Google Scholar] [CrossRef]
  60. Bonanomi, G.; Ippolito, F.; Cesarano, G.; Nanni, B.; Lombardi, N.; Rita, A.; Saracino, A.; Scala, F. Biochar as plant growth promoter: Better off alone or mixed with organic amendments? Front. Plant Sci. 2017, 8, 1570. [Google Scholar] [CrossRef]
  61. Wang, D.; Zhang, W.; Hao, X.; Zhou, D. Transport of biochar particles in saturated granular media: Effects of pyrolysis temperature and particle size. Environ. Sci. Technol. 2013, 47, 821–828. [Google Scholar] [CrossRef]
  62. Doerr, S.H.; Shakesby, R.A.; Walsh, R. Soil water repellency: Its causes, characteristics and hydro-geomorphological significance. Earth-Sci. Rev. 2000, 51, 33–65. [Google Scholar] [CrossRef]
  63. Archanjo, B.S.; Mendoza, M.E.; Albu, M.; Mitchell, D.R.; Hagemann, N.; Mayrhofer, C.; Anh Mai, T.L.; Weng, Z.; Kappler, A.; Behrens, S.; et al. Nanoscale analyses of the surface structure and composition of biochars extracted from field trials or after co-composting using advanced analytical electron microscopy. Geoderma 2017, 294, 70–79. [Google Scholar] [CrossRef]
  64. Lehmann, J. A handful of carbon. Nature 2007, 447, 143–144. [Google Scholar] [CrossRef]
  65. Hagemann, N.; Kammann, C.I.; Schmidt, H.P.; Kappler, A.; Behrens, S. Nitrate capture and slow release in biochar amended compost and soil. PLoS ONE 2017, 12, e0171214. [Google Scholar] [CrossRef]
  66. Kammann, C.I.; Schmidt, H.P.; Messerschmidt, N.; Linsel, S.; Steffens, D.; Müller, C.; Koyro, H.W.; Conte, P.; Joseph, S. Erratum: Plant growth improvement mediated by nitrate capture in co-composted biochar. Sci. Rep. 2015, 5, 12378. [Google Scholar] [CrossRef]
  67. Liang, B.; Lehmann, J.; Solomon, D.; Kinyangi, J.; Grossman, J.; O’neill, B.; Skjemstad, J.O.; Thies, J.; Luizão, F.J.; Petersen, J.; et al. Black carbon increases cation exchange capacity in soils. Soil. Sci. Soc. Am. J. 2006, 70, 1719–1730. [Google Scholar] [CrossRef]
  68. Sombroek, W.I.M.; Ruivo, M.D.L.; Fearnside, P.M.; Glaser, B.; Lehmann, J. Amazonian dark earths as carbon stores and sinks. In Amazonian Dark Earths; Springer: Dordrecht, The Netherlands, 2003; pp. 125–139. [Google Scholar]
  69. Cheng, C.H.; Lehmann, J.; Thies, J.E.; Burton, S.D.; Engelhard, M.H. Oxidation of black carbon by biotic and abiotic processes. Org. Geochem. 2006, 37, 1477–1488. [Google Scholar] [CrossRef]
  70. Haider, G.; Koyro, H.W.; Azam, F.; Steffens, D.; Müller, C.; Kammann, C. Biochar but not humic acid product amendment affected maize yields via improving plant-soil moisture relations. Plant Soil. 2015, 395, 141–157. [Google Scholar] [CrossRef]
  71. Akhtar, S.S.; Li, G.; Andersen, M.N.; Liu, F. Biochar enhances yield and quality of tomato under reduced irrigation. Agric. Water Manag. 2014, 138, 37–44. [Google Scholar] [CrossRef]
  72. Agegnehu, G.; Bass, A.M.; Nelson, P.N.; Bird, M.I. Benefits of biochar, compost and biochar–compost for soil quality, maize yield and greenhouse gas emissions in a tropical agricultural soil. Sci. Total Environ. 2016, 543, 295–306. [Google Scholar] [CrossRef]
  73. Agegnehu, G.; Nelson, P.N.; Bird, M.I. The effects of biochar, compost and their mixture and nitrogen fertilizer on yield and nitrogen use efficiency of barley grown on a Nitisol in the highlands of Ethiopia. Sci. Total Environ. 2016, 569, 869–879. [Google Scholar] [CrossRef]
  74. Agegnehu, G.; Nelson, P.N.; Bird, M.I. Crop yield, plant nutrient uptake and soil physicochemical properties under organic soil amendments and nitrogen fertilization on Nitisols. Soil Tillage Res. 2016, 160, 1–13. [Google Scholar] [CrossRef]
  75. Glaser, B.; Wiedner, K.; Seelig, S.; Schmidt, H.P.; Gerber, H. Biochar organic fertilizers from natural resources as substitute for mineral fertilizers. Agron Sustain. Dev. 2015, 35, 667–678. [Google Scholar] [CrossRef]
  76. Haider, G.; Steffens, D.; Moser, G.; Müller, C.; Kammann, C.I. Biochar reduced nitrate leaching and improved soil moisture content without yield improvements in a four-year field study. Agric. Ecosyst. Environ. 2017, 237, 80–94. [Google Scholar] [CrossRef]
  77. Kammann, C.I.; Linsel, S.; Gößling, J.W.; Koyro, H.W. Influence of biochar on drought tolerance of Chenopodium quinoa Willd and on soil–plant relations. Plant Soil 2011, 345, 195–210. [Google Scholar] [CrossRef]
  78. Zhang, D.; Pan, G.; Wu, G.; Kibue, G.W.; Li, L.; Zhang, X.; Zheng, J.; Zheng, J.; Cheng, K.; Joseph, S.; et al. Biochar helps enhance maize productivity and reduce greenhouse gas emissions under balanced fertilization in a rainfed low fertility inceptisol. Chemosphere 2016, 142, 106–113. [Google Scholar] [CrossRef] [PubMed]
Figure 1. Solid State 13C NMR organic carbon composition determination for media with % biochar amendment. BB = biochar only, CC = coir only, and PB = fine pine bark only.
Agriculture 15 00865 g001
Figure 2. Carbon thermogram for biochar % amendments of growth media determined by multielement scanning thermal analysis (MESTA).
Agriculture 15 00865 g002
Figure 3. Samples R400 relationships with (a) total C, (b) carboxyl-C, (c) phenolic-C, (d) aromatic-C, and (e) aromatic: O-alkyl ratio.
Agriculture 15 00865 g003
Figure 4. Samples of organic carbon composition relationships with NO3: (a) total C vs. NO3, (b) carboxyl-C vs. NO3, (c) phenolic vs. NO3, (d) aromatic-C vs. NO3, and (e) aromatic: O-alkyl ratio vs. NO3.
Agriculture 15 00865 g004
Figure 5. Bar chart of biochar % amendments with growth media vs. tomatoes yield (g). Letters on bars indicate significance difference between biochar % amendments and tomato yield.
Agriculture 15 00865 g005
Figure 6. Organic carbon composition relationships with tomatoes yield: (a) total C vs. tomatoes, (b) carboxyl-C vs. tomatoes, (c) phenolic-C vs. tomatoes, (d) aromatic-C vs. tomatoes, and (e) aromatic: O-alkyl ratio vs. tomatoes.
Agriculture 15 00865 g006
Figure 7. Samples R400 relationship with (a) NO3, (b) tomatoes yield, and (c) NO3 tomatoes yield and tomatoes yield.
Agriculture 15 00865 g007
Table 1. Samples pH, loss on ignition (LOI), and nutrients data. Data indicate mean ± SEM (standard error of mean) for % amendments. Different superscript letters accompanying figures indicate Tukey HSD significance difference between means of biochar % amendment to growth media.
BiocharpHLOI (%)NH4+ (mg kg−1)NO3 (mg kg−1)N (g kg−1)C (g kg−1)C:N
0%6.15 ± 0.03 d90.55 ± 0.90 a14.73 ± 2.73 a120.16 ± 16.57 bc4.17 ± 0.07 a443.67 ± 3.03 c106.51 ± 0.77 b
1%6.02 ± 0.01 d90.58 ± 0.95 a16.87 ± 1.35 a113.30 ± 10.01 c3.60 ± 0.10 ab447.80 ± 7.61 bc124.53 ± 1.35 ab
2%6.03 ± 0.06 d91.27 ± 0.41 a17.33 ± 1.12 a97.51 ± 25.24 c3.33 ± 0.09 b443.03 ± 4.08 c133.11 ± 1.49 a
3%6.23 ± 0.09 d90.47 ± 0.16 a21.12 ± 1.30 a118.39 ± 12.98 bc3.30 ± 0.00 b454.60 ± 6.55 bc137.76 ± 1.07 a
4%6.47 ± 0.05 bc89.30 ± 1.20 a19.71 ± 3.23 a140.86 ± 11.01 abc3.63 ± 0.03 ab470.17 ± 4.83 abc129.45 ± 1.20 ab
6%6.46 ± 0.02 c90.21 ± 0.44 a16.16 ± 1.20 a101.23 ± 17.95 c3.30 ± 0.15 b459.97 ± 22.71 bc139.39 ± 1.21 a
8%6.68 ± 0.02 ab90.18 ± 0.40 a17.20 ± 2.19 a123.36 ± 17.55 bc3.53 ± 0.26 ab478.40 ± 6.48 abc136.68 ± 2.27 a
10%6.76 ± 0.01 a88.69 ± 1.09 a14.30 ± 1.46 a176.01 ± 2.37 a3.60 ± 0.17 ab492.43 ± 8.69 ab137.31 ± 1.85 a
12%6.84 ± 0.02 a90.85 ± 0.91 a12.71 ± 0.43 a162.65 ± 21.20 ab3.80 ± 0.11 ab514.47 ± 8.07 a135.76 ± 1.89 a
p value<0.00010.46180.10780.03860.00440.00060.0024
Table 2. Carbon functional groups (g kg−1) data indicating % biochar amendments of growth media.
BiocharCarboxyl Phenolic Aromatic O-Alkyl Methoxyl Alkyl Alkyl:O-AlkylAromatic: O-Alkyl
0%14.8932.1767.76267.8727.1233.860.130.25
1%17.4839.8267.96250.5130.8141.220.160.27
2%14.5834.7265.66258.7230.3239.040.150.25
3%27.7242.3273.98256.0924.3830.110.120.29
4%23.0642.4078.04260.2230.1036.350.140.30
6%20.5942.2473.88247.9631.9343.380.170.30
8%25.4048.3482.16256.7530.9734.790.140.32
10%26.3853.3492.60253.0830.6836.360.140.37
12%38.2956.1195.59261.6328.4734.380.130.37
Table 3. Biochar % amendments growth media carbon low and high thermal stability (LTSC), (HTSC) (g kg−1) and “R400 index” data.
BiocharLTSC (g kg−1)HTSC (g kg−1)R400
0%268.65175.020.61
1%311.72136.080.70
2%290.09152.940.65
3%306.68147.920.67
4%303.81166.360.65
6%283.71176.260.62
8%285.47192.930.60
10%291.06201.370.59
12%255.74258.730.50
Disclaimer/Publisher’s Note: The statements, opinions and data contained in all publications are solely those of the individual author(s) and contributor(s) and not of MDPI and/or the editor(s). MDPI and/or the editor(s) disclaim responsibility for any injury to people or property resulting from any ideas, methods, instructions or products referred to in the content.

