Article

Impact of Peas (Pisum Sativum L.) as a Sustainable Source of Protein in Growing Pigs’ Diets on Production Efficiency, Nitrogen Metabolism and Gastrointestinal Tract Health

by
Tatiana Dumitra Panaite
1,*,
Gabriela Maria Cornescu
1,
Elvira Gagniuc
2,3,
Ana Elena Cismileanu
1,
Claudiu Gal
3,
Mihaela Dumitru
4 and
Smaranda Mariana Toma
4
1
Laboratory of Animal Nutrition Physiology, National Research-Development Institute for Animal Biology and Nutrition, 1 Calea Bucuresti, 077015 Balotesti, Romania
2
Department of Pathology and Forensic Medicine, University of Agronomic Sciences and Veterinary Medicine of Bucharest, 011464 Bucharest, Romania
3
Synevovet Laboratory, 021408 Bucharest, Romania
4
Laboratory of Animal Nutrition and Biotechnology, National Research-Development Institute for Animal Biology and Nutrition, 1 Calea Bucuresti, 077015 Balotesti, Romania
*
Author to whom correspondence should be addressed.
Agriculture 2025, 15(8), 897; https://doi.org/10.3390/agriculture15080897
Submission received: 13 March 2025 / Revised: 16 April 2025 / Accepted: 17 April 2025 / Published: 20 April 2025

Abstract

:
This pilot study evaluated the effects of dietary pea inclusion as a sustainable and nutritional alternative protein source on growth performance, nitrogen balance, digestibility, and intestinal health on nine castrated male Topigs hybrid pigs (three pigs/group), with an initial average weight of 20 ± 2.5 kg, for 45 experimental days. To conduct this digestibility pilot study, the pigs were kept individually in metabolic cages. Three experimental groups were compared: T0 (control), T10 (10% pea inclusion), and T20 (20% pea inclusion). Growth performance parameters, such as the feed conversion ratio (FCR), daily feed intake (DFI), and dry matter intake (DMI), were significantly higher in the T10 and T20 groups compared to T0 (p < 0.05). Nitrogen retention was significantly higher in the T10 group (p = 0.042) compared to the T0 group only. Biochemical markers, such as the total bilirubin (T-Bil) and uric acid (UA) levels, were significantly higher in T20 compared to T0 (p < 0.05). The short-chain fatty acids (SCFAs) increased significantly in the ceca and ilea of the T10 and T20 groups compared to T0, with higher levels of acetic acid (C2) and butyric acid (C4). A positive effect on Lactobacillus populations was observed in both the ileum and cecum in the T10 and T20 groups (p < 0.05). Intestinal morphology analysis revealed that the villus width, villus area, and crypt depth were significantly increased in the jejuna and ilea of both pea-fed groups. The N retention, SCFA concentration, and Lactobacillus population from the ileal and cecal segments showed a strong correlation. These findings suggest that the dietary inclusion of peas positively impacts growth performance, nitrogen retention, and intestinal health, with enhanced microbial populations and improved gut morphology.

1. Introduction

The European Green Deal aims to reduce reliance on imported soybean meal by promoting alternative protein sources in order to meet Europe’s protein feed demand while maintaining high-quality pork meat production [1,2]. In response to environmental concerns, economic pressures, and the rising cost and limited availability of soybean meal, the agricultural sector is progressively shifting to locally produced, low-input legumes—such as beans, lentils, peas, lupins, chickpeas, and faba beans—as sustainable alternative protein sources. However, this shift presents a paradox for the livestock industry: while it supports sustainability goals, the growing use of legumes for direct human consumption could limit their availability for animal feed and potentially raise production costs [3,4,5,6].
Peas (Pisum sativum L.) are a locally available feed ingredient with high amino acid availability and low levels of anti-nutritional factors (ANFs), including hemagglutinins, trypsin and chymotrypsin inhibitors, amylase inhibitors, oxalate, phytic acid, tannins, phenolic acids, and lipoxygenase activity [7]. Applying thermal treatments can further reduce heat-sensitive ANFs, enhance the nutritional value of peas, decrease the need for nitrogenous fertilizers, and lower production costs [8]. Peas are a valuable source of lysine, but they are deficient in sulfur-containing amino acids like cysteine and methionine, along with tryptophan and isoleucine [9]. Their high content of digestible lysine allows for the formulation of a balanced diet with a low protein level, which reduces the level of nitrate excreted and minimizes the environmental pollution [10]. Peas have increasingly gained attention as a sustainable alternative to conventional protein sources, particularly in finisher pigs’ diets, without negatively affecting growth performance when incorporated at optimal levels due to their ability to thrive in various climates, high protein levels, and superior digestibility [11,12,13]. In the literature, different amounts of peas are recommended for dietary inclusion—starter phase (20%), growing and finishing phases (40%), and sows (20%)—and low net energy is usually used when pea-based feeds are formulated [14].
Despite their potential, knowledge gaps remain regarding the effects of pea inclusion in pigs’ diets. For instance, while Wu et al. [15] noted the limited understanding of soluble fiber content and bioactivity of individual polyphenols in peas, Stein [16] observed poor performance in pigs fed field peas without synthetic amino acid supplementation,
Additionally, the impact of pea-based diets on nitrogen metabolism, gut microbiota, and short-chain fatty acid production is not well quantified and requires more in-depth study depending on every pig’s rearing phase.
Identifying locally available alternative protein sources can be a challenging task. In 2020, the NARDI Fundulea Institute, Romania, developed and released a high-yielding pea cultivar (3210 kg/ha), Lavinia F, the first winter pea cultivar that stands out due to its agronomic traits—early maturity, excellent winter hardiness, and adaptability—making it highly suitable for integration into diverse farming systems [17]. Beyond production metrics, studies show peas’ potential to influence nitrogen metabolism and gut health due to their oligosaccharide content [18]. Additionally, recent studies suggest that nitrogen utilization and intestinal health are crucial for achieving optimal nutrient absorption and minimizing nitrogen excretion, which has environmental benefits [19]. Lowering dietary crude protein (CP) reduces nitrogen (N) excretion, while high-fiber diets shift N from urine to feces, enhancing manure retention and reducing emissions. This shift, along with a lower manure pH and increased crusting, helps mitigate ammonia emissions [20].
Peas are rich in protein (21.2–32.9%), starch (40–50%), and fiber (10–20%), with 35–65% amylose, promoting slow digestion, gut health, and satiety. Their fiber (140–260 g/kg) comes from the hull (insoluble) and cotyledon (soluble). Pea starch resists digestion due to its amylose content, intact cell walls, and anti-nutritional factors [21]. Additionally, peas contain oligosaccharides with potential prebiotic effects that reach the colon, where they undergo fermentation and stimulate beneficial gut bacteria [22]. This process leads to the production of short-chain fatty acids (SCFAs), such as acetate, propionate, and butyrate, which contribute to digestion, satiety, immune function, and pathogen inhibition [21].
In human studies, it was found that butyrate represents a key short-chain fatty acid (SCFA) that is vital for colon health, as it serves as the main energy source for colonocytes, supports anti-inflammatory responses, and strengthens the intestinal barrier [23]. Furthermore, SCFAs contribute to gut pH regulation, creating a favorable environment for beneficial bacteria while suppressing the growth of harmful pathogens [24].
The aim of this pilot study was to evaluate the effects of two different inclusion levels of dietary peas (10 and 20%) as an alternative local protein source to soybean meal in order to improve the productive performance, nitrogen metabolism, and gastrointestinal tract health in pigs’ growing phase nutrition.

2. Materials and Methods

2.1. Plant Material Purchases and Chemical Analyses

The peas (variety BELMONDO, semi-tardy with yellow grain, adapted to drought conditions) were obtained from a local producer from the southeast of Romania (Călărași county; 44°19′33.2″ N, 27°19′40.1″ E). Prior to dietary inclusion, the peas were shredded with a universal hammer mill (MCU 7.5 kW) with 1 mm mesh. The peas samples were analyzed using the methods from Regulation (CE) 152/2009 (Methods of sampling and analysis for the official control of feed): dry matter (DM) was determined according to SR ISO 6496:2001, ash was determined using standard SR EN ISO 2171:2010, organic matter (OM) was calculated by the difference between dry matter and ash, crude protein (CP) was determined using SR EN ISO 5983-2:2009, ether extract (EE) was determined following SR ISO 6492:2001, crude fiber (CF) was determined based on standard SR EN ISO 6865:2002), and non-fermentable extractive substances (NESs) were determined according to the standard methods; the in vitro digestibility of crude protein (dCP), in vitro digestibility of dry matter (dDM), and in vitro digestibility of organic matter (dOM) were determined using the method proposed by Boisen and Fernández [25], and the metabolizable energy (ME) of the peas was theoretically calculated using the following equation proposed by Burlacu et al. [26]:
E M   ( k c a l / k g ) = ( 5.01 × %   d i g e s t i b l e   C P + 8.93 × %   d i g e s t i b l e   E E + 3.44 × %   d i g e s t i b l e   C F + 4.08 × %   d i g e s t i b l e   N E S ) × 10

2.2. Ethics, Animals, Housing, and Experimental Diets

The study was conducted at the Laboratory of Animal Nutrition Physiology of the National Research-Development Institute for Animal Biology and Nutrition (INCDBNA-IBNA Balotesti) according to the 3 R’ policy issued stated by the EC Directive 63/2010/EEC, article 4, regarding the animals’ protection regulation for experimental trials purposes. All experimental procedures were in accordance with an internal protocol (no. 4965/September 2023) approved by the members’ Institution Ethics Committee IBNA Balotesti.
The pilot experiment was conducted over 45 days on nine castrated male Topigs hybrid pigs, purchased at an initial average weight of 20 ± 2.5 kg and housed in individual digestibility cages made of galvanized steel (1.2 × 1.5 × 1 m), which allowed for digestibility tests to be performed. According to other researchers, the minimum number of animals suitable for digestibility studies (as a pilot experiment) is three animals per group [27,28]. Each cage was equipped with an individual watering system at the front of the cage, positioned on the left side. A polypropylene feeding trough was also installed at the front of the cage. Before the pigs’ purchase and accommodation, the experimental space and cages were cleaned and disinfected properly using Virkon® S disinfectant (1% solution with 50% pentapotassium active substance). The pigs were kept under controlled environmental conditions and monitored twice daily using the ViperTouch computer system (temperature: 20.57 ± 1.84 °C; humidity: 62.49 ± 4.84%; ventilation: 33.46 ± 0.77 m3/h/pig; carbon dioxide: 1087.79 ± 159.24 ppm; light regimen: 8 h daily with a minimum intensity of 40 lx). All three groups were fed a corn–triticale–soybean meal basal diet as follows: the control treatment (T0, without peas; characterized by 3255.82 kcal/kg ME and 17.5% CP) and two experimental treatments used pea inclusion at different levels: 10% (T10; 3239.58 kcal/kg ME and 17.5% CP) and 20% (T20; 3223.77 kcal/kg ME and 17.5% CP). The ingredients and chemical composition of the treatments are presented in Table 1. All treatment formulations were isocaloric and isonitrogenous, developed using a dedicated software, HYBRIMIN® Futter 2008 (Hybrimin GmbH & Co., Hessisch Oldendorf, Germany), in agreement with the feeding requirements of the Topigs guide [29]. Throughout the experimental period, the pigs had free access to water, and feed was administered twice daily at 9:00 a.m. and 3:00 p.m. During the experimental period (45 days), no soft feces or diarrhea appeared from the pigs, and no medical treatments were added to the feed. At the end of the trial, blood samples were collected for all pigs to determine the plasma protein profile, and finally, the pigs were slaughtered via electrical stunning followed by exsanguination to collect, measure, and assess the biological samples (intestinal content, length of the intestinal segments, and intestinal histomorphology).

2.3. Measurements, Sample Collection, and Procedures

2.3.1. Pig Performances

Every week, the pigs were weighed individually using the electronic animal scale ETW-VA (BOSCHE WÄGETECHNIK, Damme, Germany) to measure their weight and calculate the body weight gain (BWG; kg gain/pig). The feed consumption and leftovers were recorded every day to calculate the average daily feed intake (ADFI; g feed/pig) and feed conversion ratio (FCR; g feed/g gain). The nitrogen ingested (g N/pig/day) was calculated as the product between the feed intake and the concentration of nitrogen per 100 g of feed.

2.3.2. Nitrogen Metabolism

Nitrogen metabolism was determined using the nutritional balance technique. In the last week of the study, the amounts of ingested feed, feces, and urine were quantitatively collected daily (3 days) at a specific period of time (at 08.30–09.30 h), weighed for every cage, and kept in the refrigerator at 4 °C in order to evaluate the nitrogen balance (ingested, excreted, and retained). Samples of feces collected from each animal (approx. 250 g feces/pig) were formed, homogenized, and dried in an oven for 48 h at 65 °C for further nitrogen analyses.
The urine output of the pigs eliminated in 24 h was recorded daily (3 days). A quantity of 90 mL of urine sample from each pig (filtered through gauze to remove impurities), to which 10 mL of H2SO4 25% was added (to reduce the pH and conserve nitrogen), was transferred into a glass container and kept in the refrigerator until further nitrogen analyses.
The nitrogen content in feed and excretions (feces and urine) were determined using the Kjeldahl method, according to Regulation (EC) no. 152/2009 [30] and standard SR EN ISO 5983-2:2009 [31], using an automatic digester (Tecator Digestor 20 Auto Lif, FOSS Analytical, Denmark) at a temperature of 420 °C for 1.5 h. The samples were digested using H2SO4 in the presence of catalyzers, followed by distillation and titration.
The nitrogen balance was calculated by measuring nitrogen intake, nitrogen excretion, and nitrogen retention. The coefficient of total tract apparent digestibility (CTTAD), coefficient of apparent metabolizability (CAM), biological value of protein (BVP), and net protein utilization (NPU) were calculated according to [11,32].
C T T A D = N   i n t a k e   ( g ) f a e c a l   N   o u t p u t   ( g ) N   i n t a k e   ( g )
C A M = N   i n t a k e   ( g ) f a e c a l   N   o u t p u t   ( g ) u r i n a r y   N   o u t p u t   ( g ) N   i n t a k e   ( g )
Nitrogen retention = N intake (DM basis) − N excreta (faecal + urinary)
B V P = N   i n t a k e N   o u t p u t ( f a e c a l   N + u r i n a r y   N ) N   i n t a k e N   f a e c a l × 100
N P U = N   r e t e n t i o n N   i n t a k e × 100
P E R = B o d y   w e i g h t   g a i n   ( g ) P r o t e i n   c o n s u m e d   ( g ) × 100

2.3.3. Blood Sample Collection for Plasma Protein Profile

Blood samples were collected from the jugular vein via venipuncture using 6 mL plain plastic tubes (Vacutest, Arzergrande, Italy) containing lithium heparin as an anticoagulant and kept on ice until they were centrifuged at 4 °C for 10 min at 2500× g using a Multifuge 3L-R (Heraeus, Hanau, Germany). Finally, the resulting plasma was stored in Eppendorf tubes at −20 °C until further analysis. Using a chemistry analyzer (BS-130, Bio-Medical Electronics Co., Shenzhen, China) and commercial kits (Accent-200 MG; Cormay, Wiosenna, Poland), the subsequent plasma parameters of the protein profile were measured: total protein (TP), albumin (ALB), bilirubin (BIL), blood urea nitrogen (BUN), uric acid (UA), and creatinine (CRE).

2.3.4. Measurements and Intestinal Content Analysis

Intestinal Segments and Intestinal Content pH Measurements

At the end of the trial, all pigs were slaughtered via electrical stunning followed by exsanguination according to the principles of animal welfare stated by the EC Directive 63/2010/EEC [33] regarding the animals’ protection in experimental trials. Segments of the digestive tract (duodenum, ileum, and cecum) were removed, and after digesta sampling, they were flushed with water, blotted on filter paper, and weighed using a Kern Precision Electronic Balance with weighing precision of 0.1 g (Kern PCB 1000-1, KERN & SOHN GmbH, Balingen, Germany). After weighing, the intestinal segments were measured to determine their length using a graduated tape ruler (0–100 cm). Before emptying the intestinal contents, 30 min after euthanasia, the pH was measured directly in each segment using a portable pH meter (Five Go F2-Food kit with LE 427IP67, Sensor Metler Tolledo, Greifensee, Switzerland).

Short-Chain Fatty Acid (SCFA) Analysis

From each pig, two fresh samples of ileal (middle 1/3 of the ileum) and cecal contents were collected aseptically and stored in sterile plastic tubes on ice until the analyses of short-chain fatty acids (SCFAs) and intestinal microbiota were performed. The SCFA concentration was quantified using the gas chromatography method. In brief, ileal or cecal samples were mixed with distilled water at a ratio of 1:1.5 (w:v) and then centrifuged at 13,000× g for 15 min. A 1 μL aliquot of the centrifuged extract was injected in split mode into a Varian 430-GC gas chromatograph provided with an Elite-FFAP capillary column: 30 m length, 320 μm inner diameter, and 0.25 μm film thickness, respectively (Perkin Elmer, Springfield, United States). Hydrogen served as the carrier gas, with a flow rate of 1.5 mL/min. The injector was set to 250 °C, with 1:40 split ratio. The flame ionization detector (FID) was maintained at 200 °C; the column oven was set to 110 °C, increasing to 170 °C at a rate of 12 °C/min and then held at this temperature for 9.5 min. The total analysis time was 10 min. Sample concentrations were calculated based on a calibration curve (1 mM, 2 mM, 4 mM, 8 mM, and 10 mM) using a commercial standard mixture of volatile fatty acids (CRM46975, Supelco, Bellefonte, PA, USA); it includes a mix of 9 SCFAs, each 10 mM, but only 6 SCFAs (C2, C3, i-C4, C4, i-C5, and C5) were considered relevant as quantities. The test validation control was a standard solution of 4 mM. Finally, the results were expressed in micromoles per gram of intestinal content, or each SCFA was expressed as the % of total SCFAs. SCFAs were selected for their recognized role in gut health, particularly their involvement in epithelial cell metabolism, mucosal immunity, and gut barrier function. Differences in SCFA concentrations provide insight into the dietary impact of fermentation activity and microbial dynamics in the gastrointestinal tract.

Intestinal Microbiota Assessment

For intestinal microbiota analysis, 10-fold serial dilutions were prepared from 1 g of digesta. The dilutions were mixed with 7.0 mL of Brain Heart Infusion (BHI) broth, supplemented with 2.0 mL of glycerol, and promptly frozen at −20 °C for subsequent analysis [34]. Decimal dilutions were subsequently performed in Phosphate-Buffered Saline (PBS, 1:10, w/v; Oxoid LTD, Basingstoke, United Kingdom). The samples were assessed for lactic acid bacteria (LAB), Enterobacteriaceae, Staphylococcus spp., and Salmonella spp. LAB cultures were cultivated on de Man, Rogosa, and Sharpe agar (MRS; Oxoid CM0361) under anaerobic conditions at 37 °C for 48 h using an Oxoid anaerobic jar with Anaerogen 2.5 L [35]. Each sample was analyzed in triplicate. The final results for microbial counts were expressed as the mean log10 colony-forming units (log10 CFU) per gram.

2.3.5. Intestinal Segments Collected for Histological Analysis

Tissue samples (1 cm segments) were collected from the duodenum (middle portion), jejunum (first portion), and ileum (distal portion) from all pigs and were fixed in 10% buffered formol (pH = 7.0) for 48 h. Between 2 and 4 tissue bands in each analyzed sample, with muscle fibers oriented longitudinally and transversely to the section surface, were processed automatically using the Excelsior As tissue processor (Epredia, Runcorn, United Kingdom), and included in paraffin wax blocks. Sections of 2–3 μm thick were cut, subsequently colored with hematoxylin–eosin (classical coloration) using an automated Gemini AS coloring device (Epredia, Runcorn, UK). Histological preparations were fully scanned using a digital scanner (IntelliSite Ultra Fast Scanner, Philips, the Netherlands). Histological sections were examined and prepared digitally for analysis. Images from the most significant areas, without sectioning artifacts, equivalent to 100×, 200×, and 400× magnifications were chosen for analysis using an optical microscope (Olympus BX43, Tokyo, Japan) equipped with a camera (DP 23 Olympus, Tokyo, Japan) and dedicated software (CS-EN-V3 cellSens ENTRY V3). For each sample, 15 measurements were made for the villus length (VL, µm) and villus width (VW, µm), and the crypt depth (CD, µm). The villous length was measured from the top of the villus to the crypt opening, and the crypt depth was measured from the base of the crypt to its opening. The villus area (length × width) and villus/crypt ratio was further calculated based on the measurements.

2.4. Statistical Analysis

All experimental data (performances, nitrogen balance, protein profile in blood, SCFA intestinal content, intestinal measurements, and morphology) were analyzed using the General Linear Model (GLM) procedures of SAS (Statistical Analysis System, Minitab version 17, SAS Institute Inc., Cary, NC, USA), followed by Tukey’s multiple-range tests, with each pen considered as an experimental unit, according to the following one-way ANOVA model:
Yij = μ + Ti + eij
where Yij is the mean of the jth observation of the ith treatment; μ is the sample mean; Ti is the effect of the ith treatment; and eij is the effect of the error. To evaluate the normality and homogeneity of experimental data, Shapiro–Wilk’s test and Levene’s test were applied.
The graphs for microbiota characterization were statistically generated using GraphPad Prism 10.2.0 software (GraphPad Software, La Jolla, CA USA). Values were determined to be significant when * p < 0.05 or ** p < 0.01.
The GLM program was used for Pearson’s correlation analysis to examine the relationship between performance parameters (ADFI, BW, and FCR), nutrient digestibility (dCP, dEE, and dCF), intestinal microbiota, and the histology of the duodenum and jejunum in the growing pigs across the different dietary groups.

3. Results

3.1. Pisum sativum L. Chemical Composition

The results regarding the chemical composition of the peas are presented in Table 2. The ME value for peas was 15.4 MJ/kg DM. The analyzed samples had a DM content of 90.54% and a digestibility rate of 52.54%. The OM content was determined to be 86.98%, while the digestibility was found to be 54%. The registered value for CP content was 23.90%, with a dCP of 75.09%.

3.2. Growth Performance, Nitrogen Balance, and Digestibility Coefficients

The results for growth performances, daily feed intake, nitrogen balance, nitrogen retained, and digestibility coefficients are presented in Table 3. Significantly different and higher values were registered for the FCR (p = 0.017), DFI (p = 0.018), and DMI (p = 0.018) parameters for the T10 and T20 groups compared to the T0 group. There were no statistically significant differences among all groups with respect to the body weight parameter assessed at 70 and 105 days (BW70d, p = 0.703; BW105d, p = 0.549).
The T10 and T20 groups registered higher N intakes (g/pig/day) compared to T0 group, although there were no statistically significant differences observed (p = 0.176). The same situation occurred for N excretion through feces (p = 0.172) and urine (p = 0.571) (g/pig/day), which showed no statistically significant differences. The N-retained values were significantly higher (p = 0.042) for the T10 group compared to the T0 group, but no statistically significant differences were observed for the T20 group compared to the two other groups.
Regarding the BVP and NPU parameters, we found no statistically significant differences between the groups, indicating a relatively similar efficiency concerning protein utilization (p = 0.865 and p = 0.970, respectively).

3.3. The Protein Profile in Blood Samples

Table 4 presents the effect of pea supplementation with different dietary inclusion rates in growing pigs’ nutrition. From T0 to T20, the T-Bil parameter values progressively rise, with the T20 group exhibiting statistically higher values (p = 0.030) compared to the T0 group.
There were slight variations between the diets, with the highest T-Pro values registered in the T10 group, but without significant differences (p = 0.687). Also, the albumin levels were relatively consistent between diets, with no significant differences (p = 0.826) among groups. The BUN levels showed some fluctuation, peaking at T10, although without statistically significant differences (p = 0.196). For the UA parameter, a statistically significant increased level was observed from T0 to T20 (p = 0.046). The creatinine levels remained stable between all groups, with no evidence for significant differences (p = 0.296).

3.4. Intestinal Content Assessment of Short Chain Fatty Acids

The results concerning the dietary peas effects on the SCFA profile from the cecum and ileum intestinal segments are presented in Table 5.
In the cecal segment, the concentrations of acetic (C2) and butyric (C4) acids were significantly increased in the T10 and T20 groups compared with the T0 group. Also, in the T10 and T20 groups, a slight increase in propionic acid (C3) was observed. Our study found no differences between SCFA production for the T10 and T20 groups. It must be mentioned that the total SCFA production is higher in the T10 and T20 diets vs. the T0 diet (approx. 1.3 times higher), but the proportion of each SCFA (with the exception of C4), both for T10 and T20, is the same as for the T0 diet.
For the ileal segment, the total SCFA amount (µmol/g) is much lower compared to cecal segment for all the groups: T0—8.34 vs. 72.93 in cecum; T10—28.42 vs. 96.74 in cecum; and T20—25.70 vs. 91.60 in cecum. At the same time, it can be observed that the total SCFAs within the groups T10 and T20 are higher compared to the diet T0 (approx. 3 times higher) due to a significant increase in acetic acid. The propionic acid (C3) level was decreased by the diet, and the other SCFAs tended to slightly increase with the diets T10 and T20.

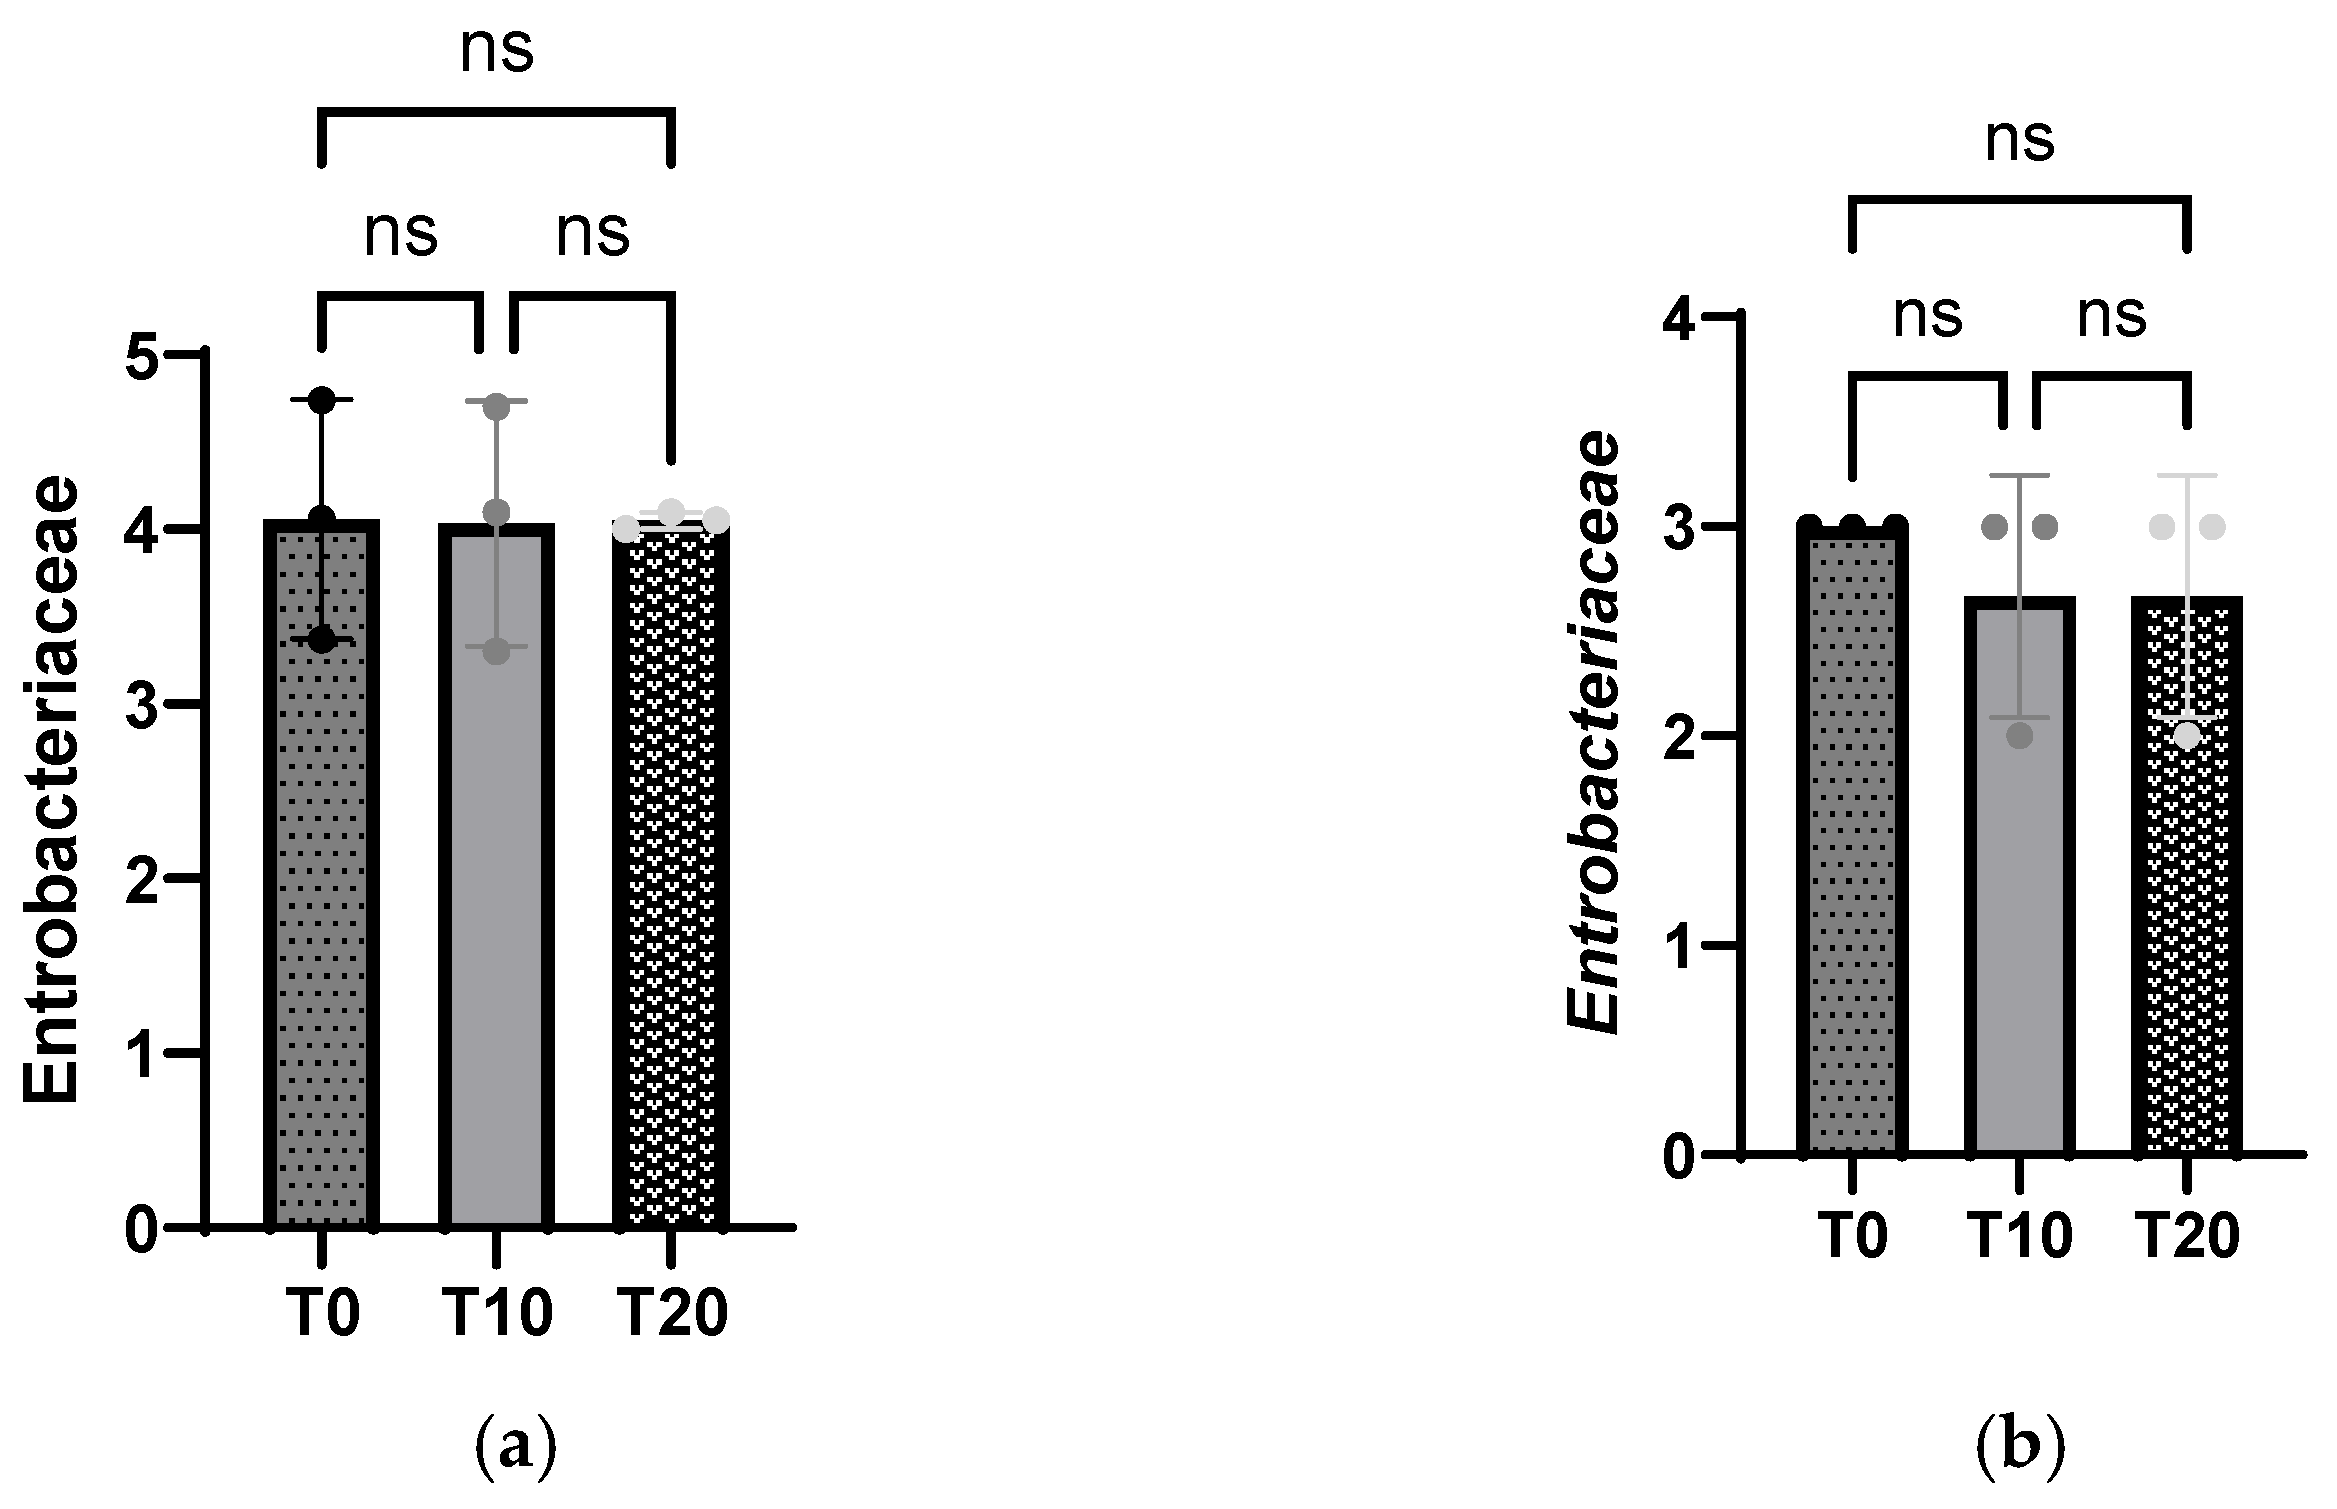
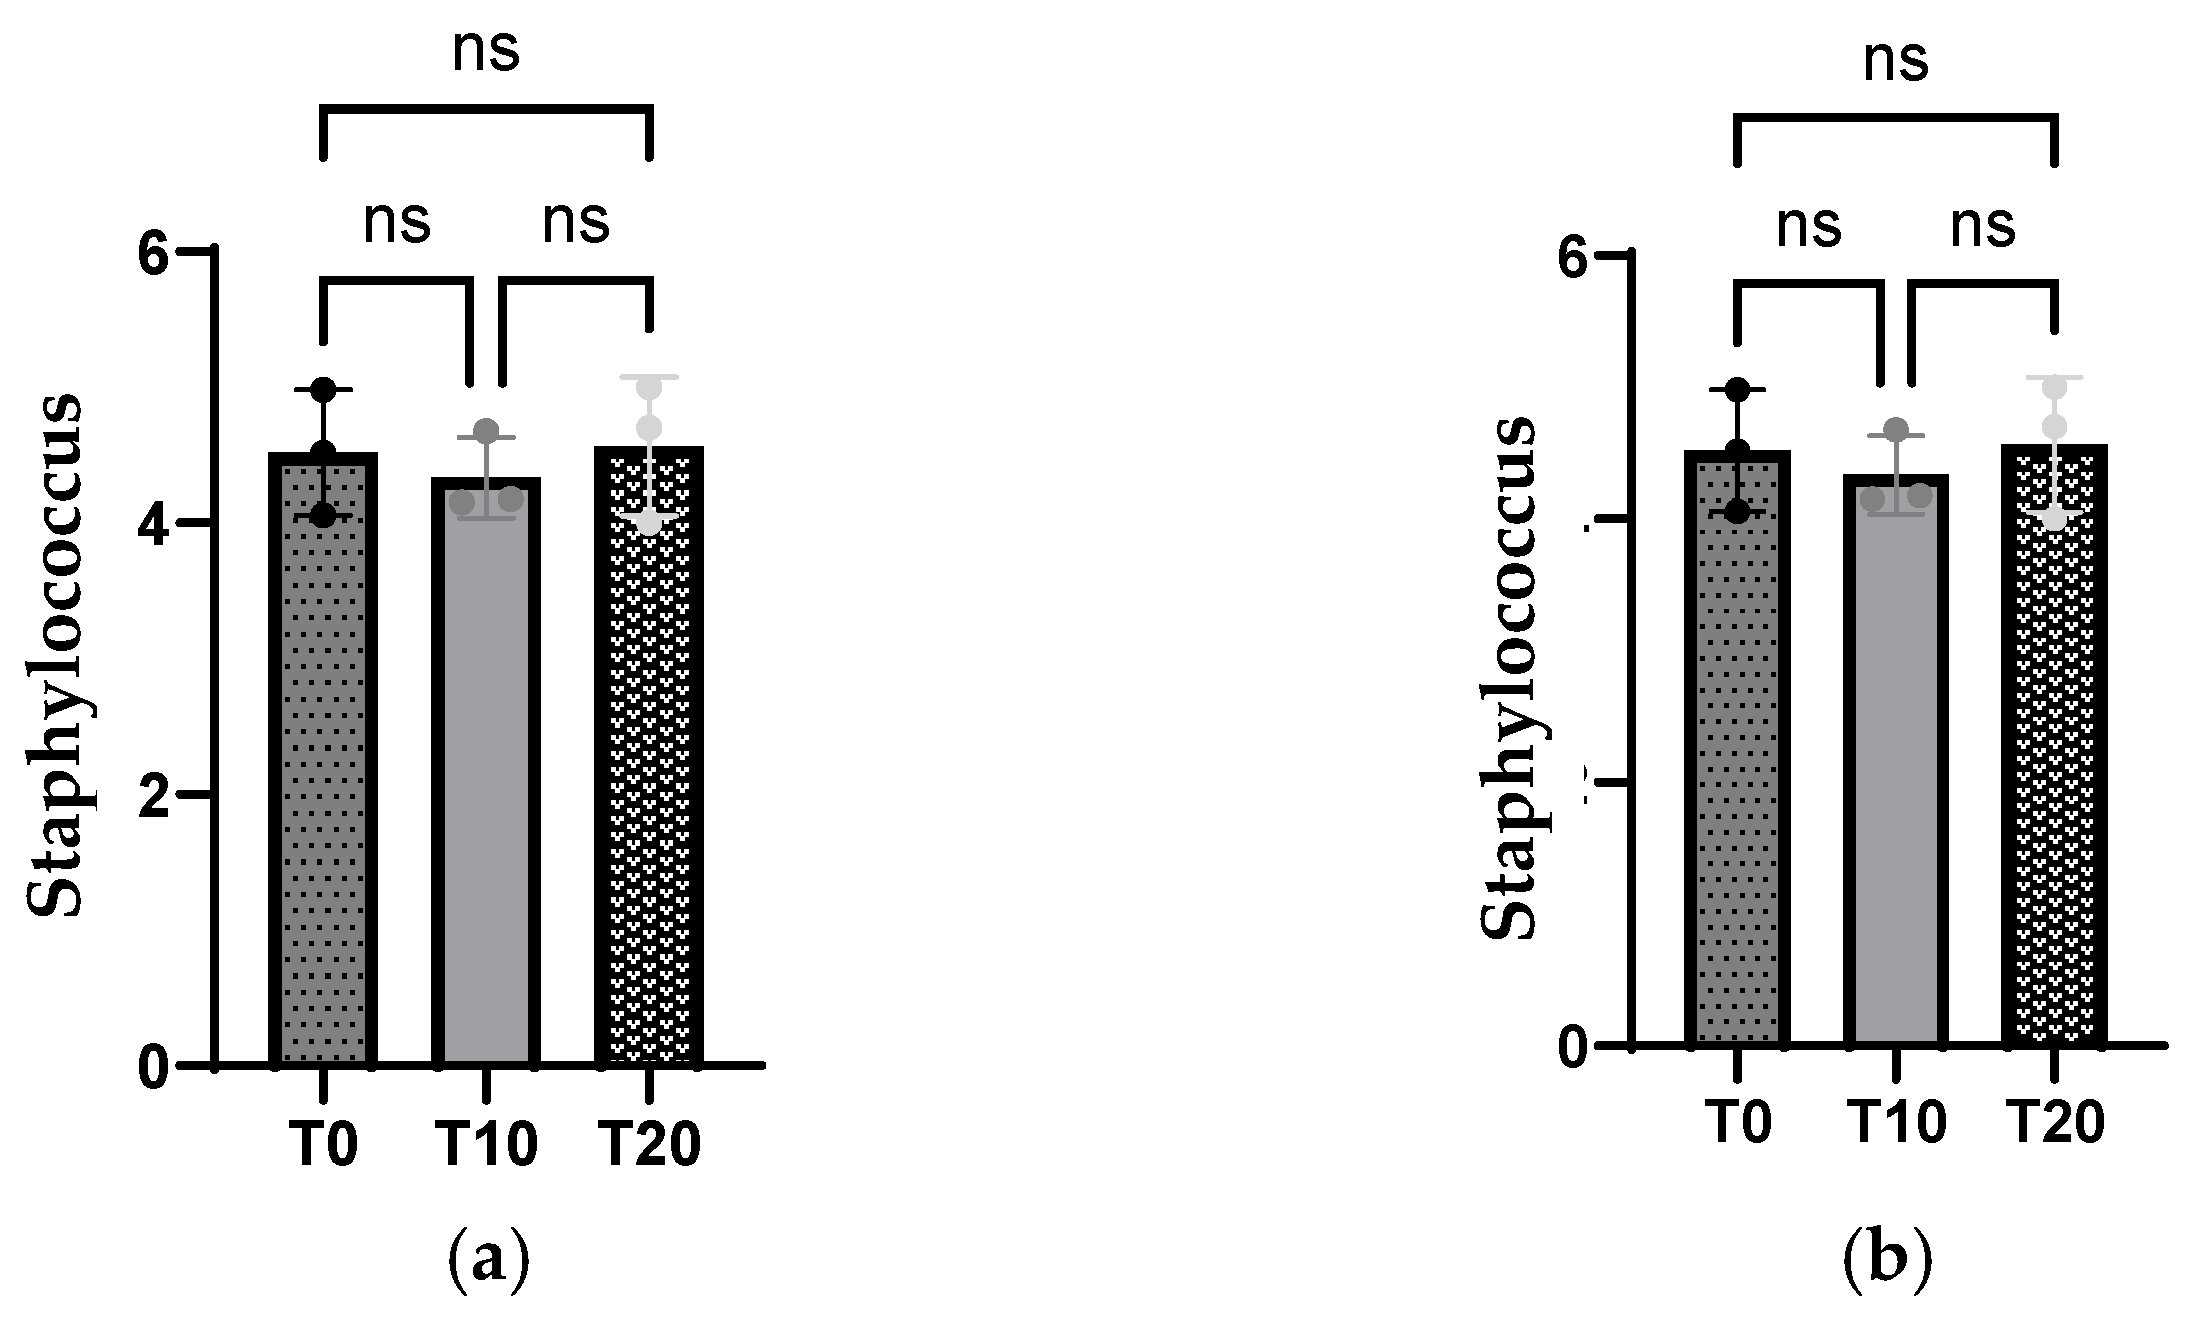
3.5. Intestinal Population Microbiota from Ileal and Cecal Segments

The microbial population assessments in the intestinal segments are presented within Figure 1a, Figure 2a and Figure 3a (ileal segment) and Figure 1b, Figure 2b and Figure 3b (cecal segment).
The T10 and T20 pea dietary inclusion had significant positive effects on the intestinal microbiota, observed only for the Lactobacillus population in both the ileal and cecal segments, compared to T0 group.
The Lactobacillus population in the ileum increased significantly in the T10 group (p = 0.007) and T20 group (p = 0.032) compared to T0. The same trend was encountered for the Lactobacillus population in the cecum, while for Enterobacteriaceae and Staphylococcus, no significant differences were noticed between groups.
Additionally, the two pea dietary inclusion levels registered no differences (p > 0.05) for neither the ileal or cecal segments.

3.6. Intestinal Length and pH Measurements

Table 6 presents the results of the pH and length measurements of the intestinal segments as a consequence of pea inclusion in the pigs’ diet.
No statistical differences (p > 0.05) were noticed concerning the pH in the cecum, jejunum, or duodenum, nor the cecum length. Significant statistical differences were noticed regarding the ileum (p = 0.049) and total digestive tract (p = 0.013), where the highest values were observed for the T20 diet compared to the T10 and T0 diets.

3.7. Intestinal Morphology of Small Intestine

Table 7 shows the intestinal morphology data obtained as a result of pea inclusion in pigs’ diet, presenting the villus length, width, their area and crypt depth, and villus/crypt ratio of the duodenum, jejunum, and ileum. Regarding small intestine measurements of the duodenum, we observed a significant decrease (p = 0.002) in the villus length in the T20 group compared to the T0 group. No statistically significant differences were registered for the jejunum (p = 0.391) and ileum (p = 0.203) concerning the villus length measurements for all groups. A significant increasing value for the villus width was observed for the duodenum (p = 0.012) in the T10 group compared to the T0 and T20 groups and the jejunum (p = 0.003) in the T10 and T20 groups compared to the T0 group. For the villus area, we observed highly significant (p = 0.0001) increasing values for the jejunal segment in the T20 and T10 groups compared to the T0 group. Similar increased values for the two experimental groups were registered for the jejunal (p = 0.004) and ileal (p = 0.0001) segments concerning the crypt depth measurements.
The results presented within Table 7 regarding the villus/crypt ratio show a decrease in this ratio for the groups fed with peas. In the duodenum, the significantly lowest (p = 0.035) ratio was observed in T20 compared to the T0 and T10 groups, while for the ileum, both experimental groups registered lower significant villus/crypt ratio values compared to the T0 group.

3.8. Correlation Between Performance Parameters, Nitrogen Metabolism, Short Chain Fatty Acids, Intestinal Microbiota, and Intestinal Villus/Crypt Ratio in Pigs’ Growing Phase

Pearson’s correlation was calculated between production performances (BW, FCR, and ADFI), nitrogen metabolism (N intake, TNO, N retained, and N digestibility), short chain fatty acids (acetic, propionic, and butyric acids), intestinal microbiota (lactobacilli), and intestinal villus/crypt ratio of growing pigs. The correlation results are presented in Table 8.
Our study revealed that the FCR was positively correlated with several factors: N retention (r = 0.937), Lactobacillus levels in the cecum (r = 0.984) and ileum (r = 0.962), as well as acetic acid concentration in the ileum (r = 0.938). N digestibility was strongly negatively correlated with the villus/crypt ratio in the duodenum (r = −0.990), and conversely, it showed a strong positive correlation with Lactobacillus levels in the cecum (r = 0.831).
Another positive strong correlation was registered between acetic and propionic acids in the cecum (r = 0.998) and butyric acid (cecum) (r = 0.995). Similar to the cecum, a positive correlation between acetic and propionic acids in the ileum (r = 0.995) and butyric acid (r = 0.996) in the ileum are registered.
A strong negative correlation was observed between the V:C ratio in the duodenum and butyric acid levels in the ileum (r = −1.000). Additionally, a strong positive correlation was found between the V:C ratios of the jejunum and duodenum (r = 0.973). Furthermore, a strong negative correlation was noted between the V:C ratio in the ileum and propionic acid levels in the cecum (r = −1.000).

4. Discussion

4.1. Pisum sativum L. Chemical Composition

Peas have a high nutritional profile, with a good protein content, being considered by nutritionists an alternative protein source to soybean meal and to animal protein [37,38,39]. The in vitro protein digestibility of peas analyzed was lower compared to soybean meal protein digestibility (78–82%), most probably due to the presence of anti-nutritional factors (ANFs) mentioned in the literature (such as protease inhibitors, tannins, and phytic acid), according to data presented by some authors [40]. The ANFs contained in peas can impair protein digestibility by inhibiting proteolytic enzymes, binding dietary proteins, or chelating essential minerals, thereby reducing nutrient bioavailability [41]. These effects may lead to compensatory responses, such as increased intestinal length or crypt depth, aimed at enhancing nutrient absorption. Trypsin inhibitors can delay protein hydrolysis in the small intestine, while phytic acid binds phosphorus, calcium, and trace minerals, further impacting digestive efficiency [42]. In our study, the CP content found in peas was consistent with the values reported in other studies, approximately 20–25% protein on a dry weight basis, highlighting their potential as an alternative protein source in animal nutrition utilization [42,43,44,45,46]. According to Mihailović et al. [47] the CP content of peas varies significantly depending on the cultivar and climatic conditions, ranging from 20% to 27% CP on a dry matter basis and 17% to 23% CP on an as-fed basis. Comparable nutritional values for peas have been documented by Heuzé et al. [36] for growing and adult pigs (ME: 15.3–15.7 MJ/kg DM; NE:11.2 MJ/kg DM; DE: 16–16.6 MJ/kg DM). Similar values of our proximal analyses were registered by ITCF, UNIP, and PGRO [48]—21% CP, 1.5% EE, 5.2% CF, 9.8% NDF, 5.8% ADF, 0.9% lignin, 12.5% insoluble cell walls, 3% ash, and 43.9% carbohydrates—and the digestible energy level 14.1 MJ kg−1 is considered high and stable [49].

4.2. Growth Performance, Nitrogen Balance, and Digestibility Coefficients

Incorporating 10% and 20% dietary peas did not significantly affect the pigs’ final body weight; the T0 and T10 groups exhibiting comparable weights, while the T20 group experienced a 3.96% weight reduction. Similar results were obtained by Sonta et al. [50], who replaced genetically modified soybean meal with increasing raw pea seeds (5.0%; 10.0%; 15.0%; and 17.5%) in fattening pig diets, with no negative impact on the production parameters and body homeostasis. According to Pradini et al. [51], the inclusion of 200 g/kg peas did not affect weight gain and feed intake, while feed intake over the entire experimental period (0–42 days) was significantly higher for extruded peas compared to the control (2.35 vs. 2.09). White et al. [11] tested the influence of peas and beans as substitutes for soybean meal in the diets of pigs during the growing (35–55 kg) and finisher phases (55–95 kg), with an optimal inclusion rate of 300 g/kg. The results showed that pigs could tolerate these legumes, and higher body weight values were observed compared to the control group. Zaworska et al. [9] evaluated a combination of pea seeds and rapeseed meal at 75:25 (w/w) on growing pigs (29 kg) over a 75-day period and registered a reduced daily weight gain, higher feed conversion ratio, and lower final body weight compared to the control diet. Pea seed extrusion significantly reduced the levels of resistant starch, phytate phosphorus, crude fiber, neutral detergent fiber, and trypsin inhibitor activity, enhancing the apparent total tract digestibility of crude protein and ileal digestibility of amino acids (aspartic acid, glutamic acid, and cysteine). Hanczakowska et al. [52] incorporated two varieties of peas (white vs. color flowering) in sows’ diets, with no statistical effect on bodyweight; however, during fattening periods, body weight gain was significantly higher for coloring peas. The protein digestibility was higher in pigs receiving the white flowering pea variety. Similar results to our study were reported by Purwin and Stanek [53], who replaced partially soybean meal with peas during the first stage of fattening and observed a digestibility comparable or higher to standard diets. During the second stage of fattening, the soybean meal was replaced totally by peas, with a positive impact on nutrient digestibility and nitrogen balance. In our study, although statistically significant differences were observed only in nitrogen retention in the T10 group compared to T0 and T20, improvements were noted across other nitrogen parameters as well. Different results were reported by Francine et al. [54], who registered significantly higher (p = 0.01) nitrogen excretion values (9.8 vs. 6.9 g/d) for an eco-friendly diet of 46% cereals (corn and wheat), 20% peas, 18% wheat middlings, 7% rapeseed meal, 5% faba beans, 1.5% rapeseed oil, and 2.5% additives compared to a control diet of 70% cereals (corn, wheat, triticale, and barley), 10% peas, 12% oil meals, 5% wheat middlings and 3% additives, while the N retention tended (p = 0.06) to be lower (27.8 vs. 30.3 g/d). The higher excretions for the eco-diet result from its lower nutrient digestibility because of dietary fibers. According to Smith et al. [55], it is possible to increase the inclusion rate of peas or beans (300 g/kg) during the growing and finishing phases of pigs, provided the diets are nutritionally balanced. Stein [56] recommended pea inclusion levels of 18% in the growing phase and 36% in the finishing phase, with carefully balanced amino acids, without impacting performance or carcass quality. Later, Stein et al. [57] demonstrated that peas could be included in pig diets up to 660 g/kg in the growing phase without adverse effects, suggesting that economic factors should determine the maximum inclusion levels. Loan et al. [58] concluded that peas can fully replace soybean meal or be included at up to 32% of DM in pigs’ finishing diets without adverse effects on growth performance or carcass quality traits. Degola and Jonkus [59], replacing soybean meal with 15% and 28% peas (in the growing and finishing phases), found no differences in the experimental results, despite the lack of methionine or tryptophan balance. However, the same researchers observed a lower average daily gain in previous tests when adding methionine or tryptophan. Additionally, Sirtori et al. [60] reported nutritional equivalence between pea and soybean proteins, achieving similar production performances.

4.3. The Protein Profile in Blood Samples

The analysis of the protein profile from blood samples revealed significant differences only for the T-Bil and UA parameters. The T20 group showed notably higher values compared to T0 and T10, but these values remained within the species-specific reference range for T-Bil (0.0–1.0 mg/dL), according to Iowa State University [61]. T-Bil, a yellow pigment produced during the normal breakdown of red blood cells, measures the amount of bilirubin in the blood [62]. Elevated levels of T-BIL can indicate liver dysfunction or adaptation in response to diet changes, bile duct obstruction, or hemolytic anemia [63]. The T-Pro parameter values for all groups were below the normal reference range for pigs (7.0–8.9 g/dL). Other literature results for T-Pro reported values similar with ours, between 55 and 86 g/L, with no reference to the physiology or age of the pigs [64]. For albumin, the results fell within the reference range of 3.0–4.5 g/dL. These consistent levels among groups could indicate stable liver function regarding albumin synthesis, unaffected by diet. Similarly, the BUN and Cre parameters were also within their respective ranges (6–30 mg/dL and 0.5–2.7 mg/dL) typically, categorized by the age group of the pigs. Increased BUN and UA levels compared to the normal range may indicate potential kidney dysfunction. The creatinine levels in our study remained constant between groups. Increased creatinine levels in the bloodstream can indicate impaired kidney function because the kidneys are unable to effectively remove creatinine from the body. Furthermore, an increase in the UA parameter could indicate increased purine metabolism. Loan et al. [58] replaced soybean meal with pea meal at levels of 25%, 50%, 75%, and 100%, corresponding to dietary pea inclusions of 8%, 16%, 24%, and 32% on a DM basis in finisher pig diets. No significant differences were observed among the diets (p = 0.532). The lowest BUN value (14.30 mg/dL) was recorded in the C group, while the highest value (14.79 mg/dL) was noticed in the group where soybean meal was 100% replaced with peas. Wen et al. [65] reported that deviations in the UA levels, whether increased or decreased compared to normal ranges, are associated with pathological conditions. In pigs, uric acid is nearly undetectable under normal physiological conditions due to the presence of the uricase enzyme (absent in humans), which converts uric acid into a more soluble form. In our study, although the highest plasma uric acid level was observed in the T20 group, all values remained within the normal physiological range for pigs, typically below 2 mg/dL. Szczurek et al. [66] reported plasma uric acid concentrations of 1.56 ± 0.13 mg/dL, consistent with the range observed in our study. The significant increase in UA levels in T20 may suggest a potential dose-dependent effect related to the dietary peas’ inclusion, which indicates changes in nitrogen metabolism or purine degradation pathways, potentially influenced by dietary factors such as a higher purine content or altered protein metabolism. Despite this increase, the UA levels do not exceed the species-specific reference range, suggesting that the kidney function remains effective in clearing UA under these dietary conditions.

4.4. Short Chain Fatty Acid Intestinal Content

In our study, the significant increased cecal concentration of acetic and butyric acids in the T10 and T20 groups, as well as acetic, isobutyric, and isovaleric acids in the ileum, suggests that the dietary peas promote the production of these acids, probably due to starch fermentation by the intestinal microbiota, a final step, after escaping from enzymatic digestion in the small intestine. The dietary inclusion of peas can enhance SCFA production, which, in turn, benefits intestinal health and energy metabolism in pigs. According to Liu [67], growing pigs are capable of absorbing and metabolizing SCFAs from the gastrointestinal tract. Butyric acid is considered a very important SCFA, one of the most abundant in the gut, assuring energy for colonic epithelial cells and influencing cell differentiation [22]. Zhou et al. [68] found that SCFAs, particularly acetic and butyric acids, play a crucial role in improving lipid and glucose metabolisms. Also, pea fiber, as an ingredient in the pigs’ diet, triggered a stimulating effect on bacterial fermentation in the colon and, consequently, higher SCFA production and acetic acid production, as well as an increased Lactobacillus sp. level [69]. Luo et al. [70] observed, when feeding a pea fiber diet to finisher pigs, an increased ratio of acetic acid to total SCFAs, a reduced butyric acid ratio, and the proliferation of Bacteroidetes involved in the degradation of dietary fibers.

4.5. Microbial Status of Growing Pigs

Our findings indicated that peas inclusion at 10% (T10) and 20% (T20) in the diets of growing pigs positively influenced the intestinal microbiota, specifically by promoting Lactobacillus populations in both the ileum and cecum, which suggests that dietary peas support lactic acid bacteria proliferation. Previous research has demonstrated that legumes, including peas, are rich in prebiotic compounds such as raffinose-family oligosaccharides, which can serve as fermentable substrates for beneficial bacteria, leading to the enhanced colonization of Lactobacillus spp. in the gut [71]. Interestingly, while Lactobacillus increased significantly in response to both inclusion levels, no significant differences were observed for Enterobacteriaceae and Staphylococcus populations, suggesting no antimicrobial effect on these bacterial groups. Also, the lack of differences between T10 and T20 groups concerning Lactobacillus populations suggests that a certain plateau effect may have been reached, where increasing pea inclusion beyond 10% does not further enhance Lactobacillus proliferation. Enhancing Lactobacillus populations in pigs has been associated with improved gut integrity, better digestion efficiency, and a reduced incidence of gastrointestinal infections [72]. Given the increasing restrictions on antibiotic growth promoters in livestock production, dietary strategies that naturally enhance beneficial gut microbiota are gaining interest.

4.6. Intestinal Length and pH Measurements

In our study, intestinal length and pH measurements showed no differences between groups, except for the total digestive tract, which had a significantly greater length in the T20 group compared to T0 and T10. We can presume that a high inclusion level of 20% dietary peas increased the total digestive tract length, possibly due to the fiber’s impact on intestinal motility and microbial activity, combined with the increased production of SCFAs, which support and promote intestinal health. Jørgensen et al. [41] reported that high dietary fiber levels, adjusted with pea fiber and pectin, significantly increased the stomach, cecum, and colon sizes, as well as the colon length, in pigs exposed to both low (13 °C) and high (23 °C) temperatures compared to low-fiber diets. The same authors found a similar effect in broilers fed pea-based diets, where higher fiber levels enlarged the digestive system, with pea fiber having a greater impact than wheat or oat bran. The ecum length and weight increased proportionally with fiber intake. Fiber plays a vital role in gut development, often leading to intestinal elongation as an adaptive mechanism to improve nutrient digestion and absorption. High-fiber diets enhance gut motility and extend digesta transit time, promoting intestinal hypertrophy, particularly in the small intestine, to compensate for reduced nutrient digestibility [73]. The presence of anti-nutritional factors (ANFs) in peas can impair protein and nutrient digestibility. In response, the intestine may elongate to expand the absorptive surface area, facilitating nutrient uptake despite lower digestibility [74]. The inclusion of higher levels of peas (T20 group) may have influenced the gut microbiota composition due to the availability of fermentable fiber, enhancing microbial activity in the hindgut and contributing to structural modifications in the intestine. Increased microbial fermentation in response to dietary fiber has been associated with intestinal hypertrophy, particularly in the large intestine [75]. Moreover, fiber-rich diets typically have a lower energy density, prompting pigs to increase feed intake to meet their energy demands. This increased intake can stimulate gut enlargement due to greater physical bulk and prolonged exposure to digesta. As a result, pigs fed high-fiber diets often develop longer intestinal tracts, with elongation primarily occurring in the jejunum and ileum to optimize digestion and nutrient absorption [76].

4.7. Intestinal Morphology

Duodenal morphology analysis showed the longest villi in the T0 group, while the shortest were in the T20 group. The T10 group had the greatest villus width, but no significant differences were noted in villus area or crypt depth. The most pronounced effects of the T10 diet were observed in the jejunum. Similar findings were reported by other researchers [7] when soybean meal was replaced with raw or extruded pea seeds, especially within the morphological parameters of the ileum and distal colon in pigs. No significant differences were observed in the ileum or distal colon for parameters such as tunica mucosa villus height, crypt depth, tunica muscularis thickness, or the villus-to-crypt ratio between diets containing raw or extruded peas. Notably, significant differences were observed in the jejunum regarding villus depth and area between the two experimental groups and the control group. Lærke and Hedemann [77] also reported that villus length increases from the duodenum to the mid-jejunum and then decreases towards the terminal ileum. This variation reflects the distinct functional roles of different segments of the small intestine. Similarly, the crypt size and composition vary along the intestine, with crypts being deepest in the proximal regions (duodenum and jejunum) and shallower in the distal ileum. According to Prakatur et al. [78], the growth in intestinal villus length is associated with enhanced digestive and absorptive functions of the intestine. This growth leads to an increase in the total luminal villus absorptive area and elevated activity of intestinal brush border enzymes. Additionally, a reduction in crypt depth contributes to improved enzymatic activity in the small intestine, which enhances absorption capacity [79]. Jin et al. [80] reported that adding 10% wheat straw, an insoluble fiber, to a low-fiber diet increased the crypt depth in the jejunum and ileum and enhanced cell division in growing pigs. McDonald et al. [81] found that feeding 21-day-old weaned pigs a carboxymethylcellulose-supplemented diet for 10 days increased the villus height, suggesting benefits of dietary viscosity up to a certain threshold. Additionally, the crypt depth increased, likely due to SCFA effects, particularly butyrate, which stimulates crypt-cell proliferation and enterocyte turnover, as a response to dietary fiber [81,82]. Crypts generate new enterocytes to replace those shed from the villus tips. Increased crypt depth may indicate a higher proliferation rate of intestinal cells, possibly as a response to greater villus shedding or damage. Feed additives like fiber, polyphenols, and probiotics can affect villus morphology, while certain bacteria, such as Lactobacilli, influence the villus structure and crypt activity [83]. If the thickening of villi results from increased mucus production or an improved barrier function, it may offer better protection against pathogens. Souza da Silva et al. [84] found that shorter villus height and increased crypt depth, impairing nutrient absorption and gut integrity, was observed in broilers under heat stress conditions. Also, Quintero-Filho et al. [85] demonstrated that heat stress increases oxidative stress and inflammation in the intestinal mucosa, leading to villus shortening. Rehman et al. [86] observed that high-fiber diets led to villus thickening and crypt deepening, affecting intestinal barrier function.

4.8. Correlation Discussion

In our study, a strong positive correlation between FCR and N retained was observed. The higher nitrogen retention in T10 compared to the T0 group, despite a lower FCR, can be a complex interaction between protein digestibility, and pigs’ ability to retain nitrogen for the growing phase. Other authors [55] reported that higher nitrogen retention in pea-fed pigs did not necessarily translate into improved growth efficiency, as some retained nitrogen may be excreted later rather than be used for muscle deposition. Similarly, Landero et al. [87] found that pigs fed high levels of peas retained nitrogen at a similar rate to those on soybean-based diets, but their FCR was slightly elevated, indicating a minor inefficiency in nitrogen utilization. Also, a positive correlation between FCR and Lactobacilli in the cecum and ileum suggests that the gut microbiota influences feed efficiency, as higher Lactobacillus levels could be modulating digestion and nutrient absorption. This aligns with Chen et al.’s studies [88], who found that replacing soybean meal with peas in pigs’ diets led to higher Lactobacillus populations in the cecum and ileum. In contrast, Torrallardona et al. [89] found no significant changes in Lactobacillus populations when pigs were fed diets containing peas, which implies that the microbial population may depend on various factors, such as diet formulation, fiber content, and processing methods. Our study found a positive correlation between FCR and acetic acid, with increasing levels in the ileum. This is consistent with the findings of other researchers [7], who observed that feeding raw peas increased the SCFA levels in the small intestine, caused by the undigested starch and fiber fermentation. A strong positive correlation between N digestibility and Lactobacilli in the cecum suggests that higher nitrogen digestibility is associated with increased Lactobacillus counts in the cecum. The positive strong correlation registered between acetic, propionic, and butyric acids in the cecum suggests that the production of SCFAs in this intestinal segment is strongly linked. The SCFAs are produced through microbial fermentation of dietary fibers, and their concentrations are interdependent. Also, the same strong correlation between acetic, propionic, and butyric acids in the ileum suggests that SCFAs in the ileum are co-produced by gut bacteria, and a higher SCFA concentration may indicate increased microbial fermentation of carbohydrates in the small intestine. Luo et al. [70] found similar trends in pigs fed legume-based diets, where the acetic acid levels were strongly correlated with butyric and propionic acids, indicating that the fermentation profile remains relatively stable across different gut compartments. In contrast, Zhang et al. [90] reported higher variability in SCFA production when pigs were fed high-fiber diets, which they attributed to differences in the gut transit time and microbial adaptation. The strong positive correlation of the V:C ratio in the jejunum and V:C ratio in the duodenum suggests that if the duodenum’s villus-to-crypt ratio increases, the jejunum’s will increase also. Van Nevel et al. [91] reported that higher SCFA production in the cecum could signal compensatory changes in the ileum, leading to a reduction in villus height. However, other authors [89] found that pea-based diets did not significantly alter villus morphology, suggesting that the effects of SCFAs on gut structure may depend on pea inclusion levels and fiber composition.

5. Conclusions

Our pilot study concluded that pea inclusion at different levels (10% and 20%) in growing pigs’ diets enhanced feed efficiency, nitrogen retention, and intestinal SCFA production without adversely affecting microbial populations, serum biochemical parameters, or protein utilization. These results suggest that dietary pea inclusion can positively influence digestive and nitrogen absorption without adverse effects on productive performances. Further research could explore the long-term effects and other peas’ inclusion levels to maximize benefits.
This study presents several limitations that should be considered when interpreting the results. First, the small sample size, while acceptable for a pilot digestibility study, may limit statistical power and the ability to detect subtle treatment effects. Second, the duration of the trial may not fully capture long-term adaptations to dietary pea inclusion, especially in relation to gut microbiota dynamics and morphological changes. Future studies involving larger animal numbers are recommended to investigate the influence of peas, particularly when tested on pigs in different rearing phases, over a longer experimental period.

Author Contributions

Conceptualization, T.D.P. and G.M.C.; methodology, T.D.P., G.M.C., A.E.C., E.G., A.E.C., C.G., M.D. and S.M.T.; software, T.D.P.; validation, T.D.P.; formal analysis, T.D.P. and G.M.C.; investigation, A.E.C.; resources, T.D.P.; data curation, T.D.P.; writing—original draft preparation, T.D.P.; writing—review and editing, T.D.P. and G.M.C.; visualization, T.D.P. and A.E.C.; supervision, T.D.P.; project administration, T.D.P.; funding acquisition, T.D.P. All authors have read and agreed to the published version of the manuscript.

Funding

This research was funded by the Ministry of Research, Innovation and Digitization, Romania—Project PN 23 20 0101.

Institutional Review Board Statement

The animal study protocol was approved by the Ethics Committee of the NATIONAL RESEARCH AND DEVELOPMENT INSTITUTE FOR BIOLOGY AND ANIMAL NUTRITION (IBNA-Balotesti, Romania; Protocol no. 4965/September 2023) following the Romanian legislation (Law 43/11 April 2014, Directive 2010/63/EU) for the feeding, handling, and slaughtering procedures of the study.

Data Availability Statement

The original contributions presented in this study are included in the article. Further inquiries can be directed to the corresponding author.

Conflicts of Interest

The authors declare no conflicts of interest.

References

  1. Colgrave, S.M. Allergenicity of novel and traditional protein sources in food production. J. Agric. Food Chem. 2021, 69, 15076–15083. [Google Scholar] [CrossRef] [PubMed]
  2. Khanashyam, A.C.; Mundanat, A.S.; Sajith Babu, K.; Thorakkattu, P.; Krishnan, R.; Abdullah, S.; Bekhit, A.E.A.; McClements, D.J.; Santivarangkna, C.; Nirmal, N.P. Emerging alternative food protein sources: Production process, quality parameters, and safety point of view. Crit. Rev. Biotechnol. 2025, 45, 1–22. [Google Scholar] [CrossRef] [PubMed]
  3. Gil, M.; Rudy, M.; Duma-Kocan, P.; Stanisławczyk, R.; Krajewska, A.; Dziki, D.; Hassoon, W.H. Sustainability of alternatives to animal protein sources, a comprehensive review. Sustainability 2024, 16, 7701. [Google Scholar] [CrossRef]
  4. Cusworth, G.; Garnett, T.; Lorimer, J. Legume dreams: The contested futures of sustainable plant-based food systems in Europe. Glob. Environ. Change 2021, 69, 102321. [Google Scholar] [CrossRef]
  5. Jafarzadeh, S.; Qazanfarzadeh, Z.; Majzoobi, M.; Sheiband, S.; Oladzadabbasabad, N.; Esmaeili, Y.; Barrow, C.J.; Timms, W. Alternative proteins; A path to sustainable diets and environment. Curr. Res. Food Sci. 2024, 9, 100882. [Google Scholar] [CrossRef]
  6. Singh, N.; Jain, P.; Ujinwal, M.; Langyan, S. Escalate protein plates from legumes for sustainable human nutrition. Front. Nutr. 2022, 9, 977986. [Google Scholar] [CrossRef] [PubMed]
  7. Tuśnio, A.; Taciak, M.; Barszcz, M.; Święch, E.; Bachanek, I.; Skomiał, J. Effect of replacing soybean meal by raw or extruded pea seeds on growth performance and selected physiological parameters of the ileum and distal colon of pigs. PLoS ONE 2017, 12, e0169467. [Google Scholar] [CrossRef]
  8. Parrini, A. Soybean replacement by alternative protein sources in pig nutrition and its effect on meat quality. Animals 2023, 13, 494. [Google Scholar] [CrossRef]
  9. Zaworska, A.; Kasprowicz-Potocka, M.; Rutkowski, A.; Jamroz, D. The influence of dietary raw and extruded field peas (Pisum sativum L.) on nutrient digestibility and performance of weaned and fattening pigs. Anim. Feed Sci. Technol. 2018, 240, 25–34. [Google Scholar] [CrossRef]
  10. Chojnacka, K.; Mikula, K.; Izydorczyk, G.; Skrzypczak, D.; Witek-Krowiak, A.; Gersz, A.; Moustakas, K.; Iwaniuk, J.; Grzędzicki, M.; Korczyński, M. Innovative high digestibility protein feed materials reducing environmental impact through improved nitrogen-use efficiency in sustainable agriculture. J. Environ. Manag. 2021, 291, 112693. [Google Scholar] [CrossRef]
  11. White, G.A.; Smith, L.A.; Houdijk, J.G.M.; Homer, D.; Kyriazakis, I.; Wiseman, J. Replacement of soybean meal with peas and faba beans in growing/finishing pig diets: Effect on performance, carcass composition and nutrient excretion. Anim. Feed Sci. Technol. 2015, 209, 202–210. [Google Scholar] [CrossRef]
  12. Lestingi, A. Alternative and sustainable protein sources in pig diet: A review. Animals 2024, 14, 310. [Google Scholar] [CrossRef]
  13. Thavarajah, D.; Lawrence, T.; Boatwright, L.; Windsor, N.; Johnson, N.; Kay, J.; Shipe, E.; Kumar, S.; Thavarajah, P. Organic dry pea (Pisum sativum L.): A sustainable alternative pulse-based protein for human health. PLoS ONE 2023, 18, e0284380. [Google Scholar] [CrossRef] [PubMed]
  14. Pulse Canada. Available online: https://pulsecanada.com (accessed on 20 October 2024).
  15. Wu, D.T.; Li, W.X.; Wan, J.J.; Hu, Y.C.; Gan, R.Y.; Zou, L. A comprehensive review of pea (Pisum sativum L.): Chemical composition, processing, health benefits, and food applications. Foods 2023, 12, 2527. [Google Scholar] [CrossRef] [PubMed]
  16. Stein, H.H. Field Peas in Diets Fed to Swine; SDSU Extension Special Series. 1; South Dakota State University: Brookings, SD, USA, 2006; Available online: https://openprairie.sdstate.edu/extension_circ/1/ (accessed on 17 February 2025).
  17. Bărbieru, A. Relation of quantitative traits in winter peas (Pisum sativum L.). Rom. Agric. Res. 2023, 40, 199–207. [Google Scholar] [CrossRef]
  18. Bergen, W.G.; Wu, G. Intestinal nitrogen recycling and utilization in health and disease. J. Nutr. 2009, 139, 821–825. [Google Scholar] [CrossRef]
  19. Shurson, G.C.; Kerr, B.J. Challenges and opportunities for improving nitrogen utilization efficiency for more sustainable pork production. Front. Anim. Sci. 2023, 4, 1204863. [Google Scholar] [CrossRef]
  20. Ball, M.E.E.; Smyth, S.; Beattie, V.E.; McCracken, K.J.; McCormack, U.; Muns, R.; Gordon, F.J.; Bradford, R.; Reid, L.A.; Magowan, E. The environmental impact of lowering dietary crude protein in finishing pig diets—The effect on ammonia, odour and slurry production. Sustainability 2022, 14, 12016. [Google Scholar] [CrossRef]
  21. Dahl, W.J.; Foster, L.M.; Tyler, R.T. Review of the health benefits of peas (Pisum sativum L.). Br. J. Nutr. 2012, 108 (Suppl. 1), S3–S10. [Google Scholar] [CrossRef]
  22. Cheng, Y.; Zhao, R.; Qiao, M.; Ma, Y.; Li, T.; Li, N.; Song, L. The pea oligosaccharides could stimulate the in vitro proliferation of beneficial bacteria and enhance anti-inflammatory effects via the NF-κB pathway. Foods 2024, 13, 626. [Google Scholar] [CrossRef]
  23. Canani, R.B.; Costanzo, M.D.; Leone, L.; Pedata, M.; Meli, R.; Calignano, A. Potential beneficial effects of butyrate in intestinal and extraintestinal diseases. World J. Gastroenterol. 2011, 17, 1519–1528. [Google Scholar] [CrossRef] [PubMed]
  24. Fusco, W.; Lorenzo, M.B.; Cintoni, M.; Porcari, S.; Rinninella, E.; Kaitsas, F.; Lener, E.; Mele, M.C.; Gasbarrini, A.; Collado, M.C.; et al. Short-chain fatty-acid-producing bacteria: Key components of the human gut microbiota. Nutrients 2023, 15, 2211. [Google Scholar] [CrossRef]
  25. Boisen, S.; Fernández, J.A. Prediction of the total tract digestibility of energy in feedstuffs and pig diets by in vitro analyses. Anim. Feed Sci. Technol. 1997, 68, 277–286. [Google Scholar] [CrossRef]
  26. Burlacu, G.H.; Cavache, A.; Burlacu, R.; Surdu, I. Potentialul Productiv Al Nutrețurilor și Utilizarea Lor, 1st ed.; Editura Ceres: Bucharest, Romania, 2002; p. 1. [Google Scholar]
  27. Hlatini, V.A.; Ncobela, C.N.; Chimonyo, M. Nitrogen balance response to varying levels of dietary protein in slow-growing Windsnyer pigs. S. Afr. J. Anim. Sci. 2020, 50, 644–653. [Google Scholar] [CrossRef]
  28. Mihaila, G.; Habeanu, M.; Lefter, N.; Gheorghe, A.; Dumitru, M.; Marin, I.; Vidu, L.; Nicolae, G.C.; Popa, D.; Marin, M. Influence of Guar Meal from pig compound feed on productive performance, nitrogen metabolism, and greenhouse gas emissions. Agriculture 2023, 13, 2156. [Google Scholar] [CrossRef]
  29. Norsvin, T. Feeding Manual Norsvin Duroc Progeny; Topigs Norsvin: ’s-Hertogenbosch, The Netherlands, 2017. [Google Scholar]
  30. Commission Regulation EC 152/2009; Laying Down the Methods of Sampling and Analysis for the Official Control of Feed. Official Journal of the European Union: Luxembourg, 2009.
  31. ISO 5983-2:2009; Animal Feeding Stuffs—Determination of Nitrogen Content and Calculation of Crude Protein Content. Part 2: Block Digestion and Steam Distillation Method. International Organization for Standardization: Geneva, Switzerland, 2009.
  32. Moreira, I.; Fraga, A.L.; Paiano, D.; Oliveira, G.C.; Scapinello, C.; Martins, E.N. Nitrogen balance of starting barrow pigs fed on increasing lysine levels. Braz. Arch. Biol. Technol. 2004, 47, 85–91. [Google Scholar] [CrossRef]
  33. Directive 2010/63/EU; The European Parliament and the Council of 22 September 2010 on the Protection of Animals Used for Scientific Purposes. Official Journal of the European Union: Luxembourg, 2010; L 276/33-79. Available online: https://eur-lex.europa.eu/eli/dir/2010/63/oj/eng (accessed on 18 April 2025).
  34. Sorescu, I.; Dumitru, M.; Ciurescu, G. Lactobacillus spp. and Enterococcus faecium strains isolation, identification, preservation and quantitative determinations from turkey gut content. Biotechnol. Lett. 2019, 24, 41–49. [Google Scholar] [CrossRef]
  35. Ciurescu, G.; Dumitru, M.; Gheorghe, A.; Untea, A.E.; Drăghici, R. Effect of Bacillus subtilis on growth performance, bone mineralization, and bacterial population of broilers fed with different protein sources. Poult. Sci. 2020, 99, 5960–5971. [Google Scholar] [CrossRef]
  36. Heuzé, V.; Tran, G.; Giger-Reverdin, S.; Noblet, J.; Renaudeau, D.; Lessire, M.; Lebas, F. Pea Seeds; Feedipedia, A Programme by INRAE, CIRAD, AFZ and FAO. 2017. Available online: https://feedipedia.org/node/264 (accessed on 20 October 2024).
  37. Barac, M.; Cabrilo, S.; Pesic, M.; Stanojevic, S.; Zilic, S.; Macej, O.; Ristic, N. Profile and functional properties of seed proteins from six pea (Pisum sativum) genotypes. Int. J. Mol. Sci. 2010, 11, 4973–4990. [Google Scholar] [CrossRef]
  38. Barac, M.; Cabrilo, S.; Stanojevic, S.; Pesic, M.; Pavlicevic, M.; Zlatkovic, B.; Jankovic, M. Functional properties of protein hydrolysates from pea (Pisum sativum L) seeds. Int. J. Food Sci. Technol. 2012, 47, 1457–1467. [Google Scholar] [CrossRef]
  39. Adebiyi, A.P.; Aluko, R.E. Functional properties of protein fractions obtained from commercial yellow field pea (Pisum sativum L.) seed protein isolate. Food Chem. 2011, 128, 902–908. [Google Scholar] [CrossRef]
  40. Tulbek, M.C.; Lam, R.S.H.; Wang, Y.C.; Asavajaru, P.; Lam, A. Pea: A sustainable vegetable protein crop. In Sustainable Protein Sources; Nadathur, S.R., Wanasundara, J.P.D., Scanlin, L., Eds.; Academic Press: San Diego, CA, USA, 2016; pp. 145–164. [Google Scholar] [CrossRef]
  41. Jørgensen, H.; Zhao, X.Q.; Eggum, B.O. The influence of dietary fibre and environmental temperature on the development of the gastrointestinal tract, digestibility, degree of fermentation in the hind-gut and energy metabolism in pigs. Br. J. Nutr. 1996, 75, 365–378. [Google Scholar] [CrossRef] [PubMed]
  42. Grosjean, F.; Jondreville, C.; Williatte-Hazouard, I.; Skiba, F.; Carrouée, B.; Gatel, F. Ileal digestibility of protein and amino acids of feed peas with different trypsin inhibitor activity in pigs. Can. J. Anim. Sci. 2000, 80, 643–652. [Google Scholar] [CrossRef]
  43. de Almeida Costa, G.E.; da Silva Queiroz-Monici, K.; Reis, S.M.P.M.; de Oliveira, A.C. Chemical composition, dietary fibre and resistant starch contents of raw and cooked pea, common bean, chickpea and lentil legumes. Food Chem. 2006, 94, 327–330. [Google Scholar] [CrossRef]
  44. Wang, N.; Hatcher, D.W.; Gawalko, E.J. Effect of variety and processing on nutrients and certain anti-nutrients in field peas (Pisum sativum). Food Chem. 2008, 111, 132–138. [Google Scholar] [CrossRef]
  45. Shen, Y.; Hong, S.; Li, Y. Pea protein composition, functionality, modification, and food applications: A review. Adv. Food Nutr. Res. 2022, 101, 71–127. [Google Scholar]
  46. Taylor, S.L.; Marsh, J.T.; Koppelman, S.J.; Kabourek, J.L.; Johnson, P.E.; Baumert, J.L. A perspective on pea allergy and pea allergens. Trends Food Sci. Technol. 2021, 116, 186–198. [Google Scholar] [CrossRef]
  47. Mihailović, V.; Mikić, A.; Erić, P.; Vasiljević, S.; Ćupina, B.; Katić, S. Protein pea in animal feeding. Biotechnol. Anim. Husb. 2005, 21, 281–285. [Google Scholar] [CrossRef]
  48. ITCF; UNIP; PGRO. Feed Peas—A Quality Raw Material for Animal Feeding; Institut Technique des Céréales et des Fourrages (ITCF): Paris, France; Union Nationale Interprofessionnelle des Plantes Riches en Protéines (UNIP), Processors & Growers Research Organisation (PGRO): Peterborough, UK, 1996. [Google Scholar]
  49. UNIP; ITCF. Peas—Utilisation in Animal Feeding; Union Nationale Interprofessionelle des Plants Riches en Protéines (UNIP) and Institut Technique des Céréals et des Fourrages (ITCF): Paris, France, 1995; p. 102. [Google Scholar]
  50. Sońta, M.; Batorska, M.; Więcek, J.; Rekiel, A. Performance results and concentrations of biochemical indices and mineral elements in blood serum of fatteners fed diets containing mixtures of raw seeds of pea (Pisum sativum L.) or blue lupin (Lupinus angustifolius L.). Animals 2020, 10, 858. [Google Scholar] [CrossRef]
  51. Prandini, A.; Morlacchini, M.; Moschini, M.; Fusconi, G.; Masoero, F.; Piva, G. Raw and extruded pea (Pisum sativum) and lupin (Lupinus albus var. Multitalia) seeds as protein sources in weaned piglets’ diets: Effect on growth rate and blood parameters. Ital. J. Anim. Sci. 2005, 4, 385–394. [Google Scholar]
  52. Hanczakowska, E.; Księżak, J.; Świątkiewicz, M. Efficiency of pea seeds in sow, piglet and fattener feeding. Anim. Prod. Sci. 2019, 59, 304–313. [Google Scholar] [CrossRef]
  53. Purwin, C.; Stanek, M. Nutrient digestibility and nitrogen balance in growing-finishing pigs fed legume-based diets. Ann. UMCS Zootech. 2011, 29, 52–61. [Google Scholar] [CrossRef]
  54. Francine, Q.; Florence, G.L.; Aurélie, W.; Jean-Yves, D.; Etienne, L. Eco-friendly diet: Nutrient digestibility, nitrogen and energy balances and growth performance of growing pigs. J. Anim. Sci. 2024, 102, skae203. [Google Scholar] [CrossRef]
  55. Smith, L.A.; Houdijk, J.G.M.; Homer, D.; Kyriazakis, I. Effects of dietary inclusion of pea and faba bean as a replacement for soybean meal on grower and finisher pig performance and carcass quality. J. Anim. Sci. 2013, 91, 3733–3741. [Google Scholar] [CrossRef]
  56. Stein, H.H. Field peas can be included in the phase 2 diet for nursery pigs without adverse effects on pig performance. J. Anim. Sci. 2002, 80, 1000–1010. [Google Scholar]
  57. Stein, H.H.; Everts, A.K.R.; Sweeter, K.K.; Peters, D.N.; Maddock, R.J.; Wulf, D.M.; Pedersen, C. The influence of dietary field peas (Pisum sativum L.) on pig performance, carcass quality, and the palatability of pork. J. Anim. Sci. 2006, 84, 311–321. [Google Scholar] [CrossRef] [PubMed]
  58. Loan, N.V.T.H.; van Kinh, L.; Riley, W.; Huyen, L.T.T.; Ngoan, L.D. The effect of replacing soybean meal by field pea (Pisum sativum) seed meal in diets on growth performance, carcass traits and meat quality of finishing pigs in the tropical climate conditions of Viet Nam. Asian-Australas. J. Anim. Sci. 2023, 35, 81. [Google Scholar]
  59. Degola, L.; Jonkus, D. The influence of dietary inclusion of peas, faba bean and lupin as a replacement for soybean meal on pig performance and carcass traits. Agron. Res. 2018, 16, 389–397. [Google Scholar] [CrossRef]
  60. Sirtori, F.; Crovetti, A.; Acciaioli, A.; Bonelli, A.; Pugliese, C.; Bozzi, R.; Campodoni, G.; Franci, O. Effect of replacing a soy diet with Vicia faba and Pisum sativum on performance, meat and fat traits of Cinta Senese pigs. Ital. J. Anim. Sci. 2015, 14, 3659. [Google Scholar] [CrossRef]
  61. Iowa State University. Available online: https://vetmed.iastate.edu (accessed on 12 February 2025).
  62. Kalakonda, A.; Jenkins, B.A.; John, S. Physiology, bilirubin. In StatPearls; StatPearls Publishing: Treasure Island, FL, USA, 2023. Available online: https://www.ncbi.nlm.nih.gov/books/NBK470290/ (accessed on 17 February 2025).
  63. Guerra Ruiz, A.R.; Crespo, J.; López Martínez, R.M.; Iruzubieta, P.; Casals Mercadal, G.; Lalana Garcés, M.; Lavin, B.; Morales Ruiz, M. Measurement and clinical usefulness of bilirubin in liver disease. Adv. Lab. Med. 2021, 2, 352–372. [Google Scholar] [CrossRef]
  64. Laboklin. Available online: https://laboklin.com (accessed on 10 December 2024).
  65. Wen, S.; Arakawa, H.; Tamai, I. Uric acid in health and disease: From physiological functions to pathogenic mechanisms. Pharmacol. Ther. 2024, 256, 108615. [Google Scholar] [CrossRef] [PubMed]
  66. Szczurek, P.; Mosiichuk, N.; Woliński, J.; Yatsenko, T.; Grujic, D.; Lozinska, L.; Pieszka, M.; Święch, E.; Pierzynowski, S.G.; Goncharova, K. Oral uricase eliminates blood uric acid in the hyperuricemic pig model. PLoS ONE 2017, 12, e0179195. [Google Scholar] [CrossRef] [PubMed]
  67. Liu, Y. Fatty acids, inflammation and intestinal health in pigs. J. Anim. Sci. Biotechnol. 2015, 6, 41. [Google Scholar] [CrossRef]
  68. Zhou, H.; Yu, B.; Sun, J.; Liu, Z.; Chen, H.; Ge, L.; Chen, D. Short-chain fatty acids can improve lipid and glucose metabolism independently of the pig gut microbiota. J. Anim. Sci. Biotechnol. 2021, 12, 61. [Google Scholar] [CrossRef]
  69. Che, L.; Chen, H.; Yu, B.; He, J.; Zheng, P.; Mao, X.; Yu, J.; Huang, Z.; Chen, D. Long-term intake of pea fibre affects colonic barrier function, bacterial and transcriptional profile in pig model. Nutr. Cancer 2014, 66, 388–399. [Google Scholar] [CrossRef] [PubMed]
  70. Luo, Y.; Chen, H.; Yu, B.; He, J.; Zheng, P.; Mao, X.; Yu, J.; Luo, J.; Huang, Z.; Chen, D. Dietary pea fibre alters the microbial community and fermentation with increase in fibre degradation-associated bacterial groups in the colon of pigs. J. Anim. Physiol. Anim. Nutr. 2018, 102, e254–e261. [Google Scholar] [CrossRef]
  71. Yang, J.; Martínez, I.; Walter, J.; Keshavarzian, A.; Rose, D.J. In vitro characterization of the impact of selected dietary fibres on fecal microbiota composition and short-chain fatty acid production. Anaerobe 2013, 23, 74–81. [Google Scholar] [CrossRef]
  72. Metzler-Zebeli, B.U.; Hooda, S.; Pieper, R.; Zijlstra, R.T.; van Kessel, A.G.; Mosenthin, R.; Gänzle, M.G. Nonstarch polysaccharides modulate bacterial microbiota, pathways for butyrate production, and abundance of pathogenic Escherichia coli in the pig gastrointestinal tract. Appl. Environ. Microbiol. 2010, 76, 3692–3701. [Google Scholar] [CrossRef]
  73. Han, X.; Ma, Y.; Ding, S.; Fang, J.; Liu, G. Regulation of dietary fibre on intestinal microorganisms and its effects on animal health. Anim. Nutr. 2023, 14, 356–369. [Google Scholar] [CrossRef]
  74. Salim, R.; Nehvi, I.B.; Mir, R.A.; Tyagi, A.; Ali, S.; Bhat, O.M. A review on anti-nutritional factors: Unraveling the natural gateways to human health. Front. Nutr. 2023, 10, 1215873. [Google Scholar] [CrossRef]
  75. Holscher, H.D. Dietary fibre and prebiotics and the gastrointestinal microbiota. Gut Microbes 2017, 8, 172–184. [Google Scholar] [CrossRef]
  76. Li, H.; Yin, J.; Tan, B.; Chen, J.; Zhang, H.; Li, Z.; Ma, X. Physiological function and application of dietary fibre in pig nutrition: A review. Anim. Nutr. 2021, 7, 259–267. [Google Scholar] [CrossRef] [PubMed]
  77. Lærke, H.N.; Hedemann, M.S. The digestive system of the pig. In Nutritional Physiology of Pigs; Bach Knudsen, K.E., Kjeldsen, N.J., Poulsen, H.D., Jensen, B.B., Eds.; Videncenter for Svineproduktion: København, Danmarks, 2012. [Google Scholar]
  78. Prakatur, I.; Miskulin, M.; Pavic, M.; Marjanovic, K.; Blazicevic, V.; Miskulin, I.; Domacinovic, M. Intestinal morphology in broiler chickens supplemented with propolis and bee pollen. Animals 2019, 9, 301. [Google Scholar] [CrossRef]
  79. Kelly, D.D.; Smyth, J.A.; McCracken, K.J. Digestive development of the early-weaned pig: 2. Effect of level of food intake on digestive enzyme activity during the immediate post-weaning period. Br. J. Nutr. 1991, 65, 181–188. [Google Scholar] [CrossRef]
  80. Jin, L.; Reynolds, L.P.; Redmer, D.A.; Caton, J.S.; Crenshaw, J.D. Effects of dietary fibre on intestinal growth, cell proliferation, and morphology in growing pigs. J. Anim. Sci. 1994, 72, 2270–2278. [Google Scholar] [CrossRef] [PubMed]
  81. McDonald, D.E.; Pethick, D.W.; Mullan, B.P.; Hampson, D.J. Increasing viscosity of the intestinal contents alters small intestinal structure and intestinal growth, and stimulates proliferation of enterotoxigenic Escherichia coli in newly-weaned pigs. Br. J. Nutr. 2001, 86, 487–498. [Google Scholar] [CrossRef] [PubMed]
  82. Murugesan, G.R. Characterization of the Effects of Intestinal Physiology Modified by Exogenous Enzymes and Direct-Fed Microbial on Intestinal Integrity, Energy Metabolism, Body Composition and Performance of Laying Hens and Broiler Chickens. PhD Thesis, Iowa State University, Ames, IA, USA, 2013. [Google Scholar]
  83. Parker, A.; Maclaren, O.J.; Fletcher, A.G.; Muraro, D.; Kreuzaler, P.A.; Byrne, H.M.; Maini, P.K.; Watson, A.J.; Pin, C. Cell proliferation within small intestinal crypts is the principal driving force for cell migration on villi. FASEB J. 2017, 31, 636–649. [Google Scholar] [CrossRef]
  84. Souza da Silva, M.; Perricone, V.; Vieira, S.L.; Lemme, A.; Hancock, J.D. Effects of different levels of dietary pea protein on broiler performance. Poult. Sci. 2021, 100, 101478. [Google Scholar]
  85. Quinteiro-Filho, W.M.; Gomes, A.V.; Pinheiro, M.L.; Ribeiro, A.; Ferraz-de-Paula, V.; Astolfi-Ferreira, C.S.; Ferreira, A.J.; Palermo-Neto, J. Heat stress impairs performance and induces intestinal inflammation in broiler chickens infected with Salmonella Enteritidis. Avian Pathol. 2012, 41, 421–427. [Google Scholar] [CrossRef]
  86. Rehman, H.; Rosenkranz, C.; Böhm, J.; Zentek, J. Dietary inulin affects the morphology but not the sodium-dependent glucose and glutamine transport in the jejunum of broilers. Poult. Sci. 2007, 86, 118–122. [Google Scholar] [CrossRef]
  87. Landero, J.L.; Wang, L.F.; Beltranena, E.; Zijlstra, R.T. Diet nutrient digestibility and growth performance of weaned pigs fed field pea. Anim. Feed Sci. Technol. 2014, 198, 295–303. [Google Scholar] [CrossRef]
  88. Chen, H.; Mao, X.B.; Che, L.Q.; Yu, B.; He, J.; Yu, J.; Han, G.Q.; Huang, Z.Q.; Zheng, P.; Chen, D.W. Impact of fibre types on gut microbiota, gut environment and gut function in fattening pigs. Anim. Feed Sci. Technol. 2014, 195, 101–111. [Google Scholar] [CrossRef]
  89. Torrallardona, D.; Harris, C.I.; Fuller, M.F. Lysine synthesized by the gastrointestinal microflora of pigs is absorbed, mostly in the small intestine. Am. J. Physiol. Endocrinol. Metab. 2003, 284, E1177–E1180. [Google Scholar] [CrossRef] [PubMed]
  90. Zhang, G.; Zhao, J.; Song, X.; Yang, M.; Wang, H.; Wu, Y. Feeding dietary fermentable fibre improved fecal microbial composition and increased acetic acid production in a nursery pig model. J. Anim. Sci. 2023, 101, skad260. [Google Scholar] [CrossRef]
  91. Van Nevel, C.J.; Dierick, N.A.; Decuypere, J.A.; De Smet, S.M. In vitro fermentability and physicochemical properties of fibre substrates and their effect on bacteriological and morphological characteristics of the gastrointestinal tract of newly weaned piglets. Arch. Anim. Nutr. 2006, 60, 477–500. [Google Scholar] [CrossRef]
Figure 1. (a) Evolution of the Lactobacillus population in the ileum (lg10 colony-forming units/g wet content). (b) Evolution of the Lactobacillus population in the cecum (lg10 colony-forming units/g wet content). significant at * p ≤ 0.05; very significant at ** p ≤ 0.01; not significant at ns.
Agriculture 15 00897 g001
Figure 2. (a) Evolution of the Enterobacteriaceae population in the ileum (lg10 colony-forming units/g wet content). (b) Evolution of the Enterobacteriaceae population in the cecum (lg10 colony-forming units/g wet content). not significant at ns.
Agriculture 15 00897 g002
Figure 3. (a) Evolution of the Staphylococcus population in the ileum (lg10 colony-forming units/g wet content). (b) Evolution of the Staphylococcus population in the cecum (lg10 colony-forming units/g wet content). not significant at ns.
Agriculture 15 00897 g003
Table 1. The diet structures tested on the pigs during the experimental trial.
Ingredients, %Growing–Finishing Phase Diet
T0T10T20
Corn meal54.8548.6642.58
Triticale18.0018.0017.89
Soybean meal (46%)23.5019.6315.75
Peas-10.0020.00
Monocalcium phosphate0.750.730.70
Calcium carbonate1.001.001.00
Salt0.450.460.46
DL-methionine (98%)0.070.070.07
L-lysine HCl (99%)0.300.360.42
L-threonine (99%)0.070.090.12
Vitamin–mineral premix *1.001.001.00
Total100100100
Calculated nutrient content
ME, kcal/kg3255.823239.583223.77
CP, %17.5017.5017.50
DCP, %15.4715.3815.28
EE, %2.522.362.20
CF, %3.703.954.20
Ca, %3.490.860.85
DP, %0.250.250.25
DLys, %0.960.960.95
DMet, %0.310.310.31
DThr, %0.550.550.55
DTrp, %0.140.140.14
DArg, %0.950.970.99
Here, T0—control diet; T10—control diet supplemented with 10% peas; and T20—control diet supplemented with 20% peas; * mineral–vitamin premix (1%) was supplied per kg diet as follows: 10,000 IU vitamin A, 2000 IU vitamin D3, 30 IU vitamin E, 3 mg vitamin K3, 2 mg vitamin B1, 6 mg vitamin B2, 13.5 mg d-pantothenic acid, 20 mg nicotinic, 3 mg vitamin B6, 0.06 mg vitamin B7, 0.8 mg vitamin B9, 0.05 mg vitamin B12, 10 mg vitamin C, 30 mg vitamin Mn, 110 mg Fe, 25 mg Cu, 100 mg Zn, 0.38 mg I, 0.36 mg Se, 0.3 mg Co, and 60 mg antioxidants. ME—metabolizable energy; CP—crude protein; DCP—digestible crude protein; EE—ether extract; CF—crude fiber; DP—digestible phosphorus; Ca—calcium; DLys—digestible lysine; DMet—digestible methionine; DThr—digestible threonine; DTrp—digestible tryptophan; DArg—digestible arginine.
Table 2. Chemical composition of peas (g/100 g).
NutrientsValue 1
ME, MJ/kg DM 215.4 ± 0.84
Moisture, %9.46 ± 0.14
DM, %90.54 ± 0.89
dDM, %52.56 ± 0.78
OM, %86.98 ± 1.31
dOM, %54.05 ± 0.81
CP 3, %23.90 ±0.36
dCP, %75.09 ± 1.14
EE, %1.20 ± 0.31
CF, %6.00 ± 0.45
Ash, %3.56 ± 0.35
NES 4, %55.88 ± 1.89
ME—metabolizable energy; DM—dry matter; dDM—dry matter digestibility; OM—organic matter; dOM—organic matter digestibility; dCP—crude protein digestibility; EE—ether extract; CF—crude fibre; 1 mean ± standard deviation of three-replicate analysis; 2 Heuzé et al. (2017) [36]; 3 crude protein (CP) = (N × 6.25); 4 NES—non-nitrogenous extractive substances, determined by difference.
Table 3. Growth performance and nitrogen balance (average values/group).
ParametersExperimental DietsSEMp-Value
T0T10T20
Growth performance
BW at 70 days (kg)25.0026.5025.831.230.703
BW at 105 days (kg)69.5069.5067.001.770.549
FCR (feed/gain)2.51 b2.72 a2.78 a0.050.017
Feed intake
ADFI (kg)2.46 b2.78 a2.61 a1140.018
DMI (kg)2.16 b2.44 a2.30 a99.90.018
N intake (g)60.4168.4564.302.800.176
Nitrogen output
N fecal output (g)11.2210.858.511.180.172
N urinary output (g)14.5717.7517.802.310.571
TNO25.7928.6026.312.460.684
Coefficients of digestibility
N digestibility, %81.2683.4186.472.070.242
ATTND coefficient0.810.830.880.020.259
AMN coefficient0.570.580.580.040.988
N retained (g/day)34.61 b39.80 a37.66 ab3.900.042
BVP, %70.6969.2767.703.790.865
NPU, %57.4057.8558.703.720.970
Here, T0—control diet; T10—control diet supplemented with 10% peas; T20—control diet supplemented with 20% peas; BW—body weight; FCR—feed conversion ratio; ADFI—average daily feed intake; DMI—dry matter intake; TNO—total nitrogen output; N—nitrogen (intake, fecal/urinary output, digestibility, and retained); ATTND—apparent total tract nitrogen digestibility coefficient; AMN—apparent metabolizable nitrogen coefficient; BVP—biological value; NPU—net protein utilization; SEM—standard error of the mean; a,b mean values within a row not sharing the same superscripts are significantly different at p < 0.05.
Table 4. Effects of dietary peas on blood protein profile of pigs (average values per group).
ParametersExperimental DietsSEMp-Value
T0T10T20
Protein profile
T-Bil mg/dL0.103 b0.400 ab0.800 a0.1030.030
T-Pro g/dL5.5506.2675.8670.5140.687
Alb g/dL3.6503.9673.9330.3380.826
BUN mg/dL21.5024.0020.001.3300.196
UA mg/dL0.450 b0.650 ab1.067 a0.1310.046
Cre mg/dL1.2001.4001.1670.0990.296
Here, T0—control diet; T10—control diet supplemented with 10% peas; T20—control diet supplemented with 20% peas; SEM—standard error of the mean; a,b mean values within a row not sharing the same superscripts are significantly different at p < 0.05; T-BIL—total bilirubin; T-Pro—total protein; Alb—albumin; BUN—blood urea nitrogen; UA—uric acid; Cre—creatinine.
Table 5. Dietary peas’ influence on the intestinal short fatty acids (average values/diet group).
ParametersExperimental DietsSEMp-Value
T0T10T20
Cecum
SCFA (µmol/g)
Acetic acid C243.63 b58.01 a53.51 a1.3400.017
Propionic acid C319.7025.0623.711.6100.426
Isobutyric acid i-C40.220.300.300.0360.603
Butyric acid C48.60 b12.33 a12.84 a0.4150.017
Isovaleric acid i-C50.240.370.320.0450.544
Valeric acid C50.550.690.930.0630.447
Total SCFAs72.9396.7491.60--
SCFA (%)
Acetic acid C259.8259.9658.421.5000.739
Propionic acid C327.0125.9025.881.8100.904
Isobutyric acid i-C40.300.300.330.0400.876
Butyric acid C411.80 b12.75 ab14.01 a0.4880.048
Isovaleric acid i-C50.330.380.350.0500.823
Valeric acid C50.750.711.010.1070.166
Ileum
SCFA (µmol/g)
Acetic acid C27.55 b27.09 a24.13 a1.0900.001
Propionic acid C30.370.320.260.0280.316
Isobutyric acid i-C40.11 b0.26 a0.23 a0.0100.003
Butyric acid C40.110.320.500.0510.059
Isovaleric acid i-C50.15 b0.39 a0.54 a0.0430.018
Valeric acid C50.060.040.050.0040.159
Total SCFAs8.3428.4225.70--
SCFA (%)
Acetic acid C290.5695.3393.906.7400.879
Propionic acid C34.41 a1.11 b0.99 b0.3960.001
Isobutyric acid i-C41.26 a0.92 b0.90 b0.0750.027
Butyric acid C41.261.131.930.2680.160
Isovaleric acid i-C51.801.372.100.4110.494
Valeric acid C50.72 a0.13 b0.18 b0.0600.001
Here, T0—control diet; T10—control diet supplemented with 10% peas; T20—control diet supplemented with 20% peas; SEM—standard error of the mean; a,b mean values within a row not sharing the same superscripts are significantly different at p < 0.05; SFCAs—short chain fatty acids.
Table 6. Dietary peas’ influence on intestinal length and pH value.
ParametersExperimental DietsSEMp-Value
T0T10T20
pH cecum5.475.385.290.0510.164
pH jejunum6.216.236.260.0490.830
Duodenum length (cm/kg)0.300.310.290.0230.841
Ileum length (cm/kg)0.26 b0.25 b0.36 a0.0300.049
Cecum length (cm/kg)0.370.380.400.0080.094
Total digestive tract (cm/kg)37.62 b36.69 b43.67 a1.0900.013
Here, T0—control diet; T10—control diet supplemented with 10% peas; T20—control diet supplemented with 20% peas; SEM—standard error of the mean; a,b mean values within a row not sharing the same superscripts are significantly different at p < 0.05.
Table 7. Dietary peas’ effects on pigs’ intestinal morphology.
ParametersExperimental DietsSEMp-Value
T0T10T20
Villus (length) µm
Duodenum615.7 a527.1 ab438.9 b31.30.002
Jejunum511.0457.3541.643.50.391
Ileum437.9361.9380.730.90.203
Villus (width) µm
Duodenum147.6 b213.3 a143.7 b12.20.012
Jejunum110.0 b164.3 a178.9 a18.10.003
Ileum155.4173.4185.616.20.399
Villus area (length × width)
Duodenum77,40866,40260,68773820.259
Jejunum37,180 b68,553 a88,413 a82380.001
Ileum63,49259,73659,78652240.876
Crypts (depth) µm
Duodenum616.6676.5602.131.70.219
Jejunum445.8 b558.5 a589.9 a26.10.004
Ileum451.1 b666.9 a587.5 a31.50.0001
Villus/crypt ratio
Duodenum1.03 a0.89 ab0.77 b0.0660.035
Jejunum1.081.030.930.1260.651
Ileum1.01 a0.54 b0.65 b0.0850.001
Here, T0—control diet; T10—control diet supplemented with 10% peas; T20—control diet supplemented with 20% peas; SEM—standard error of the mean; a,b mean values within a row not sharing the same superscripts are significantly different at p < 0.05.
Table 8. Correlation between performance, nutrient digestibility, volatile fatty acids, intestinal microbiota, and histology of growing pigs.
Pearson’s CorrelationPerformancesNitrogen BalanceVolatile Fatty AcidsIntestinal MicrobiotaIntestinal Morphology
CecumIleumLactobacilliVillus/Crypt Ratio (V:C)
BWFCRADFIN
Intake
TNON
Retained
dNC2C3C4C2C3C4IleumCecumDuodenumJejunumIleum
PerformanceBW1
FCR−0.6721
ADFI0.0360.7161
Nitrogen balanceN
Intake
0.0190.7281.000 **1
TNO0.3420.4660.9510.9461
N
Retained
−0.3700.9370.9150.9220.7461
dN−0.9120.9170.3770.3930.0740.7191
Volatile fatty acidsCecumC2−0.2110.8660.9690.9730.8460.9860.5941
C3−0.2750.8970.9510.9560.8090.995 *0.6460.998 *1
C4−0.5920.995 *0.7840.7940.5550.9680.8710.9130.,9381
IleumC2−0.3730.9380.9140.9210.7441.000 **0.7210.9860.995 *0.9691
C30.891−0.935−0.421−0.437−0.122−0.752−0.999 *−0.632−0.682−0.894−0.7541
C4−0.8430.9650.5070.5220.2170.8120.990 *0.7040.7490.9330.814−0.995 *1
LactobacilliIleum−0.4440.9620.8790.8880.6900.997 *0.7730.9700.9840.9850.997 *−0.8020.8561
Cecum−0.5290.9840.8290.8390.6170.9840.8310.9410.9620.997 *0.985−0.8560.9020.995 *1
Intestinal morphologyV:C ratioDuodenum0.843−0.965−0.507−0.522−0.217−0.812−0.990 *−0.704−0.749−0.933−0.8140.995 *−1.000 **−0.856−0.9021
Jejunum0.945−0.877−0.293−0.3100.015−0.654−0.996 *−0.519−0.575−0.823−0.6560.991 *−0.973−0.713−0.7770.9731
Ileum0.294−0.905−0.945−0.950−0.798−0.997 *−0.660−0.996 *−1.000 **−0.944−0.996 *0.696−0.762−0.987−0.9670.7620.5901
BW—body weight; FCR—feed conversion ratio; ADFI—average daily feed intake; N intake—nitrogen intake; TNO—total nitrogen output; N retained—nitrogen retained; dN—digestibility of nitrogen; C2—acetic acid; C3—propionic acid; C4—butyric acid; * correlation is significant at the 0.05 level; ** correlation is significant at the 0.01 level.
Disclaimer/Publisher’s Note: The statements, opinions and data contained in all publications are solely those of the individual author(s) and contributor(s) and not of MDPI and/or the editor(s). MDPI and/or the editor(s) disclaim responsibility for any injury to people or property resulting from any ideas, methods, instructions or products referred to in the content.

