Abstract
Land desertification is becoming increasingly significant for the Mediterranean basin, particularly due to the rising pressures on agricultural land. Regarding the olive grove sector, intensive farming methods can have detrimental effects on the provision of various agroecosystem services. Conversely, agroecological approaches, such as reduced tillage/no tillage and the use of cover crops, can help mitigate soil degradation and enhance soil arthropod biodiversity. Herein, an experiment was conducted in a hilly olive grove in southern Peloponnese, a key olive production area in Greece. Different soil treatments were implemented across nine plots (three plots per treatment), including the following: (i) the use of a cover crop mixture (Pisum sativum, Vicia faba, Hordeum vulgare), (ii) herbicide application, and (iii) spontaneous vegetation (control). A comprehensive survey was performed at the plot level for monitoring carbon sequestration and ground-dwelling arthropod diversity. The results indicated that cover crops had a positive impact on soil fertility and structure, leading to an increase in total biomass production per plot, while also contributing to the preservation of key soil arthropod populations when compared to treatments that resulted in bare soil. The findings from this in situ study are meant to be integrated into the frames of a long-term monitoring process in order to be used for climate change mitigation and biodiversity management models, enhancing the resilience and regeneration of degraded land.
1. Introduction
Olive (Olea europaea L.) is the most prominent and socioeconomically significant fruit tree in the Mediterranean Basin. Approximately ten million hectares are dedicated to olive production, employing organic, traditional, intensive, and, more recently, high-density intensive groves, resulting in an annual production of approximately 3,000,000 metric tons of olive oil [1]. However, the environmental conditions for many olive groves have deteriorated due to land degradation resulting from over 50 years of intensive agriculture. The inadequate management of olive groves is directly linked to various issues, including the depletion of organic matter and decline of the respective provisioning services [2]. Moreover, several studies revealed a severe decrease in biodiversity in the olive agroecosystem [3,4,5], areas that are essential for environmental conservation in the Mediterranean region, being able to support a rich variety of species [6].
While significant technological advancements have enhanced the production and quality of olive oil in the past three decades, further efforts are necessary to address the environmental impacts of the production process. For this reason, soil conservation and agroecological approaches, like organic farming, are currently being fostered by EU policies, along with an increase in consumer demand for organic olive oil.
Regarding this frame, since 2020, the EU Green Deal has set an ambitious roadmap to make the AE, Europe the first carbon-neutral continent based on a resource-efficient economy [7]. With approximately half of the habitable land allocated to agriculture [8], agricultural soils play a critical role in maintaining a balanced global carbon cycle and providing mitigation and adaptation strategies to address global climate change [9,10,11]. Thus, there is a growing interest in the role of cropping agricultural systems due to their significant impact on soil health, climate, and overall biodiversity. By considering ecosystem functions and processes, modern farming practices could be optimized to enhance management strategies that provide robust ecosystem services, including carbon sequestration, as well as soil and biodiversity conservation [12].
Cover cropping has been recognized as an effective practice to promote soil conservation, offering co-benefits for the sustainability and resilience of agriculture [13,14] and compensating for soil carbon losses resulting from land-use change and tillage in agricultural fields [15,16,17]. The quantity of plant residue and the degree of soil organic carbon (SOC) decomposition are critical for the formation and stabilization of aggregates, which in turn enhance soil structure and drive SOC sequestration [18,19].
A diverse plant cover can also provide food and a habitat, hosting a great diversity of various beneficial organisms in olive groves [20]. In agricultural systems, biodiversity delivers ecosystem services such as nutrient recycling or the improved suppression of pest insects via biological control agents. Herbivorous pollinators or predators and parasitoid arthropods are involved, and their manipulation can result in beneficial or detrimental effects for the orchard’s pest control [21,22].
Regarding olive groves, the composition and structure of the arthropod fauna of the soil can be rich and diverse, composed of several orders of arachnids, chilopods, and insects [23]. Among other groups, ants are considered an important factor for olive fruit fly (Bactrocera oleae) suppression, especially in the pupal stage. In fact, ants as generalist predators can be more efficient in the biological control of pests than specialist natural enemies [24]. Besides pest control, arthropod communities dwelling on soil contribute to the shredding of organic matter, stimulation of microbial activity, enhancement of soil aggregation, mineralization of plant nutrients for bacteria and fungi, and burrowing, which improves water infiltration [25]. Thus, the manipulation of the olive grove’s plant diversity may affect communities living within or nearby through an increase in resources [26,27].
Regarding this context, the primary objective of the current study was to test the hypothesis that cover crops applied in a Mediterranean olive grove would significantly contribute to greenhouse gas (GHG) mitigation through the enhancement of soil carbon pools (soil organic carbon and litter). The second objective was to examine the impact of these practices on the dwelling arthropod biodiversity. Overall, this study aims to develop guidelines for best practices to improve sustainability within a multifunctional agricultural context.
2. Materials and Methods
An ongoing experiment was set in a 4 ha commercial olive grove, located 15 km east of Pylos, Peloponnese, Greece (36°55′51″ N, 21°43′22″ E), and planted with Koroneiki cv at a 10 × 10 m planting density. The orchard’s elevation was 65 m above sea level, having a slope of approximately 22%. The experiment focused on key common practices regarding ground cover vegetation management resulting in bare or covered soil.
In the frames of a three-year monitoring scheme, several key parameters were monitored for the harvesting period 2022–2024, including soil properties, ground-dwelling arthropod diversity, olive tree nutrient status, and C sequestration, along with climate data.
2.1. Treatments and Design
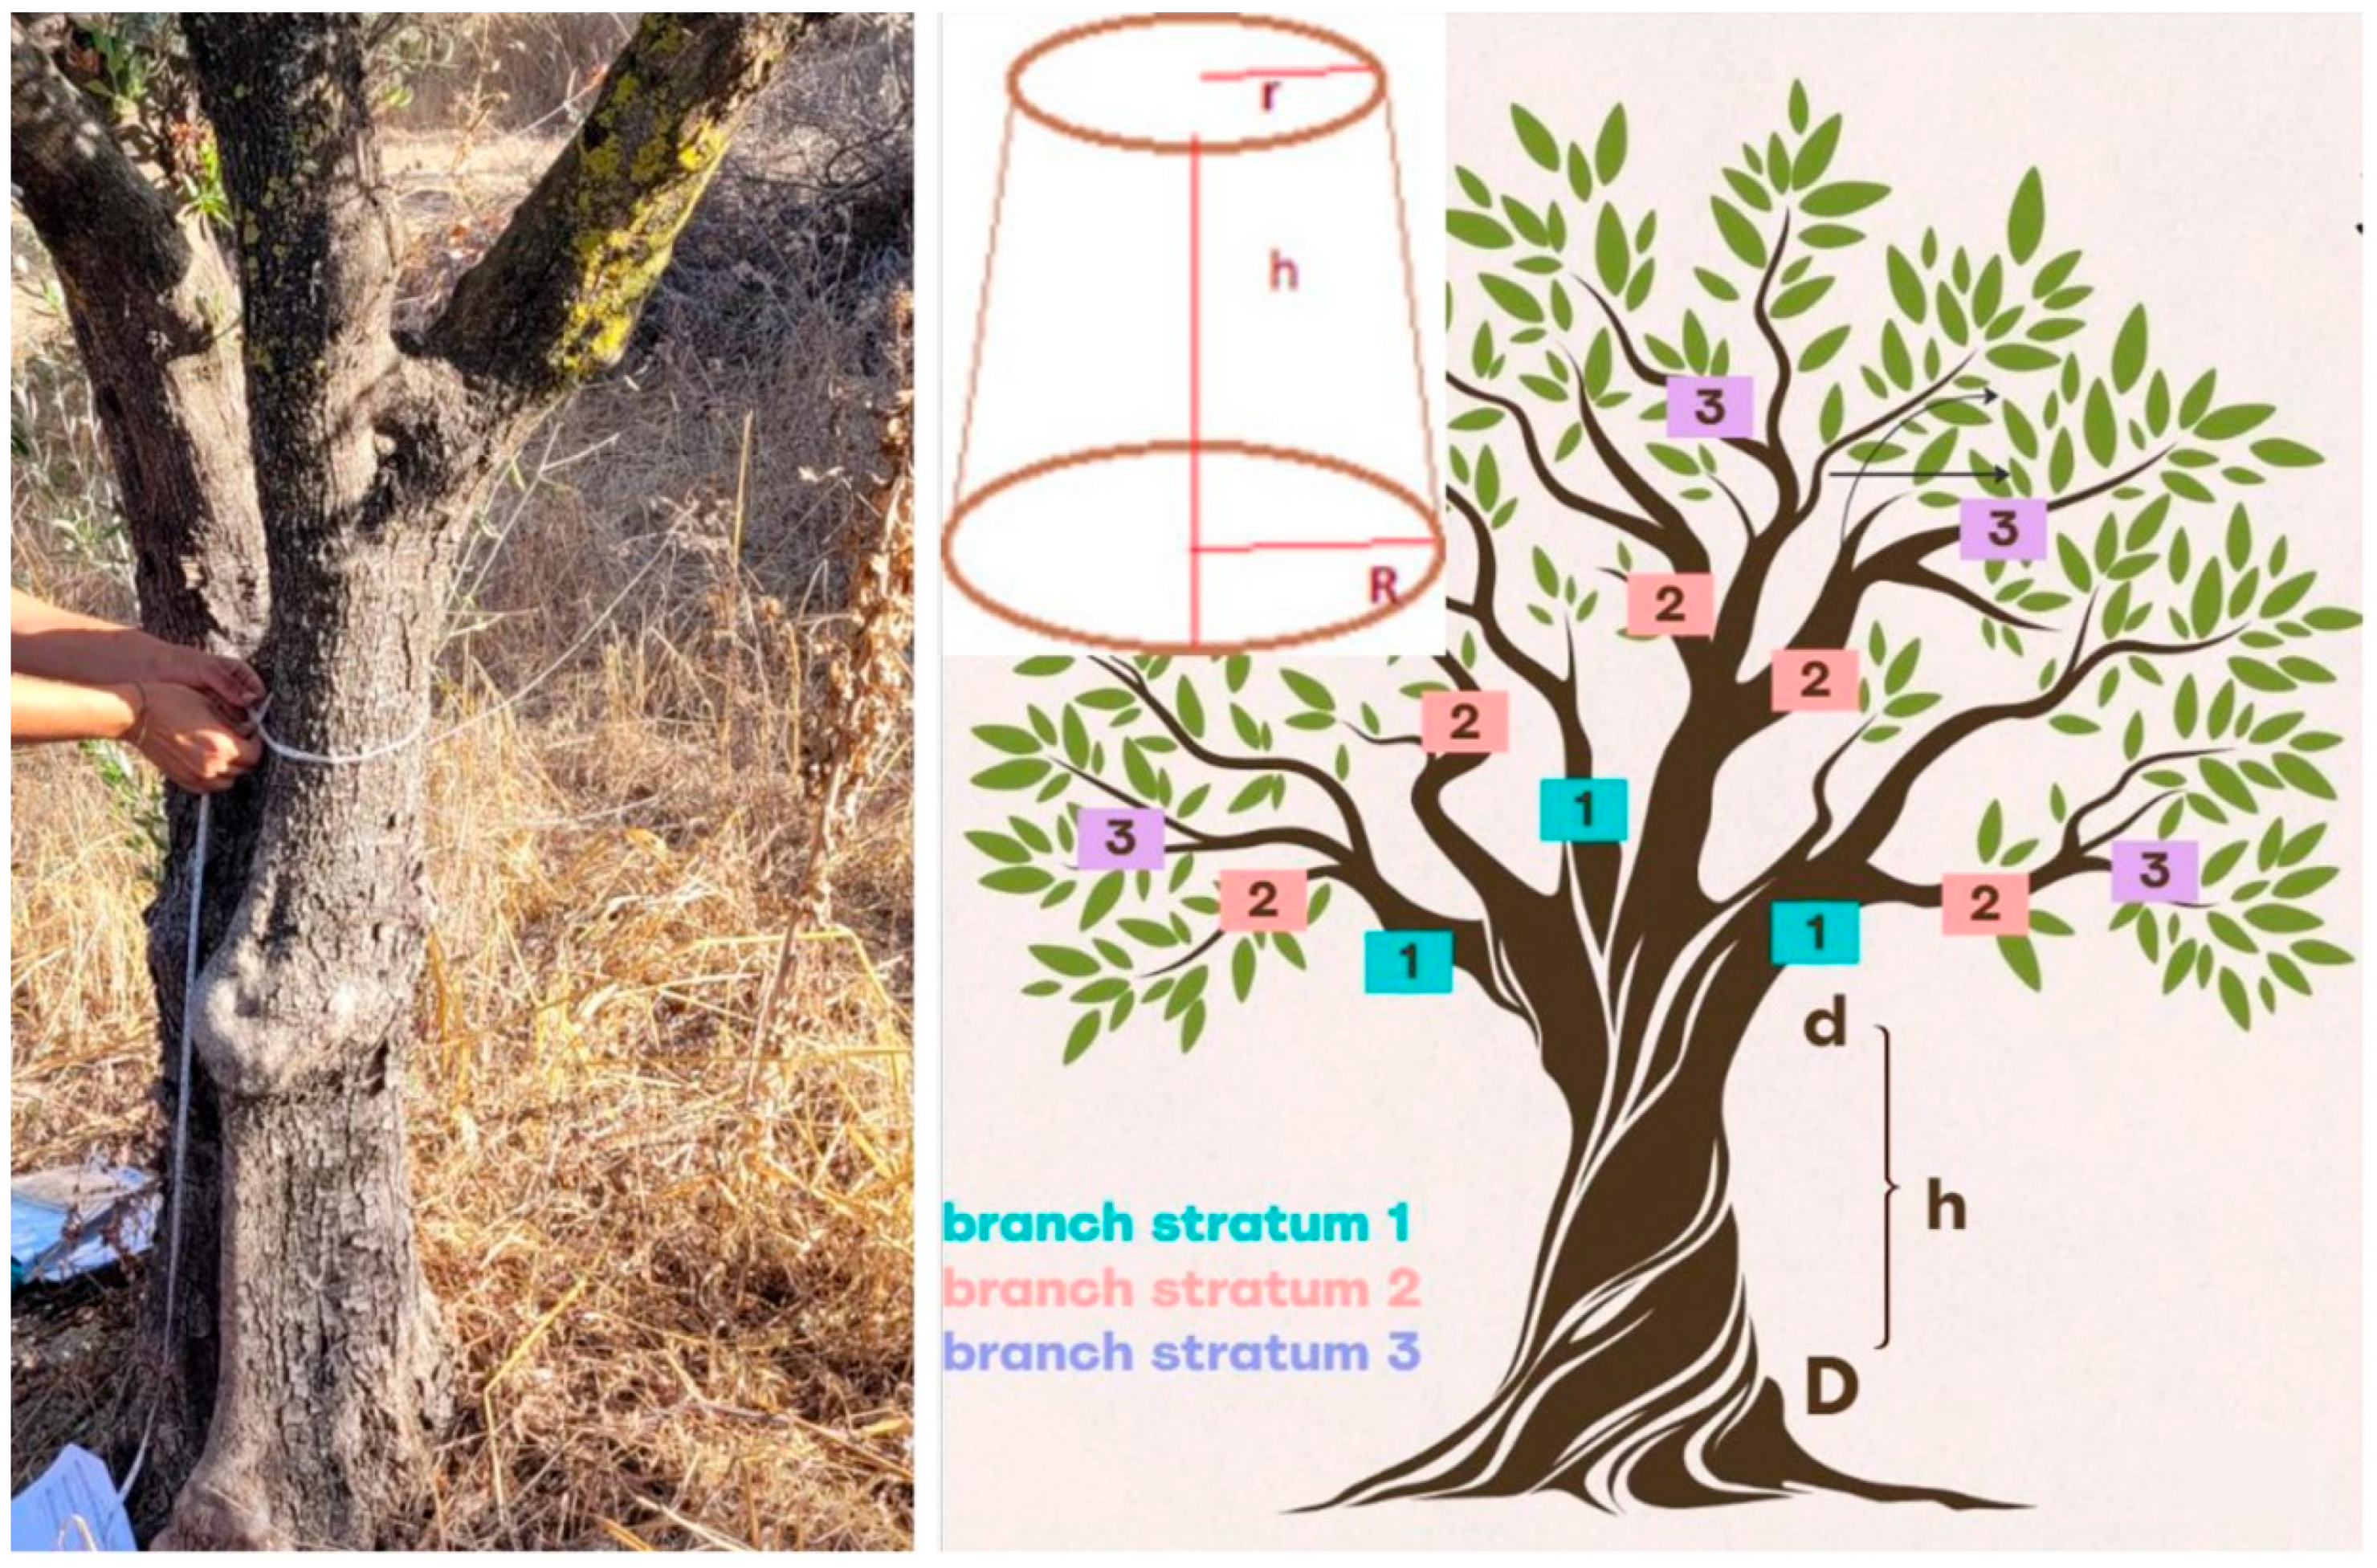
A Complete Block Design (CBD) with replicates was used for comparing 3 different groundcover treatments across homogeneous units to maximize experimental control. Each treatment consisted of 3 experimental plots of a 90 m2 size, with a total of 34 olive trees (Figure 1). The different groundcover applications included the following: (i) the use of a cover crop mixture (Pisum sativum, Vicia faba, Hordeum vulgare), (ii) herbicide application, and (iii) spontaneous vegetation. In the selected plots, herbicide was applied 2 times per year, mostly concentrated in winter and spring using glyphosate (PitonTM, 0.36 kg a.e. L1, Dow AgroSciencesTM, Indianapolis, IN, USA). Cover crops were manually applied and spread with a rake to minimize soil disturbance. Despite weed control, the respective inputs, equipment use, and management practices were the same in all plots.
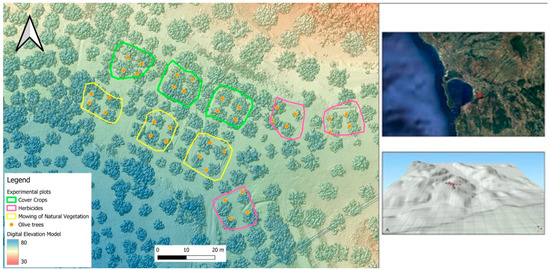
Figure 1.
Experimental site location, topography, and design.
2.2. Carbon Sequestration Assessement
Carbon sequestration assessment included (i) the soil organic C during 2022–2024; (ii) the C stored in the olive trees’ above- and below-ground biomass, and (iii) the annual rate of C accumulation in the groundcover biomass, calculated on dry basis, considering groundcover density/ha, plant biomass, and organic carbon content.
2.2.1. Soil Organic Carbon Stock
At the commencement of this study (autumn 2022), a soil sample was collected for physiochemical analysis to later serve as a baseline descriptor. Nine soil cores were randomly extracted from each treatment plot at a depth of 0–30 cm, utilizing a soil auger, ensuring the removal of any visible crop residues from the surface prior to sampling.
Throughout the duration of the study, from 2022 to 2024, soil sampling was annually repeated in autumn, using the same procedures to quantify any changes in the soil organic carbon (SOC). The soil samples were air dried, shredded, homogenized, and sieved. Then, the soil samples were pre-treated with 6 M HCl to eliminate inorganic C. Later, the organic C content was determined by employing the potassium-dichromate oxidation method [28,29]. To compute the carbon stock, the bulk density was adjusted for the coarse soil fraction, following the method of Blake and Hartge (1986) [30], using a cylinder 5 cm high, and correcting the total volume according to the percentage of gravel, similar to the method proposed by Throop et al. (2012) [31] (Equation (1)).
where Wc is the dry weight of the soil in each cylinder (g), Wg is the weight of gravel (>2 mm) (g), and Vc is the volume of the cylinder (cm3).
BD = (Wc − Wg)/Vc
Subsequently, the SOC stock per hectare was calculated by multiplying the SOC (g kg−1) by the BD (Mg m−3) and the soil depth (0–20) [32,33,34]. Subsequently, the changes in soil carbon concentration (%) and stock (Mg C ha−1) were calculated by determining the difference between the initial and final values. Finally, the average annual carbon accumulation rate (kg C ha−1 yr−1) was computed over the two-year experimental period.
2.2.2. Carbon Accumulation in the Olive Tree
The annual rate of olive tree C accumulation in the permanent structures of trees (trunk and >3 cm shoots) was calculated for one selected tree per treatment, in three replications from 2022 to 2024. The olive wood density (Dtree) (g/cm3) was calculated using the ratio of dry weight (Ws) (g) and the resulting volume of each branch (Vs) (cm3) (Equation (2)). To achieve this, a representative cylindrical part (length: >15 cm, diameter: >5 cm) was pruned and subsequently oven-dried (4 days at 45 °C).
Dtree = Ws/Vs
The olive tree biovolume estimation was carried out by comparing each tree part to a geometric figure corresponding to a truncated cone (Figure 2) (Equations (3) and (4)) [35].
where Vs is the volume of each section (cm3); h is the height (cm); R is the largest radius (cm); and r is the smallest radius (cm).
Vs = 1/3 × π × h × (R2 + r2 + R × r)
Vtree = ∑ni=1Vs
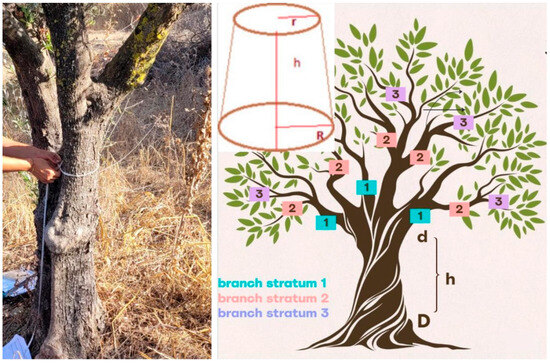
Figure 2.
Measuring biovolume by assessing the circumference of each branch. D: largest diameter (cm); d: smallest diameter (cm); h: branch length (cm).
The aerial tree biomass (Ba) was calculated from the wood density and above-ground volume of the trees (Equation (5)).
Ba = Vtree × δ
In order to determine the root biomass (Br), a corrective factor (4.2) was applied [29] (Equation (6)).
Br = Ba/4.2
The total olive tree biomass (Bt) (kg tree−1) was obtained by applying a corrective biomass expansion factor (1.13) that compensates for the non-measured canopy biomass in leaves and branches placed above stratum 3 [36] (Equation (7)).
Bt = (Ba + Br) × 1.13
The total organic carbon (kg Ctree−1) accumulated in the tree was determined by assessing the total dry biomass of the tree and the organic carbon content. Subsequently, the carbon content of the olive tree (Mg C ha−1) for each treatment was calculated based on the average total carbon stock in the tree (both above and below ground) and the number of trees per treatment (n = 12).
Both heavily and lightly pruned branches (including leaves, shoots, and branches) were collected from the field in autumn to ascertain the pruning dry biomass, which was calculated by multiplying the average fresh pruning weight per tree (kg ha−1 year−1) by the number of trees (trees ha−1) adjusted for the water content percentage.
2.2.3. Carbon Accumulation in the Groundcover Flora
The above-ground biomass of the groundcover was assessed using quadrants (1 m2), with three replications per plot conducted a few days prior to termination, to estimate the fresh biomass (Figure 3). Approximately 500 g of sub-samples were collected and subsequently oven-dried at 45.5 °C for 72 h. The harvested above-ground dry biomass was considered to represent the above-ground net annual primary production.
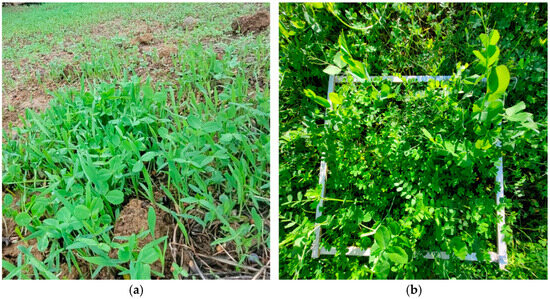
Figure 3.
Cover crops three weeks after sowing (a), cover crop biomass assessment using quadrant (b).
The annual above-ground net primary production (kg ha−1 y−1) was based on the harvested biomass within the frames and the soil cover percentage, which was also assessed using quadrants in 12 random locations within each plot. The net annual biomass production of the root system of the groundcover was estimated by applying a root-to-aerial biomass ratio of 2.32 [37]. Then carbon content in the root biomass was calculated from the root biomass, assuming an average root carbon content of 42.4% [38].
2.2.4. C Sequestration
The annual carbon sequestration rate serves as a critical indicator for calculating the carbon footprint. This metric is essential for evaluating the various agricultural practices implemented in the olive tree plantation, assessing their impact on carbon sequestration and greenhouse gas (GHG) emissions, and formulating guidelines aimed at enhancing carbon sequestration and mitigating GHG emissions within the agroecosystem [29]. Therefore, in this study, the annual carbon rates were determined in each treatment by dividing the total amount of carbon accumulated in the biomass and soil by the age of the plantation (approximately 35 years).
2.3. Soil Arthropod Biodiversity
To assess soil arthropod diversity, pitfall traps were positioned in each plot over a two-week period during the autumn and spring seasons from 2022 to 2024. Nine monitoring stations per hectare were established in the center of each plot, consisting of two traps each. The traps utilized were plastic and colorless, with a diameter of 7.5 cm and a height of 11.5 cm, filled with propylene, and were installed at the same level as the soil surface to minimize terrain disturbance. The samples collected were transported in plastic bags to the laboratory, to be filtered and cleaned of debris and inorganic material. The processed samples were then placed in Petri dishes and identified using a stereomicroscope (C-PS, Nikon, Melville, NY, USA).
Classification was performed up to the order level to estimate arthropod abundance and richness (S), based on quantifiable morphological characteristics. Such higher levels of arthropod classification are recognized for their efficiency in rapid biodiversity surveys, thereby conserving time and resources [39,40]. Samples were also analyzed in terms of diversity indices, including the reverse Simpson’s Index (1-D) and Pielou’s Index (J), since both indices are particularly valuable for comparative community assessments [41].
Additionally, further classification into important functional groups was performed, concerning the delivery of prioritized agroecosystem services within an olive grove, aiming to provide a representative overview of the “functional” fauna [42]. Based on the functions provided by most of the species, the target services identified were biological pest control (BPC) and decomposition–nutrient cycling (NC) [43]. The BPC subgroup comprised arthropod taxa that predominantly include typical potential predators of Tephritidae pupae, such as Araneae, Coleoptera, Formicidae, Dermaptera, and Chilopoda [44,45]. The NC subgroup included taxa where primary decomposers and detritivores are found, including Isopoda and Diplopoda [46,47] (Table 1).

Table 1.
Soil arthropod taxa delivering ecosystem services in an olive grove.
2.4. Data Analysis
The effects of and interactions between factors on measured parameters were assessed using analysis of variance (ANOVA), derived from linear mixed-effects (LME) models, using SPSS 20.0® for Windows. The data were assessed for their normality by means of the Shapiro–Wilk test (p < 0.05), and were found to be not normally distributed. For that reason, the Kruskal–Wallis non-parametric test was selected to assess the arthropod community’s differences between the three treatments, with a significance reported at the predefined levels of p < 0.05. Also, post hoc testing using Dunn’s Bonferroni approach for pairwise comparisons was performed to avoid Type I errors. Real means and standard errors of means were generated by using the ‘apply’ function in R software (R Core Team 2014) [48].
3. Results
3.1. Carbon Sequestration
3.1.1. Soil Organic Carbon
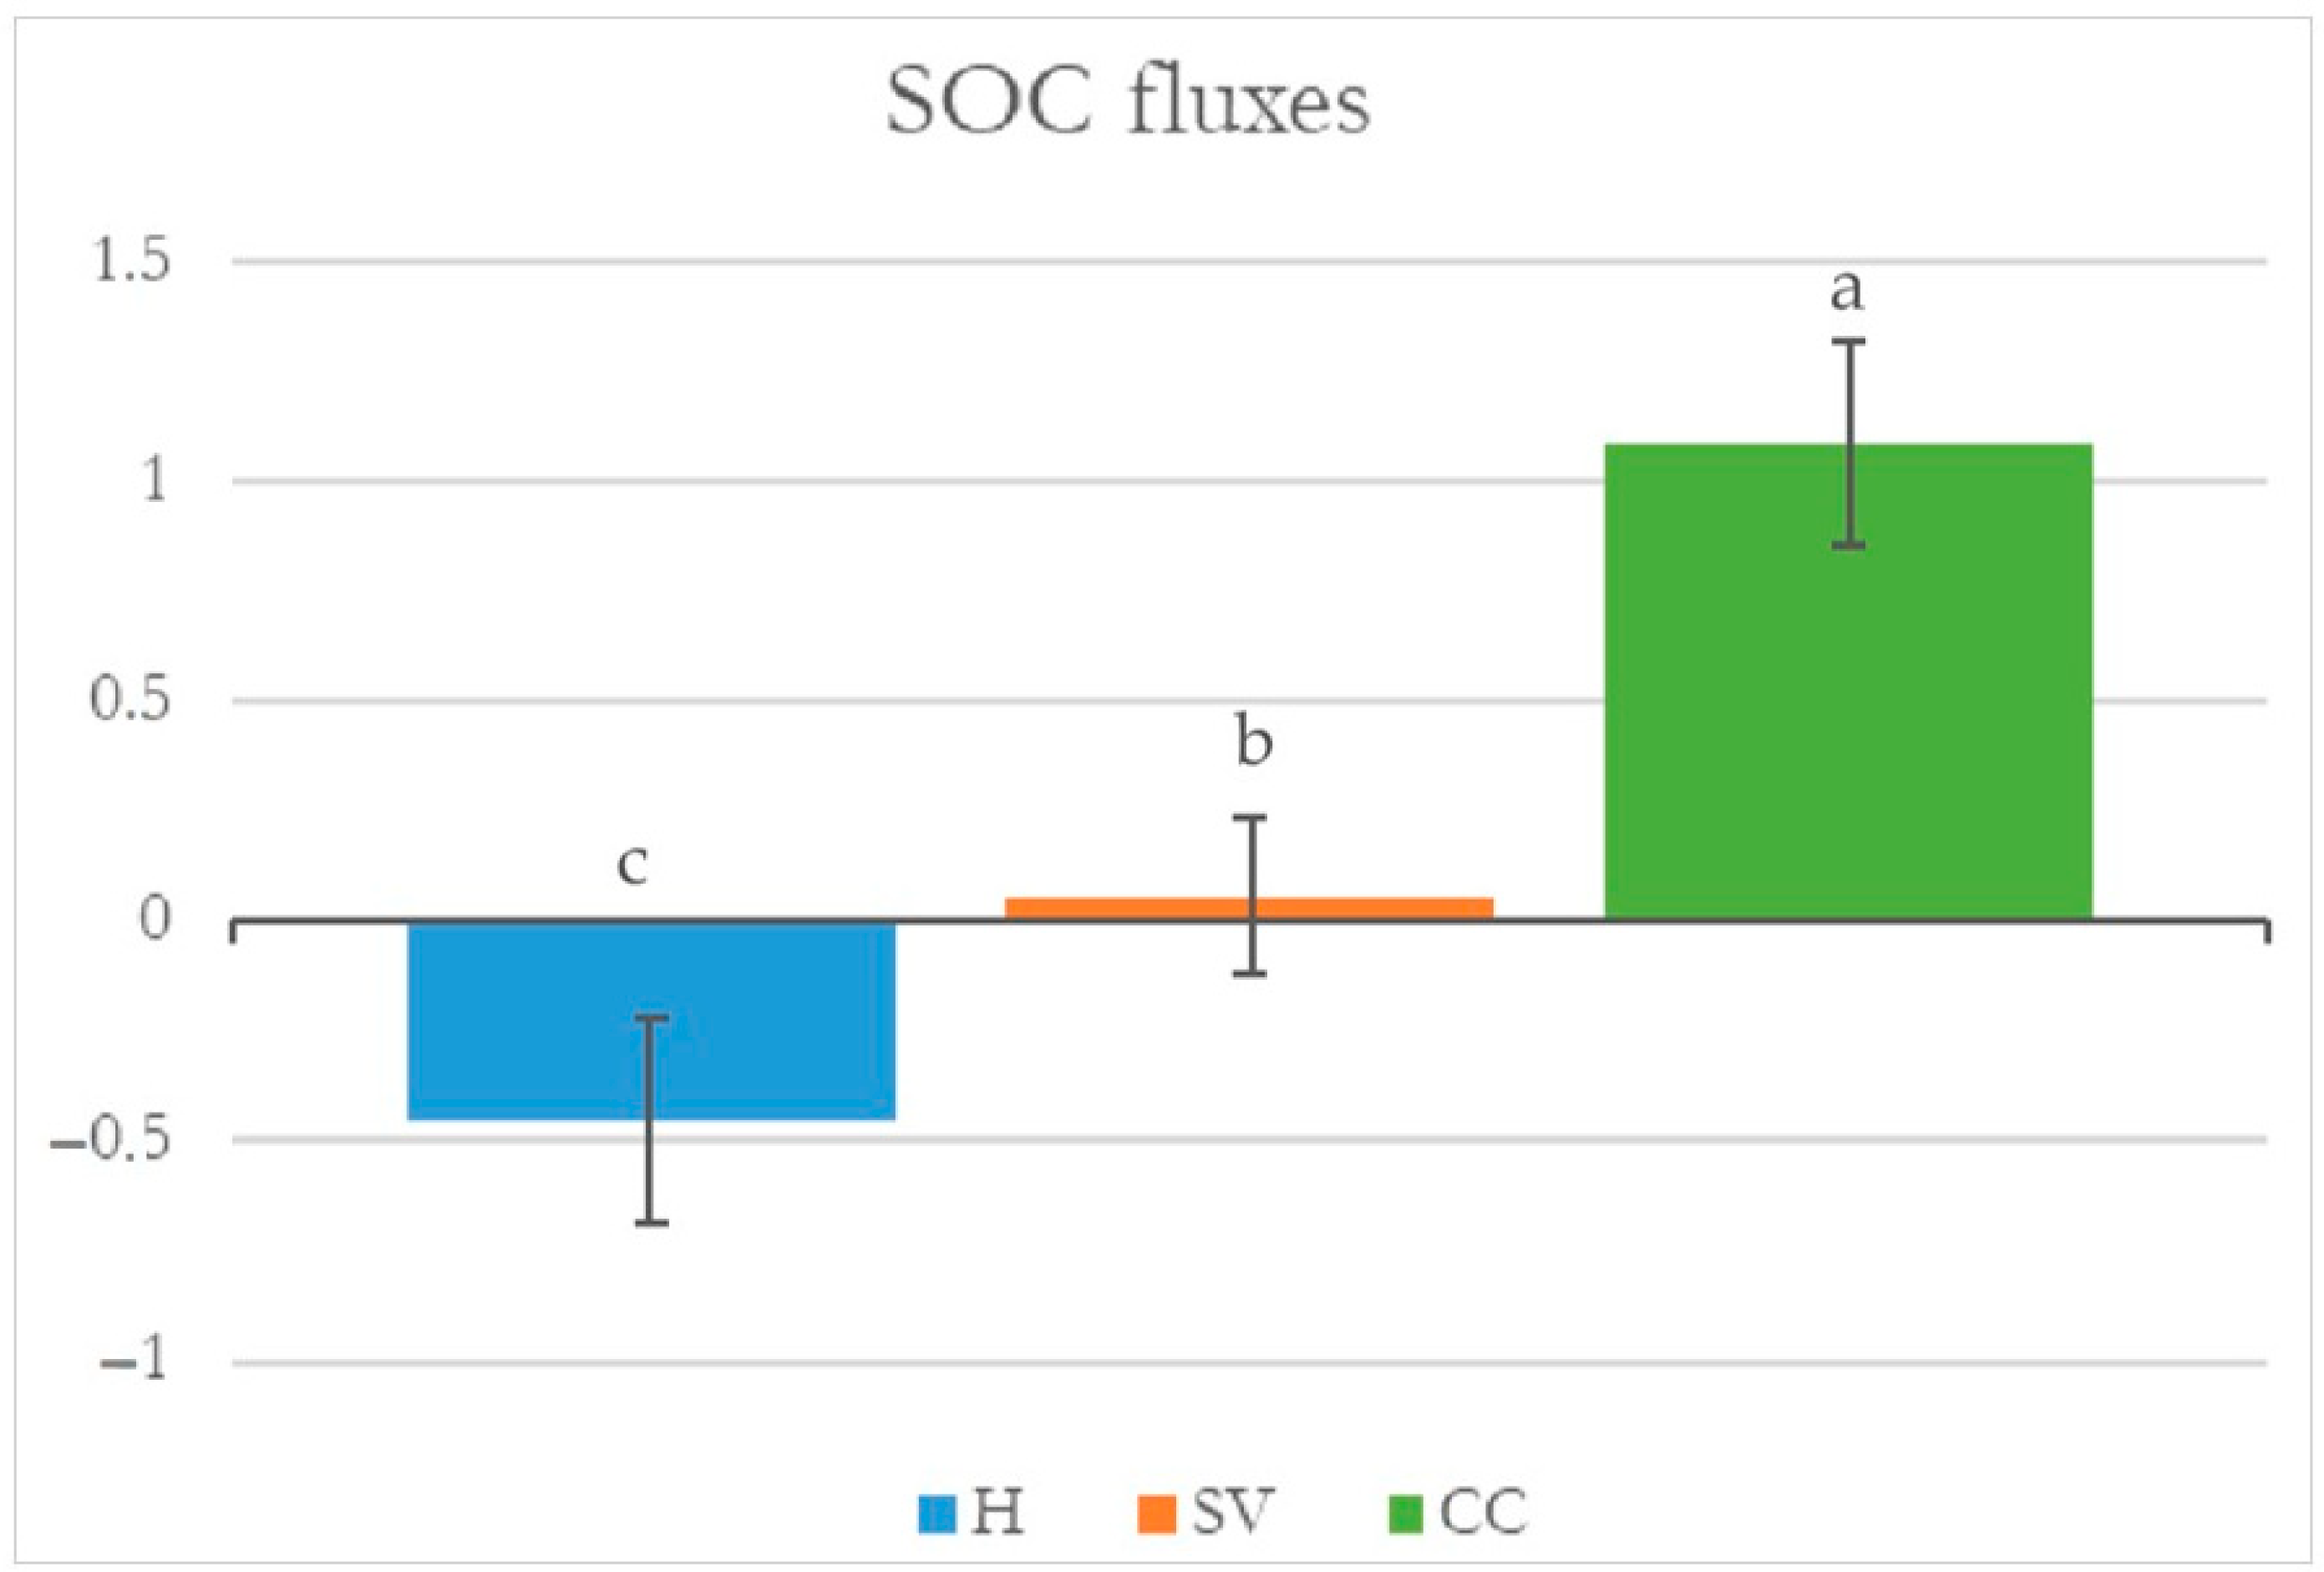
Throughout the two years of experimentation, the soil organic carbon (SOC) content in the topsoil (0–20 cm) ranged from 0.8% to 1.82%. The overall mean values for both years were higher in the cover crop (CC) treatment (1.36%) compared to herbicide (H) (0.95%) and spontaneous vegetation (SV) treatments (1.05%). In contrast to the first year, where the SOC did not show statistically significant differences among the groundcover treatments, the overall results indicate a significant difference (p < 0.05), as the second year demonstrated an increase in the SOC in CC, while a decrease was observed in H (Table 2, Figure 4).
Table 2.
Mean values and standard errors (±SD) of soil organic carbon (SOC) concentration (%), C stock in soil (Mg C ha−1), C in olive trees and the groundcover flora (Mg ha−1 yr−1), and carbon sequestration (Mg ha−1 yr−1) measured during 2022 and 2023 in each treatment.

Figure 4.
Soil organic carbon (SOC) rate fluxes among treatments (H: herbicide, SV: spontaneous vegetation, and CC: cover crops) within the 2022–2023 period. The error bar represents standard error (±SD). Mean values for each measured parameter are not significantly different in the case of the same letter (p < 0.05; Duncan test).
3.1.2. Carbon Accumulated in Plant Material
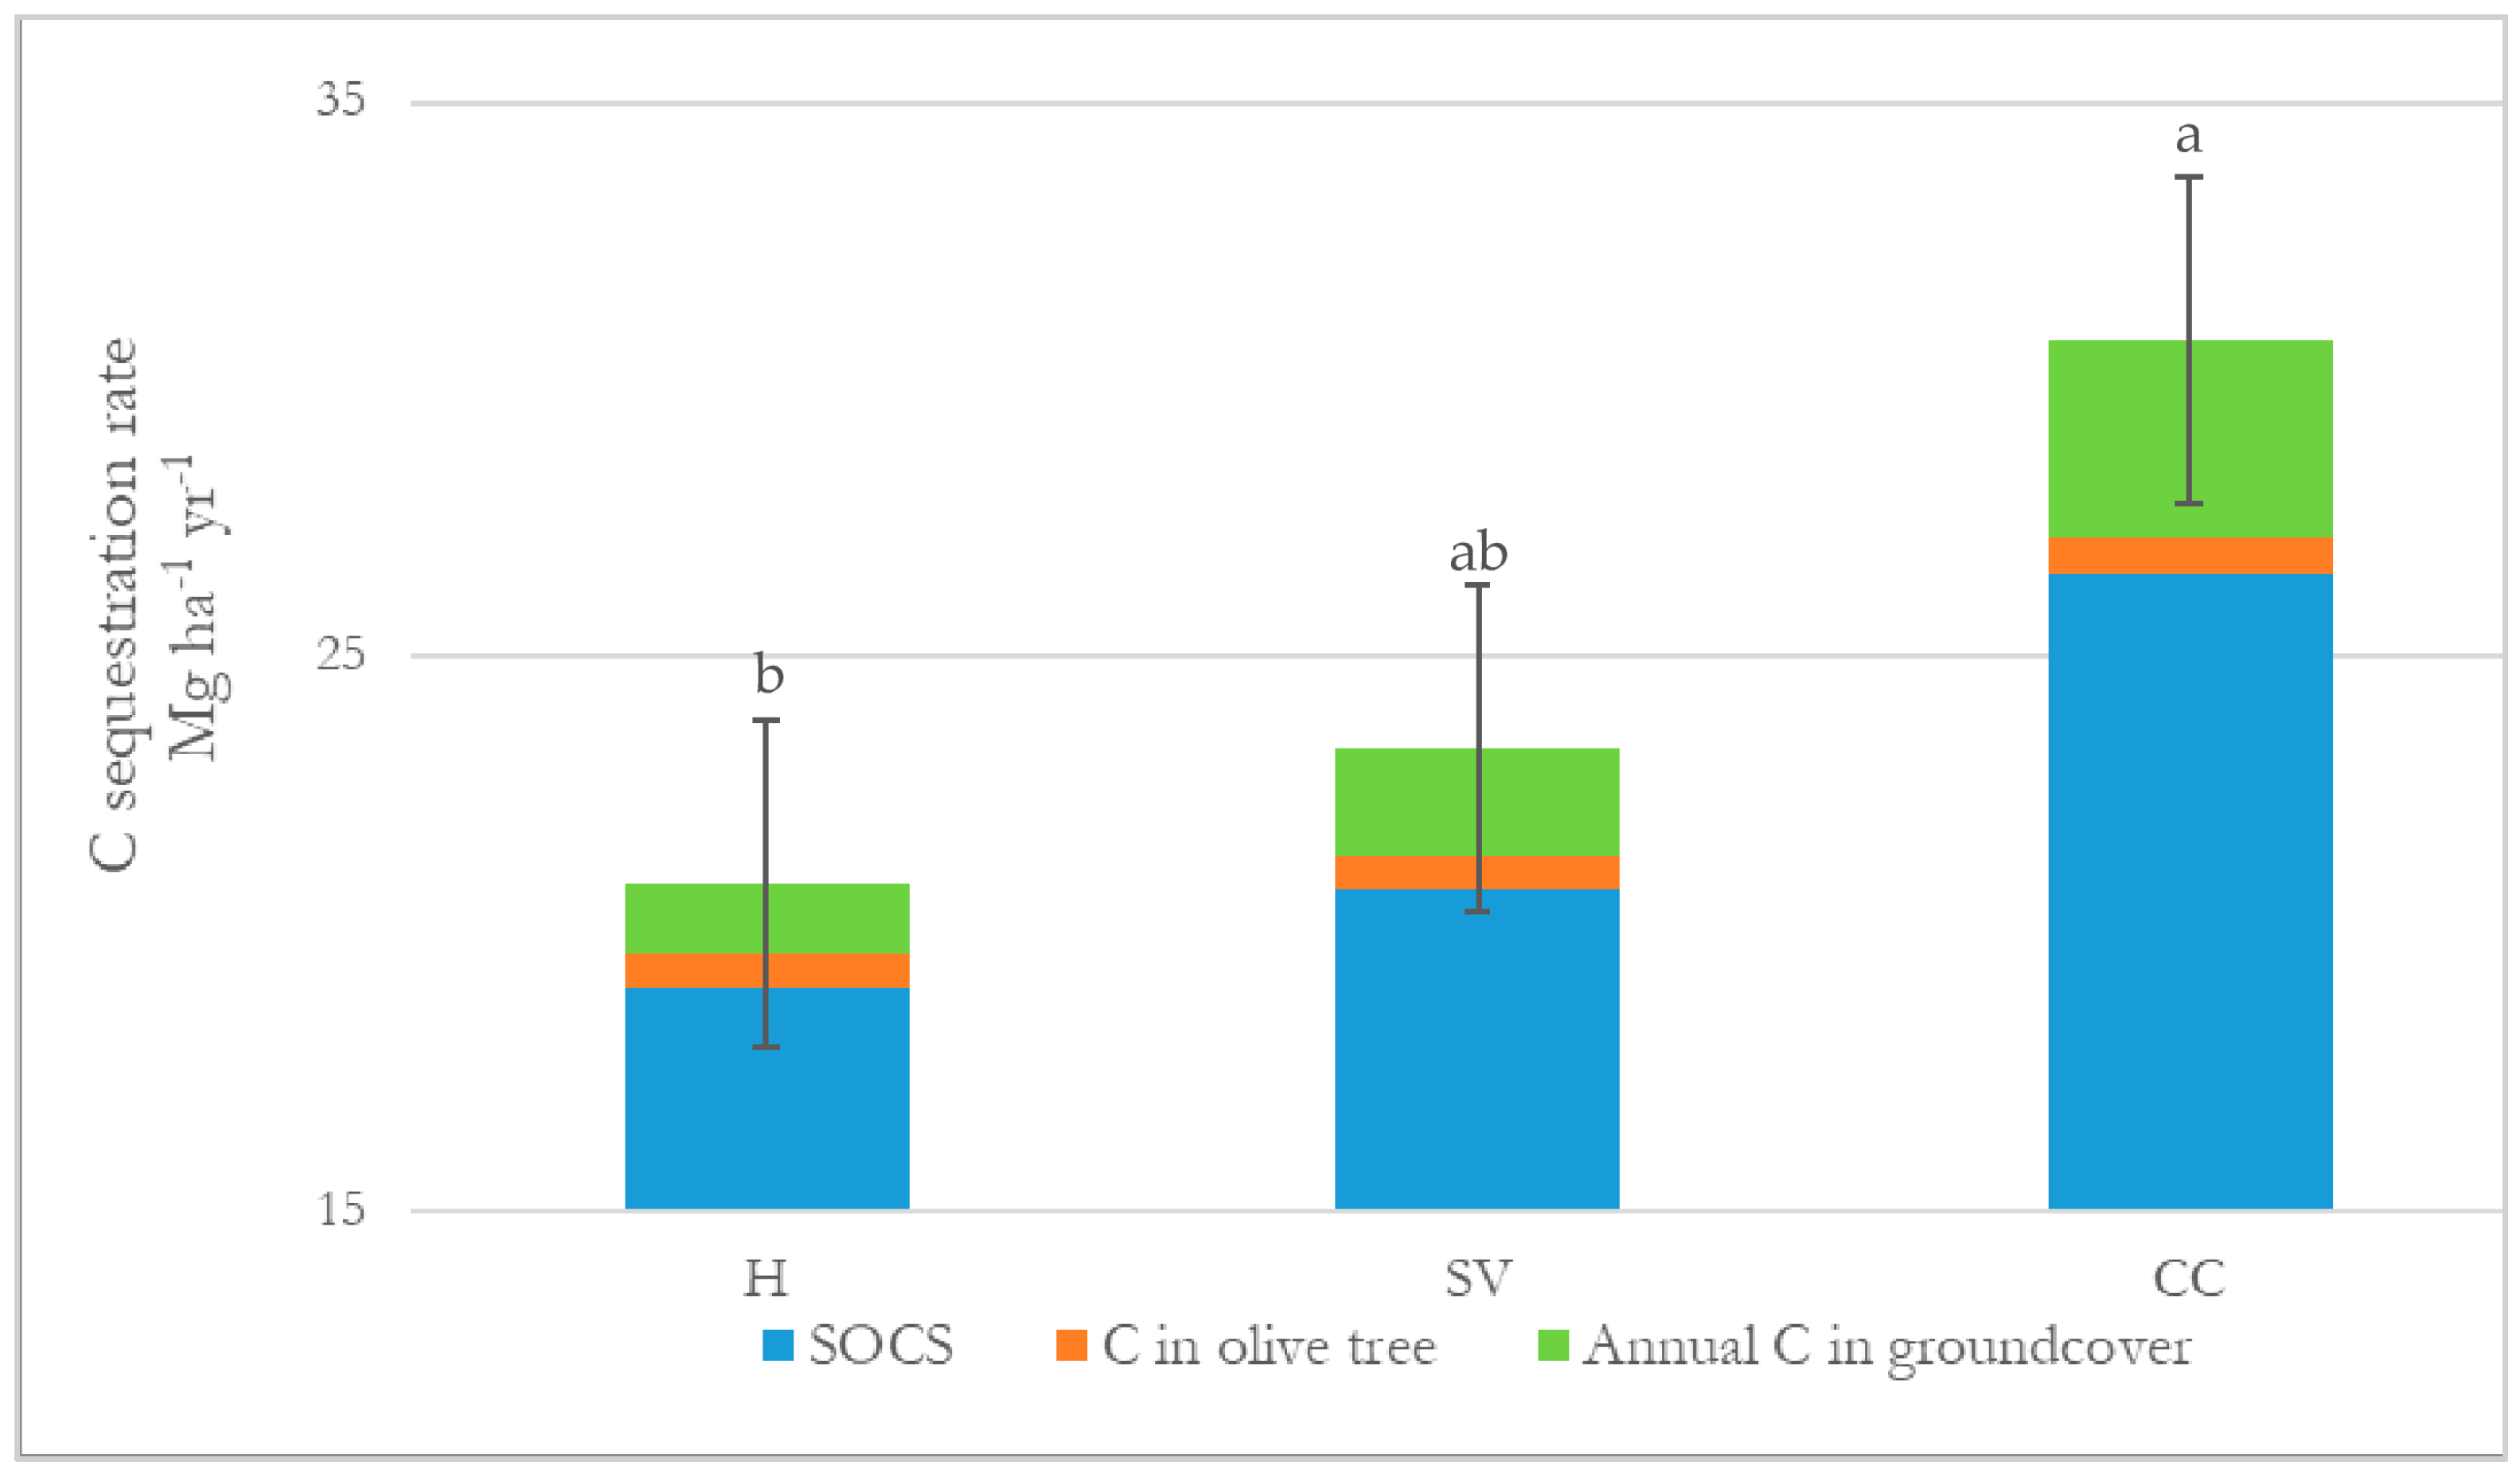
The average annual rate of tree biomass accumulation per hectare was 967 ± 16.2 kg ha−1 y−1. To calculate the overall C content, the percentage of C in the trunk wood, different types of branches, and roots was set to 45.7% for all trees [29]. Thus, the amount of C stored in the total biomass of the trees was 21.7 Mg C ha−1, having an average annual rate of carbon accumulation per hectare equal to 618 ± 9 kg C ha−1 y−1 (Table 2, Figure 5). Therefore, the annual rate of CO2 taken from the atmosphere per hectare is 2.33 Mg ha−1 y−1 in CC, followed by H and SV, with values of 2.28 and 2.24 Mg ha−1 y−1, respectively.

Figure 5.
Mean C sequestration (Mg ha−1 yr−1) among treatments (H: herbicide, SV: spontaneous vegetation, and CC: cover crops) within 2022–2023 period. Mean values are not significantly different in the case of the same letter (p < 0.05; Duncan test). The error bar represents standard error (±SD). Mean values for each measured parameter are not significantly different in the case of the same letter (p < 0.05; Duncan test).
Regarding the overall C stored in the groundcover plant biomass, CC treatment had the highest values (36.6 Mg ha−1 yr−1), while H indicated the lowest (15.7 Mg ha−1 yr−1) (Table 2). During the first year, the C values were not statistically different among the groundcover treatments; however, the overall results indicate a significant difference, due to an increase during the second year in the CC plots’ plant biomass’ in contrast with that of the H plots, which decreased.
3.1.3. Annual C Sequestration Rate
The annual sequestered C rate was calculated by dividing the annual amount of C accumulated in the plant biomass and soil, recording 643 ± 12 kg ha−1 year−1 on average. Regarding the groundcover treatment, the mean value of sequestered C obtained for the CC plot was significantly higher compared with the H treatment, which presented lower mean annual rates (Table 2).
Of the total annual sequestered C, 86–91% of this amount corresponds to C stored at a 20 cm soil depth, while 6–12% and 2–3% correspond to organic C in groundcover and olive tree biomass, respectively (Table 2) (Figure 5). Such a low percentage of C stored in the tree biomass can be attributed to the low planting density of the plantation (10 × 10 m). Although the amount of C in the groundcover was low, its significance should not be underestimated, as decomposition processes contribute to C accumulation in soil over time.
3.2. Soil Arthropod Diversity
3.2.1. Total Soil Dueling Arthropod Abundance
Throughout the entire sampling period, 1886 specimens were included in the analysis. The highest abundance was recorded in spring, with 1220 captures, while autumn yielded 667 captures. These individuals were classified into 10 distinct taxa: Hymenoptera (40.5%), Isopoda (10.9%), Coleoptera (8.7%), Dermaptera (7.5%), Diplopoda (6%), Blattodea (4.9%), Hemiptera (3.1%), Chilopoda (2.8%), and Orthoptera (2%) from the class Insecta, and Aranae (13.6%) from the class Arachnida. All arthropod orders were found across treatments (Table 3). Additionally, pitfall traps captured individuals from the orders Diptera and Mecoptera, which are not considered true soil inhabitants and were therefore excluded from the analysis.
Table 3.
Abundance of soil arthropod taxa per hectare, functional taxa, and values of richness and biodiversity indices for each treatment in autumn and spring.
The values of arthropod catches varied among treatments; however, the differences in abundance were not statistically significant (Table 3, with Appendix A presenting the results of the statistical test). The same was observed for the Shannon and reverse Simpson’s indices, in both seasons. Nevertheless, the highest number of arthropods captured was in the CC treatment, while the lowest was in the SV treatment, suggesting a trend towards increased total arthropod abundance in plots sown with cover crops (Table 3).
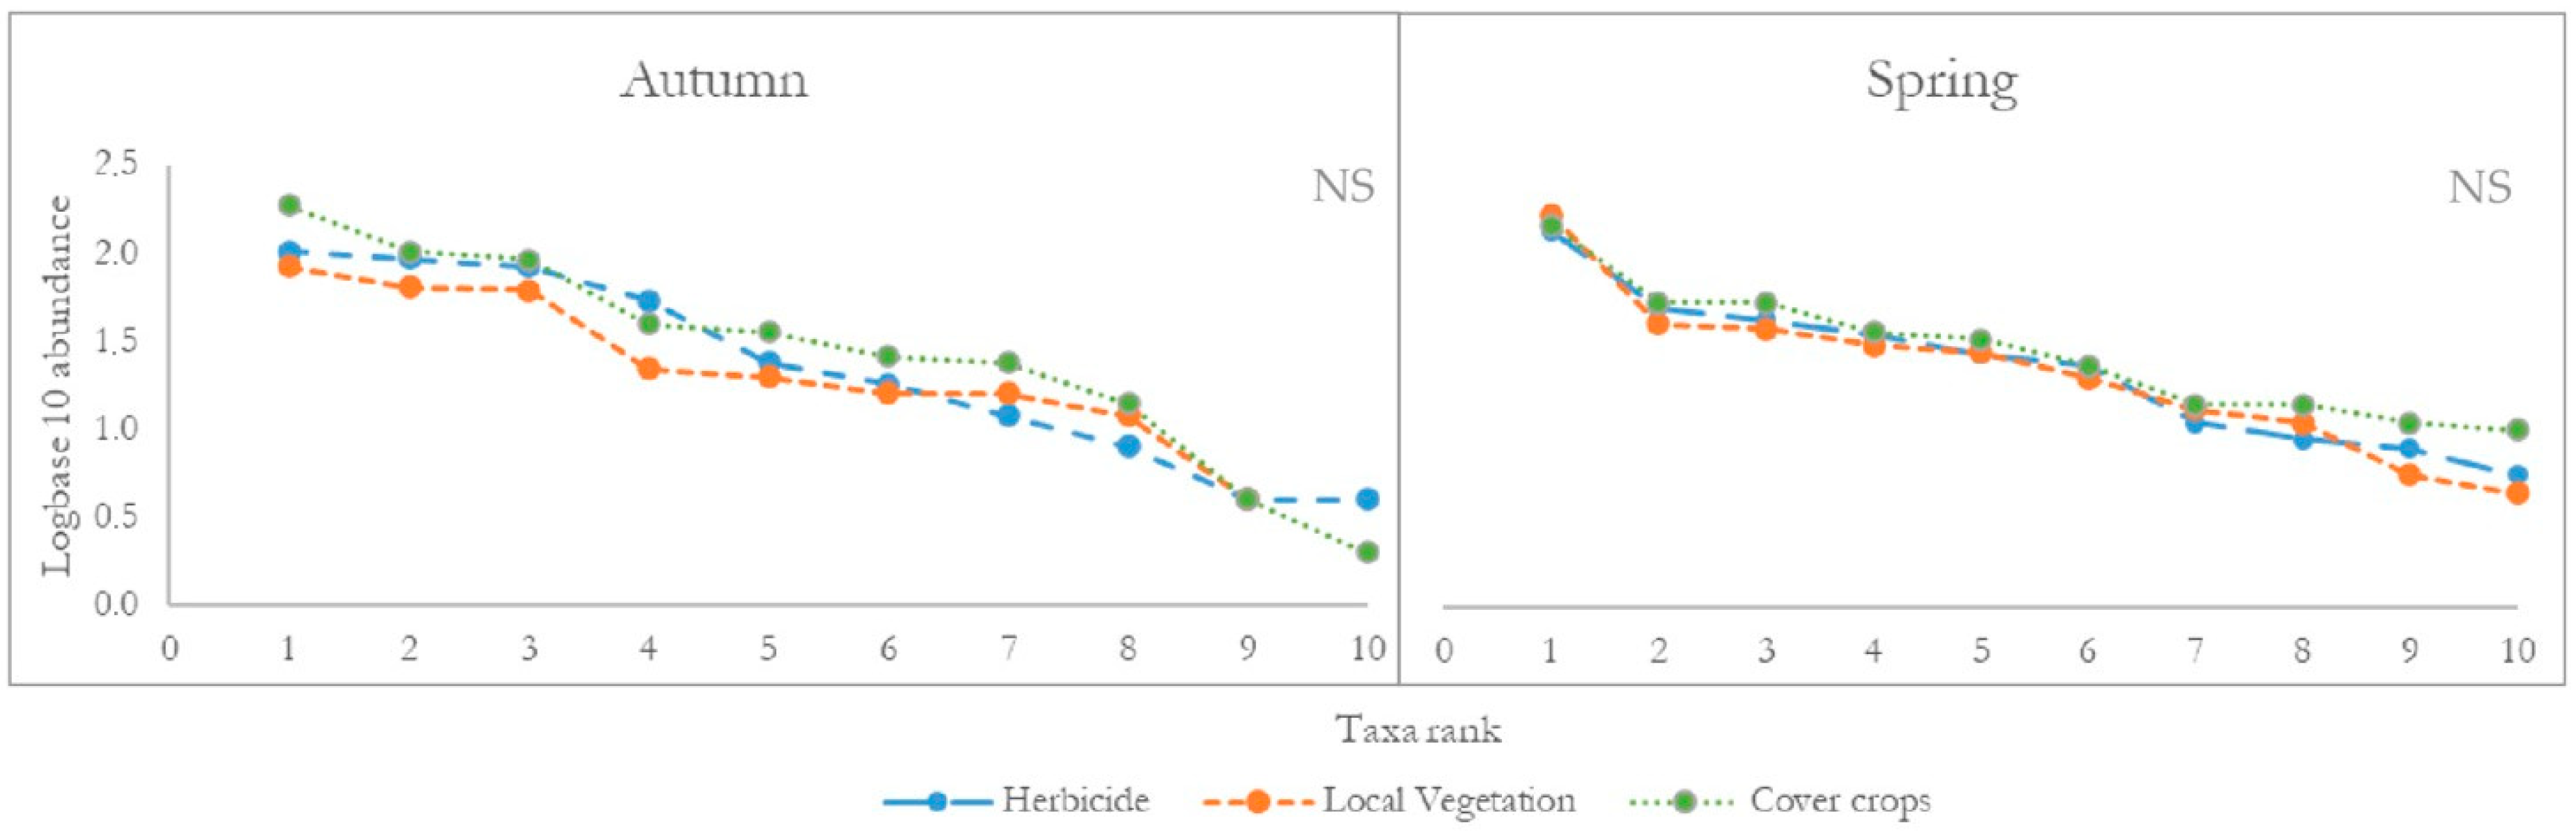
In the Whittaker plots depicting the taxa abundance distribution (Figure 6), the treated plots demonstrated steeper slopes in autumn, suggesting that all treatments, particularly CC, exhibited higher species dominance. In contrast, during spring, CC showed a more equitable distribution among taxa communities compared to SV, which displayed a steeper slope in its abundance distribution curve, indicating the prevalence of some taxa. Overall, no statistically significant differences between abundance distribution were observed among seasons.
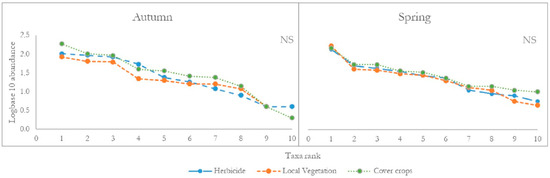
Figure 6.
Rank abundance curves in herbicide [●], spontaneous vegetation [●], and cover crop [●] treatments. NS indicates no significant differences among distribution curves and seasons (p < 0.05; Duncan test).
3.2.2. Functionally Relevant Taxa Abundance
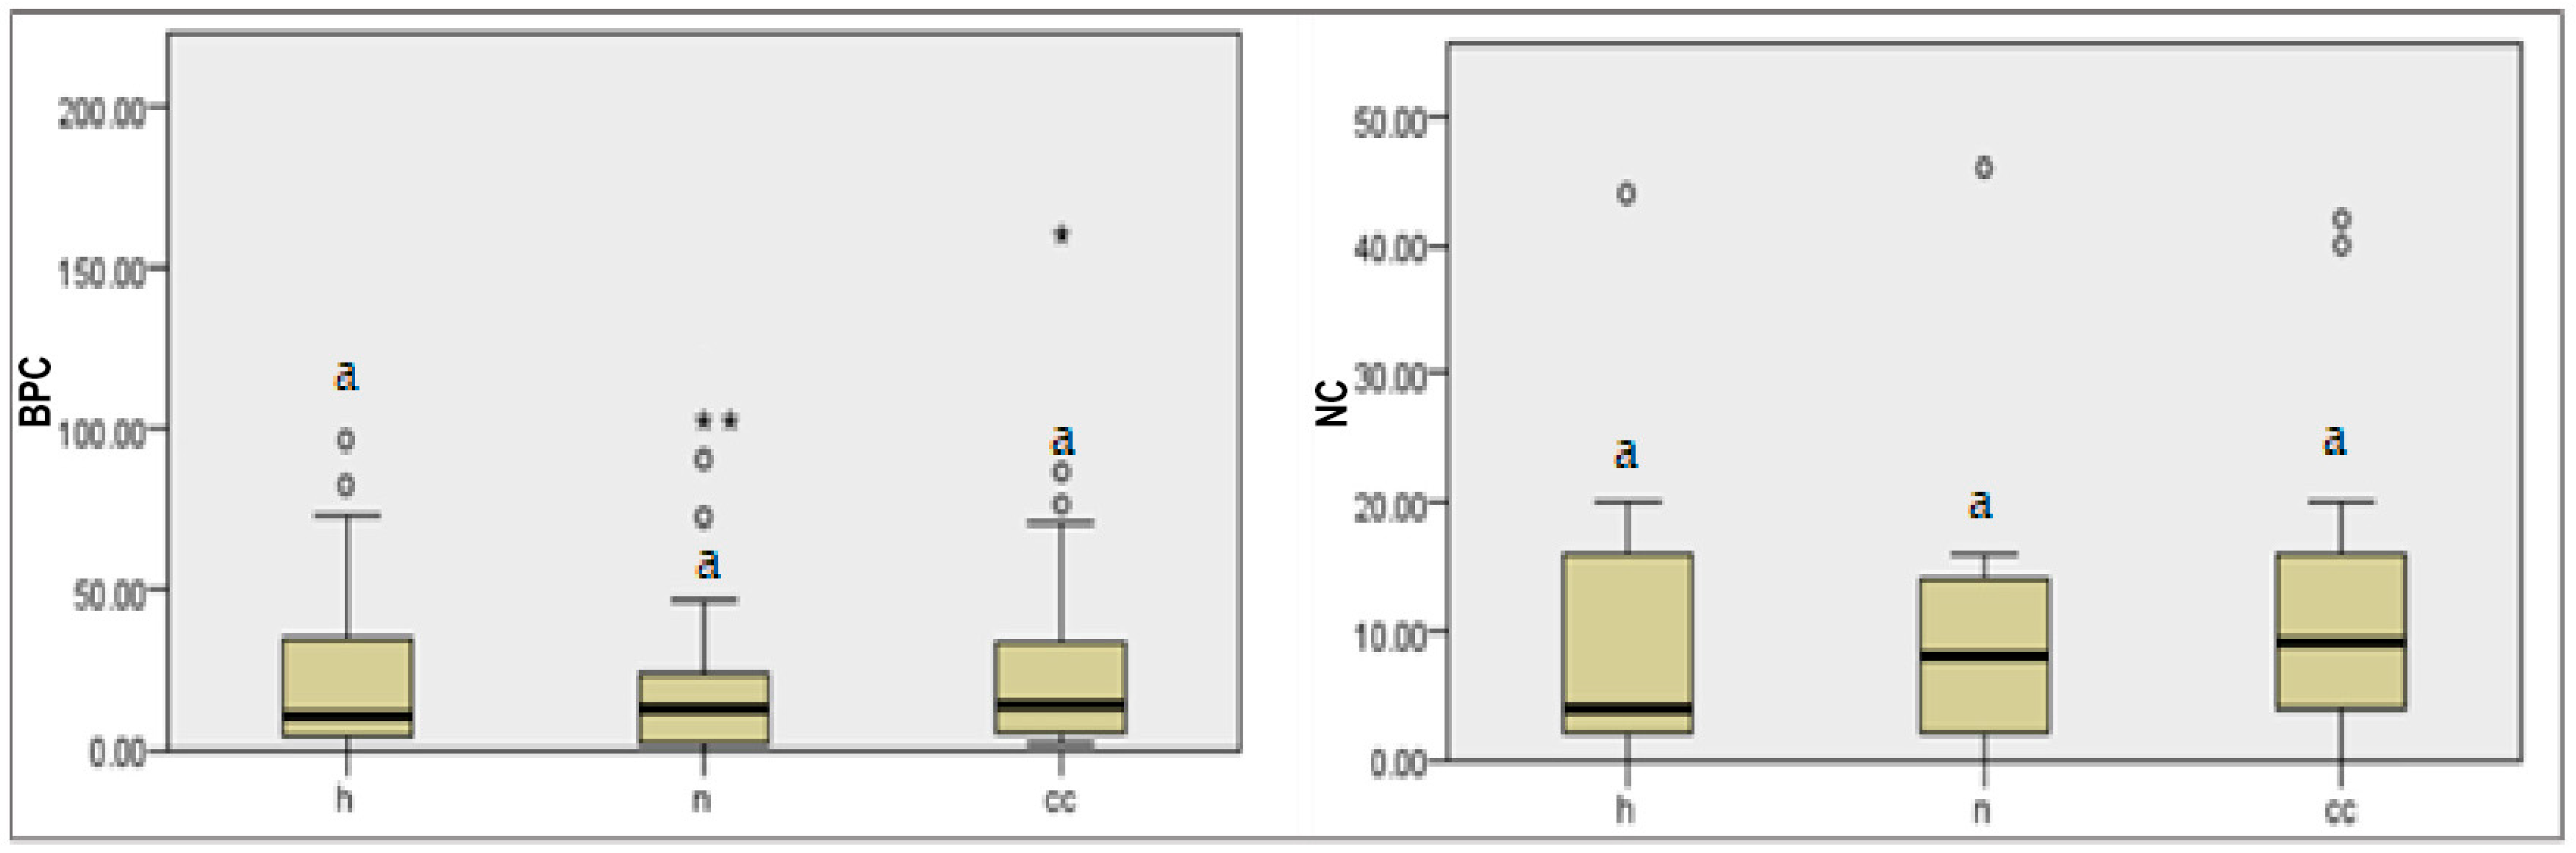
Throughout the entire sampling period, a total of 1698 functional arthropods were captured, accounting for 90% of the overall arthropod catches. Among these, 73.1% were classified within the biological pest control group (BPC), while the remaining 16.91% were categorized in the nutrient cycling group (NC). Statistical analysis revealed no significant differences in functional arthropod abundance between treatments for both seasons (Table 3, Appendix A, and Figure 7 presenting the correspondent visual representation of the seasonal abundance’s medians and quartiles). However, both subgroups exhibited higher relative abundance values in CC plots.
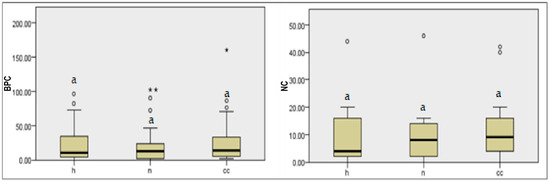
Figure 7.
Boxplots of functional soil arthropod abundance (BPC: biological pest control, NC: nutrient cycling) in the different treatments (H: herbicide, SV: spontaneous vegetation, and CC: cover crops), presenting medians and quartiles, accumulative for the period 2022–2024. Significant differences are indicated by lowercase letters.
Specifically, in spring, the BPC values of relative abundance were higher in SV, while for the NC subgroup, they were higher in H. The primary factor contributing to the increased values in the NC subgroup in H plots during spring was identified as the substantial number of Isopoda captures.
3.2.3. Specific Taxa
Hymenoptera was one of the most abundant taxa throughout the sampling period (10–23 and 4–23/24), with a total of 763 specimens, peaking seasonally in spring. Notably, higher catch rates were recorded in CC plots during autumn, as well as in SV plots during spring (Table 3). Araneae comprised 256 individuals, with higher populations observed in the H plots, followed by the CC and SV plots. Isopoda ranked third in terms of abundance, totaling 206 individuals, with a higher relative abundance in the CC treatment plots during autumn, while elevated values were noted in the H treatment plots during spring. Coleoptera ranked next in abundance, with a total of 165 individuals, exhibiting a higher seasonal catch rate in spring (133 individuals). The mean abundance of Coleoptera was greater in the CC plots. The order Dermaptera followed, with 142 individuals, and the highest seasonal catches were recorded in spring (127 individuals). The CC plots supported a larger Dermaptera population during both seasons.
A comparative analysis of taxon mean abundances between treatments indicated that CC plots exhibited a higher catch rate for six taxa, while H plots demonstrated a higher taxa relative abundance in three instances (Table 3). Notably, Diplopoda was the only taxon that benefited from spontaneous vegetation.
4. Discussion
Over the course of the two-year experiment, cover crops were comparatively assessed for their effects on carbon sequestration and soil arthropod diversity in relation to herbicide application. However, further research is needed to assess the longer-term implications of continuing with these management practices across other Mediterranean soil types. The sampled sites were situated within the same ecological landscape, and their agricultural characteristics were shaped by uniform agricultural practices, thereby rep-resenting a homogeneous unit under the current anthropogenic influences.
4.1. C Sequestration
A comparative analysis was conducted on bare soil, cover crops, and spontaneous vegetation regarding their photosynthetic rates in terms of biomass production. Cover crops were recommended due to their rapid growth and elevated photosynthetic rates, which enhance their capacity for carbon sequestration. The results of the average carbon sequestration mean values are consistent with results from a recent meta-analysis encompassing diverse Mediterranean cropping systems [29,49].
The C sequestration rate is influenced by the C input, which is affected by the management practices adopted [49,50]. This is corroborated by the present study, where carbon sequestration was significantly higher in plots with cover crops. The biomass produced by cover crops has been shown to play a vital role in carbon sequestration [51,52], and their long-term application has been demonstrated to enhance the soil structure chemical properties [53]. The carbon storage capacity within an olive agroecosystem reflects the growth rate of olive trees and groundcovers, as well as their efficiency in sequestering atmospheric carbon, thereby contributing to climate change mitigation in the long term. Similarly to recent studies, a high carbon content was found in cover crop plots, explaining the increase in the soil organic carbon (SOC) in these plots [54,55]. Spontaneous vegetation, which yields less biomass compared to seeded cover crops, releases carbon from residues at a slower rate than cover crops [56]. Due to its carbon-rich residues, such as lignin, spontaneous vegetation exhibits greater stability and requires more time for decomposition, mineralization, and subsequent absorption by trees [57]. Conversely, leguminous cover crops enhance microbial activity in the soil, thereby facilitating the degradation of organic matter [58].
Despite the notable differences among treatments, the variations in the SOC observed in relatively short-term experiments (1–2 years) are considered negligible. Consequently, the carbon flux analysis of the orchard does not account for this negligible SOC, as the carbon and nutrients (e.g., nitrogen) contained in biomass necessitate considerable time to accumulate in the soil through decomposition processes [59]. The continued application of this technique in subsequent years is anticipated to increase the SOC, thereby enhancing aggregate stability and improving the soil’s capacity to retain available plant water [60].
4.2. Soil Arthropod Biodiversity
The results concerning arthropod assemblages were consistent with previous studies regarding the most abundant taxa and peak seasons [23]. However, comparisons of abundance and diversity did not yield significant differences across treatments. Similar findings were reported in research on soil arthropods within the olive agroecosystem in Greece [61]. According to similar studies, such non-discriminatory results may be attributed to the heterogeneity of agricultural practices implemented within the same management system, as well as climatic factors and the varying responses of species to management disturbances [62,63]. In this instance, the short duration of cover crop establishment, the proximity of experimental plots, and the sample size may also influence the results of ecological studies [64].
The four most dominant taxa identified within the soil arthropod community—Hymenoptera (Formicidae), Araneae, Isopoda, and Coleoptera—have consistently been reported in previous studies as the most abundant in olive agroecosystems [65,66]. Hymenoptera, Coleoptera, Dermaptera, and Diplopoda exhibit higher populations in the cover crop treatment plots, indicating a preference for vegetative cover. This preference can be linked to the agricultural landscape, as these taxa respond to the anthropogenic modifications to the environment [67] particularly in relation to soil structure [68]. On the other hand, Arachnidae and Blattodea displayed higher mean abundances in the high-intensity treatment, which contrasts the findings from similar studies [69], suggesting that their community composition may be favored by heterogeneous plant cover.
The peak season for soil arthropod assemblages in this study was comparable to findings from a related study in Greece [61], which indicated that seasonal variation and management heterogeneity significantly affect arthropod communities. As ectotherms, arthropods exhibit a strong response to temperature, which is a critical factor influencing their developmental rates [70], activity levels, and the likelihood of their capture by pitfall traps [64]. Specifically, Hymenoptera, Coleoptera, Hemiptera, Orthoptera, Dermaptera, and Diplopoda were found in high numbers during the summer, a phenomenon that can be attributed to favorable climatic conditions and the increasing availability of soil–plant litter [23].
Ultimately, functional subgroups exhibited higher relative abundance values across treatments cumulatively for both seasons, as anticipated, due to the significant proportion of arthropod catches comprising these functional subgroups. This observation aligns with numerous prior studies [71,72], which indicate that the incorporation of natural or planted groundcover vegetation in perennial crops enhances the abundance of various groups of natural enemies [73]. According to previous research, the presence of adjacent natural vegetation in olive groves can augment populations of generalist ground predators, thereby increasing the mortality of Bactrocera oleae pupae in soil [26,74,75]. This finding is further corroborated by a study conducted in Spain that indicated an increase in the primary natural enemy groups of olive insect pests associated with groundcover vegetation [76].
5. Conclusions
The findings of the current study indicate that cover crops can lead to higher mean carbon accumulation, while favoring soil arthropod overall abundance. Consequently, when comparing sustainable management practices to conventional methods in olive groves, the former demonstrated a positive influence on sequestered carbon and the local composition of species assemblages within the agroecosystem. This, in turn, extends the provisioning of ecosystem services, while benefiting rural stakeholders and local agroecosystems.
Future research should focus on the long-term effects of cover crops on carbon sequestration and the abundance and biodiversity of soil arthropods in olive groves to yield more definitive conclusions. Ultimately, such findings can contribute to providing valuable insights for developing agroecology-based solutions related to farm management and its respective policies, with the goal of increasing olive farming resilience and regenerating degraded land.
Author Contributions
Conceptualization, I.M. and V.G.; methodology, I.M.; software, V.G.; formal analysis, I.M.; investigation, I.M. and C.P.; resources, C.P.; data curation, I.M.; writing—original draft preparation, I.M.; writing—review and editing, V.G.; visualization, I.M.; supervision, M.M., A.M. and V.G.; project administration, S.S.; funding acquisition, S.S. All authors have read and agreed to the published version of the manuscript.
Funding
This work was funded by the SALAM-MED project under the Partnership for Research and Innovation in the Mediterranean Area (PRIMA) program, supported by the European Union. Grant Agreement number: [2123] [SALAM-MED] [Call 2021 Section 1 Water RIA].
Institutional Review Board Statement
Not applicable.
Data Availability Statement
The data will not be deposited online.
Acknowledgments
We thank Giorgos Maneas for providing technical assistance and Anna Choudalaki for soil analysis.
Conflicts of Interest
The authors declare that they have no conflicts of interest.
Appendix A
Results of the Kruskal–Wallis test applied for the comparison of the accumulative relative abundance of soil arthropod taxa per hectare, the abundance of total arthropod catches, functional subgroups, the relative abundance of functional subgroups (BPC: biological pest control group, NC: nutrient cycling group), and the values of richness and biodiversity indexes between treatments, for the study period 2022–2023.
| Taxon | χ2 (p) |
| Arachnidae | 0.203 |
| Hymenoptera | 0.265 |
| Hemiptera | 0.294 |
| Isopoda | 1.68 |
| Chilopoda | 3.478 |
| Coleoptera | 0.563 |
| Orthoptera | 1.505 |
| Blattodea | 2.032 |
| Dermaptera | 0.566 |
| Diplopoda | 2.662 |
| Abundance/ha | 1.745 |
| Functional taxa | |
| BPC | 1.216 |
| NC | 0.474 |
| H′ | 1.377 |
| 1-D | 0.533 |
References
- IOC. Statistics. 2023. Available online: https://www.internationaloliveoil.org/wp-content/uploads/2022/12/IOC-Olive-Oil-Dashboard-2.html (accessed on 7 February 2023).
- Jastrow, J.D.; Amonette, J.E.; Bailey, V.L. Mechanisms controlling soil carbon turnover and their potential application for enhancing carbon sequestration. Clim. Change 2007, 80, 5–23. [Google Scholar] [CrossRef]
- Gaston, K.J. Global patterns in biodiversity. Nature 2000, 405, 220–227. [Google Scholar] [CrossRef] [PubMed]
- Terzi, M.; Barca, E.; Cazzato, E.; D’amico, F.S.; Lasorella, C.; Fracchiolla, M. Effects of weed control practices on plant diversity in a homogenous olive-dominated landscape (South-East of Italy). Plants 2021, 10, 1090. [Google Scholar] [CrossRef]
- Vahamidis, P.; Chachalis, D.; Akrivou, A.; Karanasios, E.; Ganopoulou, M.; Argiri, A.; Markellou, E. Weed Species’ Diversity and Composition as Shaped by the Interaction of Management, Site, and Soil Variables in Olive Groves of Southern Greece. Agronomy 2024, 14, 640. [Google Scholar] [CrossRef]
- Allen, H.D.; Randall, R.E.; Amable, G.S.; Devereux, B.J. The impact of changing olive cultivation practices on the ground flora of olive groves in the Messara and Psiloritis regions, Crete, Greece. Land Degrad. Dev. 2006, 17, 249–273. [Google Scholar] [CrossRef]
- Cavoski, A. An ambitious and climate-focused commissionagenda for post COVID-19 EU. Environ. Politics 2020, 29, 1112–1117. [Google Scholar] [CrossRef]
- Ellis, E.C. Land use and ecological change: A 12,000-year history. Annu. Rev. Environ. Resour. 2021, 46, 1–33. [Google Scholar] [CrossRef]
- Gross, C.D.; Harrison, R.B. The case for digging deeper: Soil organic carbon storage, dynamics, and controls in our changing world. Soil Syst. 2019, 3, 28. [Google Scholar] [CrossRef]
- Tautges, N.E.; Chiartas, J.L.; Gaudin, A.C.M.; O’Geen, A.T.; Herrera, I.; Scow, K.M. Deep soil inventories reveal that impacts of cover crops and compost on soil carbon sequestration differ in surface and subsurface soils. Glob. Change Biol. 2019, 25, 3753–3766. [Google Scholar] [CrossRef]
- Lavallee, J.M.; Soong, J.L.; Cotrufo, M.F. Conceptualizing soil organic matter into particulate and mineral-associated forms to address global change in the 21st century. Glob. Change Biol. 2020, 26, 261–273. [Google Scholar] [CrossRef]
- LaSalle, T.J.; Hepperly, P. Regenerative Organic Farming: A Solution to Global Warming; Rodale Institute: Allentown, PA, USA, 2008. [Google Scholar]
- Duval, M.E.; Galantini, J.A.; Capurro, J.E.; Martinez, J.M. Winter cover crops in soybean monoculture: Effects on soil organic carbon and its fractions. Soil Tillage Res. 2016, 161, 95–105. [Google Scholar] [CrossRef]
- Novara, A.; Cerda, A.; Barone, E.; Gristina, L. Cover crop management and water conservation in vineyard and olive orchards. Soil Tillage Res. 2021, 208, 104896. [Google Scholar] [CrossRef]
- Gómez-Muñoz, B.; Hatch, D.; Bol, R.; García-Ruiz, R. Nutrient dynamics during decomposition of the residues from a sown legume or ruderal plant cover in an olive oil orchard. Agric. Ecosyst. Environ. 2014, 184, 115–123. [Google Scholar] [CrossRef]
- Milgroom, J.; Soriano, M.A.; Garrido, J.M.; Gómez, J.A.; Fereres, E. The influence of a shift from conventional to organic olive farming on soil management and erosion risk in southern Spain. Renew. Agric. Food Syst. 2007, 22, 1–10. [Google Scholar] [CrossRef]
- Ramos, M.E.; Benítez, E.; García, P.A.; Robles, A.B. Cover crops under different managements vs. frequent tillage in almond orchards in semiarid conditions: Effects on soil quality. Appl. Soil. Ecol. 2010, 44, 6–14. [Google Scholar] [CrossRef]
- Haynes, R.J.; Beare, M.H. Aggregation and organic matter storage in meso-thermal, humid soils. In Structure and Organic Matter Storage in Agricultural Soils; CRC Press: Boca Raton, FL, USA, 2020; pp. 213–262. [Google Scholar]
- Moukanni, N.; Brewer, K.M.; Gaudin, A.C.M.; O’Geen, A.T. Optimizing carbon sequestration through cover cropping in Mediterranean agroecosystems: Synthesis of mechanisms and implications for management. Front. Agron. 2022, 4, 844166. [Google Scholar] [CrossRef]
- Gómez, J.A.; Campos, M.; Guzmán, G.; Castillo-Llanque, F.; Vanwalleghem, T.; Lora, A.; Giráldez, J.V. Soil erosion control, plant diversity, and arthropod communities under heterogeneous cover crops in an olive orchard. Environ. Sci. Pollut. Res. 2018, 25, 977–989. [Google Scholar] [CrossRef]
- Bugg, R.L.; Waddington, C. Using cover crops to manage arthropod pests of orchards: A review. Agric. Ecosyst. Environ. 1994, 50, 11–28. [Google Scholar] [CrossRef]
- Stavrianakis, G.; Sentas, E.; Stattegger, S.R.; Tscheulin, T.; Kizos, T. Effect of olive grove’s understorey management on arthropod diversity. Agroecol. Sustain. Food Syst. 2024, 48, 1115–1138. [Google Scholar] [CrossRef]
- Gkisakis, V.; Volakakis, N.; Kollaros, D.; Bàrberi, P.; Kabourakis, E.M. Soil arthropod community in the olive agroecosystem: Determined by environment and farming practices in different management systems and agroecological zones. Agric. Ecosyst. Environ. 2016, 218, 178–189. [Google Scholar] [CrossRef]
- Stiling, P.; Cornelissen, T. What makes a successful biocontrol agent? A meta-analysis of biological control agent performance. Biol. Control 2005, 34, 236–246. [Google Scholar] [CrossRef]
- Caon, L.; Vargas, R. Threats to soils: Global trends and perspectives. Global Soil Partnership Food and Agriculture Organization of the United Nations. In A Contribution from the Intergovernmental Technical Panel on Soils; Brajendra, Ed.; Global land outlook working paper; United Nations: Manhattan, NY, USA, 2017. [Google Scholar]
- de Paz, V.; Tobajas, E.; Rosas-Ramos, N.; Tormos, J.; Asís, J.D.; Baños-Picón, L. Effect of organic farming and agricultural abandonment on beneficial arthropod communities associated with olive groves in western Spain: Implications for Bactrocera oleae management. Insects 2022, 13, 48. [Google Scholar] [CrossRef] [PubMed]
- Castro, J.; Tortosa, F.S.; Carpio, A.J. Structure of canopy and ground-dwelling arthropod communities in olive orchards is determined by the type of soil cover. Eur. J. Èntomol. 2021, 118, 159–170. [Google Scholar] [CrossRef]
- Walinga, I.; Kithome, M.; Novozamsky, I.; Houba, V.J.G.; van der Lee, J.J. Spectrophotometric Determination of Organic Carbon in Soil. Commun. Soil Sci. Plant Anal. 1992, 23, 1935–1944. [Google Scholar] [CrossRef]
- Lopez-Bellido, P.J.; Lopez-Bellido, L.; Fernandez-Garcia, P.; Muñoz-Romero, V.; Lopez-Bellido, F.J. Assessment of carbon sequestration and the carbon footprint in olive groves in Southern Spain. Carbon Manag. 2016, 7, 161–170. [Google Scholar] [CrossRef]
- Blake, G.R. Bulk density. Methods of Soil Analysis. Part 1; SSSA: Madison, WI, USA, 1986. [Google Scholar]
- Throop, H.; Archer, S.; Monger, H.; Waltman, S. When bulk density methods matter: Implications for estimating soil organic carbon pools in rocky soils. J. Arid. Environ. 2012, 77, 66–71. [Google Scholar] [CrossRef]
- Grossman, R.B.; Reinsch, T.G. Bulk density and linear extensibility. In Methods of Soil Analysis Part 4, SSSA Book Ser. 5; Dane, J.H., Topp, G.C., Eds.; SSSA: Madison, WI, USA, 2002; pp. 201–254. [Google Scholar]
- Bateni, C.; Ventura, M.; Tonon, G.; Pisanelli, A. Soil carbon stock in olive groves agroforestry systems under different management and soil characteristics. Agrofor. Syst. 2021, 95, 951–961. [Google Scholar] [CrossRef]
- Gómez, J.A.; Guzmán, G.; Vanwalleghem, T.; Vanderlinden, K. Spatial Variability of Soil Organic Carbon Stock in an Olive Orchard at Catchment Scale in Southern Spain. Int. Soil Water Conserv. Res. 2023, 11, 311–326. [Google Scholar] [CrossRef]
- Velázquez-Martí, B.; Sajdak, M.; López-Cortés, I.; Callejón-Ferre, A.J. Wood characterization for energy application proceeding from pruning Morus alba L., Platanus hispanica Münchh. and Sophora japonica L. in urban areas. Renew. Energy 2014, 62, 478–483. [Google Scholar] [CrossRef]
- Ilarioni, L.; Nasini, L.; Brunori, A.N.T.O.N.I.O.; Proietti, P. Experimental measurement of the biomass of Olea europaea L. Afr. J. Biotechnol. 2013, 12, 1216–1222. [Google Scholar]
- Poeplau, C.; Reiter, L.; Berti, A.; Kätterer, T. Qualitative and quantitative response of soil organic carbon to 40 years of crop residue incorporation under contrasting nitrogen fertilisation regimes. Soil Res. 2016, 55, 1–9. [Google Scholar] [CrossRef]
- Ma, S.; He, F.; Tian, D.; Zou, D.; Yan, Z.; Yang, Y.; Zhou, T.; Huang, K.; Shen, H.; Fang, J. Variations and determinants of carbon content in plants: A global synthesis. Biogeosciences 2018, 15, 693–702. [Google Scholar] [CrossRef]
- Cotes, B.; Campos, M.; Pascual, F.; García, P.A.; Ruano, F. Comparing taxonomic levels of epigeal insects under different farming systems in Andalusian olive agroecosystems. Appl. Soil Ecol. 2010, 44, 228–236. [Google Scholar] [CrossRef]
- Timms, L.L.; Bowden, J.J.; Summerville, K.S.; Buddle, C.M. Does species-level resolution matter? Taxonomic sufficiency in terrestrial arthropod biodiversity studies. Insect Conserv. Divers. 2013, 6, 453–462. [Google Scholar] [CrossRef]
- McGill, B.J.; Etienne, R.S.; Gray, J.S.; Alonso, D.; Anderson, M.J.; Benecha, H.K.; Dornelas, M.; Enquist, B.J.; Green, J.L.; He, F.; et al. Species abundance distributions: Moving beyond single prediction theories to integration within an ecological framework. Ecol. Lett. 2007, 10, 995–1015. [Google Scholar] [CrossRef]
- Gkisakis, V.D.; Kollaros, D.; Kabourakis, E.M. Entomologia Hellenica; Hellenica Entomological Society: Athens, Greece, 2017. [Google Scholar]
- Gonçalves, M.F.; Pereira, J.A. Abundance and diversity of soil arthropods in the olive grove ecosystem. J. Insect Sci. 2012, 12, 20. [Google Scholar] [CrossRef]
- Gonçalves, F.M.; Rodrigues, M.C.; Pereira, J.A.; Thistlewood, H.; Torres, L.M. Natural mortality of immature stages of Bactrocera oleae (Diptera: Tephritidae) in traditional olive groves from north-eastern Portugal. Biocontrol Sci. Technol. 2012, 22, 837–854. [Google Scholar] [CrossRef]
- Urbaneja, A.; Marí, F.G.; Tortosa, D.; Navarro, C.; Vanaclocha, P.; Bargues, L.; Castañera, P. Influence of ground predators on the survival of the Mediterranean fruit fly pupae, Ceratitis capitata, in Spanish citrus orchards. BioControl 2006, 51, 611–626. [Google Scholar] [CrossRef]
- Stork, N.E.; Eggleton, P. Invertebrates as determinants and indicators of soil quality. Am. J. Altern. Agric. 1992, 7, 38–47. [Google Scholar] [CrossRef]
- Wurst, S. Plant-mediated links between detritivores and aboveground herbivores. Front. Plant Sci. 2013, 4, 380. [Google Scholar] [CrossRef]
- R Core Team. R: A Language and Environment for Statistical Computing; R Foundation for Statistical Computing: Vienna, Austria, 2014; Available online: www.R-project.org/ (accessed on 21 November 2024).
- Aguilera, E.; Lassaletta, L.; Gattinger, A.; Gimeno, B.S. Managing soil carbon for climate change mitigation and adaptation in Mediterranean cropping systems: A meta-analysis. Agric. Ecosyst. Environ. 2013, 168, 25–36. [Google Scholar] [CrossRef]
- Blanco-Canqui, H. Cover crops and carbon sequestration: Lessons from US studies. Soil Sci. Soc. Am. J. 2022, 86, 501–519. [Google Scholar] [CrossRef]
- Peregrina, F.; Pérez-Álvarez, E.P.; García-Escudero, E. The short term influence of aboveground biomass cover crops on C sequestration and β–glucosidase in a vineyard ground under semiarid conditions. Span. J. Agric. Res. 2014, 12, 1000–1007. [Google Scholar] [CrossRef]
- Repullo-Ruiberriz de Torres, M.A.; Moreno-García, M.; Ordóñez-Fernández, R.; Rodríguez-Lizana, A.; Rodríguez, B.C.; García-Tejero, I.F.; Zuazo, V.H.D.; Carbonell-Bojollo, R.M. Cover crop contributions to improve the soil nitrogen and carbon sequestration in almond orchards (SW Spain). Agronomy 2021, 11, 387. [Google Scholar] [CrossRef]
- Gattullo, C.E.; Mezzapesa, G.N.; Stellacci, A.M.; Ferrara, G.; Occhiogrosso, G.; Petrelli, G.; Castellini, M.; Spagnuolo, M. Cover crop for a sustainable viticulture: Effects on soil properties and table grape production. Agronomy 2020, 10, 1334. [Google Scholar] [CrossRef]
- Carbonell-Bojollo, R.; González-Sánchez, E.J.; de Torres, M.R.R.; Ordóñez-Fernández, R.; Domínguez-Gimenez, J.; Basch, G. Soil organic carbon fractions under conventional and no-till management in a long-term study in southern Spain. Soil Res. 2015, 53, 113–124. [Google Scholar] [CrossRef]
- Rodríguez-Lizana, A.; de Torres, M.Á.R.-R.; Carbonell-Bojollo, R.; Moreno-García, M.; Ordóñez-Fernández, R. Study of C, N, P and K release from residues of newly proposed cover crops in a Spanish olive grove. Agronomy 2020, 10, 1041. [Google Scholar] [CrossRef]
- Bechara, E.; Papafilippaki, A.; Doupis, G.; Sofo, A.; Koubouris, G. Nutrient dynamics, soil properties and microbiological aspects in an irrigated olive orchard managed with five different management systems involving soil tillage, cover crops and compost. J. Water Clim. Change 2018, 9, 736–747. [Google Scholar] [CrossRef]
- Ghimire, R.; Lamichhane, S.; Acharya, B.S.; Bista, P.; Sainju, U.M. Tillage, crop residue, and nutrient management effects on soil organic carbon in rice-based cropping systems: A review. J. Integr. Agric. 2017, 16, 1–15. [Google Scholar] [CrossRef]
- Ordóñez-Fernández, R.; de Torres, M.A.R.-R.; Márquez-García, J.; Moreno-García, M.; Carbonell-Bojollo, R.M. Legumes used as cover crops to reduce fertilisation problems improving soil nitrate in an organic orchard. Eur. J. Agron. 2018, 95, 1–13. [Google Scholar] [CrossRef]
- Almagro, M.; López, J.; Boix-Fayos, C.; Albaladejo, J.; Martínez-Mena, M. Belowground carbon allocation patterns in a dry Mediterranean ecosystem: A comparison of two models. Soil Biol. Biochem. 2010, 42, 1549–1557. [Google Scholar] [CrossRef]
- Manivannan, S.; Balamurugan, M.; Parthasarathi, K.; Gunasekaran, G.; Ranganathan, L.S. Effect of vermicompost on soil fertility and crop productivity-beans (Phaseolus vulgaris). J. Environ. Biol. 2009, 30, 275–281. [Google Scholar]
- Gkisakis, V.D.; Kollaros, D.; Bàrberi, P.; Livieratos, I.C.; Kabourakis, E.M. Soil arthropod diversity in organic, integrated, and conventional olive orchards and different agroecological zones in Crete, Greece. Agroecol. Sustain. Food Syst. 2015, 39, 276–294. [Google Scholar] [CrossRef]
- Hole, D.G.; Perkins, A.J.; Wilson, J.D.; Alexander, I.H.; Grice, P.V.; Evans, A.D. Does organic farming benefit biodiversity? Biol. Conserv. 2005, 122, 113–130. [Google Scholar] [CrossRef]
- Bengtsson, J.; Ahnström, J.; Weibull, A.C. The effects of organic agriculture on biodiversity and abundance: A meta-analysis. J. Appl. Ecol. 2005, 42, 261–269. [Google Scholar] [CrossRef]
- Southwood, T.R.E. Ecological Methods; Methuen & Co.: London, UK, 1966. [Google Scholar]
- Iannotta, N.; Belfiore, T.; Noce, M.E.; Scalercio, S.; Vizzarri, V. The Impact of Some Compounds Utilised in Organic Olive Groves on the Non-Target Arthropod Fauna: Canopy and Soil Levels. In Proceedings of the Ecoliva 2007, VI Jornadas Internacionales de Olivar Ecologico, Puente de Génave (Jaén), Spain, 22–25 March 2007. [Google Scholar]
- Jerez-Valle, C.; García, P.A.; Campos, M.; Pascual, F. A simple bioindication method to discriminate olive orchard management types using the soil arthropod fauna. Appl. Soil Ecol. 2014, 76, 42–51. [Google Scholar] [CrossRef]
- Hanson, H.I.; Birkhofer, K.; Smith, H.G.; Palmu, E.; Hedlund, K. Agricultural land use affects abundance and dispersal tendency of predatory arthropods. Basic Appl. Ecol. 2017, 18, 40–49. [Google Scholar] [CrossRef]
- Holland, J.M.; Reynolds, C.J. The impact of soil cultivation on arthropod (Coleoptera and Araneae) emergence on arable land. Pedobiologia 2003, 47, 181–191. [Google Scholar] [CrossRef]
- Perner, J.; Malt, S. Assessment of changing agricultural land use: Response of vegetation, ground-dwelling spiders and beetles to the conversion of arable land into grassland. Agric. Ecosyst. Environ. 2003, 98, 169–181. [Google Scholar] [CrossRef]
- Briere, J.F.; Pracros, P.; Le Roux, A.Y.; Pierre, J.S. A novel rate model of temperature-dependent development for arthropods. Environ. Entomol. 1999, 28, 22–29. [Google Scholar] [CrossRef]
- Danne, A.; Thomson, L.J.; Sharley, D.J.; Penfold, C.M.; Hoffmann, A.A. Effects of native grass cover crops on beneficial and pest invertebrates in Australian vineyards. Environ. Entomol. 2010, 39, 970–978. [Google Scholar] [CrossRef] [PubMed]
- Silva, E.; Franco, J.; Vasconcelos, T.; Branco, M. Effect of ground cover vegetation on the abundance and diversity of beneficial arthropods in citrus orchards. Bull. Entomol. Res. 2010, 100, 489–499. [Google Scholar] [CrossRef] [PubMed]
- Kelly, C.; Fonte, S.J.; Shrestha, A.; Daane, K.M.; Mitchell, J.P. Winter cover crops and no-till promote soil macrofauna communities in irrigated, Mediterranean cropland in California, USA. Appl. Soil Ecol. 2021, 166, 104068. [Google Scholar] [CrossRef]
- Orsini, M. Mortality and Predation of Olive Fly (Bactrocera oleae) Pupae on the Soil in a Davis, California Olive Orchard; UC Berkeley: Berkeley, CA, USA, 2006. [Google Scholar]
- Volakakis, N.; Kabourakis, E.; Rempelos, L.; Kiritsakis, A.; Leifert, C. Effect of different cover crops, mass-trapping systems and environmental factors on invertebrate activity in table olive orchards—Results from field experiments in Crete, Greece. Agronomy 2022, 12, 2576. [Google Scholar] [CrossRef]
- Paredes, D.; Campos, M.; Cayuela, L. El control biológico de plagas de artrópodos por conservación: Técnicas y estado del arte. Ecosistemas 2013, 22, 56–61. [Google Scholar]


Disclaimer/Publisher’s Note: The statements, opinions and data contained in all publications are solely those of the individual author(s) and contributor(s) and not of MDPI and/or the editor(s). MDPI and/or the editor(s) disclaim responsibility for any injury to people or property resulting from any ideas, methods, instructions or products referred to in the content. |
© 2025 by the authors. Licensee MDPI, Basel, Switzerland. This article is an open access article distributed under the terms and conditions of the Creative Commons Attribution (CC BY) license (https://creativecommons.org/licenses/by/4.0/).