Article

Response of Different Perennial Ryegrass Varieties to Water Stress

by
Mladen Prijović
1,
Dejan Sokolović
1,
Jelena Dragišić Maksimović
2,
Vuk Maksimović
2,
Dragica Milosavljević
2,
Snežana Babić
1,
Marija Stepić
1 and
Aneta Sabovljević
3,*
1
Institute for Forage Crops, 37251 Kruševac, Serbia
2
Institute for Multidisciplinary Research, University of Belgrade, 11030 Belgrade, Serbia
3
Institute of Botany and Botanical Garden, Faculty of Biology, University of Belgrade, 11000 Belgrade, Serbia
*
Author to whom correspondence should be addressed.
Agriculture 2025, 15(9), 917; https://doi.org/10.3390/agriculture15090917
Submission received: 30 March 2025 / Revised: 13 April 2025 / Accepted: 15 April 2025 / Published: 22 April 2025

Abstract

:
Perennial ryegrass represents the most important forage grass, yet its generally low drought tolerance leads to reduced yields under water scarcity. Nevertheless, large intra- and inter-population variability could be a pool for selecting new drought-tolerant varieties. In this study we evaluated three populations (K-11, Exp population and Shandon) under semi-controlled conditions across four watering levels (100%, 70%, 50% and 30% of field water capacity), focusing on yield and key morphological and biochemical traits. Dry matter yield and root dry mass decreased in all populations under limited watering conditions. The highest biomass production in such conditions was observed in the Exp population, likely due to better root performance in the deeper soil layer. On the other hand, oxidative stress markers (MDA and H2O2) and water-soluble sugars, which indicated the best physiological status in cultivar K-11 under severe drought, did not lead to the highest DMY. These results show the importance of including multiple physiological and biochemical traits in breeding processes, with the aim of developing perennial ryegrass cultivars capable of withstanding prolonged and intense summer drought as a consequence of climate change.

1. Introduction

As a consequence of the increasing human population and the acceleration of global climate changes, sustainable food production will be challenging in the coming decades. Drought, in particular, represents one of the most important restriction factors for food and feed productivity. More than half of the world’s agricultural land in some part of the year has a problem with a drought [1,2]. Drought may affect the growth and development of plants, dry matter yield or quality of crops [3,4,5]. None of the plants can tolerate intensive and severe drought, and because of that, plant tolerance is primarily dependent on the intensity and longevity of drought, which is usually unpredictable. On the other hand, plant genotype or developmental phase and plant age are very important in improving tolerance in such conditions [6,7]. Perennial ryegrass (Lolium perenne L.) is the most important forage grass with a high herbage yield and quality, grazing tolerance and high digestibility in ruminant nutrition [8,9]. It is the main component of various permanent and sown grasslands in temperate regions. However, it needs a lot of water to survive and maintain optimal growth [10]. Whereas grasslands cover approximately 70% of the world’s agricultural area [11], and most of them are rainfed, there is a significant danger that they will not be able to ensure enough high-quality animal feed in the future. Therefore, the creation of drought-tolerant perennial ryegrass genotypes by breeding deeper roots and physiological traits that improve drought tolerance has become more important in recent years [12,13].
Drought tolerance can be understood as the ability to sustain growth and maintain physiological functions under water deficit conditions. One of the first plant responses to drought stress is stomatal closure because of decreasing intracellular turgor pressure. This leads to reduced photosynthetic activity, increased reactive oxygen species (ROS) production and altered enzyme activity [14,15]. In such conditions, plants also overproduce low molecular weight organic solutes, like water-soluble sugars [16]. These sugars are included in protecting cellular structures, primarily to ensure plant cells uptake additional water through reducing the water potential in the osmotic adjustment process [17] and secondarily an antioxidative function to prevent membrane lipid oxidation by scavenging ROS [18]. Accumulated WSS in the cells are usually accompanied by elevated ROS levels [19], which additionally highlights the complexity and linkage between osmotic adjustment and oxidative stress responses. Plant cells naturally produce ROS [superoxide anion radical (•O2); hydrogen peroxide (H2O2); singlet oxygen (1O2); and hydroxyl radical (•OH)] that play a critical role in the rapid activation of stress response networks during biotic and abiotic stress responses, thereby supporting the establishment of defensive mechanisms and the protection of plants [20]. Nevertheless, too much accumulated ROS in cells damages proteins and nucleic acids and leads to the peroxidation of cell and chloroplast membrane lipids, producing the highly toxic molecule malondialdehyde (MDA). These factors mutually limit plant productivity and ultimately could result in cell death [21]. Therefore, ROS homeostasis in plants is very important to protect them against biotic and abiotic stress. However, plants, as sessile organisms, have evolved an extremely effective defensive antioxidant system that protects plant cells from disruptions and maintains ROS in a steady state. The large group of enzymatic and non-enzymatic antioxidants contribute to this process. Quick neutralisation of reactive •O2 into molecular oxygen (O2) and H2O2 catalyses a multimeric metalloprotein enzyme SOD, while CAT and POX catalyse the scavenging of H2O2 from the cell in the next step. CAT, which is predominantly founded in both peroxisomes and mitochondria, by combined action with SOD, dismutates H2O2 and •O2 to water and O2, while POD, after the first step of the catalytic reaction and elimination of H2O2 into water, oxidises certain one-electron substrates such as phenolic compounds [22] in a peroxidase-catalysed H2O2-dependent phenolic cross-linking reaction [23]. Since enzymes represent the biochemical basis for a multitude of plant metabolic pathways, their alterations result in changes in physiological processes connected with plant growth and yield.
The aim of this research was to evaluate differences among selected perennial ryegrass populations in response to reduced watering levels. The key morphological and biochemical traits, such as enzyme activity and water-soluble sugars, were tested to provide a better understanding of how these traits influence dry matter yield under drought stress conditions. The results could be used in breeding processes to obtain more drought-tolerant perennial ryegrass genotypes with great yield stability.

2. Materials and Methods

2.1. Plant Material and Experimental Design

Three diploid perennial ryegrass populations originating from distinct climates were utilised in the experiment to investigate their drought responses under different watering levels. Cultivar K-11 and experimental breeding population (Exp) were obtained from the Institute for Forage Crops Kruševac, representing a temperate continental climate (Serbia, the Balkans), while cultivar Shandon (Sh) from Aberystwyth University, represent an oceanic climate (Wales, Great Britain). These populations were selected to explore whether their climatic adaptations influence physiological and biochemical responses under soil moisture stress. The seeds from all populations were germinated and grown in a greenhouse previously, and the experiment was set up in the middle of May. Plants were transplanted into plastic tubes (7.5 cm in diameter, 90 cm in length) filled with washed mortar sand (0.5 to 2 mm particle size). Throughout the experiment, all plants remained in the vegetative stage. Following Blamey et al. [24], plants were irrigated with a low-strength nutrient solution during the entire experimental period. The experiment was conducted under semi-controlled conditions with a regulated water supply under a rain shelter. Soil water levels in tubes were detected by frequently weighing, selecting tubes from each watering level treatment and calculating the amount of water required to maintain the desired field water capacity. A two-factorial experiment (different watering reduction levels and populations) was performed for three months. Four levels of watering [control—100% of field water capacity (C), 70% (R1), 50% (R2) and 30% (R3)] and three populations were applied as treatments. Sixty plants per population, divided into three randomised blocks (20 plants each), were analysed in all watering regimes. The average day/night temperature during the experimental period was approximately 26.52/15.14 °C with a relative humidity of about 67% and under natural light conditions.

2.2. Yield and Root Mass

Three months (90 days) after growing in tubes, plants were harvested, aboveground biomass was air dried at 60 °C for 24 h and dry matter yield (DMY) was measured (g/plant). Roots were extracted from the sand and root dry mass (RDM) was measured (g/plant) from topsoil (0–50 cm) and from deeper soil (50–90 cm) layers. The root:shoot ratio (calculated as an RDM/DMY) and ratio of the dry root mass between topsoil and deeper soil layers were also determined.

2.3. Biochemical Analysis

At the end of the drought treatment (90 days after transplanting in tubes), leaves from each watering treatment were harvested for biochemical analysis. To minimise diurnal variation, leaf sampling was carried out at the same time of day (midday) for all treatments. Leaves were immediately frozen in liquid nitrogen and stored at –80 °C.
The extraction solution for the determination of enzyme activities was prepared by leaf tissue homogenisation in extraction buffer (50 mM potassium phosphate buffer, pH 7) at a ratio of 1:5 (fresh weight:extraction buffer). After centrifugation at 10,000× g for 10 min at 4 °C, supernatants were used for further spectrophotometric determination of total protein concentrations and enzyme activities.
Protein concentrations were determined by the Bradford total protein assay [25] customised for the use of 96-well microplates using Bovine Serum Albumin (BSA, Sigma-Aldrich, St. Louis, MO, USA) as standard [26]. Absorbance was measured at 595 nm (Multiscan FC, Thermo ScientificTM, Waltham, MA, USA).
Total superoxide dismutase (EC 1.15.1.1) activity was assayed according to the modified method of Fridovich [27]. The reaction mixture consisted of 50 mM potassium phosphate buffer pH 7.8 with 0.1 mM EDTA, 5 × 10⁻⁴ M xanthine, 6 × 10⁻⁹ M xanthine oxidase (EC 1.1.3.22) from bovine milk (Sigma-Aldrich, St. Louis, MO, USA) and 10−5 M Cyt c from horse heart (Sigma-Aldrich, St. Louis, MO, USA) [26] producing an initial Cyt c reduction rate of ΔA550 nm = 0.025 ± 0.005 per min (Shimadzu UV-2501 PC 21, Kyoto, Japan). Under these defined conditions, the SOD amount needed to inhibit Cyt c reduction by 50% (0.0125 absorbance unit per min) is defined as 1 unit of activity. SOD-specific activity was expressed in Units (U) per milligram of total protein (U/mg prot).
Catalase (EC 1.11.1.6) activity was determined by measuring a decrease in absorbance at 240 nm (Shimadzu UV-2501 PC 21, Kyoto, Japan) due to H2O2 degradation [26]. The reaction mixture consisted of 50 mM potassium phosphate buffer pH 7.0 containing H2O2 in concentration which enabled an absorbance of 0.85 ± 0.02. The specific activity of CAT was defined as the amount of enzyme required to cleave 1 µmol H2O2 per minute at 25 °C. The specific activity of CAT was expressed in units (U) per milligram of total protein (U/mg prot).
Guaiacol peroxidase (EC 1.11.1.7) activity was monitored by the formation of tetraguaiacol from guaiacol in the presence of H2O2 according to the modified method of Hammerschmidt et al. [28]. The reaction mixture contained protein sample, 0.25% (v/v) guaiacol and 10 mM H2O2 in 50 mM phosphate buffer pH 6.0. Increase in absorbance at 470 nm was measured by spectrophotometer (Shimadzu UV-2501 PC 21, Kyoto, Japan). The specific activity of POD was defined as the amount of the enzyme that oxidises 1 µmol of substrate per minute at 25 °C and expressed in units (U) per milligram of total protein (U/mg prot).
To determine the degree of lipid peroxidation of cell membranes, the amount of malondialdehyde was quantified using modified method of Heath and Packer [29]. Homogenised samples were extracted with 0.1% (w/v) trichloroacetic acid (TCA, Merck, Darmstadt, Germany) and after centrifugation for 10 min at 15,000× g at 4 °C supernatant was mixed with 20% TCA containing 0.5% (w/v) thiobarbituric acid (TBA, Sigma-Aldrich, St. Louis, USA) and incubated in water bath for 30 min at 95 °C. After cooling, samples were centrifuged at 10,000× g for 15 min. Absorbance of supernatant was measured using microplate reader (Multiskan Spectrum Thermo Electron Corporation, Vantaa, Finland) at 532 and 600 nm. Results were expressed in nanomole per gram of fresh weight (nmol/g FW).
Hydrogen peroxide content was determined in the plant tissue according to the modified method of Velikova et al. [30]. Samples were homogenised and extracted with 0.1% (v/v) TCA. After centrifugation for 10 min at 15,000× g at 4 °C, supernatant was mixed with 10 mM potassium phosphate buffer pH 7.0 and 1 M KJ. The absorbance was measured using microplate reader (Multiskan Spectrum Thermo Electron Corporation, Vantaa, Finland) at 390 nm and results were expressed in micromole per gram of fresh weight (µmol/g FW).

2.4. Carbohydrate Analyses

High-pressure liquid chromatography (HPLC) analyses were performed on a Waters Breeze chromatographic system (Waters, Milford, MA, USA) connected to Waters 2465 electrochemical detector with a 3 mm gold working electrode and hydrogen reference electrode. Separation of sugars was performed on CarboPAC PA1 (Dionex, Sunnyvale, CA, USA) 250 × 4 mm column equipped with corresponding CarboPac PA1 guard column at a constant temperature of 30 °C and at a flow rate of 1.0 mL × min−1. Sugars were eluted isocratically using 200 mM sodium hydroxide prepared from 50% (w/w), low carbonate NaOH (J.T. Baker, Deventer, Holland) by adding 10.5 mL to the final volume of 1 l vacuum-degassed deionised water. Signals were detected in pulsed amperometric mode using the following waveform: E1 = +0.15 V for 300 ms; E2 = +0.75 V for 150 ms; E3 = −0.80 V for 150 ms, and within 150 ms of integration time. The filter timescale was 0.2 s, and the range was set to 5 µA for the full mV scale. Data acquisition and quantification using the external standard method were carried out by Waters Empower 2 Software (Waters, Milford, CT, USA).

2.5. Statistical Analysis

All data were subjected to two-way ANOVA, with irrigation level and genotype as classification factors in three replications, followed by Tukey’s HSD test using STATISTICA 12 software (StatSoft, Tulsa, OK, USA).

3. Results

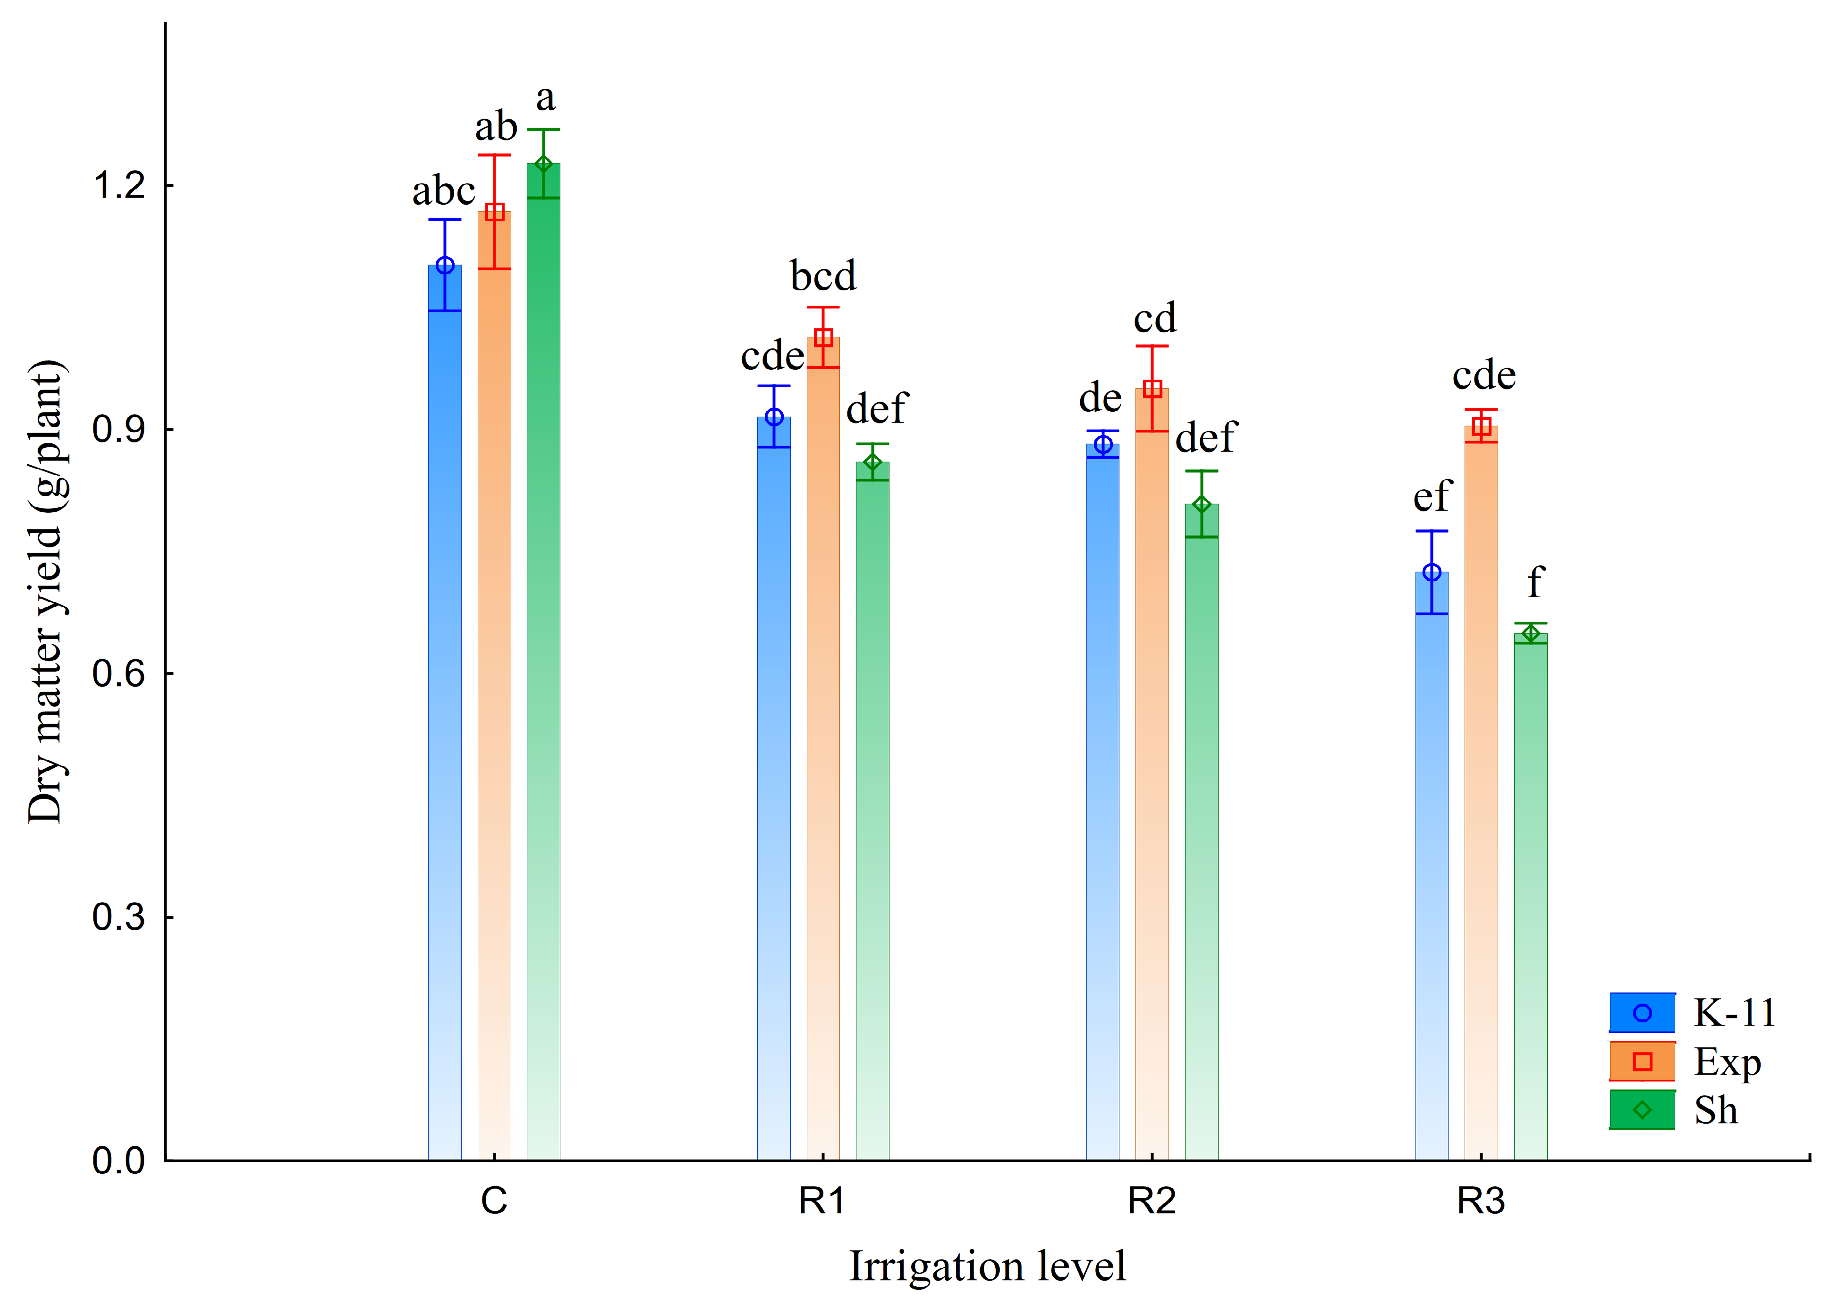
3.1. Yield and Root Mass

In all populations, there was a significant reduction in dry matter yield (DMY) under reduced watering treatments, with the lowest yields recorded at the R3 watering level. The Exp population during the water-reduced treatments achieved the highest DMY compared to other cultivars, statistically significant relative to Sh under maximum watering reduction. Statistical significance was observed only at the R3 watering level, where DMY in the Exp population was significantly higher than in the cultivar Sh. No statistically significant differences were observed between K-11 and the other two populations across individual watering treatments (Table 1 and Figure 1).
Similarly to dry matter yield, the root dry mass (RDM) decreased in both soil layers (0–50 cm and 50–90 cm) due to water scarcity. RDM was reduced by 46.93% in the deeper layer (50–90 cm) compared to 29.65% in the topsoil (0–50). The cultivar Sh had significantly higher RDM in the topsoil compared to Exp and K-11 during the experiment. On the other hand, the Exp population had the highest RDM in the deeper layer (50–90 cm). However, RDM in the Exp population was significantly higher only under control conditions compared to K-11 and in R3 treatment compared to Sh (Table 1 and Figure 2).
Analysis of the root:shoot ratio revealed that it did not significantly increase under reduced watering levels. However, the root dry mass ratio between the topsoil and deeper layers increased under the maximal reduced watering primarily due to significant increase in variety Sh (Table 1 and Figure 3).

3.2. Hydrogen Peroxide (H2O2) and Malondialdehyde (MDA) Formation

The synthesis of H2O2 and MDA overall showed a similar trend with the reduction in watering. However, if we observe populations separately, trends between MDA and H2O2 levels have differences, particularly at the R3 watering. While H2O2 in Exp constantly increased with the intensity of drought, MDA dropped sharply at the highest water reduction. In contrast, despite a significant decrease in H2O2 in K-11, MDA increased slightly under maximum water reduction. For Sh, both H2O2 and MDA significantly increased simultaneously under maximal water reduction (Table 2 and Figure 4a,b).

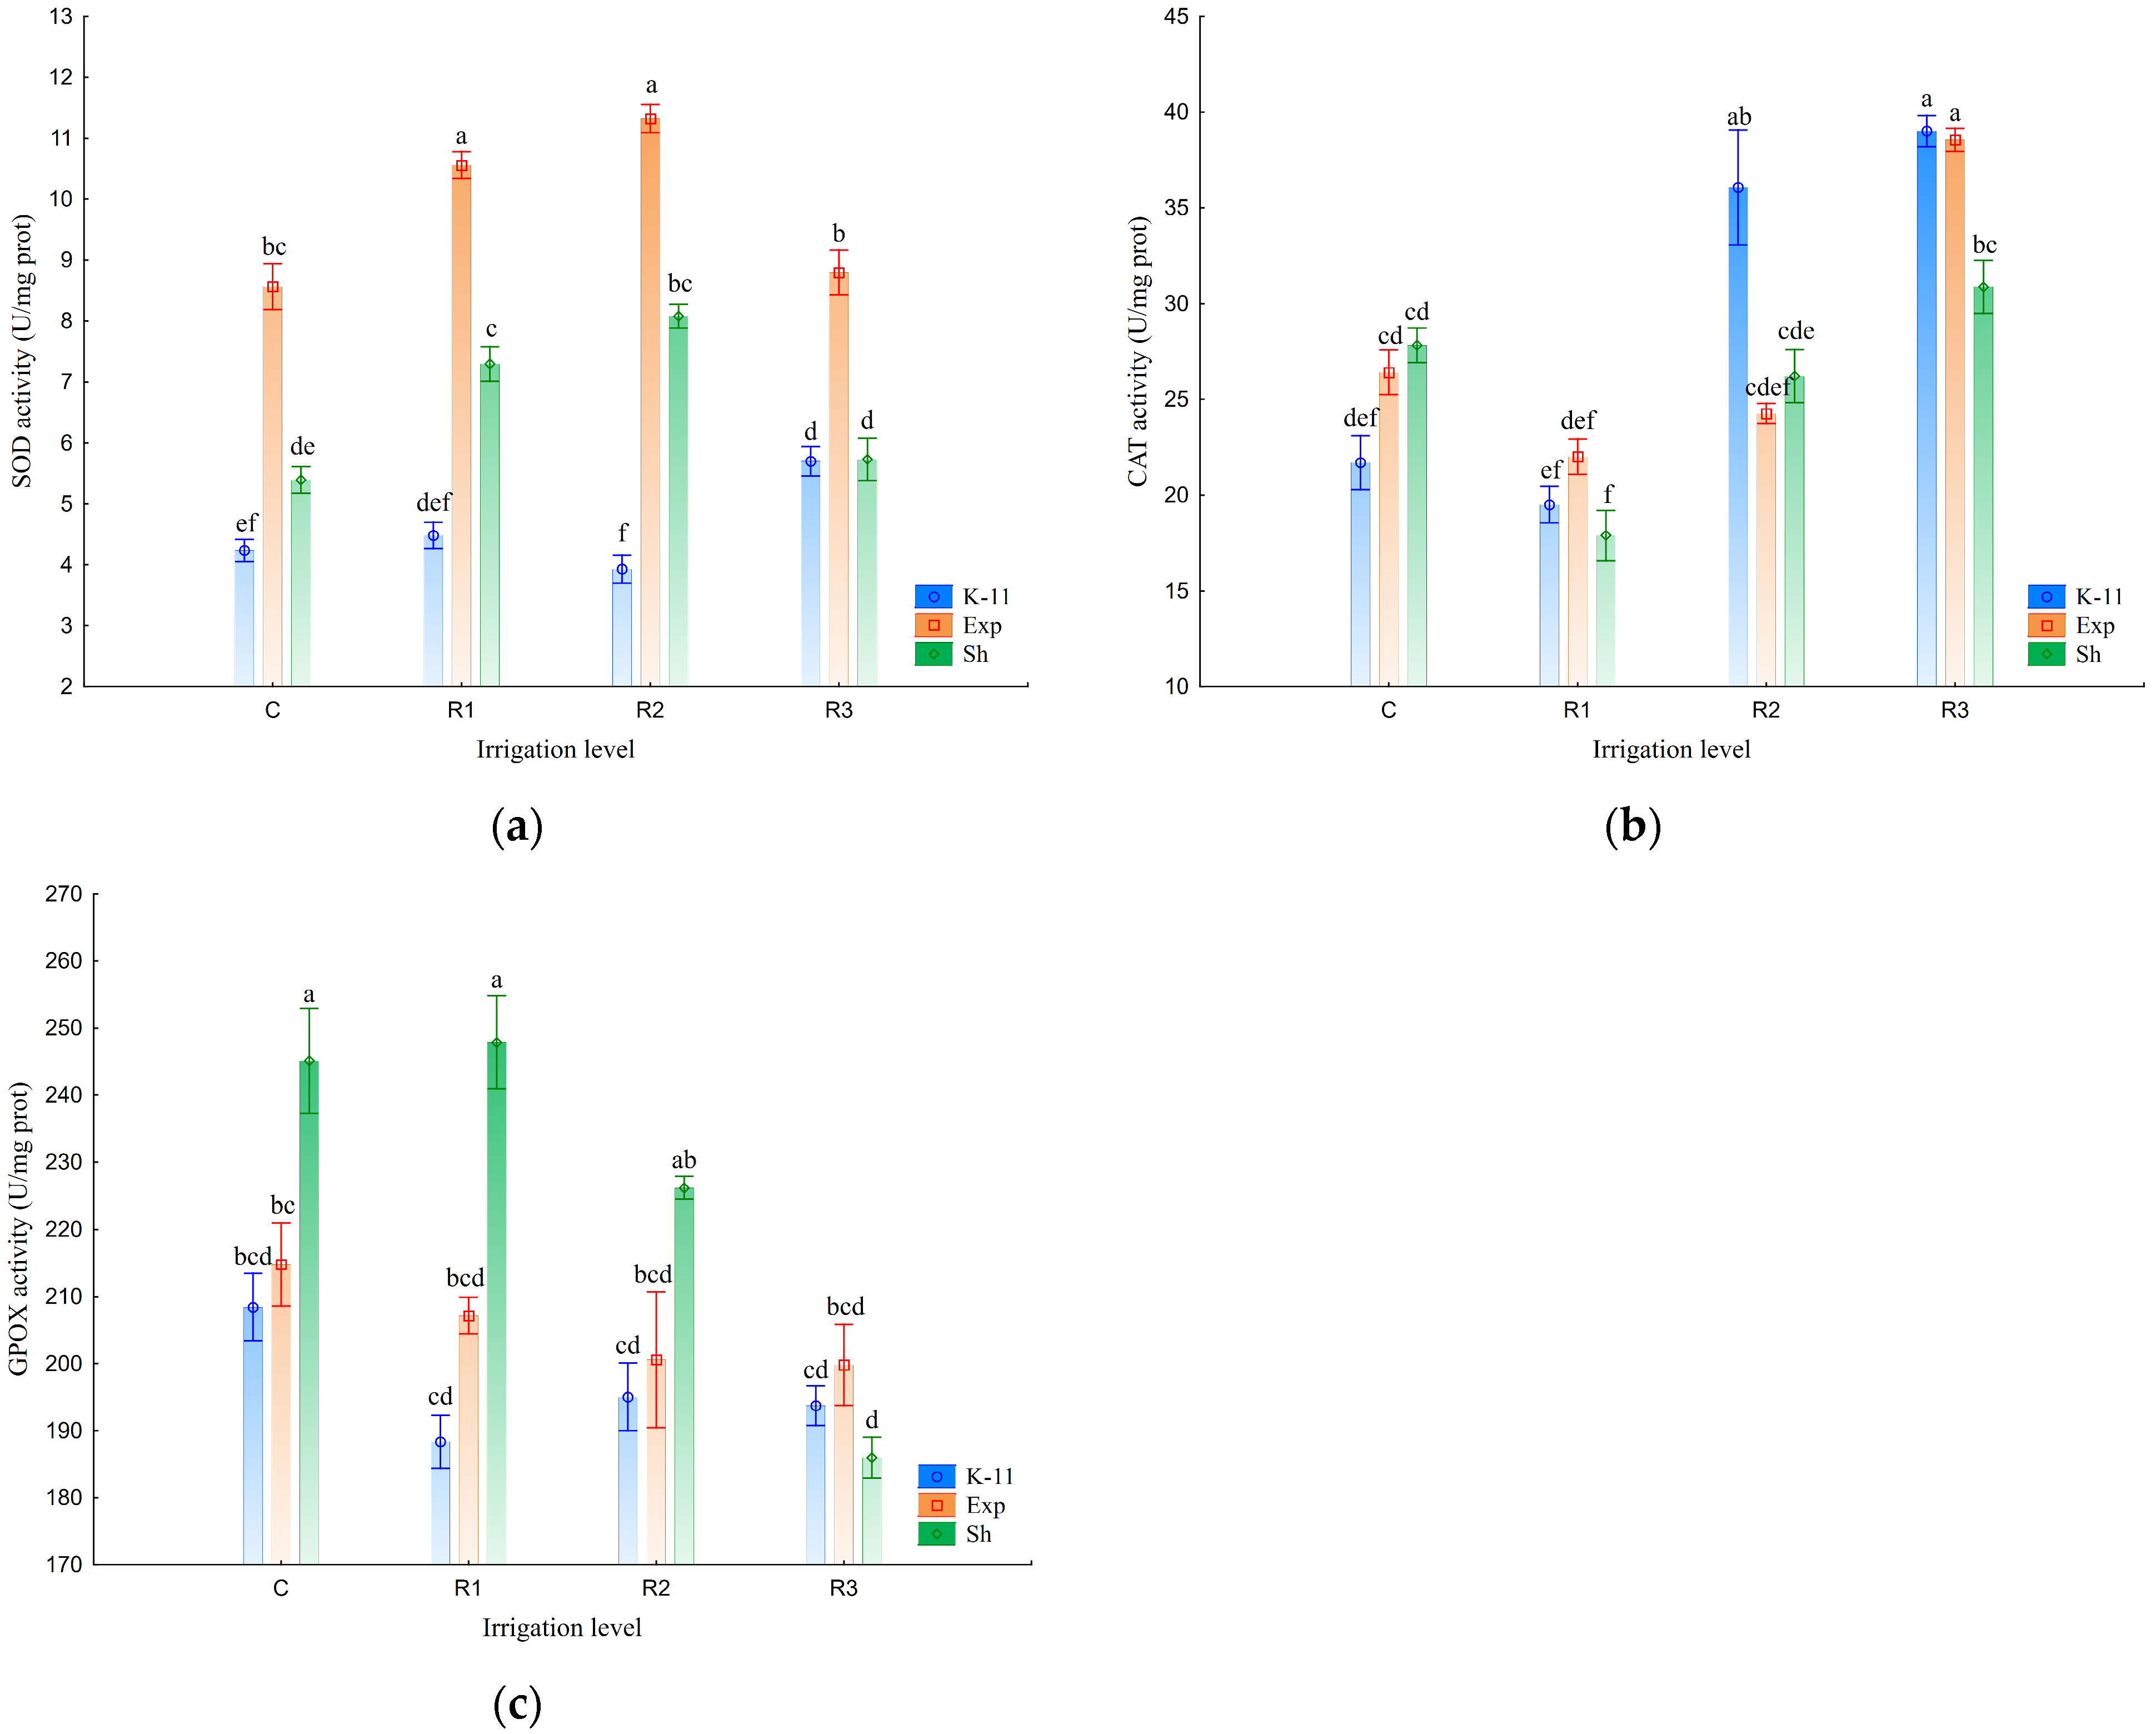
3.3. Antioxidant Enzyme Activity

The superoxide dismutase (SOD) activity in the Sh and Exp increased at the R1 and R2 watering reduction levels and then declined at R3. Conversely, the SOD activity in the cultivar K-11 was not affected by lower watering, except in R3, where SOD activity was increased compared to control conditions. SOD activity in Exp was significantly higher than in Sh and K-11 during all watering regimes (Table 2 and Figure 5a).
All populations showed similar trends in CAT activity, but their intensity varied at different watering levels. The general trend in CAT activity was to increase at the R2 and R3 watering, but it decreased at the first watering reduction in all populations, significantly at the cultivar Sh. With the next watering reduction, CAT activity was greatly increased in K-11 and was significantly higher compared to the other two populations, whose activities also slightly increased. CAT activity continued to increase under maximum water reduction, especially in Exp, where its activity was significantly higher compared to Sh. By the end of the experiment, CAT activity remained at a high level in all populations, in contrast to SOD activity (Table 2 and Figure 5b).
Under limited water conditions, guaiacol peroxidase (GPOX) showed a completely different trend in activity compared to SOD and CAT. The decline in GPOX activity under water-reduced treatments, compared to the control, was clearly observed only in the cultivar Sh. In contrast, the slight decrease in GPOX activity under water scarcity in the Exp and K-11 populations was not statistically significant. Although GPOX activity under control conditions was significantly higher in the cultivar Sh, under maximum water reduction, Sh had the lowest GPOX activity, without statistical significance compared to the other two populations (Table 2 and Figure 5c).

3.4. Water-Soluble Sugars Content

The results have shown that plant genotype had a huge impact on water-soluble sugars (WSS) content. Sucrose content was also significantly dependent on the water status, while the irrigation levels had no influence on glucose content. Cultivar K-11 showed the highest value of WSS during the experiment, statistically significant relative to Exp and Sh under the R2 and R3 watering regimes. The glucose and fructose contents were also the highest in the K-11 variety, except for glucose under maximal drought stress, where the difference was not significant. With the intensity of drought stress, sucrose content increased the most in the K-11 variety. Compared to control conditions, the Exp population and cultivar Sh also had increased sucrose content under maximal watering reduction, but it was significantly lower than in K-11. Watering status had no significant effect on glucose and fructose content, except in the Exp population, where fructose increased significantly under R3 watering compared to control conditions (Table 3 and Figure 6a–c).

4. Discussion

Our study demonstrated different drought responses among perennial ryegrass populations originating from different climes. The Exp population had the highest dry matter yield (DMY) under water reduction, significantly outperforming Sh under the most severe water deficit. It is assumed that a well-developed root system in deeper soil layers had the greatest impact on the yield, but robust antioxidant enzyme activity, mitigating oxidative damage despite high levels of reactive oxygen species (ROS), also contributed. The cultivar Sh had the highest root mass in the topsoil, which did not affect better yield in the drought stress conditions. Its limited antioxidant response in water scarcity, as evidenced by exhausted SOD and GPOX and lower CAT activity, led to increased oxidative stress markers (MDA and H2O2). Cultivar K-11, which has shown the highest water-soluble sugar (WSS) content during the experiment, could indicate better osmotic adjustment. This assumption needs to be further tested in more specific analyses of osmotic potential. Despite that oxidative stress markers did not indicate a high level of stress in cultivar K-11 under reduced watering conditions, the expected highest DMY was not achieved.

4.1. Yield and Root Mass

As expected, dry matter yield (DMY) of perennial ryegrass populations under drought stress was significantly lower (by 35%) in contrast to control conditions. The Exp population achieved a significantly higher yield under maximum water deficit (0.90 g/plant) compared to Sh (0.65 g/plant) at the same irrigation level, indicating its better performance under these conditions. Drought not only decreased DMY but also reduced root system expansion, both in topsoil and deeper soil layers. Significantly higher root dry mass (RDM) of cultivar Sh in the 0–50 cm soil layer (1.14 g/plant) did not translate into an increased DMY under limited water conditions. Although RDM in the topsoil area facilitates better intake of nutrients from aboveground, it, according to Carrow [31], negatively correlates with drought resistance. On the other hand, the highest DMY in the Exp population in the water scarcity conditions could be the result of the Exp having the highest root mass (0.22 g/plant) in the deeper soil layer. According to the results of Sokolovic et al. [32], Lolium perenne cultivars with a robust root system in the deeper soil layer were more drought-tolerant. There are also similar results on the other related species; Fang et al. [33], in the experiment with different wheat cultivars, showed that increased root mass and root length density in deeper soil layers promotes higher DMY in the drought.
Root systems are crucial for nutrient uptake and drought adaptation, but their efficiency depends on balanced development. While the root:shoot ratio was the highest in Sh (1.51), the Exp population had a more balanced allocation of root mass between topsoil and deeper layers, which gave more advantages for maintaining DMY under water deficit conditions. Phenotypes with fewer axial roots and lower lateral root density may also enhance drought resistance by optimising resource allocation in high-input ecosystems [34]. However, excessive root investment can reduce shoot growth, leading to decreased yield potential, particularly in rainfed conditions [35].

4.2. Hydrogen Peroxide (H2O2) and Malondialdehyde (MDA) Formation

Increased levels of H2O2 and MDA in watering-reduced treatments are obvious indicators of oxidative stress. However, in the Exp population, it was observed that maximum watering reduction (R3) increased the accumulation of H2O2 while MDA sharply decreased to 76.3 nmol/g FW after initially increasing in R1 and peaking at approximately 88.5 nmol/g FW in R2. Despite elevated H2O2 levels, which might suggest a partial impairment of the antioxidant system, the Exp population antioxidant system successfully mitigates lipid peroxidation. Some studies have shown that plant species can effectively scavenge reactive oxygen species (ROS) even under moderately increased H2O2 under stress conditions due to its function as a secondary messenger [36,37]. It can therefore be assumed that the antioxidant machinery in Exp in maximal water reduction remained functional or was activated to prevent excessive lipid peroxidation and MDA formation. The cultivar K-11 on the other hand exhibited a significant decrease in H2O2 level under R3 watering reduction (from 38.7 µmol/g FW in R2 to 35.4 µmol/g FW), while MDA levels remained stable across all watering regimes. Meanwhile, in the cultivar Sh, both H2O2 and MDA increased simultaneously under water deficit, suggesting an insufficient antioxidant defence.
MDA, a highly reactive byproduct of lipid peroxidation, is a significant biological marker of oxidative stress. Previous studies have shown that the formation of MDA increases during abiotic stresses [21]. However, MDA concentration is often lower in crops with enhanced oxidative stress tolerance [38], suggesting that K-11 may possess a stronger antioxidant defence due to its significantly lower MDA level in R2 and R3 watering in relation to Exp and Sh. Despite this, K-11 did not achieve higher yield under water deficit conditions compared to the other populations studied. This indicates that oxidative stress markers alone may not be sufficient for selecting drought-resistant genotypes in breeding programs.

4.3. Antioxidant Enzyme Activity

Superoxide dismutase (SOD), catalase (CAT) and guaiacol peroxidase (GPOX) represent the most important antioxidative enzymes in cell protection from the harmful effects of free radicals. The activity of these enzymes is very important in preventing oxidative stress in the drought [39]. In our experiment, SOD activity significantly increased under reduced watering conditions R1 and R2. However, at maximum watering reduction (R3), it dropped by 13.4% compared to its peak in R2. CAT activity, on the other hand, increased under all reduced watering treatments, approximately 44% from control (C) to R3, while GPOX activity did not notably change, except in Sh, where it decreased significantly under maximum watering reduction. The plant antioxidant system may be exhausted by the intense and prolonged oxidative stress, reducing its activity, as has already been observed in some experiments [40,41]. The reduction in SOD activity at the end of our experiment aligns with these findings. However, in contrast to our results, CAT activity also decreased in those studies. Different results of antioxidant enzymes were also found in a study by Farooq et al. [42], where GPOX activity constantly increased with drought intensity, while the SOD and CAT activity decreased. In another experiment on perennial ryegrass, peroxidase activity was decreased in drought conditions, but in Medicago lupulina it was increased [43]. The complexity of these enzymatic responses and their different activity in other studies could be explained by the differences in developing stages, intensity and longevity of drought, plant species or even intraspecies genetic differences between populations [44].

4.4. Water-Soluble Sugars Content

The level of water-soluble sugars (WSS), mainly sucrose, was observed to depend on both water status and plant genotype. Sucrose accumulation increased by 75% under R3 watering, compared to control, suggesting its importance in drought tolerance. It is documented that sucrose has a part in osmotic adjustment, facilitating plants to overcome water deficit, maintaining cell turgor and stabilising cell membranes [45]. Despite the fact that cultivar K-11 cells accumulated sucrose levels up to 67% higher than other genotypes in drought stress conditions, it did not reach the highest DMY. This discrepancy suggests that regardless of high sucrose levels, they may contribute to drought tolerance but are not the sole factor that could increase DMY in such conditions.
Except in the Exp population under maximum watering reduction, where fructose was significantly higher compared to the control, none of the different watering treatments influenced glucose and fructose accumulation. In the experiment by Shahidi et al. [11], perennial ryegrass and tall fescue also respond to drought stress through sucrose accumulation while hexoses significantly decreased. The lack of significant changes in glucose and fructose content across most treatments in our study indicates that hexoses likely have lower importance in drought stress responses.
In a broader context, our results have agroecological and climate relevance, particularly due to increasingly intense drought periods caused by climate change. The most important aspect in selecting drought-tolerant cultivars is to understand plant responses in such conditions. Root architecture, antioxidant activity and osmotic adjustments are surely very significant. These results are important not just in breeding processes, but also for dealing with the challenges posed by unavoidable climate change.

5. Conclusions

The decreased productivity was expected under drought conditions in all populations. The Exp population showed the best biomass production in such conditions and likely drought tolerance due to a robust root system in the deeper soil layer which facilitates better water utilisation. Despite Exp being under oxidative stress, its antioxidant enzyme activity mitigated the harmful effects of free radicals. On the other hand, stress markers in the cultivar K-11 were significantly the lowest and the WSS level was the highest under drought conditions, compared to other populations, but DMY was lower than in the Exp population. This underscores the importance of breeding multiple morphological, physiological and biochemical traits to enhance drought resilience—root architecture, water use efficiency and antioxidant capacity.
Our study is valuable for better understanding the connection between different perennial ryegrass ways to achieve drought resilience, but it also has a limitation due to controlled experimental conditions and a narrow set of physiological and biochemical parameters. Future research should include metabolomic profiling to uncover the molecular basis of drought responses across different populations. Similar experiments in the field conditions and different growing seasons would contribute to its relevance in real agricultural conditions. Additionally, heritability and genomic research of main traits such as root growth, antioxidant activity and sugar metabolism are very important for developing drought-resilient cultivars through marker-assisted selection or genomic selection approaches.

Author Contributions

Conceptualisation, M.P. and D.S.; methodology, D.S. and M.P.; validation, J.D.M. and S.B.; formal analysis, M.S.; investigation, M.P. and S.B.; resources, D.M.; data curation, M.P.; writing—original draft preparation, M.P.; writing—review and editing, V.M.; visualisation, M.P.; supervision, A.S. All authors have read and agreed to the published version of the manuscript.

Funding

This research was funded by MINISTRY OF SCIENCE, TECHNOLOGICAL DEVELOPMENT AND INNOVATION OF THE REPUBLIC OF SERBIA, grant number 451-03-136/2025-03/200217; 451-03-1366/2025-03/200053.

Institutional Review Board Statement

Not applicable.

Data Availability Statement

Data are contained within the article.

Acknowledgments

The authors thank Sussane Bart from Teagasc, Ireland for supplying of cv. Shandon seed.

Conflicts of Interest

The authors declare no conflicts of interest.

References

  1. Meza, I.; Siebert, S.; Döll, P.; Kusche, J.; Herbert, C.; Eyshi Rezaei, E.; Nouri, H.; Gerdener, H.; Popat, E.; Frischen, J.; et al. Global-Scale Drought Risk Assessment for Agricultural Systems. Nat. Hazards Earth Syst. Sci. 2020, 20, 695–712. [Google Scholar] [CrossRef]
  2. Mahmoud, N.; Abdou, M.A.H.; Salaheldin, S.; Soliman, W.S. Lemongrass Growth, Essential Oil, and Active Substances as Affected by Water Deficit. Horticulturae 2022, 8, 250. [Google Scholar] [CrossRef]
  3. Sehgal, A.; Sita, K.; Siddique, K.H.M.; Kumar, R.; Bhogireddy, S.; Varshney, R.K.; HanumanthaRao, B.; Nair, R.M.; Prasad, P.V.V.; Nayyar, H. Drought or/and Heat-Stress Effects on Seed Filling in Food Crops: Impacts on Functional Biochemistry, Seed Yields, and Nutritional Quality. Front. Plant Sci. 2018, 9, 1705. [Google Scholar] [CrossRef]
  4. Zandalinas, S.I.; Mittler, R.; Balfagón, D.; Arbona, V.; Gómez-Cadenas, A. Plant Adaptations to the Combination of Drought and High Temperatures. Physiol. Plant. 2018, 162, 2–12. [Google Scholar] [CrossRef]
  5. Dietz, K.-J.; Zörb, C.; Geilfus, C.-M. Drought and Crop Yield. Plant Biol. 2021, 23, 881–893. [Google Scholar] [CrossRef]
  6. Tardieu, F.; Simonneau, T.; Muller, B. The Physiological Basis of Drought Tolerance in Crop Plants: A Scenario-Dependent Probabilistic Approach. Annu. Rev. Plant Biol. 2018, 69, 733–759. [Google Scholar] [CrossRef]
  7. Oguz, M.C.; Aycan, M.; Oguz, E.; Poyraz, I.; Yildiz, M. Drought Stress Tolerance in Plants: Interplay of Molecular, Biochemical and Physiological Responses in Important Development Stages. Physiologia 2022, 2, 180–197. [Google Scholar] [CrossRef]
  8. Colas, V.; Barre, P.; Van Parijs, F.; Wolters, L.; Quitté, Y.; Ruttink, T.; Roldán-Ruiz, I.; Escobar Gutiérrez, A.J.; Muylle, H. Seasonal Differences in Structural and Genetic Control of Digestibility in Perennial Ryegrass. Front. Plant Sci. 2022, 12, 801145. [Google Scholar] [CrossRef]
  9. Wang, R.; Gao, Y.; Li, J.; Wang, X.; Yang, Y.; Huang, H.; Zhou, Z.; Wang, P.; Zhao, L. Drought and Heat Stress Studies in Perennial Ryegrass: A Bibliometric Analysis 1994–2024. Front. Sustain. Food Syst. 2024, 8, 1458552. [Google Scholar] [CrossRef]
  10. Fariaszewska, A.; Aper, J.; Van Huylenbroeck, J.; Baert, J.; De Riek, J.; Staniak, M.; Pecio, Ł. Mild Drought Stress-Induced Changes in Yield, Physiological Processes and Chemical Composition in Festuca, Lolium and Festulolium. J. Agron. Crop Sci. 2017, 203, 103–116. [Google Scholar] [CrossRef]
  11. Shahidi, R.; Yoshida, J.; Cougnon, M.; Reheul, D.; Van Labeke, M.-C. Morpho-Physiological Responses to Dehydration Stress of Perennial Ryegrass and Tall Fescue Genotypes. Funct. Plant Biol. 2017, 44, 612. [Google Scholar] [CrossRef] [PubMed]
  12. Norton, M.R.; Malinowski, D.P.; Volaire, F. Plant Drought Survival under Climate Change and Strategies to Improve Perennial Grasses. A Review. Agron. Sustain. Dev. 2016, 36, 29. [Google Scholar] [CrossRef]
  13. Perlikowski, D.; Augustyniak, A.; Masajada, K.; Skirycz, A.; Soja, A.M.; Michaelis, Ä.; Wolter, G.; Kosmala, A. Structural and Metabolic Alterations in Root Systems under Limited Water Conditions in Forage Grasses of Lolium-Festuca Complex. Plant Sci. 2019, 283, 211–223. [Google Scholar] [CrossRef]
  14. Ashraf, M.; Harris, P.J.C. Photosynthesis under Stressful Environments: An Overview. Photosynthetica 2013, 51, 163–190. [Google Scholar] [CrossRef]
  15. Osakabe, Y.; Osakabe, K.; Shinozaki, K.; Tran, L.-S.P. Response of Plants to Water Stress. Front. Plant Sci. 2014, 5, 86. [Google Scholar] [CrossRef]
  16. Kaur, H.; Manna, M.; Thakur, T.; Gautam, V.; Salvi, P. Imperative Role of Sugar Signaling and Transport during Drought Stress Responses in Plants. Physiol. Plant. 2021, 171, 833–848. [Google Scholar] [CrossRef] [PubMed]
  17. Singh, M.; Kumar, J.; Singh, S.; Singh, V.P.; Prasad, S.M. Roles of Osmoprotectants in Improving Salinity and Drought Tolerance in Plants: A Review. Rev. Environ. Sci. Biotechnol. 2015, 14, 407–426. [Google Scholar] [CrossRef]
  18. Couée, I.; Sulmon, C.; Gouesbet, G.; El Amrani, A. Involvement of Soluble Sugars in Reactive Oxygen Species Balance and Responses to Oxidative Stress in Plants. J. Exp. Bot. 2006, 57, 449–459. [Google Scholar] [CrossRef]
  19. Roitsch, T. Source-Sink Regulation by Sugar and Stress. Curr. Opin. Plant Biol. 1999, 2, 198–206. [Google Scholar] [CrossRef]
  20. Mittler, R.; Zandalinas, S.I.; Fichman, Y.; Van Breusegem, F. Reactive Oxygen Species Signalling in Plant Stress Responses. Nat. Rev. Mol. Cell Biol. 2022, 23, 663–679. [Google Scholar] [CrossRef]
  21. Gill, S.S.; Tuteja, N. Reactive Oxygen Species and Antioxidant Machinery in Abiotic Stress Tolerance in Crop Plants. Plant Physiol. Biochem. 2010, 48, 909–930. [Google Scholar] [CrossRef] [PubMed]
  22. Vidossich, P.; Alfonso-Prieto, M.; Rovira, C. Catalases versus Peroxidases: DFT Investigation of H2O2 Oxidation in Models Systems and Implications for Heme Protein Engineering. J. Inorg. Biochem. 2012, 117, 292–297. [Google Scholar] [CrossRef] [PubMed]
  23. Dragišić Maksimović, J.; Mojović, M.; Vučinić, Ž.; Maksimović, V. Spatial Distribution of Apoplastic Antioxidative Constituents in Maize Root. Physiol. Plant. 2021, 173, 818–828. [Google Scholar] [CrossRef] [PubMed]
  24. Blamey, F.P.C.; Edmeades, D.C.; Asher, C.J.; Edwards, D.G.; Wheeler, D.M. Evaluation of Solution Culture Techniques for Studying Aluminium Toxicity in Plants. In Plant-Soil Interactions at Low pH; Wright, R.J., Baligar, V.C., Murrmann, R.P., Eds.; Springer: Dordrecht, The Netherlands, 1991; pp. 905–912. ISBN 978-94-010-5520-8. [Google Scholar]
  25. Bradford, M.M. A Rapid and Sensitive Method for the Quantitation of Microgram Quantities of Protein Utilizing the Principle of Protein-Dye Binding. Anal. Biochem. 1976, 72, 248–254. [Google Scholar] [CrossRef]
  26. Maksimović, J.J.D.; Živanović, B.D. Quantification of the Antioxidant Activity in Salt-Stressed Tissues. In Plant Salt Tolerance; Shabala, S., Cuin, T.A., Eds.; Methods in Molecular Biology; Humana Press: Totowa, NJ, USA, 2012; Volume 913, pp. 237–250. ISBN 978-1-61779-985-3. [Google Scholar]
  27. Fridovich, I. Superoxide Dismutases. In Advances in Enzymology—And Related Areas of Molecular Biology; Meister, A., Ed.; Wiley: Hoboken, NJ, USA, 1986; Volume 58, pp. 61–97. ISBN 978-0-471-88013-4. [Google Scholar]
  28. Hammerschmidt, R.; Nuckles, E.M.; Kuć, J. Association of Enhanced Peroxidase Activity with Induced Systemic Resistance of Cucumber to Colletotrichum Lagenarium. Physiol. Plant Pathol. 1982, 20, 73–82. [Google Scholar] [CrossRef]
  29. Heath, R.L.; Packer, L. Photoperoxidation in Isolated Chloroplasts. Arch. Biochem. Biophys. 1968, 125, 189–198. [Google Scholar] [CrossRef]
  30. Velikova, V.; Yordanov, I.; Edreva, A. Oxidative Stress and Some Antioxidant Systems in Acid Rain-Treated Bean Plants. Plant Sci. 2000, 151, 59–66. [Google Scholar] [CrossRef]
  31. Carrow, R.N. Drought Avoidance Characteristics of Diverse Tall Fescue Cultivars. Crop Sci. 1996, 36, 371–377. [Google Scholar] [CrossRef]
  32. Sokolovic, D.; Babic, S.; Radovic, J.; Milenkovic, J.; Lugic, Z.; Andjelkovic, S.; Vasic, T. Genetic Variation of Root Characteristics and Deep Root Production in Perennial Ryegrass Cultivars Contrasting in Field Persistency. In Breeding Strategies for Sustainable Forage and Turf Grass Improvement; Barth, S., Milbourne, D., Eds.; Springer: Dordrecht, The Netherlands, 2013; pp. 275–281. ISBN 978-94-007-4554-4. [Google Scholar]
  33. Fang, Y.; Du, Y.; Wang, J.; Wu, A.; Qiao, S.; Xu, B.; Zhang, S.; Siddique, K.H.M.; Chen, Y. Moderate Drought Stress Affected Root Growth and Grain Yield in Old, Modern and Newly Released Cultivars of Winter Wheat. Front. Plant Sci. 2017, 8, 672. [Google Scholar] [CrossRef]
  34. Lynch, J.P. Rightsizing Root Phenotypes for Drought Resistance. J. Exp. Bot. 2018, 69, 3279–3292. [Google Scholar] [CrossRef]
  35. Palta, J.A.; Chen, X.; Milroy, S.P.; Rebetzke, G.J.; Dreccer, M.F.; Watt, M. Large Root Systems: Are They Useful in Adapting Wheat to Dry Environments? Funct. Plant Biol. 2011, 38, 347. [Google Scholar] [CrossRef] [PubMed]
  36. Sharma, P.; Jha, A.B.; Dubey, R.S.; Pessarakli, M. Reactive Oxygen Species, Oxidative Damage, and Antioxidative Defense Mechanism in Plants under Stressful Conditions. J. Bot. 2012, 2012, 217037. [Google Scholar] [CrossRef]
  37. Hasanuzzaman, M.; Bhuyan, M.H.M.; Zulfiqar, F.; Raza, A.; Mohsin, S.; Mahmud, J.; Fujita, M.; Fotopoulos, V. Reactive Oxygen Species and Antioxidant Defense in Plants under Abiotic Stress: Revisiting the Crucial Role of a Universal Defense Regulator. Antioxidants 2020, 9, 681. [Google Scholar] [CrossRef] [PubMed]
  38. Ma, J.; Du, G.; Li, X.; Zhang, C.; Guo, J. A Major Locus Controlling Malondialdehyde Content under Water Stress Is Associated with Fusarium Crown Rot Resistance in Wheat. Mol. Genet. Genom. 2015, 290, 1955–1962. [Google Scholar] [CrossRef]
  39. Laxa, M.; Liebthal, M.; Telman, W.; Chibani, K.; Dietz, K.-J. The Role of the Plant Antioxidant System in Drought Tolerance. Antioxidants 2019, 8, 94. [Google Scholar] [CrossRef]
  40. Đurić, M.; Subotić, A.; Prokić, L.; Trifunović-Momčilov, M.; Cingel, A.; Vujičić, M.; Milošević, S. Morpho-Physiological and Molecular Evaluation of Drought and Recovery in Impatiens Walleriana Grown Ex Vitro. Plants 2020, 9, 1559. [Google Scholar] [CrossRef]
  41. Zhou, Q.; Li, Y.; Wang, X.; Yan, C.; Ma, C.; Liu, J.; Dong, S. Effects of Different Drought Degrees on Physiological Characteristics and Endogenous Hormones of Soybean. Plants 2022, 11, 2282. [Google Scholar] [CrossRef]
  42. Farooq, M.; Ahmad, R.; Shahzad, M.; Sajjad, Y.; Hassan, A.; Shah, M.M.; Naz, S.; Khan, S.A. Differential Variations in Total Flavonoid Content and Antioxidant Enzymes Activities in Pea under Different Salt and Drought Stresses. Sci. Hortic. 2021, 287, 110258. [Google Scholar] [CrossRef]
  43. Farfan-Vignolo, E.R.; Asard, H. Effect of Elevated CO2 and Temperature on the Oxidative Stress Response to Drought in Lolium perenne L. and Medicago sativa L. Plant Physiol. Biochem. 2012, 59, 55–62. [Google Scholar] [CrossRef]
  44. Ayaz, M.; Ali, A.; Ullah, Z.; Sher, H.; Iqbal, J.; Iqbal, R. Exploring Antioxidant Potential and Microsatellite Based Genetic Diversity in Different Germplasm of Aegilops Tauschii. Genet. Resour. Crop Evol. 2024, 1–13. [Google Scholar] [CrossRef]
  45. DaCosta, M.; Huang, B. Osmotic Adjustment Associated with Variation in Bentgrass Tolerance to Drought Stress. J. Am. Soc. Hortic. Sci. 2006, 131, 338–344. [Google Scholar] [CrossRef]
Figure 1. Dry matter yield (DMY) under different watering treatments (means ± standard error). C = 100% of field water capacity; R1 = 70% of field water capacity; R2 = 50% of field water capacity; R3 = 30% of field water capacity. Different lowercase letters indicate significant differences according to the Tukey HSD test (p < 0.05).
Agriculture 15 00917 g001
Figure 2. Root dry mass (RDM) under different watering treatments in the deep soil layer (50–90 cm) (means ± standard error). C = 100% of field water capacity; R1 = 70% of field water capacity; R2 = 50% of field water capacity; R3 = 30% of field water capacity. Different lowercase letters indicate significant differences according to the Tukey HSD test (p < 0.05).
Agriculture 15 00917 g002
Figure 3. Root dry mass ratio (0–50 cm/50–90 cm) under different watering treatments (means ± standard error). C = 100% of field water capacity; R1 = 70% of field water capacity; R2 = 50% of field water capacity; R3 = 30% of field water capacity. Different lowercase letters indicate significant differences according to the Tukey HSD test (p < 0.05).
Agriculture 15 00917 g003
Figure 4. (a) Content of hydrogen peroxide (H2O2) under different watering treatments (means ± standard error); (b) Content of malondialdehyde (MDA) under different watering treatments (means ± standard error). C = 100% of field water capacity; R1 = 70% of field water capacity; R2 = 50% of field water capacity; R3 = 30% of field water capacity. Different lowercase letters indicate significant differences according to the Tukey HSD test (p < 0.05).
Agriculture 15 00917 g004
Figure 5. (a) Activity superoxide dismutase (SOD) under different watering treatments (means ± standard error); (b) Activity catalase (CAT) under different watering treatments (means ± standard error); (c) Activity guaiacol peroxidase (GPOX) under different watering treatments (means ± standard error). C = 100% of field water capacity; R1 = 70% of field water capacity; R2 = 50% of field water capacity; R3 = 30% of field water capacity. Different lowercase letters indicate significant differences according to the Tukey HSD test (p < 0.05).
Agriculture 15 00917 g005
Figure 6. Content of water-soluble sugars (WSS) under different watering treatments (means ± standard error): (a) glucose; (b) fructose; (c) sucrose. C = 100% of field water capacity; R1 = 70% of field water capacity; R2 = 50% of field water capacity; R3 = 30% of field water capacity. Different lowercase letters indicate significant differences according to the Tukey HSD test (p < 0.05).
Agriculture 15 00917 g006
Table 1. Dry matter yield and root mass parameters across soil layers under reduced watering treatments and between populations.
DMY (g/Plant)RDM from 0–50 cm (g/Plant)RDM from 50–90 cm (g/Plant)Root:Shoot RatioRoot Mass Ratio (0–50/50–90)
Irrigation (A)
C1.17 ± 0.03 a0.95 ± 0.11 a0.23 ± 0.02 a1.01 ± 0.09 a4.23 ± 0.45 b
R10.93 ± 0.03 b0.85 ± 0.09 ab0.21 ± 0.01 ab1.16 ± 0.13 a3.98 ± 0.39 b
R20.88 ± 0.03 b0.77 ± 0.10 bc0.18 ± 0.01 b1.10 ± 0.14 a4.47 ± 0.68 b
R30.76 ± 0.04 c0.67 ± 0.07 c0.12 ± 0.01 c1.07 ± 0.12 a6.59 ± 1.40 a
Population (B)
K-110.91 ± 0.04 b0.53 ± 0.03 c0.16 ± 0.01 b0.77 ± 0.02 c3.38 ± 0.18 b
Exp1.01 ± 0.04 a0.75 ± 0.04 b0.22 ± 0.01 a0.96 ± 0.04 b3.57 ± 0.15 b
Sh0.87 ± 0.07 b1.14 ± 0.06 a0.18 ± 0.02 b1.51 ± 0.05 a7.51 ± 0.87 a
ANOVA
A***NS*
B*****
A × B*NS*NS*
C = 100% of field water capacity; R1 = 70% of field water capacity; R2 = 50% of field water capacity; R3 = 30% of field water capacity; DMY (dry matter yield); RDM from 0–50 cm (root dry mass in the 0–50 cm layer); RDM from 50–90 cm (root dry mass in the 50–90 cm layer). Different lowercase letters indicate significant differences according to the Tukey HSD test (p < 0.05). F-test: ‘*’—p < 0.05; “NS”—not significant.
Table 2. Oxidative stress markers and antioxidant enzyme activities under reduced watering treatments and between populations.
H2O2 (µmol/g FW)MDA (nmol/g FW)SOD (U/mg Prot)CAT (U/mg Prot)GPOX (U/mg Prot)
Irrigation (A)
C31.78 ± 0.78 d53.97 ± 3.51 c6.06 ± 0.66 c25.31 ± 1.10 c222.8 ± 6.5 a
R134.97 ± 1.07 c63.16 ± 3.17 b7.45 ± 0.89 a19.81 ± 0.81 d214.5 ± 9.1 ab
R237.23 ± 0.95 b67.69 ± 5.87 a7.78 ± 1.08 a28.85 ± 2.07 b207.3 ± 5.8 b
R340.16 ± 1.27 a68.60 ± 4.35 a6.74 ± 0.54 b36.14 ± 1.41 a193.2 ± 2.9 c
Population (B)
K-1135.18 ± 1.15 b48.76 ± 1.69 c4.59 ± 0.22 c29.07 ± 2.69 a196.4 ± 2.9 b
Exp37.72 ± 0.90 a75.64 ± 3.11 a9.81 ± 0.37 a27.81 ± 1.96 ab205.6 ± 3.4 b
Sh35.21 ± 1.54 b65.67 ± 2.10 b6.62 ± 0.35 b25.70 ± 1.55 b226.3 ± 7.8 a
ANOVA
A*****
B*****
A × B*****
C = 100% of field water capacity; R1 = 70% of field water capacity; R2 = 50% of field water capacity; R3 = 30% of field water capacity; H2O2 (hydrogen peroxide); MDA (malondialdehyde); SOD (superoxide dismutase); CAT (catalase); GPOX (guaiacol peroxidase). Different lowercase letters indicate significant differences according to the Tukey HSD test (p < 0.05). F-test: “*”—p < 0.05.
Table 3. Water-soluble sugars (WSS) under reduced watering treatments and between populations.
Glucose (mg/g FW)Fructose (mg/g FW)Sucrose (mg/g FW)
Irrigation (A)
C2.72 ± 0.12 a2.62 ± 0.11 ab6.46 ± 0.56 b
R12.76 ± 0.12 a2.53 ± 0.12 b6.07 ± 0.57 b
R22.73 ± 0.19 a2.52 ± 0.18 b6.99 ± 1.04 b
R32.82 ± 0.12 a2.76 ± 0.11 a11.31 ± 1.04 a
Population (B)
K-113.11 ± 0.07 a2.95 ± 0.05 a10.60 ± 0.94 a
Exp2.86 ± 0.07 b2.68 ± 0.07 b6.82 ± 0.50 b
Sh2.31 ± 0.05 c2.19 ± 0.09 c5.70 ± 0.63 c
ANOVA
ANS**
B***
A × B***
C = 100% of field water capacity; R1 = 70% of field water capacity; R2 = 50% of field water capacity; R3 = 30% of field water capacity. Different lowercase letters indicate significant differences according to the Tukey HSD test (p < 0.05). F-test: “*”—p < 0.05; “NS”—not significant.
Disclaimer/Publisher’s Note: The statements, opinions and data contained in all publications are solely those of the individual author(s) and contributor(s) and not of MDPI and/or the editor(s). MDPI and/or the editor(s) disclaim responsibility for any injury to people or property resulting from any ideas, methods, instructions or products referred to in the content.

