


Abstract
To address soil degradation and pest accumulation in facility agriculture, this study developed an in situ soil-turning plow for deep soil inversion under spatially constrained greenhouse conditions. A reference plow surface was obtained by reverse engineering, and the final in situ plow surface was reconstructed using plow-body forming theory and a constrained soil-turning trajectory. Soil contact parameters were calibrated in EDEM using the measured soil moisture content and angle of repose. An in situ furrow soil retention rate was proposed to evaluate the proportion of disturbed soil remaining within or returning to the original furrow region. Plackett–Burman screening identified plowing width, plow-body installation angle, and soil-cutting angle as the main factors affecting the retention rate. Box–Behnken optimization yielded optimal values of 278.392 mm, 40.522°, and 23.211°, respectively, with a predicted retention rate of 81.166%. Physical validation showed a 3.13% relative error between predicted and measured values. The optimized plow provides a design reference for compact deep-tillage machinery in greenhouses where lateral soil displacement must be minimized.
1. Introduction
Facility-based agriculture is a critical component of modern intensive horticulture because it integrates engineering, environmental control, biological production, and information technologies to create controllable growth environments for crops and animals. Existing studies have investigated greenhouse micro-spray regulation and energy partition in cucumber production systems [1,2], chemical-input management in agricultural production [3], intelligent greenhouse control and modeling strategies [4], CFD-based micro-plant-factory design [5], and energy-saving insulation systems for multi-span greenhouses [6]. In addition, recent research has addressed temperature-responsive irrigation regulation in greenhouses, plant-factory microclimate management, and pre-production quality and safety control in agricultural supply chains [7,8,9]. Because disease prevention is also important in protected cultivation, airborne disease-spore separation and enrichment technologies provide useful support for crop-disease monitoring [10].
Despite the expansion in cultivation area and yield benefits, the long-term sustainability of facility soil health is facing severe challenges directly linked to intensified management practices. Intensive greenhouse production requires accurate fertilizer and chemical-input management, and electronically controlled fertilization equipment has been developed to improve the precision of side-deep fertilization [11]. However, long-term plastic-shed vegetable cultivation can alter soil nitrogen transformation processes and increase environmental pressure [12]. Maintaining soil health in greenhouse production systems therefore requires active management of soil biological, chemical, and physical conditions [13]. In facility agriculture, these problems are commonly reflected in soil compaction, secondary salinization, nutrient imbalance, and the accumulation of crop residues and pathogens, which can reduce crop yield and quality if no effective soil-improvement measures are adopted.
In response to the escalating issues of soil degradation and pest infestation within these facilities, a variety of remediation and tillage-management strategies have been explored. Biological and microbial approaches have been investigated for sustainable farmland remediation and crop-biomass improvement [14]. Reductive soil disinfestation with biochar amendment has also been shown to modify microbial community composition in plastic-greenhouse vegetable soils [15]. From the engineering perspective, soil-disinfection machinery and its soil-contacting components have been optimized using strain sensing and discrete-element simulation [16]. In addition, improvement of the deeper plow layer can enhance soil characteristics and crop performance [17], while conservation-tillage adoption, disc-tool soil disturbance, and soil-adhesion/tillage-force reduction studies indicate that tool geometry, soil disturbance, and soil–tool interaction forces are important factors in tillage design [18,19,20]. These studies suggest that an effective tillage tool for facility agriculture should not only improve soil inversion but also account for spatial constraints, soil disturbance, and operating resistance.
However, a significant technical barrier prevents the widespread adoption of conventional deep tillage methods within the spatially constrained infrastructure of facility agriculture. The primary obstacle lies in the operational mechanics of standard moldboard plows, which are the traditional implements for achieving deep soil inversion and burial of surface residues. However, conventional moldboard plows turn the soil sideways, forming furrows that inevitably impact the supporting columns and walls of greenhouses. This space limitation makes conventional deep tillage impractical in facility agriculture systems. The formation of an open furrow requires substantial lateral working width, which is incompatible with the narrow interior walkways and the close proximity of structural pillars found in most plastic tunnels and solar greenhouses. Consequently, farmers are often forced to rely on shallow rotary tillage, which, while spatially compatible, fails to break the deep plow pan and address the underlying issues of soil degradation, thereby perpetuating a cycle of declining soil health and increased reliance on chemical inputs.
To overcome the spatial constraints that make conventional plowing infeasible in protected structures, a compact tillage machine capable of deep soil inversion and limited lateral soil displacement is needed. Although previous studies have improved greenhouse environmental control, crop management, soil remediation, and soil–tool interaction analysis, fewer studies have focused on a plow surface that can invert soil deeply while keeping the disturbed soil within the original furrow. The development of such a machine is significant because it can provide a mechanical solution for greenhouse soil remediation, reduce interference with columns and walls, and support deep tillage in narrow working spaces where conventional moldboard plows cannot operate. Scientifically, it also provides a basis for studying constrained soil-inversion trajectories and soil–tool interaction under facility-agriculture conditions. Therefore, the objective of this study was to develop an in situ soil-turning plow capable of deep soil inversion while minimizing lateral soil displacement. The conventional moldboard-plow surface was used only as a reverse-engineering reference; the final in situ plow surface was reconstructed by redefining the soil-turning trajectory, guide curve, openness, lifting angle, plow-body width, installation angle, and cutting angle. The following sections describe the surface reconstruction, DEM parameter calibration, response-surface optimization, and physical validation of the proposed in situ plow.
2. Materials and Methods
2.1. Plow-Body Design
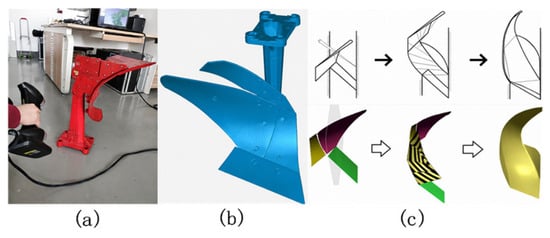
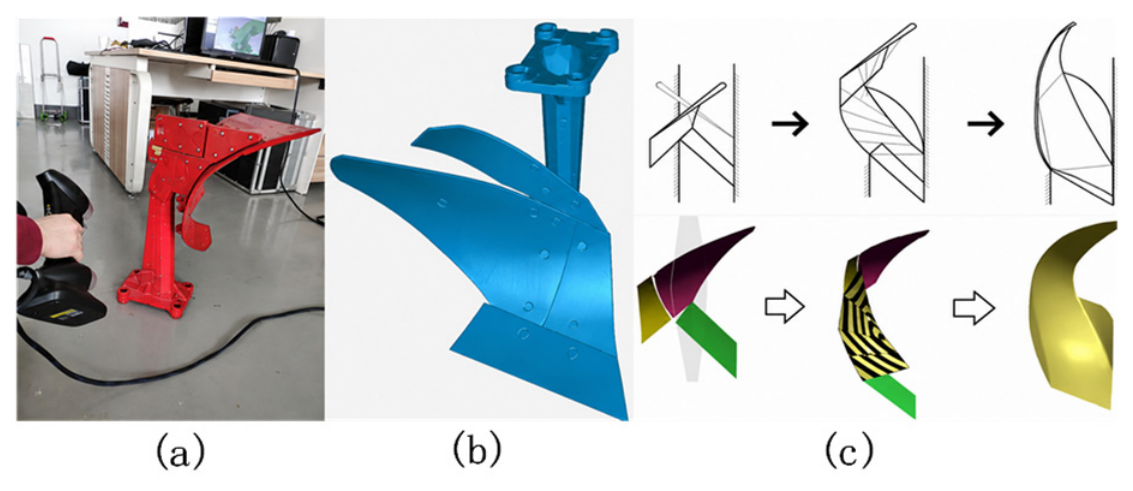
The plow-body surface is the key component determining soil cutting, lifting, turning, and final backfilling into the furrow. Previous studies have shown that geometric characterization of moldboard plows can be performed through image-based or surface-fitting approaches [21]. In this study, the design was problem-oriented: based on the theoretical movement path of soil layers along a plow moldboard [22], the target soil trajectory was constrained so that the soil block was lifted, rotated, and guided back toward its original furrow instead of being discharged laterally as in a conventional moldboard plow. The reverse-engineering and surface-reconstruction process is shown in Figure 1. A non-contact handheld laser 3D scanner (GAMSCAN-H, HEXAGON, Stockholm, Sweden) with an accuracy of 0.03 mm was used to scan an existing BT-25 plow body provided by our laboratory and obtain point-cloud data. Geomagic Wrap 2016 and Geomagic Design X 2016 (3D Systems, Rock Hill, SC, USA) were used to clean, align, mirror, and reconstruct the surface data. The mirrored surface was not directly adopted as the final structure; rather, it was used as an inverse reference surface for reconstructing an in situ soil-turning surface based on the desired soil trajectory and adjustable geometric parameters.
Figure 1.
Reverse-engineering and surface-reconstruction process: (a) point-cloud acquisition from the reference moldboard plow; (b) reconstructed reference surface; (c) geometric transformation and surface fitting for the in situ soil-turning plow. The different colors are used only for visual distinction and do not indicate different materials, parameters, or specific meanings.
The surface-fitting tool was used to fit the processed point-cloud group into a continuous plow-wall surface, and smoothing was applied to achieve curvature continuity. The fitted and mirrored surface was used only as an inverse reference surface. Its function was to provide a geometrical basis for the symmetrical variation in the conventional plow wall, not to serve as the final in situ plow surface.
The transformation logic was based on the TRIZ analysis of the conventional moldboard-plow operation. The lateral displacement of the furrow slice was identified as a harmful effect caused mainly by the lateral pushing of the plow chest and the overturning action of the plow wing. According to the TRIZ standard solution of introducing an improved or modified substance to eliminate a harmful interaction, the conventional plow wall was symmetrically varied to reverse the lateral soil-discharge tendency. Therefore, the mirrored surface was used only as a reference for this modified plow-wall direction.
After the inverse reference surface was obtained, the final in situ plow surface was reconstructed according to the target soil-turning trajectory. The relative position between the plowshare and the modified plow wall was adjusted, and the transition surface between them was fitted using the soil-turning curve-family method. The guide curve, openness, lifting angle, plow-wing curvature, and terminal soil-discharge direction were then constrained so that the disturbed soil was guided toward the original furrow. Thus, the geometric transformation was not a simple mirror copy of a conventional plow; it was a TRIZ-based symmetrical variation followed by constrained trajectory design and surface reconstruction.
The idealized design trajectory was approximately 0°–90°–180°. However, this trajectory represents the intended guide path and functional design objective rather than direct evidence that the soil block remains continuously attached to the plow surface until exactly 180°. Under actual working conditions, gravity, soil fragmentation, cohesion, and soil–tool interaction may cause the soil block to detach or fall back after being lifted and rotated to approximately 90°. Therefore, the design objective was to guide the disturbed soil toward the original furrow and reduce lateral displacement, and the final effect was evaluated by the in situ furrow soil retention rate.
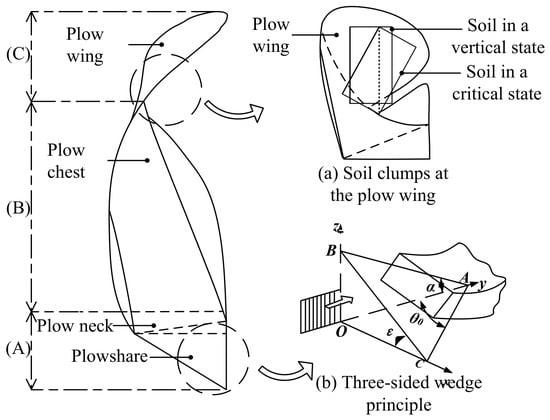
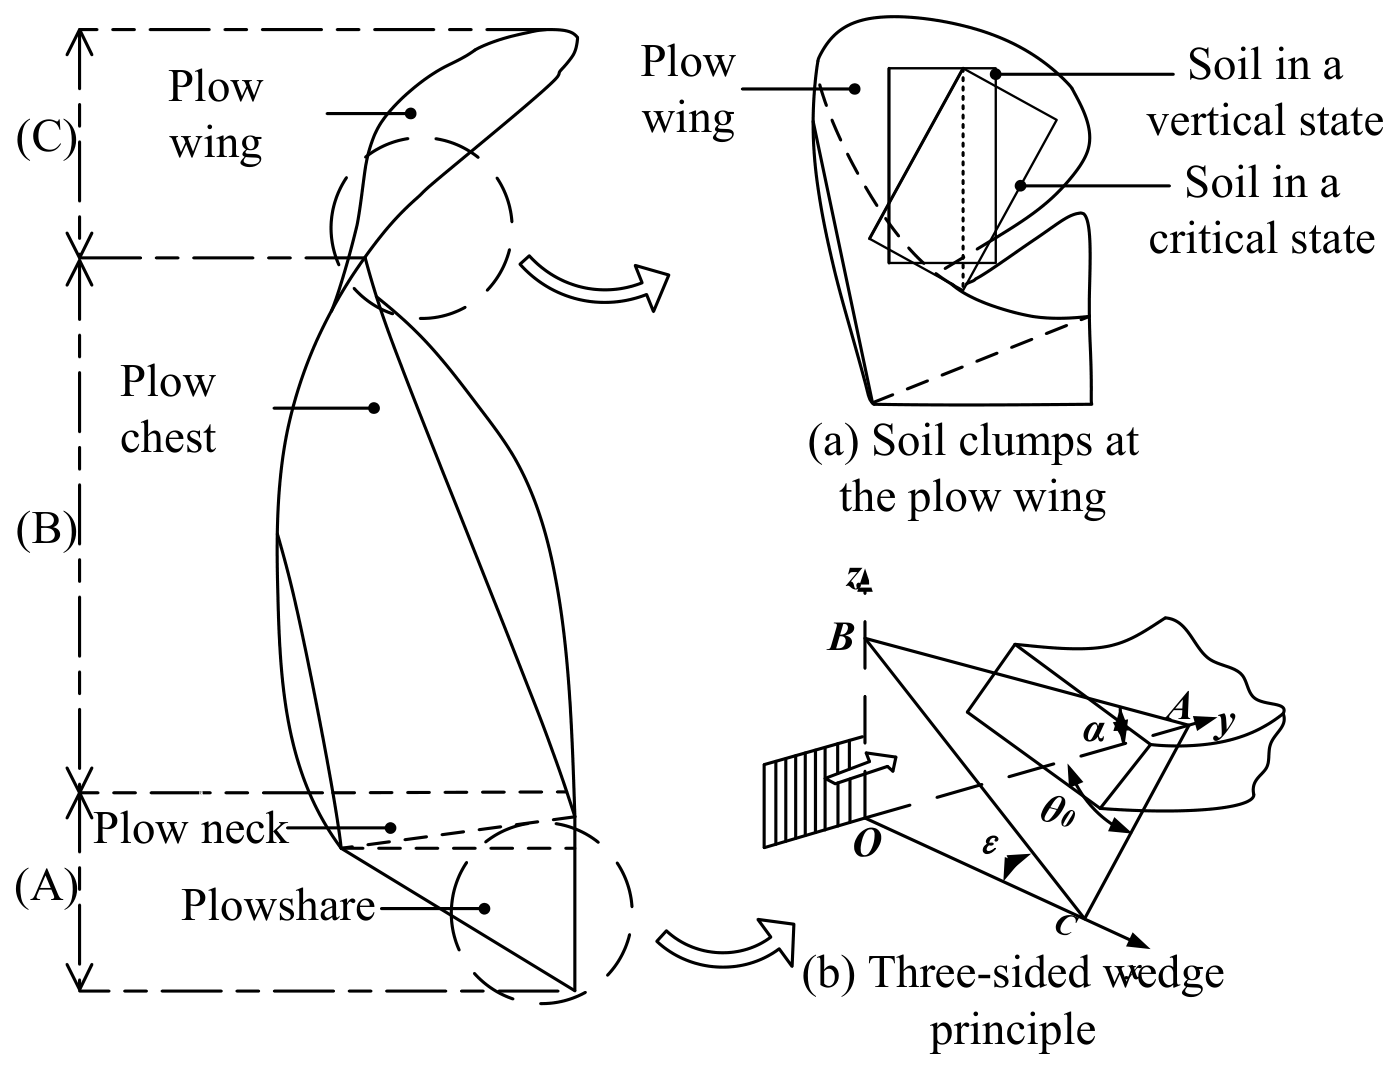
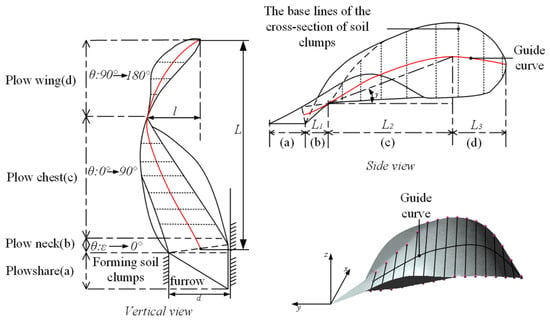
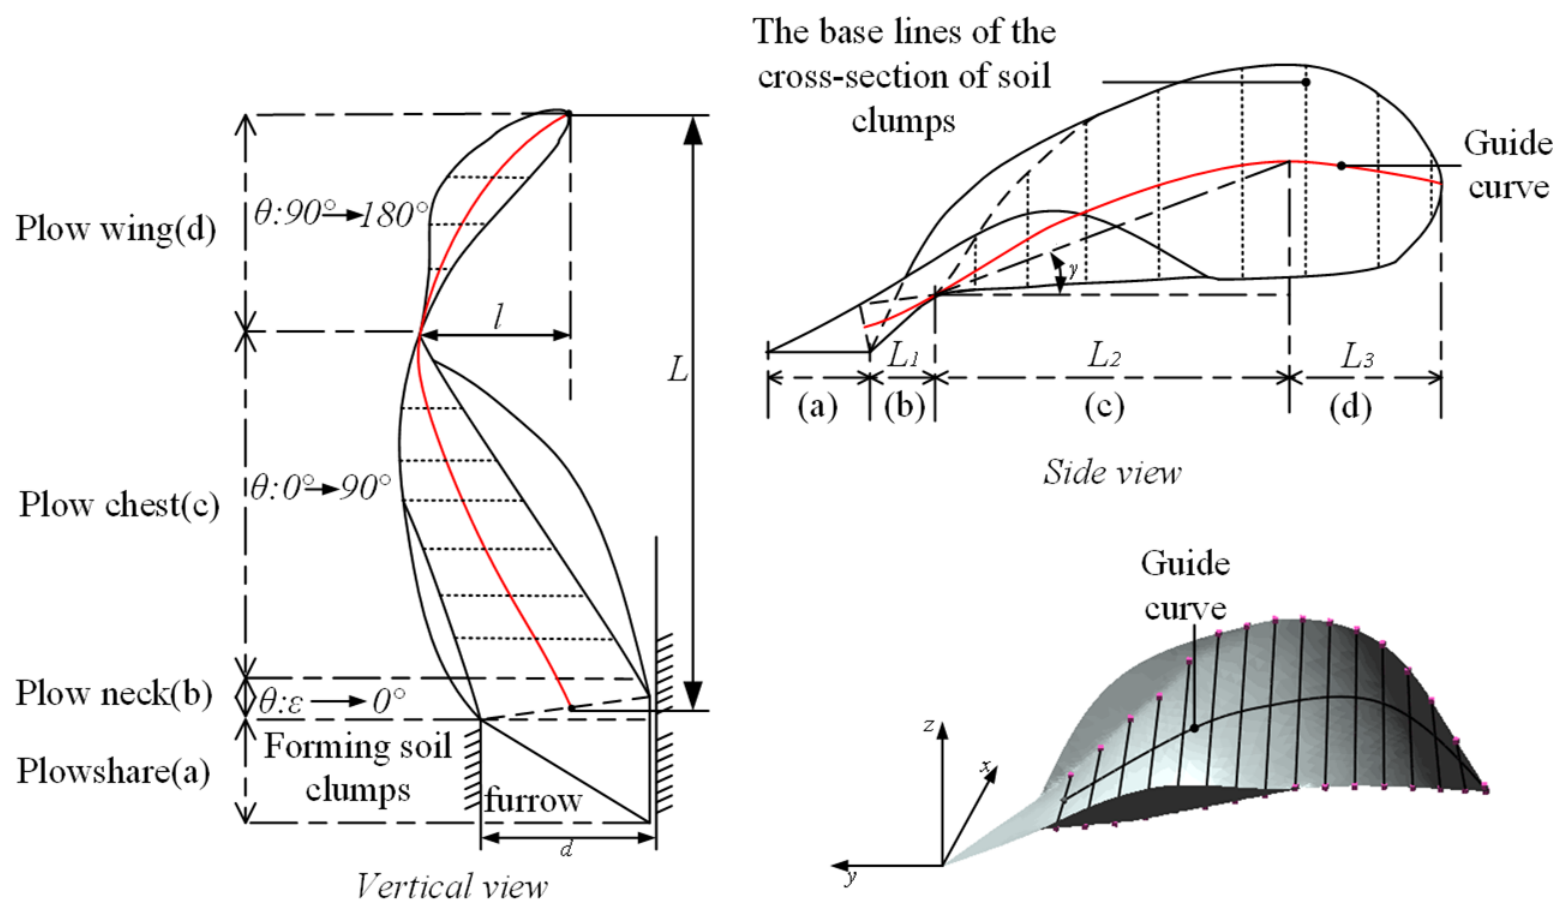
After the inverse reference surface was obtained, the next step was to define the functional regions and adjustable parameters of the in situ plow body. This definition is necessary because the reference surface itself cannot fully determine the final soil-turning performance. The reconstructed plow body was therefore divided into the plowshare, plow chest, and plow wing, as shown in Figure 2, so that each region could be related to a specific stage of soil cutting, rotation, and backfilling.
Figure 2.
Principle of the in situ soil-turning plow: (A) plow neck and plowshare region for soil cutting and initial lifting; (B) plow chest region for soil-block rotation; (C) plow wing region for final guidance and backfilling toward the original furrow; (a) soil clumps at the plow wing; (b) three-sided wedge principle.
The plow body consists of the plowshare, plow chest, and plow wing, which correspond to soil cutting and lifting, soil-block rotation, and final guidance toward the original furrow, respectively. The plowshare cuts and lifts the soil block. The plow chest then guides the soil block to rotate to approximately 90°, which is the main soil-turning stage. In an idealized geometric trajectory, the soil block is expected to continue rotating toward the 180° position. However, in actual tillage, the soil block may not remain fully attached to the plow surface until 180° because gravity, soil fragmentation, cohesion, and soil–tool interaction can cause partial detachment or falling back after the soil block reaches approximately 90°. Therefore, the plow wing is designed mainly to adjust the subsequent soil movement and discharge direction toward the original furrow, so that the disturbed soil remains within or falls back into the in situ furrow region rather than being thrown outward.
The total plow-body length was divided into three functional sections along the forward direction: L1 for the plow neck, L2 for the plow chest, and L3 for the plow wing. According to the reconstructed three-dimensional reference surface, the initial total length was set to 584 mm. The plow neck mainly cuts and starts lifting the soil block; therefore, L1 was set to 90 mm, accounting for 15.41% of the total length. The plow chest must guide the soil block through the largest part of its rotation, so L2 was set to 300 mm, accounting for 51.37% of the total length. The plow wing provides the final guiding section for the soil after the main rotation stage. Because the soil block may not completely fit the plow surface and reach the ideal 180° position under the influence of gravity and soil fragmentation, L3 was designed to guide the soil discharge direction toward the original furrow rather than to guarantee a fully attached 180° turnover. Therefore, L3 was set to 194 mm, accounting for 33.22% of the total length. To evaluate the influence of overall length without changing the functional distribution of the three regions, the total length L was allowed to vary within ±10% of 584 mm, namely 525.6–642.4 mm, while the proportions of L1, L2, and L3 remained unchanged.
Plow-body plowing width d: The plowing width was determined according to the target tillage depth and the requirement for stable soil–tool interaction. Because tillage depth detection and control are important for maintaining consistent tillage quality [23], a design depth of 200 mm was selected as the reference working depth for the in situ soil-turning operation. At this depth, the interaction between the soil and the plow body can be effectively observed in both simulation and physical tests. Research on the relationship between plowing width and plowing depth shows that the ratio of plowing width to plowing depth is 1.14–1.56. Therefore, the plowing width of the plow body was defined as 228–312 mm.
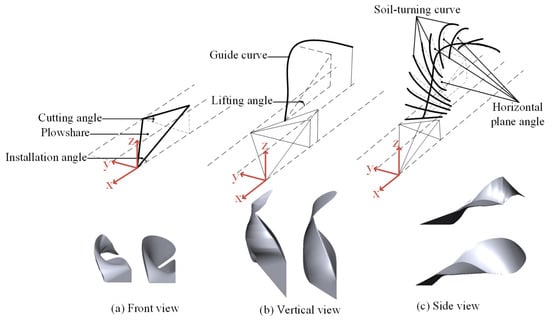
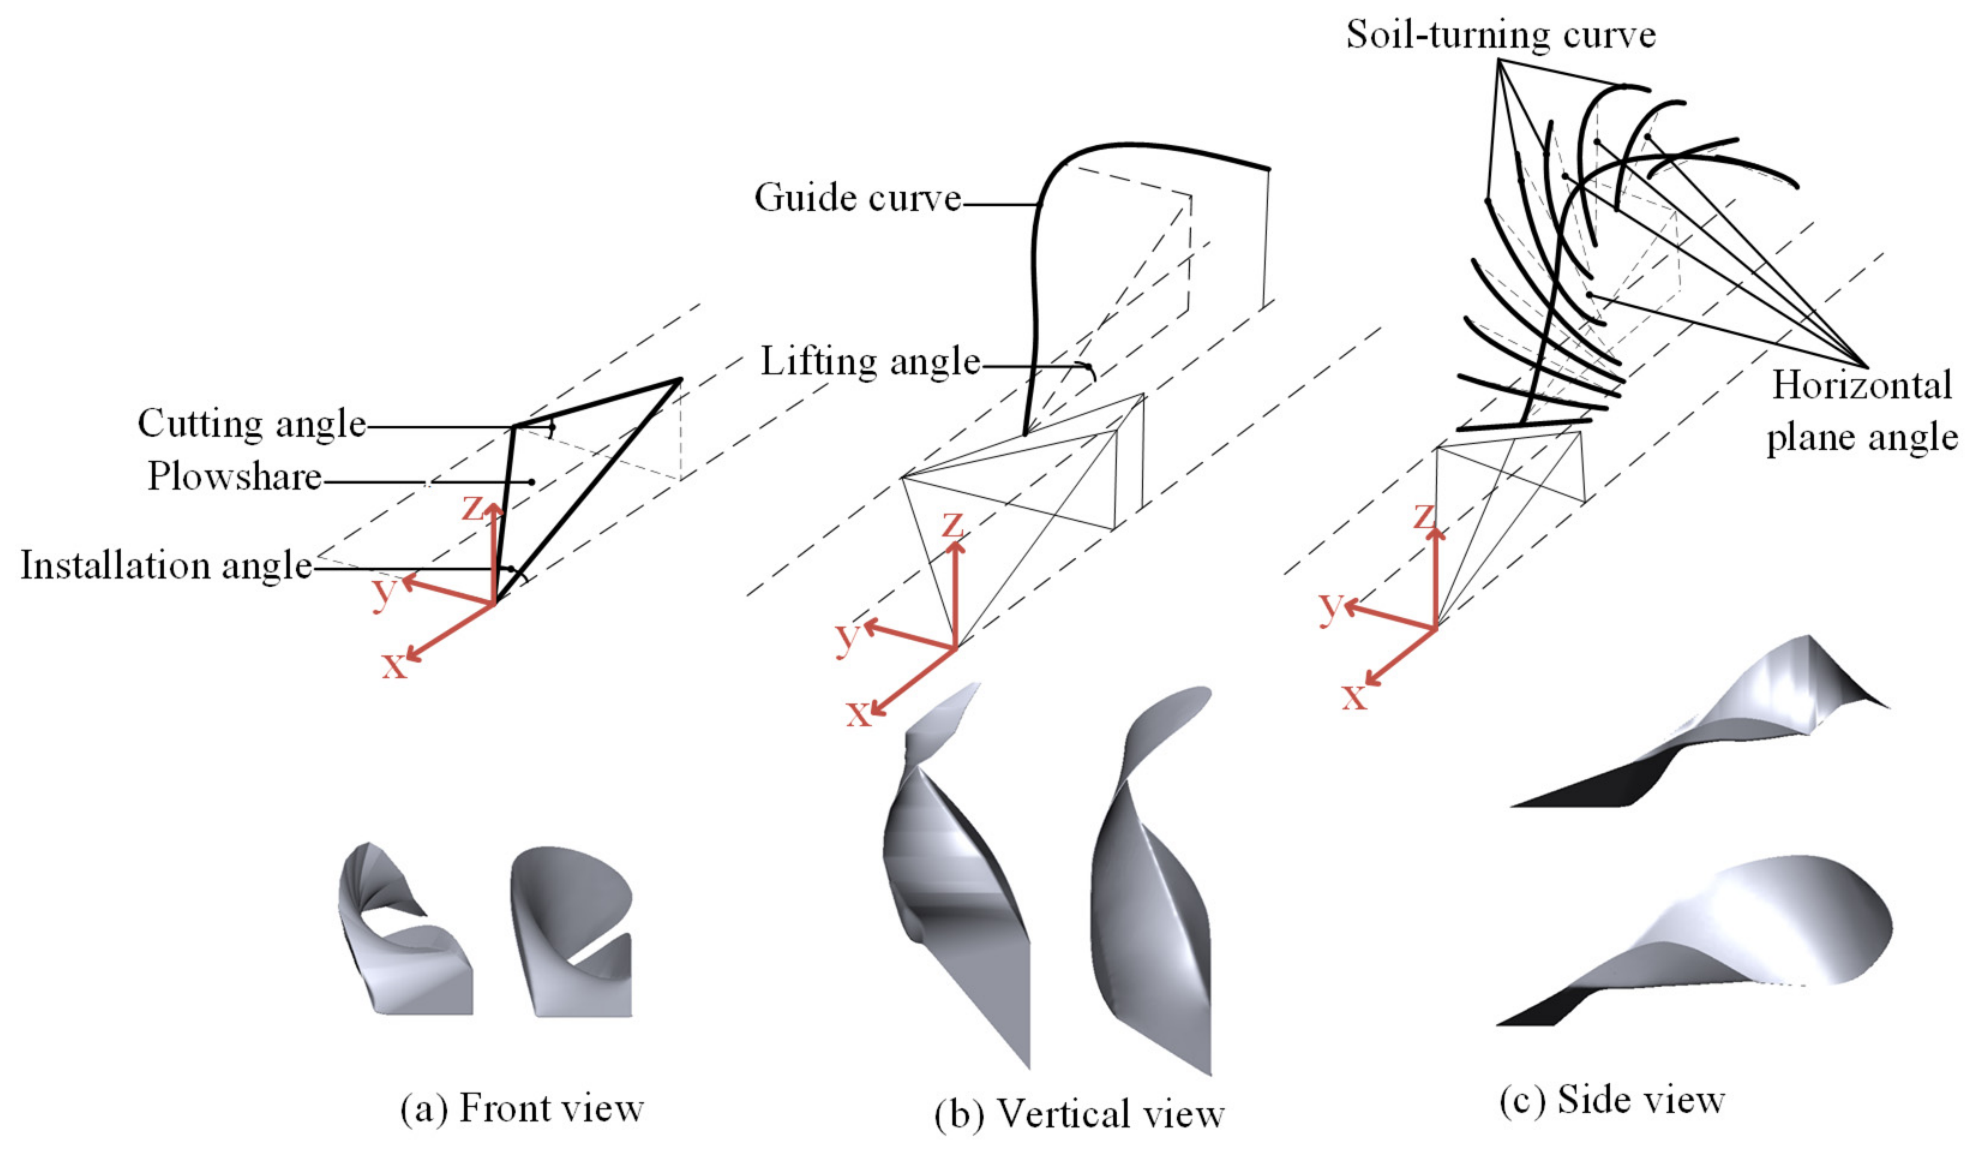
Plowshare angle: As shown in Figure 2, the plowshare operates according to the three-sided wedge principle. The values of the plow-body installation angle θ0 and the soil-cutting angle ε were referenced from the Agricultural Machinery Design Manual, which specifies θ0 = 40–45° and ε = 20–30° for soil-crushing plow bodies, and θ0 = 35–40° and ε = 15–25° for soil-turning plow bodies.
In this study, as shown in Figure 3, the proposed plow combines soil-turning and soil-shredding functions. Therefore, the design range was selected to cover the overlapping and adjacent ranges of the two plow types. The plow-body installation angle θ0 was set to 35–45°. The soil-cutting angle ε was set to 25–30° because this range allows the cutting edge to enter the soil smoothly while maintaining sufficient lifting and cutting ability. A smaller cutting angle may weaken soil lifting and turning, whereas a larger angle may increase cutting resistance, soil adhesion, and instability of soil flow on the plow surface.
Figure 3.
Geometric design of the in situ soil-turning plow body: (a) plowshare; (b) plow neck; (c) plow chest; (d) plow wing. The angular ranges shown in the figure represent the idealized soil-turning trajectory of different functional regions and do not indicate that the soil block continuously rotates through these exact angles under actual working conditions.
In the side view, the guide curve determines the lifting and turning path of the furrow slice. The highest point of the guide curve corresponds to the approximate 90° turning position of the soil block. The angle between the line connecting this highest point and the 0° bottom-edge reference point of the furrow slice and the horizontal plane is defined as the guide-curve lifting angle γ. According to the soil-turning curve-family method, the lifting angle can be expressed as:
where γ is the guide-curve lifting angle (°), hγ is the vertical lifting height from the 0° bottom-edge reference line of the furrow slice to the highest point of the guide curve (mm), and L2 is the longitudinal length of the plow chest (mm). In this study, hγ was determined according to the plowing width d, the approximate 90° turning position of the soil block, and the smooth-transition requirement of the guide curve. Based on the design plowing width and the plow-chest length, the guide-curve lifting angle was determined as 19.52–29.06°.
This range was used as the initial geometric design range of the guide curve. If the lifting angle is too small, the soil block moves along a flatter and longer guiding path, which increases the contact distance and contact time between the soil and the plow chest and may increase frictional resistance. If the lifting angle is too large, the soil block must be lifted more sharply, increasing the vertical lifting requirement and the energy needed to overcome gravity. Therefore, the selected lifting-angle range represents a compromise between soil lifting, turning guidance, contact friction, and energy consumption. In this study, the guide-curve lifting angle was included in the Plackett–Burman screening test as a design factor. However, draft force was not used as the response variable for this factor; therefore, the quantitative relationship between lifting angle and draft force will be further investigated in future work.
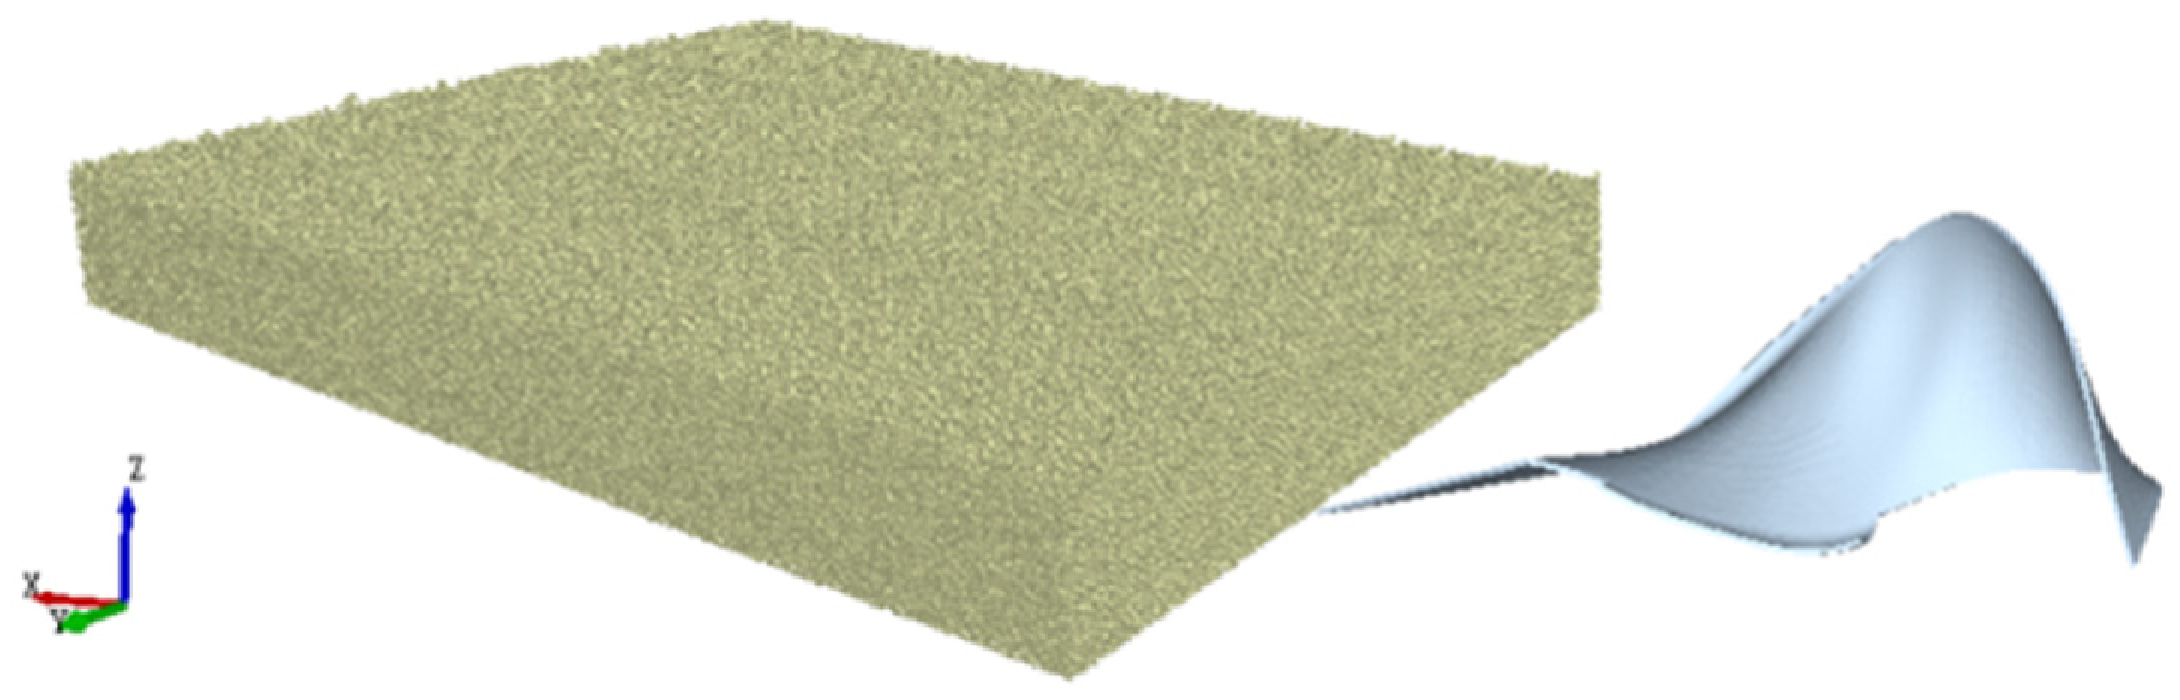
The plow-body modeling procedure included drawing the plowshare, defining the guide curve, generating the turnover-curve generatrices, and fitting the final surface. The design process ensured that the surface transition from the plowshare to the plow wing was continuous and that the soil trajectory remained constrained toward the in situ furrow. The effect of the inverse reference surface and forward-designed plow surface is shown in Figure 4.
Figure 4.
Forward-designed plow surface and comparison with the inverse reference surface. The coordinate system is defined as follows: the X-axis is the forward direction of plow motion, the Y-axis is the lateral direction, and the Z-axis is the vertical direction.
2.2. Calibration of Soil Parameters
The Discrete Element Method (DEM) is an effective numerical method for analyzing the kinetic behavior of granular materials [24,25,26]. Altair EDEM 2021 software (Altair Engineering Inc., Troy, MI, USA) has been widely used in agricultural machinery simulations involving soil loosening, residual-film separation, feeding uniformity, straw motion, straw grinding, fertilizer spreading, and hole-forming processes [27,28,29,30,31,32,33,34,35]. In the present work, DEM was used as a comparative design and optimization tool rather than as a complete substitute for physical validation.
Facility-agriculture soil water conditions are closely related to irrigation management, soil physical properties, crop growth, and root development in greenhouse systems [36]. Soil moisture also strongly affects tractive performance and soil–tool interaction behavior under agricultural operating conditions [37]. Therefore, soil water status was considered when selecting the DEM contact model and calibrating soil parameters. The Hertz–Mindlin with JKR contact model was selected because it can represent cohesive interactions between moist soil particles and has been used in DEM studies of wet paddy soil, stalk material, and furrow-opener–soil interaction [38,39]. In addition, irrigation-related water conditions have also been shown to affect crop physiological parameters, root development, yield, and quality [40]. The test soil was loam collected from a vegetable plastic greenhouse in Zibo City, Shandong Province, China (117.99° E, 36.79° N). The site was converted from wheat-corn rotation land to greenhouse vegetable production in 2018. The soil tests were conducted according to the Specification of Soil Test (SL 237-1999) [41]. Because the angle of repose is an important macroscopic indicator for soil contact-parameter calibration, it was also considered in the subsequent DEM parameter calibration [42].
2.2.1. Soil Density Measurement
Soil density is the mass per unit volume of soil and is an important indicator of soil physical properties. The ring-knife method was used. A 100 cm3 ring knife with a mass of 98.29 g and a YP6002B high-precision balance (Shanghai Lichen Scientific Instrument Co., Ltd., Shanghai, China; readability 0.01 g) were used to measure wet soil mass. Soil density was calculated using Equation (2).
where ρ is the soil density, g/cm3; m1 is the mass of the ring knife with wet soil, g; m2 is the mass of the ring knife, g; and V is the volume of the ring knife, cm3.
Soil samples were collected from the test plot, and the wet mass was measured after zero calibration of the balance. Parallel determinations were conducted, and the difference between measurements did not exceed 0.03 g/cm3. The average soil density was 1.5873 g/cm3.
2.2.2. Determination of Soil Moisture Content
Greenhouse water conditions and irrigation-related soil moisture changes are commonly evaluated in studies of film mulching, insufficient drip irrigation, and evapotranspiration [43,44]. In the present study, soil moisture content was measured because it directly affects soil cohesion, adhesion, and the calibration of moist-soil DEM contact parameters. The oven-drying method was used with a constant-temperature drying oven (LC-202-00, Shanghai Lichen Scientific Instrument Co., Ltd., Shanghai, China; used in 2024). Soil moisture content was calculated using Equation (3).
where ω is the soil moisture content, %; Wwet is the mass of wet soil, g; and Wdry is the mass of dry soil, g.
Two parallel soil samples were collected from the test site and dried at 105 ± 2 °C until constant mass was reached. The drying duration was not less than 8 h. The average value was used when the parallel difference did not exceed 2%. The measured soil moisture content of the tillage layer was 23.21%.
2.2.3. Particle Diameter Distribution Measurement
The particle-size distribution reflects the composition and mechanical behavior of soil particles. The sieve method was used with standard soil sieves (30 cm diameter, Shaoxing Shangyu Caoe Street Zhekun Instrument Business Department, Shaoxing, China; used in 2024) with apertures of 5, 2, 1, 0.5, and 0.25 mm. A 500 g soil sample was placed on the top sieve, and a vibrating sieve machine (Model ST-A, Beijing Xuxin Shengke, Beijing, China; used in 2024) was operated for at least 15 min. After sieving, the soil retained on each sieve was collected and weighed.
The retained soil mass was measured using a YP6002B high-precision electronic balance (Shanghai Lichen Scientific Instrument Co., Ltd., Shanghai, China) with a readability of 0.01 g. In this study, readability represents the minimum display resolution of the weighing equipment and was used to describe the measurement sensitivity of the balance. For the 500 g soil sample, the mass-percentage uncertainty caused by the balance resolution was approximately 0.002% (0.01/500 × 100%), which was lower than 0.01%. Therefore, the weighing resolution had a negligible influence on the particle-size percentage values reported in Table 1.
Table 1.
Soil particle size distribution.
The mass percentage of each particle-size group was calculated relative to the total sample mass. The corrected test results are shown in Table 1. In the EDEM model, the measured particle-size distribution in Table 1 was used as the basis for particle generation. To reduce the particle number and computational cost in the full-scale soil-bin simulation, particles smaller than 1 mm were represented by 1 mm mesoscopic particles. This treatment was a computational simplification for macroscopic soil–tool interaction analysis rather than an exact reproduction of each physical soil particle. Because particle-size scaling may influence particle-scale responses, the same simplification was applied consistently in all comparative simulations and was evaluated through angle-of-repose calibration and physical validation of the optimized plow.
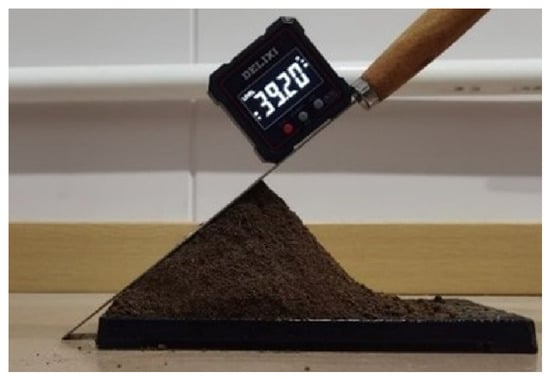
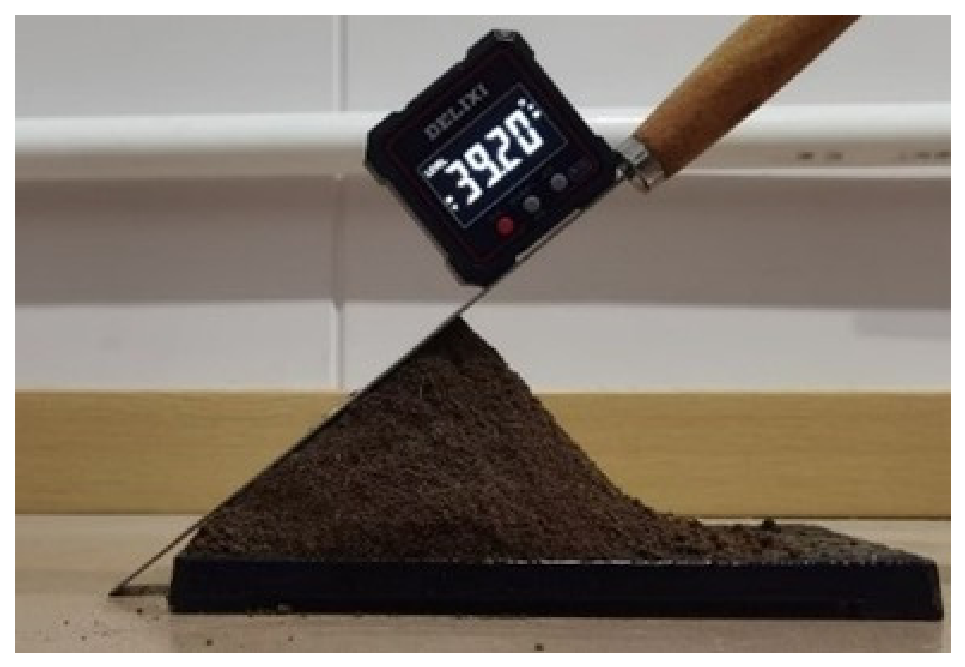
The angle of repose is closely related to soil moisture, dynamic friction coefficient, static friction coefficient, and particle-size distribution [45]. An angle-of-repose test bench was built using a funnel with a mouth diameter of 120 mm, a tube diameter of 18 mm, and a height of 133 mm. The funnel was fixed on an iron frame platform conforming to the General Quality Requirements for Educational Instruments and Equipment Products (JY0001-2003) [46], and the distance between the funnel outlet and the platform was 150 mm, as shown in Figure 5.
Figure 5.
Measurement of the soil angle of repose.
The platform was leveled before testing. Soil was placed in the plugged funnel, and the outlet was then opened to allow the soil to fall naturally onto the platform until the pile no longer expanded. The angle between the pile surface and the horizontal plane was measured using an electronic protractor (DLX-AGB3159C, Shanghai Delixi Group Co., Ltd., Shanghai, China; 2024) with a resolution of 0.1°. The test was repeated three times, and the measured mean angle of repose was 39.20°.
2.2.4. Determination of Soil Particle Contact Parameter Range
The contact parameters between soil particles included the collision restitution coefficient, static friction coefficient, dynamic friction coefficient, and JKR surface energy. Because the measured soil moisture content of the test soil was 23.21%, the JKR surface energy was not directly adopted as a fixed value from the GEMM Database. In this study, the GEMM Database was used only to define a preliminary calibration interval for the contact parameters. The final DEM parameters used in the subsequent plow–soil interaction simulations were obtained by fitting the simulated angle of repose to the measured angle of repose of the moist greenhouse soil, rather than by directly adopting database values. The selected calibration ranges were 4–8 J/m2 for JKR surface energy, 0.15–0.55 for collision restitution coefficient, 0.05–0.10 for dynamic friction coefficient, and 0.32–1.16 for static friction coefficient. X1, X2, X3, and X4 represent surface energy, collision restitution coefficient, dynamic friction coefficient, and static friction coefficient, respectively, as shown in Table 2.
Table 2.
JKR model soil parameter combination.
Experimental and optimization methods have been widely used to improve the reliability of agricultural and engineering studies, including irrigation and fertilization management, agricultural mechanism validation, response-surface optimization, and wet-soil mechanical-response analysis [47,48,49,50]. Therefore, the factor levels in Table 2 were entered into Design-Expert 10.0.7 software (Stat-Ease Inc., Minneapolis, MN, USA) to obtain the simulated angle of repose under each parameter combination, as shown in Table 3.
Table 3.
Experimental design for soil parameter selection in JKR model.
Based on the results in Table 3, a full quadratic regression model was first fitted for the angle of repose. The ANOVA was then used to identify statistically significant terms. Terms with p > 0.05 were excluded from the predictive expression, and the simplified regression equation was obtained as follows:
y = 50.90 + 9.09X1 + 12.44X2 + 5.39X3 − 10.21X22
As shown in Table 4, the full quadratic model was highly significant at the 99% confidence level (p < 0.01), and the lack-of-fit term was not significant (p = 0.0713 > 0.05), indicating that the fitted model was acceptable for calibration. Among the primary terms, X1 (surface energy) and X2 (collision restitution coefficient) had highly significant effects on the angle of repose (p < 0.0001), and X3 (dynamic friction coefficient) had a significant effect (p = 0.0025). X4 (static friction coefficient) and all interaction terms were not significant (p > 0.05). Among the quadratic terms, only X22 was significant (p = 0.0002). Therefore, only the statistically significant terms were retained in the predictive regression equation, and X4 was excluded from Equation (4). This means that the static friction coefficient did not show a significant independent effect on the angle of repose within the tested range, rather than that static friction can be omitted from the DEM contact model.
Table 4.
ANOVA results for soil-parameter calibration in the JKR model. * Significance at the 95% confidence level (p < 0.05); ** significance at the 99% confidence level (p < 0.01).
In EDEM, the Hertz–Mindlin with JKR contact model still requires the static friction coefficient to be specified as a physical input parameter. Therefore, X4 was retained only as a required DEM input parameter, not as a significant term in the predictive equation. Using the Optimization module of Design-Expert 10.0.7 software (Stat-Ease Inc., Minneapolis, MN, USA), the target angle of repose was set to 39.20°. The statistically significant parameters were calibrated as follows: JKR surface energy = 4.194 J/m2, collision restitution coefficient = 0.282, and dynamic friction coefficient = 0.051. The static friction coefficient was set to 0.629 within the tested range as the required DEM input value for the calibrated parameter combination. This value should not be interpreted as a statistically significant optimized factor, because X4 was not significant in the regression analysis.
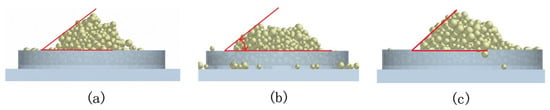
Using the calibrated DEM parameters, three repeated simulations of the angle-of-repose test were conducted with the same geometry, material properties, boundary conditions, and contact parameters, as shown in Figure 6. In each replicate, the random particle-generation process was renewed to evaluate the numerical variability caused by particle initialization. The simulated angles of repose were 38.00°, 40.27°, and 36.55°, respectively, as shown in Table 5. The simulated mean angle of repose was 38.27°, with a standard deviation of 1.88° and a coefficient of variation of 4.90%. Compared with the measured angle of repose of 39.20°, the relative error of the simulated mean was 2.36%.
Figure 6.
Repeated angle-of-repose simulations using the calibrated DEM parameters: (a) Replicate 1, 36.55°; (b) Replicate 2, 38.00°; and (c) Replicate 3, 40.27°.
Table 5.
Repeated angle-of-repose simulations using the calibrated DEM parameters.
This error represents the overall macroscopic error of the calibrated DEM model, including the combined effects of contact-parameter calibration, particle-size representation, and random particle generation. The relatively small coefficient of variation indicates that the calibrated DEM parameter combination was stable under random particle generation and was therefore acceptable for the subsequent comparative optimization of the plow geometry.
2.2.5. DEM Simulation Settings for Plow–Soil Interaction
The working environment of tillage components such as plows is harsh because direct soil contact generates high operational resistance and wear [51]. Therefore, the plow body was modeled as wear-resistant 65Mn steel, with a Poisson’s ratio of 0.3, a density of 7850 kg/m3, and a shear modulus of 7.9 × 10¹⁰ Pa. The soil–plow contact parameters were set as follows: collision restitution coefficient, 0.3; static friction coefficient, 0.5; and dynamic friction coefficient, 0.05.
The key EDEM simulation settings were as follows: the contact model was Hertz–Mindlin with JKR; the soil bin was defined as a rigid-wall boundary; the plow moved along the positive X direction at a constant speed; and gravity was 9.81 m/s2 along the negative Z direction. The calibrated soil-particle contact parameters used in the subsequent simulations were set as follows: JKR surface energy, 4.194 J/m2; coefficient of restitution, 0.282; coefficient of rolling friction, 0.051; and coefficient of static friction, 0.629. The static friction coefficient was included as a required DEM input parameter, although it was not retained as a significant term in the angle-of-repose regression equation. The particle-size distribution was based on Table 1, and particles smaller than 1 mm were represented by 1 mm particles to reduce computational cost.
The simulation used Euler time integration. The Rayleigh time step was 3.9814 × 10⁻⁴ s, and the fixed time step was set to 20% of the Rayleigh time step, namely 7.9627 × 10⁻⁵ s. The total simulation time was 4 s, with approximately 5.02 × 10⁴ required iterations. The target data-save interval was 0.01 s, corresponding to 400 saved data points. The CPU solver was selected, and 24 CPU cores were used for the calculation. The simulator grid cell size was set to 25 mm, corresponding to 8.33 times the minimum particle radius. The Grid Bin control region was fixed before and after tillage to calculate the in situ furrow soil retention rate.
For all comparative simulations, the particle-generation procedure, soil-bin dimensions, boundary settings, solver settings, time-step settings, output interval, and evaluation region were kept unchanged. Therefore, changes in the calculated retention rate were attributed to the tested plow parameters rather than to changes in the numerical setup.
3. Results and Discussion
3.1. Plow-Body Simulation
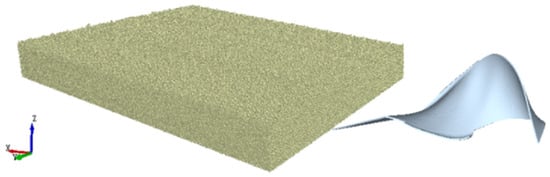
To balance actual geometric scale and computational efficiency, the plow-body model was established at a 1:1 scale. Because particles smaller than 1 mm greatly increase computational cost, soil particles with diameters below 1 mm were represented as 1 mm mesoscopic particles. This simplification was applied consistently to all simulations; therefore, although it may affect the absolute particle-scale response, it does not change the relative comparison among plow-geometry schemes under the same modelling assumptions. Its acceptability was checked through the angle-of-repose calibration, where the simulated and measured angles showed a relative error of 2.36%, and through the physical validation test, where the predicted and measured in situ furrow soil retention rates showed a relative error of 3.13%. The soil bin was 2000 mm long, 1000 mm wide, and 250 mm high. The bottom and side walls were defined as rigid boundaries. The plow moved in the positive X direction, the Y direction represented the lateral direction, and the Z direction represented the vertical direction. Gravity was set to 9.81 m/s2 in the negative Z direction. The Hertz–Mindlin with JKR contact model and the calibrated soil parameters were used. The simulation was solved using the EDEM solver with a time step selected according to the Rayleigh-time-step stability criterion. The model is shown in Figure 7.
Figure 7.
EDEM model of the soil bin and in situ soil-turning plow. The X-axis represents the forward direction, the Y-axis represents the lateral direction, and the Z-axis represents the vertical direction.
3.2. Plow Evaluation Indicators
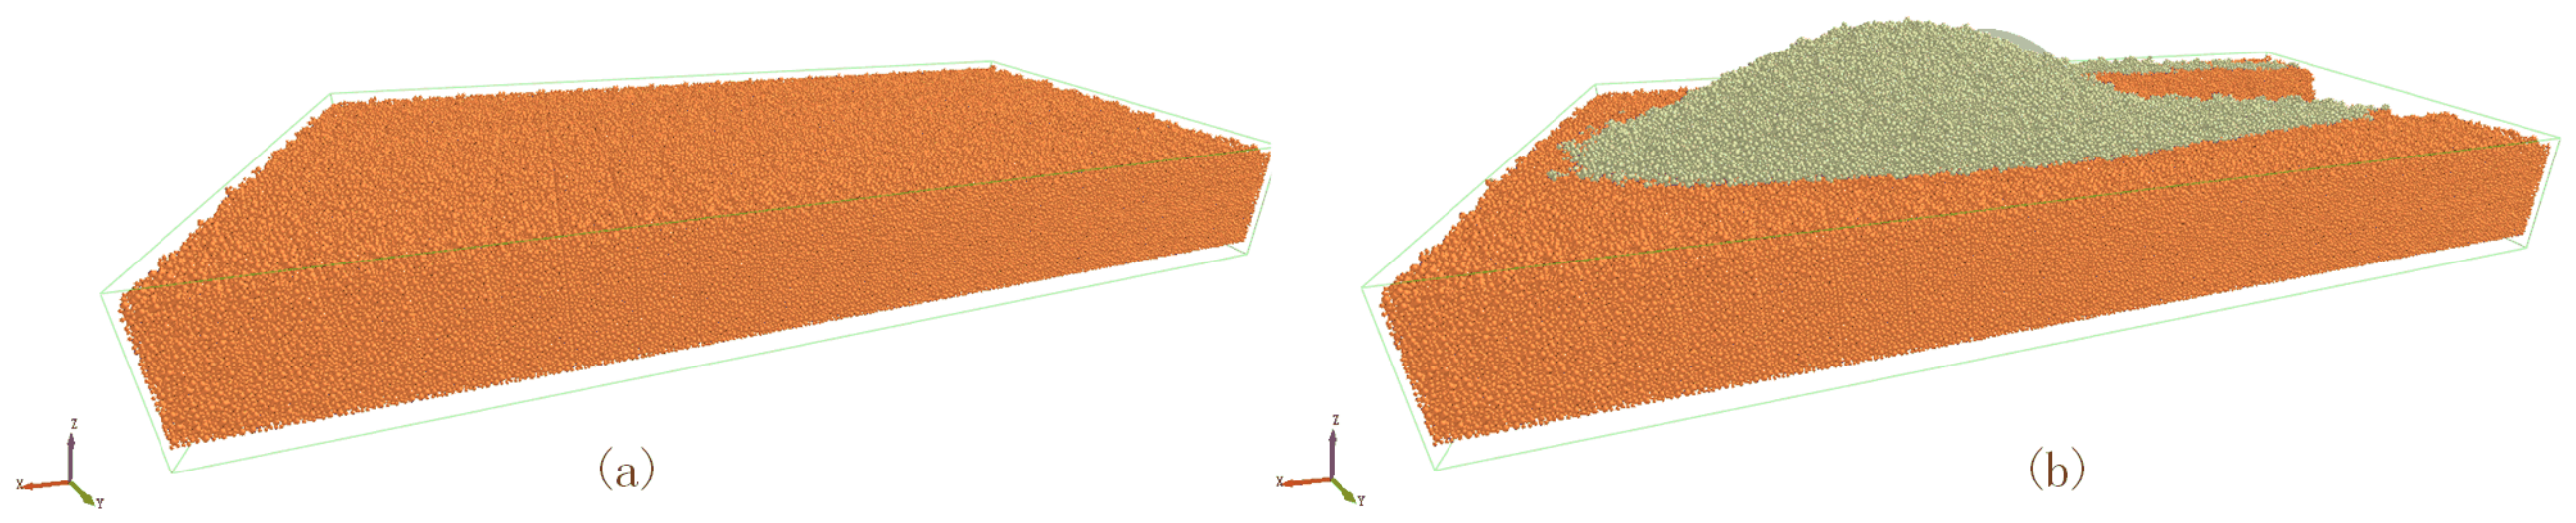
The quantification of plowing effects has been studied for many years [52]. In this study, the in situ furrow soil retention rate was introduced as an evaluation index. The Grid Bin Group module in EDEM was used to calculate the in situ furrow soil retention rate. A fixed rectangular control region was defined according to the original furrow region before tillage. The Grid Bin Group was set to include all soil particles, while geometry, particle–geometry contacts, particle–particle contacts, particle–geometry bonds, and particle–particle bonds were excluded from the query. The center of the control region was set at X = 0 mm, Y = 0 mm, and Z = −145 mm, and its dimensions were 1500 mm × 800 mm × 265 mm in the X, Y, and Z directions, respectively. The number of bins was set to 1 × 1 × 1, and the rotation angles around the X, Y, and Z axes were all 0°. Therefore, the Grid Bin Group was used as a single fixed control volume rather than as a spatially subdivided grid.
Before tillage, the soil-particle volume inside this fixed control region was recorded as Va. After the plow completed the tillage path and the soil particles reached a relatively stable state, the soil-particle volume remaining within or returning to the same fixed region was recorded as Vb. The in situ furrow soil retention rate was then calculated as the ratio of Vb to Va. Because the control region was kept unchanged before and after tillage, this index represents the proportion of disturbed soil retained within or returned to the original furrow region, rather than the instantaneous particle trajectory, soil bulk density, or soil porosity. It is therefore a control-volume index used to compare lateral soil loss and backfilling ability under different plow-geometry parameters. This definition also provides a bridge to the physical test, where soil displaced outside the original furrow was estimated from ridge geometry and then converted to the same retention-rate concept.
It should be noted that the in situ furrow soil retention rate does not assume that all soil particles follow a continuous 180° trajectory along the plow surface. Instead, it evaluates the final macroscopic result of the soil-turning process by measuring the proportion of disturbed soil retained within or returned to the predefined furrow control region. Therefore, this index is suitable for verifying whether the in situ plow reduces lateral soil displacement under actual working conditions, where gravity, soil fragmentation, and soil–tool interaction may cause the soil block to detach or fall back before completing a fully attached 180° motion. The measurement principle of the fixed EDEM Grid Bin Group control region is shown in Figure 8.
Figure 8.
Measurement principle of the in situ furrow soil retention rate using the fixed EDEM Grid Bin Group control region: (a) initial soil-particle volume Va in the predefined control region before tillage; (b) retained soil-particle volume Vb in the same fixed control region after tillage. The Grid Bin Group was set as a single 1500 mm × 800 mm × 265 mm control volume with its center at X = 0 mm, Y = 0 mm, and Z = −145 mm. The different colors are used only to visually distinguish the control region and soil-particle distribution and do not indicate different soil materials, properties, or DEM parameters.
A high in situ furrow soil retention rate indicates that a larger proportion of soil remains within or returns to the original furrow after disturbance, whereas a low value indicates greater outward throwing or lateral loss. The retention rate was calculated as follows:
where F is the in situ furrow soil retention rate, %; Va is the initial soil-particle volume in the predefined furrow control region before tillage, m3; and Vb is the retained soil-particle volume within the same control region after tillage, m3.
F = Vb/Va × 100%
3.3. Screening Key Factors
Parameter calibration and device-optimization studies in agricultural engineering commonly use designed experiments to identify key factors and improve performance [53,54]. In this study, the Plackett–Burman screening test was used as a two-level fractional factorial design to identify the most influential variables affecting the in situ furrow soil retention rate. Eight design or operating factors were examined: plowing depth, plowing width, plow-body installation angle, soil-cutting angle, guide-curve lifting angle, openness, plow-body length, and plowing speed. Three dummy variables were included to estimate background error. The factors and levels are shown in Table 6.
Table 6.
Main parameters of plow body.
The Plackett–Burman design consisted of 12 simulation runs, as shown in Table 7. The response value in each run was calculated from the EDEM Grid Bin control region after the plow completed the tillage path.
Table 7.
Plackett Burman test table.
In Table 7, X1–X8 represent plowing depth, plowing width, plow-body installation angle, soil-cutting angle, guide-curve lifting angle, openness, plow-body length, and plowing speed, respectively. X9–X11 are dummy variables used to estimate the background error of the Plackett–Burman screening design. The values of −1 and +1 for the dummy variables do not represent physical parameters but only the low and high levels required by the statistical design matrix. The response value in each run is the in situ furrow soil retention rate calculated from the fixed EDEM Grid Bin control region after tillage.
According to Table 8, X2 (plowing width), X3 (plow-body installation angle), and X4 (soil-cutting angle) had the largest contributions to the in situ furrow soil retention rate, with contribution rates of 20.31%, 26.58%, and 16.97%, respectively. These values were clearly higher than the maximum contribution of the dummy variables, represented by X10 with a contribution rate of 8.42%. Therefore, X2, X3, and X4 were selected as the main factors for subsequent optimization. Their negative effect values (−2.40, −2.75, and −2.20) indicate that excessively increasing these parameters reduced the retention rate within the tested range.
Table 8.
Effect evaluation of factors in Plackett–Burman experimental design.
3.4. Optimization of the Plow Body
3.4.1. Regression Equation and Significance Analysis
Based on the screening results, plowing width (X1), plow-body installation angle (X2), and soil-cutting angle (X3) were selected for optimization, with the in situ furrow soil retention rate as the response value. The ranges in Table 9 were selected according to the negative effects observed in the Plackett–Burman screening test. Therefore, the upper levels of the original screening ranges were reduced, and the optimization was concentrated around the lower-to-middle ranges where better soil retention was expected. Plowing width was set to 240–280 mm, the plow-body installation angle to 38–42°, and the soil-cutting angle to 23–27°, as shown in Table 9.
Table 9.
Box–Behnken optimization ranges for the main factors.
For the Box–Behnken simulations, the non-significant factors were fixed as follows: plowing depth, 200 mm; guide-curve lifting angle, 26°; openness, 180 mm; plow-body length, 584 mm; and plowing speed, 5.75 km/h. These fixed values were selected according to the design constraints, preliminary simulations, and the allowable working-speed range of 4.5–7.0 km/h. The simulated response values are shown in Table 10.
Table 10.
Box–Behnken test table.
Regression fitting of the in situ furrow soil retention rate was performed using the Box–Behnken results. According to the ANOVA results, the interaction terms X1X3 and X2X3 were not significant (p > 0.05) and were removed from the predictive equation. The simplified empirical model retained the significant primary, interaction, and quadratic terms and was used only within the tested design range, as follows:
Y = 81.90 − 0.38X1 + 0.48X2 − 0.66X3 − 0.25X1X2 − 0.72X12 − 0.53X22 − 0.26X32
As shown in Table 11, the regression model was highly significant at the 99% confidence level (p < 0.01), and the lack-of-fit term was not significant (p = 0.2602 > 0.05), indicating that the model was reliable for predicting the in situ furrow soil retention rate within the design range. The primary terms X1 (plowing width), X2 (plow-body installation angle), and X3 (soil-cutting angle) all had highly significant effects (p < 0.01). Among the interaction terms, only X1X2 was significant (p = 0.0386), whereas X1X3 and X2X3 were removed from the empirical equation. The quadratic terms X12, X22, and X32 were significant, indicating that each factor had a nonlinear influence on the response.
Table 11.
ANOVA results for the Box–Behnken optimization model. * Significance at the 95% confidence level (p < 0.05); ** significance at the 99% confidence level (p < 0.01).
3.4.2. Response-Surface Analysis (RSA)
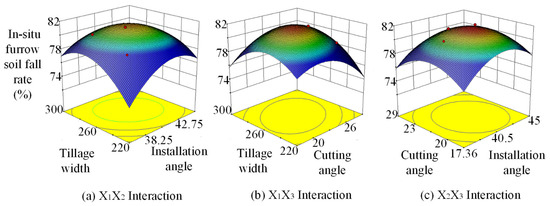
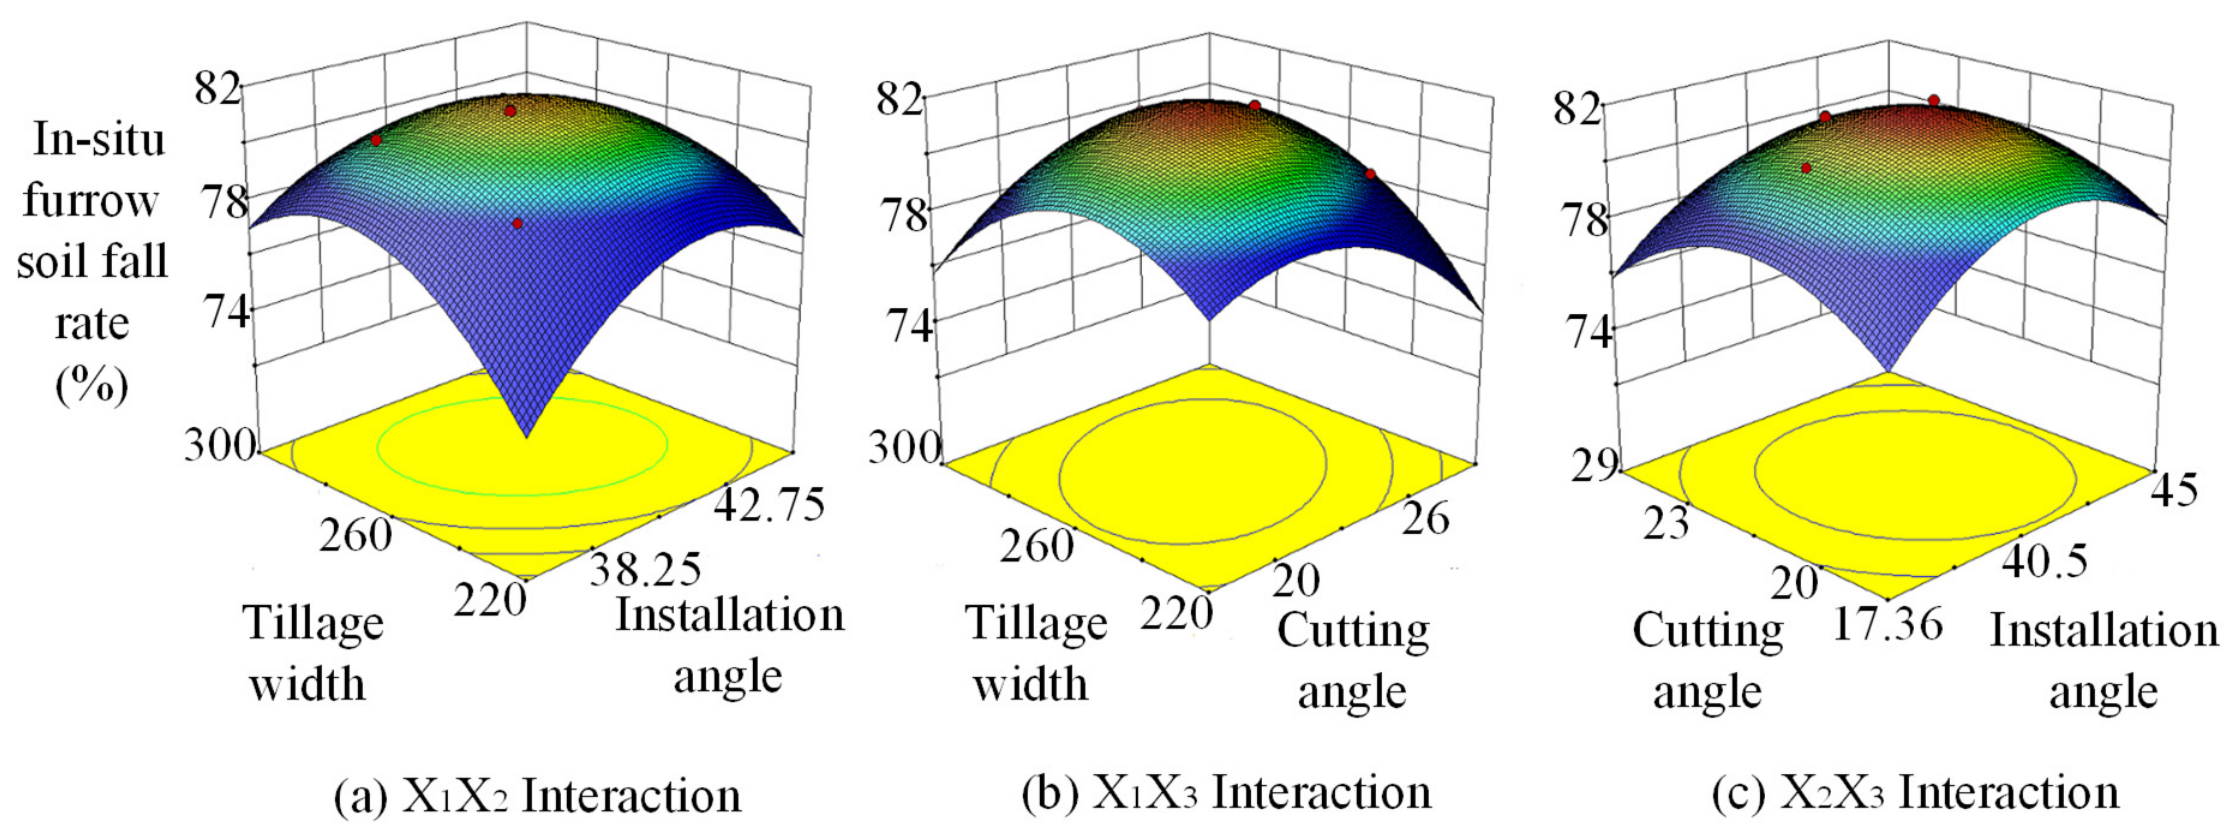
The response-surface and contour plots corresponding to the significant factors are presented in Figure 9 to visually support the interaction analysis and the location of the optimal parameter region.
Figure 9.
Response-surface and contour plots showing the effects of the main factors on the in situ furrow soil retention rate: (a) interaction between plowing width and plow-body installation angle when the soil-cutting angle was fixed at 25°; (b) interaction between plowing width and soil-cutting angle when the plow-body installation angle was fixed at 40°; and (c) interaction between plow-body installation angle and soil-cutting angle when the plowing width was fixed at 260 mm. The color gradient represents the magnitude of the predicted in situ furrow soil retention rate, with warmer colors indicating higher retention rates and cooler colors indicating lower retention rates.
As shown in Figure 9a, when the soil-cutting angle was fixed at 25°, the retention rate first increased and then decreased with increasing plowing width and plow-body installation angle. This occurs because a moderate plowing width increases the amount of soil guided by the plow surface and improves backfilling into the original furrow. However, when the width becomes too large, soil disturbance and lateral extrusion increase, causing part of the soil to move beyond the furrow region. Similarly, a moderate installation angle improves soil lifting and turning, whereas an excessive installation angle increases lateral acceleration and reduces in situ retention.
In Figure 9b, when the plow-body installation angle was fixed at 40°, the retention rate increased with plowing width up to the optimal region but decreased when the soil-cutting angle exceeded the suitable range. A small cutting angle may not provide sufficient cutting and lifting action, while an excessively large cutting angle increases cutting resistance and causes unstable soil flow on the plow surface. Therefore, the optimal value appears within an intermediate range rather than at the boundary.
Figure 9c shows the interaction between plow-body installation angle and soil-cutting angle when the plowing width was fixed at 260 mm. The closed contour indicates an internal maximum. The optimal region occurs when soil lifting, rotation, and backfilling are balanced. Parameters beyond this range may either weaken the turnover ability or increase soil throwing, adhesion, and draft resistance, thereby reducing the retention rate. The response-surface results were consistent with the ANOVA results. Using the Optimization module in Design-Expert 10.0.7 software (Stat-Ease Inc., Minneapolis, MN, USA) with the goal of maximizing the in situ furrow soil retention rate, the optimal parameters were identified as follows: plowing width, 278.392 mm; plow-body installation angle, 40.522°; and soil-cutting angle, 23.211°. The predicted maximum retention rate was 81.166%.
3.5. Physical Test
3.5.1. Test Preparation
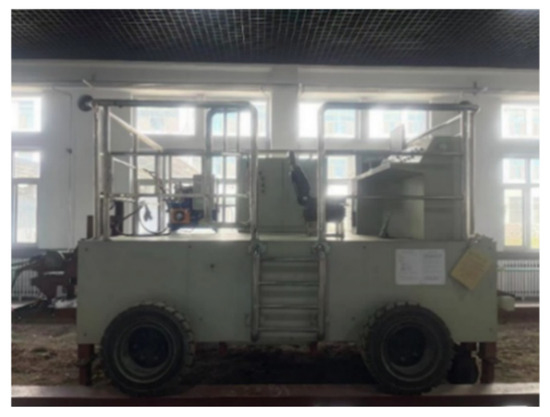
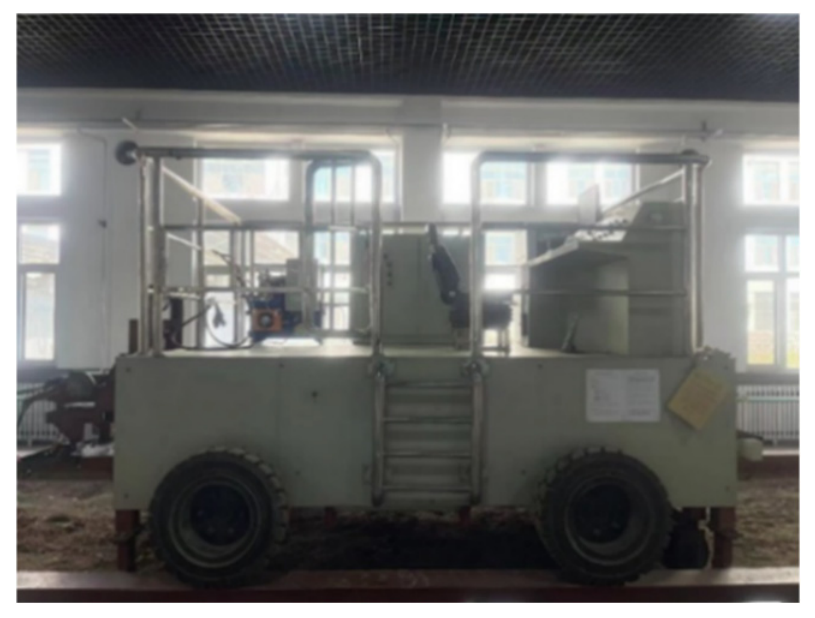
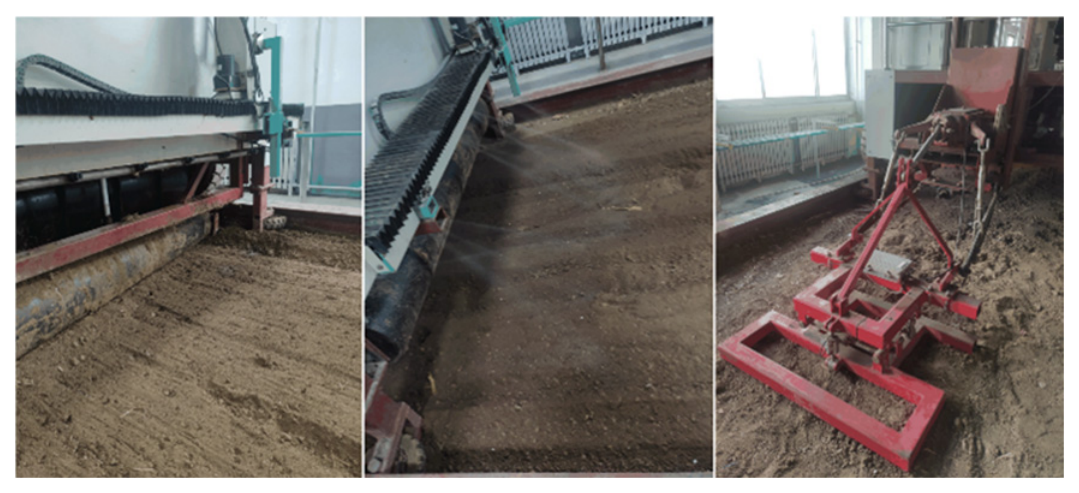
The physical test was conducted in 2024 in the soil tank of the Modern Agricultural Equipment Laboratory of Jiangsu University. The soil tank was 60 m long, 3 m wide, and 0.8 m deep. A TCY-23141248 all-electric four-wheel-drive soil-tank test rig (Harbin Bona Science and Technology Co., Ltd., Harbin, China; used in 2024) was used for the test, as shown in Figure 10.
Figure 10.
Soil-tank test vehicle.
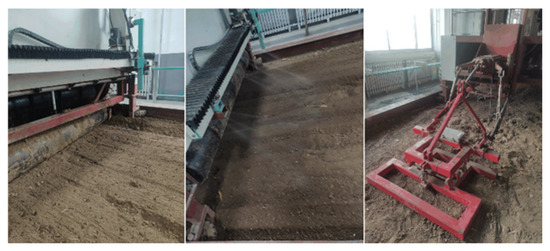
The test rig operates within a speed range of 0–12 km/h. Its main structure includes the frame, power system, suspension control system, tillage components, braking system, and data-monitoring system, as shown in Figure 11.
Figure 11.
Soil preparation before the physical test.
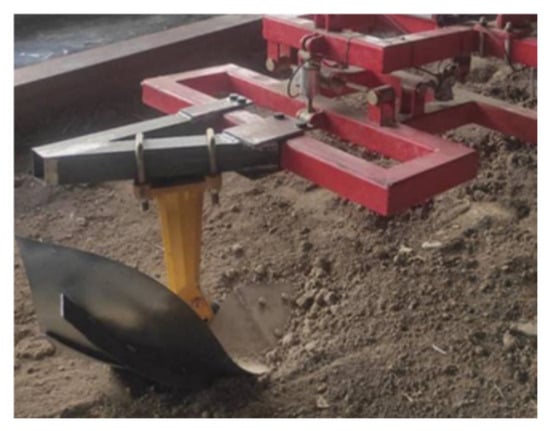
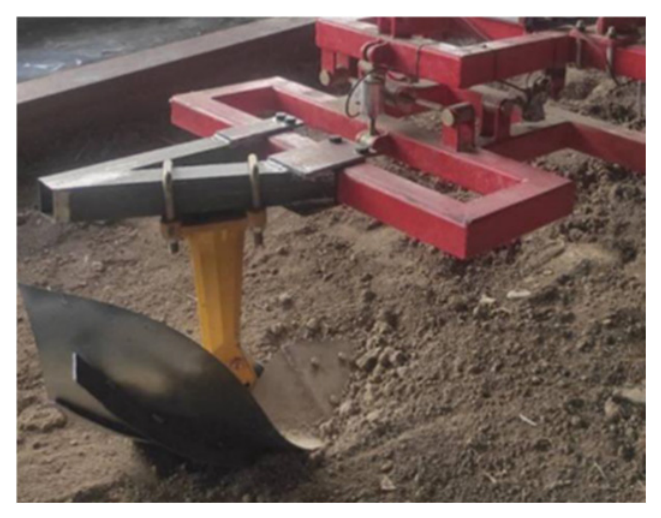
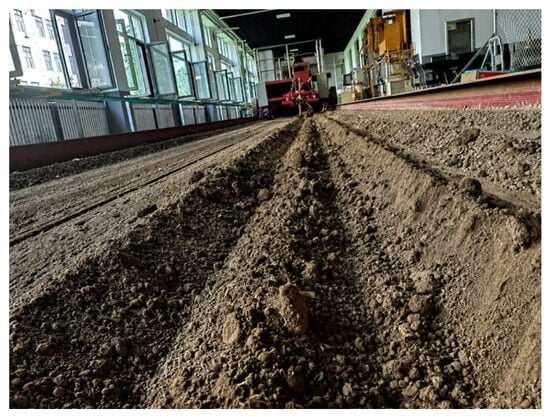
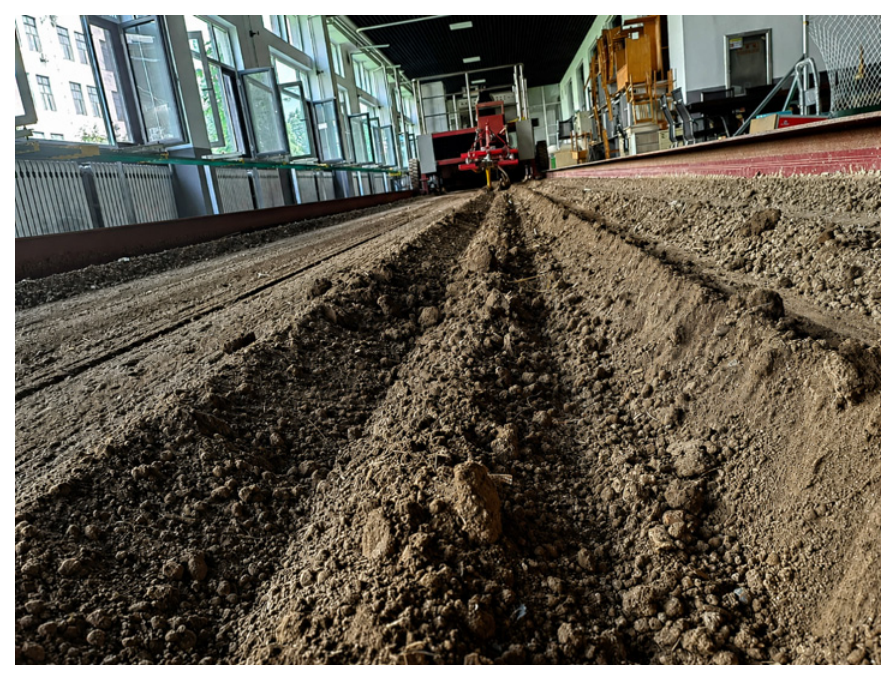
The soil-tank test vehicle drove the optimized plow body through the prepared soil to evaluate the plowing effect, as shown in Figure 12.
Figure 12.
Plowing test with the optimized in situ soil-turning plow.
After plowing, the disturbed soil formed ridges near the original furrow. To maintain consistency with the EDEM control-volume definition, the physical test did not attempt to track individual soil particles. Instead, the volume of soil displaced outside the original furrow was estimated from ridge geometry. The ridge cross-section was approximated as an isosceles triangle. The bottom width and height of the ridge were measured at multiple positions along the test path, and the ridge volume was calculated from the average triangular cross-sectional area multiplied by the evaluated length. For each side ridge, the cross-sectional area was calculated as A = b·h/2, and the ridge volume was calculated as V = A·L. The total displaced ridge volume was obtained as Vr = Vleft + Vright. The retained soil volume was then calculated as the initial furrow volume minus the outward-displaced ridge volume. This method links the simulation index and the physical measurement through soil-volume conservation, although particle-scale trajectories cannot be directly observed in the physical test.
To clarify the physical measurement of the in situ furrow soil retention rate, a schematic diagram of the ridge-volume measurement method is provided in Figure 13.
Figure 13.
Schematic diagram of ridge-volume measurement in the physical test. After tillage, the left and right ridges outside the original furrow were approximated as triangular prisms. The ridge volume was estimated from the bottom width b, height h, and evaluated length L.
3.5.2. Test Methods
The physical test was conducted to verify the macroscopic plowing effect of the optimized in situ soil-turning plow and to compare the measured in situ furrow soil retention rate with the value predicted by the response-surface model. The physical test considered three controllable variables: soil moisture content, working depth, and forward speed. The experimental parameter levels are shown in Table 12. A factorial test with two soil-moisture levels, three working depths, and three forward speeds was reported, giving 18 test groups. Each group was repeated three times, and the mean value of the repeated measurements was used for subsequent analysis.
Table 12.
Test parameter setting.
Before each test, the soil moisture content was adjusted to the target value and the soil surface was leveled. The plow was lowered into the soil using the rear suspension device, and the hydraulic system was adjusted to maintain the target working depth. A pre-test was conducted at a maximum plowing depth of 300 mm and a forward speed of 6 km/h to verify coordination between the soil-bin trolley and the plow. During the formal test, plowing depth was checked every 5 m using a steel ruler, and forward speed was monitored using a stopwatch. The maximum draft force was checked to ensure that it did not exceed the sensor range.
The traction resistance was collected by the sensor acquisition system during tillage. To reduce the influence of transient fluctuations at the beginning and end of the test path, a relatively stable section of the traction-resistance curve was selected as the representative traction-resistance value for each test. After tillage, the ridge geometry outside the original furrow was measured at multiple cross-sections to calculate the physical in situ furrow soil retention rate.
For validation of the retention-rate index, the physical measurement was designed to correspond to the same control-volume concept as the EDEM Grid Bin method. Because individual soil particles could not be tracked directly in the physical test, the soil volume displaced outside the original furrow was estimated from the ridge geometry. The ridge cross-section was approximated as an isosceles triangle. The bottom width and height of the ridge were measured at multiple positions along the test path, and the ridge volume was calculated from the average triangular cross-sectional area multiplied by the measured length. The retained soil volume was calculated as the initial furrow volume minus the outward-displaced ridge volume. The physical in situ furrow soil retention rate was calculated as follows:
where Fp is the physical in situ furrow soil retention rate, %; V0 is the initial furrow volume before tillage, m3; and Vr is the ridge volume displaced outside the original furrow, m3.
Fp = (V0 − Vr)/V0 × 100%
This calculation provides a macroscopic validation method for the EDEM retention-rate index rather than a direct particle-tracking measurement.
For validation of the optimized plow body, the predicted retention rate from the response-surface optimization was compared with the measured retention rate obtained from the physical test. The relative error was calculated as follows:
where E is the relative error, %; Fm is the measured retention rate from the physical test, %; and Fs is the simulated or predicted retention rate from the response-surface model, %.
E = |Fm − Fs|/Fs × 100%
The physical test was conducted using the optimized in situ soil-turning plow body developed in this study. The purpose of the physical test was to verify the macroscopic soil-retention performance of the optimized single plow body under soil-bin conditions. No double-share coupled configuration was designed, simulated, optimized, or evaluated in this study. Therefore, the physical validation was intended to correspond to the single-plow-body DEM optimization and response-surface prediction.
3.5.3. Test Results and Analysis
The physical tests evaluated the in situ furrow soil retention rate under different soil moisture contents, plowing depths, and forward speeds. Traction resistance was monitored during tillage to support the engineering interpretation of soil–tool interaction. Each treatment was repeated three times, and the mean value was used for analysis. The optimized parameter combination was validated by comparing the predicted retention rate with the measured retention rate obtained from ridge-volume measurements. The response-surface optimization predicted a maximum in situ furrow soil retention rate of 81.166% under the optimized parameter combination of 278.392 mm plowing width, 40.522° plow-body installation angle, and 23.211° soil-cutting angle. The measured mean retention rate in the physical validation test was 83.71%, and the relative error between the predicted and measured values was 3.13%, as shown in Table 13. This indicates that the response-surface model had acceptable predictive accuracy for the optimized condition. Because the validation was based on macroscopic ridge-volume measurement, the result should be interpreted as engineering verification of the retention-rate index rather than direct observation of every soil particle trajectory.
Table 13.
Comparison between the response-surface prediction and physical validation.
The physical test further evaluated the effects of soil moisture content, tillage depth, and forward speed on the in situ furrow soil retention rate. The measured mean results of the 18 summarized test groups are reported in Table 14. Under the reported conditions, the retention rate ranged from 66.66% to 85.96%, and the monitored traction resistance ranged from 894.72 N to 2339.10 N. These results indicate that the optimized plow maintained a stable in situ soil-retention ability under the tested operating conditions, while traction resistance increased under more demanding soil and operating conditions.
Table 14.
Physical test results of the optimized in situ soil-turning plow under different operating conditions.
At the same tillage depth and forward speed, the in situ furrow soil retention rate generally increased when the soil moisture content increased from 20% to 25%. This occurred because higher soil moisture strengthened cohesion among soil particles and adhesion between the soil and the plow surface. As a result, the disturbed soil tended to move more continuously along the plow surface and was more likely to remain within or return to the original furrow region. However, this effect should not be interpreted as meaning that higher soil moisture is always beneficial for tillage performance. Excessive soil moisture can increase soil–tool adhesion and may cause more soil to remain on the plow surface, resulting in plow-surface residue and less stable soil flow. In addition, stronger soil cohesion and soil–tool adhesion require greater force to cut, lift, and turn the soil, which increases traction resistance and may increase energy consumption. Therefore, the soil moisture effect should be evaluated as a trade-off between improving the in situ furrow soil retention rate and increasing adhesion, draft force, and energy demand.
Under different soil moisture contents, the retention rate first increased and then decreased as plowing depth increased. At shallow depths, the plowshare mainly disturbed the surface soil, and the turnover effect was limited. As the depth increased, more soil was lifted and guided by the plow surface, which improved retention. However, excessive depth increased the disturbed soil volume and outward throwing tendency, causing part of the soil to move beyond the original furrow region. In contrast, traction resistance increased continuously with plowing depth because both the soil volume being turned and the soil–tool contact area increased.
The forward speed also affected the retention rate and traction resistance. As forward speed increased, the retention rate first increased and then decreased. A moderate increase in forward speed provided sufficient kinetic energy for soil lifting and turnover, improving the backfilling effect. However, when the forward speed was too high, the outward inertial force of the soil increased, resulting in greater soil spillage outside the original furrow. Traction resistance increased with forward speed because the plowshare interacted with the soil more intensively, increasing friction, impact, and soil-cutting resistance.
Overall, the physical test confirmed the feasibility of the optimized in situ soil-turning plow. The in situ furrow soil retention rate was affected by soil moisture content, tillage depth, and forward speed, and the experimental trend was generally consistent with the EDEM simulation and response-surface optimization results. Nevertheless, the retention rate alone is not sufficient for a balanced engineering evaluation. Higher soil moisture may improve soil continuity and retention, but it can also increase soil adhesion, plow-surface residue, traction resistance, and energy consumption. Therefore, future application and optimization of the in situ soil-turning plow should jointly consider soil retention, draft force, adhesion, energy consumption, and operational stability.
4. Conclusions
- An in situ soil-turning plow was designed to address the spatial limitations of conventional moldboard plows in facility agriculture. A conventional plow surface was used as a reverse-engineering reference, and the final plow surface was reconstructed by constraining the soil trajectory toward in situ inversion rather than lateral discharge. The plowshare, plow chest, and plow wing were designed to realize soil cutting, lifting, rotation, and backfilling into the original furrow.
- Soil parameters were measured and calibrated using the angle of repose and the Hertz–Mindlin with JKR contact model in EDEM. The calibrated contact parameters were surface energy of 4.194 J/m2, collision restitution coefficient of 0.282, dynamic friction coefficient of 0.051, and static friction coefficient of 0.629. The in situ furrow soil retention rate was proposed as a comparative index for evaluating the ability of the plow to keep disturbed soil within or return it to the original furrow region.
- Plackett–Burman screening identified plowing width, plow-body installation angle, and soil-cutting angle as the key factors affecting the retention rate. Box–Behnken optimization determined the optimal parameter combination as a plowing width of 278.392 mm, plow-body installation angle of 40.522°, and soil-cutting angle of 23.211°, with a predicted retention rate of 81.166%. Physical validation based on ridge-volume measurement showed a 3.13% relative error between predicted and measured retention rates, supporting the feasibility of the proposed plow design at the macroscopic engineering scale.
- Scientifically, this study provides a geometric and DEM-based design framework for constrained soil-inversion surfaces and proposes the in situ furrow soil retention rate as a control-volume index for evaluating lateral soil displacement and backfilling ability. Practically, the optimized plow provides a structural reference for compact deep-tillage equipment in greenhouses and other protected cultivation systems where conventional moldboard plows are limited by columns, walls, and narrow working spaces. Future work will focus on testing different soil types, soil moisture contents, and operating speeds, and on evaluating draft force, soil adhesion, plow-surface residue, energy consumption, double-share coupled soil disturbance, and operational stability more comprehensively. In practical applications, the in situ furrow soil retention rate should be balanced with power demand and soil–tool adhesion rather than being used as the only performance indicator.
Author Contributions
Conceptualization, S.Y. and Z.L.; methodology, Z.L.; software, S.Y.; validation, S.Y., Z.L. and B.Y.; formal analysis, B.Y.; investigation, S.Y.; resources, Z.L.; data curation, S.Y. and Z.L.; writing—original draft preparation, S.Y.; writing—review and editing, B.Y.; visualization, S.Y.; supervision, Z.L.; project administration, Z.L.; funding acquisition, Z.L. All authors have read and agreed to the published version of the manuscript.
Funding
This research was funded by the National Natural Science Foundation of China, grant number 52275251; the Qing Lan Project of Jiangsu Province, China, 2023; and the Priority Academic Program Development of Jiangsu Higher Education Institutions, grant number PAPD-2023-87.
Data Availability Statement
The raw data supporting the conclusions of this article will be made available by the authors upon request.
Conflicts of Interest
The authors declare no conflicts of interest. The funders had no role in the design of the study; in the collection, analyses, or interpretation of data; in the writing of the manuscript; or in the decision to publish the results.
References
- Zhang, C.; Zhang, W.C.; Yan, H.F.; Ni, Y.X.; Akhlaq, M.; Zhou, J.N.; Xue, R. Effect of micro–spray on plant growth and chlorophyll fluorescence parameter of tomato under high temperature condition in a greenhouse. Sci. Hortic. 2022, 306, 111441. [Google Scholar] [CrossRef] [Scilit]
- Yan, H.F.; Deng, S.S.; Zhang, C.; Wang, G.Q.; Zhao, S.; Li, M.; Liang, S.W.; Jiang, J.H.; Zhou, Y.D. Determination of energy partition of a cucumber grown Venlo-type greenhouse in southeast China. Agric. Water Manag. 2023, 276, 108047. [Google Scholar] [CrossRef] [Scilit]
- Cui, M.L.; Yang, G.; Chen, J.W. Influence of Transfer Plot Area and Location on Chemical Input Reduction in Agricultural Production: Evidence from China. Agriculture 2023, 13, 1794. [Google Scholar] [CrossRef] [Scilit]
- Li, K.J.; Shi, J.L.; Hu, C.L.; Xue, W.P. The Intelligentization Process of Agricultural Greenhouse: A Review of Control Strategies and Modeling Techniques. Agriculture 2025, 15, 2135. [Google Scholar] [CrossRef] [Scilit]
- Chen, X.X.; Hou, T.Y.; Liu, S.L.; Guo, Y.X.; Hu, J.P.; Xu, G.M.; Ma, G.X.; Liu, W. Design of a micro-plant factory using a validated CFD model. Agriculture 2024, 14, 2227. [Google Scholar] [CrossRef] [Scilit]
- Guan, W.F.; Guo, W.Z.; Chen, F.; Han, X.B.; Wang, H.G.; Sun, W.T.; Zhao, Q.; Jia, D.D.; Wei, X.M.; Zhu, Q.Z. Multi-Span Greenhouse Energy Saving by External Insulation: System Design and Implementation. Agriculture 2024, 14, 281. [Google Scholar] [CrossRef] [Scilit]
- Zhang, C.; Xue, R.; Yan, H.F.; Lakhiar, I.A.; Ren, J.; Kinde, N.D.; Muhammad, A.; Deng, S.S. Temperature-responsive regulation of combined drip and micro-sprinkler systems in greenhouses: An EWM-TOPSIS approach for enhancing tomato heat resilience and irrigation efficiency. Irrig. Sci. 2026, 44, 31. [Google Scholar] [CrossRef] [Scilit]
- Yu, H.B.; Yu, H.Y.; Zhang, B.; Chen, M.C.; Liu, Y.C.; Sui, Y.Y. Quantitative perturbation analysis of plant factory LED heat dissipation on crop microclimate. Horticulturae 2023, 9, 660. [Google Scholar] [CrossRef] [Scilit]
- Liu, C.Y.; Li, W.; You, Y.L.; Yang, Q.Z.; Li, M.J. Research on leading agricultural enterprises guiding farmers’ participation in pre-production quality and safety control: Evidence from the Yangtze River Delta Region of China. Front. Sustain. Food Syst. 2025, 9, 1615223. [Google Scholar] [CrossRef] [Scilit]
- Wang, Y.F.; Zhang, X.D.; Yang, N.; Ma, G.X.; Du, X.X.; Mao, H.P. Separation-enrichment method for airborne disease spores based on microfluidic chip. Int. J. Agric. Biol. Eng. 2021, 14, 199–205. [Google Scholar] [CrossRef] [Scilit]
- Zhu, Q.Z.; Zhu, Z.H.; Zhang, H.Y.; Gao, Y.Y.; Chen, L.P. Design of an Electronically Controlled Fertilization System for an Air-Assisted Side-Deep Fertilization Machine. Agriculture 2023, 13, 2210. [Google Scholar] [CrossRef] [Scilit]
- Sun, X.; Zhang, Y.; Zhang, H.; Wang, J.; Elrys, A.S.; Tu, X.; Müller, C.; Zhang, J.; Cai, Z.; Cheng, Y. Plastic-shed vegetable cultivation alters soil gross nitrogen transformation rates and nitrous oxide production pathways. Soil Tillage Res. 2022, 223, 105464. [Google Scholar] [CrossRef] [Scilit]
- Gamliel, A.; van Bruggen, A. Maintaining soil health for crop production in organic greenhouses. Recent advances in organic horticulture technology and management—Part 1. Sci. Hortic. 2016, 208, 120–130. [Google Scholar] [CrossRef] [Scilit]
- Gao, L.; Charles, O.O.; Lou, F.Y.; Bonaventure, C.E.; Wu, Y.F.; Chen, X.F.; Wang, Y.L.; Li, X.; Jiang, J.X. Corn-Domesticated Bacteria Synergy Removes Pyrene and Enhances Crop Biomass: A Sustainable Farmland Remediation Strategy. Agriculture 2025, 15, 2083. [Google Scholar] [CrossRef] [Scilit]
- Ji, C.Y.; Ye, R.Z.; Yin, Y.F.; Sun, X.F.; Ma, H.L.; Gao, R. Reductive soil disinfestation with biochar amendment modified microbial community composition in soils under plastic greenhouse vegetable production. Soil Tillage Res. 2022, 218, 105323. [Google Scholar] [CrossRef] [Scilit]
- Gao, J.M.; Shen, Y.H.; Ma, B.L. Optimized design of touching parts of soil disinfection machine based on strain sensing and discrete element simulation. Sensors 2023, 23, 6369. [Google Scholar] [CrossRef] [Scilit]
- Chen, J.; Pang, D.W.; Jin, M.; Luo, Y.L.; Li, H.Y.; Li, Y.; Wang, Z.L. Improved soil characteristics in the deeper plough layer can increase grain yield of winter wheat. J. Integr. Agric. 2020, 19, 1215–1226. [Google Scholar] [CrossRef] [Scilit]
- Guo, Y.; Cui, M.L.; Xu, Z.J. Spatial characteristics of transfer plots and conservation tillage technology adoption: Evidence from a survey of four provinces in China. Agriculture 2023, 13, 1601. [Google Scholar] [CrossRef] [Scilit]
- Chandio, F.A.; Li, Y.; Xu, L.; Ma, Z.; Ahmad, F.; Cuong, D.M.; Lakhiar, I.A. Predicting 3D forces of disc tool and soil disturbance area using fuzzy logic model under sensor based soil-bin. Int. J. Agric. Biol. Eng. 2020, 13, 77–84. [Google Scholar] [CrossRef] [Scilit]
- Guan, C.S.; Fu, J.J.; Xu, L.; Jiang, X.Z.; Wang, S.L.; Cui, Z.C. Study on the reduction of soil adhesion and tillage force of bionic cutter teeth in secondary soil crushing. Biosyst. Eng. 2022, 213, 133–147. [Google Scholar] [CrossRef] [Scilit]
- Mahmoodi-Eshkaftaki, M.; Ebrahimi, R.; Ghanbarian, D.; Houshyar, E. Geometric characterization of moldboard plough using coupled close photography and surface fitting model. Soil Tillage Res. 2017, 170, 122–129. [Google Scholar]
- Bulgakov, V.; Pascuzzi, S.; Adamchuk, V.; Ivanovs, S.; Pylypaka, S. A theoretical study of the limit path of the movement of a layer of soil along the plough mouldboard. Soil Tillage Res. 2019, 195, 104406. [Google Scholar]
- Zhu, Y.Y.; Cui, B.B.; Yu, Z.L.; Gao, Y.Y.; Wei, X.H. Tillage Depth Detection and Control Based on Attitude Estimation and Online Calibration of Model Parameters. Agriculture 2024, 14, 2130. [Google Scholar] [CrossRef] [Scilit]
- Ma, Z.; Zhu, Y.L.; Wu, Z.P.; Traore, S.N.; Chen, D.; Xing, L.C. BP neural network model for material distribution prediction based on variable amplitude anti-blocking screening DEM simulations. Int. J. Agric. Biol. Eng. 2023, 16, 190–199. [Google Scholar] [CrossRef] [Scilit]
- Zhao, Z.; Li, H.C.; Liu, J.K.; Yang, S.X. Control method of seedbed compactness based on fragment soil compaction dynamic characteristics. Soil Tillage Res. 2020, 198, 104551. [Google Scholar] [CrossRef] [Scilit]
- Hao, Y.; Liang, S.F.; Wang, J.; Lu, Y.K. Numerical Simulation and Analysis of Vibrating Rice Filling Based on EDEM Software. Agriculture 2022, 12, 2013. [Google Scholar] [CrossRef] [Scilit]
- Dai, Q.Q.; Zuo, Z.Y.; Zheng, Q.H.; Fu, Y.Q.; Zhang, S.H.; Mao, H.P. Optimization and Experimental Study of a Soil Loosening and Root Lifting Device for Shanghai Green (Brassica rapa subsp. chinensis) Harvesting Based on an EDEM-RecurDyn Simulation. Agriculture 2025, 15, 1865. [Google Scholar] [CrossRef] [Scilit]
- Wang, X.Z.; Li, Y.P.; Bai, J. Simulation and Experimental Study on Vibration Separation of Residual Film and Soil Based on EDEM. Agriculture 2025, 15, 1987. [Google Scholar] [CrossRef] [Scilit]
- Fang, W.Q.; Wang, X.Z.; Zhu, C.S.; Han, D.L.; Zang, N.; Chen, X.G. Analysis of Film Unloading Mechanism and Parameter Optimization of Air Suction-Type Cotton Plough Residual Film Recovery Machine Based on CFD—DEM Coupling. Agriculture 2024, 14, 1021. [Google Scholar] [CrossRef] [Scilit]
- Shi, J.W.; Hu, J.P.; Li, J.; Liu, W.; Yue, R.C.; Zhang, T.F.; Yao, M.J. Design and experiment of planting mechanism of automatic transplanter for densely planted vegetables. Agriculture 2024, 14, 1357. [Google Scholar] [CrossRef] [Scilit]
- Hao, Y.; Cai, Y.; Liang, S.F.; Ku, J.S.; Qin, Y. Numerical Simulation and Analysis of Feeding Uniformity of Viscous Miscellaneous Fish Bait Based on EDEM Software. Agriculture 2023, 13, 356. [Google Scholar] [CrossRef] [Scilit]
- Zhang, Q.Y.; Fang, H.M.; Xu, G.W.; Niu, M.M.; Li, J.Y. Experimental and Numerical Analysis of Straw Motion under the Action of an Anti-Blocking Mechanism for a No-Till Maize Planter. Agriculture 2024, 14, 1001. [Google Scholar] [CrossRef] [Scilit]
- Xu, Y.F.; Zhang, X.L.; Wu, S.; Chen, C.; Wang, J.Z.; Yuan, S.Q.; Chen, B.; Li, P.P.; Xu, R.J. Numerical simulation of particle motion at cucumber straw grinding process based on EDEM. Int. J. Agric. Biol. Eng. 2020, 13, 227–235. [Google Scholar] [CrossRef] [Scilit]
- Ou, M.X.; Wang, G.Q.; Lu, Y.; Zhang, Z.J.; Pan, H.J.; Jia, W.D.; Dong, X. Structure Optimization and Performance Simulation of a Double-Disc Fertilizer Spreader Based on EDEM-CFD. Agronomy 2025, 15, 1025. [Google Scholar] [CrossRef] [Scilit]
- Yang, Q.Z.; Zhang, R.Y.; Jia, C.P.; Li, Z.Y.; Zhu, M.L.; Addy, M. Study of dynamic hole-forming performance of a cup-hanging planter on a high-speed seedling transplanter. Front. Mech. Eng. 2022, 8, 896881. [Google Scholar] [CrossRef] [Scilit]
- Zhang, C.; Li, X.Y.; Yan, H.F.; Ullah, I.; Zuo, Z.Y.; Li, L.L.; Yu, J.J. Effects of irrigation quantity and biochar on soil physical properties, growth characteristics, yield and quality of greenhouse tomato. Agric. Water Manag. 2020, 241, 106263. [Google Scholar] [CrossRef] [Scilit]
- Shaikh, S.A.; Li, Y.; Zheng, M.; Chandio, F.A.; Ahmad, F.; Tunio, M.H.; Abbas, I. Effect of Grouser Height on the Tractive Performance of Single Grouser Shoe under Different Soil Moisture Contents in Clay Loam Terrain. Sustainability 2021, 13, 1156. [Google Scholar] [CrossRef] [Scilit]
- Qian, P.F.; He, Q.; Tang, Z.; Gu, T.W.; Tian, L.Q. Effect of wet paddy and stalk parameter for DEM simulation based on Hertz–Mindlin with JKR model. AIP Adv. 2025, 15, 105307. [Google Scholar] [CrossRef] [Scilit]
- Ahmad, F.; Qiu, B.; Ding, Q.; Ding, W.; Khan, Z.M.; Shoaib, M.; Chandio, F.A.; Rahim, A.; Khaliq, A. Discrete element method simulation of disc type furrow openers in paddy soil. Int. J. Agric. Biol. Eng. 2020, 13, 103–110. [Google Scholar] [CrossRef] [Scilit]
- Shabbir, A.; Mao, H.; Ullah, I.; Buttar, N.A.; Ajmal, M.; Lakhiar, I.A. Effects of Drip Irrigation Emitter Density with Various Irrigation Levels on Physiological Parameters, Root, Yield, and Quality of Cherry Tomato. Agronomy 2020, 10, 1685. [Google Scholar] [CrossRef] [Scilit]
- SL 237-1999; Specification of Soil Test. Ministry of Water Resources of the People’s Republic of China: Beijing, China, 1999.
- Yang, Q.Z.; Shi, L.; Shi, A.P.; He, M.S.; Zhao, X.Q.; Zhang, L.; Addy, M. Determination of key soil characteristic parameters using angle of repose and direct shear stress test. Int. J. Agric. Biol. Eng. 2023, 16, 143–150. [Google Scholar] [CrossRef] [Scilit]
- Yan, H.F.; Ma, J.M.; Zhang, J.Y.; Wang, G.Q.; Zhang, C.; Muhammad, W.; Huang, S.; Yu, J.J. Effects of film mulching on the physiological and morphological parameters and yield of cucumber under insufficient drip irrigation. Irrig. Drain. 2022, 71, 897–911. [Google Scholar] [CrossRef] [Scilit]
- Shi, W.; Zhang, X.; Xue, X.Z.; Feng, F.; Zheng, W.G.; Chen, L.P. Analyzing evapotranspiration in greenhouses: A Lysimeter-Based calculation and evaluation approach. Agronomy 2023, 13, 3059. [Google Scholar] [CrossRef] [Scilit]
- Fang, W.Q.; Wang, X.Z.; Han, D.L.; Chen, X.G. Review of Material Parameter Calibration Method. Agriculture 2022, 12, 706. [Google Scholar] [CrossRef] [Scilit]
- JY 0001-2003; General Quality Requirements for Educational Instrument and Equipment Products. Ministry of Education of the People’s Republic of China: Beijing, China, 2003.
- Ullah, I.; Mao, H.; Rasool, G.; Gao, H.; Javed, Q.; Sarwar, A.; Khan, M.I. Effect of Deficit Irrigation and Reduced N Fertilization on Plant Growth, Root Morphology and Water Use Efficiency of Tomato Grown in Soilless Culture. Agronomy 2021, 11, 228. [Google Scholar] [CrossRef] [Scilit]
- Lin, Z.H.; Li, X.; Sun, H.; Zhou, M.L.; Yin, J.J.; He, J.J.; Yin, D.Q. Design and Experimental Validation of Stem-Clamping-and-Pull-Out-Type Pepper Plug Seedling-Picking Mechanism. Agriculture 2025, 15, 1563. [Google Scholar] [CrossRef] [Scilit]
- Liu, Q.; Zhuang, S.G.; Bao, H.F.; He, Z.F.; Wang, K.; Liu, H.L. The Optimization of a First-Stage Liquid-Sealing Impeller Structure for a Turbopump Based on Response Surface Methodology. Processes 2022, 10, 1999. [Google Scholar]
- Han, D.L.; Ren, L.Z.; Li, C.W.; Liu, H.R.; Hu, J.R.; Yang, D.Y.; Yang, Q.Z. Mechanical response of wet and soft soil to complex interactions with solid. Soil Tillage Res. 2026, 255, 106834. [Google Scholar] [CrossRef] [Scilit]
- Zhang, H.L.; Tian, L.Q.; Tang, Z.; Fang, M.; Zhang, B. Friction-Reduction Mechanism and Performance Optimization of Biomimetic Non-Smooth Surfaces Inspired by Dung Beetle Microstructures. Lubricants 2025, 13, 490. [Google Scholar] [CrossRef] [Scilit]
- Chen, X.X.; Guo, Y.X.; Hu, J.P.; Xu, G.M.; Liu, W.; Ma, G.X.; Ding, Q.S.; He, R.Y. Quantitative evaluation of post-tillage soil structure based on close-range photogrammetry. Agriculture 2024, 14, 2124. [Google Scholar] [CrossRef] [Scilit]
- Chen, X.Y.; Bai, J.; Wang, X.Z.; Fang, W.Q.; Hong, T.Y.; Zang, N.; Fang, L.L.; Wang, G.L. Calibration and Testing of Discrete Elemental Simulation Parameters for Pod Pepper Seeds. Agriculture 2024, 14, 831. [Google Scholar] [CrossRef] [Scilit]
- Bai, J.; Chen, X.Y.; Fang, W.Q.; Fang, H.M.; Wang, X.Z. Design and Parameter Optimization of Fresh Chili Seed Extractor. Agriculture 2025, 15, 1336. [Google Scholar] [CrossRef] [Scilit]


Disclaimer/Publisher’s Note: The statements, opinions and data contained in all publications are solely those of the individual author(s) and contributor(s) and not of MDPI and/or the editor(s). MDPI and/or the editor(s) disclaim responsibility for any injury to people or property resulting from any ideas, methods, instructions or products referred to in the content. |
© 2026 by the authors. Licensee MDPI, Basel, Switzerland. This article is an open access article distributed under the terms and conditions of the Creative Commons Attribution (CC BY) license.