Abstract
The vortex in a pump sump is a negative problem for the pump unit, which can lead to the decline of pump performance. Focusing on the internal pressure characteristics of the floor-attached vortex (FAV) and its influence on the pump unit, the FAV was analyzed adopting the previously verified numerical simulation method and experiment. The results show that the pressure in the vortex core gradually decreases with time, drops to a negative pressure at the development stage, and then reaches the lowest pressure during the continuance stage. When the negative pressure of the vortex tube is around the vaporization pressure of the continuance stage, it can cause a local cavitation at the impeller inlet. The evolution of the FAV is accompanied by a change of pressure gradient in the vortex core which is discussed in detail. This research provides theoretical guidance for a better understanding of the vortex characteristics and the optimal design for the pump.
1. Introduction
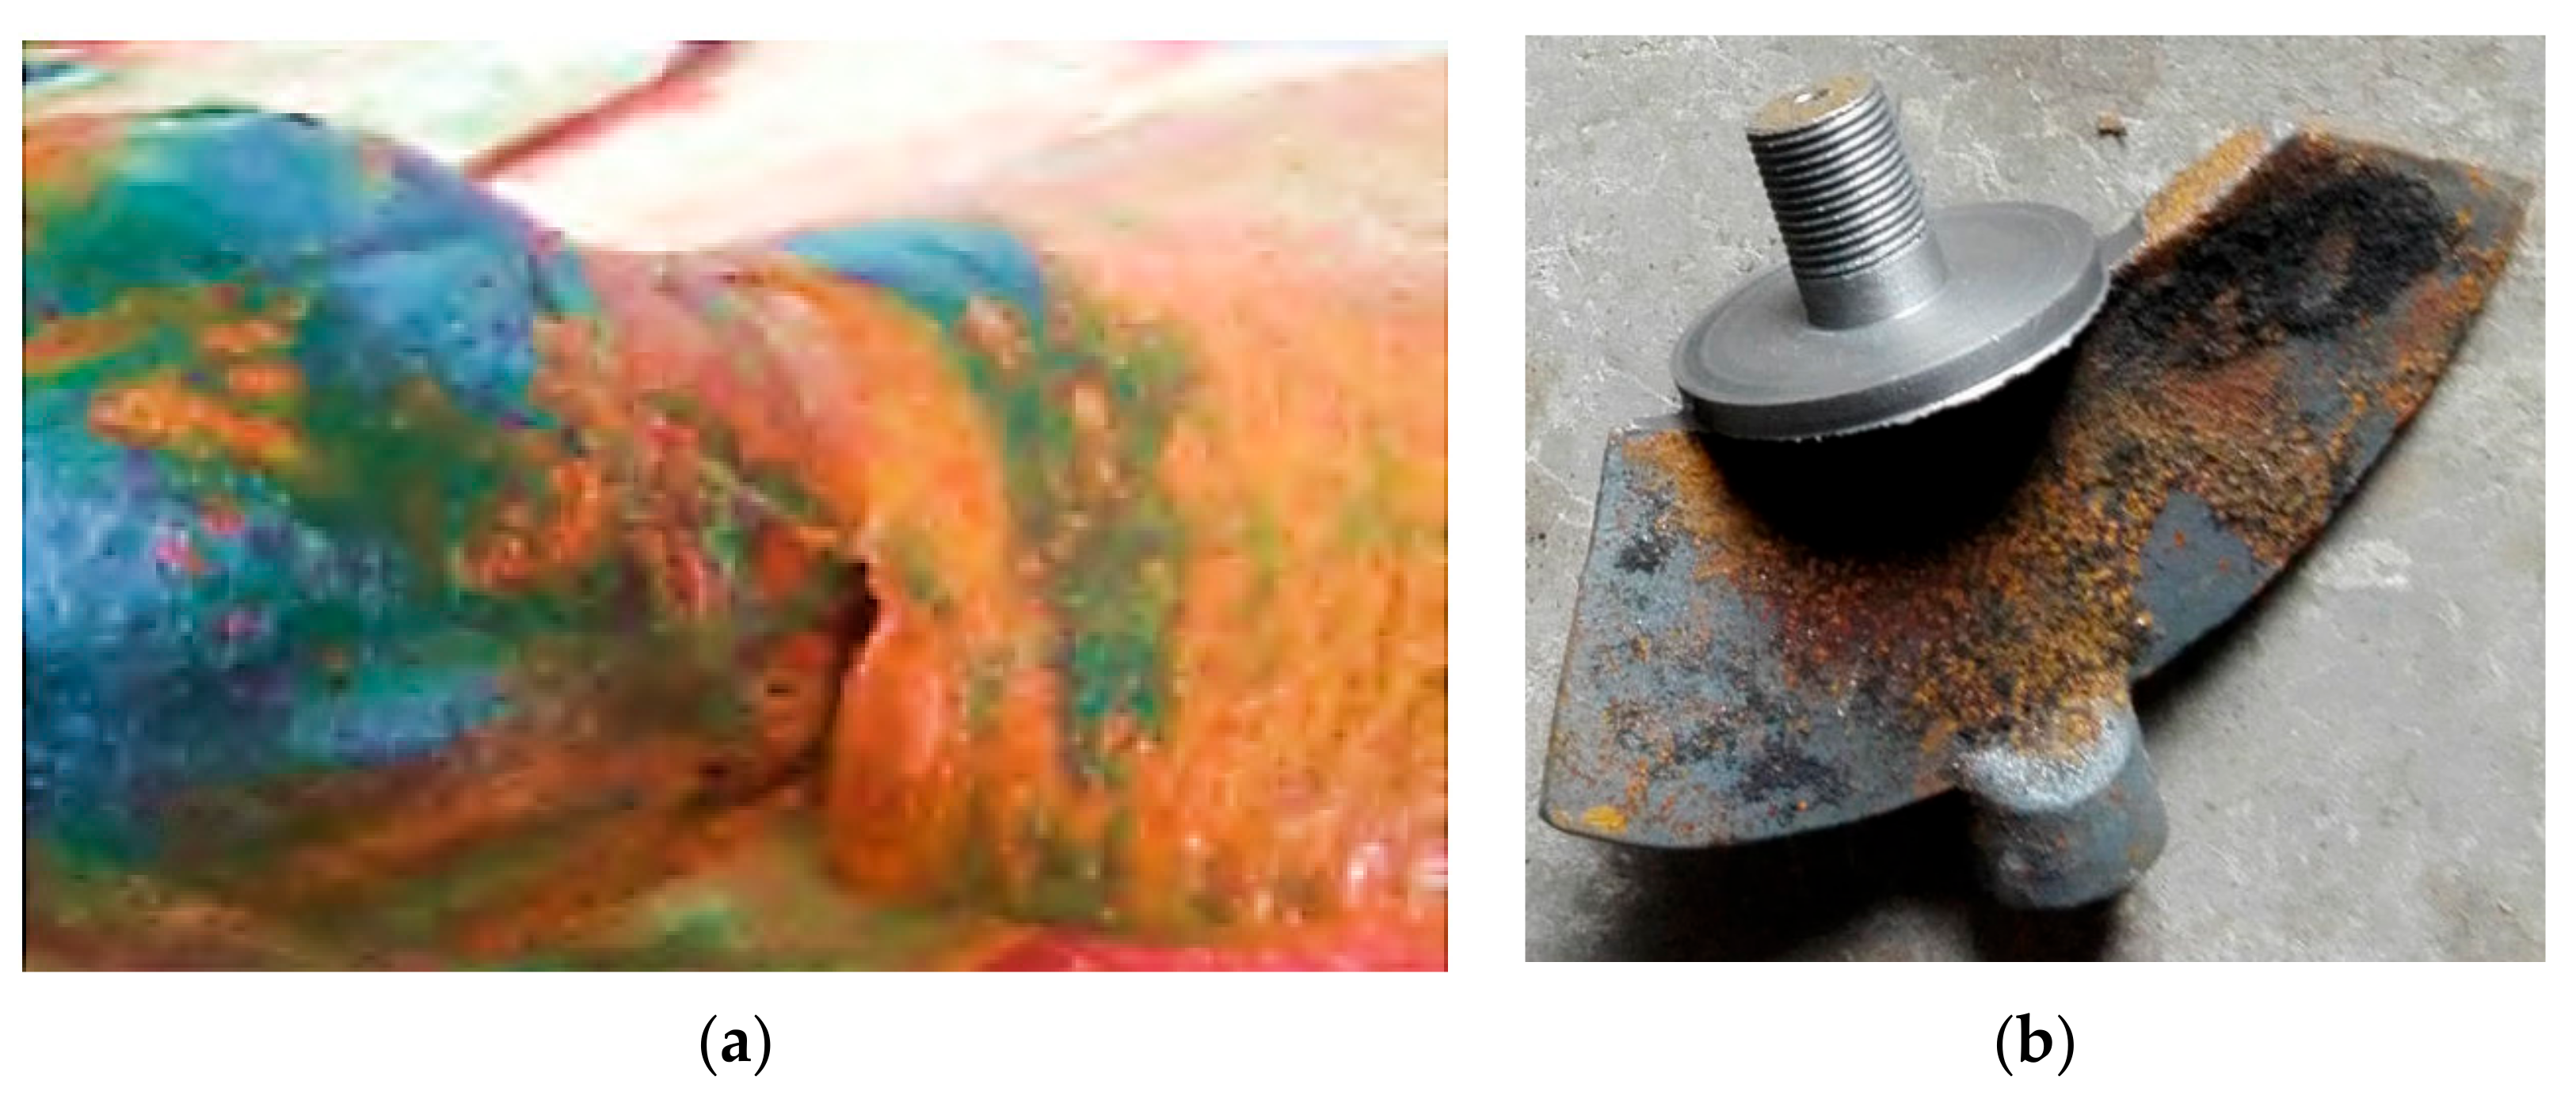
The pump sump is the key component of a pump station, but many different vortices exist in the pump sump due to an unreasonable design, which seriously affects the safe operation of the pump unit [1,2]. For a sediment laden flow, the vortex can change the particle motion and aggravate the impeller erosion [3]. Figure 1 shows the structural damage of a pump unit that was operating under this vortex condition for a long-term period.

Figure 1.
Erosion damage of the parts of a pump on site. (a) Impeller hub (b) Blade.
A vortex is a special form of fluid motion, which has unsteady and nonlinear characteristics [4]. The universality and complexity of vortex motion make it an enduring research frontier in the theoretical and applied research of hydrodynamics [5]. The vortex formed at the inlet of a pump station is generally divided into a free surface vortex and submerged vortex. The free surface vortex has a great impact on the project, which will reduce the effective water flow section at the inlet of the pump station and reduce the flow capacity. A floor-attached vortex (FAV) is a typical submerged vortex and because it occurs underwater, it is difficult to observe and evaluate directly. At present, various theoretical and analytical models have been proposed for the vortices from the Navier–Stokes equations [6].
The research on the influencing factors of a vortex can directly affect the research progress of vortex hydraulic characteristics, such as critical submerged depth and vortex elimination. Therefore, a substantial amount of research on the influencing factors of the vortex has been undertaken [7,8]. Nahale [9] believes that there is a negative pressure below a certain point on the water surface, resulting in continuous rupture of the water and air intrusion, thus forming a vortex. Deng Constantinescu et al. [10] believes that the blocking effect of the wall leads to a reduction in the kinetic energy of the water to zero and an increase of the potential energy to form a stagnant area, which forms a vortex under the combined action of forward, reverse and transverse velocity at the same time. Monshizadeh. et al. [11] regarded the stagnant area upstream of the intake as a large shear flow field. Water bodies with different velocities collide with each other in the stagnant area and produce inertial force. They believe that this inertial force is the main driving force for the formation and development of vortices. Amiri [12] summarized the previous studies on the influencing factors of vortices and believed that these research results can be summarized as the hydraulic characteristics of intake (velocity, flow, submerged depth, circulation, etc.), fluid characteristics (Coriolis force, surface tension, kinematic viscosity coefficient, etc.) and boundary conditions (intake form, location, etc.).
There have been many studies on the dynamic characteristics of the vortex itself. V.P. Rajendran [13] found that the change of submergence and the distance between the bell and the sidewall of the pump sump has an important influence on vortices. Duinmeijera S. [14] measured the flow field used the PIV and obtained the flow characteristics with and without an anti-vortex device. Liu [15] measured the dynamic characteristics of the vortex in a pump sump by V3V, which proved that the vortex in the pump sump was a forced vortex.
Moreover, various numerical methods have been presented for vortexes with single-phase and two-phase methods [16,17,18,19,20]. For the numerical simulation of a vortex in a pump sump, it mainly focused on the development of a multiphase flow model and turbulence model. Numerical simulation can better make up for the shortcomings of a model test [21,22,23]. The research of a model test and numerical simulation has provided great help for vortex theory development and engineering applications; however, the previous studies on the vortex in a pump sump mostly used the simplified model, and the influence of the FAV on the pump was not comprehensive enough. Moreover, the FAV in the axial-flow pump device was different from that in the simple model, so it is necessary to study the FAV in an axial-flow pump device.
In this paper, the pressure characteristics in the evolution process of an FAV in a pump sump and its harm on the pump unit was studied based on previous research. It is expected to improve the research depth on vortex characteristics and contribute to engineering applications and academic research.
2. Numerical Calculation
2.1. Numerical Model
2.1.1. Reynolds-Averaged Navier–Stokes Equations
The Navier–Stokes equation was used to study the vortex in a pump sump, which was verified by experiments [12,24,25]. The Reynolds-averaged Navier–Stokes equation is:
where u is the flow velocity, t is the time, ρ is the fluid density, p is the flow pressure, ν is the kinematic viscosity of the fluid and St is the source term. τ is the Reynolds stress defined as:
where τd is the deviatoric Reynolds stress, k is the turbulent kinetic energy, δ is the Kronecker delta. Based on viscosity (νt) assumption, Equation (2) can be written as:
where S is the train-rate tensor:
2.1.2. Turbulence Model
The model (SST-CC) was proposed by Smirnov [26], which applied the curvature correction model to the shear stress transport model (SST).
SST-CC:
where
where cr1 and cr3 both are 1; cr2 is 2; , , Ωa is the absolute rotation-rate tensor,
where ξ is the Levi-Civita symbol; Ωrot is the rotation rate of frame; Ω is the relative rotation-rate tensor.
2.1.3. Multiphase Flow Model
The VOF model is a surface tracking method, which is suitable for a continuous two-phase flow with obvious interface. The mixture model is suitable for the flow where each phase is treated as a continuum connected to each other in the Euler model, which is realized by solving the momentum equation of the mixture and that is mainly applied to the calculation of particle flow and sedimentation [27]. The Euler model is mainly used for bubble flow, particle suspension and sedimentation, by solving the multiple momentum equations and continuity equations [28].
A large number of studies proved that the VOF model is the most suitable for a gas–liquid two-phase flow with a free surface [29] and has been widely used in the simulations on the vortices in a pump sump. The interface tracking of the VOF model is realized by solving the volume fraction equation. For phase q, the volume fraction control equation is as follows:
where, αq is the phase volume fraction.
Therefore, the VOF model was used to simulate the FSV in this paper.
2.2. Establishment of Computational Model and Mesh Generation
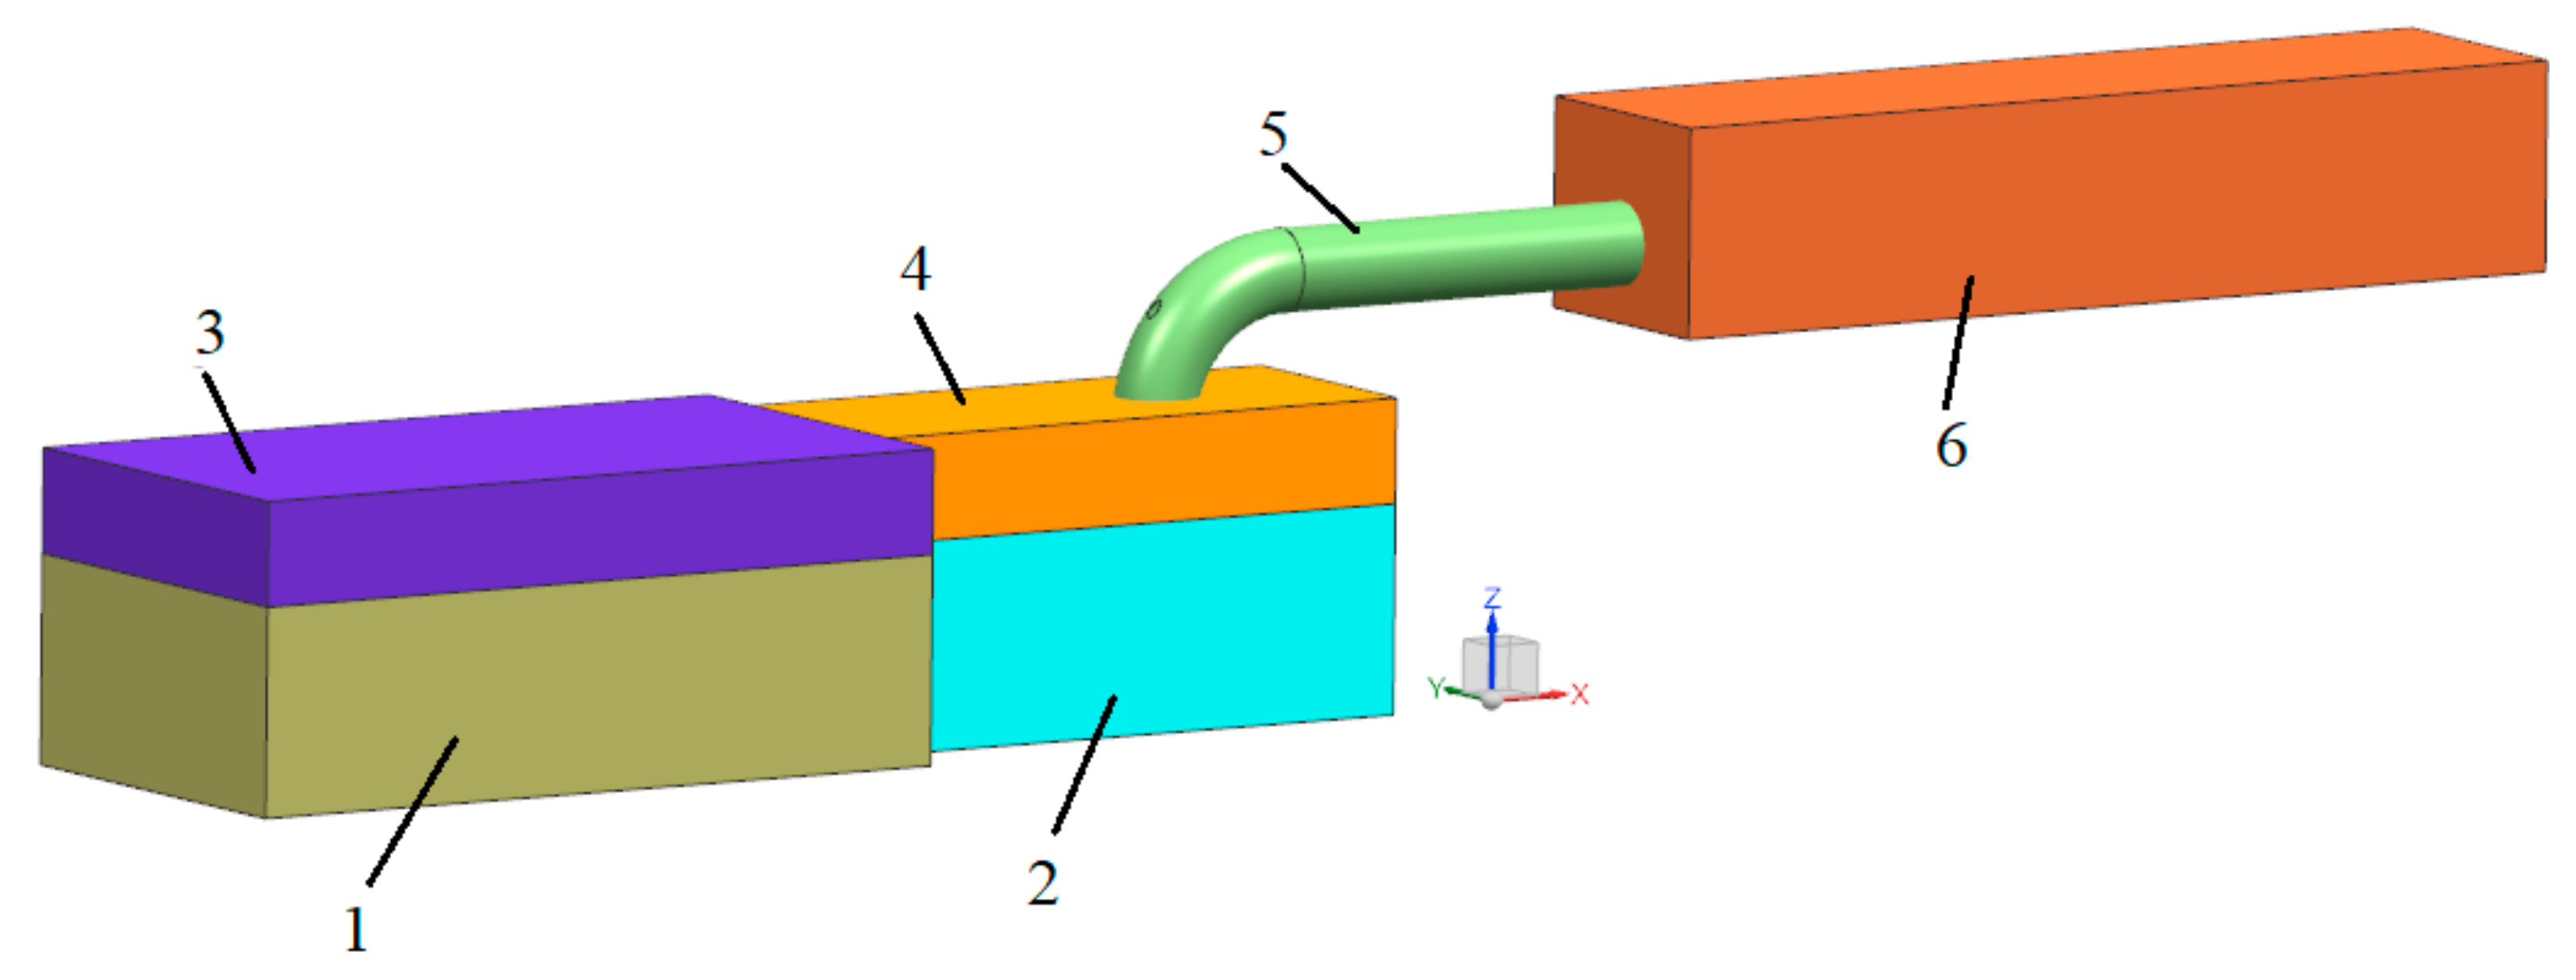
The research object of this paper was an open vertical axial flow pump, as Figure 2. The size of the pump sump was 840 mm × 360 mm × 330 mm (length × width × height), the suspended height of the bell was 0.7D, and D is the impeller diameter, which was 120 mm. The number of impeller blades and guide vanes was 4 and 7, respectively.

Figure 2.
Three-dimensional geometric model. 1, forebay; 2, pump sump; 3, air; 4, air; 5, outlet pipe; and 6, outlet tank.
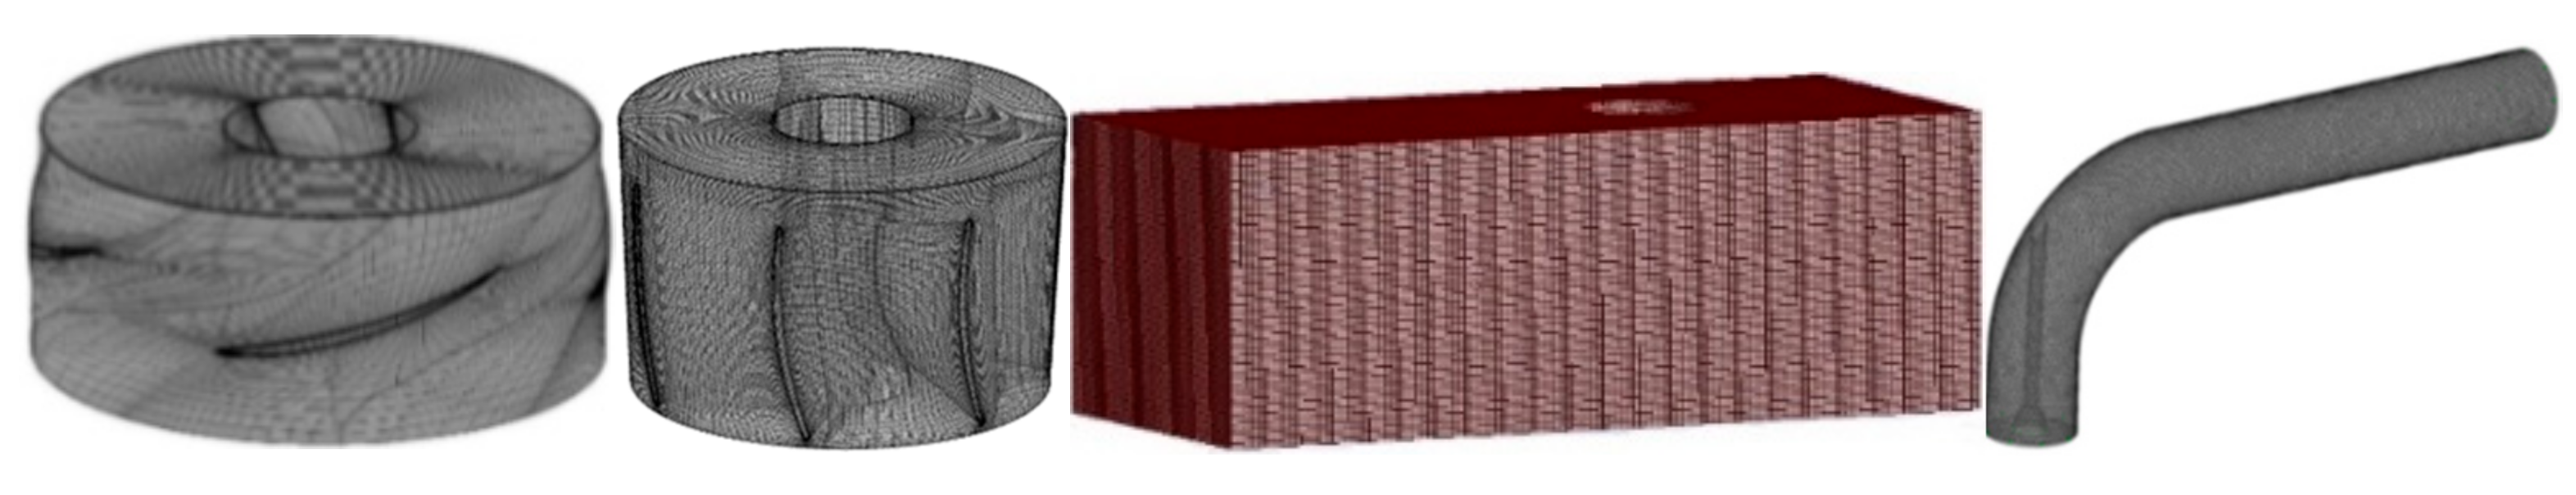
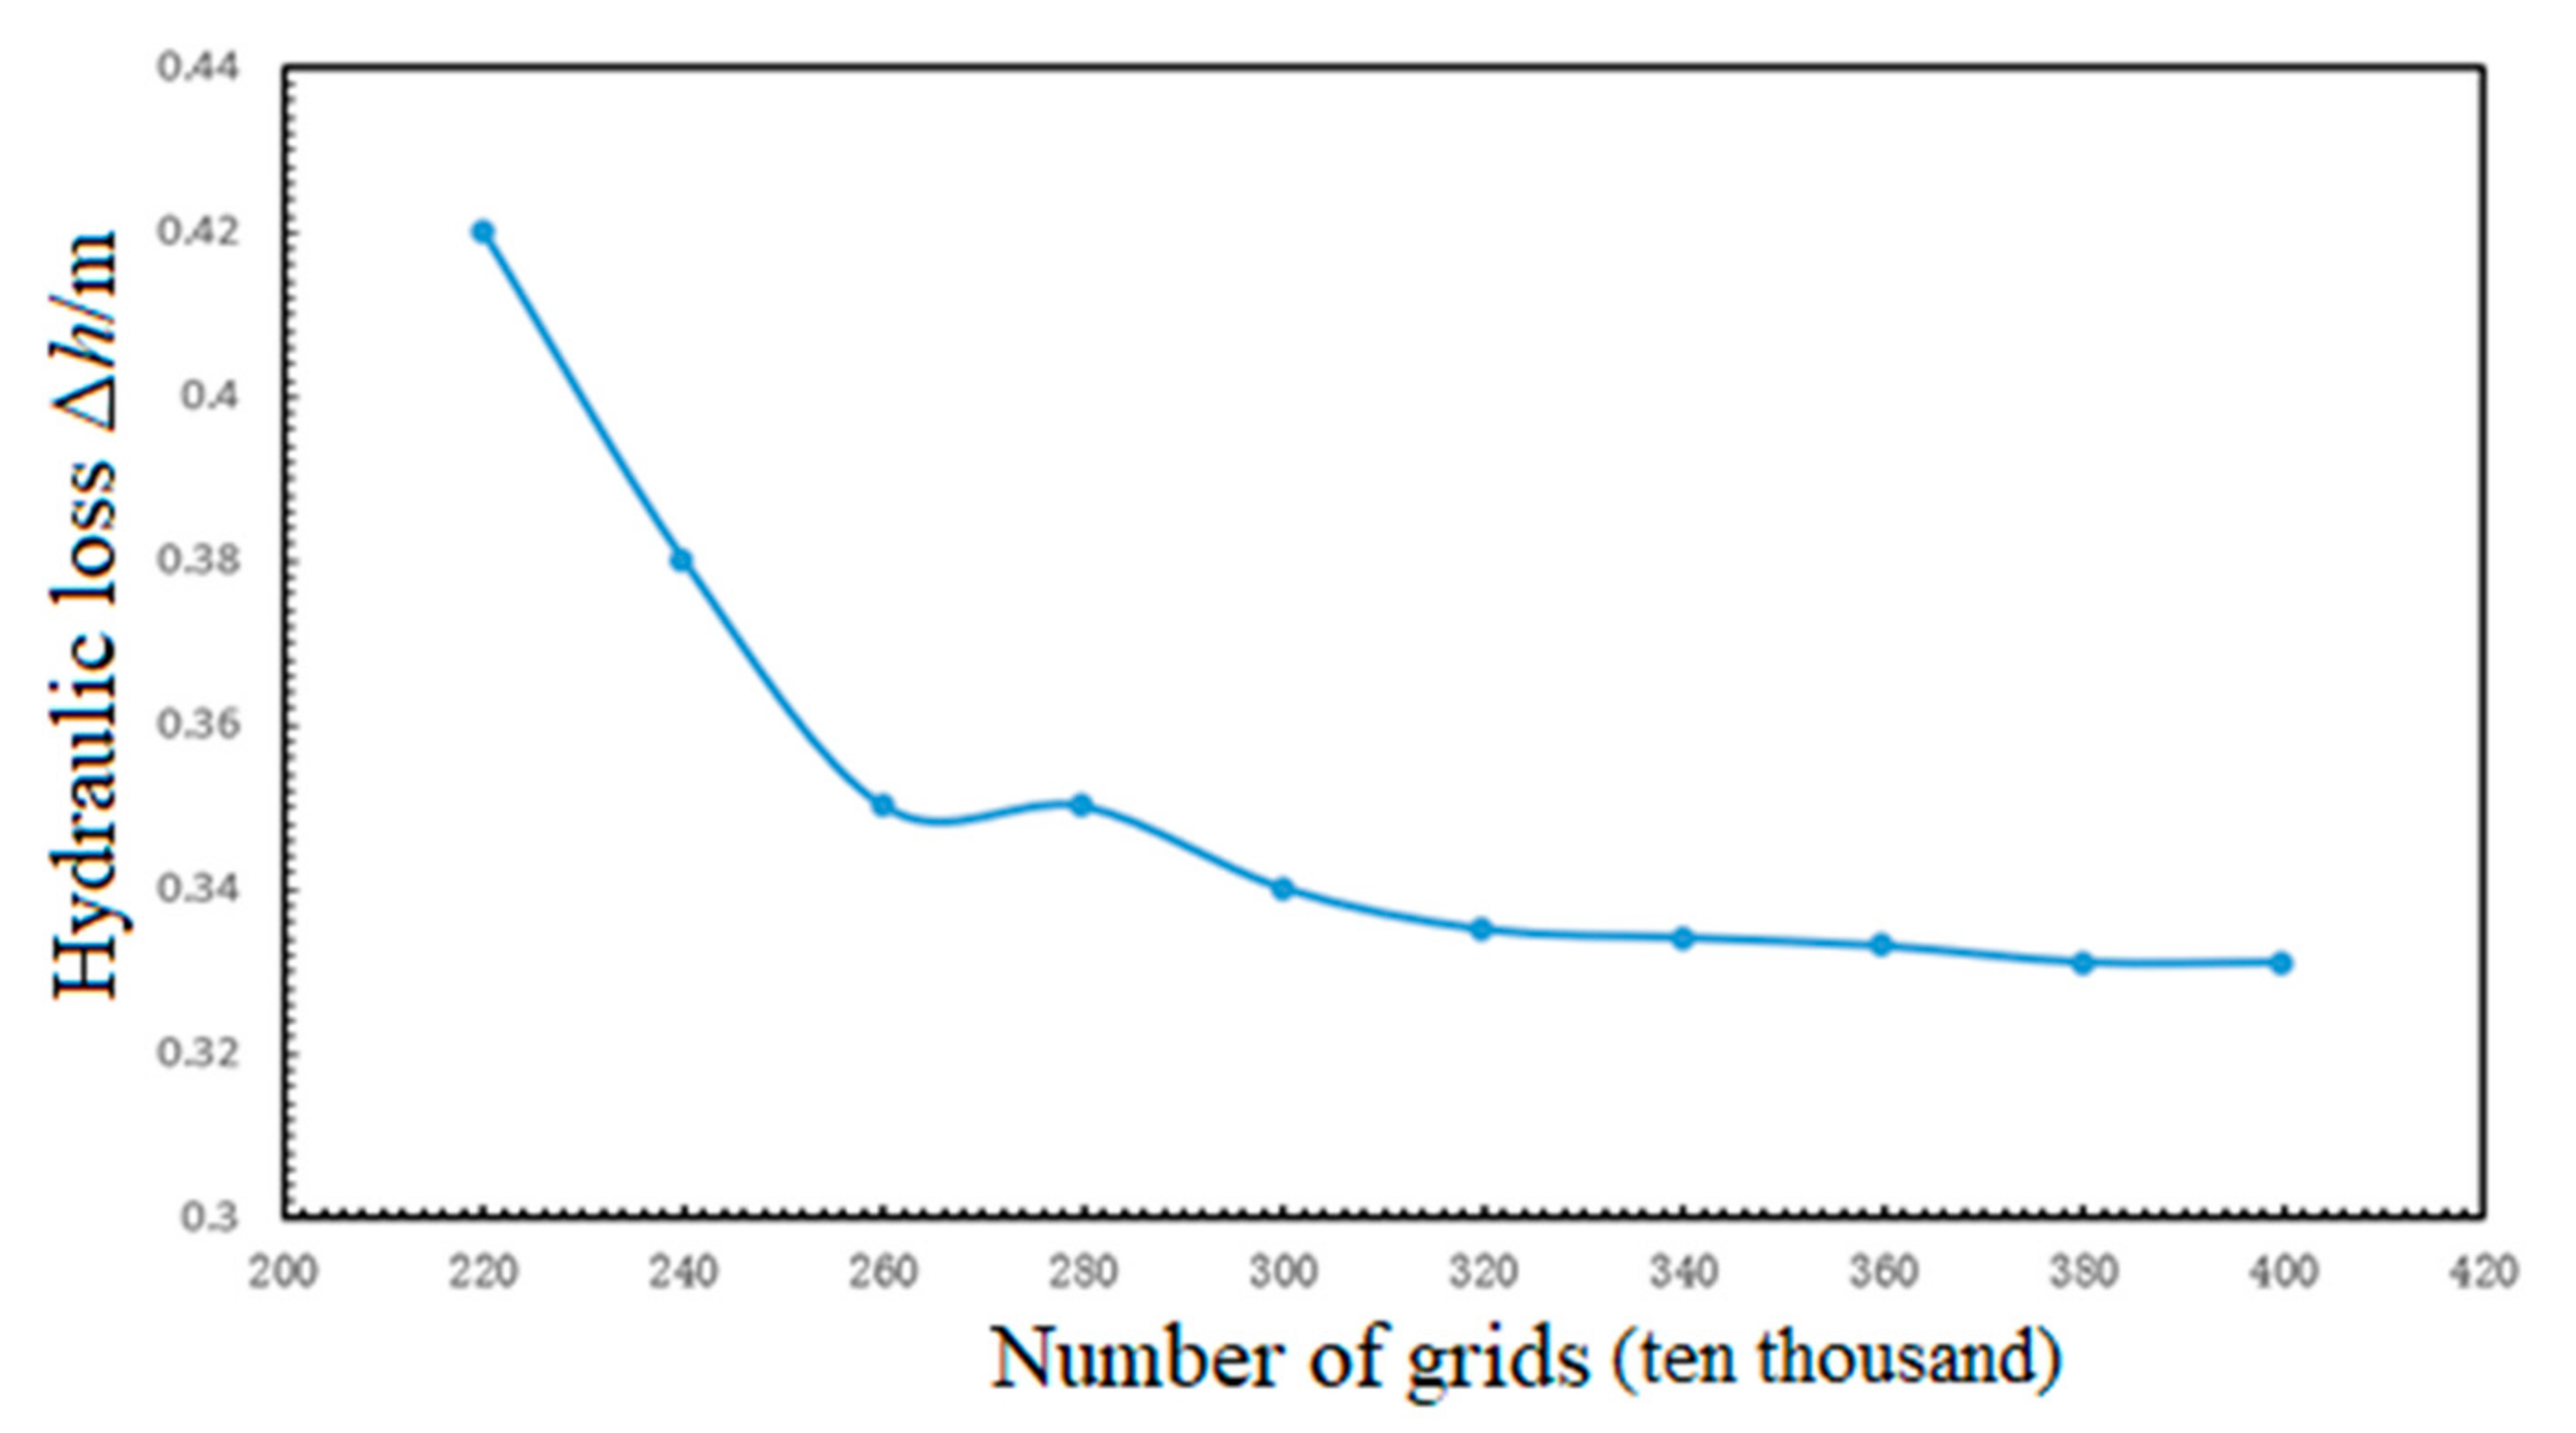
A hybrid of a structured and unstructured grid was used for the calculation model, as in Figure 3. The hydraulic loss was used to evaluate the grid independence. When the number of grids is more than 3.8 million, the total hydraulic loss has no obvious change, as shown in Figure 4, therefore the grid number of pump sump was 3.8 million. In another paper, the y + value of the same calculation model was introduced in detail. Similar simulations were all controlled within 30–300, and the y + value in the pump sump of this model was controlled within 100 [30]. See literature [30] for detailed a analysis.
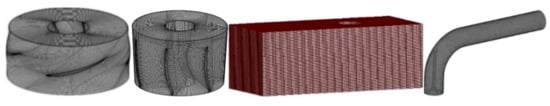
Figure 3.
Grid diagram of a calculation model.
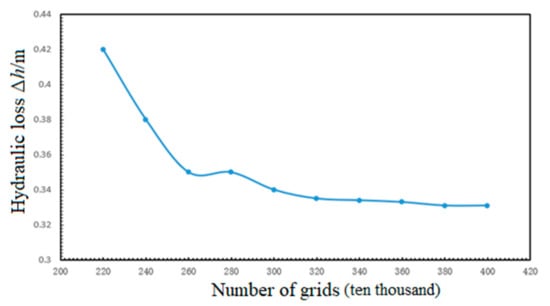
Figure 4.
Grid independence verification.
2.3. Boundary Setup
The inlet of the calculation model adopted a flow inlet, the flow was 38 L/s, the outlet adopted a pressure outlet, the static pressure was 1 atm, the wall surface was a non-sliding wall, and the free surface of the pump sump adopted an opening boundary. The total time of the unsteady calculation was 8 s and the time interval was 0.005 s. The initial volume fraction of water was 1 and the initial volume fraction of air was 1. The initial gas–liquid distribution of the calculation model is shown in Figure 5.
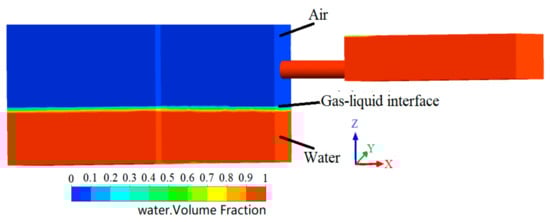
Figure 5.
Initial gas–liquid distribution of the calculation model.
2.4. Test Introduction
We carried out the experimental research on the vortices in the pump sump, mainly including a V3V measurement, pressure pulsation measurement, vortex capture test by high-speed camera and an energy performance test. The pressure near the wall and the three-dimensional velocity fields in the vortex area were obtained. The specific test process is introduced in detail in the literature [31,32,33]. A large number of repeated experiments were carried out for the measurement of the vortex, and the error was within 0.5%. The error result analysis is introduced in detail in literature [32]. Due to the limitations of the measurement technology, the measurement of the three-dimensional pressure field was difficult, therefore the numerical simulation was used to compensate for the limitations of the test. Based on the previous research, this paper carried out numerical simulation research which was verified by the experiment results. The pump’s geometric parameters and calculation settings of the calculation model were the same as those of the test model.
3. Results Discussion
3.1. Reliability Verification of the Numerical Simulation Results
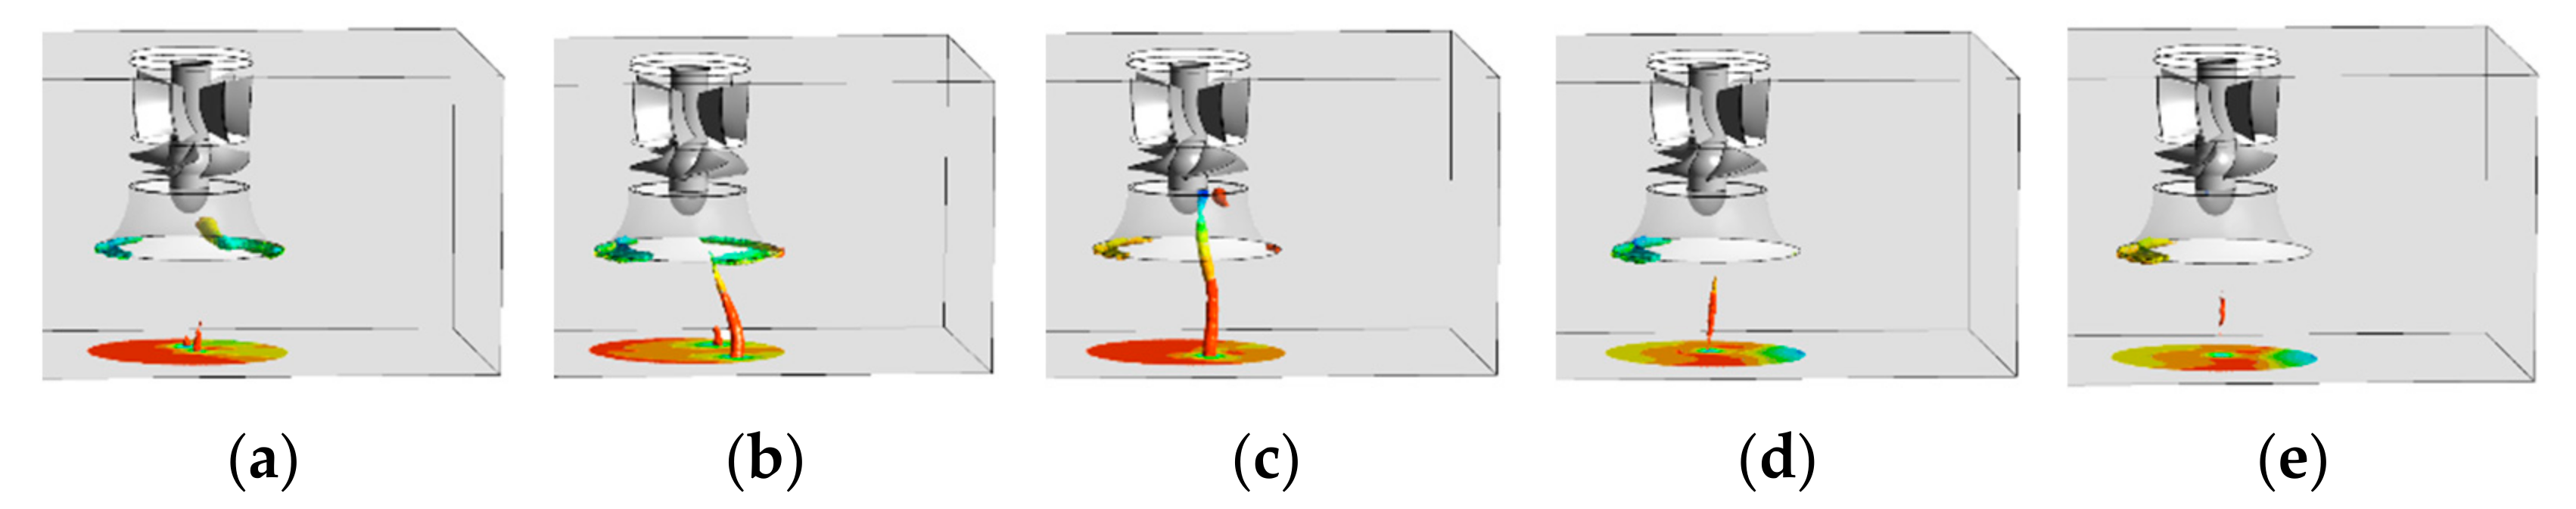
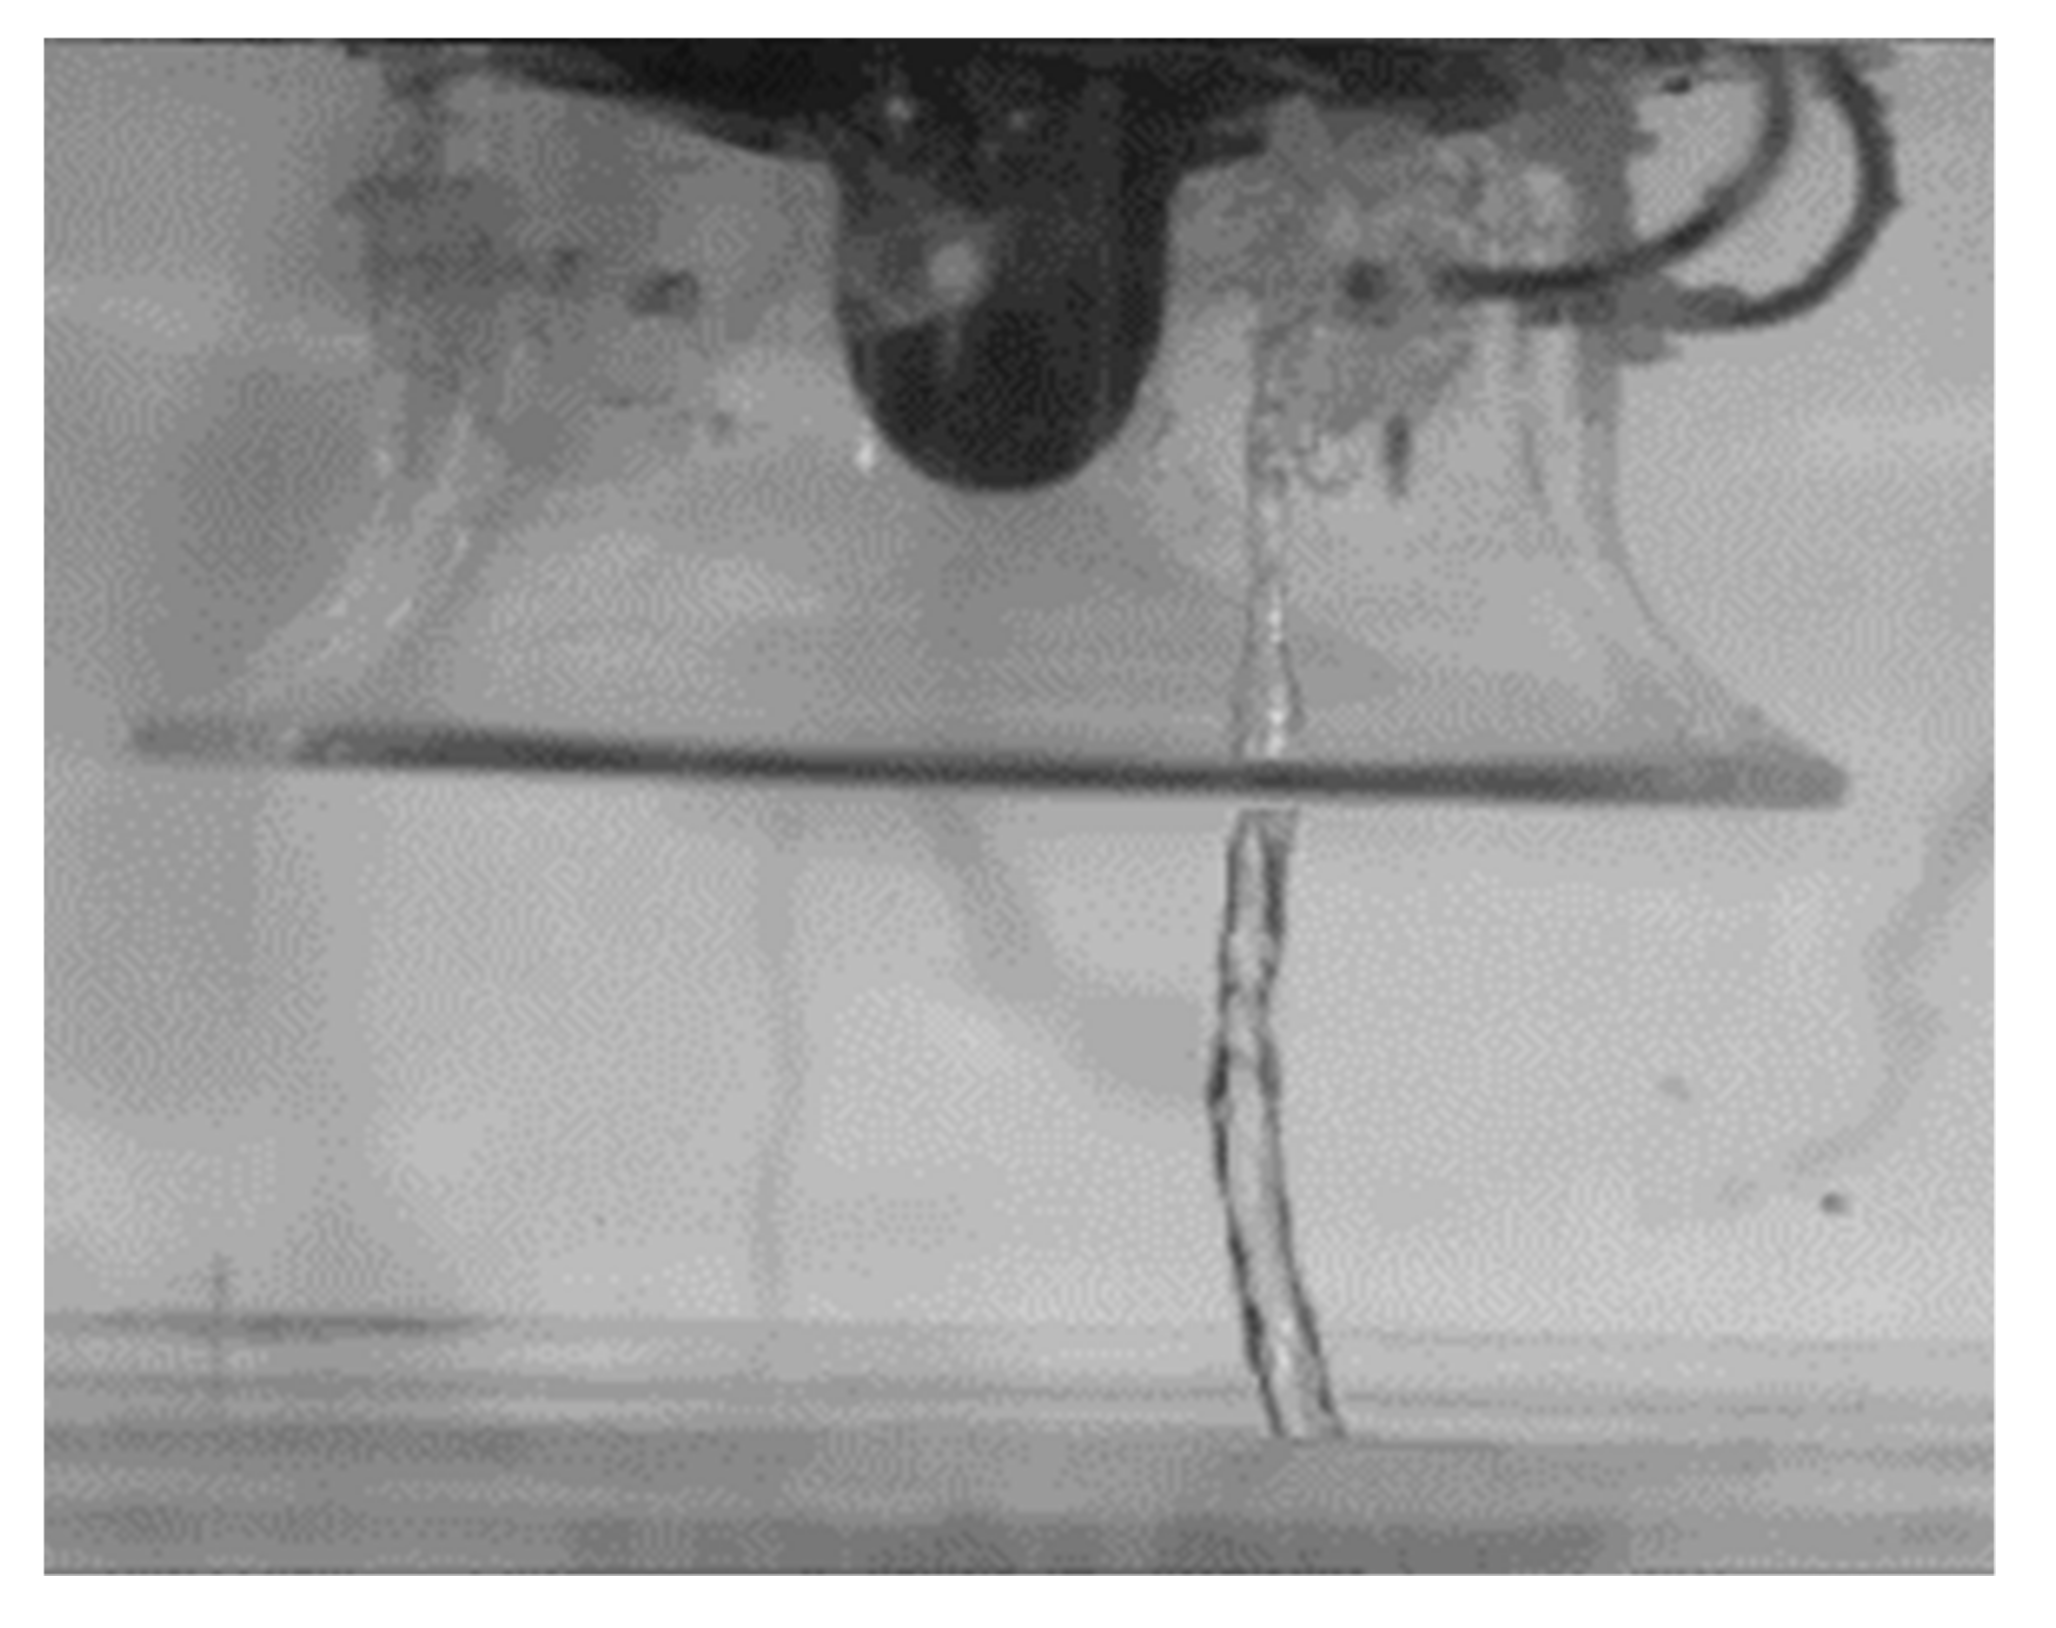
The evolution process of the FAV consisted of five stages: inception, development, continuance, collapse and disappearance [32]. Figure 6 is the experimental diagram of the FAV. The vortex’s shape obtained by the calculation are displayed by the Q criterion, as shown in Figure 7, and its shape was consistent with the vortex shape in the test, with the details introduced in the literature [31]. Figure 8 shows the physical shape of the vortex in the continuance stage.
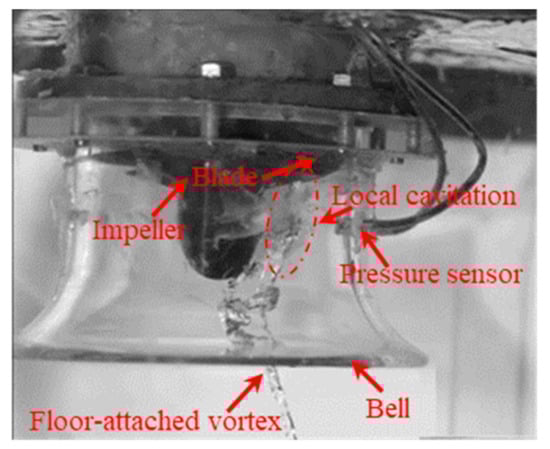
Figure 6.
Experimental diagram of the FAV.

Figure 7.
Vortex shape at different stages. (a) inception stage, (b) development stage, (c) continuance stage, (d) collapse stage, and (e)disappearance stage.

Figure 8.
Physical vortex in the continuance stage.
3.2. Spatial Variation of Pressure Distribution in the Vortex Area
The spatial distribution of pressure in the vortex area of the inlet pool at different times is shown in Figure 9. The vortex was located in a low-pressure area, which was surrounded by a high-pressure area. In the inception stage (t0 = 1.03 s), the pressure distribution in the vortex zone appeared in pairs, concentrated in the center under the bell. In the early development stage (t1 = 1.33 s), the two low-pressure areas gradually merged and intersected, which means that the two vortices had merged and the low-pressure areas continued to expand, further verifying that the FAV was a double vortex in the early stage. In the later development stage (1.63 s), the double low-pressure areas in the vortex area merged into a single low-pressure area. The low-pressure range in the vortex core reached the maximum in the continuance stage, which decreased rapidly due to the continuous development of the vortex which was disturbed by the impeller blades in the collapse stage. In the disappearing phase, the low-pressure area in the vortex core completely disappeared. The pressure distribution in the vortex area was consistent with the vortex shape.
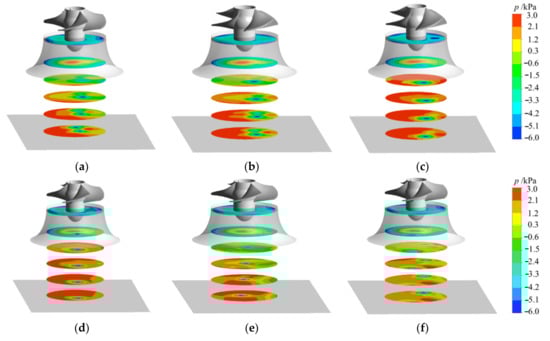
Figure 9.
Pressure distribution at different moments and positions. (a) t0 = 1.03 s, (b) t1 = 1.33 s, (c) t2 = 1.63 s, (d) t3 = 1.98 s, (e) t4 = 2.14 s, and (f) t4 = 2.38 s.
3.3. Instantaneous Change of Vortex Core Pressure
- (1)
- Temporal change characteristics of pressure in a vortex core
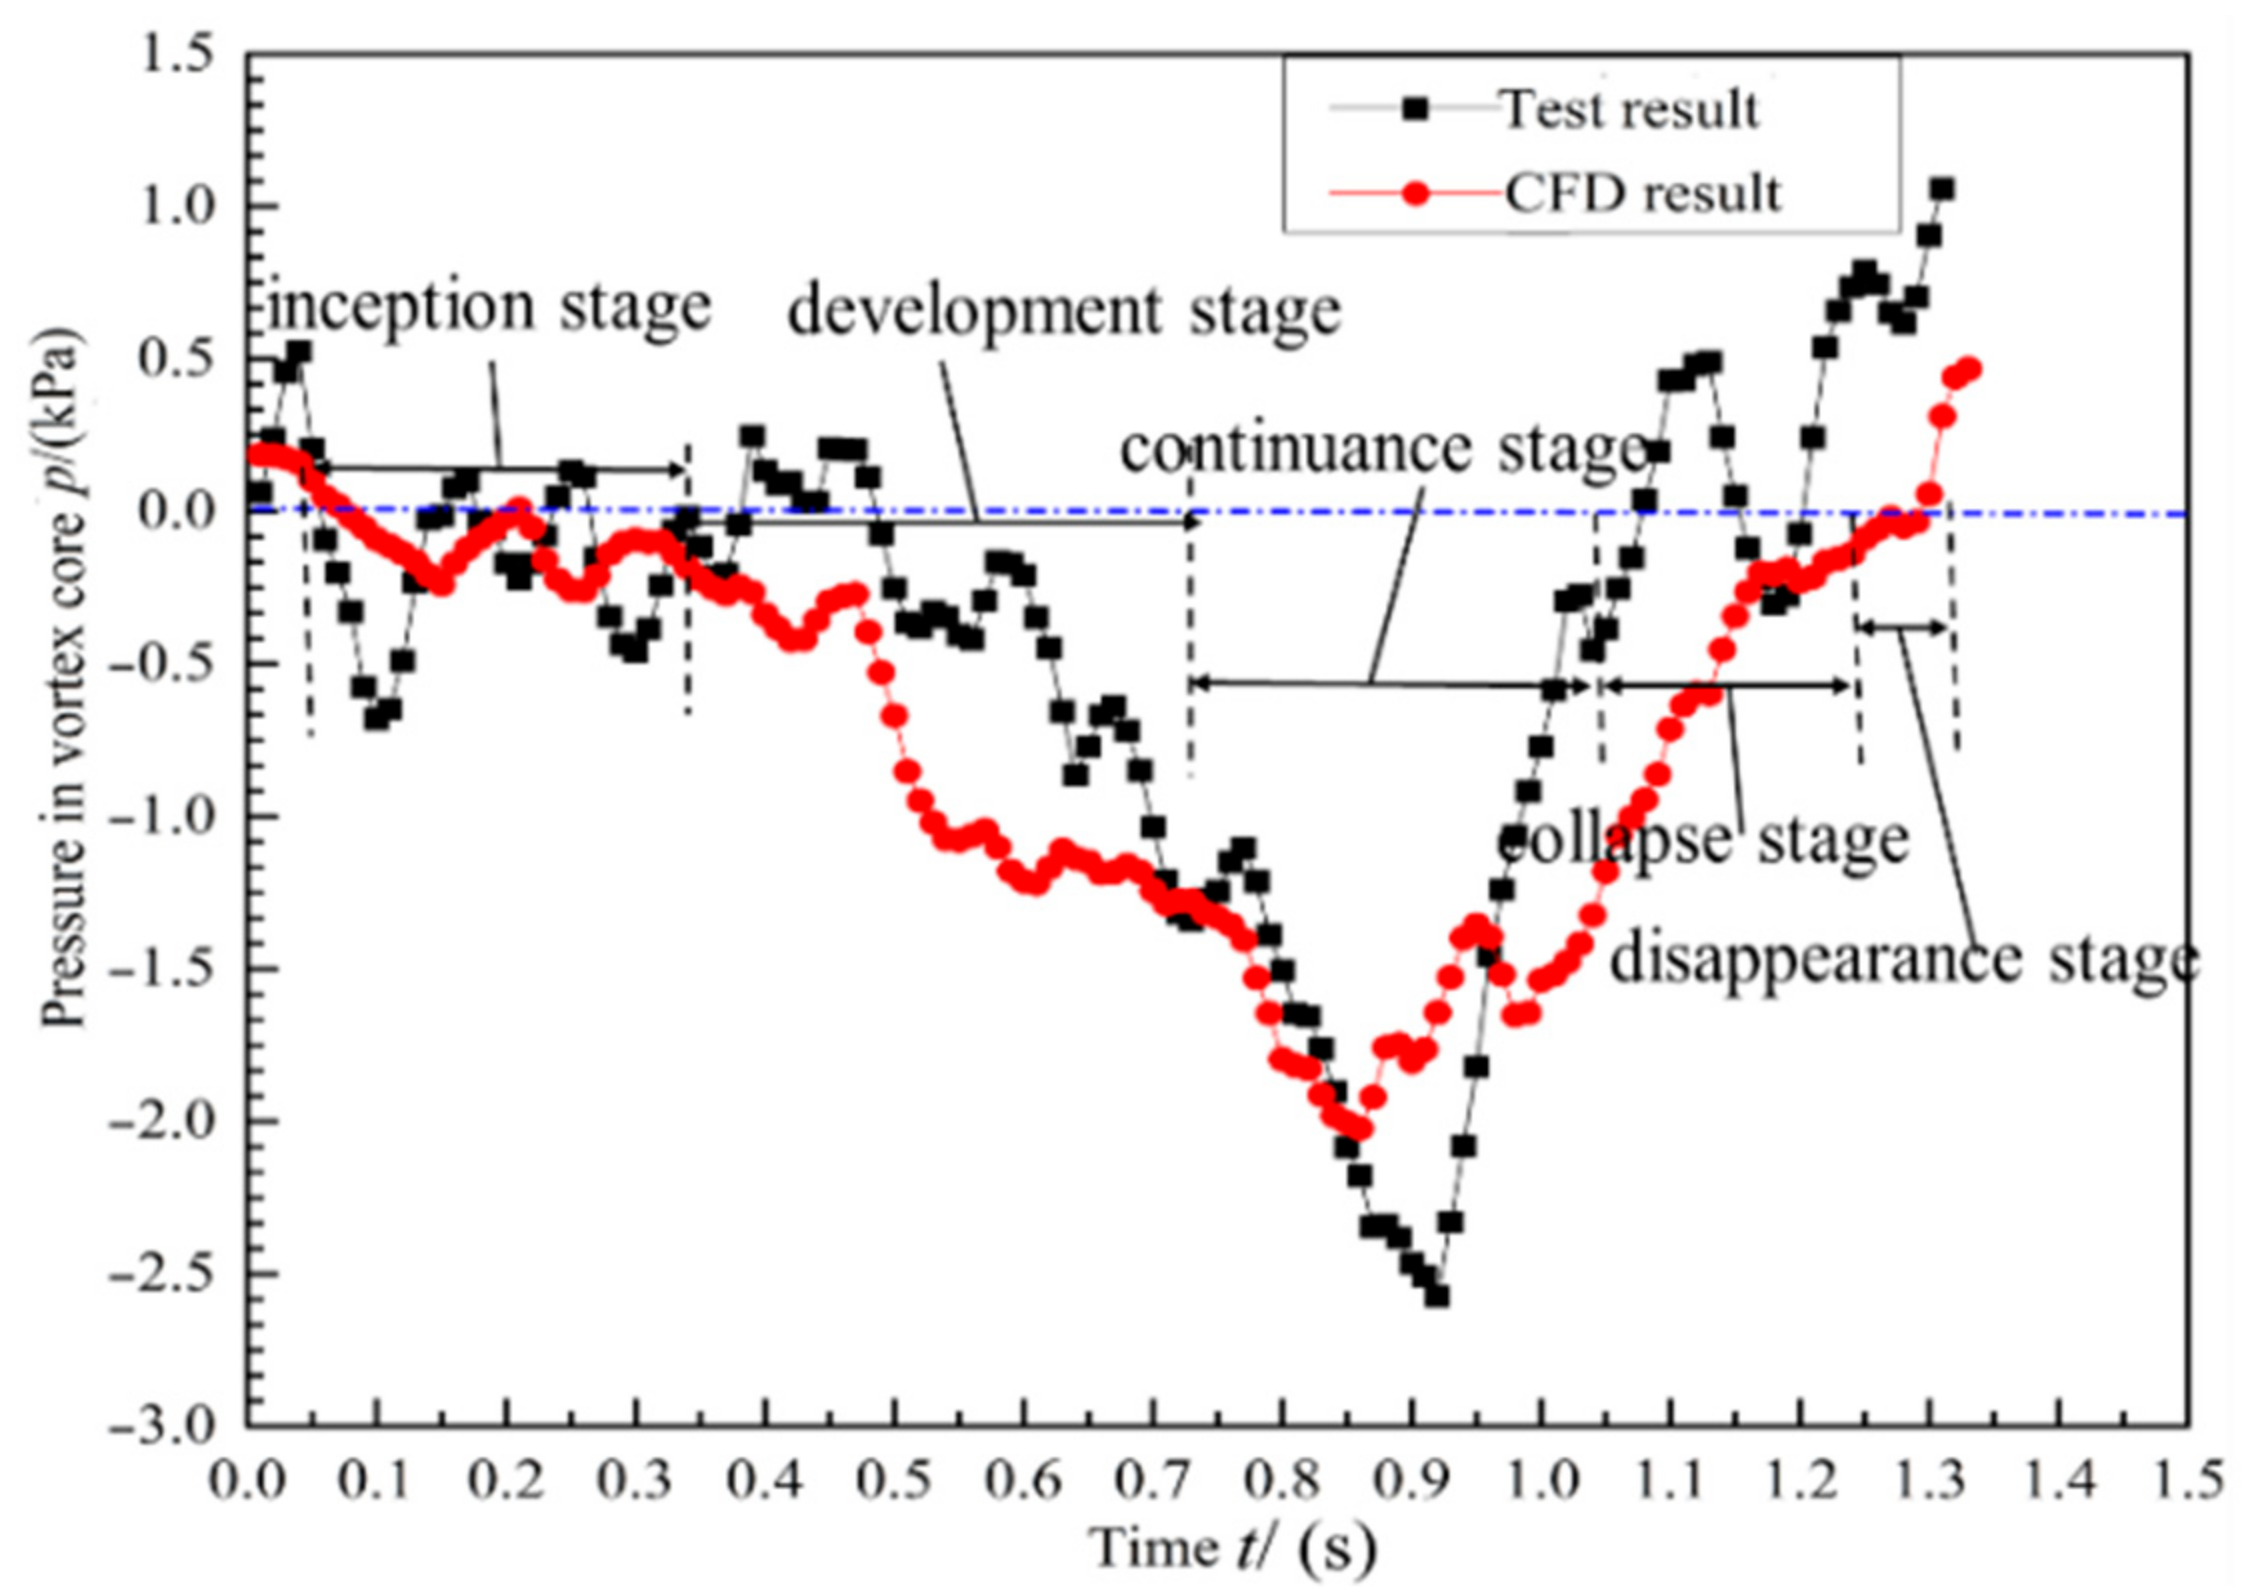
The pressure variation curves in the vortex core during a single evolution cycle from inception to disappearance obtained by the pressure experimental results and CFD results are shown in Figure 10. On the whole, the changing trend of the pressure in the core area of the FAV was at first slowly decreasing and then increasing rapidly, which could also indicate that the time of the FAV formation was longer than that of the collapse and disappearance. The pressure at the vortex core fluctuated continuously over time. At 0.15 s, the lowest pressure in the core area of the FAV dropped to negative pressure, and the vortex tube could be seen on the experimental site at this time, when the lowest pressure in the core area of the FAV decreased to −0.85 kPa. The gas around the FAV continuously entered the vortex tube due to the pressure difference between the inside and outside of the vortex tube wall in this stage. In the continuance stage (0.8 s–1.0 s), the lowest pressure in the vortex core was maintained between −2.0 kPa and −2.5 kPa. The pressure inside the core did not reach the vaporization pressure, which means that the gas inside the FAV was not produced by vaporization but was mainly caused by gas released from the water. In the collapse stage, the water entered the vortex tube due to the vortex rupture, and the pressure in the vortex core increased rapidly. At the end of the collapse stage, the pressure in the vortex core increased from a negative pressure to a positive pressure. After the vortex disappeared, the pressure fluctuated periodically and stably.
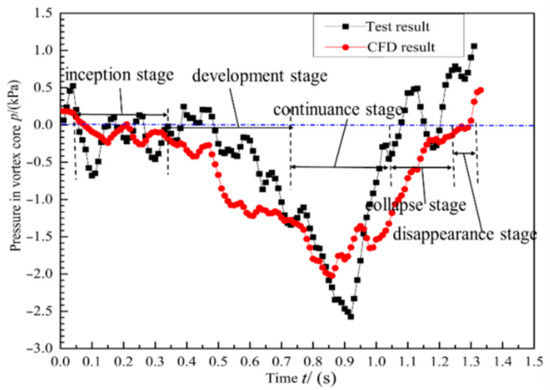
Figure 10.
The curve of the pressure over time at the vortex core of the 10 mm section above the bottom of the pump sump.
- (2)
- Spatial variation characteristics of the pressure in the vortex core
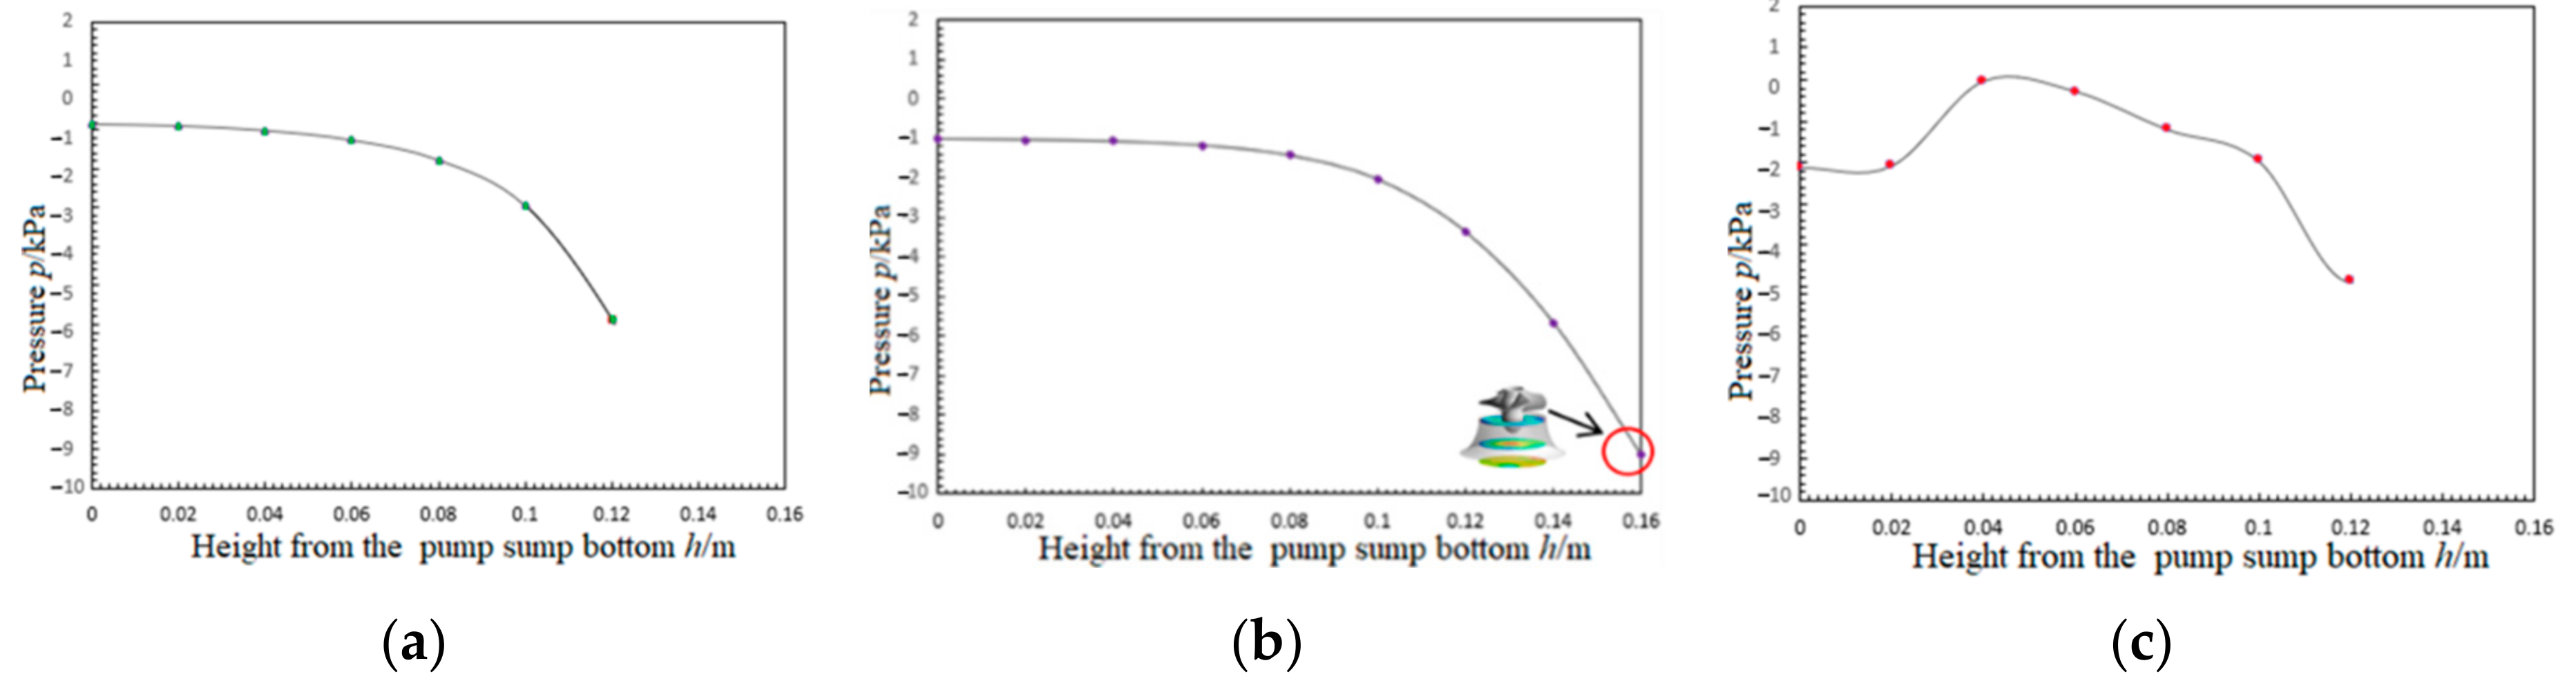
According to the previous analysis, the development stage, the continuance stage and the collapse stage were the most typical stages, which had a serious impact on the pump device in these three stages. The pressure in the vortex core along the developing direction at three moments, 1.33 s, 1.63 s and 2.23 s, respectively, were analyzed, as shown in Figure 11. The three moments were in the development stage, the continuance stage and the collapse stage, respectively. In the development stage, the pressure in the vortex core of the FAV decreased with the increase of the height from the bottom of the pump sump, and the decrease range was very small, within 0.08 m, and decreased rapidly in the range of 0.08–0.14 m. In the continuance stage, the pressure in the vortex core decreased with the height from the bottom of the pump sump, and decreased slightly within 0.1 m, and then decreased rapidly after 0.1 m. This is because the distance from the bell mouth to the bottom of the pump sump was 0.084 m. When the FAV entered the bell, the pressure inside the bell dropped sharply under the influence of the rotation of the impeller, and the closer to the impeller inlet, the greater the drop. In the collapse stage, the pressure in the vortex core showed a certain fluctuation at different heights.
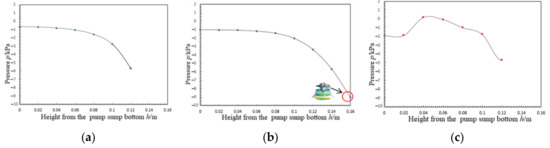
Figure 11.
Spatial variation curve of pressure in the vortex center at different moments. (a) t = 1.33 s, (b) t = 1.63 s, and (c) t = 2.23 s.
- (3)
- Pressure variation with vortex core radius in the vortex core
The pressure in the vortex core with the radius of the vortex core at two sections of Case A and Case B in the continuance stage were analyzed, as shown in Figure 12. The two cross-sections of Case A and Case B, respectively, were 5 mm and 15 mm from the bottom of the pump sump. The pressure in the center of the vortex core along the vortex core radius in the two sections was consistent, and both gradually increased with the radius of the vortex core. The pressure in the vortex core increased gradually with the radius of the vortex core from 3 mm to 5 mm, and remained stable outside 10 mm. The pressure difference caused gas to separate out of the water into the vortex tube.
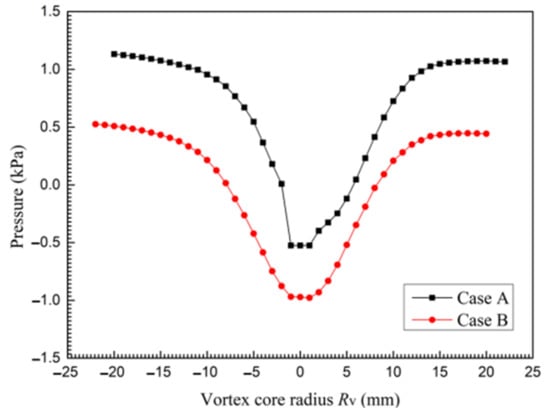
Figure 12.
Variation curve of the pressure in the vortex core with the radius of the vortex core.
3.4. Pressure Gradient Characteristics in the Vortex Zone
The previous two sections show that the pressure spatiotemporal difference in the vortex area was very large, indicating that there was a certain pressure gradient. In this section, the spatiotemporal evolution of the pressure gradient in the vortex area is analyzed. The definition formula of the pressure gradient is as follows [34]:
where τp is the pressure gradient, p is the pressure surrounding the FAV, and s is the area.
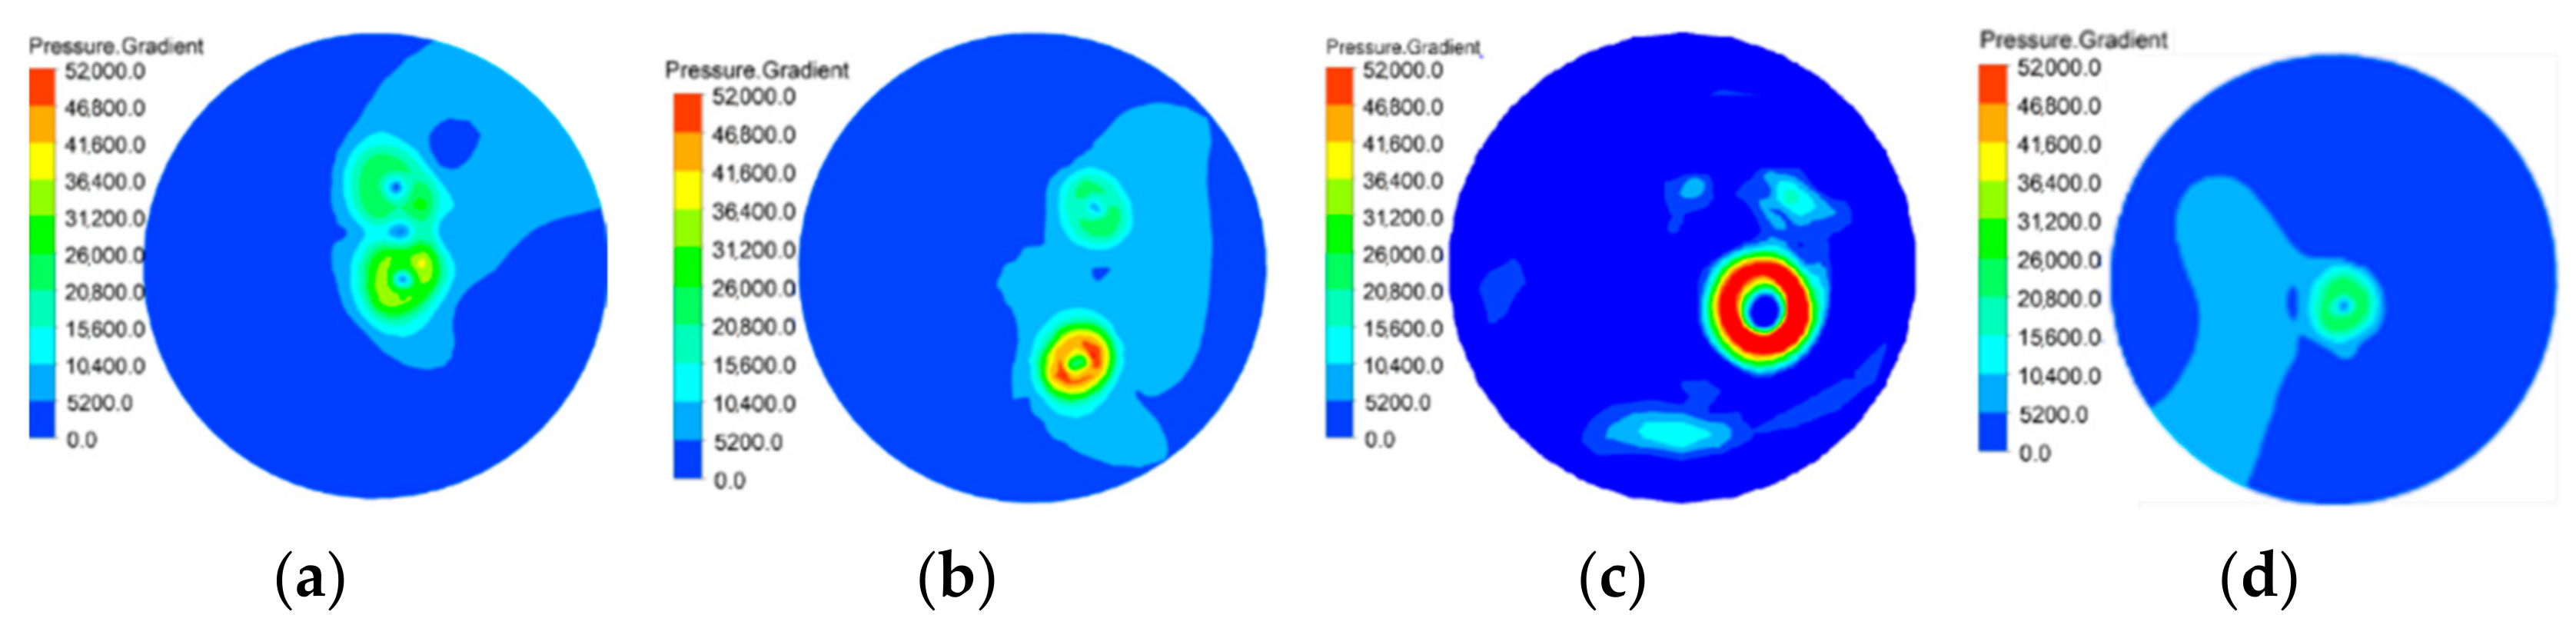
The instantaneous pressure gradient distributions (PGDS) in the vortex area at different stages were analyzed at the section 5 mm from the bottom of the pump sump, as shown in Figure 13. The pressure gradient distribution (PGD) in the vortex area presented the form of a double vortex at the inception stage (see in Figure 13a). In the development stage, the vortex tube of the FAV began to form, and the flow inside of the vortex tube was still in a state of gas–liquid mixing, while the pressure gradient outside the vortex tube was greater than that inside the vortex tube, and the PGDS of the vortex pair evolved into a strong and a weak annular PGD (see Figure 13b). In the continuance stage, the two annular PGDS evolved into a single PGD that in the vortex core was very small, close to 0 (see Figure 13c). This is because the vortex tube was full of gas in this stage, with no big pressure difference between the gases. In the collapse stage, with the vortex tube rupturing, the water entered the vortex tube, the fluid inside the vortex tube became a gas–liquid mixed state. The annular pressure gradient around the vortex tube decreased (see Figure 13d).
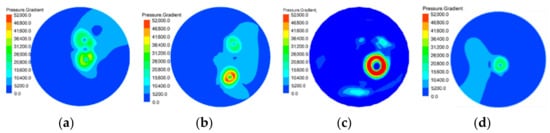
Figure 13.
Pressure gradient distribution in the vortex area at different moments. (a) t0 = 1.03 s, (b) t1 = 1.33 s, (c) t2 = 1.63 s, and (d) t3 = 1.9.
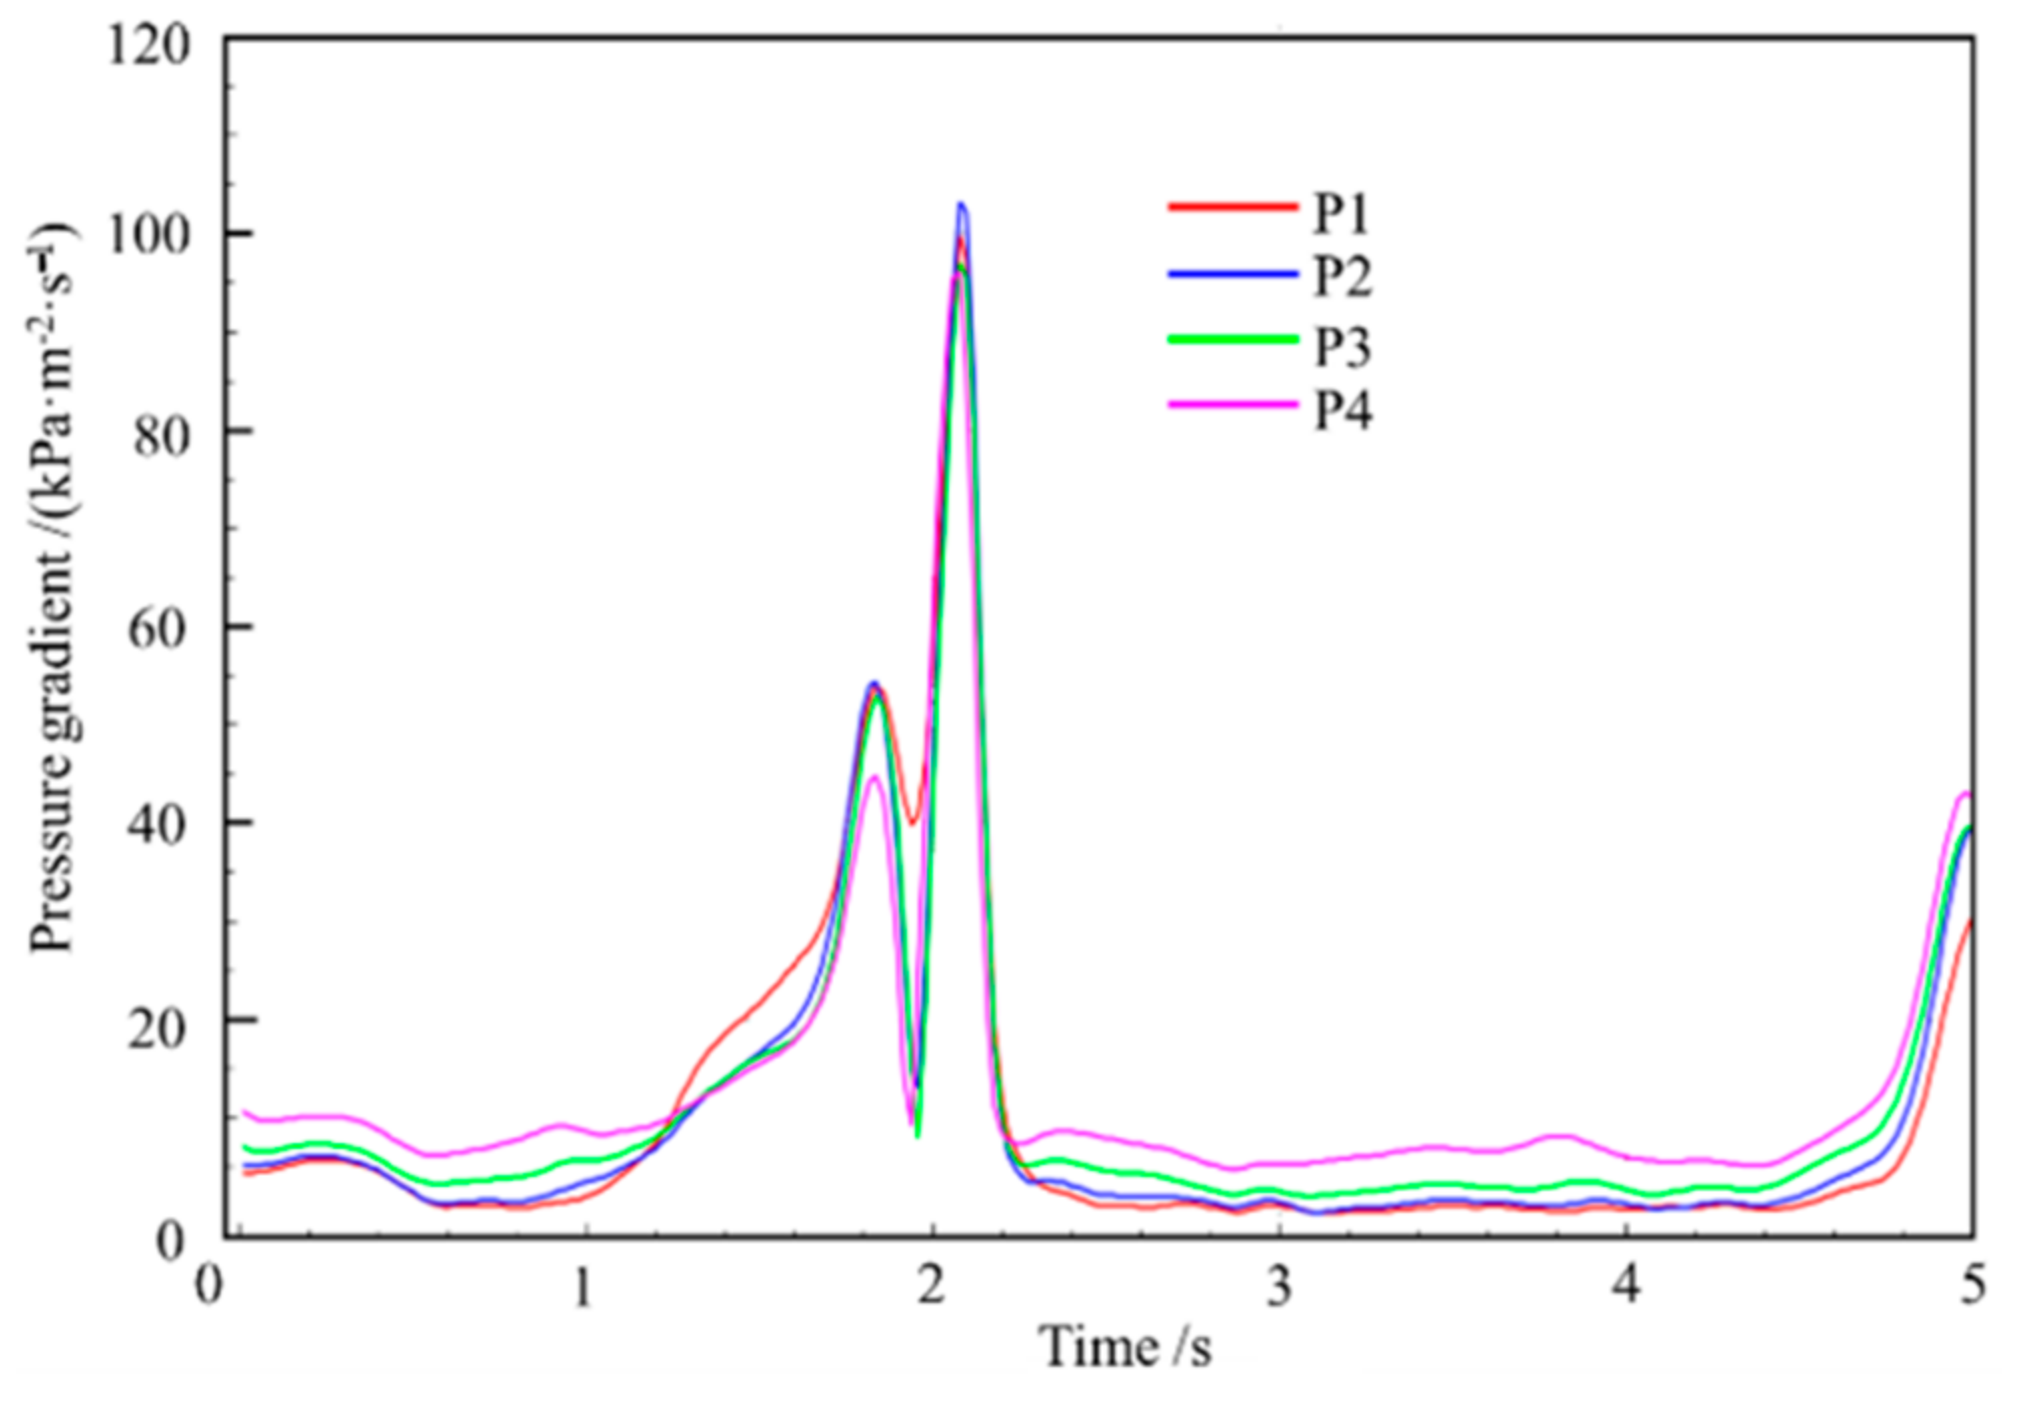
Figure 14 shows the pressure gradient intensity over time during the evolution process of the FAV at the monitoring points P1, P2, P3, and P4, which were set at the vortex core center at the height of 5 mm, 20 mm, 35 mm and 50 mm, respectively, from the bottom of the pump sump. The pressure gradients of the four monitoring points at different heights had the same change trend over time. In the inception stage of the FAV, the pressure gradient in the vortex area increased slowly. In the early stage of development, the pressure gradient intensity in the vortex core increased rapidly over time. In the middle stage of the development, the pressure gradient in the vortex core fluctuated, which may be due to the instability in the process of the FAV development, and then the intensity of the pressure gradient in the core continued to increase. In the continuance stage, the pressure gradient intensity reached the maximum. In the collapse stage, the pressure gradient in the vortex core decreased rapidly, and in the disappearance stage, the pressure gradient in the vortex zone disappeared.
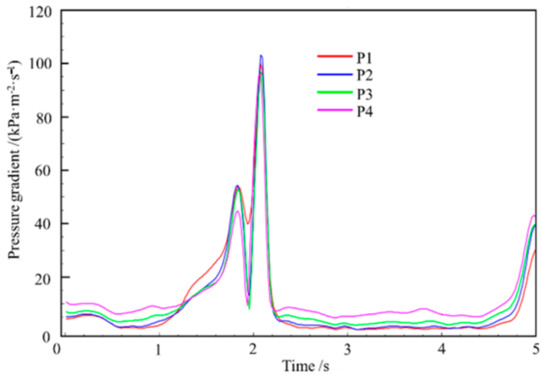
Figure 14.
Pressure gradients at different heights of the vortex core center over time.
3.5. Influence of the FAV on Pump Units
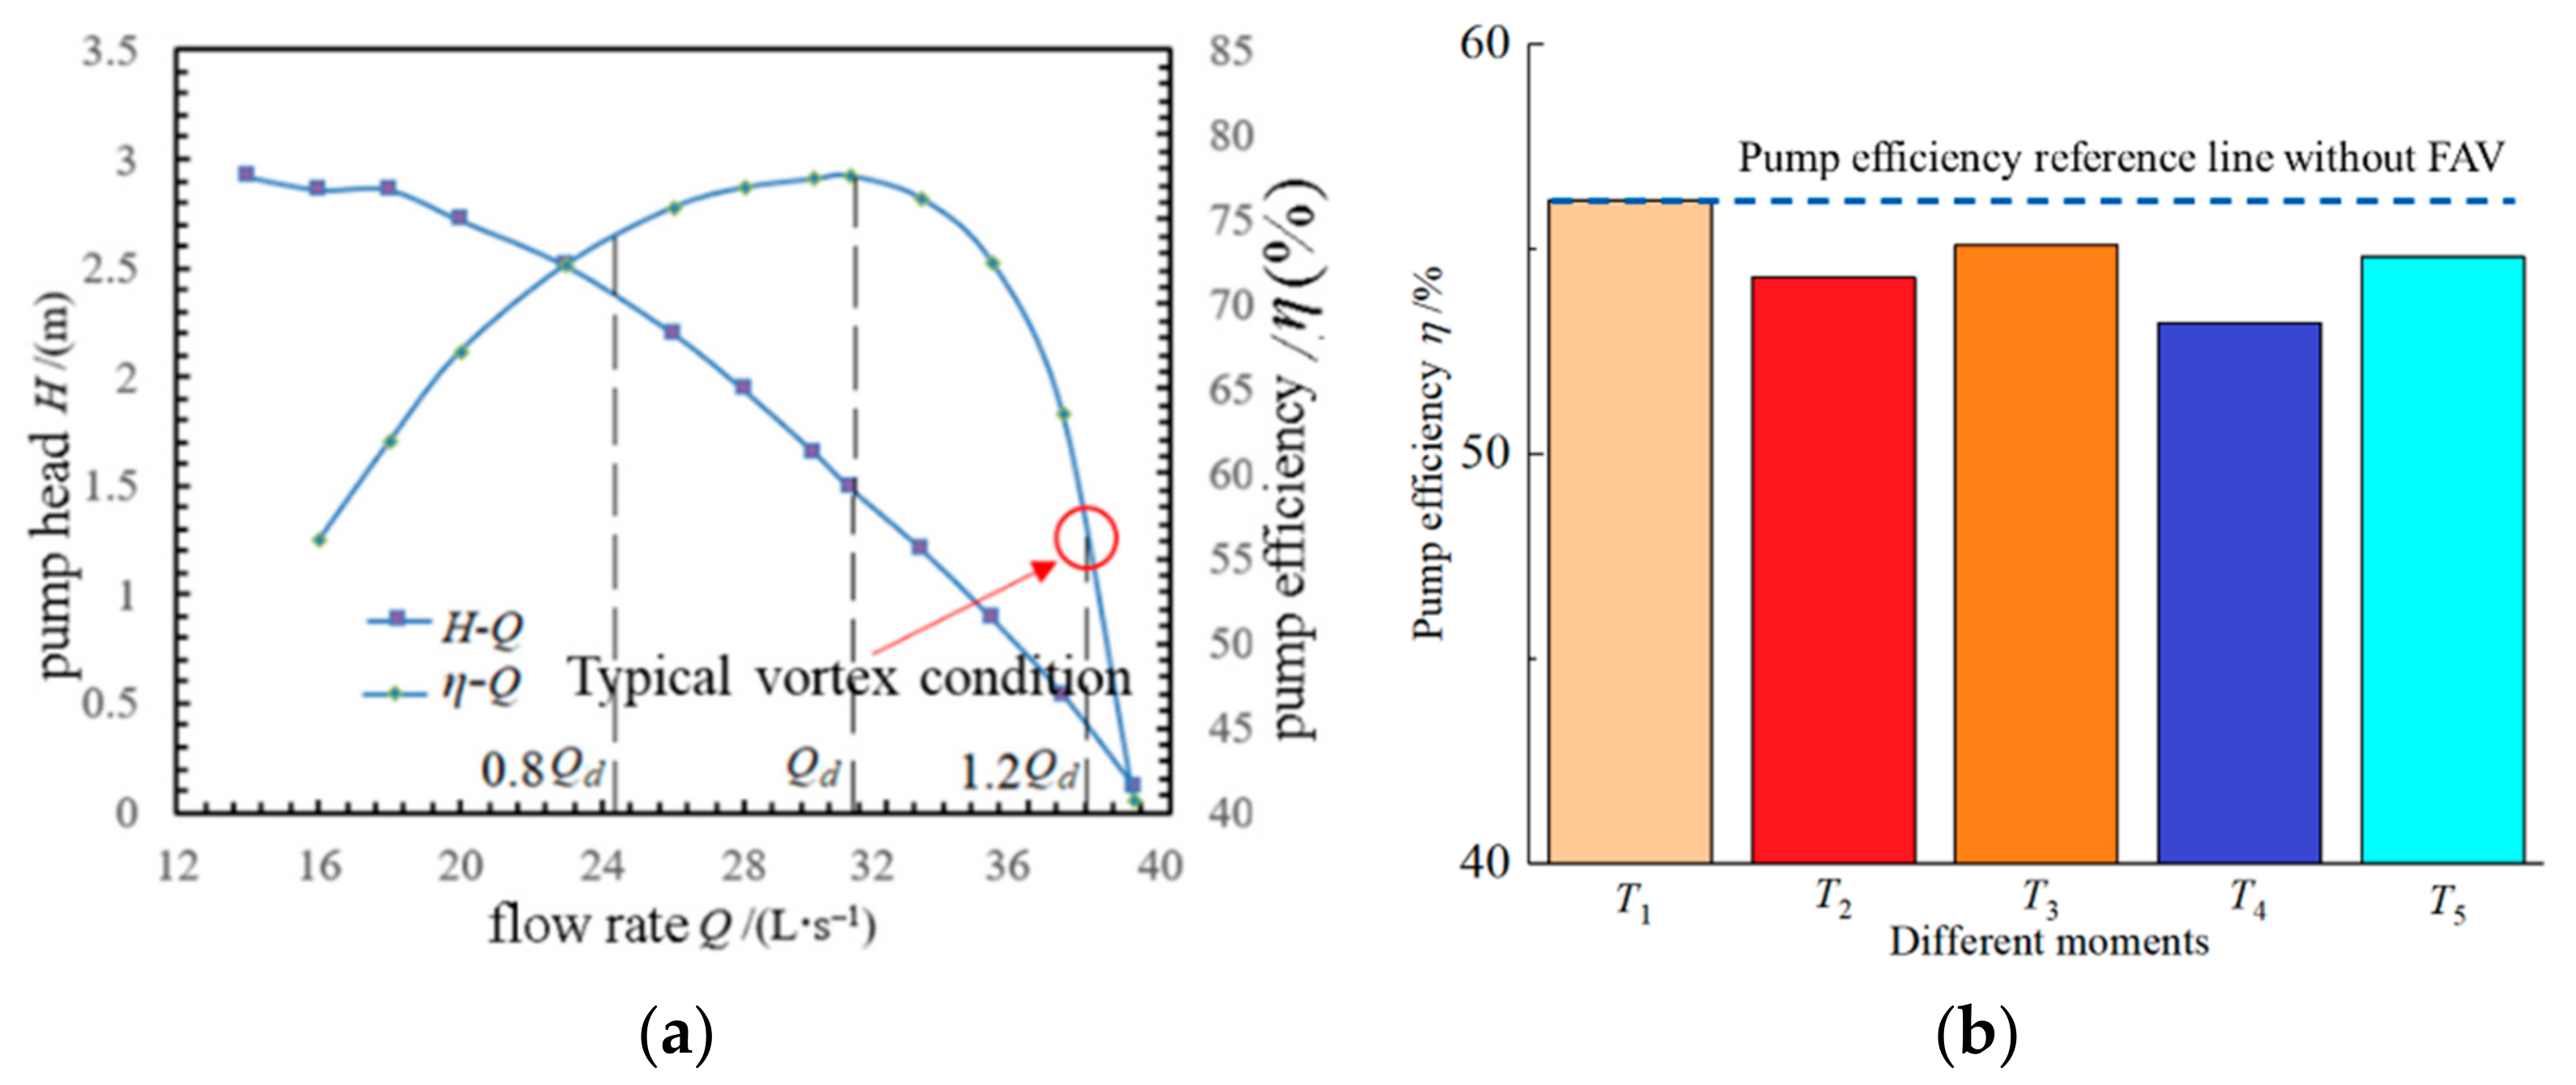
To further explore the influence of the FAV on the performance of the pump unit, the energy characteristics and pressure of the impeller inlet were analyzed from the model experiment results. The pressure sensor was installed in the vortex area in front of the impeller inlet, as seen in Figure 8. Figure 15 shows the influence data of the vortex on pump performance monitored under large flow conditions of 1.2Qd. Figure 16 shows the instantaneous pressure change curve at the impeller inlet with and without the FAV. Figure 8 clearly shows that the FAV touched the impeller blade, and the pressure sensor could directly measure the pressure in the vortex area. In Figure 15b, the efficiency at T1 was that under the flow rate condition without the FAV, and the efficiency at T2, T3, T4 and T5 are that under the flow rate condition with the FAV. The blue line is the reference line of pump efficiency without a vortex. The efficiency with the FAV was lower than that without the FAV. When there was no FAV, the pressure at the impeller inlet changed steadily with time, and the overall relative pressure was maintained between—48 kPa and −78 kPa, as seen in Figure 16a. When there was an FAV, the pressure presented an unstable change, and the greater the vortex intensity, the greater the pressure fluctuation. The pressure dropped to the lowest between 3.6 s and 5.1 s, and the lowest pressure was close to −90 kPa, as seen in Figure 16b. This pressure had reached the vaporization pressure. The experimental measurement results show that there was a local cavitation in front of the impeller, as in Figure 8.
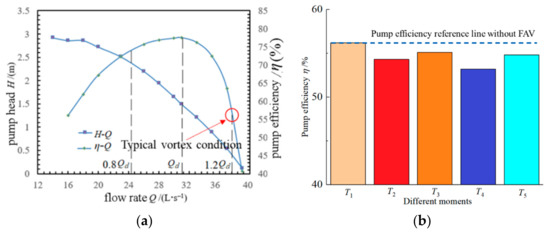
Figure 15.
Analysis of the influence of the vortex on energy performance of the water pump. (a) Pump performance curve and (b) pump efficiency change.
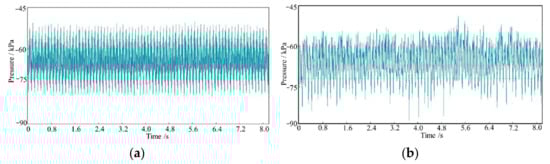
Figure 16.
The change curve of instantaneous pressure at the impeller inlet. (a) With FAV and (b) without FAV.
4. Discussion
The vortices in a pump sump are a complex gas–liquid two-phase flow, which is harmful to the pump unit. A free surface vortex is the most harmful to the unit, which has always been the focus of research. Some researchers have pointed out that in the centrifugal pump pumping station, when 1% of the air volume enters the centrifugal pump, the efficiency of the centrifugal pump will be reduced by 15%, and when 10% of the air volume enters the centrifugal pump, the water absorption will decrease, and the centrifugal pump will produce a severe vibration [35,36,37]. The floor-attached vortex is a submerged vortex, and its harm to the unit is not as obvious as the surface vortex. This is because it is difficult to observe the floor-attached vortex underwater and is not as easy to eliminate as a surface vortex; however, many cases have proved that a floor-attached vortex is also harmful to the unit.
Previous studies on the harm of a vortex unit and the characteristics of a vortex provided good guidance for this research. This paper analyzes the harm of a FAV to the unit from the perspective of the vortex pressure field; however, it was still difficult to explain some phenomenons, such as whether the air in the vortex tube is caused by cavitation. Through the experimental measurement and numerical simulation in this paper, it can be observed that there is a gas core when there is no cavitation in the vortex tube, as Figure 7a and Figure 11a show. Interestingly, when the floor-attached vortex is in the continuance stage, the pressure in the vortex core drops to near the vaporization pressure, which can lead to the local cavitation of the flow field, as Figure 11c,d shows. Although there are various numerical simulation methods, these methods need to be improved. For example, in the experiment, it was found that the vortex was an obvious vortex tube, but in the numerical simulation it was difficult to accurately capture the same vortex tube as the experiment, which mainly lies within the current vortex criterion.
The harm of the FAV to the unit is mainly that it can reduce the pump’s operation efficiency [30,31,32]. Due to the vortex core having a negative pressure area, when the negative pressure of the vortex tube is around the level of vaporization pressure, a local cavity could occur due to the effect of an unsteady flow at the impeller inlet. Moreover, the occurrence of a vortex would induce pressure pulsation in the unit and the pressure pulsation induced by the vortex would mainly include the pressure pulsation induced by a vortex rotation flow field and that induced by vortex sweeping [32,33]. This sweeping frequency is low frequency and the pressure pulsation induced by the vortex rotation is relatively regular and changes in a trigonometric function over time.
Some studies have also been undertaken on the floor-attached vortices. The main research methods have included experiments and numerical simulation. Experiments can directly obtain the flow field characteristics, but they also have some limitations. At present, the spatial three-dimensional velocity field can be measured by V3V measurement [30]; however, there has been no non-interference measurement technology to measure the spatial pressure field up to now. Generally, it is a common method to install a sensor on the wall to measure the pressure and the 20 pressure sensors at the bottom of the pump sump to measure the pressure in the vortex area used by the authors, provided a reference for the reliability of the numerical simulation results in this paper. It can be said that the combination of a model test and numerical simulation provided good technical support for the accurate prediction of the prototype pump’s performance.
5. Conclusions
- The spatiotemporal evolution characteristics of pressure in the process of the FAV evolution were analyzed. The pressure distributions in the vortex area show that the FAV was located at the low-pressure area, and double vortices appeared in the inception stage. In the early development stage, the two low-pressure areas gradually merged and intersected, which means that the two vortices had merged and the low-pressure areas continued to expand. In the later development stage (t = 1.63 s), the double low-pressure areas in the vortex area merged into a single low-pressure area.
- The changing trend of the pressure in the core area of the FAV first slowly decreased and then increased rapidly, which can also indicate that the time of the FAV formation and development was longer than that of the collapse and disappearance. The pressure in the vortex core gradually increased with the radius of the vortex core. The pressure in the core kept decreasing and increasing with time, and was the lowest in the continuance stage. The evolution of the FAV was accompanied by a change of pressure gradient. The pressure gradient in the non-central area of the vortex core was the largest, while that in the central area of the vortex core was extremely small.
- The harm of the FAV to the unit is mainly that it can reduce pump operation efficiency. When there is no vortex, the pressure of the impeller inlet changes stably with time. But that fluctuates unsteadily over time when the FAV exists at the impeller. Due to the vortex core having a negative pressure area, when the negative pressure of the vortex tube is around the vaporization pressure level in the continuance stage, it can cause a local cavitation at the impeller.
Note, in the present work, combined with experiments and numerical simulation, the pressure characteristics of a vortex and its harm to the unit were explored. In the future, we will continue to modify the theoretical model and deeply explore the impact of vortices on the performance of the unit.
Author Contributions
Data curation, software, writing—original draft and preparation, X.S.; validation, formal analysis, investigation, and resources, C.L.; writing—review and editing, Z.W. All authors have read and agreed to the published version of the manuscript.
Funding
This work was supported by the joint open fund of Tsinghua University Ningxia Yinchuan Water Network Digital Water Control Joint Research Institute (sklhse-2021-Iow10), and the National Natural Science Foundation of China (51876099, 51279173).
Institutional Review Board Statement
Not applicable.
Informed Consent Statement
Not applicable.
Data Availability Statement
Not applicable.
Conflicts of Interest
The authors declare no conflict of interest.
References
- Anup, K.C.; Young, H.L.; Bhola, T. CFD study on prediction of vortex shedding in draft tube of francis turbine and vortex control techniques. Renew. Energy 2016, 86, 1406–1421. [Google Scholar]
- Kan, K.; Yang, Z.; Lyu, P.; Zheng, Y.; Shen, L. Numerical study of turbulent flow past a rotating axial-flow pump based on a level-set immersed boundary method. Renew. Energy 2021, 168, 960–971. [Google Scholar] [CrossRef]
- Yu, H.D.; Wang, Y.Q. Liutex-based vortex dynamics: A preliminary study. J. Hydrodyn. 2020, 32, 1217–1220. [Google Scholar] [CrossRef]
- Liu, C.; Gao, Y.S.; Dong, X.R.; Wang, Y.Q.; Liu, J.M.; Zhang, Y.N.; Cai, X.S.; Gui, N. Third generation of vortex identification methods: Omega and Liutex/Rortex based systems. J. Hydrodyn. 2019, 31, 205–223. [Google Scholar] [CrossRef]
- Zhao, M.S.; Zhao, W.W.; Wan, D.C. Numerical simulations of propeller cavitation flows based on Open Foam. J. Hydrodyn. 2020, 32, 1071–1079. [Google Scholar] [CrossRef]
- Norizan, R.E.; Harun, Z. Enhancement of vorticity reduction by floor splitter in pump sump to improve pump efficiency. Sustain. Energy Technol. Assess. 2018, 26, 28–37. [Google Scholar] [CrossRef]
- Ansar, M.; Tatsuaki, N.; George, C. Numerical simulations of inviscid three-dimensional flows at single- and dual-pump intakes. J. Hydraul. Res. 2002, 40, 461–470. [Google Scholar] [CrossRef]
- Dong, X.; Dong, G.; Liu, C. Study on vorticity structures in late flow transition. Phys. Fluids 2018, 30, 104–108. [Google Scholar] [CrossRef] [Green Version]
- Nahale, S.; Reza, M.; Michel, J.C. Investigation of rotating vortex rope formation during load variation in a francis turbine draft tube. Renew. Energy 2020, 151, 238–254. [Google Scholar]
- Constantinescu, G.S.; Patel, V.C. Numerical model for simulation of pump-intake flow and vortices. J. Hydraul. Eng. 2008, 24, 123–134. [Google Scholar] [CrossRef]
- Monshizadeh, M.; Tahershamsi, A.; Rahimzadeh, D. Comparison between hydraulic and structural based anti-vortex methods at intakes. Eur. Phys. J. Plus 2017, 132, 291–302. [Google Scholar] [CrossRef]
- Rajendran, V.P.; Patel, V.C. Measurement of vortices in model pump-intake bay by PIV. J. Hydraul. Eng. 2000, 126, 322–334. [Google Scholar] [CrossRef]
- Duinmeijera, S.P.; Moreno, R.A.; Antonio, M. A simple measuring set-up for the experimental determination of the dynamics of a large particle in the 3D velocity field around a free surface vortex. Flow Meas. Instrum. 2019, 65, 52–64. [Google Scholar] [CrossRef]
- Amiri, S.M.; Zarrati, A.R.; Roshan, R. Surface vortex prevention at power intakes by horizontal plates. Proc. Inst. Civ. Eng.-Water Manag. 2011, 164, 193–200. [Google Scholar] [CrossRef]
- Liu, C.; Liang, H.; Jin, Y. PIV Measurements of intake flow field in axial-flow pump. Trans. Chin. Soc. Agric. Mach. 2015, 46, 33–41. [Google Scholar]
- Xu, J. Numerical Simulation and V3V Measurements on Inlet Rotation Flow of Vertical Axial-Flow Pump; Yangzhou University: Yangzhou, China, 2016. [Google Scholar]
- Gupta, R.; Kaulaskar, M.D.; Kumar, V. Studies on the understanding mechanism of air core and vortex formation in a hydro-cyclone. Chem. Eng. J. 2008, 144, 153–166. [Google Scholar] [CrossRef]
- Hite, J.E.; Mih, W.C. Velocity of air-core vortices at hydraulic intakes. J. Hydraul. Eng. ASCE 1994, 120, 284–297. [Google Scholar] [CrossRef]
- Zhu, B.; Chen, H. Analysis of the staggered and fixed cavitation phenomenon observed in centrifugal pumps employing a gap drainage impeller. J. Fluids Eng. 2017, 139, 031301. [Google Scholar] [CrossRef]
- Zhang, D.; Shi, W.; Pan, D.; Dubuisson, M. Numerical andexperimental investigation of tip leakage vortex cavitation patterns and mechanisms in an axial flow pump. Comput. Fluids 2015, 112, 61–71. [Google Scholar] [CrossRef]
- Kim, J.; Song, S.J. Measurement of temperature effects on cavitation in a turbopump inducer. J. Fluids Eng. 2016, 138, 011304. [Google Scholar] [CrossRef]
- Dutta, R.; Xing, T. Five-equation and robust three-equation method for solution verification of large eddy simulations. J. Hydrodyn. 2018, 30, 23–33. [Google Scholar] [CrossRef]
- Chen, H.X. Research on turbulent flow within the vortex pump. J. Hydrodyn. 2004, 16, 701–707. [Google Scholar]
- Jong, W.C.; Young, D.C.; Chang, G.K. Flow uniformity in a multi-intake pump sump model. J. Mech. Sci. Technol. 2010, 24, 1389–1400. [Google Scholar]
- Menter, F.R. Two-equation eddy-viscosity turbulence models for engineering applications. AIAA J. 1994, 32, 1598–1605. [Google Scholar] [CrossRef] [Green Version]
- Smirnov, P.E.; Menter, F.R. Sensitization of the SST turbulence model to rotation and curvature by applying the Spalart–Shur correction term. J. Turbomach. 2009, 131, 041010. [Google Scholar] [CrossRef]
- Yamade, Y.; Kato, C.; Nagahara, T.; Matsui, J. Suction vortices in a pump sump-their origin, formation, and dynamics. J. Fluids Eng. ASME 2020, 142, 323–331. [Google Scholar] [CrossRef]
- Huang, B.; Young, Y.L.; Wang, G.; Shyy, W. Combined experimental and computational investigation of unsteady structure of sheet/cloud cavitation. J. Fluids Eng. 2013, 135, 071301. [Google Scholar] [CrossRef]
- Škerlavaj, A.; Škerget, L.; Ravnik, J. Predicting free-surface vortices with single-phase simulations. Eng. Appl. Comput. Fluid Mech. 2014, 8, 193–210. [Google Scholar] [CrossRef] [Green Version]
- Song, X.J.; Yao, R.; Chao, L.; Wang, Z.W. Study of the formation and dynamic characteristics of the vortex in the pump sump by CFD and experiment. J. Hydrodyn. 2021, 33, 93–103. [Google Scholar] [CrossRef]
- Song, X.J.; Liu, C. Experimental study of the floor-attached vortices in pump sump using V3V. Renew. Energy 2021, 164, 752–766. [Google Scholar] [CrossRef]
- Song, X.J.; Liu, C. Experimental investigation of pressure pulsation induced by the floor-attached vortex in an axial flow pump. Adv. Mech. Eng. 2019, 11, 1–13. [Google Scholar] [CrossRef] [Green Version]
- Song, X.J.; Liu, C. Experimental investigation of floor-attached vortex effects on the pressure pulsation at the bottom of the axial flow pump sump. Renew. Energy 2020, 145, 2327–2336. [Google Scholar] [CrossRef]
- Long, N.I.; Shin, B.R.; Douw, D.H. Study on surface vortices in pump sump. J. Fluid Mach. 2012, 15, 60–66. [Google Scholar] [CrossRef]
- Pennings, P.; Westerweel, J.; Terwisga, T. Flow field measurement around vortex cavitation. Exp. Fluids 2015, 56, 206. [Google Scholar] [CrossRef] [Green Version]
- Amini, A.; Reclari, M.; Sano, T.; Iino, M.; Farhat, M. Suppressing tip vortex cavitation by winglets. Exp. Fluids 2019, 60, 159. [Google Scholar] [CrossRef]
- Sarkardeh, H.; Zarrati, A.R.; Roshan, R. Effect of intake head wall and trash rack on vortices. J. Hydraul. Res. 2010, 48, 108–112. [Google Scholar] [CrossRef] [Green Version]


Publisher’s Note: MDPI stays neutral with regard to jurisdictional claims in published maps and institutional affiliations. |
© 2022 by the authors. Licensee MDPI, Basel, Switzerland. This article is an open access article distributed under the terms and conditions of the Creative Commons Attribution (CC BY) license (https://creativecommons.org/licenses/by/4.0/).