1. Introduction
Coral reef ecosystems and the vast array of organisms they support continue to decline due to global scale stressors driven by climate change [
1,
2,
3]. In addition, coastal ecosystems suffer local pressures, such as pollution, coastal development, and overfishing [
4]. Whilst urgent climate change action on a grand scale is crucial, artificial reefs are increasing in popularity as a conservation tool used to compensate for degraded natural reef ecosystems, with increased fish production and attraction being common biological management goals [
5,
6]. Artificial reefs are also implemented to mitigate habitat damage or loss, and can help with the recolonisation of corals [
7,
8]. Furthermore, these structures are deployed for various social reasons, often to meet the demands of key stakeholders, such as tourists, fishers, and SCUBA divers in the region [
8,
9].
Artificial reefs take many forms, such as reef balls, pods, concrete pipes, wrecks, and sculptures, the latter of which have been gaining popularity over the last decade [
10,
11]. Artificial reefs naturally turn into living structures as benthic organisms begin to colonise. Planting coral fragments accelerates the natural recovery process [
12,
13]. Planting corals on underwater sculptures is an innovative method of linking art, science, tourism, and conservation. Underwater art has been used as a tool to inspire, highlight environmental issues, and drive conservation efforts [
8,
14].
Underwater artwork proposals within the Great Barrier Reef Marine Park (GBRMP) are considered artificial reefs for the purposes of the
Environment Protection (Sea Dumping) Act 1981 [
15]. The installation and operation of a facility in the GBRMP requires extensive planning, consultation, and assessment under Australian Government legislation [
15,
16].
A permit was granted to the Museum of Underwater Art by the Great Barrier Reef Marine Park Authority (GBRMPA) for installation of a facility with one of the conditions of permit G19/42006.1: “Within 20 business days of commencement of the permit, the Permit Holder must submit to the Managing Agency a plan for the following Monitoring Programs:
- i.
substrate impacts;
- ii.
ecological monitoring including coral reef health;
- iii.
social impacts including aesthetics and conflict of use; and
- iv.
marine debris management.”
The research program expanded to include coral restoration and an additional permit G20/44358.1 including condition 12: “The Permit Holder must submit a Monitoring Plan to the Great Barrier Reef Marine Park Authority for approval, that must include but is not limited to, the following:
- i.
out-planted specimen and out-planting site monitoring (including survivorship and health of out-plants);
- ii.
natural recruitment rates;
- iii.
social and aesthetic monitoring; and
- iv.
copies of forms to be used for all monitoring.”
The approved monitoring plan version 3 was updated on 26 February 2021 [
17]. This paper provides the methodology and results of baseline and annual post-installation site assessment and monitoring of the Coral Greenhouse facility at John Brewer Reef over a five-year period between 2018 and 2022 [
18,
19,
20,
21].
Tourism visitation to the Coral Greenhouse is managed according to a site management plan and condition of permits issued by the Australian Government [
22]. The Coral Greenhouse and associated sculptures are a public facility that can be accessed by all users. There are two private moorings adjacent to the site and permission to use these must be sought from the permit holder Museum of Underwater Art. In practice, there are three regular tourism operators who book daily access to private moorings and pay a fee of
$15 per vessel. Tourism visitation is between 2000–4000 people per annum.
The objectives of this research project on ecology, engineering, and aesthetics of artificial reefs were primarily undertaken to achieve legislative compliance with permit conditions issued by the Australian Government. We tested hypotheses associated with changes in fish abundance, fish diversity, invertebrate abundance, invertebrate diversity, tourist perceptions of aesthetic vales, aesthetic values associated with coral transplantation, and survivorship of transplanted corals.
2. Materials and Methods
2.1. Study Site
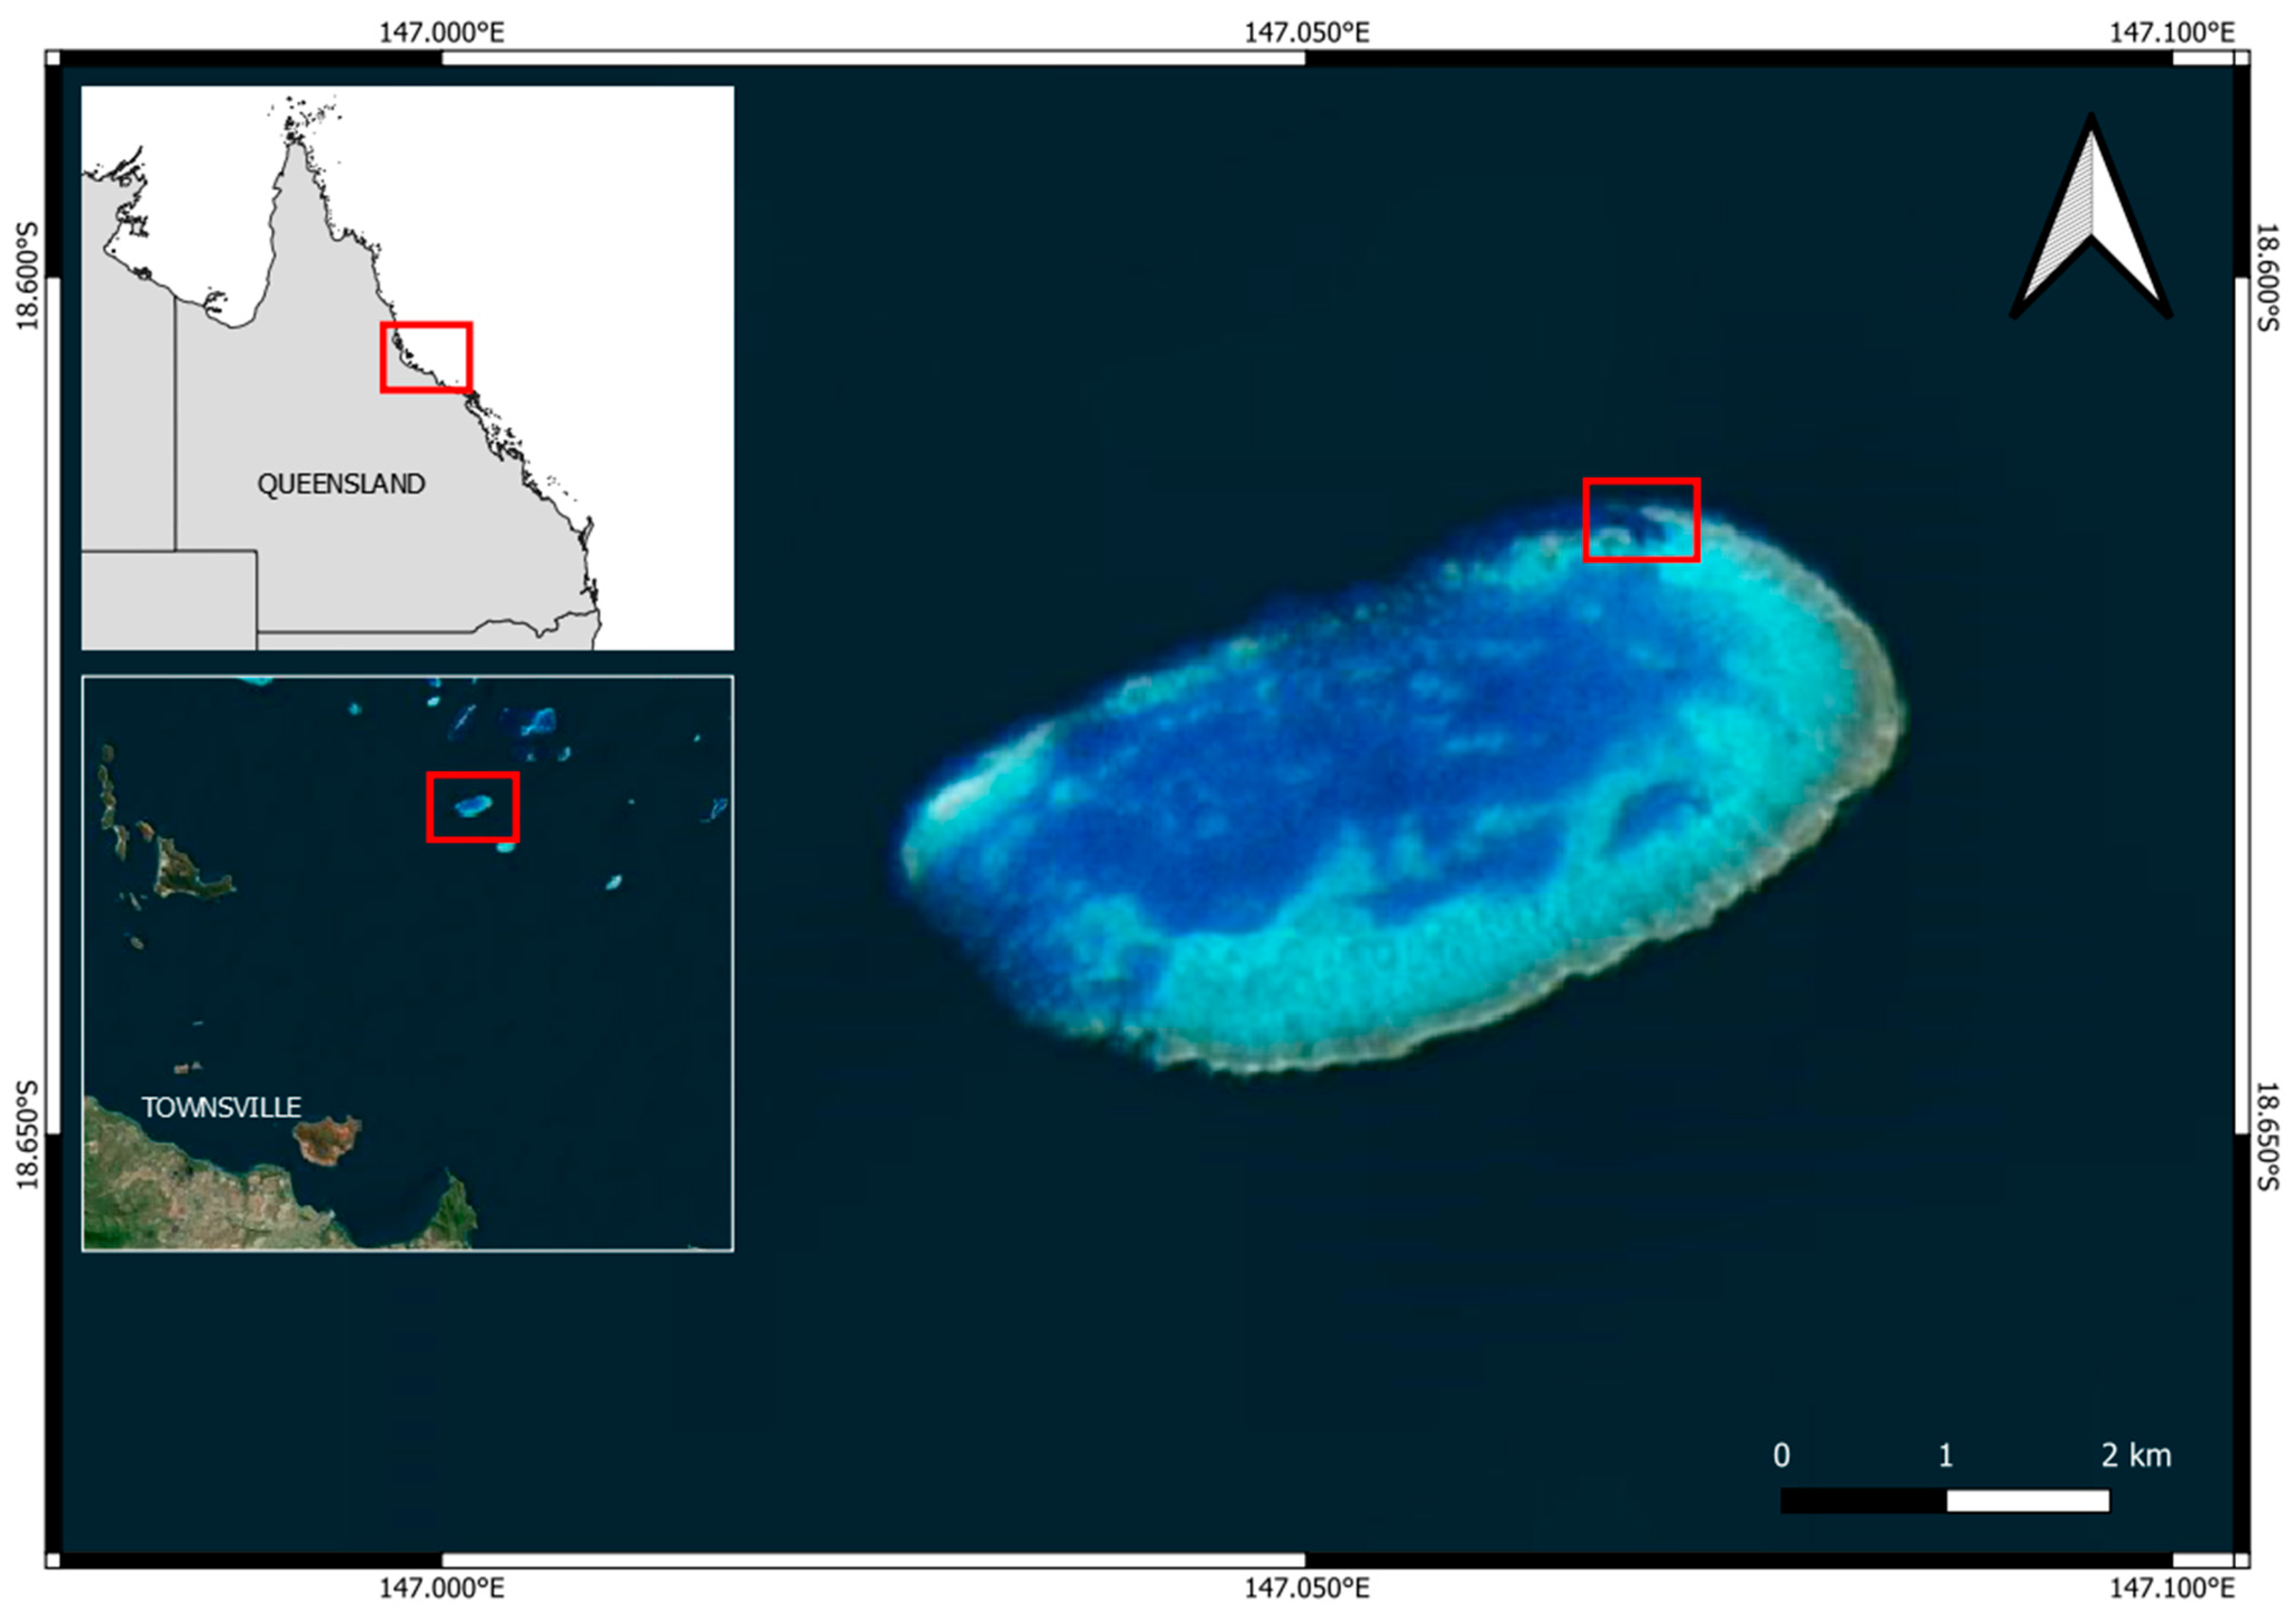
John Brewer Reef is a naturally formed reef located in the Great Barrier Reef Marine Park (GBRMP). Located approximately 80 km offshore from Townsville, Queensland, John Brewer Reef is a popular snorkelling and diving destination famous for its beautiful corals and rich marine life. John Brewer Reef is within a conservation park (yellow) zone that allows research and tourism activities and limited fishing. The Coral Greenhouse underwater sculptures were installed on a sandy bottom of a sheltered lagoon on the north side of John Brewer Reef in December 2019 (
Figure 1). The site has a bathymetric depth of 16–18 m, with weather protection from natural coral walls surrounding the lagoon.
2.2. Design of the Artificial Reef
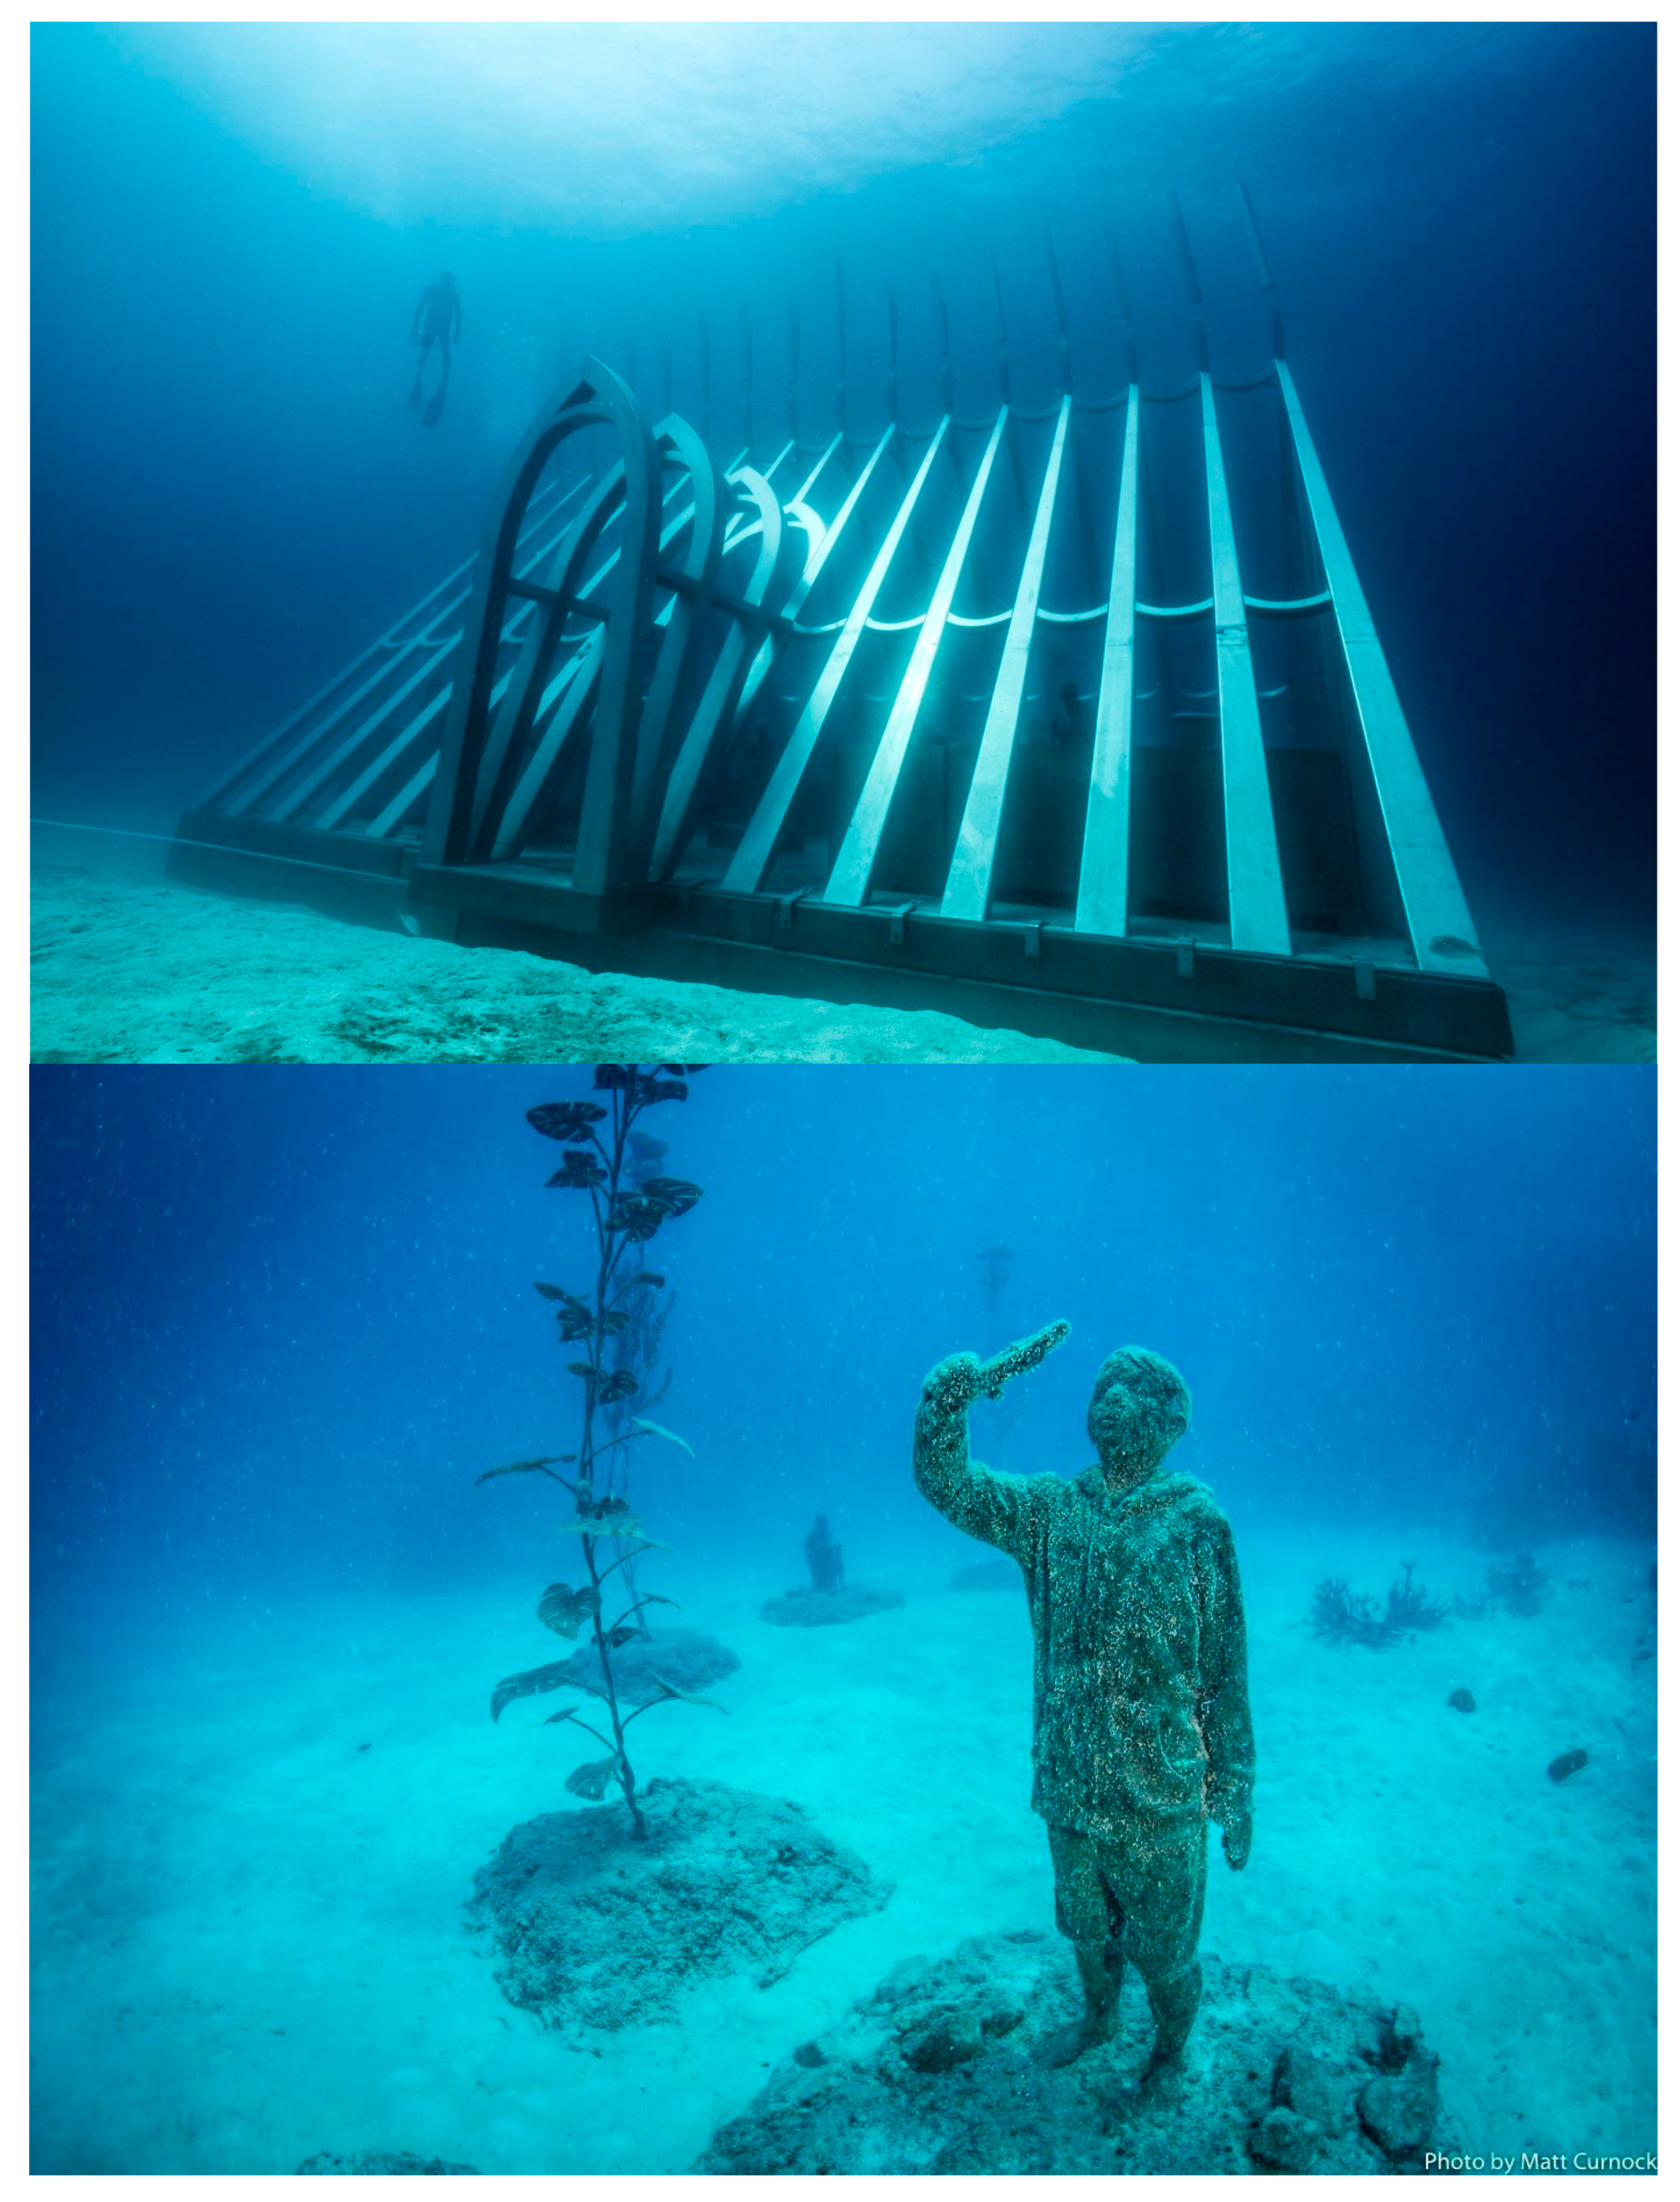
The Coral Greenhouse sculptures were created by artist Jason deCaires Taylor for the not-for-profit organisation the Museum of Underwater Art [
23,
24]. It is the largest underwater sculpture in the world [
25] at 12 m × 9 m × 9.3 m and a weight of 165 t (
Figure 2). The underwater sculptures were made of pH-neutral cement compounds and corrosion-resistant 316 stainless steel. The Coral Greenhouse sculptures were designed and certified by North Queensland Engineering (NQE) to withstand, at a minimum, environmental conditions exerted by a category 4 cyclone. A total of 47 underwater artworks, comprising the Coral Greenhouse with sculptures inside and surrounding it, were installed by Pacific Marine Group using a tug, barge, and commercial divers under supervision of the artist and Great Barrier Reef Marine Park Authority (GBRMPA) staff.
As part of the requirements for installing artificial reefs in the Great Barrier Reef, we obtained design drawings certified by a suitably qualified Registered Professional Engineer of Queensland (RPEQ) that demonstrates:
Design life of the artwork, including durability and suitability of applied coatings to tropical marine environments.
Due consideration of Marine Safety Queensland requirements, particularly depth of structures in relation to vessels that may pass over them.
That the artwork can withstand, at a minimum, environmental conditions exerted by a category 4 cyclone.
That the artwork will maintain structural integrity through expected seasonal sea height and wave conditions.
That the artwork and all structural components are designed to prevent rust and leaching of contaminants or inert materials.
The dimensions and materials used in construction of the artwork, methods to attach the artwork to the substrate, and the footprint of the artwork on the seafloor [
15].
The Coral Greenhouse was a challenging structure to anchor, as the design envisioned by the artist was a lightweight stainless steel exoskeleton in the shape of a greenhouse. This, in effect, created a large underwater sail for the lateral pressure pulses. It was estimated that these loads could be up to 10–20 t, depending on the direction and the wave height. To mitigate these potential extreme loads and address the legislative requirements [
15] and associated risk of a weather event above the load rating of the sculptures, referred to as an “above design” event occurring, a two-stage lateral restraint system was developed for the structure. The first stage involved stainless steel anchor rods, incorporated in the design to brace the Greenhouse up to the 20 t of lateral load limit. The second stage involved a secondary flexible stainless steel tether, which was incorporated in the design to provide an additional safety mechanism in the event of partial or complete failure of the Greenhouse structure during an “above design” event. This was designed for up to a 54 t lateral load limit. The sole purpose of this secondary tether was to reduce the risk of the structure causing damage to nearby reefs in the event of failure from “above design” events.
The foundation of the Greenhouse was designed as four precast concrete modules with a maximum mass of 30 t each, as per the requested limit of the installation crane and barge. These modules were bolted together underwater at the installation location to form the final Greenhouse foundation. The design featured a 600-mm-deep base frame that provided overall stiffness to the foundation. This frame was designed to be inherently robust and resistant to scour and differential settlement. On top of the base frame, three 300-mm-thick slabs would be installed, which provided the floor and support system for the approximately 40 t of sculptures that would be post-installed on the foundation.
An engineering survey is completed for all underwater structures over the duration of the permit on a yearly interval. The survey includes a visual inspection, photographs of each structure, and erosion/accretion measurements at critical locations. This allows for the review of data over time to compare changes in the stability of the structures. Monitoring for marine debris (such as fishing line, plastic, other rubbish) was also conducted to ensure that marine debris is not being captured or entangled in the artificial reef. Components of the artwork (such as broken branches, fallen limbs, other structural damages) that cannot be adequately repaired to sufficient engineering requirements were also treated as marine debris.
2.3. Ecological Survey
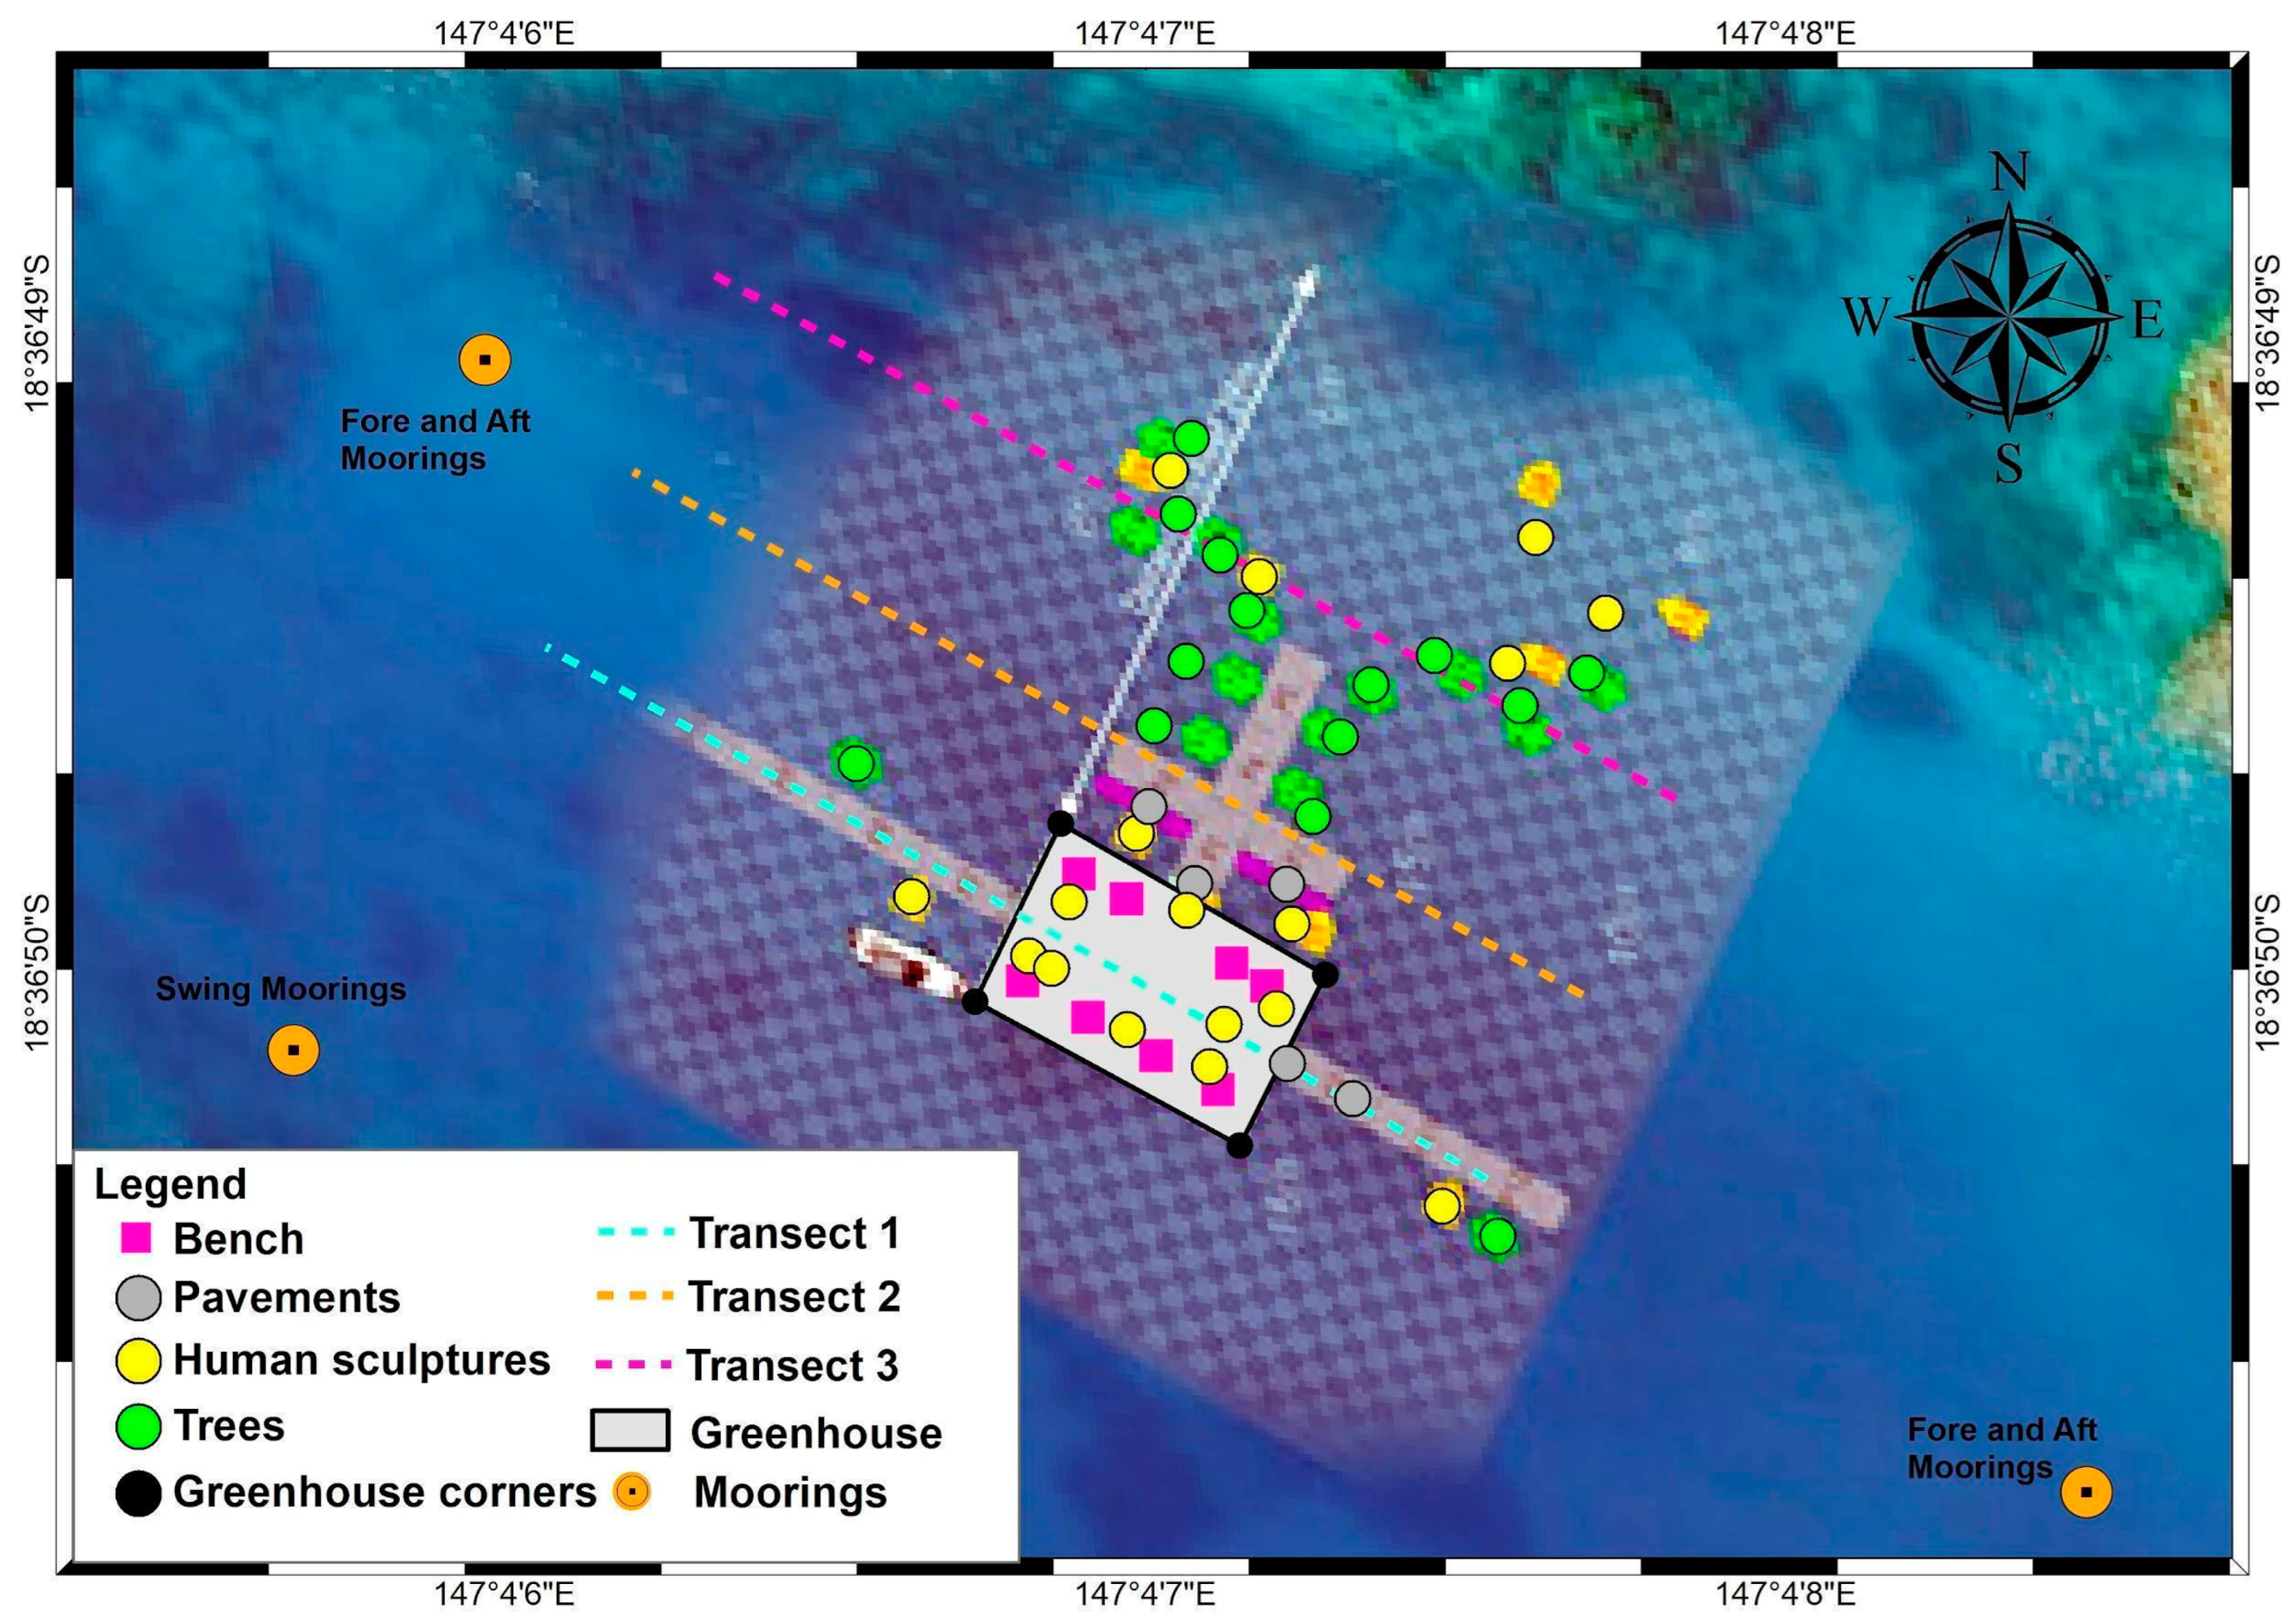
Three 50 m permanent transects, 10 m apart, were established in 2018, prior to installation of the facility (
Figure 3). To assess changes in fish and macroinvertebrate communities, we conducted underwater visual censuses using self-contained underwater breathing apparatus (SCUBA) in 2018 (pre-installation), 2020 (post-installation), 2021, and 2022. The divers recorded species and abundance of individuals sighted along a 50 m long x 4 m wide x 4 m high transect following the long-term monitoring program (LTMP) procedures from the Australian Institute of Marine Science (AIMS) [
26]. Underwater video and photographs were used to assist with species identification. Benthic macroinvertebrates were also identified and counted along the same transect.
2.4. Coral Propagation
On March 2021, Reef Ecologic and MOUA were joined by scientists, volunteers, and partners from James Cook University, CSIRO, C2O Consulting, Grumpy Turtle Creative and Pacific Marine Group in planting 131 corals on the Coral Greenhouse through the marine park permit G20/44358 granted by GBRMPA. Corals of opportunity, or broken pieces of live corals, were collected from a nearby reef of similar depth and used to plant corals in the sculptures. Corals were planted on one half of the Coral Greenhouse with the other side left as control to assess any potential effect of planting corals on the Coral Greenhouse on social and aesthetic value. Corals were planted on 17 locations in the treatment side by the use of underwater cement through pre-fitted holes in the sculptures approximately 2–3 cm wide (
Figure 4). The number of corals in each location varied based on the available pre-fitted holes. Live corals, health, and genus in each location were recorded after planting and during each monitoring period (1, 6 and 12 months). To assess natural recruitment at the Coral Greenhouse, ten random 1 m
2 quadrats on each group were surveyed for visible hard and soft coral recruits measuring between 1–5 cm in size for each monitoring period.
2.5. Social and Aesthetic Survey
2.5.1. Surveys of Tourists Values
Planting corals onto the structure marks potential changes to the aesthetics of the Coral Greenhouse. To assess how coral planting on the museum affects visitor experience and aesthetic value of the Coral Greenhouse, we conducted a coral reef aesthetic survey pre- and post-planting of corals. A total of 142 surveys were taken before and 94 surveys were taken after coral planting at the Coral Greenhouse, respectively. The survey questionnaire has a series of questions, including 15 statements for participants to rate between 1–10 based on their level of agreement with the statement (10 = Strongly Agree, 1 = Strongly Disagree) (
Figure S1) [
27]. Responses were collected on regular tourism trips to John Brewer Reef.
2.5.2. Survey of Aesthetic Values
The underwater aesthetic surveys at the Coral Greenhouse rate the aesthetic beauty in three aspects (Art, Coral, and Fish) of the site, where 1 is low and 10 is high. Ten replicates were chosen, five in the treatment area and five directly opposite in the control area, making a direct view of the effects of coral transplantation. These sites were also chosen as fixed photo stations to monitor and compare changes between each group through time.
2.6. Statistical Analysis
All statistical analyses and data visualisations were conducted using R version 4.2.1 [
28] and Tableau data visualisation software. A variety of statistical methods were used to analyse the different variables that were measured throughout the existence of MOUA (
Table 1). We used non-metric Multidimensional Scaling (nMDS) to compare the community structure of fish at the Coral Greenhouse from 2018 to 2022. Permutational Multivariate Analysis of Variance (PERMANOVA) and Analysis of Variance (ANOVA) were used to detect significant changes in fish abundance, species richness, and diversity (using Shannon’s Diversity Index). A Student’s
t-test was used for pairwise analysis of pre- and post-installation differences for ecological and social data. Linear regression coefficients of abundance, species richness, and diversity with respect to time for fish and invertebrates were analysed to test for trends over time.
3. Results
3.1. Design and Durability Survey
North Queensland Engineering (NQE) reported annually in 2021 and 2022 that the Coral Greenhouse is in overall good condition. A number of items were noted that required replacement or repair. Small zinc anodes were installed on the Greenhouse and tree sculptures to provide an additional sacrificial barrier to corrosion of the artwork, and larger anodes were recommended to increase the replacement interval and improve effectiveness. The Greenhouse floats/spires had been in service for 24 months and it was noted that several of the joints had broken. Additional tethers were added to reduce the risk of failure, and it was recommended for the design to be modified to improve robustness at the critical locations. No additional marine debris were recorded on all monitoring periods.
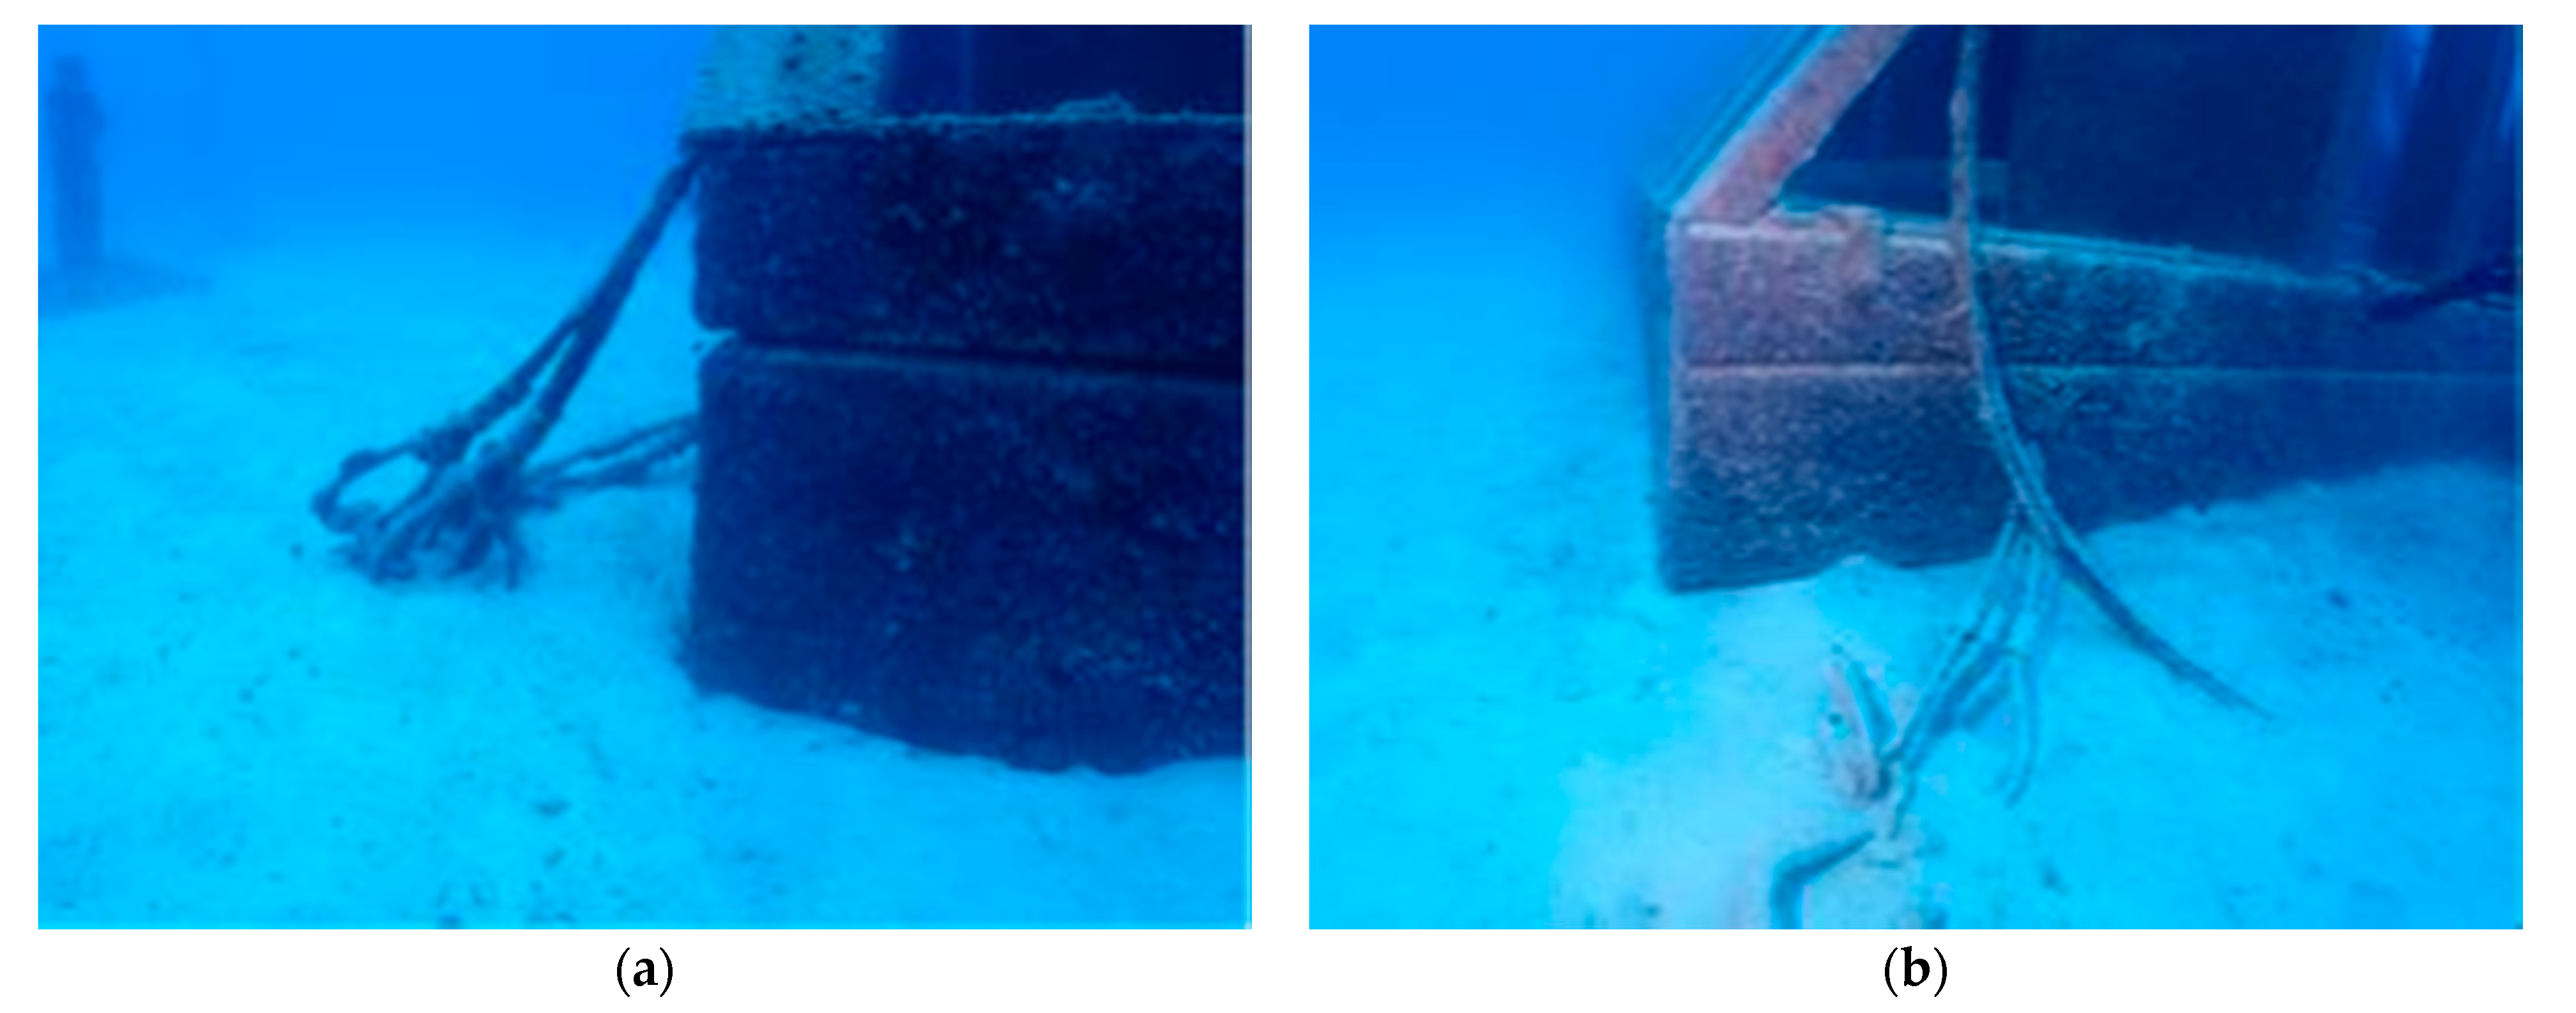
The Greenhouse base foundation was located on the seabed, partially buried. The seabed is inherently variable, with sediment transport playing a key part in the design of the levels. Due to these factors, additional monitoring is required to understand the erosion/accretion rates. It was noted that the southern and western corner of the Coral Greenhouse had minor signs of erosion, with the bottom of the base frame just visible at the southern corner (
Figure 5) [
29]. The results from the measurements completed in 2021 are included in
Table 2. The Greenhouse design was to allow up to 900 mm between the top of the base frame and the seabed.
3.2. Ecological Survey
Pre-installation baseline survey of the site in 2018 reported a total of 65 individuals from 12 species of fish (
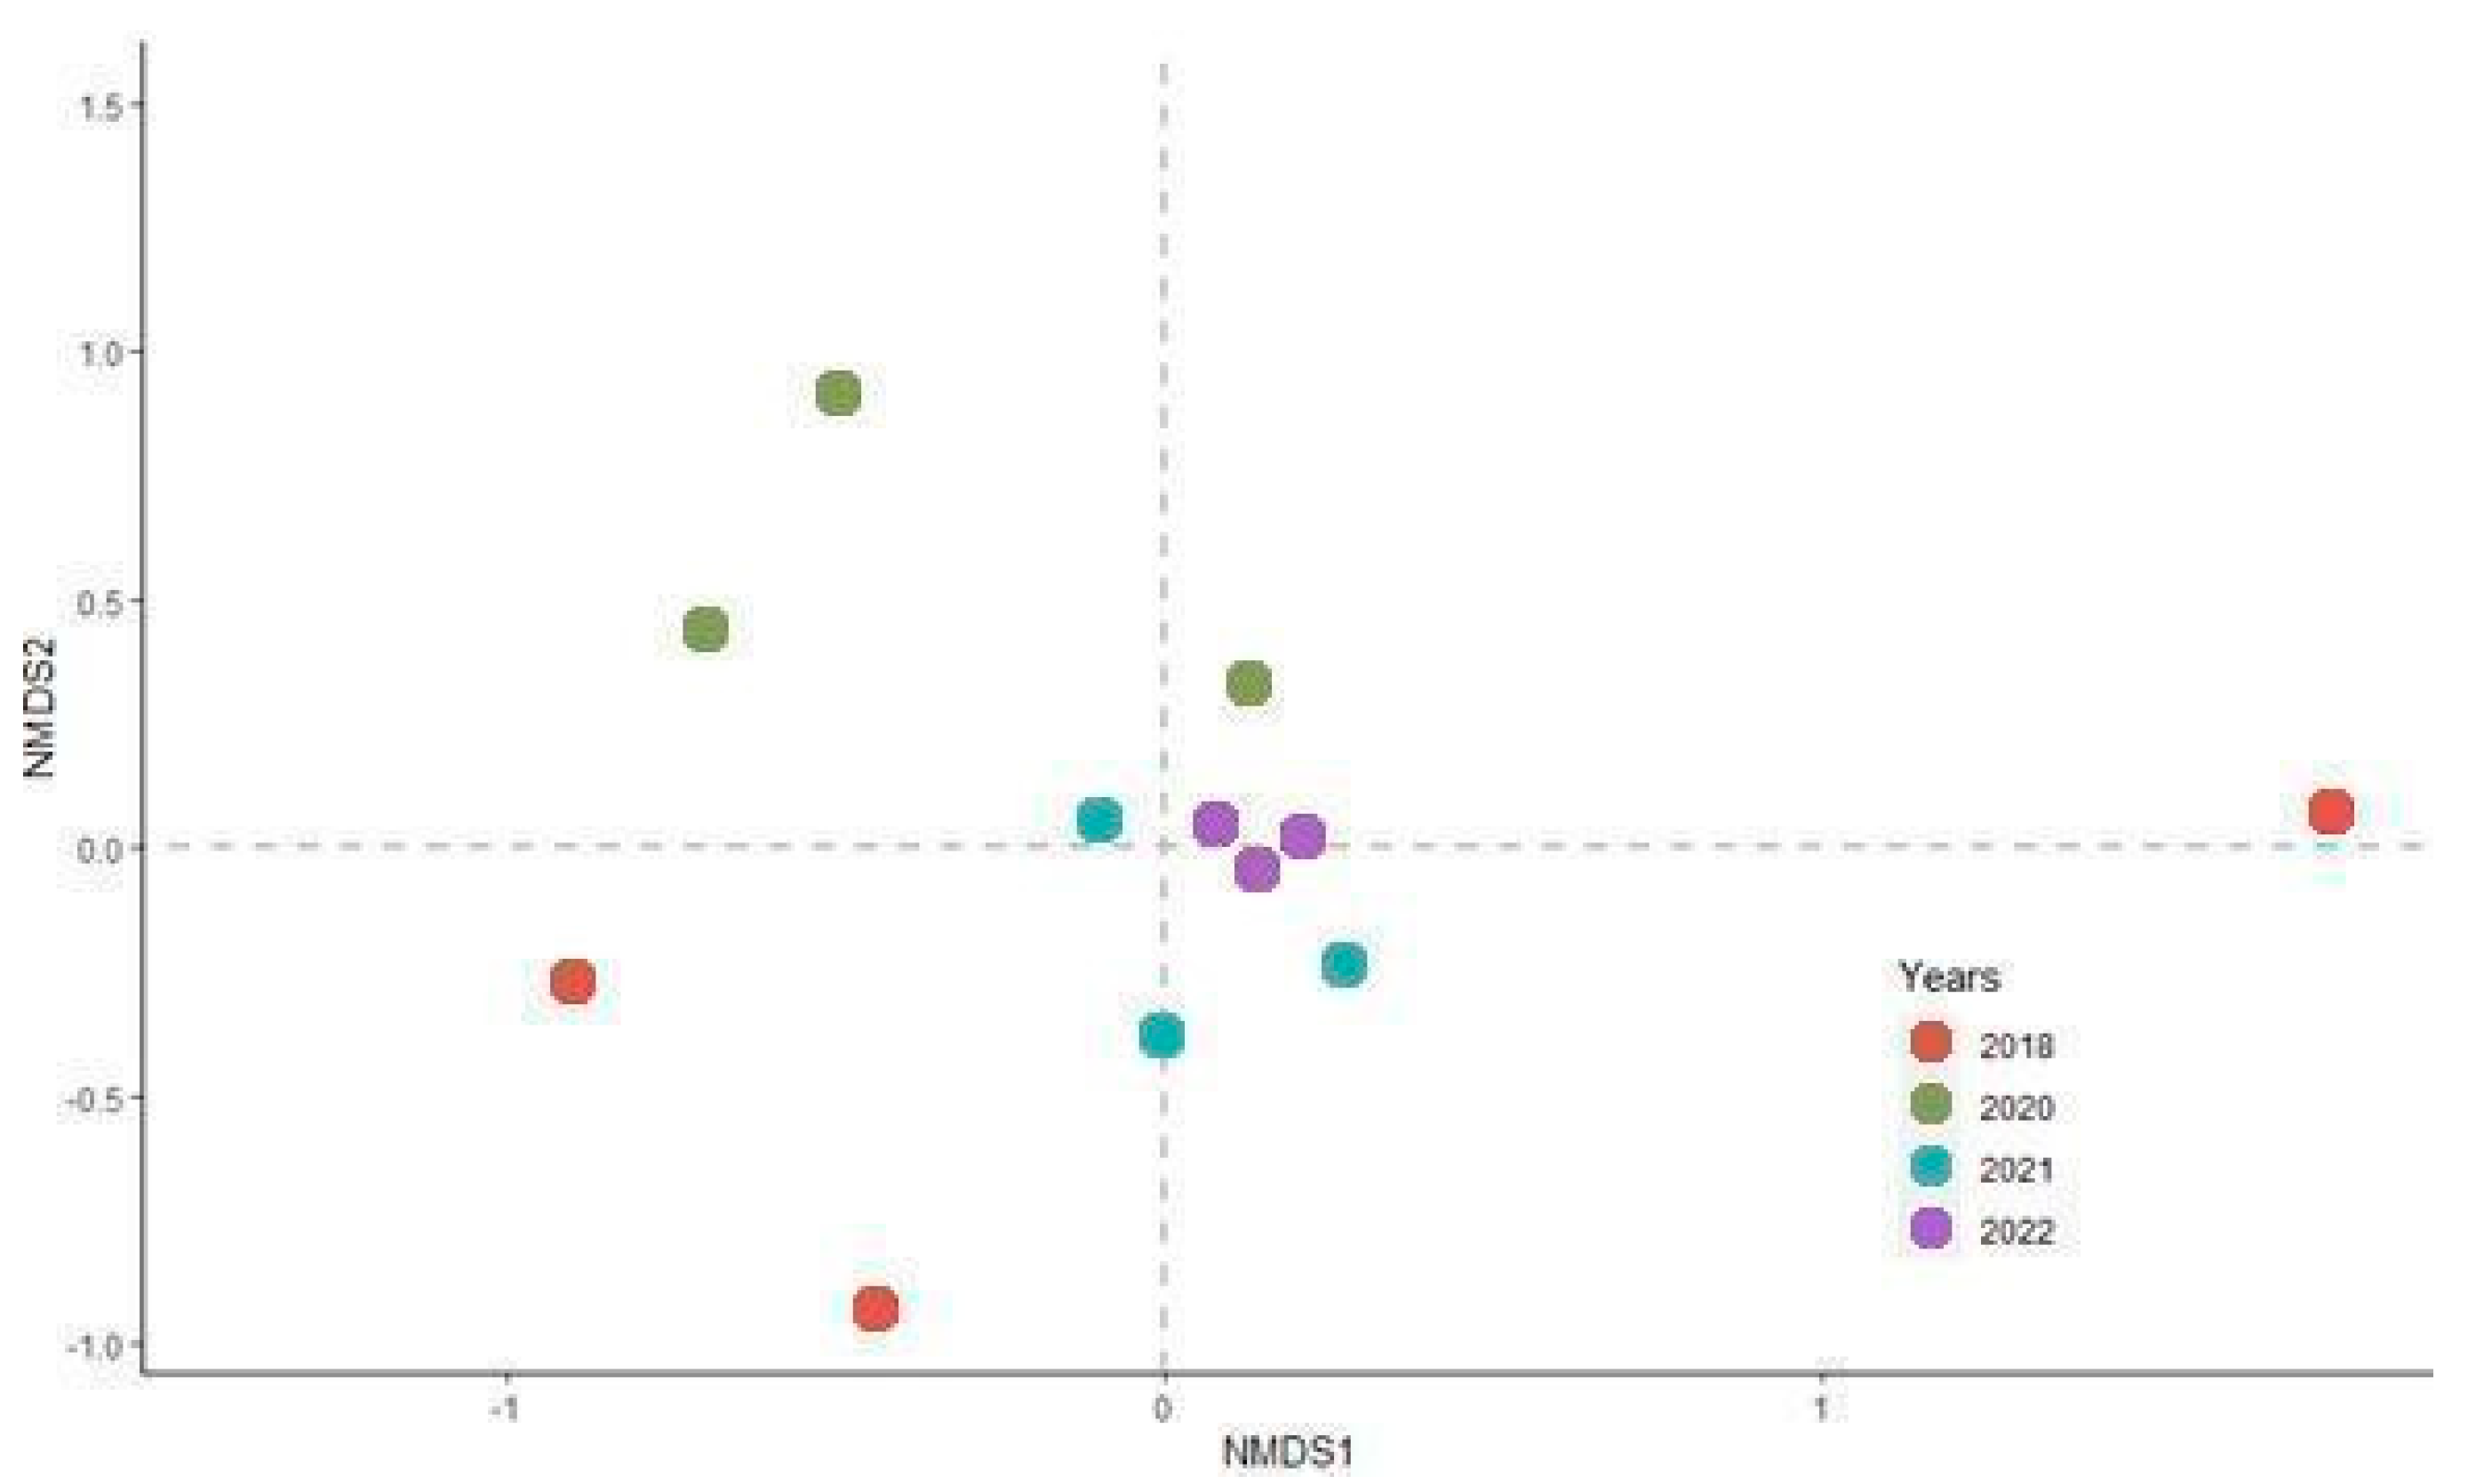
Table 3). Following the same methods, in 2022, a total of 320 individuals from 46 species of fish were observed along the three transects. The PERMANOVA on the NMDS analysis showed that the abundance of fish species on twelve transects differed significantly (
Figure 6;
Table 4 and
Table 5). Pairwise
t-test showed that post-installation fish abundance, species richness, and species diversity were significantly higher than baseline values, except for fish abundance and diversity in 2020 (
Table 6).
Linear regression coefficient analysis on fish species showed a significant positive increase of abundance, species richness, and diversity with respect to time (
Figure 7). Overall time had a significant effect on the biodiversity of fish species (
Table 4).
The most abundant fish species were Double-lined Fusilier (
Pterocaesio digramma), Yellowtail Fusilier (
Caesio cuning), and Brassy Trevally (
Caranx papuensis). The mean abundance of the top ten species varied over time (
Figure 8).
Macroinvertebrate species maintained no significant trends in abundance, species richness, and diversity with respect to time between 2018 and 2022 (
Figure 7). Overall, time had no significant effect on the biodiversity of macroinvertebrate species (
Table 5).
The most abundant macroinvertebrate species were the Hermann’s sea cucumber (
Stichopus hermanni), the edible sea cucumber (
Holothuria edulis), and the black sea cucumber (
Holothuria atra). In 2022, we observed three species new to the site: Day octopus (
Octopus cyanea), golden sandfish (
Holothuria scabra), and white-teated sea cucumber (
Holothuria nobilis) that were not observed during the 2018, 2020, and 2021 surveys (
Figure 8).
3.3. Social and Aesthetic Surveys
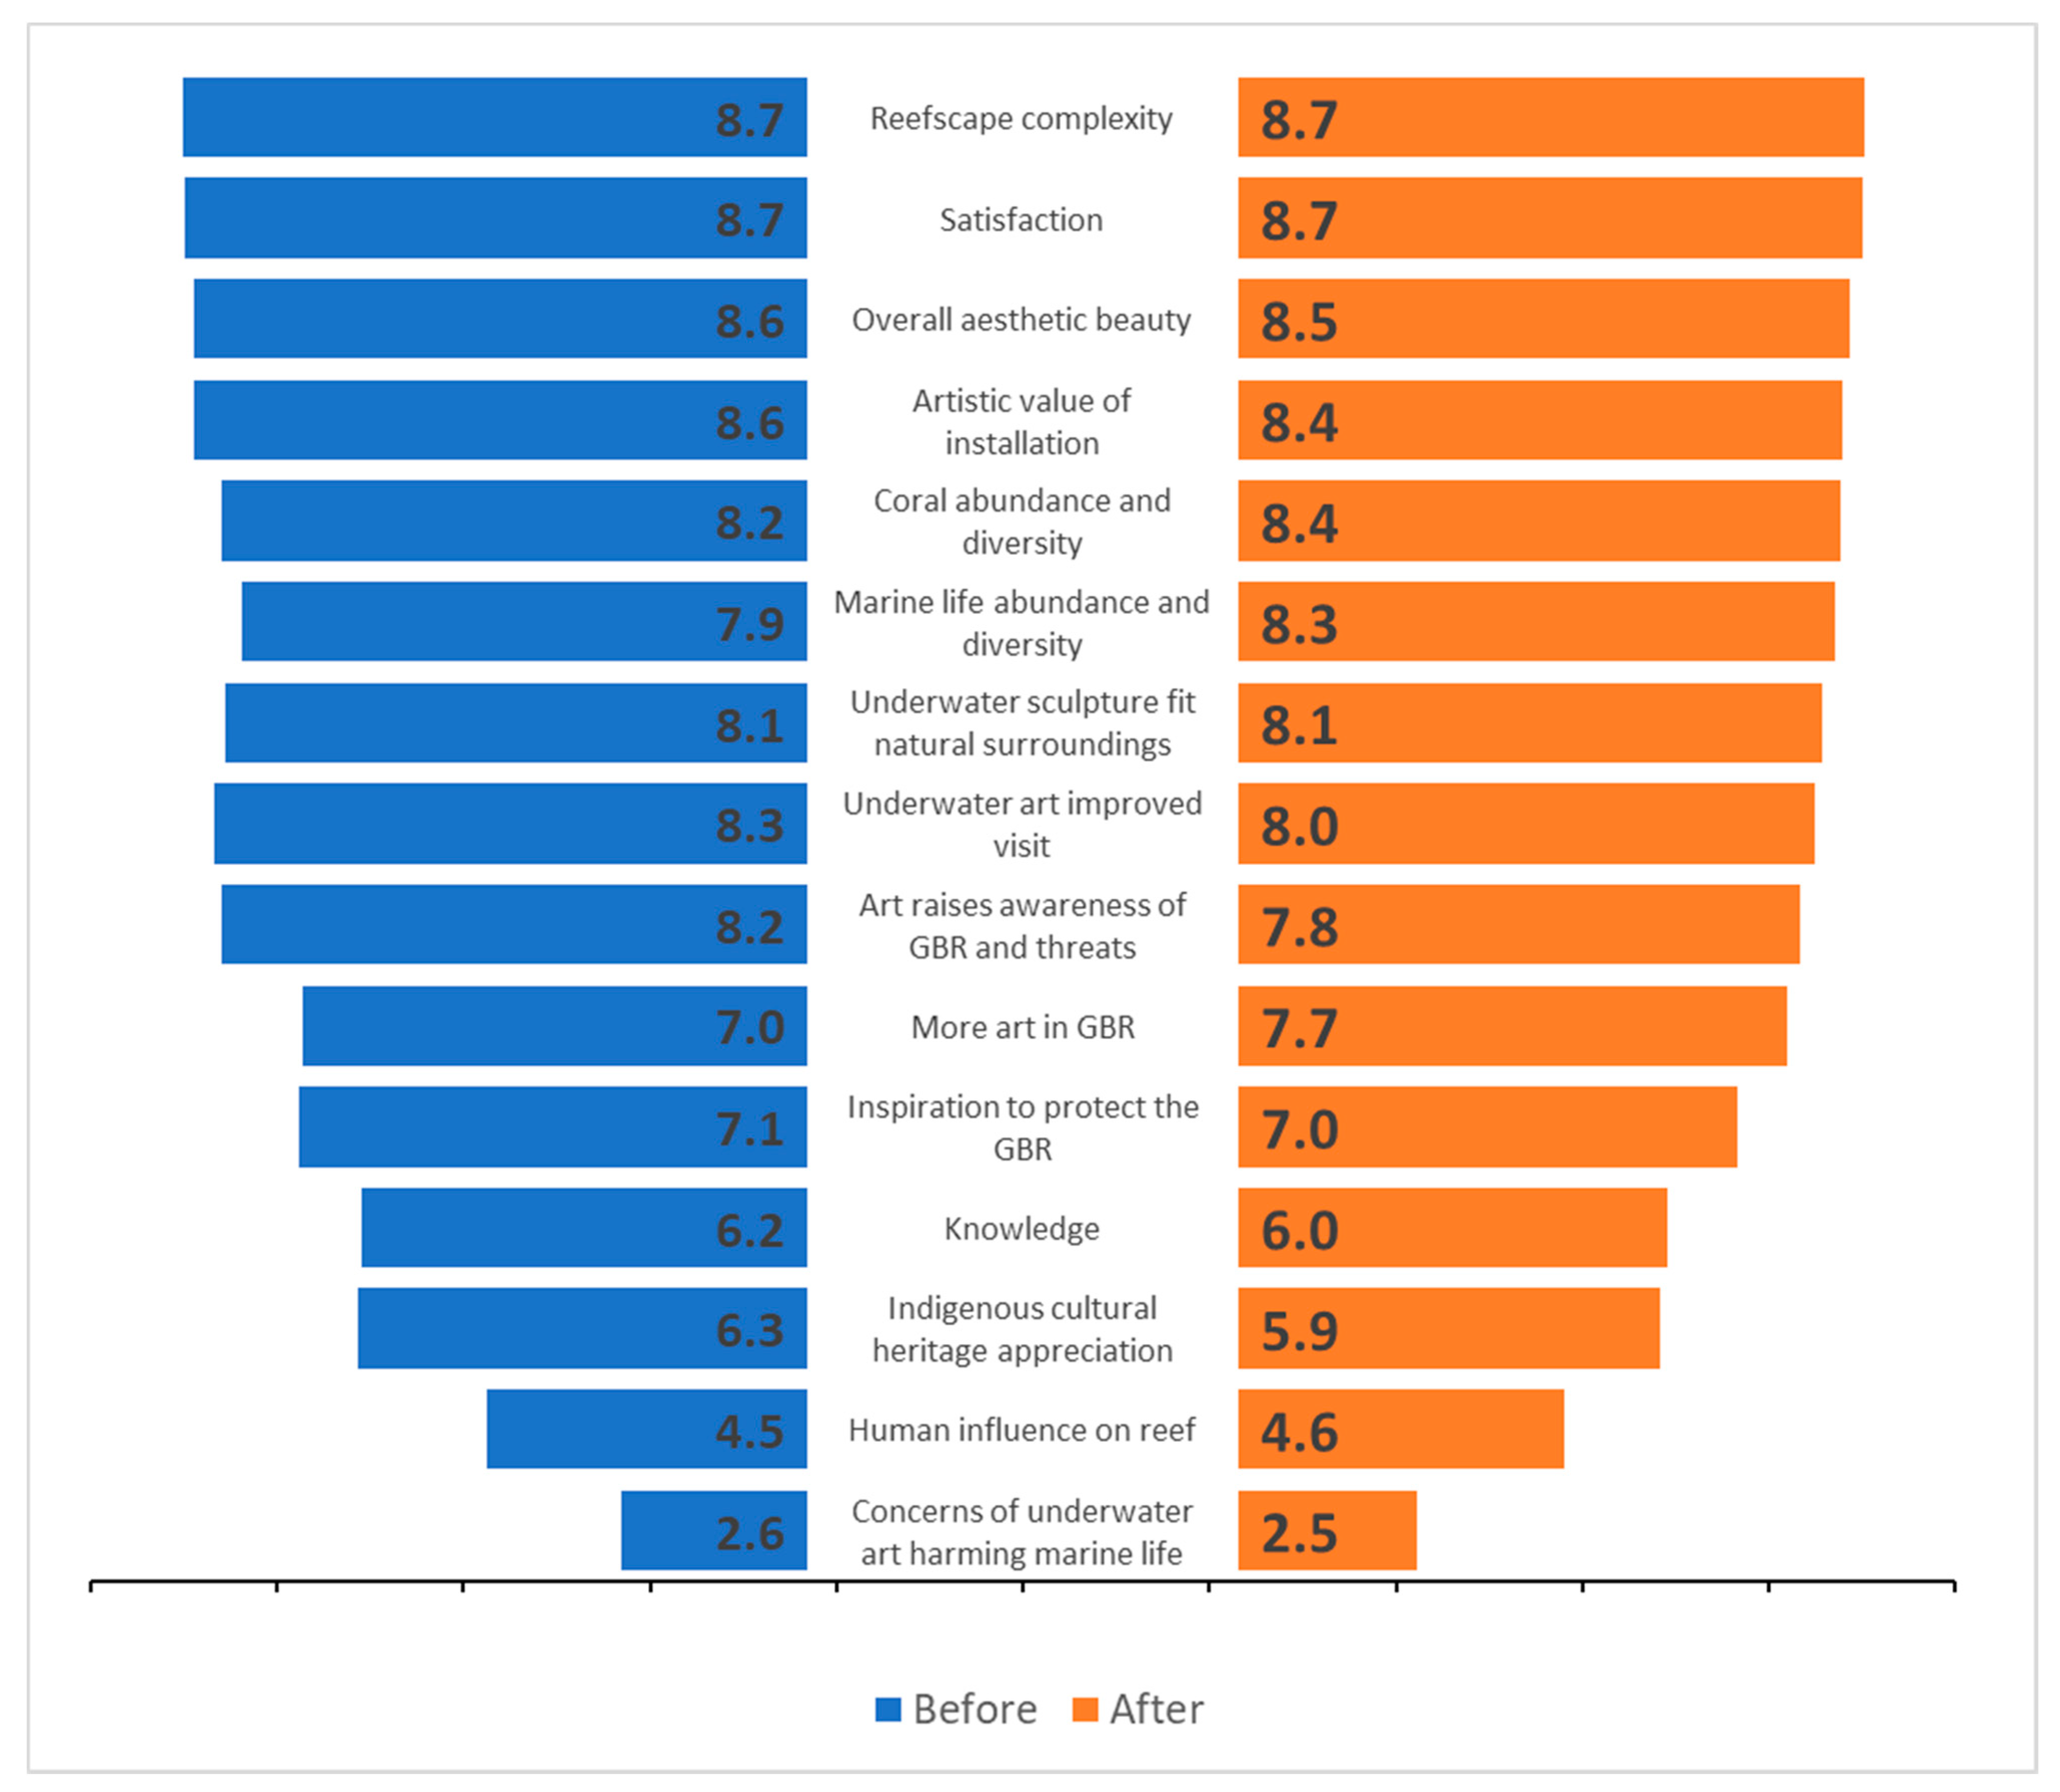
We found no significant differences in the overall score based on John Brewer Reef and Coral Greenhouse aesthetic beauty and visitor experience (
Figure 9). Statistical analysis using a two-tail
t-test on each of the 15 metrics did not show significant differences in scores before and after coral planting.
The survey showed high scores in Satisfaction, Reefscape complexity, Overall aesthetic beauty, and Artistic value of installation. We also note that low scores on Human influence on reefs and Concerns of underwater art harming marine life indicate that visitors think that the underwater art does not negatively impact the marine life and habitat around John Brewer Reef.
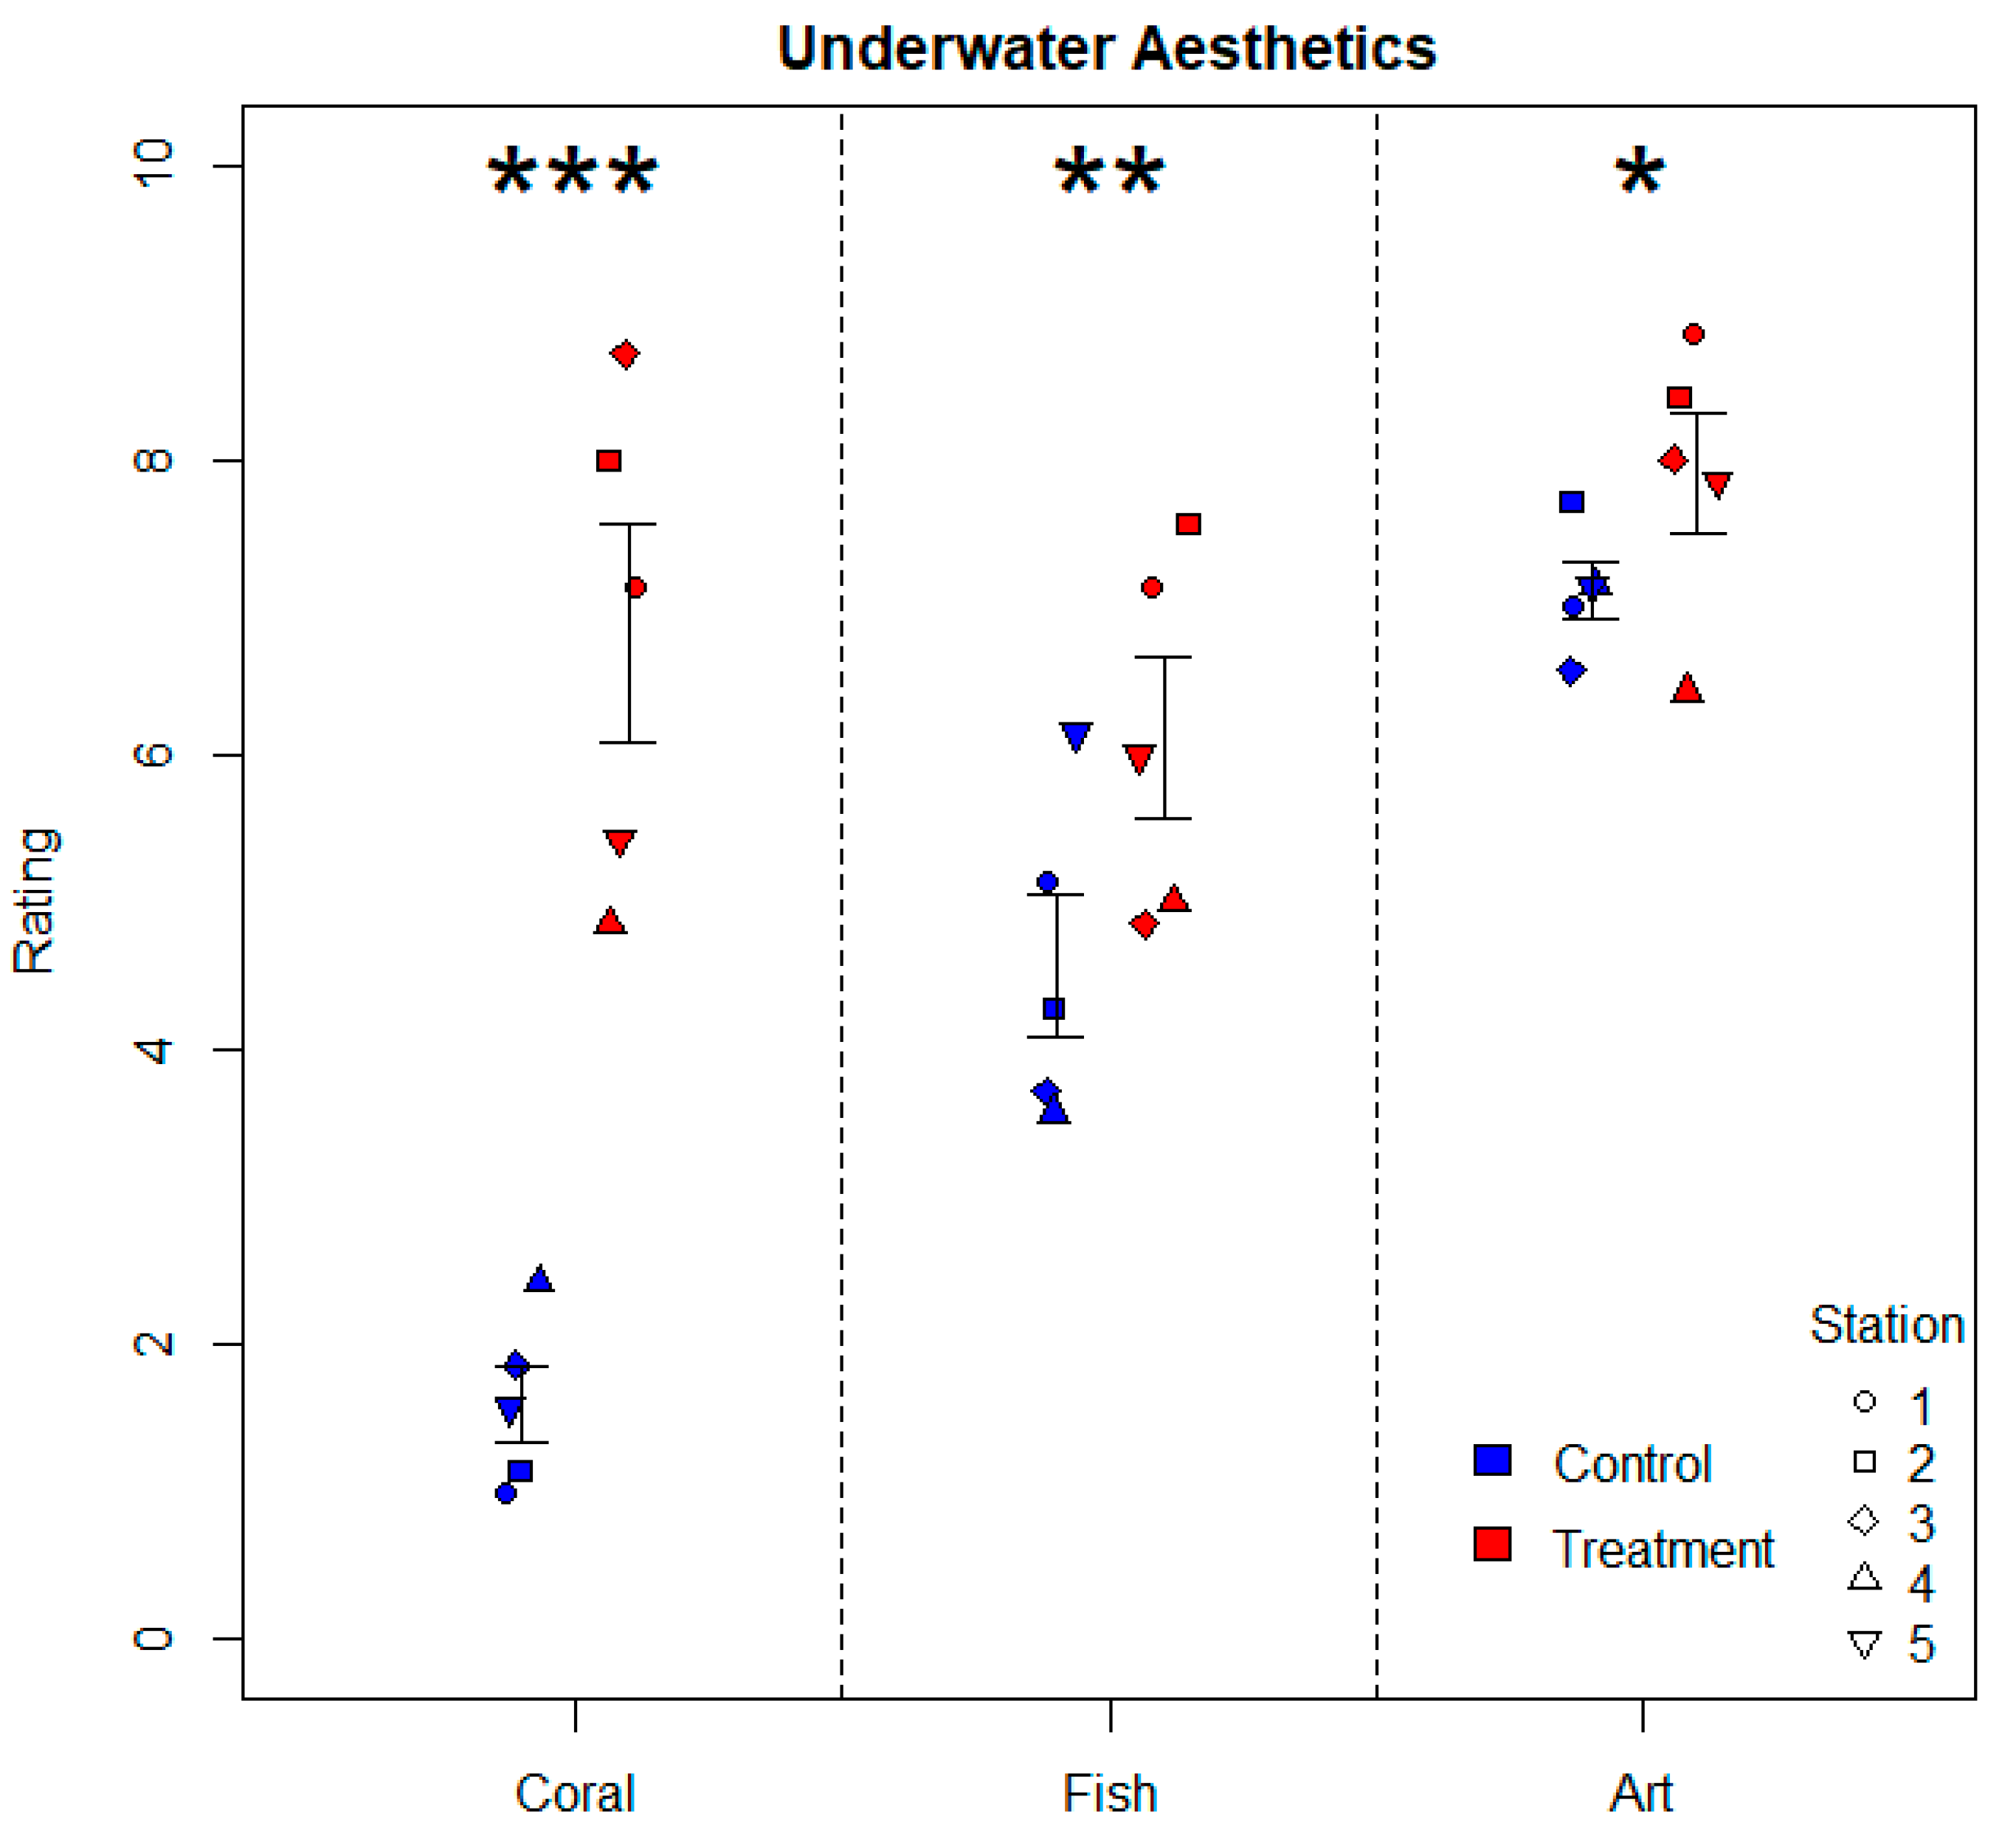
Underwater aesthetic surveys showed that ratings for corals, fish, and art are higher in treatment locations than in controls, suggesting that the presence of coral increases the aesthetics of the other components of the Coral Greenhouse (
Figure 10). Two-factor ANOVA showed that aesthetic scores for treatment plots across coral, fish, and art differ significantly from control plots (
Table 7). A comparison of scores between stations showed that underwater aesthetic value for corals, art, and fish differ significantly between stations in the treatment plots, but not in the control plots. Stations 1, 2, and 3, where more underwater structure provides greater complexity and higher coral outplant density, have significantly higher underwater aesthetic scores compared to stations 4 and 5 (
Table 7,
Figure 10).
3.4. Coral Monitoring
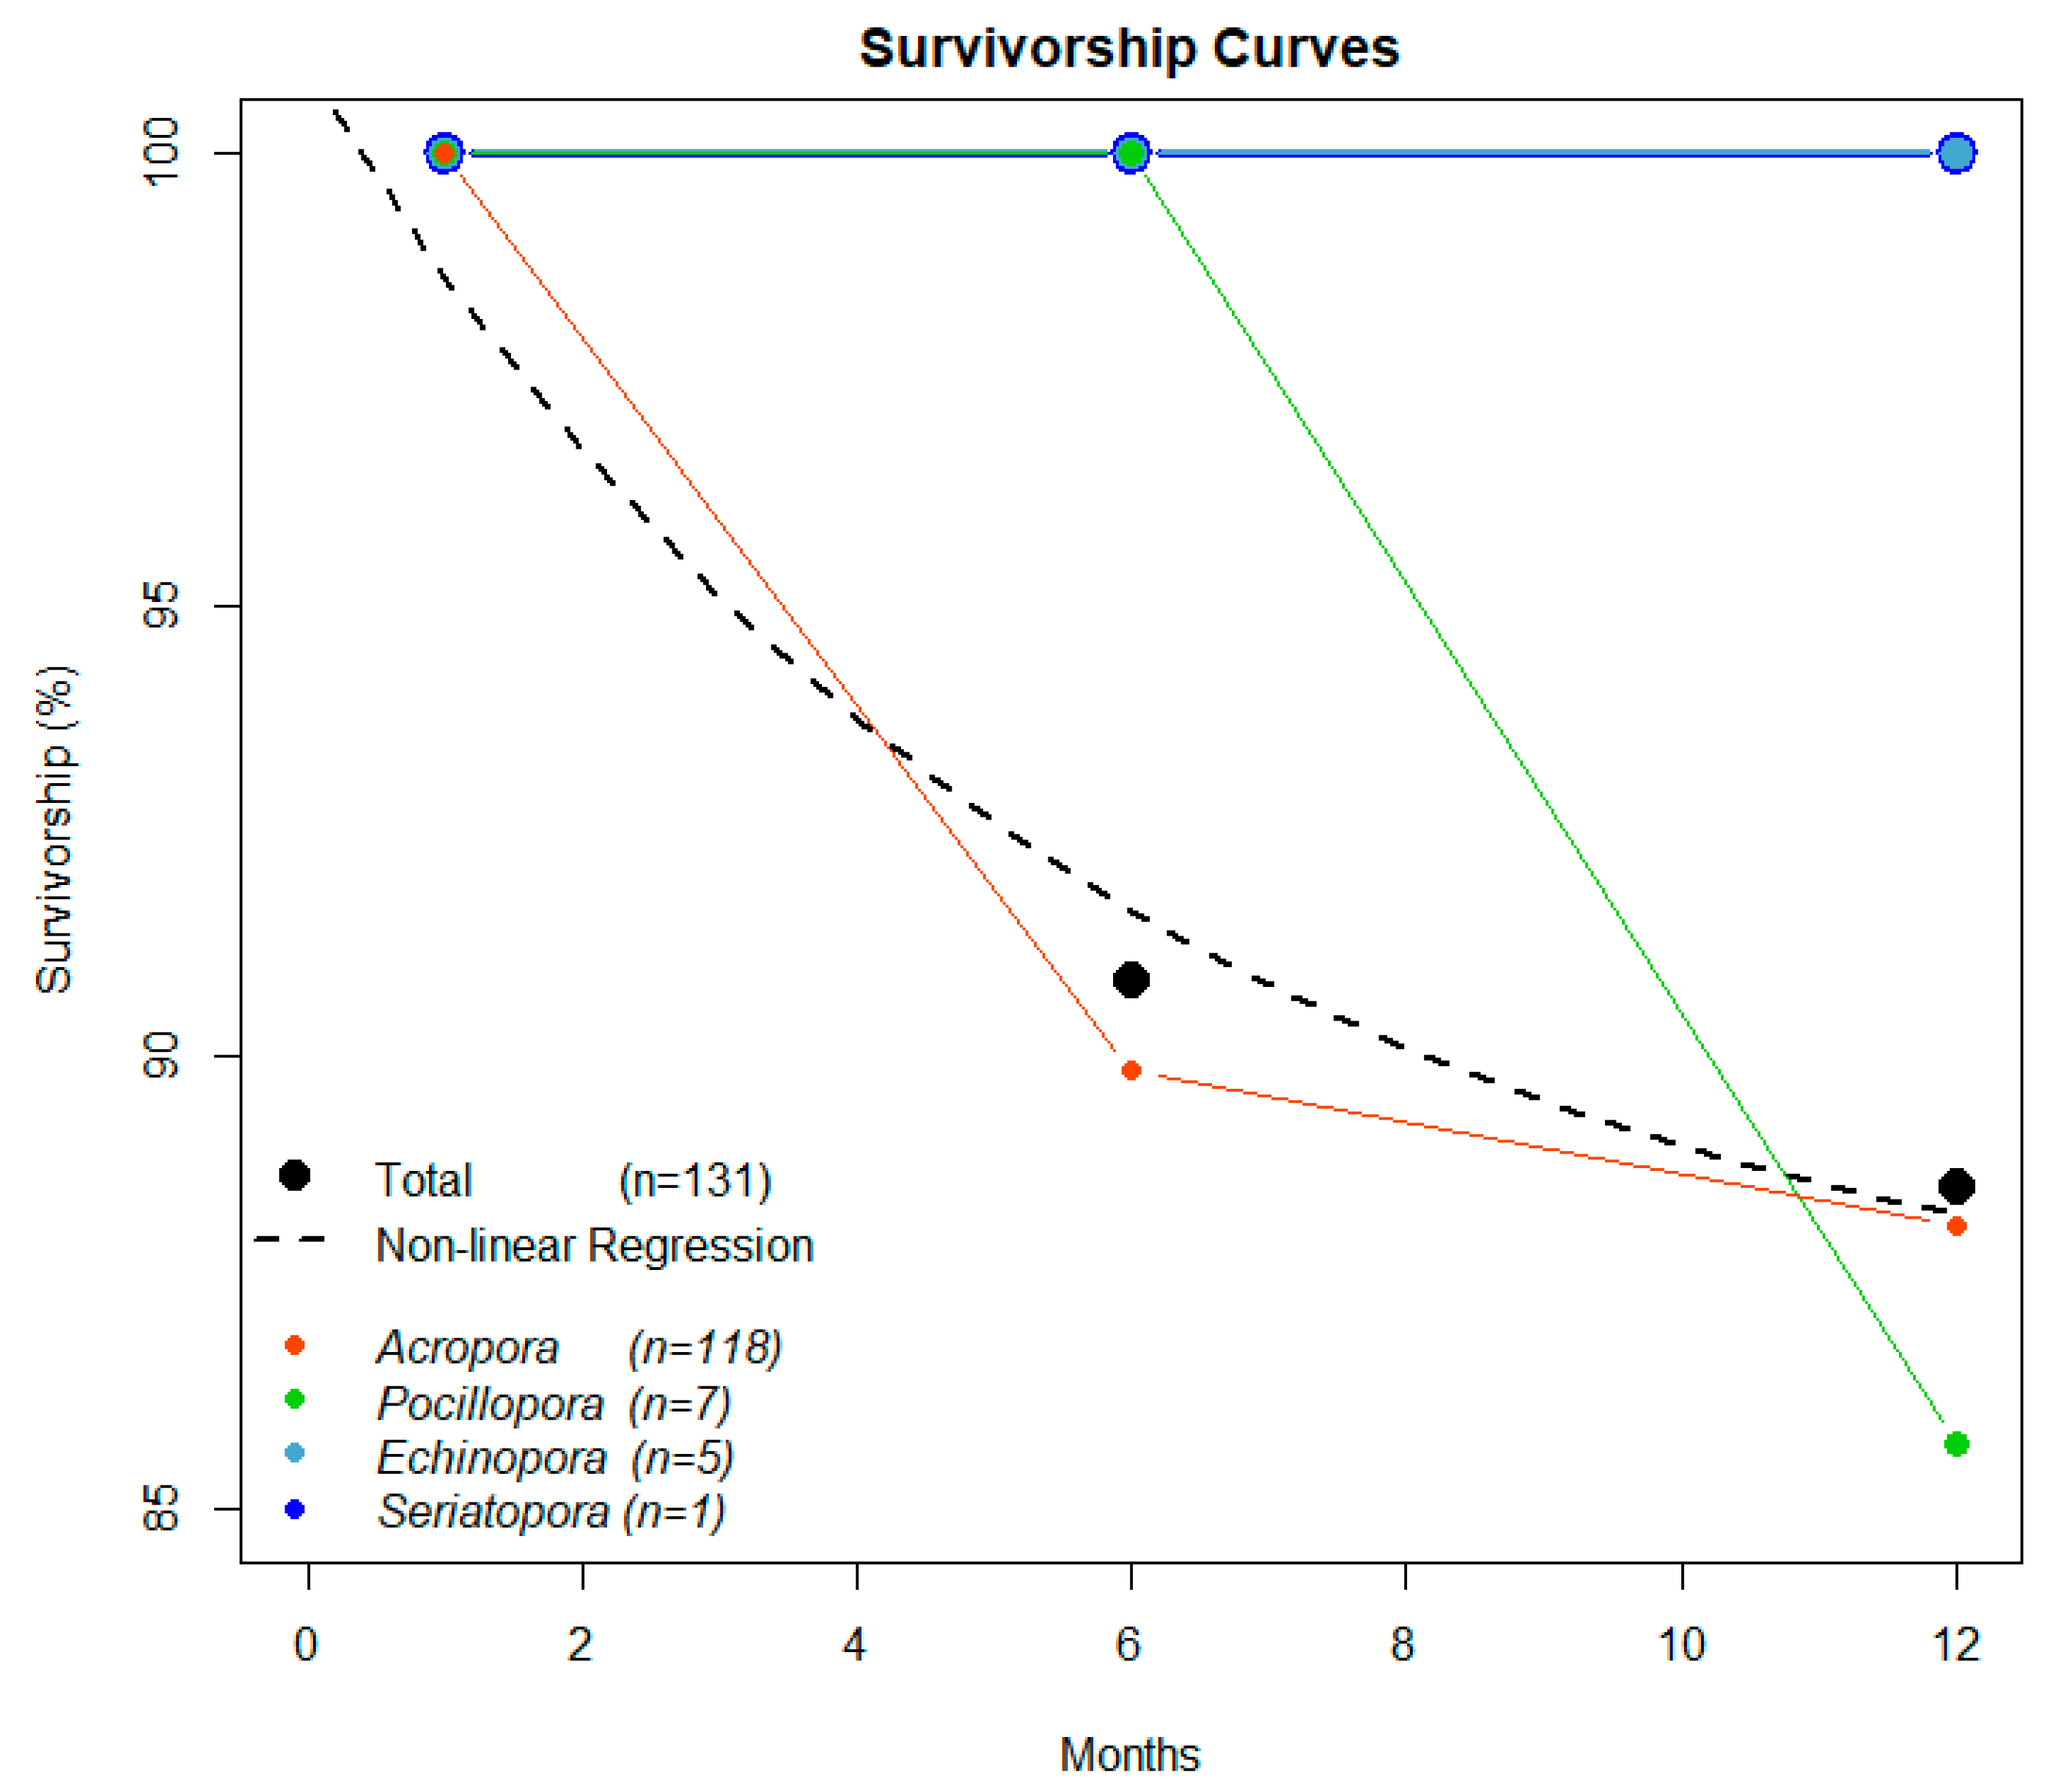
Out of 131 propagated corals, 90% were
Acropora spp. (
n = 118), while 10% were
Pocillopora spp. (
n = 7),
Echinopora spp. (
n = 5), and
Seriatopora sp. (
n = 1). Propagated corals were monitored for survival and health at 1, 6, and 12 months (
Figure 11). All corals were alive and healthy after one month. At month 12, the observed coral transplants still showed a very high rate of 91.6% survivorship (
n = 120). Dead or missing corals were
Acropora spp. (
n = 10) and
Pocillopora sp. (
n = 1). Of all remaining propagated corals, 93% were in good health (
n = 112) and 7% were partially dead (
n = 8).
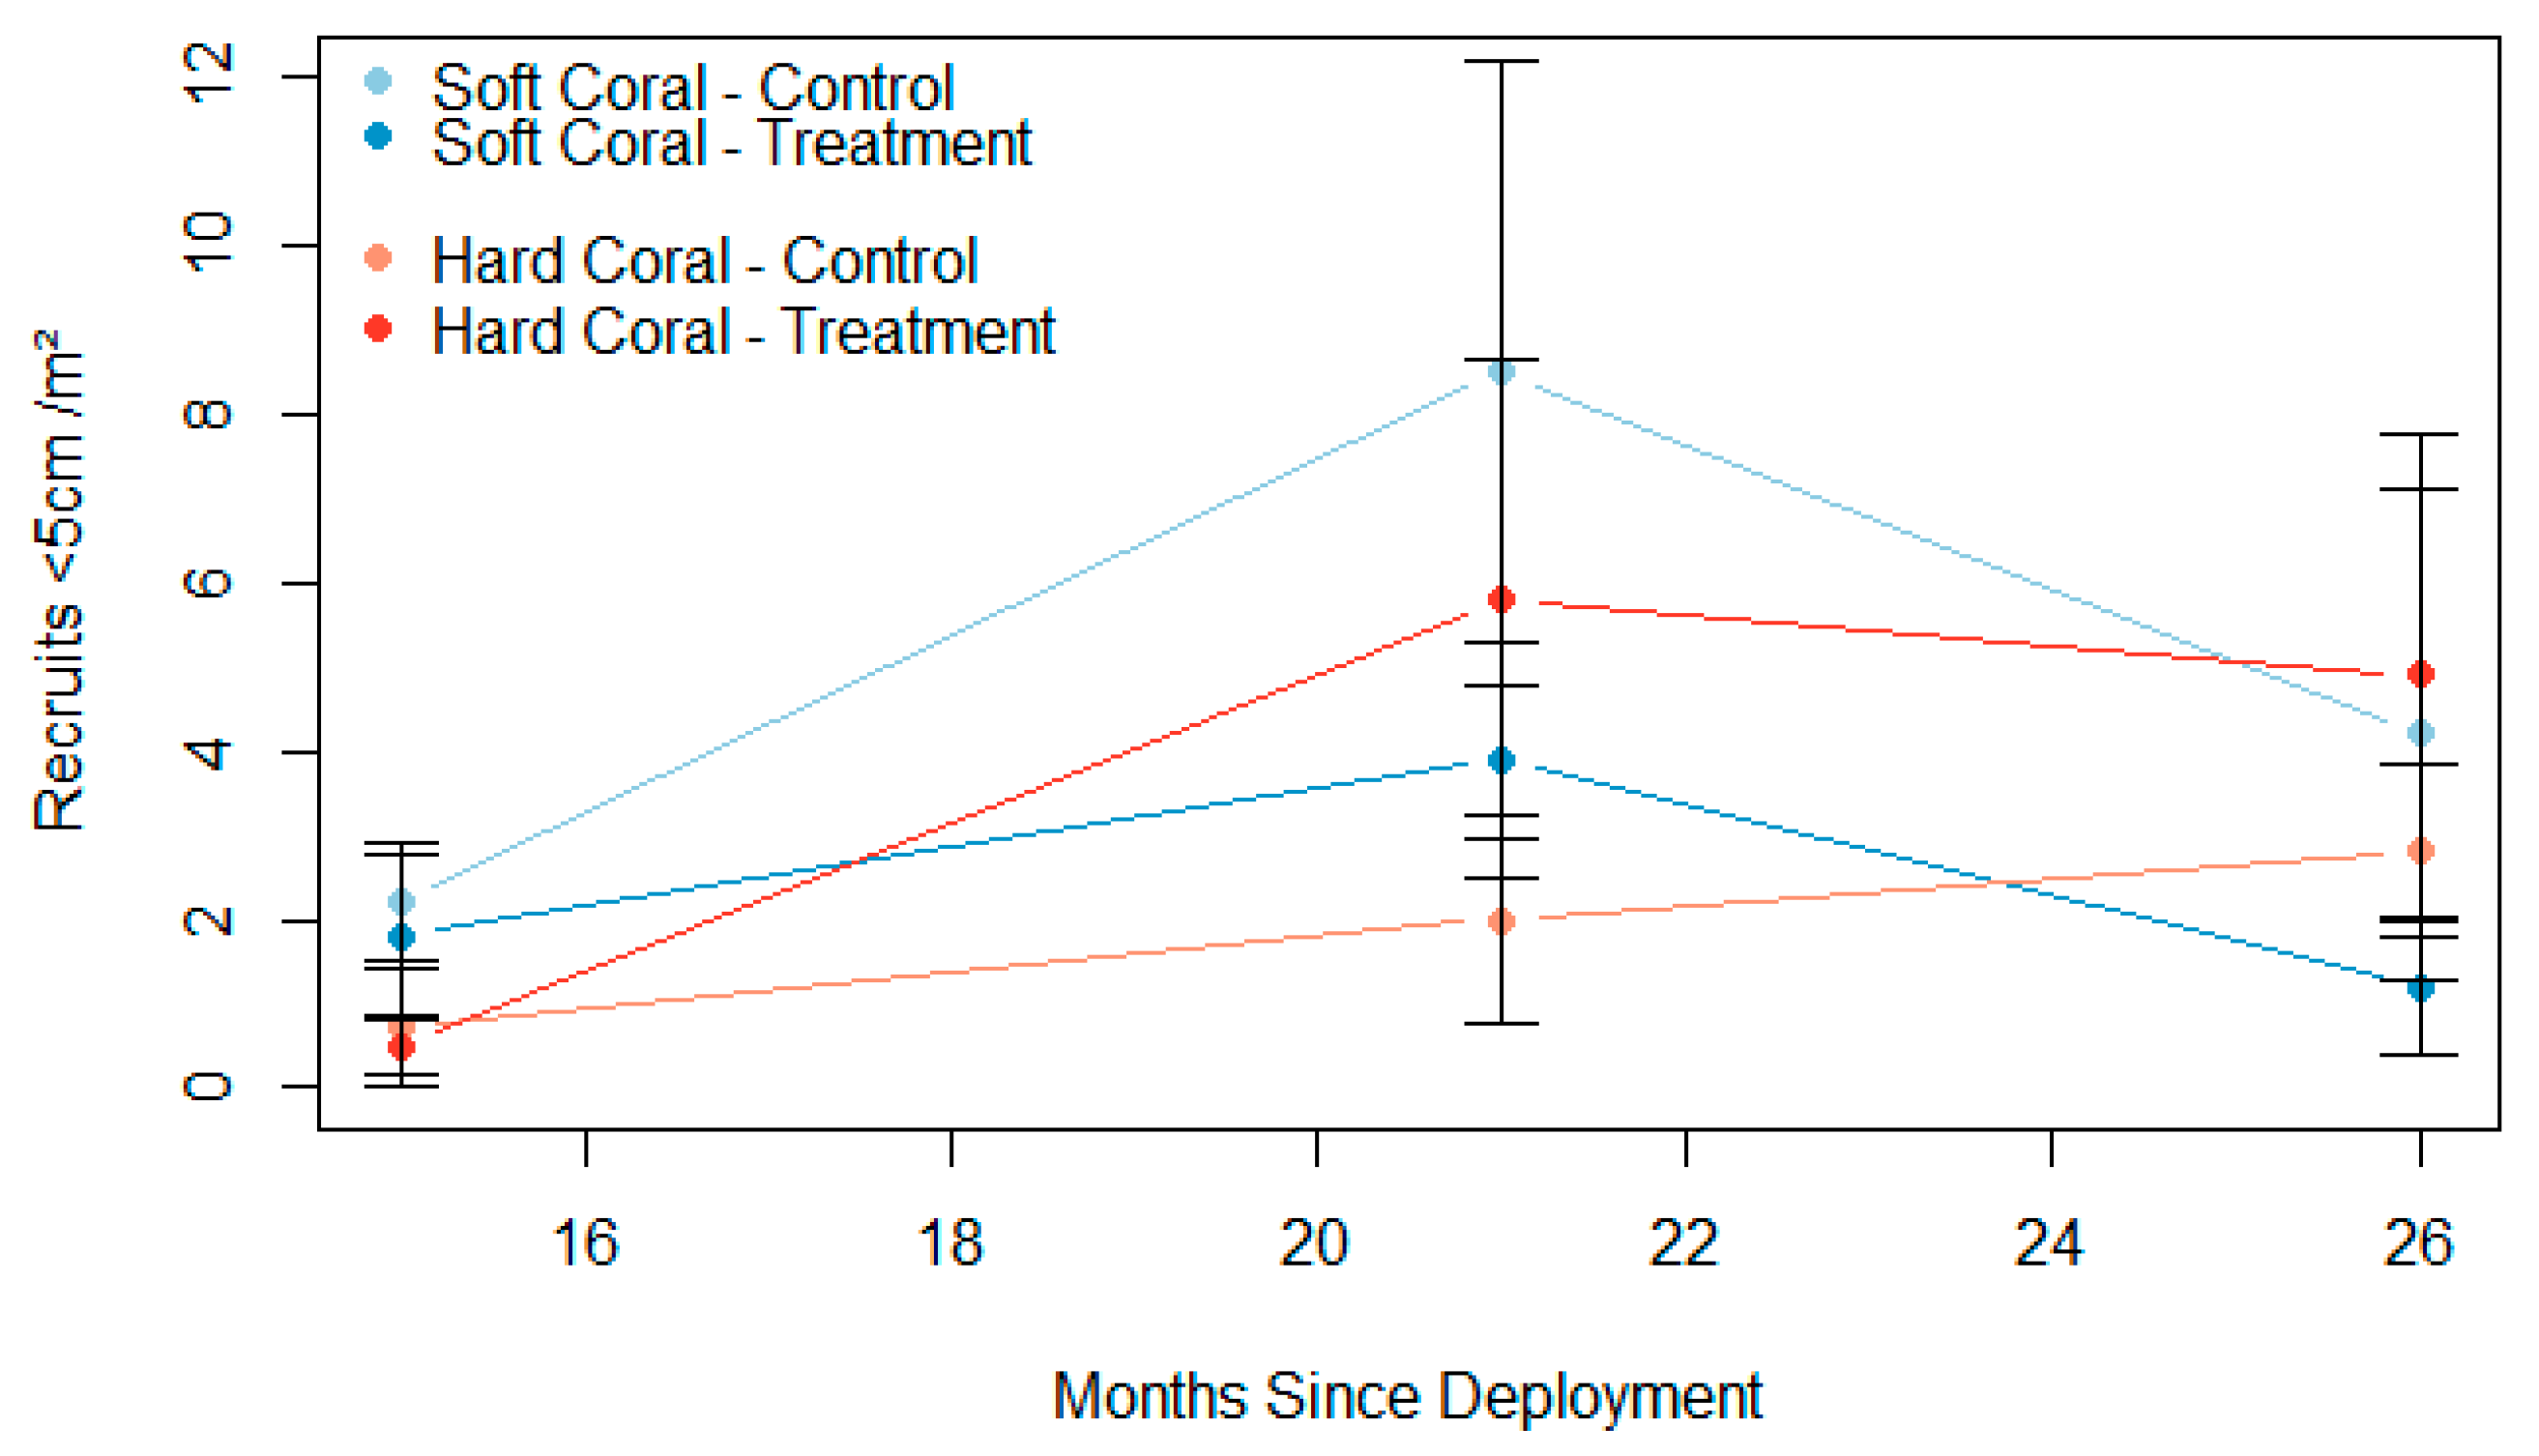
The number of hard coral recruits on control and treatment plots averaged 1.8 (±0.59 se) per m
2 and 3.7 (±1.37 SE) per m
2, respectively. On the other hand, the number of soft coral recruits on control and treatment plots averaged 4.97 (±1.61 SE) per m
2 and 2.3 (±0.64 SE) per m
2, respectively. Comparison of settler densities across time periods (16 months, 21 months, and 26 months), between control and treatment sections of the Greenhouse structure, and between hard and soft corals, showed no significant differences (
Figure 12).
4. Discussion
Our monitoring of the Coral Greenhouse artificial reef at John Brewer Reef, Queensland, Australia has been shaped by the legislative requirements of the Australian Government [
15] with a technical focus on engineering of the structures, changes to the marine ecology over time, aesthetics, satisfaction of tourists, and recruitment and survival of corals. These are important factors to measure to ensure that the structures are meeting their objectives and are having a positive impact on the marine environment and community.
4.1. Design and Durability of the Artificial Reef
The Coral Greenhouse and associated structures were designed for a 20–25 year lifespan and are generally performing well in normal weather conditions. The structure has not been exposed to extreme weather from a Tropical Cyclone. A number of maintenance issues, such as the replacement of anodes and joints, have been identified and actioned to optimise the service life of the facility. An ongoing research priority is scour and sedimentation associated with the facility. Our research indicates minor scour at three edges (east, west, north) of the structure and minor sedimentation at one edge of the structure (south). Scour can lead to undermining and instability [
30] and we will monitor to determine if scour protection is used to mitigate. Structural integrity is of utmost importance both for the longevity of the Greenhouse artificial reef and to protect the surrounding natural reefs [
14].
Even though the entire installation is submerged underwater, cyclonic wind events are the critical design condition. An example of the damage that can be caused by cyclones to underwater structures is documented in the investigation that occurred on the wreck of the SS Yongala following Cyclone Yasi, a Category 5 cyclone, in 2011. Large-scale damage to the wreck of the Yongala was documented and quantified by comparative analysis, including hull buckling, warping, and overall movement in the order of 5 m being noted in some areas [
31]. Waves can be generated by cyclonic wind speeds (165 km/h to 198 km/h for a 10 min gust), which have the potential to reach 5 to 5.9 m in height, respectively. This, in turn, creates lateral pressure pulses at the Greenhouse level (6 to 18 m below the surface), which must be resisted by the various structural systems.
4.2. Ecology
A synthesis of 39 relevant studies revealed that across reef ecosystems, artificial reefs support comparable levels of fish density, biomass, species richness, and diversity to natural reefs [
32,
33]. The increase of fish abundance by a factor of 3 a year after the installation of the Coral Greenhouse shows that the structures were effective in aggregating fish communities in the area. The added complexity of the structure on a bare sandy bottom also provided additional habitat for fish communities. Studies suggest that planktivorous and piscivorous fish are more abundant in artificial reefs than herbivorous species [
34]. Planktivorous fish use the artificial structures as a refuge when foraging for zooplankton [
35], while piscivorous fish and invertebrate feeders may be attracted to artificial reefs due to the presence of prey items hiding on complex structures [
36]. This coincides with the abundance of trevallies, fusiliers, barracuda, snappers, and sweetlips at the Coral Greenhouse. The high numbers of herbivores, such as parrotfish, surgeonfish, and damselfish, observed in the Coral Greenhouse may be due to the turf algae and other benthic organisms growing over the sculptures. Further studies would be useful to determine whether the Coral Greenhouse is enhancing production of fish or redistributing them within the ecosystem, and therefore, whether artificial reefs can be used to increase absolute fish abundance on coral reefs [
14].
This study focused solely on epifaunal macroinvertebrates, and therefore, does not account for the likely diversity contribution by more cryptic species, such as burrowing organisms, sessile invertebrates, and potentially, microinvertebrates. More detailed analysis of the benthos and its inhabitants, at the Coral Greenhouse and, for comparison, in surrounding areas away from the artificial reef would provide a more accurate overview of mobile invertebrate population. Population density of sea cucumber
Apostichopus japonicus in China was significantly higher within an artificial reef compared with outside the reef area [
37]. The difference was attributed to food (diatoms) [
37].
Artificial reefs featuring underwater art are still understudied. Preliminary studies of the Underwater Museum of Art in Cancún, Mexico, show that rugosity is increased by a factor of 16 to 20, and algae and sponges dominate the growth on the sculptures [
38]. The sculptures at the Coral Greenhouse, by comparison, have been dominated by sponges and soft coral, not algae. Rugosity measures have not been undertaken at the Coral Greenhouse.
The Coral Greenhouse is surrounded by a productive and diverse natural reef, which allows the movement of fish and some invertebrate communities between the two habitats. However, it also makes it challenging to isolate the effects of artificial structures on the fish community. Fish community structure on artificial reefs typically reaches equilibrium, or a state where it is similar to that of a natural reef, within 1 to 5 years, though close proximity to established reefs, natural or artificial, can reduce this time to 5 months [
39,
40,
41].
A citizen science project at the Coral Greenhouse has recorded high biodiversity of fish, invertebrates, and corals, with 284 species [
41]. This is much higher than the 74 species of fish and 10 species of invertebrates recorded in our study. iNaturalist observations are diverse and include species that are easy to photograph and taxa of interest to the observer.
4.3. Social Survey of Tourists
Visitor experience surveys indicated high satisfaction and did not differ significantly pre- and post-planting of corals. The score of 8.7 out of 10 was higher than scores of 4.3–8.5 for tourists in the Whitsundays [
8]. Other studies also quantify the high satisfaction of divers with artificial reef experiences [
42]. One factor that could be explored in future research is the relative experience of divers in relation to their answers to the survey. It has been shown that novice divers have a greater preference for and enjoyment of artificial reefs compared to more experienced divers, who prefer natural reefs [
43]. As custom designed artificial reefs are still a relatively new practice, it would also be of interest to explore preferences long term to determine whether experienced divers prefer mature artificial reef environments with greater biodiversity or disregard them altogether. Regardless, project objectives are crucial for planning, design, and implementation [
44].
Underwater aesthetic surveys showed significantly higher scores on the treatment of half of the museum for corals, fish, and art. This expectedly resulted in higher coral aesthetic values on the treatment half of the museum. Underwater aesthetic surveys for fish also showed that scores for treatment stations are significantly higher than control. The increased number of juvenile fish taking refuge on coral branches greatly affected the aesthetic value of treatment stations. Corals also improved the aesthetic value of art “giving life to the sculptures”. Aside from differences between treatment and control stations, we also observed that treatment stations 1, 2, and 3, where most corals were planted and more complex structures were installed, have higher scores than stations 4 and 5 with individual standing trees.
4.4. Coral Monitoring
One of the successful outcomes of artificial reef deployments has been its role as a target location for transplanted corals and natural recruitment from the water column [
14]. The Coral Greenhouse follows this trend by exhibiting high survivorship of transplanted corals (91.6%) and considerable natural recruitment of hard and soft corals on the Greenhouse structures. Longer-term monitoring could determine how successful the Greenhouse is in establishing mature corals beyond this initial assessment of coral survivorship and recruitment.
4.4.1. Coral Transplantation
Overall survival of corals planted on the Coral Greenhouse was very high at 91.6% over a 12-month period. A review of coral restoration methods that combined artificial reef deployment with coral transplantation reported a mean survival of 66% [
45]. Results at the Coral Greenhouse show high survival of transplanted coral colonies similar to other coral gardening projects. For example, in Belize, long term monitoring of transplanted corals demonstrated mean survival of 89% [
46]. To our knowledge, the transplantation of corals at depths of 12 to 18 m is the deepest successful transplantation experiment in Australia. This project was unique, as most projects plant corals in shallow water (2–10 m) habitats. All representative genera survived at the end of the monitoring period.
The planting of corals over artificial reef structures is a way to reduce the time needed for the structures to become dominated by biotic foundational organisms [
13,
47]. Prefabricated attachment locations, such as those developed for the Coral Greenhouse, allow for easy addition of coral colonies to enable rapid benthic community assemblage development. They also allow for habitat to be developed throughout sandy areas that otherwise would not support coral establishment and growth [
13,
47].
4.4.2. Coral Recruitment
Coral recruits to artificial structures versus natural reef habitats have been shown to consist of differing recruit densities and community compositions over time [
48,
49,
50]. Recruitment varies due to different structures and orientation, with, for example, steel structures resulting in lower invertebrate abundance and diversity than sandstone, Perspex, and wood [
51]. Soft corals, which comprised over 55% of the total coral recruits surveyed, are early settlers on artificial reefs due to their extended breeding season, their asexual propagation techniques, and their ability to colonise a wider range of substrates [
51,
52,
53]. Mean hard coral recruit density remained low, ranging from 2.8 to 4.9 hard coral recruits per m
2. This was less than observed on natural reefs of the same reef complex, where a mean of 9.7 hard coral recruits per m
2 was observed [
54], differing from prior research, where artificial reefs experienced higher recruit densities than natural reefs in the first year of deployment [
48]. This was less that the coral density of 6.0 ± 1.0 SE per m
2 at eight months post construction, increasing to 24.0 ± 2.1 SE per m
2 at 62 months post construction of the artificial concrete reef at Parker Point, Dampier, Western Australia [
50]. While hard coral recruit densities remain lower than nearby natural observations, direct comparisons are difficult due to the different depth profiles. Natural reefs are monitored at between 6–9 m depth while the depth at the Coral Greenhouse is between 12–17 m. The underwater art provided an opportunistic settlement location advantageously selected by soft coral recruits. The number of recruits fluctuated with the highest abundance observed in September 2021. This may be due to the annual spawning cycles across the Great Barrier Reef for many reef corals, including the dominant
Acropora spp. corals. With mass coral spawning occurring between October and December each year [
54,
55], there is a higher likelihood of coral recruits being more prominent in September than may be visible in March or February. Additionally, subsequent monitoring will be unlikley to include previous year’s recruits who have grown out of that size class.
5. Conclusions
The deployment of underwater sculptures is a new, novel way of providing a restorative response to vulnerable or damaged marine ecosystems and maintaining or enhancing marine tourism experiences; however, there may also be detractors during community consultation [
8]. The Coral Greenhouse appears to be the most extensively monitored artificial reef facility in Australia with engineering, ecological, social, aesthetics, and debris monitoring by scientists on an annual basis over the past five years and ongoing, as well as ecological monitoring by citizen scientists.
The London Convention and Protocol/UNEP [
56] provides guidance for artificial reefs and states that permits for artificial reefs are necessary to ensure that:
appropriate sites are selected
the materials are suitable and prepared properly
no significant adverse impacts on the marine environment occur, and
the reef does not pose a danger to navigation, fishermen or divers.
We contend that all of the above guidance has been applied rigorously, monitored, and quantified. The Coral Greenhouse site was chosen for its sheltered aspect, sandy substrate, and proximity to a healthy reef. Consequently, it has proven to be an appropriate site based on monitoring of engineering, ecological, and social indicators.
We rejected the null hypotheses that there were no changes over time in fish abundance, fish diversity, aesthetics of fish, coral, and art. We accepted the null hypotheses that there were no changes over time in invertebrate abundance, invertebrate diversity, and tourist perceptions of aesthetic values. Fish abundance and diversity at the artificial reef has increased over the three years since deployment by a factor of 5 and 4, respectively.
Visitor satisfaction with the museum was consistently high, while concerns regarding harm to the marine environment were low. The coral transplants improved the aesthetics of the museum for tourists, and the museum itself is not contributing to marine debris. Coral transplant survival was very high.
The Coral Greenhouse is located in a sheltered lagoon away from reef fishing areas, and at a depth that does not impact the navigation of vessels; therefore, it has caused few, if any, negative impacts to navigation, fishermen, or divers. The installation of three mooring buoys has assisted people in locating the Coral Greenhouse and provided an alternative to anchoring, mitigating negative impacts to the reef or the art.
Overall, the installation of the Coral Greenhouse and the transplantation of coral fragments onto the structures have contributed to an increase of the abundance and diversity of the marine community, have improved the aesthetics of the area with minimal impact to the environment, and have contributed to high visitor satisfaction. However, we caution that underwater sculptures and artificial reefs may also have environmental, social, economic, and cultural issues and impacts that must be considered and mitigated during the planning and operation stages of any major project.
Author Contributions
Conceptualization, A.S. and N.C.; methodology, A.S., N.C., A.J.S., R.R.; formal analysis, A.J.S., K.C.; resources, A.S.; data curation, A.S., N.C., A.J.S.; writing—original draft preparation, A.S., A.J.S., R.B.; writing—review and editing, A.S., N.C., A.J.S., R.B., K.C., R.R.; visualisation, A.J.S., K.C.; supervision, A.S.; project administration, A.S.; funding acquisition, A.S. All authors have read and agreed to the published version of the manuscript.
Funding
This research was funded by Museum of Underwater Art Pty Ltd. and Reef Ecologic Pty Ltd.
Institutional Review Board Statement
Informed Consent Statement
Informed consent was obtained from all subjects involved in the study.
Data Availability Statement
Acknowledgments
We acknowledge the Traditional Owners of the country in the Townsville region, the Wulgurukaba, Bindal and Manbarra people, and recognise their continuing connection to land, waters and culture. We pay our respects to their Elders past, present and emerging. We thank the MOUA Board particularly the Chairman Paul Victory, PVW Project management team and all of the tourists who completed surveys. We acknowledge Jason deCaires Taylor as the artist of Coral Greenhouse. We acknowledge past and present staff from Reef Ecologic and interns from James Cook University who assisted with the research.
Conflicts of Interest
The authors declare no conflict of interest.
References
- Hoegh-Guldberg, O.; Poloczanska, E.S.; Skirving, W.; Dove, S. Coral reef ecosystems under climate change and ocean acidification. Front. Mar. Sci. 2017, 4, 158. [Google Scholar] [CrossRef] [Green Version]
- Great Barrier Reef Marine Park Authority (GBRMPA). Great Barrier Reef Outlook Report 2019; GBRMPA: Townsville, Australia, 2019; p. 354.
- Eddy, T.D.; Lam, V.W.Y.; Reygondeau, G.; Cisneros-Montemayor, A.M.; Greer, K.; Palomares, M.L.D.; Bruno, J.F.; Ota, Y.; Cheung, W.W.L. Global decline in capacity of coral reefs to provide ecosystem services. One Earth 2021, 4, 1278–1285. [Google Scholar] [CrossRef]
- Andrello, M.; Darling, E.S.; Wenger, A.; Suárez-Castro, A.F.; Gelfand, S.; Ahmadia, G.N. A global map of human pressures on tropical coral reefs. Conserv. Lett. 2021, 15, e12858. [Google Scholar] [CrossRef]
- Keller, K.; Smith, J.A.; Lowry, M.B.; Taylor, M.D.; Suthers, I.M. Multispecies presence and connectivity around a designed artificial reef. Mar. Freshw. Res. 2017, 68, 1489–1500. [Google Scholar] [CrossRef] [Green Version]
- Lima, J.S.; Atalah, J.; Sanchez-Jerez, P.; Zalmon, I.R. Evaluating the performance and management of artificial reefs using artificial reef multimetric index (ARMI). Ocean Coast. Manag. 2020, 198, 105350. [Google Scholar] [CrossRef]
- Bortone, S.A.; Brandini, F.P.; Fabi, G.; Otake, S. Artificial Reefs in Fisheries Management, 1st ed.; CRC Press: Boca Raton, FL, USA, 2011; p. 366. [Google Scholar]
- Smith, A.K.; Cook, N.; Grundy, A.; Lück, M.; Pert, P.L.; Picken, F.; Stacey, J. Innovative local response to cyclone damaged reef leads to rapid tourism recovery. J. Ecotour. 2022. [Google Scholar] [CrossRef]
- Sutton, S.G.; Bushnell, S.L. Socio-economic aspects of artificial reefs: Considerations for the Great Barrier Reef Marine Park. Ocean Coast. Manag. 2007, 50, 829–846. [Google Scholar] [CrossRef]
- Dafforn, K.A.; Glasby, T.M.; Airoldi, L.; Rivero, N.K.; Mayer-Pinto, M.; Johnston, E.L. Marine urbanization: An ecological framework for designing multifunctional artificial structures. Front. Ecol. Environ. 2015, 13, 82–90. [Google Scholar] [CrossRef]
- Lemoine, H.R.; Paxton, A.B.; Anisfeld, S.C.; Rosemond, R.C.; Peterson, C.H. Selecting the optimal artificial reefs to achieve fish habitat enhancement goals. Biol. Conserv. 2019, 238, 108200. [Google Scholar] [CrossRef]
- Oren, U.; Benayahu, Y. Transplantation of juvenile corals: A new approach for enhancing colonization of artificial reefs. Mar. Biol. 1997, 127, 499–505. [Google Scholar] [CrossRef]
- Ortiz-Prosper, A.L.; Bowden-Kerby, A.; Ruiz, H.; Tirado, O.; Cabán, A.; Sanchez, G.; Crespo, J.C. Planting small massive corals on small artificial concrete reefs or dead coral heads. Bull. Mar. Sci. 2001, 69, 1047–1051. Available online: https://www.ingentaconnect.com/contentone/umrsmas/bullmar/2001/00000069/00000002/art00061 (accessed on 11 April 2022).
- Higgins, E.; Metaxas, A.; Schiebling, R.E. A systematic review of artificial reefs as platforms for coral reef research and conservation. PLoS ONE 2022, 17, e0261964. [Google Scholar] [CrossRef] [PubMed]
- Australian Government. CHECKLIST Underwater Artwork. Application Information; Great Barrier Reef Marine Park Authority: Townsville, Australia, 2020; pp. 1–4.
- GBRMPA. Policy Environmental Impact Management—Permission System. 2017; 15p. Available online: https://elibrary.gbrmpa.gov.au/jspui/retrieve/d82be212-cf32-405b-bc7f-62cc1dcca399/v1-Environmental-Impact-Management-Permission-System.pdf (accessed on 22 September 2022).
- Smith, A.; Cook, N.; Molinaro, G. MOUA Monitoring Plan 2021; John Brewer Reef: Townsville, Australia, 2021; p. 28. [Google Scholar]
- Smith, A.; Marshall, P.; Cook, N. Site Assessment of John Brewer Reef for a Proposed Museum of Underwater Art (MoUA), Townsville; Reef Ecologic: Townsville, Australia, 2018; p. 23. [Google Scholar]
- Smith, A.; Molinaro, G.; Cook, N.; Songcuan, A. 2020 Post Installation Site Assessment and Monitoring of Coral Greenhouse; John Brewer Reef; Reef Ecologic: Townsville, Australia, 2020; p. 38. [Google Scholar]
- Smith, A.; Cook, N.; Songcuan, A.; Molinaro, G.; Brown, R.; Cook, K. 2021 Site Assessment and Monitoring of John Brewer Reef; Reef Ecologic: Townsville, Australia, 2021; p. 36. [Google Scholar]
- Smith, A.; Songcuan, A.; Cook, N.; Molinaro, G.; Brown, R.; Wilke, M. Monitoring of Substrate, Ecology, Social, Marine Debris and Coral (Dhambi) Propagation Associated with Underwater Sculptures at John Brewer Reef, Townsville; Reef Ecologic: Townsville, Australia, 2022; p. 56. [Google Scholar]
- GBRMPA. Site Plan: John Brewer Reef (18-075)—Townsville/Whitsunday Management Area. 2021; 8p. Available online: https://elibrary.gbrmpa.gov.au/jspui/bitstream/11017/3820/1/v0-John-Brewer-Reef-18-075-Site-Plan.pdf (accessed on 22 September 2022).
- Museum of Underwater Art (MOUA). Coral Greenhouse. Available online: https://www.moua.com.au/coral-greenhouse (accessed on 28 August 2022).
- Smith, A.; Cook, N.; Stacey, J.; Molinaro, G.; Sartori, G.; Songcuan, A. MOUA Museum of Underwater Art. John Brewer Reef, Coral Greenhouse: A Dive Guide. 2020. Available online: https://reefecologic.org/wp-content/uploads/2020/04/2020-03-MOUA_JBR_Dive-Guide-V3.pdf (accessed on 22 September 2022).
- Guiness World Records. Largest Underwater art Structure. Available online: https://www.guinnessworldrecords.com/world-records/634464-largest-underwater-art-structure (accessed on 23 September 2022).
- Halford, A.R.; Thompson, A.A. Visual Census Surveys of Reef Fish: Long-term monitoring of the Great Barrier Reef. Stand. Oper. Proced. 1994, 3, 22. Available online: https://www.researchgate.net/publication/252552308_Visual_Census_Surveys_of_Reef_Fish (accessed on 22 September 2022).
- Nugent, J. iNaturalist. Sci. Scope 2018, 41, 12–13. Available online: https://www.proquest.com/docview/2009534937 (accessed on 29 August 2022). [CrossRef]
- Curnock, M.; Marshall, N.; Thiault, L.; Heron, S.F.; Hoey, J.; Williams, G.; Taylor, B.M.; Pert, P.L.; Goldberg, J. Shifts in tourists’ sentiments and climate risk perceptions following mass coral bleaching of the Great Barrier Reef. Nat. Clim. Chang. 2019, 9, 535–541. Available online: https://www.nature.com/articles/s41558-019-0504-y (accessed on 23 September 2022). [CrossRef]
- R Core Team. R: A Language and Environment for Statistical Computing; R Foundation for Statistical Computing: Vienna, Austria, 2013. [Google Scholar]
- North Queensland Engineering (NQE). Annual Inspection of the Museum of Underwater Art; North Queensland Engineering: Mysterton, Australia, 2021; p. 30. [Google Scholar]
- Draper, S.; Harris, J.M.; Cheng, L.; White, D.J. Seabed processes: Sediment transport, scour, and sedimentation. In Encyclopedia of Maritime and Offshore Engineering; Carlton, J., Jukes, P., Choo, Y.S., Eds.; Wiley: Oxford, UK, 2018. [Google Scholar]
- Stieglitz, T.C.; Waterson, P. Impact of Cyclone Yasi on the wreck of the SS Yongala documented by comparative multibeam bathymetry analysis. Qld. Archaeol. Res. 2013, 16, 33–44. [Google Scholar] [CrossRef] [Green Version]
- Holland, M.M.; Becker, A.; Smith, J.A.; Everett, J.D.; Suthers, I.M. Fine-scale spatial and diel dynamics of zooplanktivorous fish on temperate rocky and artificial reefs. Mar. Ecol. Prog. Ser. 2021, 674, 221–239. [Google Scholar] [CrossRef]
- Paxton, A.B.; Shertzer, K.W.; Bacheler, N.M.; Kellison, G.T.; Riley, K.L.; Taylor, J.C. Meta-analysis reveals artificial reefs can be effective tools for fish community enhancement but are not one-size-fits-all. Front. Mar. Sci. 2020, 7, 282. [Google Scholar] [CrossRef]
- Paxton, A.B.; Peterson, C.H.; Taylor, J.C.; Adler, A.M.; Pickering, E.A.; Silliman, B.R. Artificial reefs facilitate tropical fish at their range edge. Commun. Biol. 2019, 2, 168. [Google Scholar] [CrossRef] [Green Version]
- Champion, C.; Suthers, I.M.; Smith, J.A. Zooplanktivory is a key process for fish productivity on a coastal artificial reef. Mar. Ecol. Prog. Ser. 2015, 541, 1–14. [Google Scholar] [CrossRef] [Green Version]
- Zhang, L.; Zhang, T.; Xu, Q.; Qiu, T.; Yang, H.; Liu, S. Artificial oyster-shell reef for the culture and stock enhancement of sea cucumber, Apostichopus japonicus, in shallow seawater. Aquac. Res. 2015, 46, 2260–2269. [Google Scholar] [CrossRef]
- Solís-Weiss, V.; Toledano-Granados, A.; González-Cano, J.; Jost, N. Biodiversity associated to the sponges and algae of the sculptures of the Underwater Museum of Art (“MUSA”), Cancún, Mexico. PeerJ Prepr. 2018, 6, e26548v26541. [Google Scholar] [CrossRef]
- Paxton, A.B.; Revels, L.E.; Rosemond, R.C.; Hoeck, R.V.V.; Lemoine, H.R.; Taylor, J.C.; Peterson, C.H. Convergence of fish community structure between a newly deployed and an established artificial reef along a five-month trajectory. Ecol. Eng. 2018, 123, 185–192. [Google Scholar] [CrossRef]
- Walker, S.J.; Schlacher, T.A. Limited habitat and conservation value of a young artificial reef. Biodivers. Conserv. 2014, 23, 433–447. [Google Scholar] [CrossRef]
- Coral Greenhouse, John Brewer Reef. Available online: https://inaturalist.ala.org.au/projects/coral-greenhouse-john-brewer-reef (accessed on 20 October 2022).
- Stolk, P.; Markwell, K.; Jenkins, J. Perceptions of Artificial Reefs as Scuba Diving Resources: A Study of Australian Recreational Scuba Divers. Ann. Leis. Res. 2005, 8, 153–166. [Google Scholar] [CrossRef]
- Kirkbride-Smith, A.E.; Wheeler, P.M.; Johnson, M.L. The relationship between diver experience levels and perceptions of attractiveness of artificial reefs—Examination of a potential management tool. PLoS ONE 2013, 8, e68899. [Google Scholar] [CrossRef]
- Meyers, R. Bodies of Water: Designing Resilient Dive Tourism through Underwater Sculpture. Master’s Thesis, University of Rhode Island, Kingston, RI, USA, 2018. [Google Scholar]
- Boström-Einarsson, L.; Babcock, R.C.; Bayraktarov, E.; Ceccarelli, D.; Cook, N.; Ferse, S.C.A.; Hancock, B.; Harrison, P.; Hein, M.; Shaver, E.; et al. Coral restoration—A systematic review of current methods, successes, failures and future directions. PLoS ONE 2020, 15, e0226631. [Google Scholar] [CrossRef]
- Carne, L.; Kaufman, L.; Lord, K.S. Measuring success for Caribbean acroporid restoration: Key results from ten years of work in southern Belize. In Proceedings of the 13th International Coral Reef Symposium, Honolulu, HI, USA, 19–24 June 2016. [Google Scholar]
- Ammar, M.S.A.; El-Gammal, F.; Nassar, M.; Belal, A.; Farag, W.; El-Mesiry, G.; El-Haddad, K.; Orabi, A.; Abdelreheem, A.; Shaaban, A. Review: Current trends on coral transplantation—An approach to preserve biodiversity. Biodiversitas 2013, 14, 43–53. [Google Scholar] [CrossRef]
- Fadli, N.; Campbell, S.J.; Ferguson, K.; Keyse, J.; Rudi, E.; Riedel, A.; Baird, A. The role of habitat creation in coral reef conservation: A case study from Aceh, Indonesia. Oryx 2012, 46, 501–507. [Google Scholar] [CrossRef] [Green Version]
- Monchanin, C.; Mehrotra, R.; Haskin, E.; Scott, C.M.; Plaza, P.U.; Allchurch, A.; Arnold, S.; Magson, K.; Hoeksema, B.W. Contrasting coral community structures between natural and artificial substrates at Koh Tao, Gulf of Thailand. Mar. Environ. Res. 2021, 172, 105505. [Google Scholar] [CrossRef]
- Blakeway, D.; Byers, M.; Stoddart, J.; Rossendell, J. Coral colonisation of an artificial reef in a turbid nearshore environment, Dampier Harbour, western Australia. PLoS ONE 2013, 8, e75281. [Google Scholar] [CrossRef] [PubMed] [Green Version]
- Ushiama, S.; Smith, J.A.; Suthers, I.M.; Lowry, M.; Johnston, E.L. The effects of substratum material and surface orientation on the developing epibenthic community on a designed artificial reef. Biofouling 2016, 32, 1049–1060. [Google Scholar] [CrossRef] [PubMed]
- Perkol-Finkel, S.; Benayahu, Y. Community structure of stony and soft corals on vertical unplanned artificial reefs in Eilat (Red Sea): Comparison to natural reefs. Coral Reefs 2004, 23, 195–205. [Google Scholar] [CrossRef]
- Rodriguez, M.V.B.; Segumalian, C.S.; Lalas, J.A.A.; Maningas, J.M.C. Octocorals outcompete scleractinian corals in a degraded reef. IOP Conf. Ser. Earth Environ. Sci. 2020, 420, 012027. [Google Scholar] [CrossRef]
- Australian Institute of Marine Science (AIMS). Reef Monitoring March 2022, John Brewer Reef. 2022. Available online: https://apps.aims.gov.au/reef-monitoring/reef/john%20brewer%20reef/juvenile (accessed on 22 September 2022).
- Harrison, P.L.; Babcock, R.C.; Bull, G.D.; Oliver, J.K.; Wallace, C.C.; Willis, B.L. Mass spawning in tropical reef corals. Science 1984, 223, 1186–1189. [Google Scholar] [CrossRef] [PubMed]
- United Nations Environment Programme (UNEP). London Convention and Protocol UNEP: Guidelines for the Placement of Artificial Reefs. 2009; 95p. Available online: http://hdl.handle.net/20.500.11822/2337 (accessed on 23 September 2022).
Figure 1.
Map of John Brewer Reef in Townsville, Queensland, Australia. Coral Greenhouse installation location in red box.
Figure 1.
Map of John Brewer Reef in Townsville, Queensland, Australia. Coral Greenhouse installation location in red box.
Figure 2.
Coral Greenhouse sculpture at John Brewer Reef with a snorkeller in the background for scale. Photo credit Jason deCaires taylor (Top). Representative photo of individual sculptures of trees and people. Photo credit Matt Curnock (Bottom).
Figure 2.
Coral Greenhouse sculpture at John Brewer Reef with a snorkeller in the background for scale. Photo credit Jason deCaires taylor (Top). Representative photo of individual sculptures of trees and people. Photo credit Matt Curnock (Bottom).
Figure 3.
Location of underwater sculptures and 3 × 50 m transects at Coral Greenhouse site.
Figure 3.
Location of underwater sculptures and 3 × 50 m transects at Coral Greenhouse site.
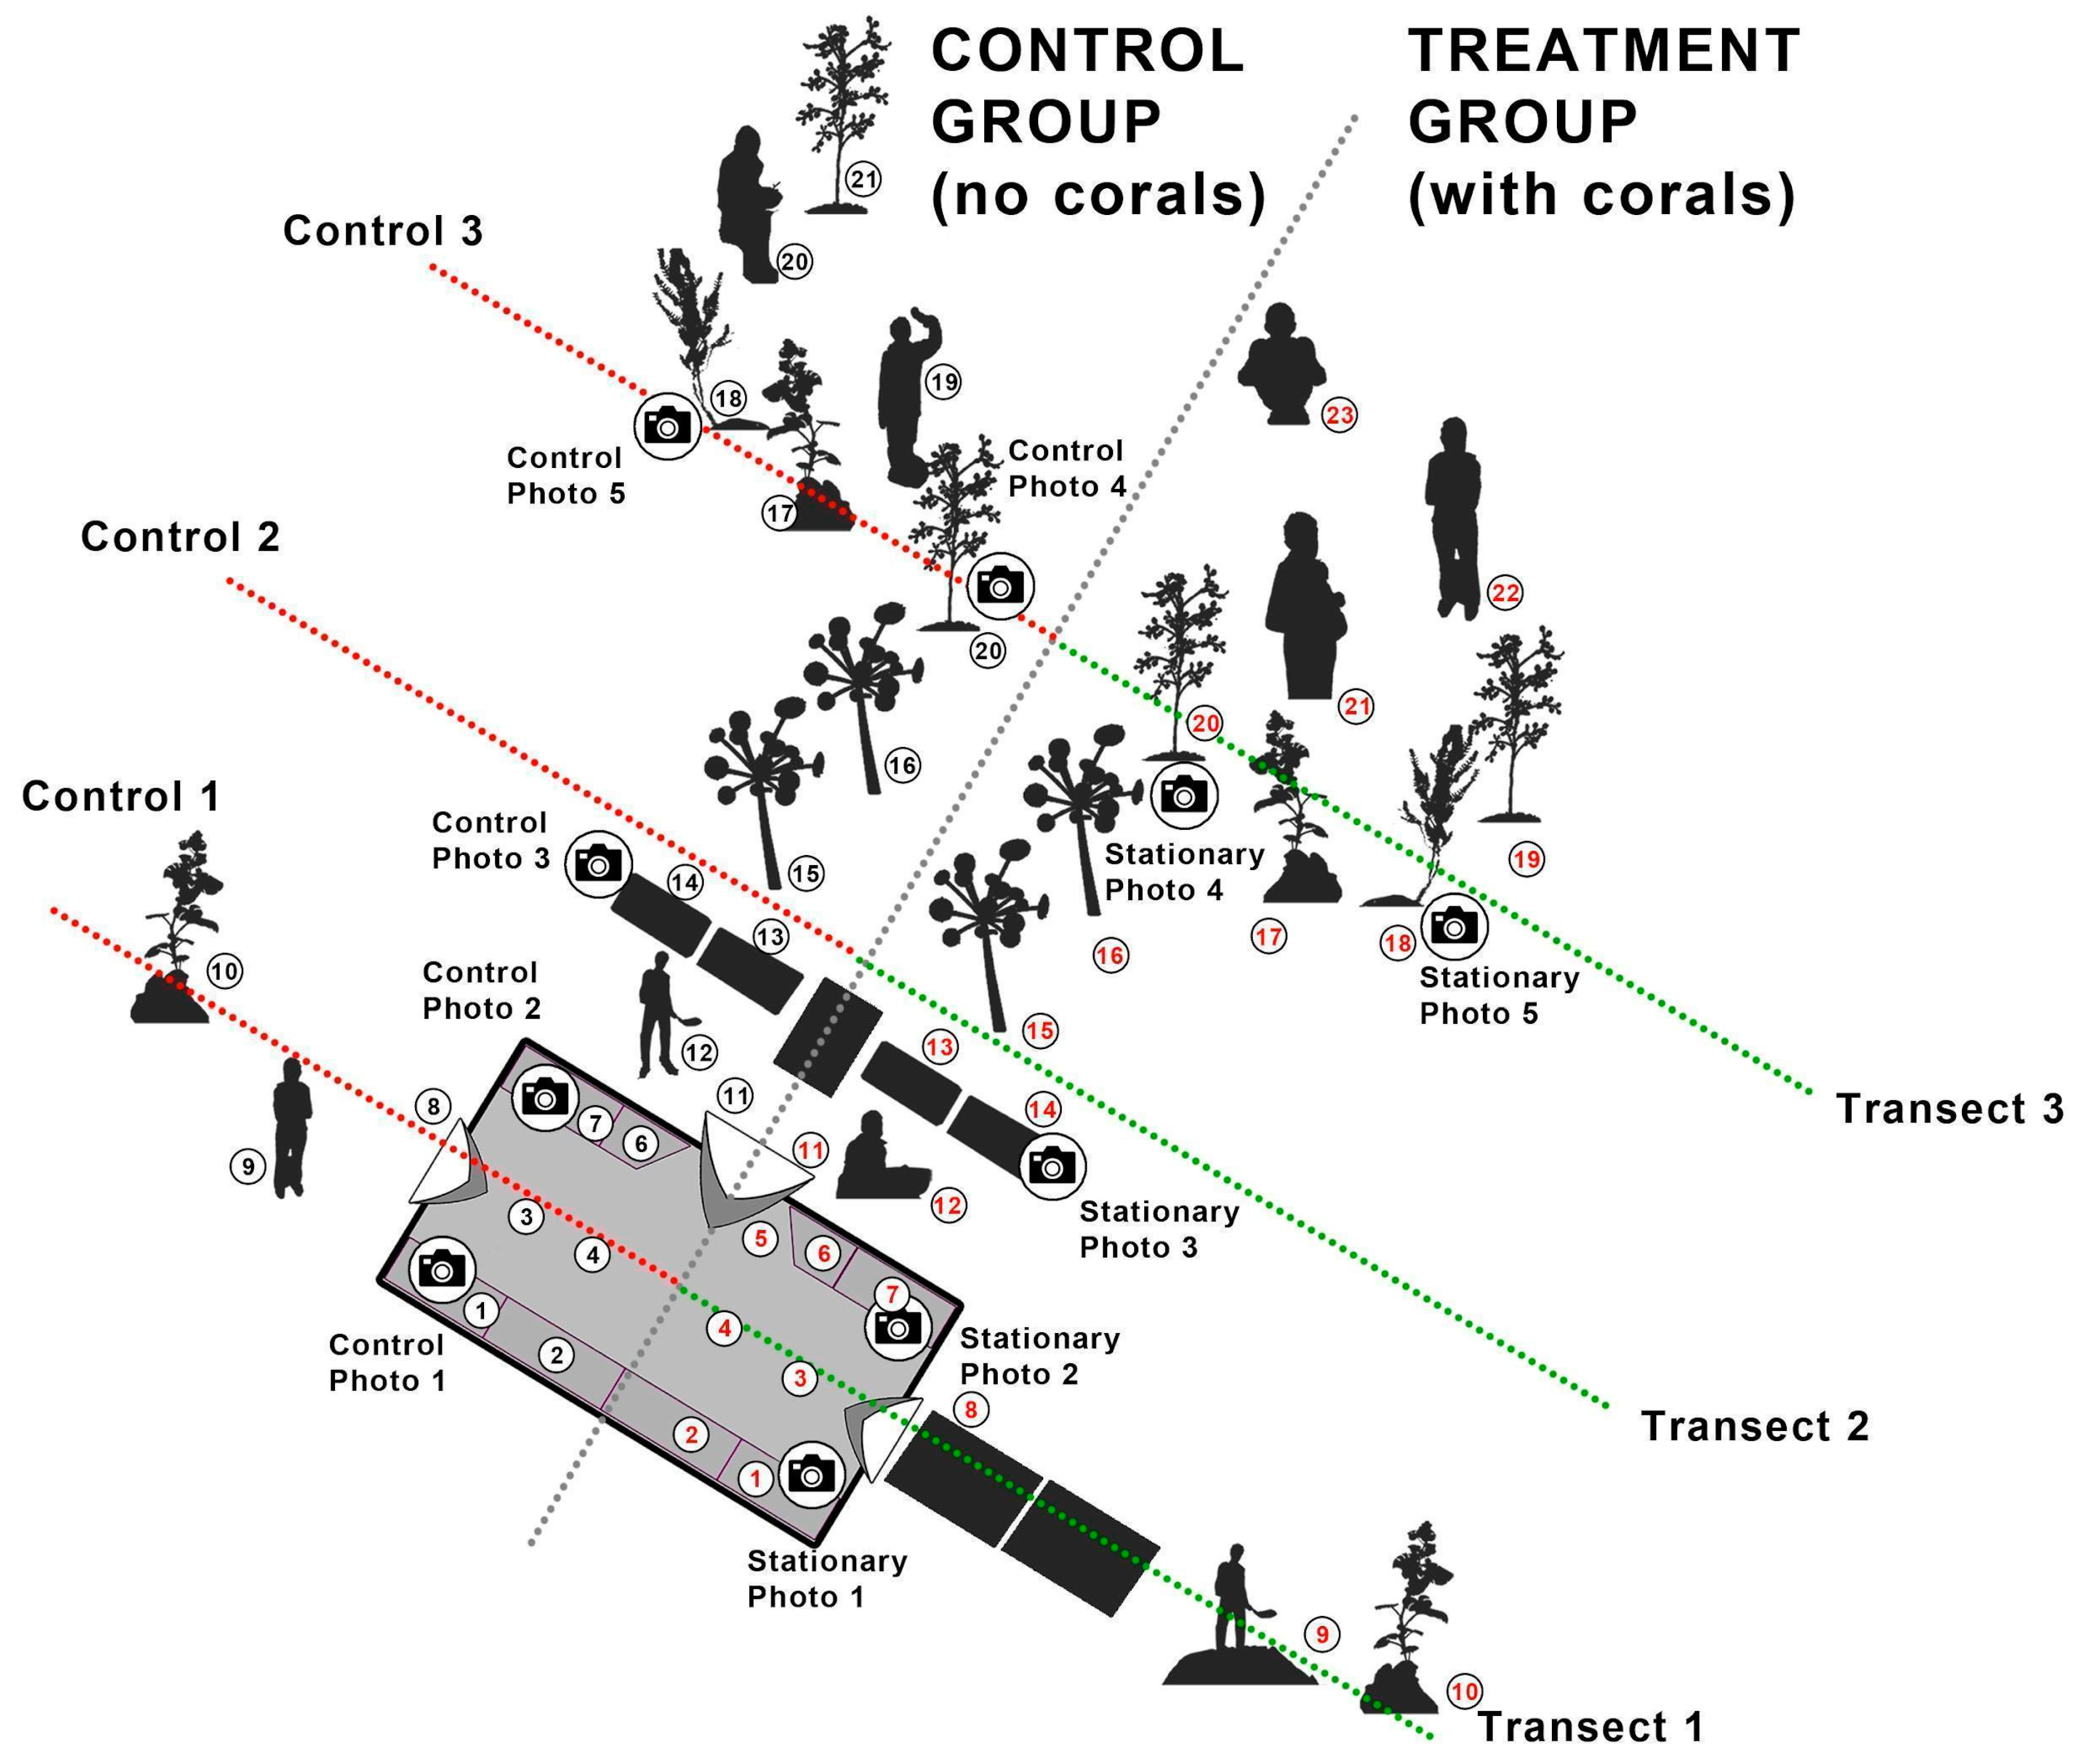
Figure 4.
Coral Greenhouse layout showing sculpture locations, transect locations, stationary point photo locations and transplantation sites for treatment and control locations. Numbers in red are locations for coral planting and monitoring. Numbers in black are locations for control (no coral planting).
Figure 5.
Coral Greenhouse foundation corners—(a) West; (b) South.
Figure 5.
Coral Greenhouse foundation corners—(a) West; (b) South.
Figure 6.
Non-metric multidimensional scaling (NMDS) using Bray-Curtis dissimilarities of fish community on permanent transects at MOUA from 2018 to 2022 (2D stress value = 0.08).
Figure 6.
Non-metric multidimensional scaling (NMDS) using Bray-Curtis dissimilarities of fish community on permanent transects at MOUA from 2018 to 2022 (2D stress value = 0.08).
Figure 7.
Comparing the mean abundance, mean species richness and mean diversity of fish across time between fish (n = 75) and invertebrates (n = 10). Baseline (2018) (Baseline) indicates results before the installation of the Coral Greenhouse. Deployment (2019) (Deployment) indicates the year when the Coral Greenhouse was deployed (no results were collected this year). p-values were calculated by t-tests of the coefficient of the linear model testing if the gradient was equal to 0. Error bars indicate the standard error of each time period.
Figure 8.
Mean abundance across three transects of fish (left) and macroinvertebrate (right) species ordered by species with highest representation across 2018–22. The 10 species with the greatest representation are displayed.
Figure 8.
Mean abundance across three transects of fish (left) and macroinvertebrate (right) species ordered by species with highest representation across 2018–22. The 10 species with the greatest representation are displayed.
Figure 9.
Average rating of agreement per statement: Before (n = 142) (blue) and After (n = 94) (orange) coral transplantation (14 March 2021).
Figure 9.
Average rating of agreement per statement: Before (n = 142) (blue) and After (n = 94) (orange) coral transplantation (14 March 2021).
Figure 10.
Average aesthetic rating in control versus treatment for each category (n = 7). Error bars represent the standard error. Asterisks represent statistical differences between control and treatment groups of each category, as determined by a t-test (*: p-value = < 0.05, **: p-value = < 0.01, ***: p-value = < 0.001).
Figure 11.
Survivorship of propagated corals on the Coral Greenhouse at 1, 6, and 12 months. Non-linear regression was conducted by minimising the residuals of the form where a, k and c are constants. R-squared = 0.96.
Figure 11.
Survivorship of propagated corals on the Coral Greenhouse at 1, 6, and 12 months. Non-linear regression was conducted by minimising the residuals of the form where a, k and c are constants. R-squared = 0.96.
Figure 12.
Mean number of hard and soft coral recruits observed on Coral Greenhouse. Error bars show standard error of means. No statistically significant difference between control and treatment or hard and soft coral across time.
Figure 12.
Mean number of hard and soft coral recruits observed on Coral Greenhouse. Error bars show standard error of means. No statistically significant difference between control and treatment or hard and soft coral across time.
Table 1.
Statistical analysis performed to compare different variables.
Table 1.
Statistical analysis performed to compare different variables.
| Hypothesis | Independent Variable | Dependent Variable | Statistical Analysis |
|---|
| The installation of underwater art at John Brewer Reef does not affect fish community structure (abundance, species richness and biodiversity) over time. | Time (year) | Abundance, Species richness, Biodiversity Index | t-test of linear regression coefficients, PERMANOVA
of 4th Root Transformation, Pairwise Student’s t-Test |
| The installation of underwater art at John Brewer Reef does not affect invertebrate community structure (abundance, species richness and biodiversity) over time. | Time (year) | Abundance, Species richness, Biodiversity Index | t-test of linear regression coefficients, PERMANOVA, Pairwise Student’s t-test |
| Planting corals on the underwater art has no effect on the overall aesthetic value of the Coral Greenhouse and visitor experience. | Time (before and after planting corals) | Survey scores
(10 = Strongly Agree, 1 = Strongly Disagree) | Student’s t-test |
| Planting corals on the underwater art has no effect on the underwater aesthetic value of the Coral Greenhouse (fish, coral and art). | Control and treatment groups | Survey scores
(1 = lowest, 10 = highest) | ANOVA |
Table 2.
Coral Greenhouse corner seabed measurements—difference from top of base frame to seabed (unit: mm).
Table 2.
Coral Greenhouse corner seabed measurements—difference from top of base frame to seabed (unit: mm).
| Date | East | South | West | North | Design |
|---|
| 28 November 2021 | 550 | 1020 | 850 | 570 | 900 |
Table 3.
Total number of species and individual fish observed in the Coral Greenhouse from 2018 to 2022.
Table 3.
Total number of species and individual fish observed in the Coral Greenhouse from 2018 to 2022.
| | 2018 | 2020 | 2021 | 2022 |
|---|
| Total number of fish species | 12 | 32 | 41 | 46 |
| Total abundance | 65 | 193 | 257 | 321 |
Table 4.
PERMANOVA (permutational multivariate analysis of variance) with a 4th root transformation testing for a difference in the biodiversity of fish at Coral Greenhouse across time. A million permutations were used with the transect as a blocking factor. p-values were adjusted to account for repeated cases using the Benjamini and Hochberg method (1995). Significant values in bold.
| Fish | Df | Sum Sq | R2 | F Value | Pr(>F) | Adjusted |
|---|
| Time | 1 | 0.7102 | 0.2005 | 2.4723 | 3 × 10⁻⁴ | 6 × 10⁻⁴ |
| Transect | 2 | 0.5337 | 0.1507 | 0.9289 | 0.6066 | 0.6066 |
| Residuals | 8 | 2.2981 | 0.6488 | | | |
Table 5.
PERMANOVA (permutational multivariate analysis of variance).testing for a difference in the biodiversity of macroinvertebrates at the Coral Greenhouse across time. A million permutations were used with the transect as a blocking factor. p-values were adjusted to account for repeated cases using Benjamini and Hochberg method (1995).
| Invertebrates | Df | Sum Sq | R2 | F Value | Pr(>F) | Adjusted |
|---|
| Time | 1 | 0.4766 | 0.1597 | 1.8243 | 0.1364 | 0.2728 |
| Transect | 2 | 0.4181 | 0.1401 | 0.8003 | 0.6119 | 0.6119 |
| Residuals | 8 | 2.0898 | 0.7002 | |
Table 6.
Pairwise comparison of fish abundance, species richness and diversity for pre-installation (2018) and post-installation (2020–22). Significant values in bold.
Table 6.
Pairwise comparison of fish abundance, species richness and diversity for pre-installation (2018) and post-installation (2020–22). Significant values in bold.
| | Year | Mean | sd | df | t Statistic | p-Value |
|---|
| Abundance | | | | | |
| 2018 × 2020 | 2018 | 21.66667 | 24.00694 | 3 | −1.51844 | 0.113102 |
| | 2020 | 64.33333 | 42.33596 | | | |
| 2018 × 2021 | 2018 | 21.66667 | 24.00694 | 4 | −2.66461 | 0.02806 |
| | 2021 | 85.66667 | 33.97548 | | | |
| 2018 × 2022 | 2018 | 21.66667 | 24.00694 | 4 | −3.61749 | 0.011203 |
| | 2022 | 107 | 33.06055 | | | |
| Species richness | | | | | |
| 2018 × 2020 | 2018 | 4.333333 | 4.932883 | 4 | −2.25084 | 0.043782 |
| | 2020 | 14 | 5.567764 | | | |
| 2018 × 2021 | 2018 | 4.333333 | 4.932883 | 4 | −2.9076 | 0.021892 |
| | 2021 | 19 | 7.211103 | | | |
| 2018 × 2022 | 2018 | 4.333333 | 4.932883 | 3 | −4.01571 | 0.013861 |
| | 2022 | 26 | 7.937254 | | | |
| Diversity | | | | | | |
| 2018 × 2020 | 2018 | 0.804887 | 0.885293 | 2 | −2.28759 | 0.074708 |
| | 2020 | 2.008681 | 0.216813 | | | |
| 2018 × 2021 | 2018 | 0.804887 | 0.885293 | 3 | −2.54433 | 0.04218 |
| | 2021 | 2.21776 | 0.375951 | | | |
| 2018 × 2022 | 2018 | 0.804887 | 0.885293 | 3 | −3.17695 | 0.025106 |
| | 2022 | 2.569205 | 0.376159 | | | |
Table 7.
Analysis of underwater aesthetic scores for corals, fish and art using ANOVA.
Table 7.
Analysis of underwater aesthetic scores for corals, fish and art using ANOVA.
| | p-Value |
|---|
| Corals | |
| control × treatment | p < 0.001 |
| within treatment | p = 0.0037 |
| Fish | |
| control × treatment | p = 0.003 |
| within treatment | 0.033 |
| Art | |
| control × treatment | p = 0.008 |
| within treatment | p < 0.05 |
| Publisher’s Note: MDPI stays neutral with regard to jurisdictional claims in published maps and institutional affiliations. |
© 2022 by the authors. Licensee MDPI, Basel, Switzerland. This article is an open access article distributed under the terms and conditions of the Creative Commons Attribution (CC BY) license (https://creativecommons.org/licenses/by/4.0/).


 ,
, 


