Article

Ship Production Planning Using Shipbuilding System Modeling and Discrete Time Process Simulation

1
Graduate School of Engineering Science, Yokohama National University, Yokohama 240-8501, Japan
2
Faculty of Engineering, Institute of Advanced Sciences, Yokohama National University, Yokohama 240-8501, Japan
3
Institute of Advanced Sciences, Yokohama National University, Yokohama 240-8501, Japan
*
Author to whom correspondence should be addressed.
J. Mar. Sci. Eng. 2022, 10(2), 176; https://doi.org/10.3390/jmse10020176
Submission received: 31 December 2021 / Revised: 20 January 2022 / Accepted: 25 January 2022 / Published: 28 January 2022
(This article belongs to the Special Issue Advances in Ship Design)

Abstract

:
Production planning is an important factor for production efficiency in the shipyard. However, planning is currently executed by manual operations based on the experience of field workers because of the complexity of the target shipbuilding project. This paper proposes a method of creating a realistic production plan automatically by modeling the complex shipbuilding project and using the developed process simulation. Specifically, we propose a method to represent the target shipbuilding process by four system models—Product, Workflow, Workplace, and Team. By executing the developed process simulation using system models, a Gantt chart can be created as a realistic production plan. From the case studies of a virtual shipyard manufacturing a ship hull block, it can be said that the proposed method can create a good production plan considering the complexity of the target shipbuilding project. In addition, the proposed method can evaluate the bottleneck of the target shipyard and the re-allocation plan for workers quantitatively.

1. Introduction

The production process in a shipyard represents one of the most complex production systems in the manufacturing industry. A ship is an enormous collection of individual parts, with each VLCC (very large crude carrier) said to have 100,000 hull parts and 300,000 outfitting parts. Since all these parts are of different types and sizes, the shipbuilding process requires different workloads, procedures and personnel with skills of various trades. Unlike mass-produced ATO (Assemble to Order) industries, such as automobiles and electronic devices, ships are classified as ETO (Engineering to Order) industries [1]. Customers often request specification changes and revisions, and a flexible and rapid response to changes in customer requirements is required throughout the entire process from design to production [2]. Therefore, It is the significant job of the production manager to plan how to efficiently and cost-effectively accumulate the huge number of parts into a single ship.
Production planning is an essential factor directly related to construction costs and duration. In addition, it is necessary to compare multiple plans in a short period, taking into account the constraints of production resources. However, since the vast amount of information for the entire shipyard is not centrally managed, production planning and management are still done manually. Manual operations are time-consuming, costly, difficult to plan optimally, and do not allow for flexible responses to unexpected changes. However, with the recent trend of digitization, the use of IoT (Internet of Things) technology and simulation are becoming more and more significant in shipbuilding [3,4]. A simulation-based approach to production planning is expected to streamline the work strategy time, resulting in significantly higher productivity [5,6,7]. To improve production planning in shipyards, which relies on manual work and the experience of workers, research has been done to design and develop an organized system that can automatically create production plans. Woo et al. [8] focused on the processing shop of a shipyard and created a simulation model of an indoor factory. The PPR (Product, Process, and Resource) information model was used to create the simulation model. In addition to the PPR, Lee et al. [9] pointed out that schedule information, which subdivides production resources, is very important. They applied the PPR-S (Product, Process, Resource, and Schedule) model, an improved version of the PPR model, to define a process-centric simulation modeling approach that reflects the characteristics of ship production. J. H. Woo et al. [10] introduced a decision-making system that can perform logistics verification on scheduling and layout changes using a block logistics simulation model that reflects product, process, resource, and schedule data of the shipbuilding industry in a unified manner. Jeong et al. [11] proposed a framework based on a six-element information model defined based on PPR3-S that can perform process-centered simulation considering the KPI (Key Performance Index) of a shipyard. The master plan of the shipyard was validated based on the proposed framework. Nam et al. [12] analyzed the process of shipbuilding production planning and developed an Advanced Planning System (APS) that can establish a long-term production plan. S. Hellgren [13] uses Bayesian networks to model the shipbuilding process of a cruise ship and analyzes and reports on how three different organizational types of the shipbuilding process affect production efficiency. Sender et al. [14] perceived that in shipyard planning, an integrated consideration of production and logistics resources is necessary to guarantee a sophisticated planning procedure. They introduced an approach to model the shipyard specific transport processes and integrate these processes into a shipyard simulation tool called YardPlan 2.0. Chong et al. [15] proposed an optimized model of the real-time optimal path for a transporter and established an optimal scheduling method considering path missing. To minimize delivery delays of sub-contractors to the shipyard, J G. Park et al. [16] developed the entering order optimization algorithm and work-volume assignment optimization algorithm. Aoyama et al. [17] and Takechi et al. [18] have built a shipbuilding factory simulator, a production schedule planning support system, and a surface plate planning simulator by modeling using Petri nets. Mitsuyuki et al. [19] have proposed an evaluation method for the effect of introducing production facilities in the shipbuilding process, taking into account the constraints of the work location and the skills of the workers, and have verified the effect of the introduction. As for research on improving the accuracy of planning, Steinhauer et al. [20] focused on the uncertainty in the early stage of production planning and took an approach to reduce the uncertainty in the processing time through an estimation process that linking the bill of material to process times. Choi et al. [21] proposed a method for calculating the man-hours required for assembly, which is the basis for preparing the basic unit. Based on a ship’s computerized three-dimensional geometric model, they developed a method that generates the geometric properties and production information required for calculating the metric.
The above studies improved the efficiency of production control operations by using factory modeling methods and simulation runs. However, these studies focus on a part of the shipbuilding process or a simplified product/process model. Furthermore, although there are many studies that target medium- and long-term plans such as master plans, there are few examples of granular planning methods that can actually be used by workers and practical applications. It is necessary to broaden the scope of the simulation, which is only partial, and to study the overall optimization by modeling the entire factory. For this purpose, it is extremely important to research and develop a production resource model that represents facilities and operations involving workers unique to shipbuilding.
Therefore, the objective of this paper is to automatically create a production plan at a practical level, taking into account the complex production system unique to the shipbuilding process. Specifically, we propose a method for system modeling of complex product, process and resources constraints in a flexible manner. By executing developed process simulation, a realistic and good production plan can be obtained. In addition, a more detailed analysis such as a quantitative assessment of bottlenecks and a re-allocation plan for workers can be done by using the created model and the developed process simulation.

2. Proposed Methods

Figure 1 shows the overview of the proposed method. In the proposed method, the simulation model of the target shipbuilding process is created by system modeling. By executing process simulation using the simulation model, a realistic production plan is created as a Gantt chart form.
In this paper, we describe the proposed method using a simple three-plate model fabrication process in a certain shipyard as an example. The three-plate model consisted of three steel plates welded together in an I-shape as shown in Figure 1. To examine the target shipbuilding process in a process simulation, all the necessary information for production must be covered as required data.

2.1. Required Data

The first step is to create a bill of materials, which shows the parts of the final product down to a single item. This is the basic information required for products in the manufacturing industry to understand the components and how they are assembled [22,23]. From now on, this data will be referred to as M-BOM (Manufacturing Bill of Material). In the data structure of M-BOM, the parent–child relationship such as parent item and child item is managed in a hierarchical structure based on the assembly order of the product. The parent–child relationship can be considered by dividing the hierarchy as follows: the final product is the “parent”, the processed parts necessary for assembly are the “children”, and the raw materials necessary for further processing are the “grandchildren”. The information given from the design department to the production department is the blueprint and CAD (Computer Aided Design) data, which contain only a diagram or model of the final product. Figure 2 shows how to create M-BOM data from the three-plate model. In the M-BOM data, the final product is divided by defining “intermediate products” as necessary, which are the states including the posture at a certain point of assembly from a single part to a final product (a block, a ship, etc.). The constituent units of intermediate products are determined depending on the following items [24,25,26,27]:
  • Structural characteristics in the assembly procedure;
  • Facilities constraints;
  • Control unit in manufacturing process.
The first item is to determine whether or not there are intersections between weld marks and whether or not the base product needs to be rotated using the facilities from the drawing or CAD data. Regarding the second item, facilities constraints include the capacity of the transport facilities, such as whether the product can be lifted, and the capacity of the workplace, such as whether sufficient space can be secured to place the product. It is necessary to set up intermediate products by determining the consistency between the quantity number, dimensions, weight information of the product itself and the weight and dimension constraints of each facility. The third item depends on the judgment of the production manager o each factory considering work efficiency, management, and so on. In the case of the three-plate model, the final product S1 was divided into the intermediate product U1 and the smallest part P3 based on the necessity of turning the upper part using a crane with P3. Furthermore, U1 is divided into the smallest parts—P1 and P2—by following the welding line information.
The next step is to create data that define the manufacturing process for each product as defined in the M-BOM data. A unit of work is defined as a task. The execution order between tasks and the workload for each task are defined based on the past performance records. The data that summarizes this information are called the BOP (Bill of Process). Figure 3 shows the example of creating BOP data form the three-plate model. “WL” in the BOP data means the workload. In this example, machining for P1 to P3, welding for U2, reversing, welding for S1 in execution tasks are defined. The welding of U2 and the welding of S1, which are the same task, are distinguished as different tasks because they are performed in different workplaces.
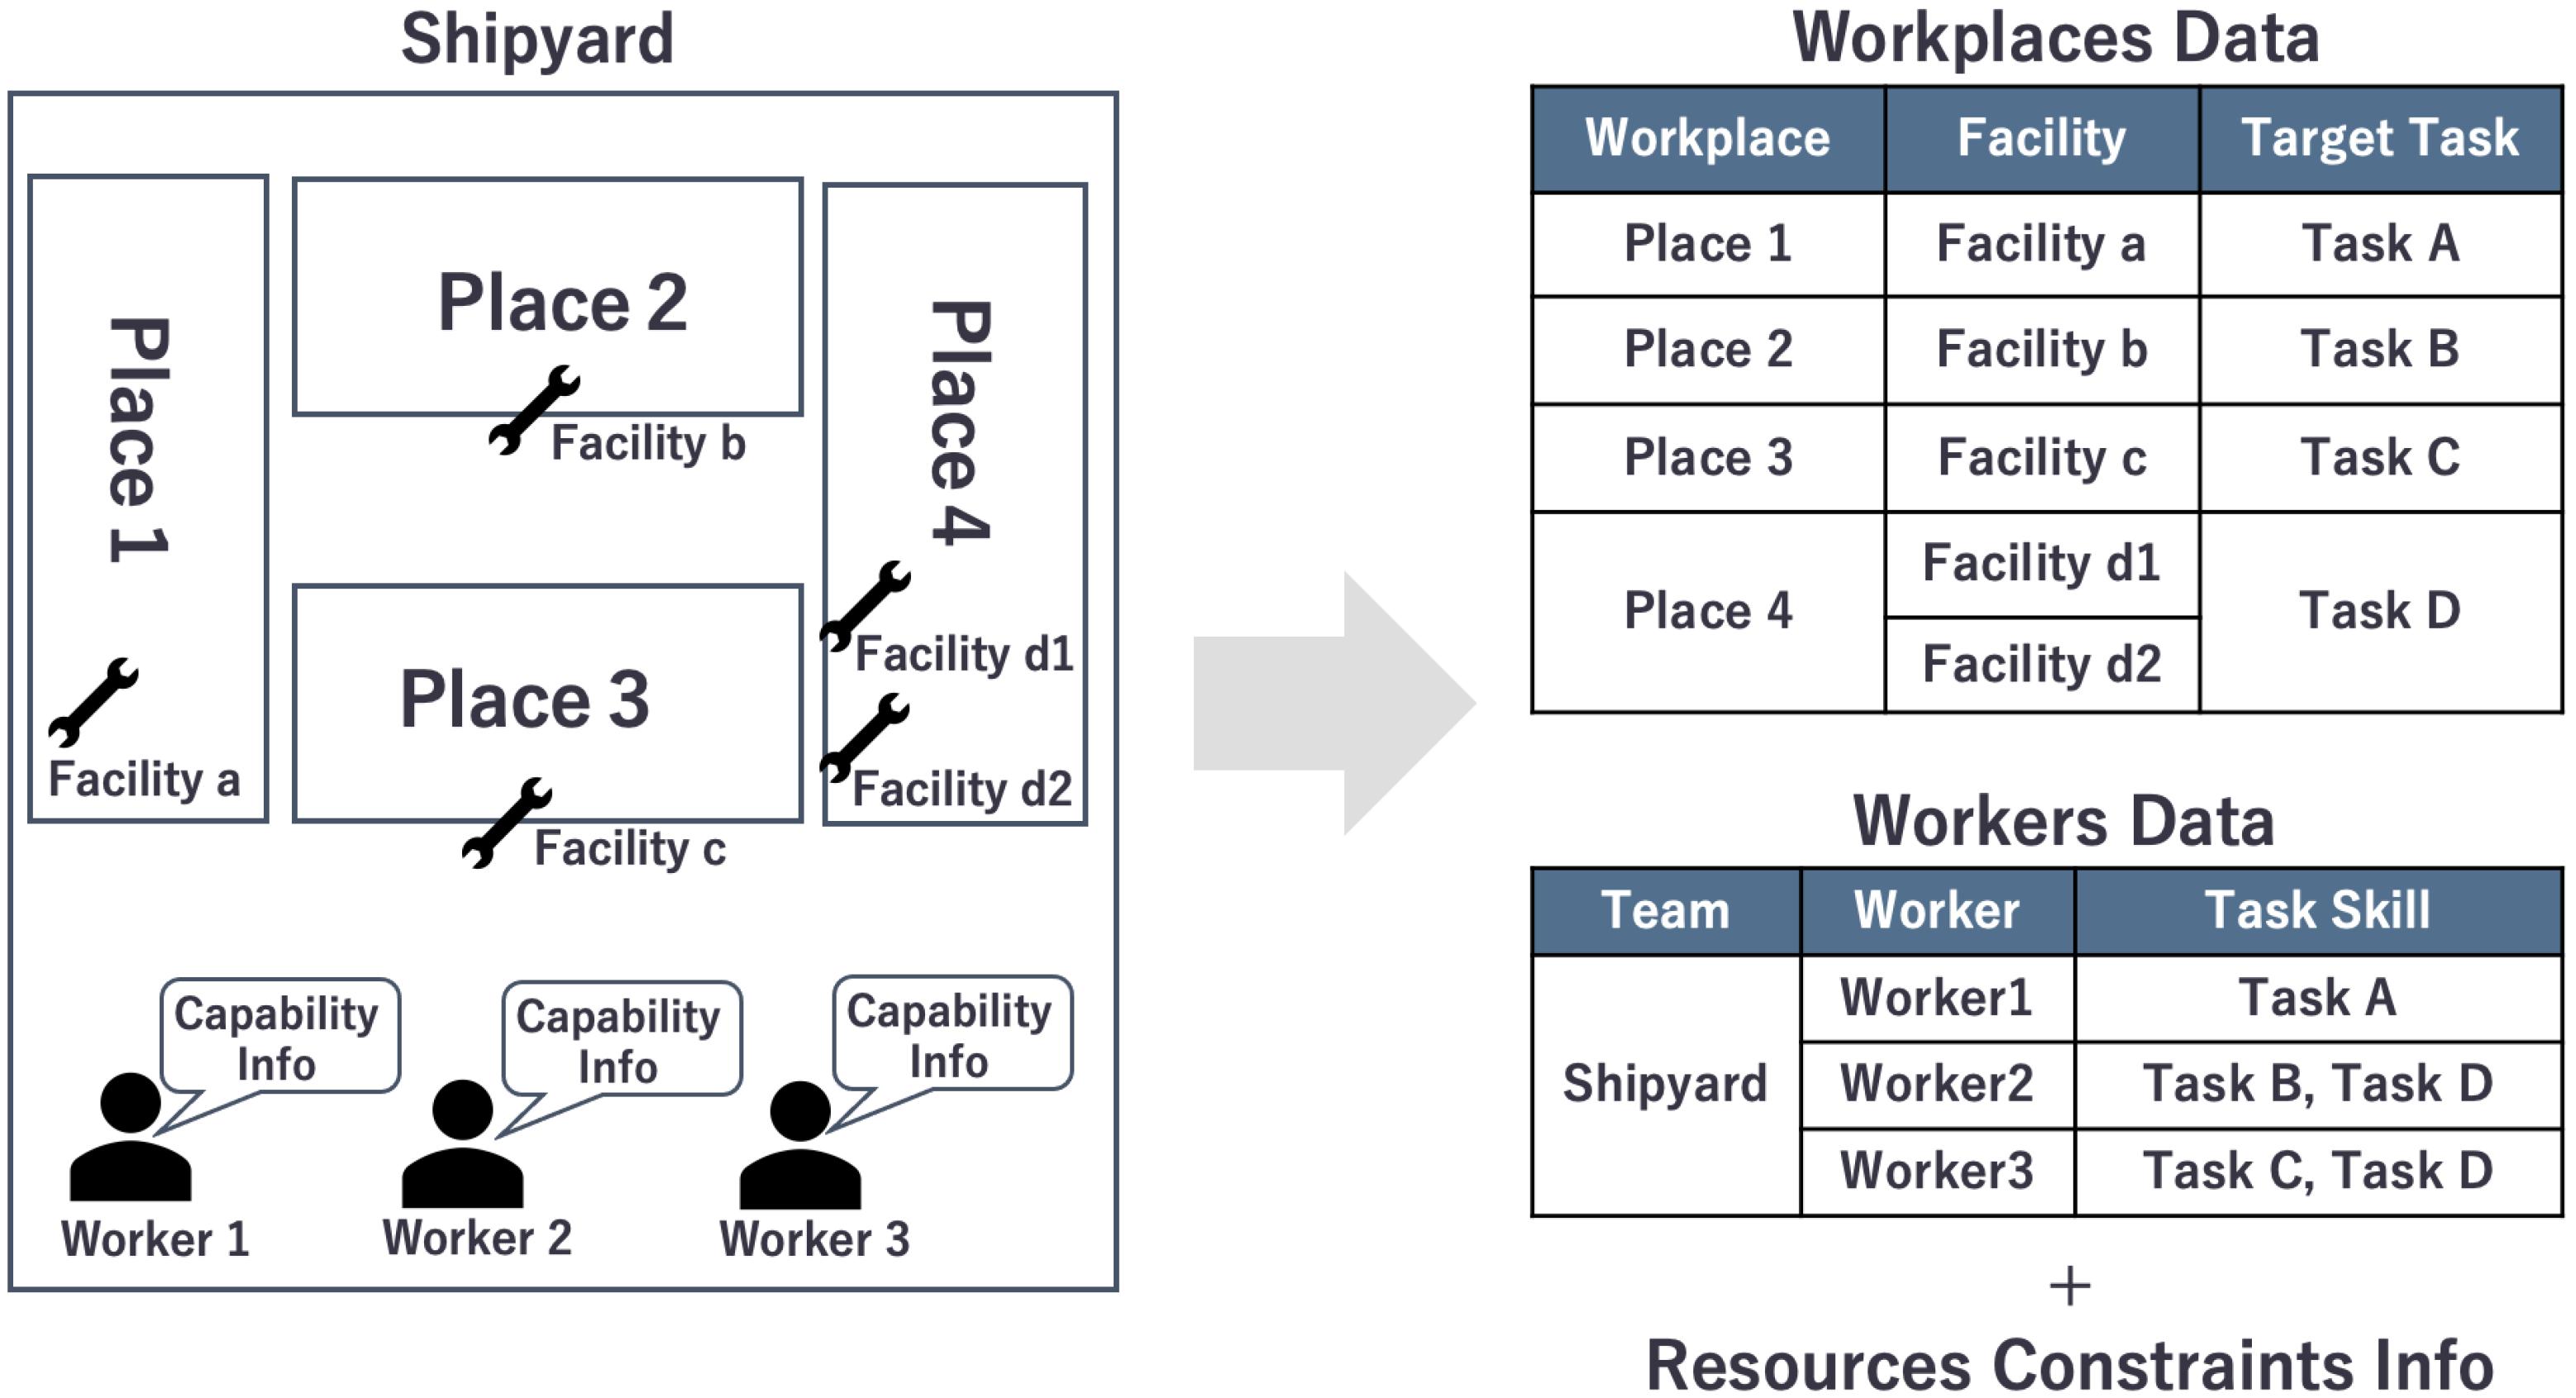
Figure 4 shows the example of creating workplace data and workers’ data. Workplace data indicate facilities located in target workplaces and the tasks that the facilities can be performed. This information can be created from the target factory layout and facilities’ specification information. If necessary, constraints specific to the facilities should be implemented (for example, restrictions on the number of products in a workplace, restrictions on movement between workplaces, etc.). Workers’ data are expressed in terms of who can perform each task. This will be created based on the capability information of each worker ascertained by the production manager. If necessary, attribute information and constraints specific to the workers should be added (skill values to account for differences in abilities among workers, fixed workplaces to be assigned, etc.).

2.2. System Model for Simulation

The target shipbuilding process is converted into a simulation model using the required data. We assumed that the simulation model consists of four models: Product, Workflow, Workplace, and Team. Figure 5 shows the contents of each model and these relationships. We will model each of the four models using a graph structure represented by nodes and links based on graph theory [28,29]. Figure 6 shows the simulation model of the target shipbuilding process according to the following four models. This section shows the contents of each model and how to create each model.
The product model represents the product to be manufactured in the production process. A product is a tree structure that consists of multiple parts. Every single product from the final product to the smallest product defined in the M-BOM data is a node. Each node has a “product name” as an attribute. The “dependency between products” is expressed as a directed link in which the parent product owns the child products. Create the link from the parent-child hierarchy data defined in M-BOM data. These relationships are represented as red arrows in Figure 6. The “dependency between products and tasks” is expressed by combining product nodes and task nodes with links from BOP data. These relationships are represented as red dashed lines in Figure 6.
The workflow model is composed of the tasks to generate a product. In a workflow model, define one task represented in BOP data as one node. Each task node has “task name”, “planned workload” and “dependency between tasks” as attributes. The “dependency between tasks” is expressed by joining task nodes with directed links in the direction of execution. These relationships are represented as blue arrows in Figure 6.
In the workplace model, it represents the facilities, size and dependency information of each workplaces. According to the workplace data, each workplace and each facility is represented by one node. Each node has “name”, “target task” and “dependency” as attributes. The “dependency” expresses the affiliation of each facility by linking the workplace node and the facility node. These relationships are represented as green solid lines in Figure 6. The “target task” expresses which task can be performed by linking facility nodes and task nodes. These relationships are represented as green dashed lines in Figure 6.
The team model represents the team and the workers who can perform each task. According to the workers’ data, the team and each worker are defined by one node. Each worker node has “name”, “dependency” and “task skill” as attributes. The “dependency” is a link between the team node and the worker node. These relationships are represented as yellow solid lines in Figure 6. The “task skill” shows which tasks the worker can handle and its capability. This is expressed by linking the worker node and the task node. These relationships are represented as yellow dashed lines in Figure 6. Skill values are given to the attributes of the links. A skill value of 1.0 means, for example, that it takes 1.0 [minutes] to complete a task with a workload of 1.0 [minutes]. If modeling involves consideration of skill differences between workers, use skill values. The “available facilities” is decided from the “task skill” of workers and “target tasks” of facilities by linking workers node and facility nodes. These relationships are represented as yellow dotted lines in Figure 6.

2.3. Process Simulation

Next, we propose an algorithm to perform a process simulation using the data structure modeled as input values. The proposed algorithm is based on the shipbuilding simulation developed by Mitsuyuki et al. [30] and adds the ability to model shipyard-specific constraints. Furthermore, we developed pDESy [31], which is the open source python library [32] and includes the proposed algorithm. This library is developed based on the discrete-time process simulation that follows the state of the task at each time step. The task execution is represented by reducing the remaining workload and updating the state based on the assigned facilities and the skill values of the workers. The following state types are defined: NONE: cannot start, READY: can start, WORKING: in progress, FINISHED: completed. The developed process simulation repeats the following operation until the all tasks are ended;
  • Extract of tasks in READY or WORKING state;
  • Place the products depending on the extracted tasks in the corresponding workplace;
  • Extract available workers and facilities;
  • Allocate workers and facilities based on task priority;
  • Execute the task;
Initially, at time t = 0, the state of the first task in all workflows is set to READY. At this time, all the other task states are still NONE. Next, extract tasks whose state is either READY or WORKING (in the case of repetitive processing, the state may be WORKING). Place the product depending on the task, whose state is READY, according to the workplace model. If the corresponding workplace is not available, it stays in the same workplace at time t 1 . Place the products depending on the task, whose state is WORKING, in the same workplace at time t 1 . After the products are installed in the workplace, extract the workers and facilities that are available at the current time. Then, according to the task priority rule, workers and facilities with skill values are assigned to the corresponding task. The task priority rule is to decide which product should be started first when multiple products whose task status are READY to exist. In this paper, we adopt the FIFO (First In First Out) rule, which means that workers start working on the oldest products in the order they arrive. After allocating resources according to the rules, change the task status to WORKING and execute the task. Then, update the remaining workload of the task based on the skill value of the worker. If the remaining workload is zero in this update, change the task status to FINISH. In addition, set the task state to READY when the advanced task state in the workflow is FINISH. The simulation ends when all tasks are in the FINISH state. Otherwise, it moves forward one time and returns to the extraction of the tasks in the ready-to-start state. The simulation results output the simulation end time, the state of each model at each time, and the tasks that each resource has started. A Gantt chart is created as a process simulation result based on these records.

3. Case Study

The proposed method is applied to a virtual shipyard to plan the manufacturing of one ship hull block. The output results are evaluated using several indices to show how the proposed method can be utilized and its usefulness in the field.
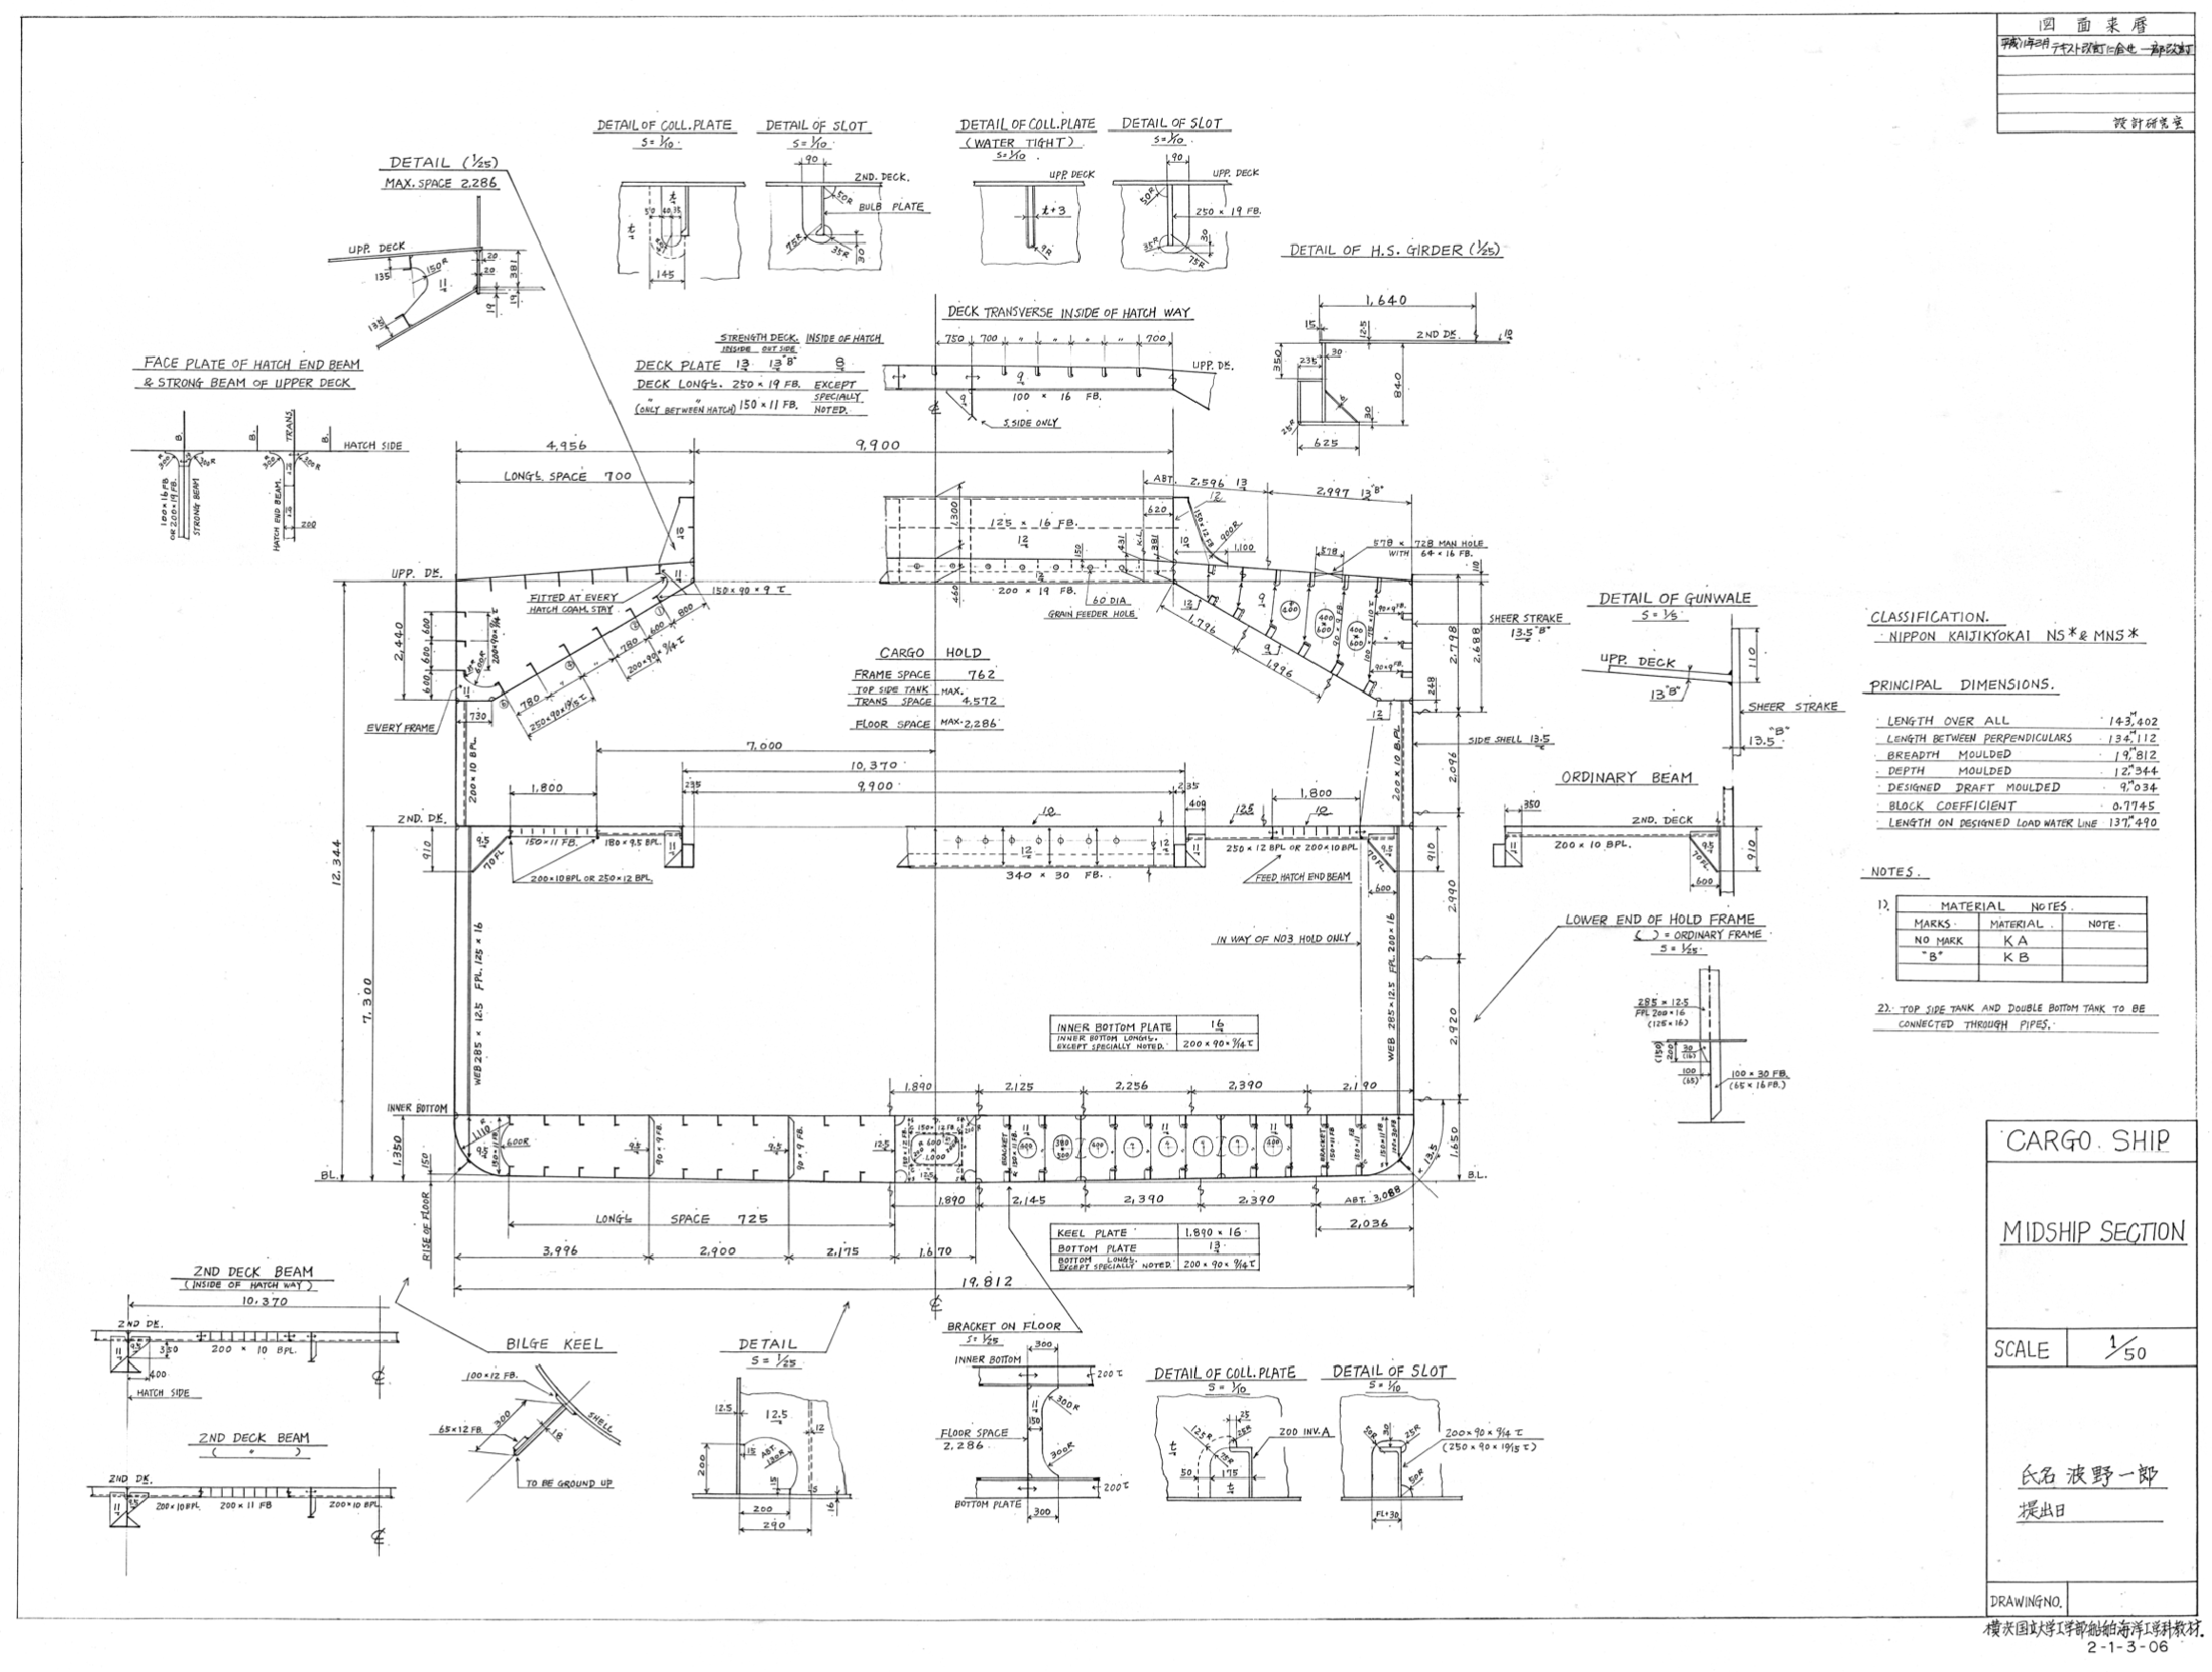
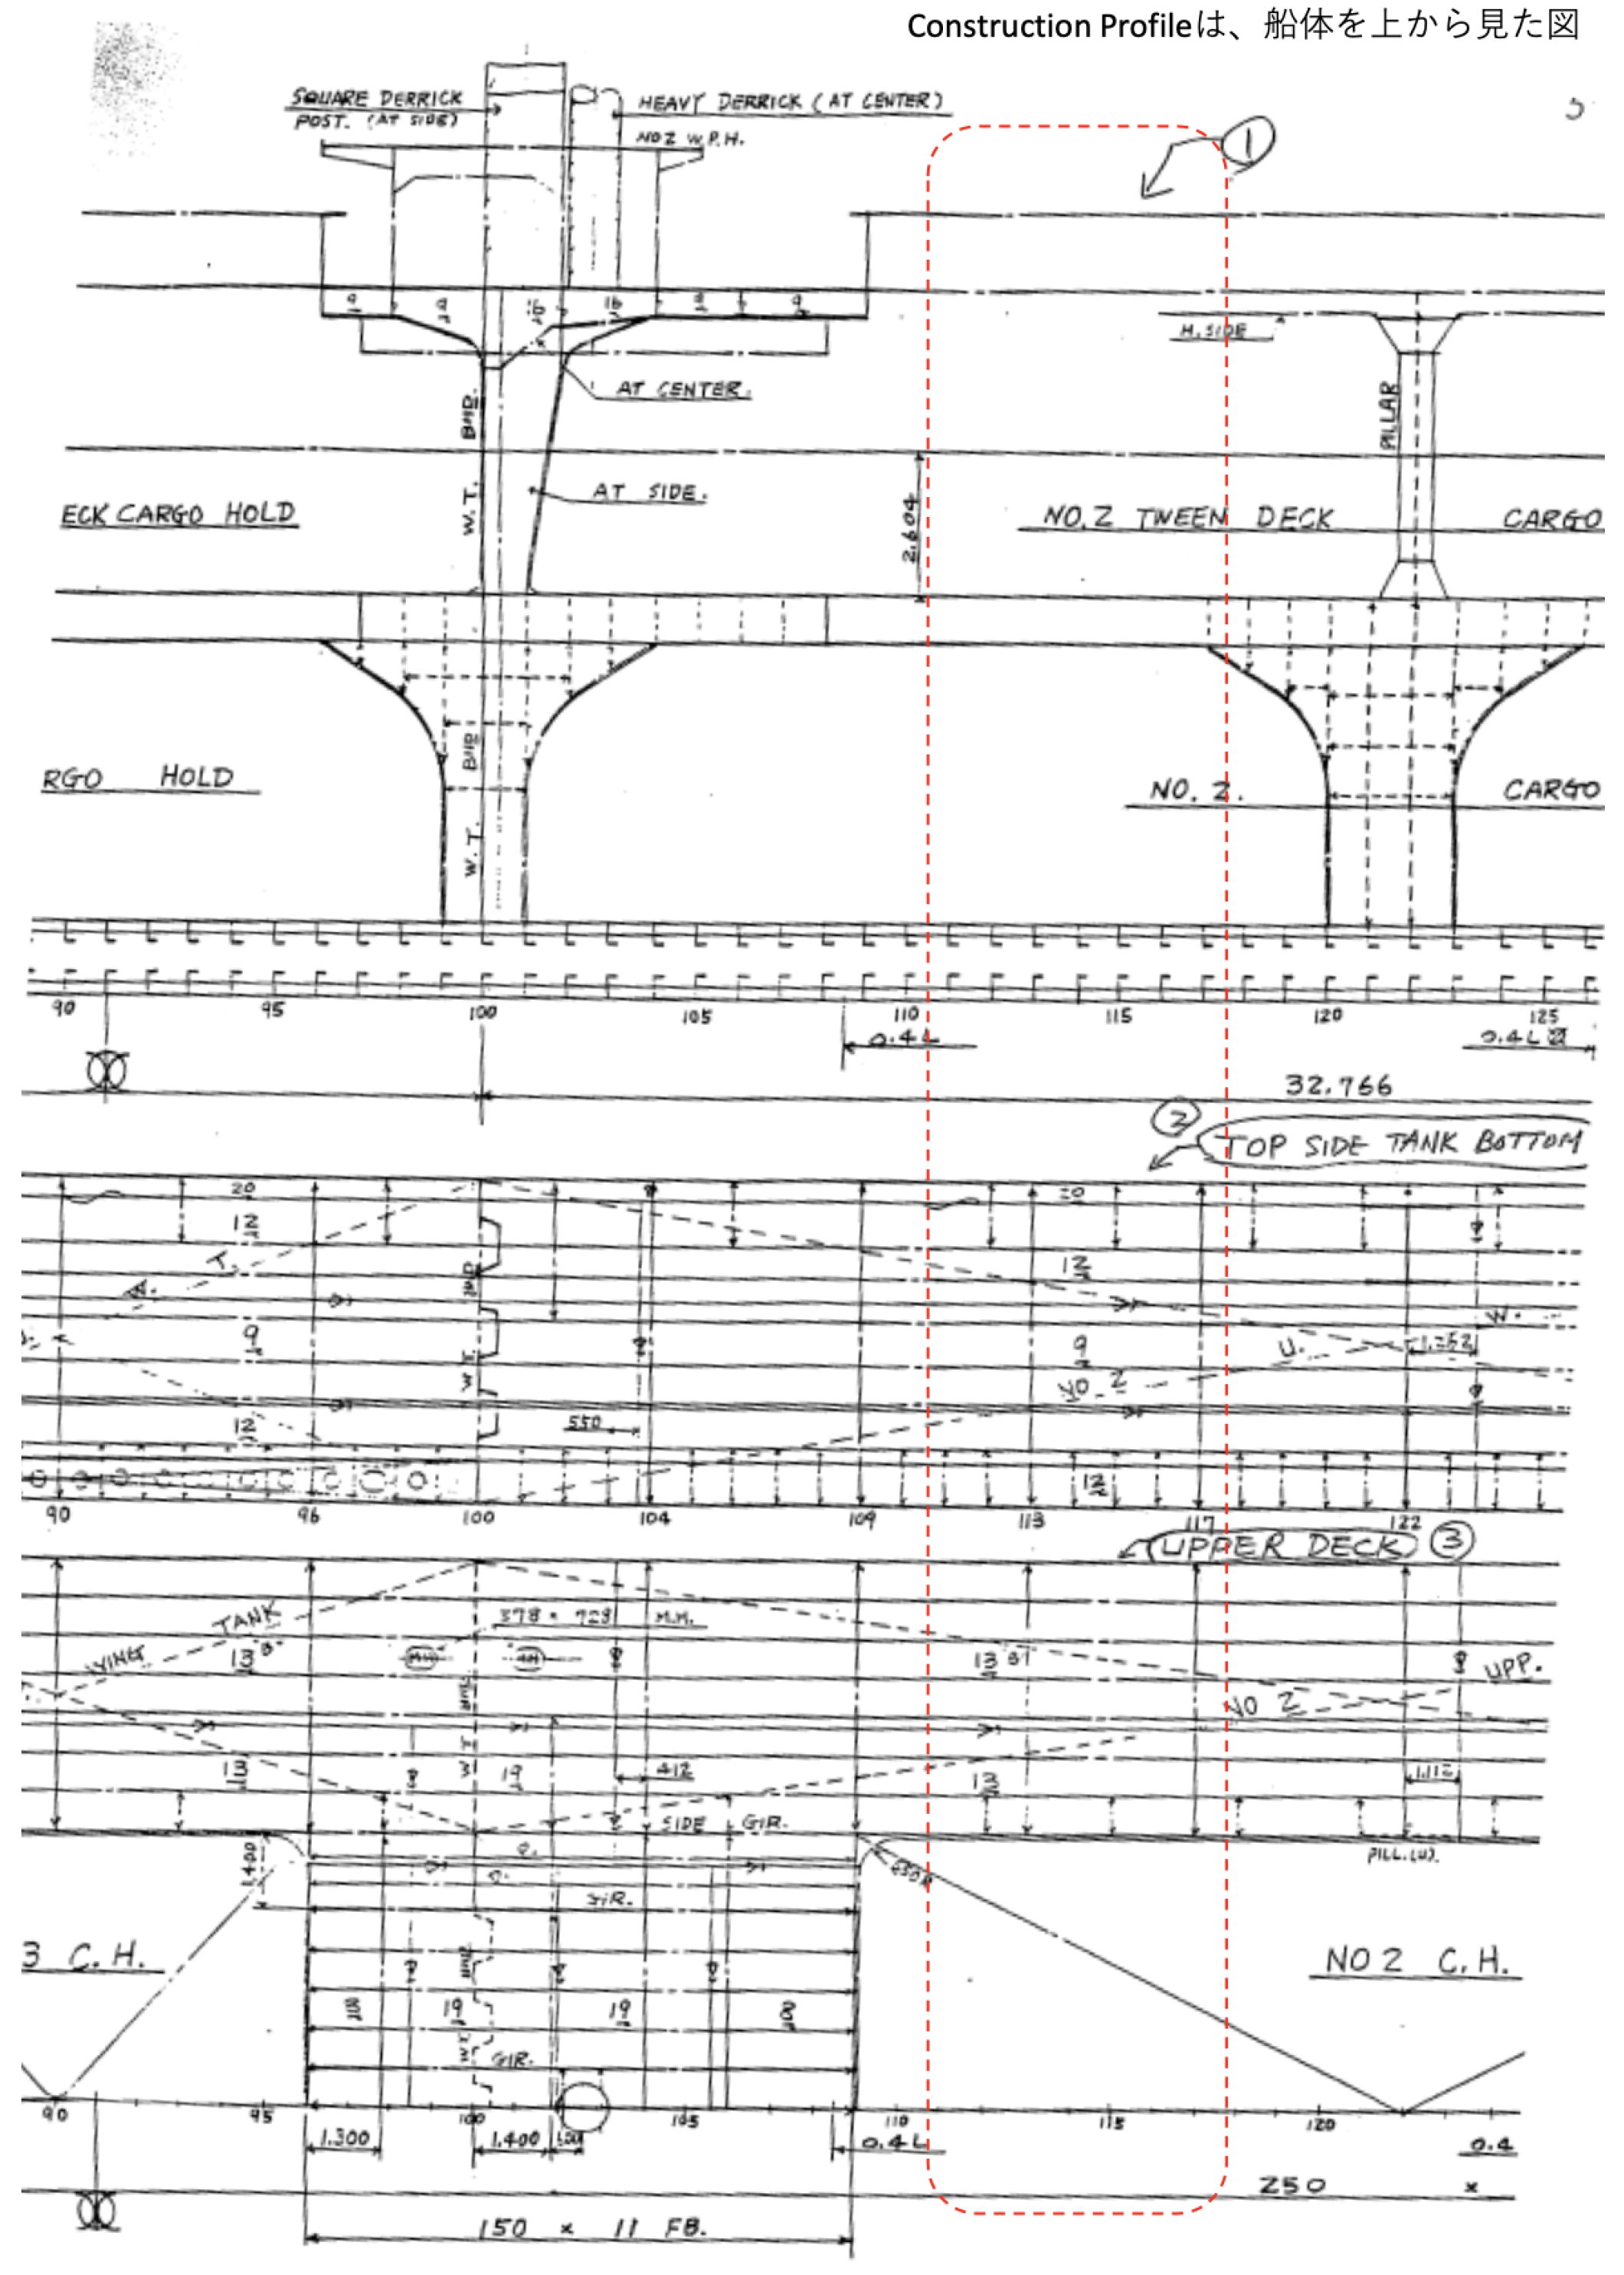
First, the target product in the virtual shipyard is the blocks in the center of the hull of a large cargo ship. For the design information of the block, we use the midship section design in Figure 7 and the construction profile design in Figure 8 of the cargo ship, which is given in the lecture of “Design and Drawing II” at Yokohama National University. Produce a block with a length of 5334 mm from the middle of frame numbers 110 and 111 to the middle of frame number 117 and 118 of the steel profile design in Figure 8.
For the production resources of the virtual shipyard, we assumed the layout of the virtual shipyard and the arrangement of workers shown in Figure 9.
For creating M-BOM data from the design data of Figure 7 and Figure 8, a target large hull block is divided into four large sets of blocks: a double bottom block at the bottom of the hull, a side shell block at the side of the hull, a topside tank block at the upper deck, and a second deck block at the second deck. Based on this division, we created the M-BOM data shown in Figure 10.
The manufacturing procedure of the ship hull block is based on the conventional method [33,34]. The “cut” material is the first task, then minimum components will become small assembly blocks or steel panels. In the case of small assembly blocks, they go through “distribute”, “install”, “automatic weld”, and “manual weld” tasks. After that, it is “stocked” in the stockyard until it is “transported” and picked up by the large assembly process. In the case of steel panels, they go through the “longitudinal pre-weld” and “plate joint” tasks. After that, it is “stocked” in the stockyard until it is “transported” and picked up by the large assembly process. In the large assembly process, the small assembly blocks and steel panels that make up the intermediate products are taken from the stockyard to perform the “distribute”, “install”, and “weld” tasks. Depending on the shape of the intermediate product, it should be turned over by a crane after the “weld” task to prepare it for the next intermediate product stage. It’s called a “reverse” task. Completed large assembly blocks are “transported” to the stockyard and “stocked” until they are taken over by the total assembly process. Each task’s planned workload is expressed as a ratio when the workload of the “transport” task is set to 1 (a dimensionless unit of time) and set arbitrarily. Based on these assumptions, we created the BOP data shown in Table 1.
According to the layout diagram shown in Figure 9, we defined each workplace, the facilities installed, and the tasks which can be performed by each facility. Usually, in the small assembly process in a shipyard, a line production method is adopted that suits the characteristics of the small assembly blocks. In this system, small assembly blocks with a simple structure are placed on a conveyor belt for flowing work to improve efficiency. In the case study, two conveyors are installed with compartmentalized sections for each task of “distribute”, “install”, “automatic weld”, and “manual weld”. Since the belt conveyor is a continuous structure, it is not possible to move to another conveyor midway once on it. In addition, each compartment on the conveyor can only have one small set of blocks and produce each block in a single flow. It is necessary to model the above characteristics of conveyors, such as “constraints on movement between workplaces” and “constraints on the capacity of workplaces”. As to the former, add the information specifying the next workplace and the previous workplace to the workplace data. The simulation model is created by joining workplace nodes with directed links in the order of movement. As for the latter, add the allowable number of pieces to the workplace data. The simulation model is created by adding the maximum number of items to the workplace node as an attribute. Among the facilities in a shipyard, transportation facilities (cars and cranes) are not located in a specific workplace but move between workplaces. This is modeled by defining a dummy workplace node for the transport facility and linking it to the transport facility node. Table 2 shows the workplace data created considering the above facility constraints and the shipyard layout.
Table 3 shows the data of workers belonging to the virtual shipyard in Figure 9. In this workers’ data, name, target tasks and available facilities are defined by each worker.

3.1. Simulation of One Block Production

Using the simulation model of the shipbuilding process of the virtual shipyard, we can execute the process simulation. The output result shows the proposed production plan for producing the central block of the ship hull. Figure 11 shows the Gantt chart for each product defined in the M-BOM data. The gray area shows the time period of the READY state, and the red area shows the time of the WORKING state of each product.
To evaluate the validity of the manufacturing flow of products from the output results, we specifically focus on the Gantt chart of the double bottom block. The parts cut from time 0 to 9 pass through the conveyor from time 9 to 97 to form small assembly blocks. Each small assembly block is produced on a staircase, thus reproducing the single-piece flow of the conveyor process. The parts cut from time 40 to 49 become multiple single plates from time 50 to 61 and are joined to make the lower steel panel (time 62 to 72) and the upper steel panel (time 73 to 83). At time 73, when the lower steel plate and small assembly blocks are ready, the large assembly starts and, at time 197 it is reversed and the upper steel plate is welded to complete the double bottom block at time 217. Following the Gantt chart along the time axis, it is confirmed that the production plan was output as modeled.

3.2. Simulation of Five Blocks Production

In order to demonstrate the benefits of the system modeling by the proposed method, the following two analyses are conducted.
  • Evaluating bottlenecks of target shipyard;
  • Reviewing the workers’ allocation plan.
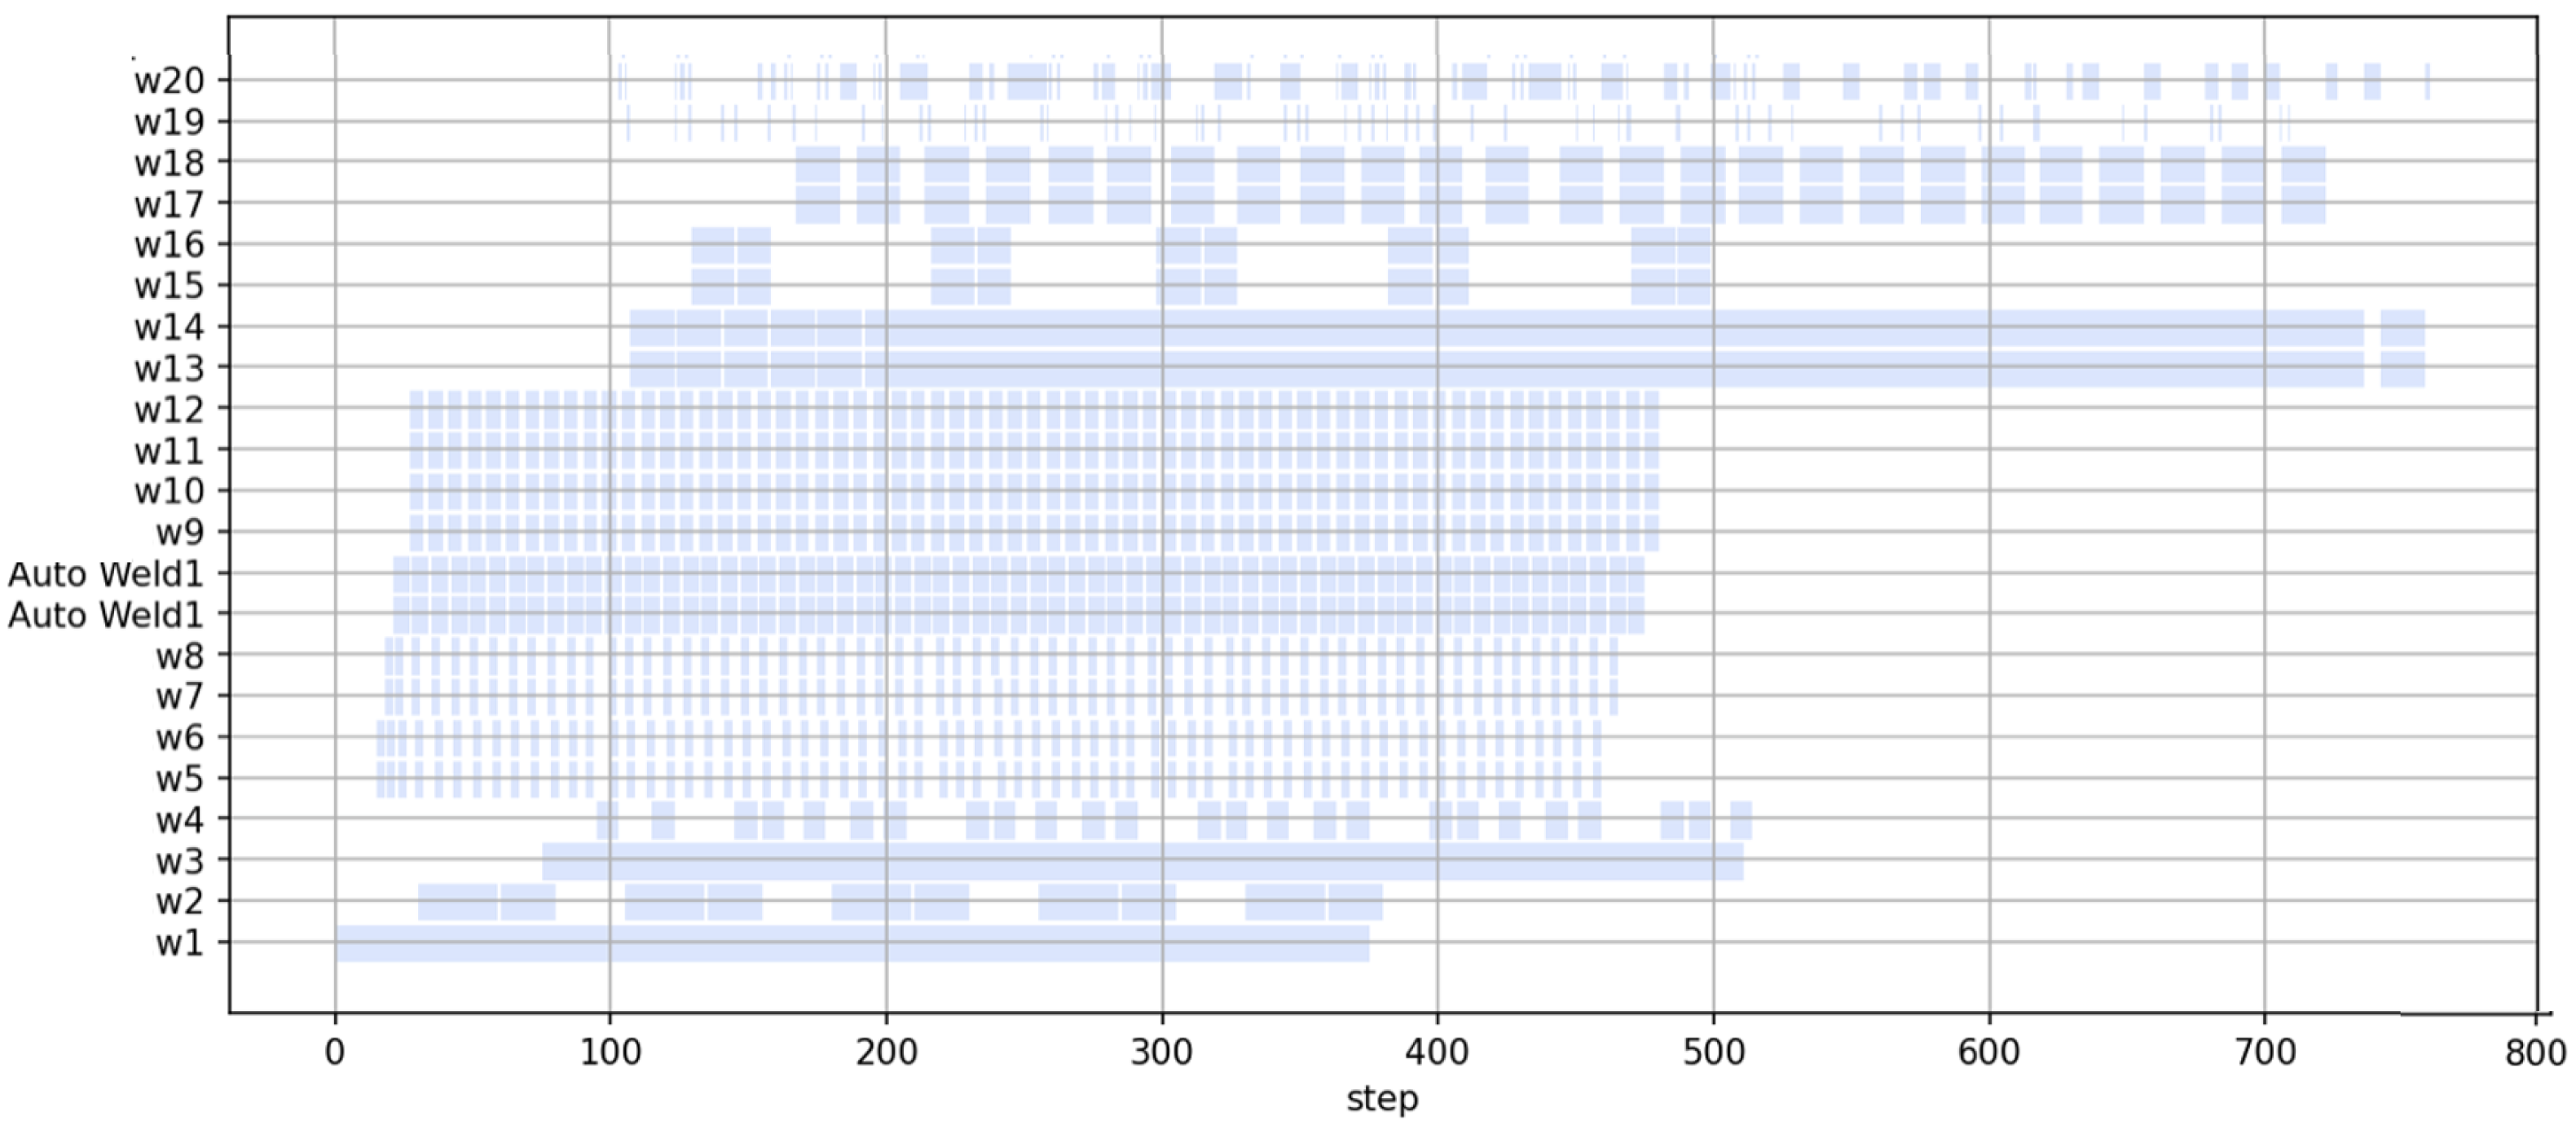
The target of these analyses is the same as in the previous case study of one block production, but here we assume that five blocks are manufactured instead of one. Figure 12 shows the Gantt chart of workers in the original plan. In this section, this result is used as a baseline. The blue area shows the time of the WORKING state of each worker.

3.2.1. Evaluating Bottlenecks of Target Shipyard

Firstly, we investigated which workplace in the shipyard would have the most impact on the original plan if their efficiency were to deteriorate. Specifically, we performed an experiment in which a single workplace is selected and made quantitative comparisons between the original plan and a plan in which only the skill value of the worker assigned to that workplace was reduced. The skill values of the worker in the experimental workplace are set to 0.8, and the skill values of the workers in the other workplaces are set to 1.0.
Table 4 shows the results of this investigation. “BS [workplace name]” (ex. BS Cut Place) shows which workplace is selected for this bottleneck analysis. We adopted three types of KPIs (Key Performance Indicators). The first KPI is the lead time, which indicates the time from the beginning to the end of the project. From Table 4, “Project Lead Time” of “BS Large Assembly Place1 (weld)” shows 920, which is the longest time compared others. The work efficiency of the “welding” task in the large assembly workplace, where the double-bottom blocks are manufactured, has the most impact on the lead time. The second KPI is the total time a product is stocked in the stockyard. From Table 4, “Small Block Stock Time” of “BS Cut Place” indicates 187 and “Steel Panel Stock Time” of “BS Crane Place” shows 749. Each is the longest time compared to the others. The efficiency loss of the “cutting” task has the most impact on the yard stocking time for small assembly blocks, while the efficiency loss of the “transporting” and “reversing” tasks by the crane has the most impact on the yard stocking time for steel panels. The third KPI is the waiting time on the conveyor of small assembly blocks. This indicator is strongly related to the idling time of the workers. From Table 4, “Conveyor Waiting Time” of “BS Conveyor1 Place3” shows 982, which is the longest time compared others. The decrease in efficiency of the “manual welding” task of the small assembly blocks maximizes the waiting time.

3.2.2. Reviewing the Workers’ Allocation Plan

Next, we reviewed the original workers’ allocation plan by calculating each worker’s operation rate. The operation rate in this section is the percentage of time that a worker is in a WORKING state out of the time section where all workplaces have work in progress. In this review, the target time section is from time 129 to time 374 in the original plan showed in Figure 12. In this target time section, the workers in the large assembly workplace of the second deck block (w15 and w16 in Figure 9) and the car operator (w19 in Figure 9) have the lower operation rate. From this analysis, the re-allocation plan was created by reducing the car operator and adding the car transporting task to the worker (w15) in the large assembly workplace. Figure 13 shows the simulation result of re-allocation plan. Table 5 shows the comparison results between the original plan and re-allocation plan. From Table 5, all KPI values of the re-allocation plan were almost the same as the original plan. It can be said that reducing the car operator does not affect the original plan.

4. Overall Discussion

From the two analyses performed in Section 3.2, the following observations can be made:
  • Based on the results of the bottleneck analysis, the production manager can identify which workplace’s delay will have the greatest impact on the plan, and notify field workers of bottleneck workplace before starting work to prevent delays in planning and ensure appropriate management;
  • By modifying the task qualification of workers, it is possible to create a multiple assignment patterns. Production managers can create optimal assignment plans by trying these patterns and quantitatively evaluating the differences.
In the case studies, the proposed method can be used to create a realistic production plan by system modeling various information of the target shipyard. It is also shown that the created model made it easy to identify bottlenecks and to conduct quantitative studies on the re-allocation of workers. The proposed method can also be used to understand the impact on back-end processes caused by worker vacancies and facility breakdowns, to evaluate the cost-effectiveness of installing a new facility, to assess the overall impact of differences in worker capabilities and to create delivery-oriented plans using backward simulation. The key point is that if we modify the model information of the input and quantitatively evaluate the simulation output, we can apply it to various production management decision cases by using the proposed system modeling and process simulation.
Production simulation tools for process optimization have already been put to practical use as stand-alone applications in Plant Simulation by Siemens, Dassaults Heavy Industry plant layout, and so forth. Recently, a total package including data management and simulation has been put to practical use under the concept of Digital Twin. All of them adopt a direct modeling method for equipment in a specific factory or production phase. It is necessary to use various kinds of models and applications to represent the production process of the whole shipyard. This paper adopts a method that uses only four models classified on a function basis to represent the target production process. We believe that using these models to represent the production process will eliminate the need to integrate and link many applications.

5. Conclusions

This paper proposed a method to create a realistic production plan automatically by modelling the complex shipbuilding project and using the process simulation. Specifically, we proposed a method to represent the target complex shipbuilding project by four models, Product, Workflow, Workplace, and Team. The developed process simulation using system models creates a Gantt chart as a realistic production plan. A case study of a virtual shipyard manufacturing a ship hull block yielded the following results and findings.
  • The proposed method can be used to create a realistic production plan by system modeling various information of the target shipyard;
  • By utilizing created model and process simulation, we can evaluate the bottleneck of the target shipyard and the re-allocation plan for workers quantitatively.
Based on the above, once a simulation model of the target product or factory is created, it is easy to examine the optimal work plan by simply changing the model information. Therefore, it can be said that the proposed method is effective and practical as a decision-making tool for production managers in the production planning and project management of shipbuilding.
The goal of this study is to manage the shipbuilding overall process using models, process simulation, and monitoring data. The future work of this study is to develop a database system for executing the proposed system automatically and to use the monitoring data of the target production process for more precise and flexible process simulations.

Author Contributions

Conceptualization, Y.O. and T.M.; methodology, Y.O. and T.M.; software, Y.O.; validation, Y.O.; formal analysis, Y.O.; investigation, Y.O.; resources, T.M.; data curation, Y.O. and T.M.; writing—original draft preparation, Y.O.; writing—review and editing, T.M.; visualization, Y.O.; supervision, T.M.; project administration, T.M.; funding acquisition, T.M. All authors have read and agreed to the published version of the manuscript.

Funding

This work was supported by JSPS KAKENHI Grant Number 20K14962, and SAJ REDAS.

Institutional Review Board Statement

Not applicable.

Informed Consent Statement

Not applicable.

Data Availability Statement

The data that support the findings of this study are available from the corresponding author, Y.O., upon reasonable request.

Conflicts of Interest

The authors declare no conflict of interest.

References

  1. Molina, A.; Ponce, P.; Miranda, J.; Cortés, D. Enabling Systems for Intelligent Manufacturing in Industry 4.0, 1st ed.; Springer: Berlin/Heidelberg, Germany, 2021; p. 277. [Google Scholar]
  2. Kjersem, K.; Halse, L.L.; Kiekebos, P.; Emblemsvåg, J. Implementing Lean in Engineer-to-Order Industry: A Case Study. Conf. Pap. Int. Conf. Adv. Prod. Manag. Syst. 2015, 460, 248–255. [Google Scholar]
  3. Ding, J.; Ni, C. Gird Based Line Segment Detector and Application: Vision System for Autonomous Ship Small Assembly Line. J. Mar. Sci. Eng. 2021, 9, 1313. [Google Scholar] [CrossRef]
  4. Wu, Q.; Mao, Y.; Chen, J.; Wang, C. Application Research of Digital Twin-Driven Ship Intelligent Manufacturing System: Pipe Machining Production Line. J. Mar. Sci. Eng. 2021, 9, 3. [Google Scholar] [CrossRef]
  5. Rouco-Couzo, M.; Crespo-Pereira, D.; Garcia-del-Valle, A.; Cebral-Fernandez, M.; Rios-Prado, R. Discrete event simulation to improve cutting-welding workshop in a shipyard. Proc. Eur. Model. Simul. Symp. 2016, 25, 191–196. [Google Scholar]
  6. Hadjina, M.; Fafandjel, N.; Matulja, T. Shipbuilding production process design methodology using computer simulation. Brodogr. Shipbilding 2015, 66, 77–91. [Google Scholar]
  7. Lee, Y.G.; Ju, S.; Woo, J.H. Simulation-based planning system for shipbuilding. Int. J. Comput. Integr. Manuf. 2020, 33, 626–641. [Google Scholar] [CrossRef]
  8. Woo, J.H.; Lee, K.; Jung, H.; Kwon, Y.; Shin, J.G. Method for integrated logistics planning in shipbuilding. J. Soc. Nav. Archit. Korea 2005, 42, 165–174. [Google Scholar]
  9. Kun, L.D.; Gye, S.J.; Youngmin, K.; Jeong, Y.K. Simulation-Based Work Plan Verification in Shipyards. J. Ship Prod. Des. 2014, 30, 49–57. [Google Scholar]
  10. Hun, W.J.; Joo, S.Y.; Woo, K.Y.; Shin, J.G. Development of the Decision-Making System for the Ship Block Logistics Based on the Simulation. J. Ship Prod. Des. 2010, 26, 290–300. [Google Scholar]
  11. Jeong, Y.K.; Woo, J.H.; Oh, D.K.; Shin, J.G. A shipyard simulation system using the process-centric simulation modeling methodology: Case study of the simulation model for the shipyard master plan validation. Korean J. Comput. Des. Eng. 2016, 21, 204–214. [Google Scholar] [CrossRef]
  12. Nam, S.; Shen, H.; Ryu, C.; Shin, J.G. SCP-Matrix based shipyard APS design: Application to long-term production plan. Int. J. Nav. Archit. Ocean. Eng. 2018, 10, 741–761. [Google Scholar] [CrossRef]
  13. Hellgren, S.; Maria, H.; Orisis, A.; Kujala, P. Modelling of a Cruise Shipbuilding Process for Analyzing the Effect of Organization on Production Efficiency. J. Ship Prod. Des. 2017, 33, 101–121. [Google Scholar] [CrossRef]
  14. Sender, J.; Klink, S.; Flügge, W. A framework of plant simulation for a construction of a digital shipyard. In Proceedings of the 13th CIRP Conference on Intelligent Computation in Manufacturing Engineering, Gulf of Naples, Italy, 17–19 July 2019; Volume 88, pp. 122–126. [Google Scholar]
  15. Wang, C.; Wang, K.; Tao, J.; Zhou, Y. Research on Real-Time Optimal Path Planning Model and Algorithm for Ship Block Transportation in Shipyard. J. Mar. Sci. Eng. 2020, 8, 991. [Google Scholar] [CrossRef]
  16. Park, J.G.; Kim, H.J.; Woo, J.H. Development of Entering Order and Work-Volume Assignment Algorithms for the Management of Piping Components in Offshore Structure Construction. J. Mar. Sci. Eng. 2020, 8, 894. [Google Scholar] [CrossRef]
  17. Aoyama, K.; Nomoto, T.; Watanabe, K. Development of Shipyard Simulation System based on Petri Net. J. Soc. Nav. Archit. Jpn. 1997, 182, 795–807. [Google Scholar] [CrossRef]
  18. Takechi, S.; Aoyama, K.; Kobayashi, M.; Makihara, K. Development of Shipyard Simulation System based on Petri Nets, 3rd Report: Factory Simulator introduced the concept of the Job-Shop Floor. J. Soc. Nav. Archit. Jpn. 2001, 190, 449–458. [Google Scholar] [CrossRef]
  19. Mitsuyuki, T.; Hiekata, K. Study on Installation of Production Facilities Using Shipbuilding Process Simulation. J. Soc. Nav. Archit. Jpn. 2016, 24, 291–298. [Google Scholar]
  20. Steinhauer, D.; Sikorra, J.N.; Haux, M.A.; Friedewald, A.; Lödding, H. A framework of plant simulation for a construction of a digital shipyard. J. Soc. Nav. Archit. Korea 2005, 42, 165–174. [Google Scholar]
  21. Choi, W.-S.; Kim, D.-H.; Nam, J.-H.; Kim, M.-J.; Son, Y.-B. Estimating Production Metric for Ship Assembly Based on Geometric and Production Information of Ship Block Model. J. Mar. Sci. Eng. 2021, 9, 39. [Google Scholar] [CrossRef]
  22. Yao, S.; Sun, H.; Shen, P.; Lian, C. Research on bom mapping transformation for ship construction process. Manag. Sci. Eng. Can. Res. Dev. Cent. Sci. Cult. 2009, 3, 54–68. [Google Scholar]
  23. Boton, C.; Rivest, L.; Forgues, D.; Julie, R.J. Comparison of shipbuilding and construction industries from the product structure standpoint. Int. J. Prod. Lifecycle Manag. 2018, 11, 191–220. [Google Scholar] [CrossRef]
  24. Amemiya, T. Process Planning System for CIM in Shipbuilding. J. Soc. Nav. Archit. Jpn. 1990, 1990, 629–638. [Google Scholar] [CrossRef]
  25. Roh, M.-I.; Lee, K.-Y. Generation of production material information for a building block and simulation of block erection for process planning and scheduling in shipbuilding. Int. J. Prod. Res. 2007, 45, 4653–4683. [Google Scholar] [CrossRef]
  26. Sasaki, Y.; Sonda, M.; Ito, K. Development of computer aided process planning system based on knowledge base. Soc. Nav. Archit. Jpn. 2002, 868, 309–315. [Google Scholar]
  27. Takezawa, M.; Taniguchi, T.; Matsuo, K.; Hirakata, M. Fundamental Study on Highly Precise Production Simulation for Shipbuilding. Conf. Proc. Jpn. Soc. Nav. Archit. Ocean. Eng. 2020, 31, 177–183. [Google Scholar]
  28. Shimokawa, T. Graph Theory. Jpn. J. Neuropsychol. 2018, 3, 34, 200–208. [Google Scholar]
  29. Robin, J. Wilson Introduction to Graph Theory, 5th ed.; Pearson: London, UK, 2010. [Google Scholar]
  30. Mitsuyuki, T.; Hiekata, K.; Yamato, H. Design of production strategy considering the cutting peak demand of electricity in the shipbuilding industry. J. Mar. Sci. Technol. 2014, 19, 425–437. [Google Scholar] [CrossRef]
  31. pDESy. Available online: https://github.com/pDESy/pDESy (accessed on 31 December 2021).
  32. Van Rossum, G.; Drake, F.L. Python 3 Reference Manual; CreateSpace: Scotts Valley, CA, USA, 2009. [Google Scholar]
  33. Muto, M.; Miyata, T. Three dimensional block method in ship’s hull construction program. Conf. Proc. Jpn. Soc. Nav. Archit. Ocean. Eng. 1964, 169–183. [Google Scholar] [CrossRef]
  34. Nomoto, T.; Aoyama, K. Computer Aided Information Acquisition System of Design and Manufacturing in Shipbuilding. J. Soc. Nav. Archit. Jpn. 1989, 166, 425–433. [Google Scholar] [CrossRef] [Green Version]
Figure 1. Overview of the Proposed Method.
Jmse 10 00176 g001
Figure 2. How to Create M-BOM Data.
Jmse 10 00176 g002
Figure 3. How to Create BOP Data.
Jmse 10 00176 g003
Figure 4. How to Create Workplace Data and Workers’ Data.
Jmse 10 00176 g004
Figure 5. Proposed System Models and These Relationships.
Jmse 10 00176 g005
Figure 6. Simulation Model of The Target Shipbuilding Process.
Jmse 10 00176 g006
Figure 7. The Midship Section Design.
Jmse 10 00176 g007
Figure 8. The Construction Profile Design.
Jmse 10 00176 g008
Figure 9. Layout of the Virtual Shipyard.
Jmse 10 00176 g009
Figure 10. M-BOM Data in Case Study.
Jmse 10 00176 g010
Figure 11. Result of Gantt Chart by Each Product.
Jmse 10 00176 g011
Figure 12. Gantt Chart of Workers in the Original Plan.
Jmse 10 00176 g012
Figure 13. Gantt Chart of Workers in the Re-allocation Plan.
Jmse 10 00176 g013
Table 1. BOP Data in Case Study.
Cut MaterialBending PartSingle PlateSteel Panel
NameWorkloadNameWorkloadNameWorkloadNameWorkload
1st TaskCut15Bend2Pre-Weld3Joint3
2nd TaskCrane Transport1
3rd TaskPanel Stock0
4th Task
5th Task
6th Task
Small Assembly BlockIntermediate ProductLarge Assembly Block
NameWorkloadNameWorkloadNameWorkload
1st TaskSmall Distribute3Car Transport1Car Transport1
2nd TaskSmall Install3Large Distribute8Large Distribute8
3rd TaskSmall Auto Weld6Large Install8Large Install8
4th TaskSmall Manual Weld10Large Weld15Large Weld15
5th TaskSmall Stock0(Transverse)5Crane Transport1
6th Task Large Stock0
Table 2. Workplaces Data in Case Study.
WorkplaceFacilityTarget Task
Cut placeCutterCut
Bend placeBenderBend
Pre-weld placeWeld machine pPre-weld
Joint placeWeld machine jJoint
Steel Panel Stockyard-Panel Stock
Conveyor1 place1Tool d1Small Distribute
Conveyor1 place2Tool i1Small Install
Conveyor1 place3Weld machine a1Small Auto Weld
Conveyor1 place4Weld machine m 1 1 Small Manual Weld
Weld machine m 1 2
Conveyor2 place1Tool d2Small Distribute
Conveyor2 place2Tool i2Small Install
Conveyor2 place3Weld machine a2Small Auto Weld
Conveyor2 place4Weld machine m 2 1 Small Manual Weld
Weld machine m 2 2
Small Assembly Block Stockyard-Small Stock
Large Assembly place1Tool D 1 1 Large Distribute
Tool D 1 2
Tool I 1 1 Large Install
Tool I 1 2
Weld machine L 1 1 Large Weld
Tool machine L 1 2
Large Assembly place2Tool D 2 1 Large Distribute
Tool D 2 2
Tool I 2 1 Large Install
Tool I 2 2
Weld machine L 2 1 Large Weld
Tool machine L 2 2
Large Assembly place3Tool D 3 1 Large Distribute
Tool D 3 2
Tool I 3 1 Large Install
Tool I 3 2
Weld machine L 3 1 Large Weld
Tool machine L 3 2
Large Assembly Block Stockyard-Large Stock
Car placecarCar Transport
Crane placecraneCrane Transport Transverse
Table 3. Workers Data in Case Study.
WorkerTarget TaskAvailable Facility
w1CutCutter
w2BendBender
w3Pre-weldWeld machine p
w4JointWeld machine j
w5Small DistributeTool d1
w6Small DistributeTool d2
w7Small InstallTool i1
w8Small InstallTool i2
w9Small Manual WeldWeld machine m 1 1 , Weld machine m 1 2
w10Small Manual WeldWeld machine m 1 1 , Weld machine m 1 2
w11Small Manual WeldWeld machine m 2 1 , Weld machine m 2 2
w12Small Manual WeldWeld machine m 2 1 , Weld machine m 2 2
w13Large DistributeTool D 1 1 , Tool D 1 2
Large InstallTool I 1 1 , Tool I 1 2
Large WeldWeld machine L 1 1 , Weld machine L 1 2
w14Large DistributeTool D 1 1 , Tool D 1 2
Large InstallTool I 1 1 , Tool I 1 2
Large WeldWeld machine L 1 1 , Weld machine L 1 2
w15Large DistributeTool D 2 1 , Tool D 2 2
Large InstallTool I 2 1 , Tool I 2 2
Large WeldWeld machine L 2 1 , Weld machine L 2 2
w16Large DistributeTool D 2 1 , Tool D 2 2
Large InstallTool I 2 1 , Tool I 2 2
Large WeldWeld machine L 2 1 , Weld machine L 2 2
w17Large DistributeTool D 3 1 , Tool D 3 2
Large InstallTool I 3 1 , Tool I 3 2
Large WeldWeld machine L 3 1 , Weld machine L 3 2
w18Large DistributeTool D 3 1 , Tool D 3 2
Large InstallTool I 3 1 , Tool I 3 2
Large WeldWeld machine L 3 1 , Weld machine L 3 2
w19Car TransportCar
w20Crane Transport TransverseCrane
Table 4. Bottleneck Evaluation Results.
CaseProject Lead TimeSmall Block Stock TimeSteel Panel Stock TimeConveyor Waiting Time
Original Plan761146646717
BS Cut Place819187721717
BS Bend Place761147646717
BS Pre-Weld Place868146220717
BS Joint Place766146634717
BS Conveyor1 Place1761146646513
BS Conveyor1 Place2761146646441
BS Conveyor1 Place3768113680982
BS Large Assembly Place1 (Distribute)880146688717
BS Large Assembly Place1 (Install)880146688717
BS Large Assembly Place1 (Weld)920146710717
BS Large Assembly Place2 (Distribute)761146656717
BS Large Assembly Place2 (Install)761146656717
BS Large Assembly Place2 (Weld)761146646717
BS Large Assembly Place3 (Distribute)797146712717
BS Large Assembly Place3 (Install)797146712717
BS Large Assembly Place3 (Weld)823146729717
BS Car Place769146676717
BS Crane Place836146749717
Table 5. Comparison Result between Original Plan and Re-allocation Plan.
Project Lead TimeSmall Block Stock TimeSteel Panel Stock TimeConveyor Waiting Time
Original Plan761146646717
Re-allocation Plan767146663717
Publisher’s Note: MDPI stays neutral with regard to jurisdictional claims in published maps and institutional affiliations.