Abstract
When the icebreaker sails in the polar region, it adopts continuous and ramming icebreaking operations. When the ice condition exceeds the design working condition, it uses the ramming icebreaking method to advance. The nonlinear icebreaking process and complex ice conditions make it difficult to accurately predict the ice-strengthened ships’ ramming performance. This paper develops a scale-ratio brittle model of ice to simulate thick, level ice and predicts the ice penetration distance and bow load of an icebreaking research vessel (IRV) model at different speeds. The test results show that the penetration distance of the scoop-shaped bow IRV increases with the ramming speed and the average and extreme values of the contact load increase with the increase in the speed. The experimental results are a valid complement to the ice tank tests and do not cover all aspects of ship design. The main purpose is to develop a test program and performance prediction scheme for studying penetration distance and ice load during ram icebreaking.
1. Introduction
Speed-Dependent Ramming Performance
The opening of the Northern Sea Route (NSR) in the past decade has accelerated the progress in polar ship and maritime engineering research, particularly in polar scientific expeditions and the development of polar resources. Icebreakers have played a crucial role in polar scientific research, navigation, and ice management while also providing support in establishing shipping routes and escorting vessels with lower ice class ratings. Icebreaker navigation and structural performance must comply with ship design specifications. The International Maritime Organization (IMO) [1] underscores that, for ships operating in icy conditions, every area of the hull and all appendages should be reinforced to withstand the design structure/ice interaction scenario applicable to each situation. Ramming is the most difficult scenario during the icebreaking navigation of an ice-strengthened ship. It is a routine operation of polar icebreakers during icebreaking navigation. It is also a multiple test of the ship’s icebreaking capability, stability, and structural safety. Canada’s ice class specification, Canadian Arctic Class (CAC) [2], emphasizes the ramming performance of ice-strengthened ships and the structural design specifications. Ships sailing in ice areas rely on the power provided by propellers to move forward. When faced with severe ice conditions such as thick ice, ice ridges, multi-year ice floes, or glacial ice fragments, icebreakers cannot continuously break the ice and need to use a ram to break the ice.
The research on the performance of ram-type icebreaking icebreakers focuses on the ship’s motions, the ice load on the bow, the penetration distance of the ship in the ice, and the ice destruction mode under different speeds and ice conditions. Research methods, as shown in Table 1, include full scale ship test methods [3,4,5,6,7,8,9], model test methods [10,11,12], and numerical simulation methods [13,14,15,16,17,18,19,20,21].

Table 1.
Summary of ramming test methods for ice-strengthened ships.
Riska (1987) [22] studied in detail the interaction mechanisms of two ice-strengthened ships when they rammed thick multi-year ice floes. Using data and phenomena from full-scale ship tests, the ramming interaction is separated into physical structures that can be studied individually, and a numerical model is used to determine the ice force parameters due to the ramming and subsequent ship response. Two types of model ice material tests were also conducted based on the actual ship test: the fine-grained saline model ice (FG-ice) model test in the ice tank and the concrete model ice (Foam concrete) model test in the towing tank. Among them, due to the fast speed of ship-ice interaction, ice materials are treated as elastic and brittle materials, and the time-dependent part of ice is ignored. To maintain a linear relationship between the penetration distance of the model and the prototype, a criterion for compressive strength scaling is derived. The scale of the model test model is 1:40, the model ice thickness is 7.5 cm, and it simulates 3 m thick ice. The ship model test data collected longitudinal and vertical displacements and forces, which were used to compare the prototype, model, and numerical simulation data. The research results show that the multi-year thick ice floe can be regarded as a brittle material with uniform properties, and the bow load and penetration distance increase linearly with the ship’s speed.
The overall ramming process is illustrated in Figure 1 and can be divided into several steps: Ⅰ. The vessel accelerates to a certain speed within the fragmented ice channel; Ⅱ. The bow of the vessel makes initial contact with and compresses the ice layer; Ⅲ. The vessel uses propeller thrust and its own inertia to ride up onto the ice layer; Ⅳ. The vessel penetrates the ice layer, causing extensive damage and creating a passage slightly wider than the vessel’s width; Ⅴ. The vessel reverses within the fragmented ice channel; Ⅵ(Ⅰ). The vessel retreats to a sufficient distance for acceleration, preparing for the next cycle, as showen in Figure 1 the turn arrow.
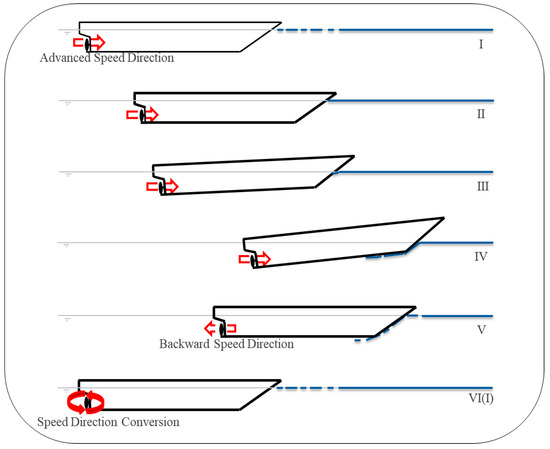
Figure 1.
Schematic Diagram of Ram-Induced Icebreaking Process.
Full-scale ship testing is the most direct and effective method to study the performance of ramming navigation, but it also has shortcomings, such as a long experimental preparation period and seasonal restrictions. Studies have shown that the ship’s load, ice penetration distance, ice destruction mode, and ship’s motion response are directly related to the ship’s speed and ice conditions. Ahn and Kee (2019) [3] recorded and analyzed ship data from the Korean icebreaker ARAON during polar research activities. They proposed a method for predicting ship resistance and velocity under various ice conditions. Nyseth et al. (2013) [5] evaluated the vessel’s response and the possibility of global loads acting on the hull for different types of ship-ice interactions by assessing the vessel’s motion in six degrees of freedom during ramming events using recorded data from the Norwegian Coast Guard icebreaker KV Svalbard. Lu and Kujala (2020) [6] conducted measurements during a special event involving the continuous ramming of an icebreaker into multi-year floating ice. Strain gauges were installed on the bow and stern of the vessel, and cameras were placed on the deck. A central measurement unit recorded the vessel’s speed, rudder angle, and power. The recorded parameters were analyzed using statistical methods to gain a deeper understanding of the potential factors or operations leading to high ice loads. Lee et al. (2016) [7] obtained ramming loads on the vessel’s hull when ramming into multi-year and floating ice via full-scale ship trials. While full-scale ship trials are the most direct and effective research method for studying the performance of ramming icebreaking, they also have limitations such as long preparation cycles, limited research subjects, and seasonal constraints.
According to the type of model ice, it can be divided into frozen model ice test and artificial model ice test. Both should ensure that the ice strength is reduced in proportion to the scale ratio to obtain the correct ice load. Guo et al. (2021) [10] constructed a model ship in an ice tank to accurately predict the navigation performance and ice loads during ship rams with thick ice in polar research ship operations. Non-dimensional numbers were analyzed to determine the ship’s ramming capability. Luo et al. (2017) [11] utilized a towing tank equipped with a wave maker at Harbin Engineering University to simulate wave-ice interactions and wave-ice-ship interactions in the ice-marginal zone using paraffin wax as a model ice. The paraffin wax model ice does not involve ice fragmentation, which is feasible in the case of broken ice. However, caution must be exercised when simulating floating ice, as the use of artificial model ice like paraffin wax can lead to easy damage to the ice edges when the ice floe size is large. The experimental results indicated that the ship’s navigation performance is dependent on the ramming speed, with the penetration distance and local loads increasing linearly with the ship’s speed. Based on the findings obtained from the study, improvement suggestions for future ship designs were proposed.
The main objective of this study is to investigate the ship ramming loads, icebreaking patterns, and penetration distances of an icebreaking vessel at different sailing speeds. Tests were conducted in a towing tank using artificial and breakable model ice to evaluate the icebreaking capability of the vessel. The research is divided into four parts: Part 1: Introduction to the background and significance of ship ramming; Part 2: Description of the experimental methods for evaluating the icebreaking performance, including the experimental procedures and conditions; Part 3: Observation of the model ice, including monitoring the performance of the model ice during experiments and observing the ice damage patterns after the vessel’s ramming. The observation of the model vessel’s icebreaking performance includes the speed, penetration distance, and load response during the sailing process; Part 4: Discuss the important results of ramming tests, including model rate analysis of ramming model tests and discussion of ice failure modes; Part 5: Summary and prediction of the experimental results, as well as the planning of future experiments.
2. Test Methods
2.1. Experimental Model
In this study, the test model used is an icebreaking scientific research vessel. The detailed icebreaker model parameter details are shown in Table 2. During the open water experiments, the turbulence stimulator was installed at 5% of the Length Perpendicular to the Perpendicular (LPP) from the Forward Perpendicular (FP) to minimize the scaling effects caused by conflicts between Froude and Reynolds scaling. During the ramming experiments, friction between the ice and the turbulence stimulator occurred frequently, and no ice-related tests were conducted with the installation of the turbulence stimulator.
Table 2.
Main parameters of the IRV.
2.2. Model Scaling
Relevant research has been conducted on the model testing similarity system required for conducting ice-ship interaction model experiments in conventional water tanks. This research provides technical and theoretical support for the implementation of model testing, thus laying the foundation for the successful execution of physical model experiments. When a ship navigates through ice, three types of forces act upon it: gravity, inertia, and friction. The destruction of model ice is mainly controlled by gravity and elastic forces [23].
- (1)
- Froude Number ()
The Froude similarity criterion assumes that gravity and inertia forces are dominant, adhering to the principles of geometric similarity, kinematic similarity, dynamic similarity, and similar boundary conditions in fluid experiments. In dynamic similarity, it satisfies the requirement of gravity similarity. The Froude number () can be expressed as the square root of the ratio of inertia force to gravity force (Equation (1)):
where is the velocity, is the acceleration due to gravity, and is the characteristic length.
- (2)
- Reynolds Number ()
The Reynolds similarity criterion assumes that viscous forces and inertia forces are predominant, satisfying the requirement of viscosity similarity in dynamic similarity. The Reynolds number () can be expressed as the ratio between inertia force and viscous force (Equation (2)):
where is the water density, is the velocity, is the characteristic length, and is the dynamic viscosity coefficient of water.
- (3)
- Cauchy Number ()
The Cauchy similarity criterion assumes that elastic forces and inertia forces are predominant, satisfying the requirement of elasticity similarity in dynamic similarity. The Cauchy number () can be expressed as the ratio between inertia force and elastic force (Equation (3)):
where is the water density, is the velocity, and is the elastic modulus of ice.
In this study, it is necessary to simulate the damage of ice cover under the ramming of the ship model. In this process, the dominant forces are inertia force, gravity, friction force, and elastic force. Therefore, the Froude and Cauchy similarity criteria are used to scale the physical processes. According to these two similarity criteria, the scaling ratios for geometric length, ice strength, ice thickness, and ice elastic modulus are , while the scaling ratios for time and velocity are , and the scaling ratios for mass and force are . The detailed scale relationship between the prototype and model of each physical parameter is shown in Table 3.
Table 3.
Scale of main physical quantities.
2.3. Model Ice
Artificial model ice is a supplement to model ice in an ice tank and has the same mechanical properties as frozen model ice. This article simulates 1.5 m of thick level ice of the current year, with a uniaxial compressive strength of 1200 kPa and a bending strength of 500 kPa. The mechanical properties of frozen model ice are affected by temperature, solute concentration, ramming velocity, etc. The mechanical properties of artificial non-freezing model ice are not affected by temperature, and its strength decreases with the increase in doped particles. The preparation of model ice refers to ITTC’s recommended procedure for model ice preparation ITTC—test methods for model ice properties.
The materials used to prepare artificial non-freezing model ice are 1801 stearic acid, 2426 H polyethylene particles, and boiling water. Since the melting point of stearic acid is 56~69.6 °C, stearic acid particles will melt into oil in boiling water, and the mechanical strength of its solid state is too high and needs to be reduced, while the melting point of polyethylene particles is about 130 °C higher than the boiling water temperature. The preparation method of artificial non-freezing model ice is to keep stearic acid particles in a mixed solution of oily stearic acid and boiling water, and the mixture of stearic acid mixed with polyethylene particles slowly solidifies to form non-freezing model ice. The ITTC model ice preparation procedure is different from the artificial ice preparation procedure in this article. The ITTC [24] ice tank preparation model ice uses cold air to reduce the temperature of the solution in the tank, allowing it to achieve a phase change from solution to ice and then controls the mechanical properties of the ice using temperature recovery. The density of stearic acid is close to that of polyethylene. After cooling, the stearic acid gradually solidifies, forming artificial model ice in which stearic acid is mixed with polyethylene particles. The incorporation of polyethylene particles achieves the purpose of weakening model ice and simulating natural defects such as cracks, voids, and air pockets in real sea ice to a certain extent.
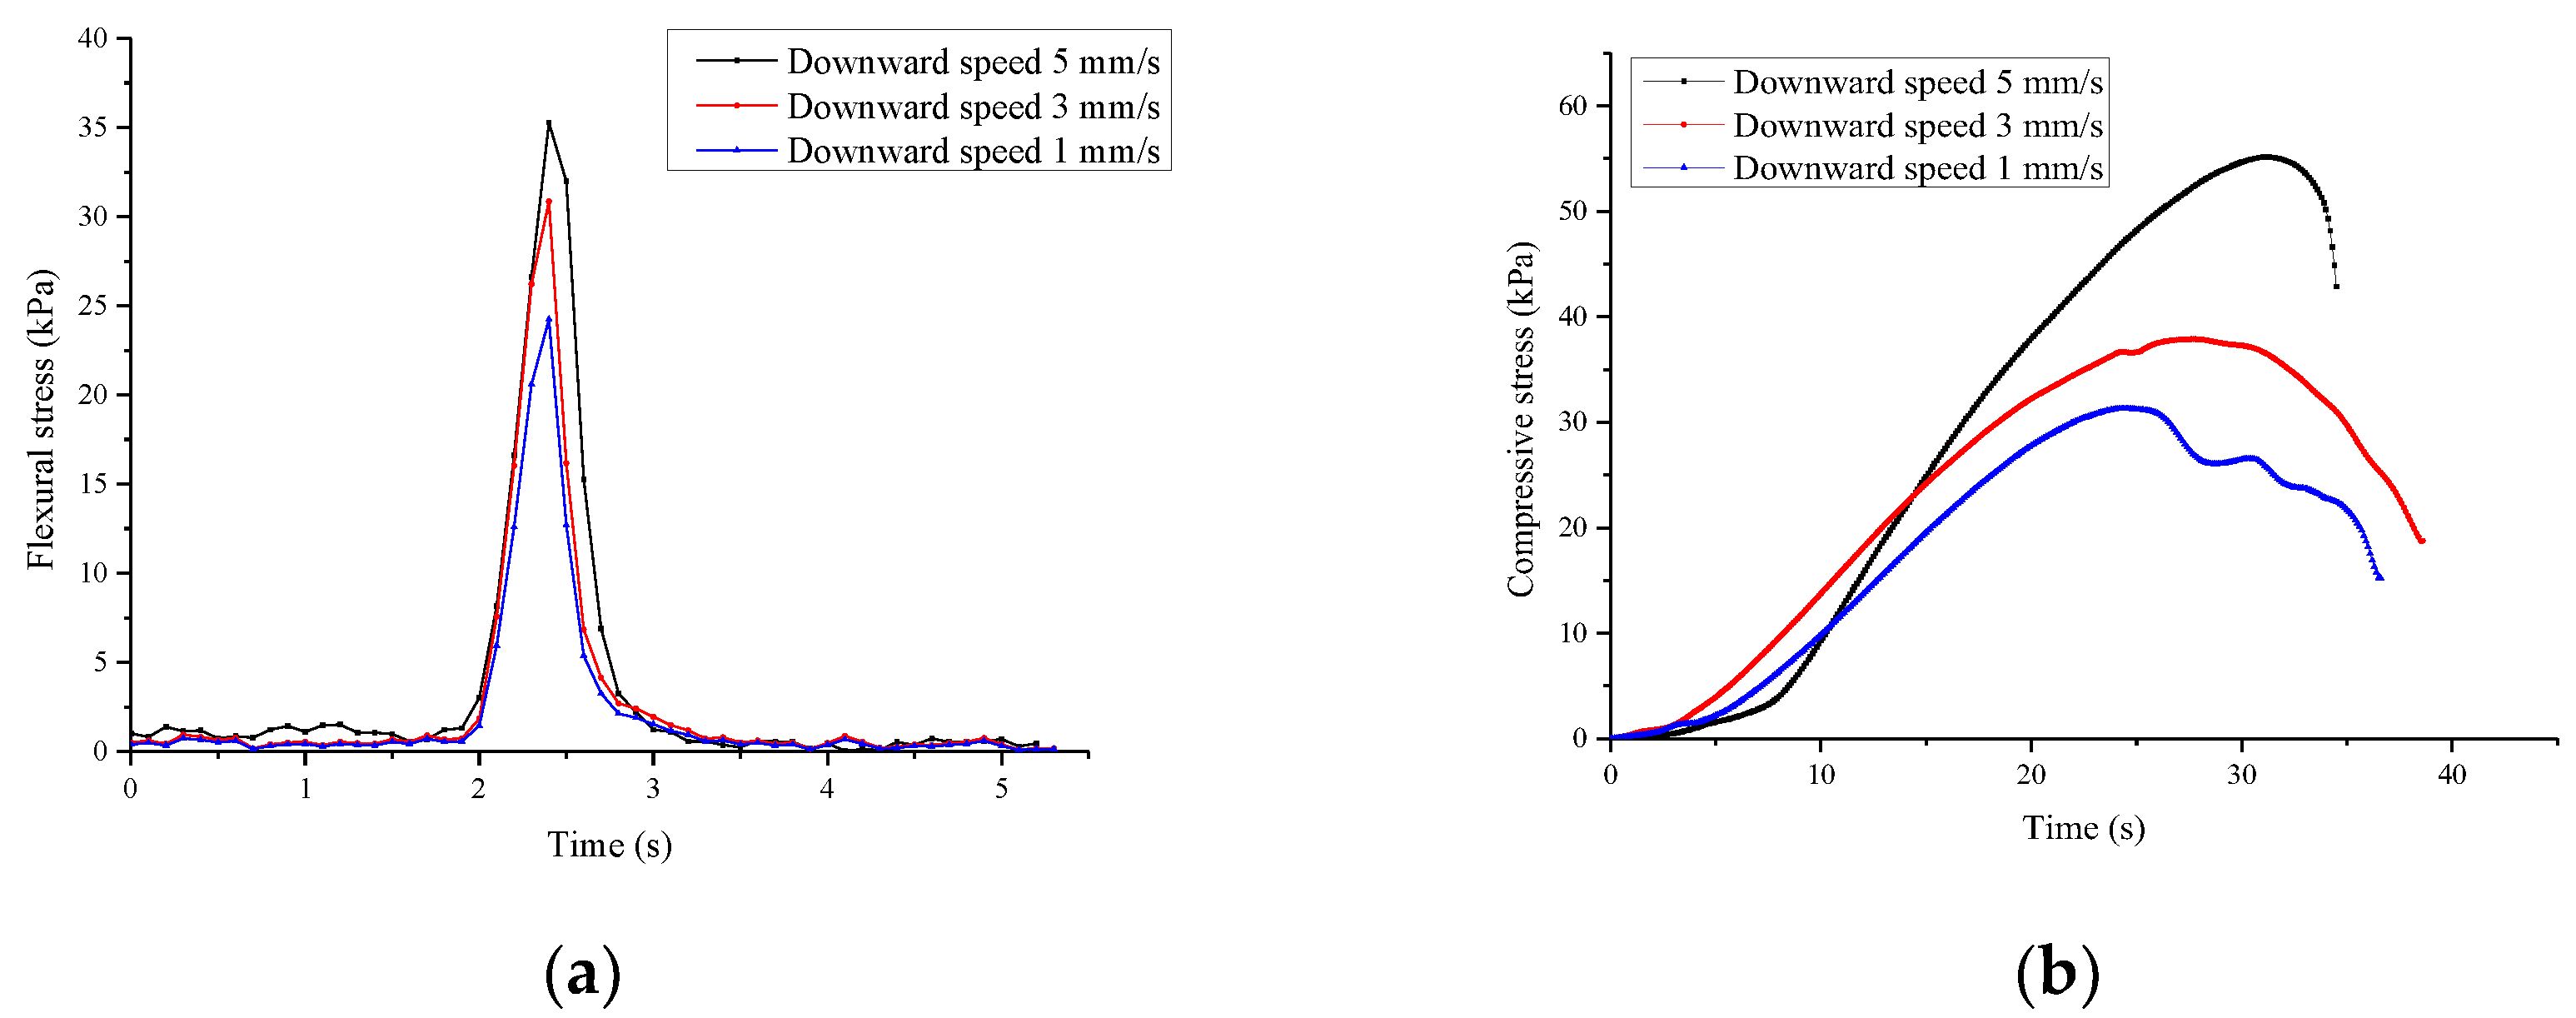
Figure 2a,b show the three-point bending and uniaxial compression test processes of artificial model ice, respectively, and the test results are summarized in Table 4. The loading speed of the model ice mechanical property test was the same as Riska’s test [22], which was set to 1~5 mm/s. This is because the ship-ice structure interaction is fast enough that sea ice exhibits the properties of brittle material. Figure 3a,b show the time-strength curve calculated from the time-force curve of the test. The three-point bending strength calculation formula and the uniaxial compression strength calculation formula recommended by ITTC are used here, where is the failure load, , , are model ice length, width, and thickness. The test results show that at a scale ratio of 1:30, the artificial non-freezing model ice is a brittle material and can be used for ship-ice interaction tests.
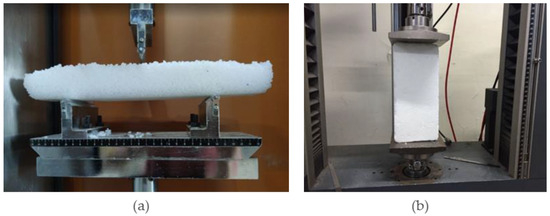
Figure 2.
Strength test of artificial non-frozen model ice: (a) Three-point bending test, using CTM-100 GD testing machine, used to detect the bending strength of model ice before the test starts; (b) Uniaxial compression test, using Zwick electronic universal Testing machine to evaluate the compressive strength of the model ice before starting the test. Only when the strength of the model ice meets the strength scale ratio can start the model ship ramming test.
Table 4.
Statistics of uniaxial compression and three-point bending strength results of artificial model ice.
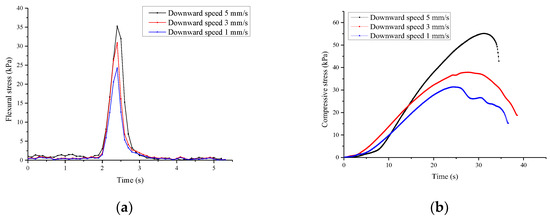
Figure 3.
Time-strength curve of artificial model ice: (a) Test results of three-point bending strength. From (a), it can be seen that the artificial non-frozen model ice breaks and then unloads after going through the elastic stage, showing typical characteristics of brittle materials; (b) Uniaxial compression test results, as can be seen from (b), the brittle failure of the material is not obvious or even plastic when loaded at 1 and 3 mm/s, while at 5 mm/s when the material exhibits brittle failure after passing through the elastic stage.
2.4. Experimental Setup
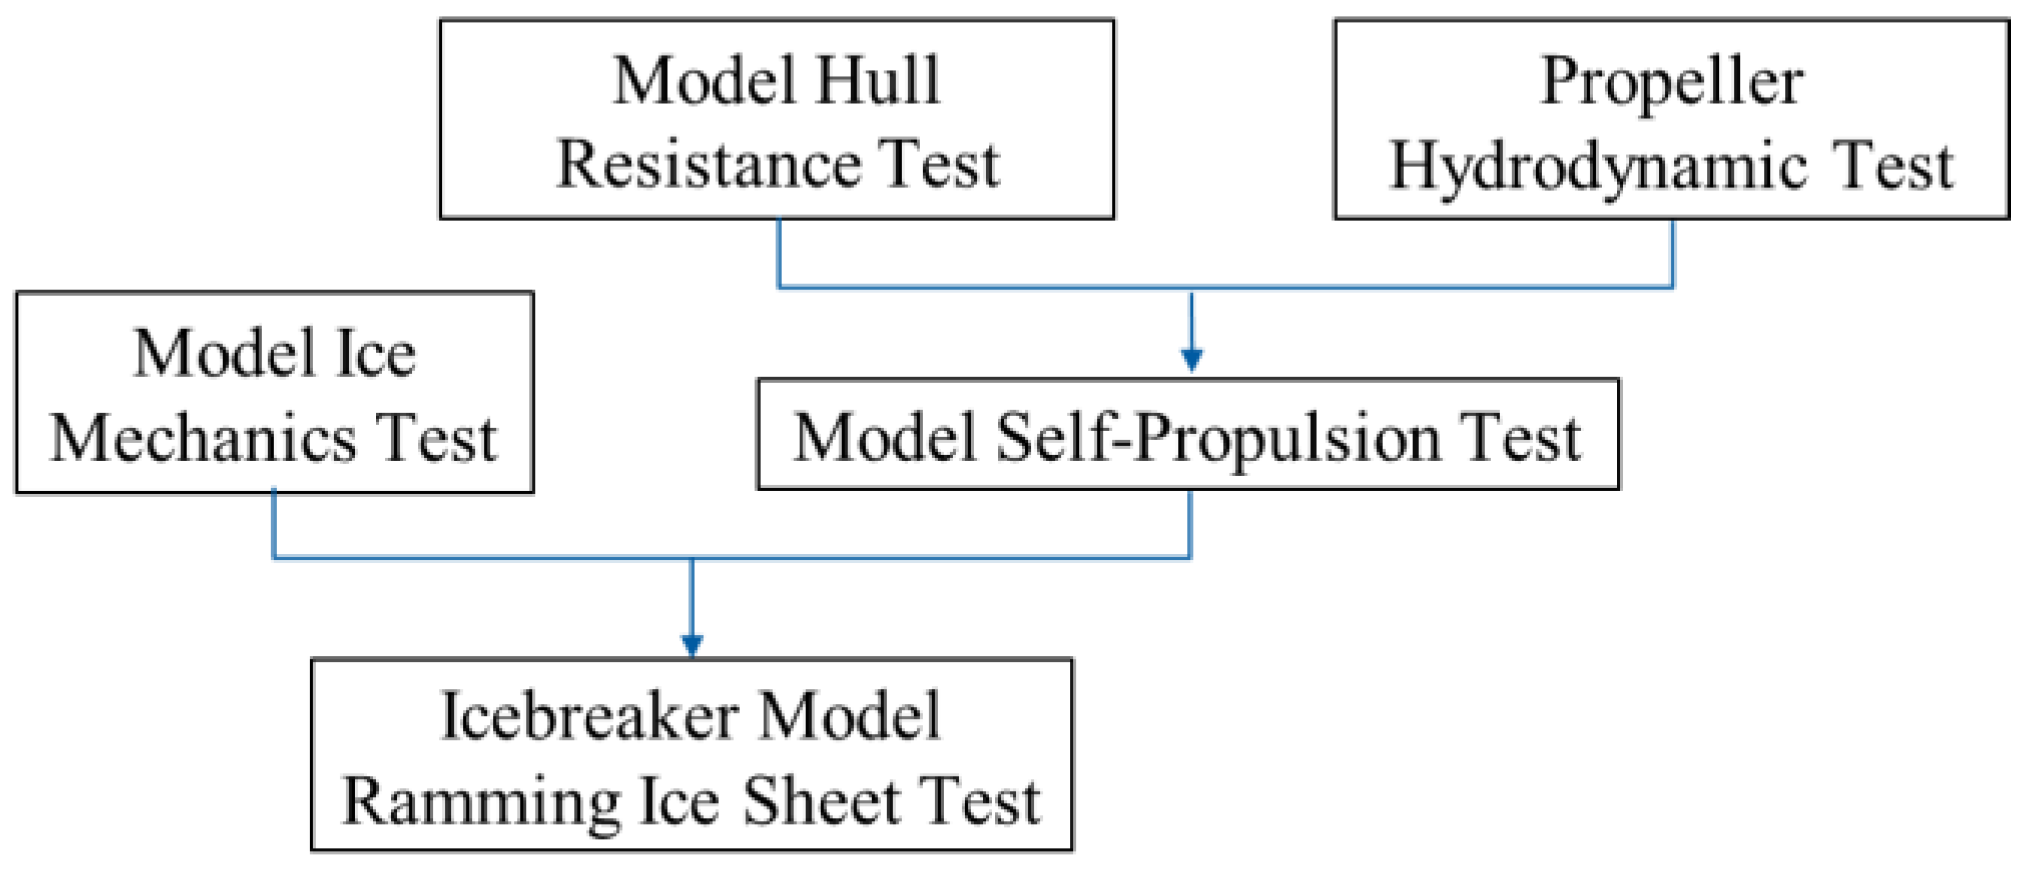
The detailed test process is shown in Figure 4, which includes the ship model, propeller model, and model ice tests. The ship model and propeller model used in the test were manufactured in strict accordance with the model value table, and the hull used 3D printing technology to ensure its smooth appearance and high precision. The propeller mold is processed with precision machinery, and the surface error is controlled within 0.1 mm. The model ice test measures the strength of the model ice before the test to ensure that it correctly scales mechanical properties. All experiments were conducted in the towing tank of Harbin Engineering University. The tank is 108 m long and 7 m wide, and the experimental water depth is 3.5 m. The tank carriage tows the icebreaker model forward and is equipped with data acquisition instruments, self-propulsion instruments, and other test equipment. All tests include the ship model ram ice discharge test and the ice mechanical performance test before the test, the ship water resistance, the propeller hydrodynamic test, and the ship model self-propulsion test.
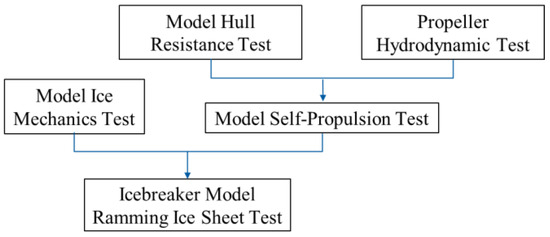
Figure 4.
Experimental Procedure Diagram.
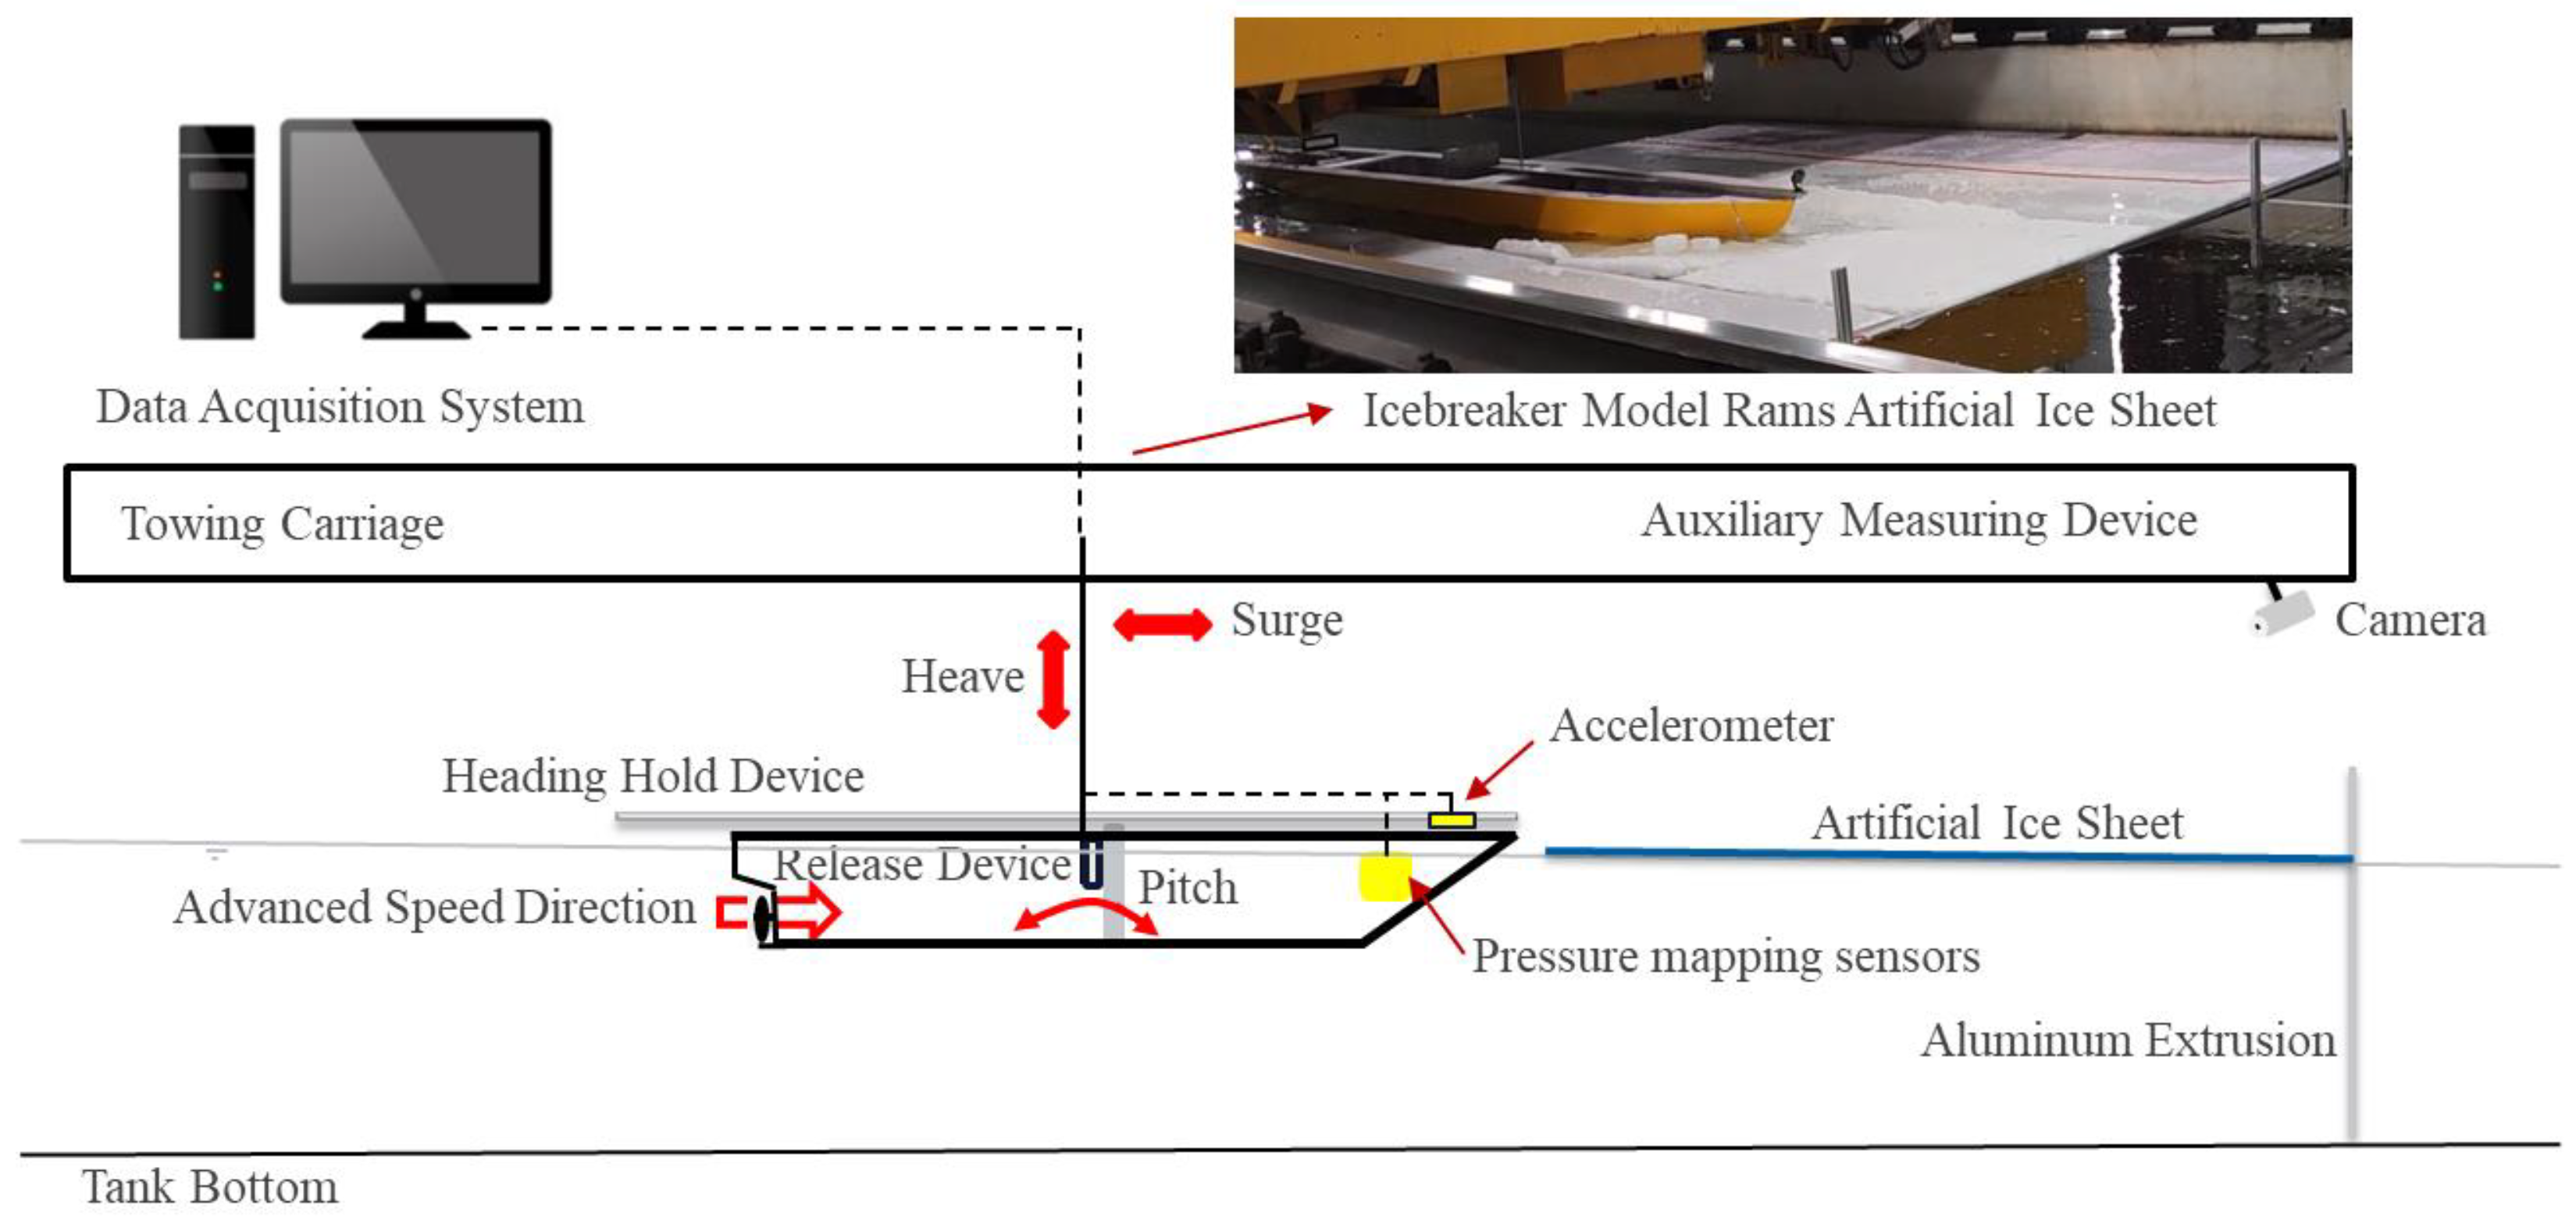
The specific test layout is shown in Figure 5, which consists of a test model, a control system, a measurement system, an observation system, and a data acquisition system. The model ice is arranged at the end of the tank, limited by chevron panels on the sides and aluminum profiles on the rear side. The ramming test models include an icebreaker model and an artificial non-freezing ice model. A ducted propeller is installed on the ship model to provide initial thrust. The control system is mainly the trailer, the release device, and the four-degree-of-freedom airworthiness instrument arranged on the trailer. The control system provides power for the test and is used for the resistance test of the ship model. The self-propelled test and icebreaking test are also conducted in open water dynamic tests. The measurement system and data acquisition system are matched, with a sampling frequency of 50 Hz, and are used to measure load and motion information and data acquisition in the test. The observation system is primarily video and photography equipment, including a GoPro action camera mounted on the bow and a monitor mounted on a trailer to record the ice’s damage patterns.

Figure 5.
Experimental Layout Diagram.
The process of preparing and placing the model ice in the tank must be very careful. The preparation and transfer devices are designed to be integrated to minimize damage to the model ice. Because the bending strength of the model ice is very low after scaling, the preparation mold must maintain good stiffness to ensure that the model ice sheet does not crack during transportation. First, we prepare small-sized model ice in batches, such as 0.5 m × 1.0 m, and then merge the small-sized model ice into large-area model ice by pouring it with the same proportion of the hot mixture and then cooling it. Of course, a large model ice sheet can also be poured at one time. However, it is more efficient to prepare large-model ice by merging small-size model ice. A thin plastic film needs to be laid between the model ice and the transfer device so that the model ice and the mold can be separated more easily in the water.
The icebreaking research vessel is designed to have the icebreaking capability of continuously breaking through 1.2 m thick ice (including 0.2 m of snow) at a speed of 1.5 knots [25]. When designing the icebreaking conditions for the ram, the icebreaking capability of the vessel and the polar ice conditions were fully considered. The simulated ice thickness was set to 1.5 m, representing the ice thickness of the current year, with a bending strength of 500 kPa. For this model experiment, a self-developed artificial model ice was used, which is similar in density to sea ice. The bending strength, friction coefficient, and density of the model ice meet the requirements for this scale model experiment.
According to the recommendations of the ITTC [23] for ice model testing, the width of the model ice should be at least twice the ship’s width, which means the minimum width of the model ice should be 1.81 m. To eliminate the influence of the tank walls, the distance from any load application point on the model ice to the tank walls should exceed three characteristic lengths (). In this way, the range of the horizontal ice field can be considered infinite, and it is defined as follows:
where is the Young’s modulus of ice with an average test value of 85 MPa, HI is the thickness of the ice with an average value of 0.06 m, is the Poisson’s ratio of ice (0.3~0.33), is the water density, is the acceleration due to gravity, and the average water temperature during the test is 25 °C. The calculated characteristic length is 0.614 m. The distance from the load application point to the tank walls is greater than three times the characteristic length. Therefore, it can be considered that the simulated sea ice represents an infinite ice field of level ice.
3. Test Results and Analysis
3.1. Model Ramming and Icebreaking Phenomenon
In the experiments conducted on a level ice condition with the icebreaking ship, detailed observations were made on the modes of ice breaking [9,26]. It was found that the ice breaking in front of the ship’s bow occurred via a complex process with multiple modes of failure, and the trajectory of ice breaking reflected this complex process.
In each test group, a relatively intact area of ice fragmentation could be observed on the water surface. Figure 4 illustrates the icebreaking pattern of the model ice at a model speed of 0.72 m/s.
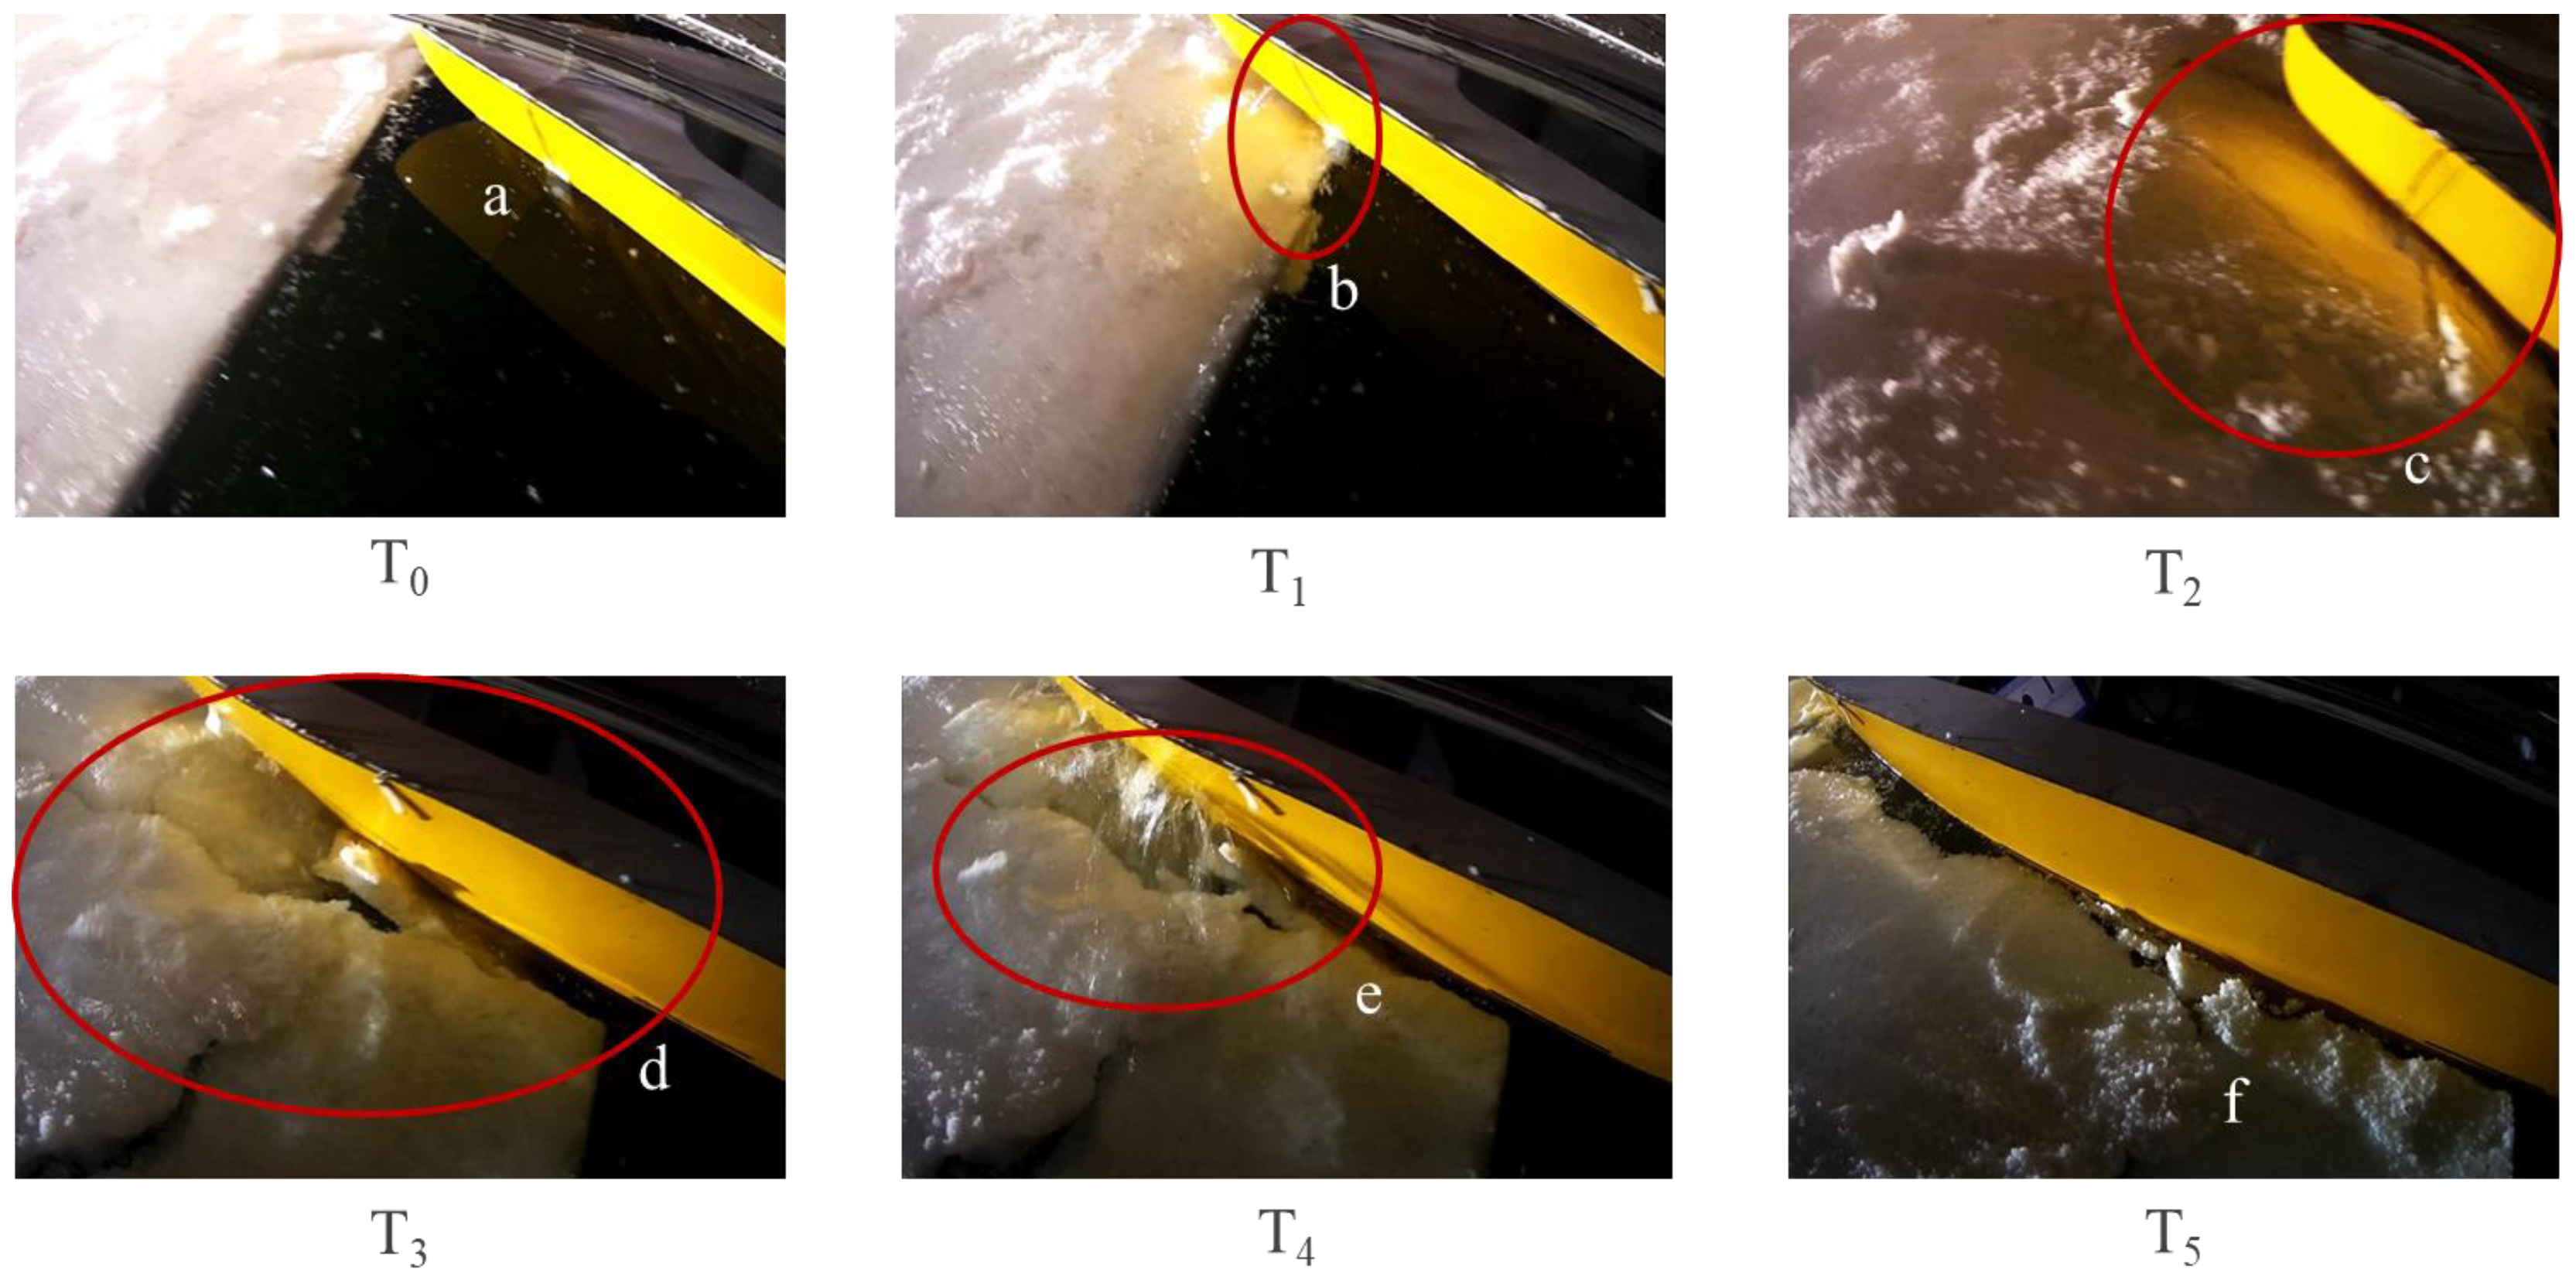
According to the series of images in Figure 6, the process of ice breaking in front of the ship’s bow can be divided into the following stages: T0, contact between the ship’s bow and the model ice, with evident deformation and localized damage of nearby ice floes; T1, as the ship model continues to advance, the lateral ice floes in front of the ship’s hull experience a combination of local compression and buckling, resulting in fragmented ice; T2, after the fragmented ice is pressed underwater by the ship’s hull, localized compression damage starts to occur in the ice floes on the right side of the bow, while a circumferential crack extends from the shoulder of the ship model towards the bow pillar; T3, the circumferential crack extending along the ship’s hull encounters local damage caused by the bow pillar, triggering the formation and propagation of a new circumferential crack (second-order circumferential crack); T4, the two circumferential cracks merge and cause extensive bending and damage to the ice floes on the left side of the ship’s hull, while the ice floes on the right side of the hull enter the process of circumferential crack propagation. T5, the ice floes eventually break under multiple ramming forces, with the floating ice either submerging under the ship’s bottom or being pushed aside to both sides of the ship model, creating a narrow channel closely following the width of the ship model.

Figure 6.
Experimental Scenes of ramming with Level Ice at a Model Speed of 0.72 m/s, T0–T5 are time sequences, a–f are used to express the ice damage stage in the time-force curve in Figure 8. The red circle marks the damage range and cracks.
3.2. Ice Penetration Distance
The penetration length in level ice can be determined by comparing the position of the intact ice edge before and after each ramming test [10]. Table 5 presents the experimental results of penetration distance, average load, and extreme values as a function of ship speed.
Table 5.
Measurement Results of Model Test.
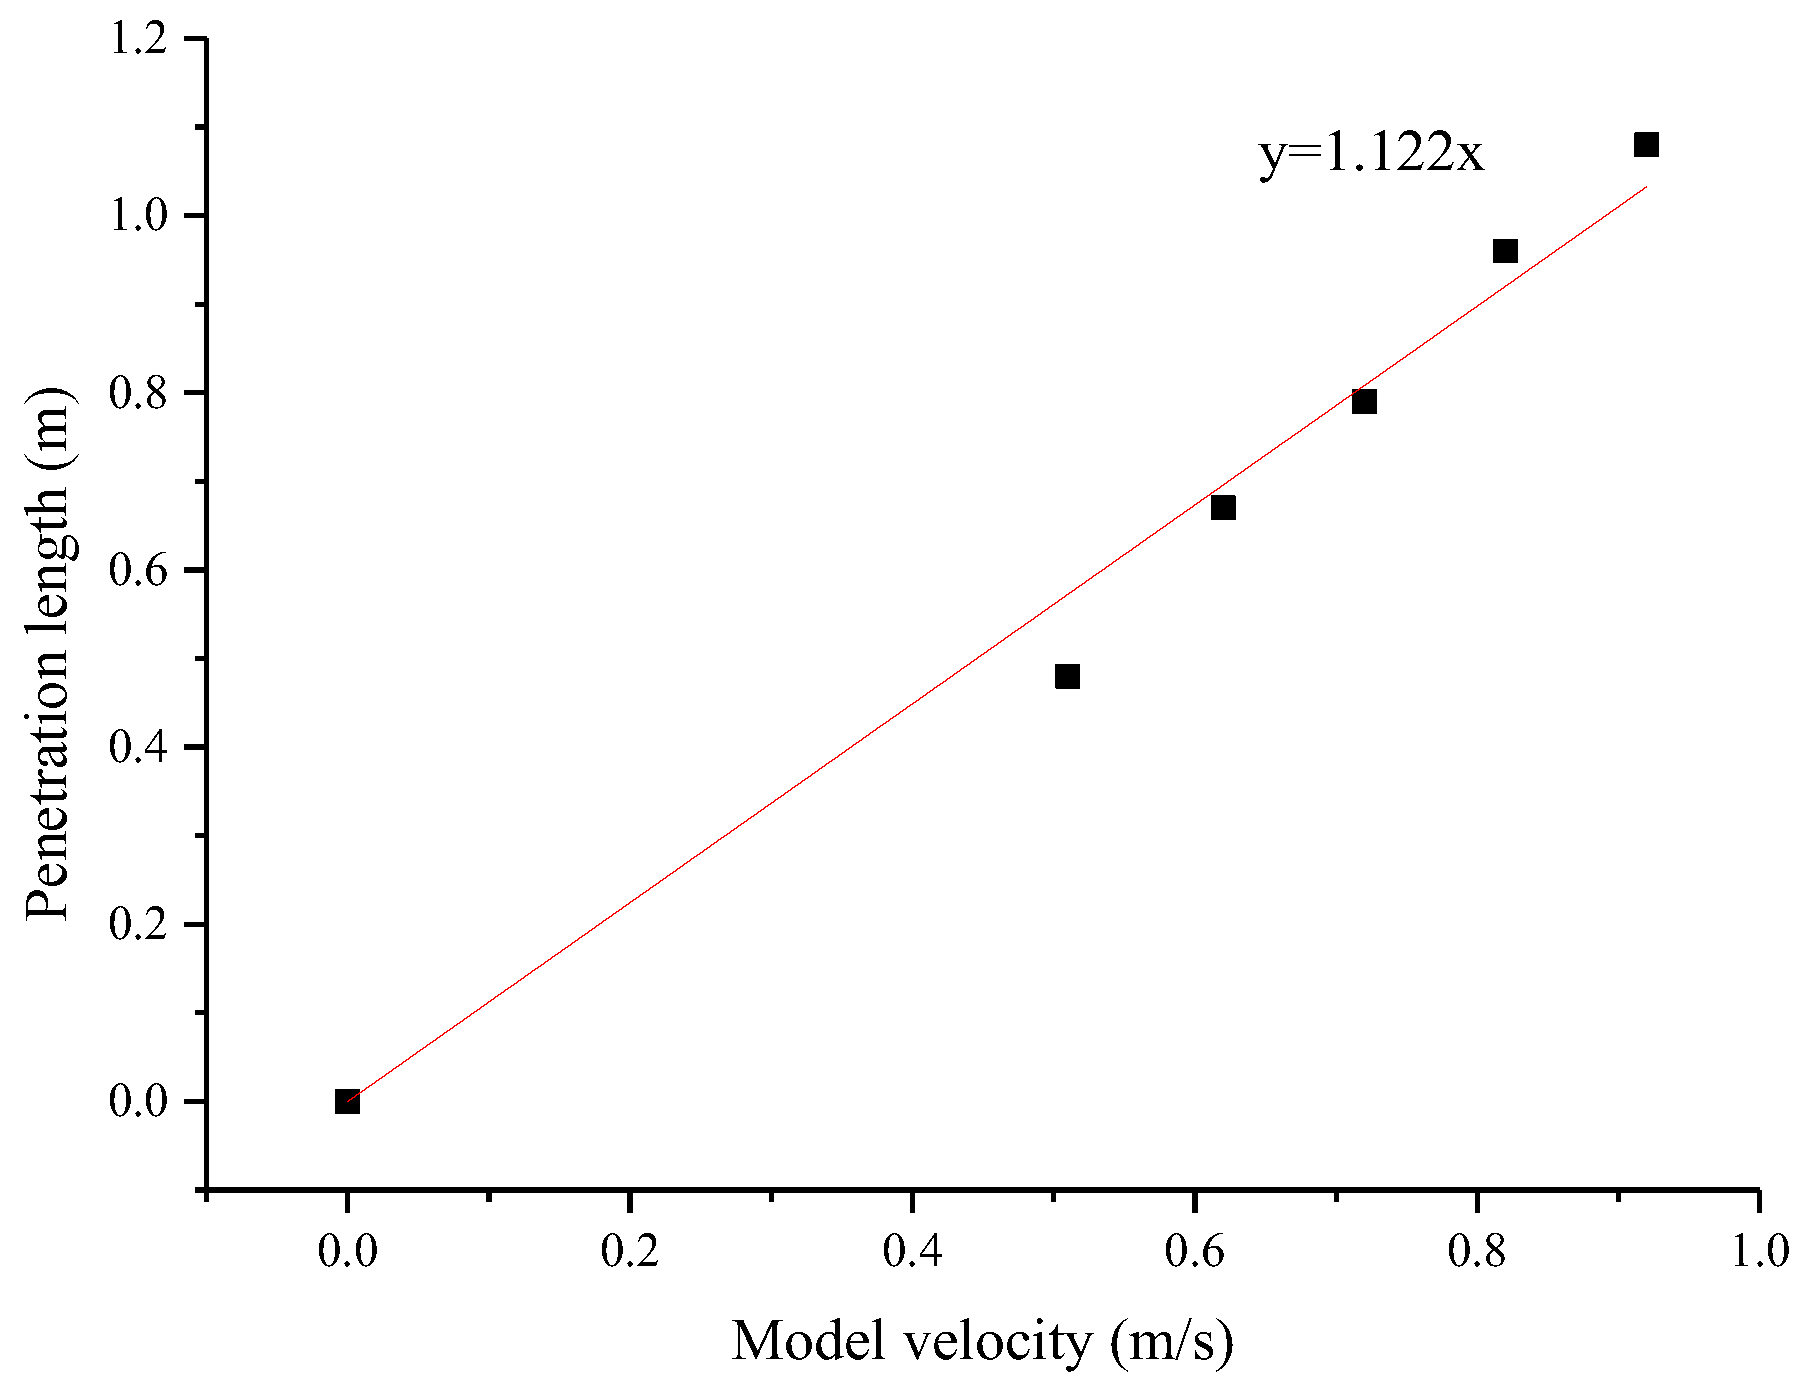
The average penetration values for typical speeds are summarized in Figure 7, showing a relatively good linear correlation between the two variables. In the calculation models by Sawamura et al. (2020) [15], the penetration distance is related to the ice thickness; however, it needs to be experimental proof. We cannot distinguish if the thickness is the main influence factor in the ramming test; it should be studied with other influence factors in the future. The experiment can be improved by considering the influence of ice thickness and ice mechanics. Riska (1987) [22] analyzed full-scale, model, and numerical results and found that the ship penetration distance during ramming is proportional to the speed, which is the same as the study in this paper. Guo (2021) [10] used frozen model ice to conduct a ship model ramming test in the HSVA large ice tank. The results also showed a positive correlation between penetration distance and speed.

Figure 7.
Curve of Penetration Distance with Ship Speed Variation.
3.3. Bow Loads
The observed force-displacement curves also exhibit corresponding pulsating characteristics [22]. In Figure 8, it can be seen that the continuous fluctuations on a high level represent the characteristic of compression damage and the complete unloading of bending damage, which corresponds to the observed continuous compression damage in the bow column region and the bending damage caused by circumferential cracks in the experimental phenomenon.
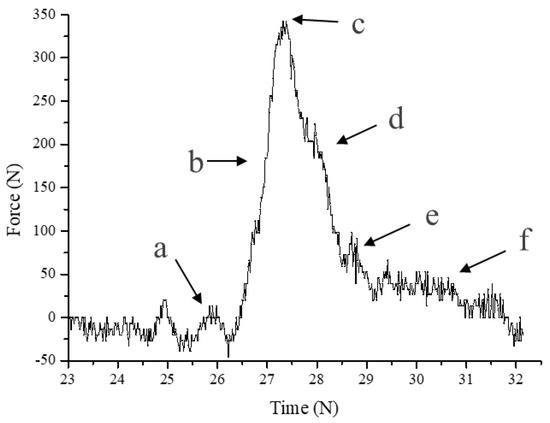
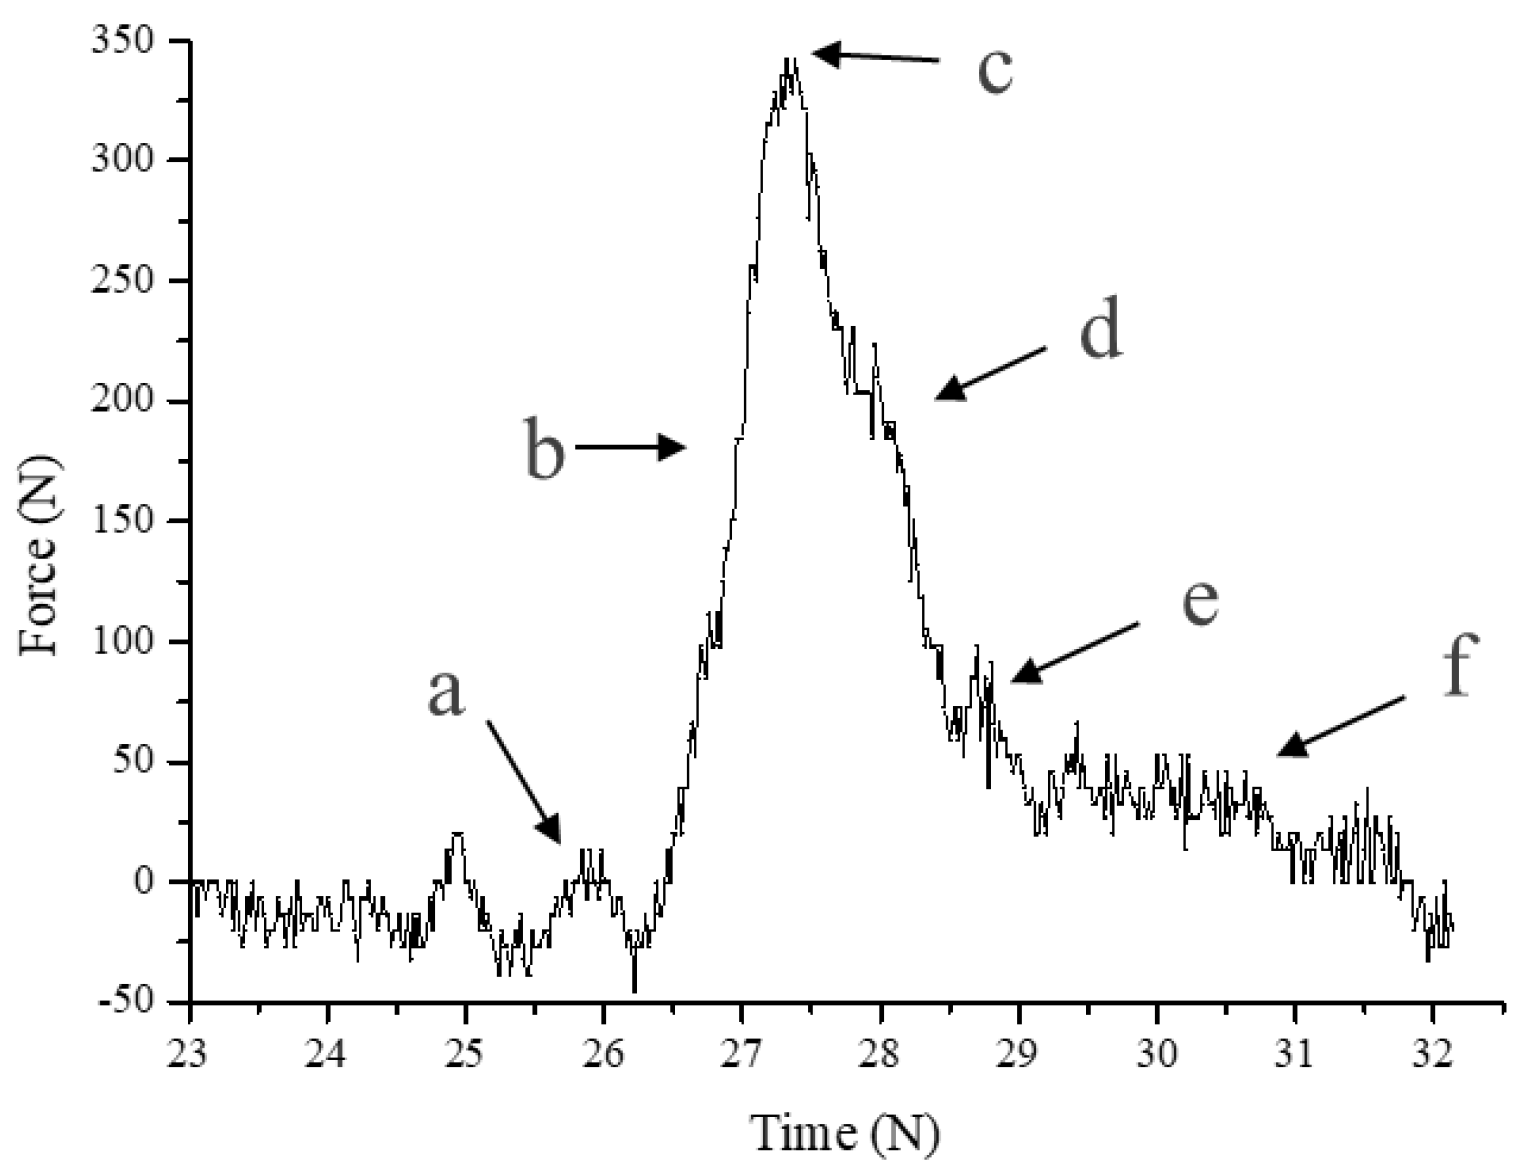
Figure 8.
Total Force-Time History of IRV at a Speed of 0.514 m/s during ramming with Level Ice, a–f are used to express the ice damage stage in the time-force curve, which can be seen in Figure 6.
Taking the test record at 0.514 m/s as an example, when the release device is activated, and the model ship starts free sailing under the action of water resistance (Stage a), the force-time history shows an increasing trend of fluctuation. When local compression damage occurs in the ice sheet (Stage b), the force-time history exhibits continuous and rapid fluctuations on a high level of ice force. When the circumferential crack starts to extend towards the bow column (Stage c), the ice force rapidly rises to a very large peak value. When this crack extends to the region where local compression damage occurs in the ice sheet near the bow column, the ice force suddenly drops to a certain level, while the second-order circumferential crack rapidly extends towards the front end of the bow column, eventually triggering large-scale fracture and damage of the ice sheet (Stage d), and at this time, the ice force also rapidly rises to the next peak value. The completion of the aforementioned damage process leads to a rapid decrease in ice force, but this decreasing trend is quickly terminated by the extension process of the circumferential crack on the other side of the bow (Stage e). A series of successive large-scale ice sheet damage processes on both sides of the hull will cause significant damage to the ice sheet in front of the bow, and this large-scale damage will promote the rapid upwelling of the ice water body in front of the bow, further expanding the range of ice sheet damage. This coupled physical process is ultimately reflected in the force-time history as a sustained unloading state over a certain time (Stage f).
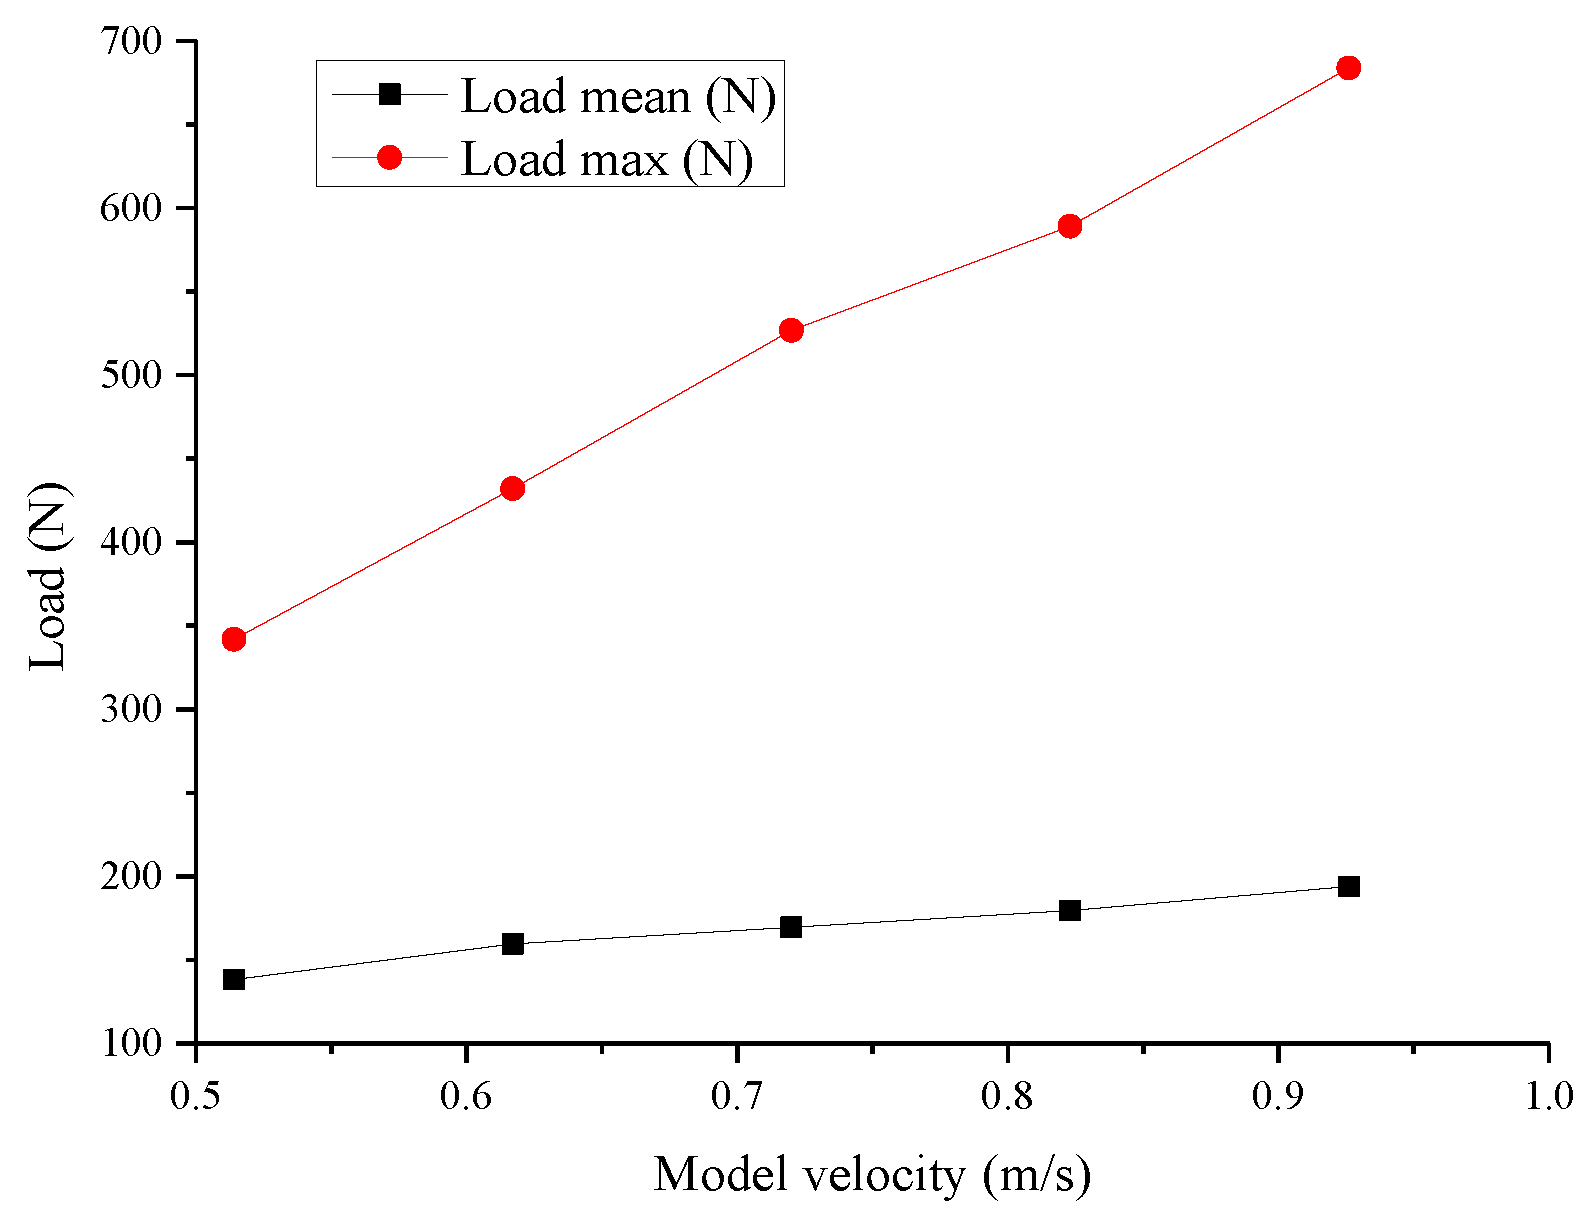
Further analysis of the ramming experiments reveals a stable and regular relationship between the icebreaking load and the sailing speed. For ships navigating in ice-infested areas, the average ramming load directly determines their continuous icebreaking capabilities, while the extreme loads are primarily considered for structural safety. Table 5 provides the average and extreme load data, and Figure 9 shows the variations of the average and extreme ice forces acting on the model ship under level ice conditions with respect to the sailing speed. The following patterns can be observed from the curves: (1) The average load of the ship during ramming increases with the increase in sailing speed; (2) The extreme load experienced by the ship during ramming also increases with the increase in sailing speed.
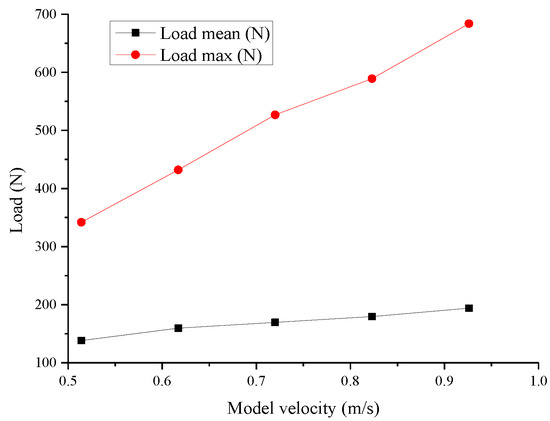
Figure 9.
Variation of Icebreaking Load with Sailing Speed under ramming Conditions.
In this physical process, the bow contact load is of particular interest to designers as it also determines the design requirements for the local strength of the hull. During the experiment, tactile sensors were installed on the outer side of the bow to measure the variation of ship-ice interaction load over time. Both the average and extreme values of the contact load increase with the increase in sailing speed, but the rate of increase is relatively moderate.
4. Discussion
4.1. Ice Strength Scaling Guidelines
At present, the scaling criteria of ice in ice model tests are not uniform. Although ITTC [23] recommends scaling criteria dominated by the Froude number, the damage to ice materials is obviously more complicated. Newman [27] tried to introduce the concept of strength factor in fracture mechanics into the scaling criterion of model tests and obtained the critical ice strength factor used to control ice fracture. The main reason for the non-uniform scaling of ice strength is the complexity of the internal crystal structure and defects of the ice material and the complexity of external damage caused by non-uniform loading environments [28]. However, the results of the ship model test are not ideal. The main reason is that it is contrary to the Cauchy number. At the same time, the operation is too complicated and has been recommended by the ITTC model ice test rules.
In the research of Riska (1987) [22], the ship-ice contact area and ice pressure were first determined, and then the compression strength was scaled by the penetration distance. The scaling relationship between the model and the actual ship is shown in Equations (5) and (6). In his study, compressive strength dominated. This may be related to the short distance of ship-ice interaction and the fact that the ship type studied is a bulk carrier with a large bow inclination angle. The scaling of the flexural strength [29,30,31,32] and elastic modulus follows exactly the linear scaling derived from the Froude and Cauchy numbers. The research object of this article is an icebreaking scientific research ship, and the bow inclination angle is smaller than that of other ships. Therefore, the bow is more likely to climb up the ice, and the strength of the ice must take into account not only the scaling of the compressive strength but also the scaling of the flexural strength, and even more importantly. Therefore, this article uses the model scaling method recommended by ITTC, that is, the similarity relationship derived based on the Froude number and the Cauchy number, such as the scaling ratio between the model and the real scale, in Table 3.
where is the nominal ice pressure, is based on the form of the Tsai-Wu failure criterion and is the ice compressive strength factor, is the empirical constant dependent on the test, is the scale factor, and the subscripts p and m represent full scale and model, respectively.
4.2. Destruction Modes of Ice
Figure 4 shows detailed pictures of ice damage at different times when an icebreaker collides with flat ice. The model ice shows typical compression damage in the initial stage of ramming, which is consistent with the research of Riska (1987) [22]. As the ship model moves further forward, the damage of the model ice shows bending-dominated damage, which is the main reason for the generation of circumferential cracks. This situation occurs in most ship-ice interactions, where the ice failure shape is slightly different depending on the ship shape. In the final stage, at higher speeds (v > 0.72 m/s), the model ice showed obvious splitting. Myland [26] studied four different bow types of icebreaking model tests. The test results showed that large ice floes can produce greater resistance than small ice floes. However, the study of ice thickness on ramming ice has not been carried out in-depth, and the correlation between ice thickness and ice destruction cannot be concluded here. Of course, the failure mode of ice is also related to the properties of the ice itself. Ice will show ductile, elastic, and brittle failure at different ballast rates [29,30,31,32]. In this study, however, the ramming velocity was fast enough that the failure of the model ice was shown to be a brittle failure.
In summary, the following conclusions can be drawn. During the icebreaking process of ship ramming, the damage modes of ice are mainly compression and bending damage. The ice destruction mode in ramming is related to the type of icebreaker, ice conditions, and ship speed.
5. Summary and Conclusions
The following conclusions can be drawn from the ram icebreaking experiments:
- (1)
- Similarity criteria: By summarizing the commonly used similarity criteria and deriving scaling rules applicable to model tests under ramming conditions, the similarity criteria for ramming experiments on level ice were established.
- (2)
- Model ice damage: In the ramming experiments under level ice conditions, the damage pattern of the model ice for the IRV initially involved localized bending and squeezing damage caused by the bow, followed by extensive bending damage initiated at the shoulder as the model ship climbed onto the ice surface with inertia.
- (3)
- Ramming distance: Under level ice conditions, there is a good linear correlation between the icebreaking distance and the sailing speed.
- (4)
- Contact load of the icebreaking ship’s bow: Under level ice conditions, both the average and extreme values of the contact load on the bow of the icebreaking ship increase with the increase in sailing speed.
Studying the ramming of ice-strengthened ships is of great significance. If conditions permit, we will focus on conducting more comprehensive experiments in towing tanks in the future. Research should focus on analyzing different ice conditions, such as ice bending strength and ice thickness under variable operating conditions, as well as model tests on different ice conditions, such as ramming with large floating ice blocks and ice ridges. In addition, it is important to study the prediction of the icebreaking capability of full-scale ships based on model test results. Overall, research on ramming is still in its early stages and requires further in-depth study.
Author Contributions
Conceptualization, Supervision, C.G.; Writing—original draft, Data curation C.Z.; Methodology, Funding acquisition C.W. (Chunhui Wang); Writing—review and editing, C.W. (Chao Wang). All authors have read and agreed to the published version of the manuscript.
Funding
The National Natural Science Foundation of China (Grant No. 51909043), the China Scholarship Council (Grant No. 202106680054), and Harbin Engineering University Central University Basic Research Funds (Project No.: 3072022CF0103) fund this paper.
Institutional Review Board Statement
Not applicable.
Informed Consent Statement
Not applicable.
Data Availability Statement
The data presented in this study are available on request from the corresponding author.
Acknowledgments
This research was supported by Harbin Engineering University, where their towing tank and related laboratories were used for the experiments. The laboratory staff assisted in completing the necessary procedures to ensure the success of this study. The authors would like to express sincere gratitude to those who supported this research.
Conflicts of Interest
The authors declare no conflict of interest.
References
- IMO. Guidelines for Ships Operating in Arctic Ice-Covered Waters; IMO Report; IMO: London, UK, 2002. [Google Scholar]
- Transport Canada Ship Safety. Arctic Ship Pollution Prevention Regulations. TP 12260E. 1985. Available online: https://faolex.fao.org/docs/pdf/can023168.pdf (accessed on 6 October 2019).
- Ahn, S.; Kee, L.T. A Study of the Change of Ship Speed according to the Ice Load Signal during Slow Ramming. J. Ocean Eng. Technol. 2019, 33, 627–631. [Google Scholar] [CrossRef]
- Yamauchi, Y.; Mizuno, S. Study on improvement in ramming performance of Antarctic icebreaker. In Proceedings of the 19th International Offshore and Polar Engineering Conference, Osaka, Japan, 21–26 June 2009; pp. 629–635. [Google Scholar]
- Nyseth, H.; Robert, F.; Sand, B. Evaluation of global ice load impacts based on real-time monitoring of ship motions. In Proceedings of the 22nd International Conference on Port and Ocean Engineering under Arctic Conditions, Espoo, Finland, 9–13 June 2013; Available online: http://www.poac.com/Papers/2013/pdf/POAC13_135.pdf (accessed on 1 October 2020).
- Lu, L.; Kujala, P.; Valdez Banda, O.A. Ramming induced ice loads between the ship bow and multiyear thick ice in Antarctic Weddell Sea. In Developments in the Collision and Grounding of Ships and Offshore Structures, Proceedings of the 8th International Conference on Collision and Grounding of Ships and Offshore Structures (ICCGS 2019), 21–23 October 2019, Lisbon, Portugal; CRC Press: Boca Raton, FL, USA, 2019; p. 204. Available online: https://acris.aalto.fi/ws/portalfiles/portal/38668124/ENG_Lu_et_al_Ramming_induced_ice_loads_Development_in_the_Collision_and_Grounding_of_Ships.pdf (accessed on 3 March 2021).
- Lee, J.M.; Lee, C.J.; Kim, Y.S.; Choi, G.G.; Lew, J.M. Determination of global ice loads on the ship using the measured full-scale motion data. Int. J. Nav. Archit. Ocean Eng. 2016, 8, 301–311. [Google Scholar] [CrossRef]
- Riska, K.; Bridges, R. Limit state design and methodologies in ice class rules for ships and standards for Arctic offshore structures. Mar. Struct. 2019, 63, 462–479. [Google Scholar] [CrossRef]
- Kotilainen, M.; Suominen, M.; Kujala, P. Rotating ice cusps on ship’s bow shoulder: Full-scale study on the cusp sizes and corresponding peak loads in different ice and operational conditions. Ocean Eng. 2019, 189, 106280. [Google Scholar] [CrossRef]
- Guo, C.; Zhang, C.; Feng, F.; Wang, C.; Wang, C. Predicting ship ramming performance in thick level ice via experiments. Ships Offshore Struct. 2022, 17, 2141–2149. [Google Scholar] [CrossRef]
- Luo, W.-Z.; Guo, C.-Y.; Wu, T.-C.; Su, Y.-M. Experimental research on resistance and motion attitude variation of ship–wave–ice interaction in marginal ice zones. Mar. Struct. 2018, 58, 399–415. [Google Scholar] [CrossRef]
- Myland, D.; Ehlers, S. Methodology to assess the floe size and distribution along a ship hull during model scale ice tests for self-propelled ships sailing ahead in level ice. Ships Offshore Struct. 2017, 12, S100–S108. [Google Scholar] [CrossRef]
- Zhang, Y.; Tao, L.; Wang, C.; Ye, L.; Guo, C. Numerical study on dynamic icebreaking process of an icebreaker by ordinary state-based peri dynamics and continuous contact detection algorithm. Ocean Eng. 2021, 233, 109148. [Google Scholar] [CrossRef]
- Zhang, Y.; Tao, L.; Wang, C.; Ye, L.; Sun, S. Numerical study of icebreaking process with two different bow shapes based on developed particle method in parallel scheme. Appl. Ocean Res. 2021, 114, 102777. [Google Scholar] [CrossRef]
- Junji, S. Numerical Simulation of Ship Ramming in Extremely Thick Ice. In Proceedings of the 26th International Conference on Port and Ocean Engineering under Arctic Conditions, Moscow, Russia, 14–18 June 2021; Available online: https://www.poac.com/Proceedings/2021/POAC21-068.pdf (accessed on 1 June 2022).
- Gao, Y.; Hu, Z.; Ringsberg, J.W.; Wang, J. An elastic–plastic ice material model for ship-iceberg collision simulations. Ocean Eng. 2015, 102, 27–39. [Google Scholar] [CrossRef]
- Xu, Y.; Hu, Z.; Ringsberg, J.W.; Chen, G. Nonlinear viscoelastic-plastic material modelling for the behavior of ice in ice-structure interactions. Ocean Eng. 2019, 173, 284–297. [Google Scholar] [CrossRef]
- Wang, C.; Hu, X.; Tian, T.; Guo, C.; Wang, C. Numerical simulation of ice loads on a ship in broken ice fields using an elastic ice model. Int. J. Nav. Archit. Ocean Eng. 2020, 12, 414–427. [Google Scholar] [CrossRef]
- Zhou, L.; Diao, F.; Song, M.; Han, Y.; Ding, S. Calculation Methods of Icebreaking Capability for a Double-Acting Polar Ship. J. Mar. Sci. Eng. 2020, 8, 179. [Google Scholar] [CrossRef]
- Zhao, W.; Johan Leira, B.; Vilhelm Høyland, K.; Kim, E.; Feng, G.; Chen, Z.; Gui, H. On the Structural Analysis of Icebreakers Due to Ramming of First-Year Ice Ridges. In Proceedings of the ASME 2022 41st International Conference on Ocean, Offshore and Arctic Engineering, Hamburg, Germany, 5–10 June 2022; Volume 6: Polar and Arctic Sciences and Technology, V006T07A029. ASME: New York, NY, USA, 2022. [Google Scholar] [CrossRef]
- Gong, H.; Polojärvi, A.; Tuhkuri, J. Discrete element simulation of the resistance of a ship in unconsolidated ridges. Cold Reg. Sci. Technol. 2019, 167, 102855. [Google Scholar] [CrossRef]
- Riska, K. On the Mechanics of the Ramming Interaction between a Ship and a Massive Ice Floe. Ph.D. Dissertation, Technical Research Centre of Finland, Espoo, Finland, 1987. [Google Scholar]
- ITTC. Test Methods for Model Ice Properties. ITTC Report. 2021. Available online: https://www.ittc.info/media/8061/75-02-04-02.pdf (accessed on 1 June 2022).
- ITTC. General Guidance and Introduction to Ice Model Testing. ITTC Report. 2021. Available online: https://www.ittc.info/media/9649/75-02-04-01.pdf (accessed on 1 June 2022).
- Chai, W.; Leira, B.J.; Hoyland, K.V.; Sinsabvarodom, C.; Yu, Z.L. Statistics of thickness and strength of first-year ice along the Northern Sea Route. J. Mar. Sci. Technol. 2021, 26, 331–343. [Google Scholar] [CrossRef]
- Myland, D.; Ehlers, S. Influence of bow design on ice breaking resistance. Ocean Eng. 2016, 119, 217–232. [Google Scholar] [CrossRef]
- Newman, J.C. NASA Technical Note, NASA TND 671; NASA: Washington, DC, USA, 1971. [Google Scholar]
- Timco, G.W.; Weeks, W.F. A review of the engineering properties of sea ice. Cold Reg. Sci. Technol. 2010, 60, 107–129. [Google Scholar] [CrossRef]
- Schwartz, J.; Frederking, R.; Gavrillo, V.; Petrov, I.G.; Hirayama, K.-I.; Mellor, M.; Tryde, P.; Vaudrey, K.D. Standardized Testing Methods for Measuring Mechanical Properties of Ice. Cold Reg. Sci. Technol. 1981, 4, 245–253. [Google Scholar] [CrossRef]
- Aly, M.; Taylor, R.; Bailey Dudley, E.; Turnbull, I. Scale effect in freshwater ice flexural strength. In Proceedings of the ASME 2018 37th OMAE Conference, Madrid, Spain, 17–22 June 2018. [Google Scholar]
- Ettema, R.; Gralher, S.; Kellner, L.; Stender, M. The non-linear behavior of aqueous model ice in downward flexure. Cold Reg. Sci. Technol. 2019, 165, 102775. [Google Scholar]
- Cole, D. The microstructure of ice and its influence on mechanical properties. Eng. Fract. Mech. 2001, 68, 1797–1822. [Google Scholar] [CrossRef]


Disclaimer/Publisher’s Note: The statements, opinions and data contained in all publications are solely those of the individual author(s) and contributor(s) and not of MDPI and/or the editor(s). MDPI and/or the editor(s) disclaim responsibility for any injury to people or property resulting from any ideas, methods, instructions or products referred to in the content. |
© 2023 by the authors. Licensee MDPI, Basel, Switzerland. This article is an open access article distributed under the terms and conditions of the Creative Commons Attribution (CC BY) license (https://creativecommons.org/licenses/by/4.0/).