Abstract
Mooring systems are a critical component of all floating wave energy converter (WEC) systems, yet the impact of amooring system on the WEC dynamics is often neglected during the initial assessment of candidate designs. The purpose of this study was to investigate how the inclusion of mooring dynamics in the early stages of the WEC design process influences decisions regarding hydrodynamic features and control strategies. The study was executed within a mechanical circuit framework to represent the WEC response in the frequency domain. Thevenin’s theorem was applied within this framework to transform a multi-body WEC into a single-body canonical form. This work specifically focused on self-reacting point absorbers and examined how four realistic mooring designs impact WEC intrinsic mechanical impedance across a range of common wave frequencies. We show how the mooring can easily be included in this framework, and a simple approach to identifying the mooring model parameters is described. It was observed that if mooring dynamics are considered within the WEC control design process, a 40% reduction in the required range of the controller physical variable can be achieved while yielding up to 16% more useful power. These results suggest that considering the mooring system early can enhance WEC design.
1. Introduction
As average global temperatures continue to rise, it is apparent that the window of opportunity to transition to non-carbon emitting sources of electricity to prevent a global temperature rise below the UN Paris Agreement’s 2 °C goal is rapidly closing [1]. The introduction of wind and solar power as sustainable sources of energy has been successful, but redesigning energy infrastructure on a global scale requires working with prevailing local renewable sources. It is becoming clear that to have the best solution for all jurisdictions means having a portfolio of technologies that span the diversity of renewable sources. Wave energy exhibits the potential to become an integral part of the renewable energy mix, given the estimated 3.7 TW of accessible global wave power [2]. However, the power of ocean waves remains nearly completely unutilized in modern energy systems.
One of the aspects blocking the use of wave energy is that the wave energy converter (WEC) design space has not converged. Most WECs consist of one or more oscillating bodies that convert wave motion to translation or rotation and a PTO system to generate useful power. However, there are a variety of operating principles to generate electricity, and each is subject to varied frequency-dependent hydrodynamics, power take-off (PTO) design, and control strategy. Traditionally, the design of a WEC begins by selecting one of these operating principles before proceeding to modeling, testing, and deployment. The breadth of the design space requires the use of computational models for early stage design assessment by identifying designs and associated parameters to focus on. By achieving incremental improvements to the modeling tools that guide successive design choices, we can converge on economically feasible designs with less iteration.
The goal of designing a WEC is to bring the system into resonance with incoming wave excitation forces, consequently yielding conditions in which maximum useful power may be extracted. Resonance can be achieved by enacting a control law on the PTO or other control force which effectively tunes the WEC to the frequency of the waves. Optimal control laws depend on the elements comprising the PTO as well as the overall mechanical impedance of the WEC, as shown by Falnes et al. [3]. The goals of this work are to (i) show the effect of the mooring on influencing resonance and (ii) present a method to improve early stage WEC design by characterizing and including more realistic mooring system models during conceptual design.
In this work, we study two-body self-reacting point absorbers (SRPAs) that consist of two axis-symmetric oscillating bodies coupled by a PTO. SRPAs are favored due to their circular symmetry and small size compared to ocean wave, features, allowing for simplifications of the dynamics governing their motion. There are many published studies exploring the performance of SRPAs.
Babarit et al. optimized an SRPA with an internal pendulum and showed how simple latching control could improve the power captured in regular waves [4]. Beatty et al. characterized a scaled model of an SRPA and compared it to numerical models to establish computational model accuracy [5]. Kalidoss and Banerjee used time-domain simulations of an SRPA to investigate its effectiveness in a polychromatic sea [6]. Engström et al. also studied the time-domain performance of an SRPA by generating a model of the interactions of the hydrodynamic and electromechanical systems [7]. Alves et al. optimized the shape of the reacting bodies of an SRPA in the frequency domain to uncover design insights [8], and Liang et al. applied frequency-domain tuning of hydrodynamic parameters to achieve resonance at one frequency without a controller and demonstrated the efficacy of two-body over single-body converters [9]. Clark et al. studied the influence of hull geometry on the control of the PTO and its effects on early stage design [10]. Moorings are neglected in these and other studies due to their complexity, but they have the potential to contribute a substantial force to the WEC dynamics due to their weight and drag.
This knowledge gap has led others to study mooring models, but the results are commonly centered on average power. Bergdahl et al. introduced a method for including moorings in the frequency domain analysis of single-body WECs [11,12]. Muliawan et al. studied the effects of the PTO and different moorings on the power capture of SRPA with time-domain simulations and concluded that the effect ofa specific mooring system on power capture was insignificant [13]. Davidson and Ringwood outlined modeling methods for moorings, such as frequency domain techniques and system identification of time or frequency data, as well as stating that moorings should be included in the plant model for energy maximizing control [14]. Gubesch et al. observed the effects of various moorings on the power capture of an oscillating water column WEC and compared their effect on performance [15]. Cerveira et al. applied system identification to the mooring of a single-body point absorber, linearized it for use in the frequency domain, and suggested that the effect of mooring on WEC dynamics is small [16]. Ortiz performed global optimization to design a mooring system and showed that particular mooring designs could increase WEC power [17]. Notably, these studies do not include the effects of mooring systems on the control of WECs.
Moorings provide a significant force to the WEC dynamics but are often neglected in initial frequency domain analysis due to their highly non-linear behavior. This behavior is caused by complex fluid and soil interactions. Soil and anchor interactions have been a recent focus, with detailed modeling of the mooring–seabed interaction by Wang et al. and Rui et al. [18,19]. Choosing to neglect mooring dynamics erodes performance early in the design process as it needlessly chooses to ignore contributions to the WEC response. Bubbar et al. exposed an opportunity to improve power capture by considering the control action between the SRPA spar and ground, which could consequently be implemented by mooring dynamics [20]. As researchers focus on ‘good’ WEC designs, it is important to consider these complex interactions early. In this paper, we propose applying an approach based on mechanical circuits to determine the influence of a mooring system on the control design of the PTO.
To incorporate accurate mooring forces into the early stages of WEC design, there is a need to formulate a method of representing mooring dynamics in a frequency domain model. This representation can be achieved by developing a methodology to characterize the mooring dynamics using a standard mechanical impedance formulation. Falnes et al. demonstrated how to achieve this with single-body point absorbers and SRPAs [3], and Bubbar et al. expanded on the work of Falnes to incorporate more complex WEC architectures using the mechanical circuit framework and by defining a WEC model topology [21]. By establishing a mechanical impedance model, methods synonymous with circuit theory can be applied to maximize the energy captured from ocean waves by applying impedance matching. For example, using knowledge of the system model, Têtu et al. implemented phase control of a WEC with a negative spring system, which increased the range of frequencies where power could be effectively captured [22]. Further, work by Haider, Bacelli, and others has also added to foundational WEC research by applying system identification techniques to establish models from empirical data [23,24].
To the authors’ knowledge, there has not yet been work that includes a characterized mooring model using a mechanical circuit framework to inform of the influence of moorings on the optimal control of a WEC.
This paper focuses on a linear, frequency domain analysis of the power captured by a WEC with a mooring and its integration in the control model. This work was limited to the frequency domain to demonstrate the application of the mechanical circuit approach but can be extended to time-domain applications with some considerations discussed in the system identification section. The model is constrained to heave-only as it is the power capture degree of freedom (DOF) for the device under study. The choice of constraining the model operation to a single DOF will still affect the projected useful power captured by the WEC, but the methodology permits a straightforward comparison of the impact of moorings on the control design of the PTO. Although it is not considered here, higher degrees of freedom can and have been considered in linear frequency domain studies [11,16].
This paper is organized as follows. Section 2 describes the parameters of theSRPA studied and mooring systems. This is followed by a review of frequency domain dynamics from a mechanical circuit perspective and the previous literature published on the topic. A series of numerical experiments used to inform a system identification exercise follow, yielding a linearization of the mooring dynamics, which is compatible with the mathematical framework used in the proposed WEC conceptual design process. In Section 3, the useful power and PTO control design are studied in the context of how the proposed mooring model influences the WEC system requirements.
2. Materials and Methods
The WEC considered in this study is the WaveBob™ SRPA (Figure 1), which was characterized through tank testing at a 1/25th scale by Beatty et al. and Froude scaled to full scale for use in this work [5]. This WEC consists of a toroidal buoyant body, hereafter referred to as the float and a larger body, which is mostly submerged, hereafter referred to as the spar. The parameters of mass, added mass, radiation damping, stiffness, and excitation force for both bodies are relevant when determining the performance of the device. For the proposed method, the WEC design and parameters provided in Table 1 must be known, either from BEM, CFD, or tank testing. The mooring is modeled and simulated at full scale in ProteusDS™ [25,26].
Figure 1.
Generic SRPA WEC modeled after a design studied by [27].

Table 1.
Characterized parameters of full-scale self-reacting point absorber scaled up from [5].
The parameters of the WEC are provided in Table 1. Ranges are presented where applicable. The original data can be found in [5].
2.1. Mooring Models
This paper studies the effects of four mooring designs on the useful power generated by the WEC. These moorings represent a successive level of complexity with different key features and demonstrate that the methods proposed in this paper are applicable to a wide range of common mooring designs. The mooring parameters for each design are provided in Table 2. The order of elements in the mooring starts from the spar and continues out to the anchor point on the seafloor. The length of the steel trawl float indicates its position measured from the spar.
Table 2.
Mooring parameters for various configurations.
Each mooring design is only simulated with one leg, which reduces simulation time. This choice is possible as the body is constrained to vertical motion. For analysis, each mooring system is considered to have four legs when post-processing simulation data are used to represent a realistic design for station keeping. The differences in mooring weight are also accounted for during simulations by enforcing the mass equivalency of each system. The mass of the spar is reduced by the weight of each mooring, which can be achieved by removing some ballast. This ensures consistent static equilibrium of the SRPA for each mooring design. Additionally, the seafloor in all simulations is set to be mud-like and allows for mooring sinkage.
2.1.1. Catenary Mooring
Figure 2a is based in principle on a global optimization study completed by Ortiz [17]. However, commonly available wire rope is used instead of the heavier optimization result to investigate the impact on useful power. Each leg has a long length resting on the seafloor to ensure the mooring system continues to have a general catenary shape in rough seas. This mooring is intended to model typical mooring for deploying a WEC. It is a basic mooring method that should not considerably affect the motion of the spar.
Figure 2.
Mooring structure: (a) catenary mooring, (b) heavy catenary, (c) taut-leg, and (d) lazy-S.
2.1.2. Heavy Catenary
The mooring shown in Figure 2b is also based on Ortiz’s work, but the high mass per unit length is maintained by adding line weights. The result of Ortiz’s study was that the heavier optimized mooring system reduced roll induced by excitation of the pitch and heave modes, making the heave-only assumption more realistic. Due to the additional weight, the mooring sinks into the seabed, which further impedes motion.
2.1.3. Taut-Leg
Figure 2c depicts a much shorter mooring than the others and is fixed to the bottom near the spar such that no line rests on the seafloor. This style of mooring is considered as it might be used to restrict the motion of the spar or minimize impact on the seafloor and has been studied for another WEC [15].
2.1.4. Lazy-S
The mooring shown in Figure 2d is lazy-S mooring with a line float and weight. The trawl float supports most of the weight of the mooring so that the resting force the mooring imparts on the WEC is smaller than the other mooring configurations. A WEC with a similar mooring was studied by Yang et al. [28].
2.2. System Modeling and the SRPA Canonical Form
Working within the confines of a linear, inviscid, frequency-domain model, one can observe that aside from the excitation force, all forces are simply a function of the velocity of each body (with for the float and spar, respectively) and frequency . These dynamics can be represented as a mechanical circuit based on the same concepts employed in the study of electronic circuits. Force is selected as the through variable, and velocity is the across variable so that a velocity difference across a circuit element induces force through that element. In the frequency domain, forces are simply the product of an element’s mechanical impedance and the reference variable, which in this work is velocity. This is obvious for a damper, which is analogous to a resistor but also holds for masses and springs, with the caveat that they result in a phase shift and additional frequency dependence. The forces that result from the motion of each body are provided in Equations (1)–(4), where they equate to velocity multiplied by the impedance of the element. Radiation cross-coupling terms between the spar and float have not been included in this work to simplify calculations and maintain focus on the impact of mooring systems.
The PTO impedance is generalized and could be comprised of an arbitrary combination of reactive and dissipative elements depending on the design. This allows any architecture to be prescribed in the control section. This generalization allows the PTO impedance to be treated as a variable, and the task of designing a PTO to achieve each impedance is left out of this work. The PTO acts between the float and spar, so the PTO force is written in terms of the relative velocities of both bodies.
Summing all the forces and noting that the forces listed above oppose the excitation yields the equations of motion:
Equations (1)–(4) may be substituted into Equations (6) and (7) and rearranged based on velocity dependence to find the frequency-domain equations of motion for the float and spar, respectively.
From these equations, one can draw a circuit diagram of the WEC according to the equations of motion for bodies 1 and 2 as shown in Figure 3. Each element is arranged in the circuit according to what body it is associated with. Elements associated with one body act between that body and the ground, and elements that act on both bodies act between those bodies. The float is indicated by its velocity and the spar by its velocity . The forces on the float and spar are generated at each element due to the velocity across the element, which, as defined, is analogous to voltage. Similarly, the forces sum at junctions, so the net force at a node is zero, as defined by Norton’s node law.
Figure 3.
Mechanical circuit of self-reacting point absorber with a mooring. Adapted from [20].
We include the mooring force in Equation (9) with the knowledge that it will be attached to the spar. Developing a method for characterizing this force is the goal of the following section.
Bubbar et al. demonstrated the application of mechanical circuits to the SRPA WEC architecture for determining the frequency domain useful power of a heave-only device using Thevenin’s theorem [21]. The mechanical circuit framework allows us to describe the dynamics of a mechanical system as if it were an electrical circuit. The interested reader can find Thevenin’s theorem for a mechanical circuit in [29]. By inserting the impedance of the mooring between the spar and ground in the two-body system, one can determine the effect of a mooring system on the power production of the WEC.
2.2.1. Mooring as a Circuit Element
The goal is to characterize the mooring as an impedance . This impedance represents the mooring dynamics, which include inertial, drag, and stiffness forces. However, rather than modeling the dynamics in detail, they are simplified down to their effect on the spar. Since the mooring dynamics include effects from mass and stiffness, the mooring impedance will have real and reactive components. The differences in the design of each mooring lead to a different impedance for each, but the relationship between the dynamics of each mooring and its impedance is beyond the scope of this work. Note that a mooring connects the spar to the seabed, so the relevant velocity is .
2.2.2. Equivalent Single-Body Circuit (The Canonical Form)
The dynamics of a two-body WEC are more complex than those of a single-body WEC; however, the mechanical circuit of a two-body point absorber can be used to determine the single-body equivalent WEC via Thevenin’s theorem [21,29]. Bubbar et al. showed that this result using mechanical circuits matches Falnes’ original findings [3,20]. The derivation is not repeated here as it can be found in Falnes’ and Bubbar et al.’s work [3,20], but the procedure is described. The Thevenin-equivalent force and velocity are determined by considering two cases. The velocity is found by considering the open circuit with no PTO and solving for the relative velocity. Conversely, the Thevenin-equivalent force is found as the force which passes through the PTO if the float and spar were locked in place and no relative velocity occurred.
Mirroring the work of Bubbar et al., the impedances in parallel are grouped together into equivalent impedances , with kept separate from the spar impedances to highlight its impact in the canonical form.
Then, equations for the Thevenin equivalent force and intrinsic impedance representing a single body point absorber are:
The frequency dependence has been dropped for clarity since all terms are functions of frequency. The velocity difference can be written as a relative velocity, which is equal to the velocity determined by observation of the single-body equivalent mechanical circuit.
2.2.3. Control Strategies
The transformation of the mechanical circuit to a single-body representation allows us to employ single-body control strategies. The impact a mooring system has on amplitude control and complex conjugate control is studied in this paper. The optimal control of a WEC has varying degrees of complexity. If the PTO is designed to act only as a damper, the PTO impedance is limited to real values, and the optimal control strategy is amplitude control [30]. The condition that enacts this control strategy is that the PTO impedance should match the magnitude of the WEC intrinsic impedance, as described by Equation (16).
If the PTO is designed to have some additional reactive elements which serve to both extract and re-inject power, then the optimal control strategy of this device is complex conjugate control [31]. In this case, the PTO force response can be represented by setting the PTO to a complex impedance, chosen optimally as the complex conjugate (denoted with a *) of the WEC intrinsic impedance.
2.3. Mooring Characterization
There are a handful of approaches to establish the linear representation of a mooring. A recent paper by Paduano et al. used multisine signals to excite a WEC and characterize the mooring response [32]. Cerveira et al. applied a system identification procedure to linearize the mooring force [16]. Fitzgerald et al. excited moorings modeled in a finite element solver at discrete frequencies and compiled results across a frequency range [11]. Fitzgerald’s approach is used in this paper as it intuitively yields the response of the mooring at each frequency. A contribution of this work is demonstrating the use of ProteusDS™ to perform the time-domain simulations of high-fidelity mooring as an input to this approach. The sea is set to be still with no current or waves. Simulations are performed at discrete frequencies within the range of interest. The spar (and, by extension, the upper end of the cable) is prescribed to move sinusoidally with a single frequency and with a position amplitude of one meter. This amplitude is chosen as it is representative of the operating condition off the west coast of Canada near Nootka Island. Other studies have used an amplitude with the same energy of the specific frequency [16,32], but here, the mean significant wave height and response amplitude operator are considered similarly to [11]. The response amplitude operator of the SRPA is unity for low frequencies, as characterized by [5]. The resulting mooring force acting on the spar is recorded for multiple cycles at a steady state. Note that only the vertical component is taken as the spar is constrained to move only in heave.
The characterization method begins with gathering data on the response of the mooring. This is carried out in this work with time-domain simulations in ProteusDS. Simulations are run at discrete frequencies in the range of interest by prescribing waypoints for the position of the spar so that the velocity is sinusoidal and monochromatic. The velocity input and force response for one experiment are shown in Figure 4.
Figure 4.
Simulation mooring force due to forced sinusoidal motion of the spar.
Each simulation is run for a sufficient time at each frequency to achieve a steady-state heave force response. Plotting the velocity and the mooring force for any shows that there is a phase difference as well as more harmonics in the mooring force.
2.3.1. Mooring Linearization
As described in Equation (10), a linear representation of the mooring would relate the velocity of the spar to the force exerted on the spar by the mooring. Rearranging that equation shows that the mooring impedance can be determined from the velocity of the spar and the force at the mooring connection.
The force amplitude is normalized by the velocity amplitude at each point according to Equation (18) to determine the impedance to the velocity of the mooring at that frequency. The impedance amplitudes and phases were then plotted across the range of interest to form the frequency response function (FRF) of the mooring.
Viewing the frequency content of a typical force response in the range of interest using the fast Fourier transform (FFT) algorithm shows that the largest response is at the excitation frequency, but the mooring force has frequency content at higher frequencies, as shown in Figure 5. Despite the velocity input being a single-frequency sinusoid, the mooring force response contains many frequencies. This is due to the non-linear nature of the mooring, as discussed in [33,34].
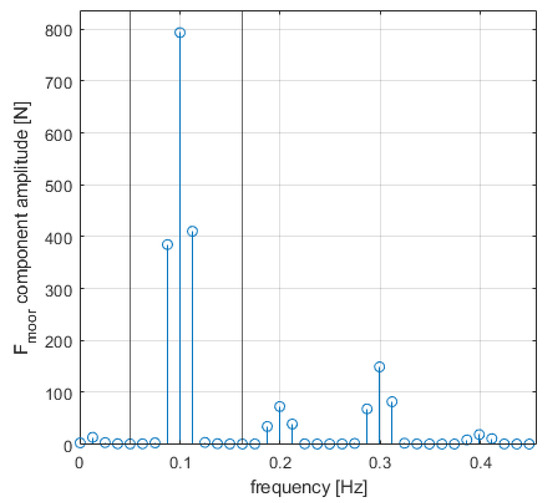
Figure 5.
FFT of mooring force. Vertical markers bound the content assigned to the excitation frequency.
An aspect of the non-linear nature of slack moorings can be explained by the forces causing the motion of the mooring. When the spar is rising, the tension force in the mooring causes it to be picked up and pulled along quickly with the WEC, but when the WEC is sinking, the mooring cannot act in compression, and the only force pulling the mooring back down is gravity. The different forces driving the mooring motion cause a quick rise and a slower fall, as shown in Figure 6. In this example, the position of each node of the heavy catenary is plotted in the middle of downward and upward motion. The third mooring node is displaced by 0.75 m due to the mooring stretching from high tension, pulling it up. This repeating but uneven response shows up in the FFT as peaks at integer multiples of the excitation frequency, as seen in Figure 5.
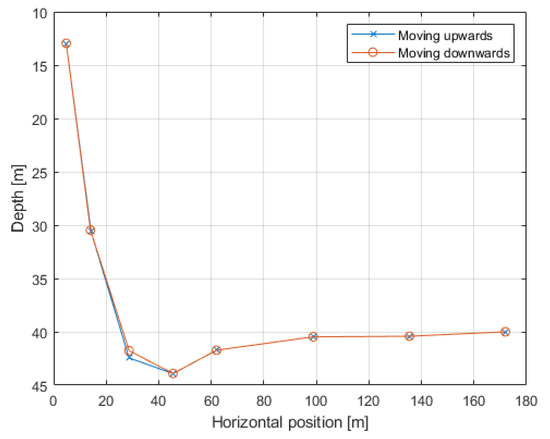
Figure 6.
Difference in mooring motion upwards versus downwards showcasing non-linear motion of mooring. Snapshots shown are taken from the heavy catenary test at 0.13 Hz.
The linear mechanical circuit framework enforces each velocity, force, and impedance to operate at a common frequency defined by the excitation. Hence, the components of the mooring response at other frequencies must be discarded to deterine the linear response that best matches the actual motion. Fitzgerald and Bergdahl proposed determining the motion amplitude that would result in the same power loss to estimate damping accurately [11], but in this case, the quantities of interest are stiffness and mass of the mooring, which are bundled into the magnitude and phase of the mooring force. So, in this work, we aim to recreate the original amplitude and phase instead, which is simply the amplitude of the FFT at the excitation frequency. The phase difference can also be determined directly from the FFT. Comparisons of original and linearized mooring forces are shown in Figure 7.
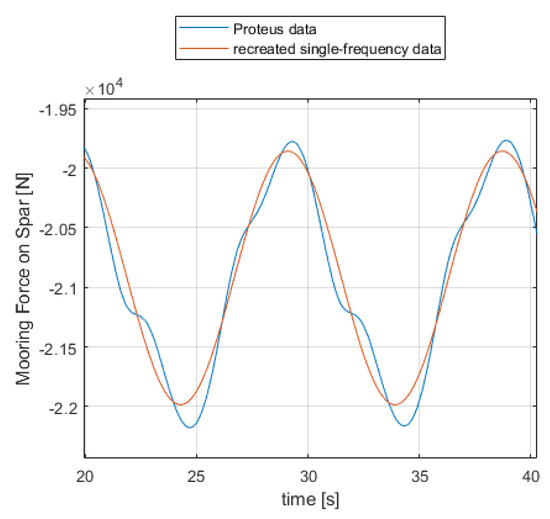
Figure 7.
Comparison of representative original and linearized mooring forces.
Figure 6 and Figure 7 show the impact of linearization on the fidelity of the final mooring model as the frequency content left behind and the approximated shape of the force response. The amount of frequency content retained is used as a measure for the accuracy of the linearization process, as shown in Figure 8, which doubles as an indicator of how non-linear each mooring is.
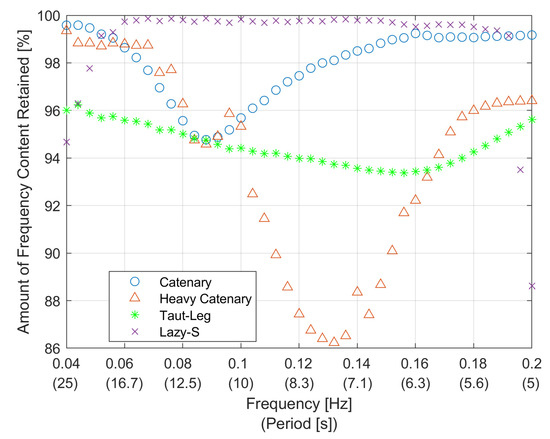
Figure 8.
Percentage of total frequency content of mooring response retained by linearization for each mooring.
The amplitude and phase of the linearized mooring force can be grouped as a single complex number :
Inserting this and the observed velocity into Equation (18) determines the linearized impedance of the mooring. Note that this impedance is a complex number, and by comparing it to the mechanical circuit, one can better understand the mechanics in play. The real component defines the damping of the mooring and can be used to determine the associated energy loss. The reactive or imaginary component is less informative, as both mass and stiffness are complex when the reference variable is velocity. These components are why the linearized mooring force amplitude is approximated rather than the amplitude which has equivalent power loss as was carried out by [12]: one would be finding the “true” damping but could mischaracterize the mass and stiffness.
The complex representations of the mooring system impedances are all that is necessary to characterize the mooring systems, but plotting the amplitude-phase representation provides a unique insight as well. Figure 9 shows the amplitudes and phases across the range of interest. These plots demonstrate the range of differences due to differing mooring designs. For example, the heavy catenary is very similar to the taut catenary in terms of impedance until 0.12 Hz, at which point it rises dramatically. The phase of the response is even more varied, with as much difference as 110 degrees. Note that a low-pass filter is applied to the heavy catenary data to smooth the effect of coarse sampling.
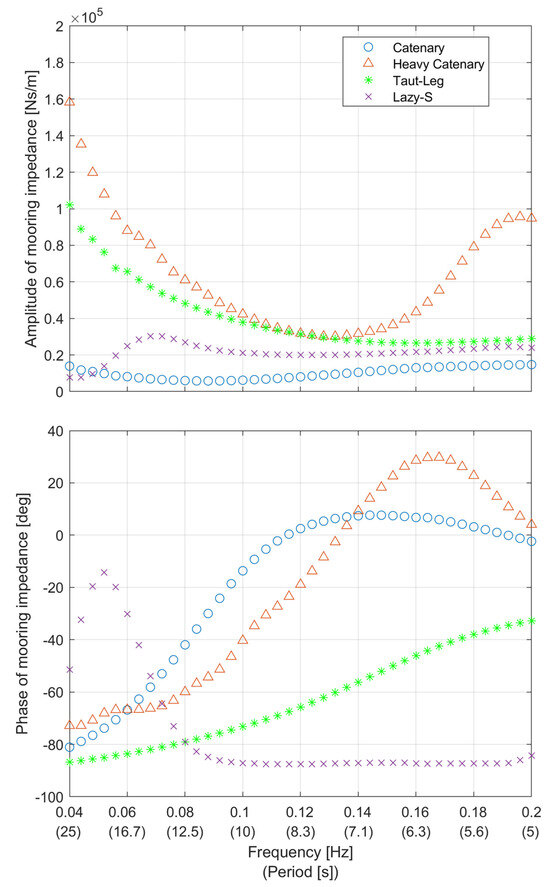
Figure 9.
Amplitude and phase of mooring impedance.
2.3.2. System Identification
Although some insight into the mooring response has been found, the results are at discrete frequencies. This is sufficient for work within the frequency domain, but here, we choose to make a practical consideration for time-domain studies and control of the moored WEC. To do this requires a continuous frequency function that fits the discrete points, is stable, and preferably is also minimum-phase. Appropriate representations are state-space or transfer function models. Although state-space and transfer function models can be interchanged, the algorithms applied by system identification (SID) yield different results for the same inputs. In this work, the transfer function SID is more effective. The transfer function represents the impedance of the mooring and has a polynomial numerator and denominator, as shown in Equation (22).
The MATLAB™ SID toolbox is used to fit a frequency-continuous transfer function or state-space model to the discrete frequency response function of the mooring [35]. SID also computes the mean-squared error of the function and discrete input data, which informs how well a transfer function fits the data. Along with discrete characterization, SID also requires parameters describing what order of transfer function or state-space model one is attempting to fit and has additional inputs for applying constraints on the system.
The constraint to ensure the result of SID is stable is that the poles of the transfer function must be negative–real; in other words, the real part of the zeros of the denominator must be negative. Stability ensures the model does not provide unbounded responses to bounded inputs and is necessary for the mooring model response to be realistic.
The other constraint that should be applied is that the transfer function should be minimum-phase. A non-minimum-phase system is characterized as initially responding in the wrong direction or having a time delay when given an input.
A minimum-phase system is characterized by having its zeros on or left of the imaginary axis.
The condition applied to achieve minimum-phase is that all the polynomial coefficients must be positive [36]. Unfortunately, this condition is necessary but not sufficient to enforce minimum-phase. Thus, the model fit is not guaranteed to be the minimum phase, and one must check if the transfer functions are minimum-phase by noting their poles and zeros.
2.3.3. SID Results
The transfer functions with the best fit are plotted with the original data to verify that they are a reasonable fit. This is shown for the catenary mooring case in Figure 10.
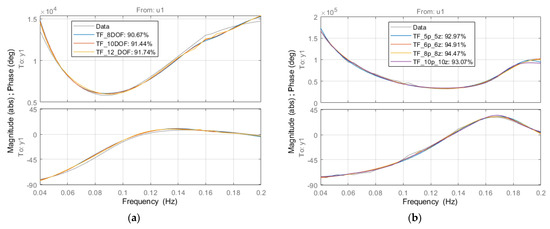
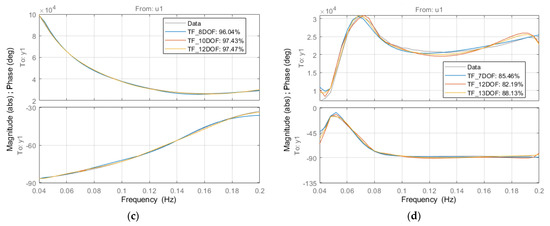
Figure 10.
Frequency response of best-fit transfer function and state-space models expressed as magnitude and phase for (a) catenary, (b) heavy catenary, (c) taut-leg, and (d) lazy-S moorings.
Any models with zeros on the right half plane are disregarded, and from those, the model with the best fit is taken to be representative of the mooring. This is achieved with the three catenary moorings, but the minimum phase condition cannot be achieved for the line-float mooring, so the best fit is taken. A 12 degree of freedom (DOF) transfer function model is the best fit for the catenary mooring at 91.7%, as well as the taut mooring with a 97.5% fit. A 5 DOF transfer function model fits the heavy catenary model at 93.0%. Finally, the mooring system with a line float is best approximated by a 13 DOF transfer function with an 88.1% fit. The fit is calculated with the normalized root mean square error between the model and the mooring data.
The models generally fit the data well; however, it is important to point out that because of constraining the models for stability and minimum-phase, the mooring responses are shifted slightly. This results in a slightly larger or smaller amplitude response or a small phase shift, but the differences are consistently an order of magnitude below the mooring impedance, and phase differences are 15 degrees at most and less than 5 degrees on average, so these changes are considered negligible.
3. Results
The useful power generated by the equivalent single-body device is described by Equation (23) in terms of the previously stated variables [3]. Note that the velocity amplitude is defined as being per meter wave amplitude, so the useful power is a response amplitude operator with units of W/m2.
Three cases were compared for each mooring design with associated control methods to investigate the effect of the mooring systems on power capture. Case 1 is the no-mooring case and consists of just the WEC to establish the baseline power with each control scheme and mooring. This case also matches the results of [20]. Case 2 represents a study in which the mooring model was incorporated into the system plant model but not into the control model. This case represents the situation of not including knowledge of the mooring model to help define the control action for optimizing power capture.
Case 3 proceeds from the previous case, where the mooring is incorporated in the evaluation of the plant model as well as the control model. An increase in power from case 2 to case 3 would demonstrate the value of including a mooring early in the design. The details of each case are provided in Table 3 below.
Table 3.
Description of where is used in each case.
3.1. Influence on Useful Power
The difference in useful power caused by changing the control method has already been studied and discussed by [20], so the emphasis here is on the difference between the three cases for two specific control methods. The power generated by cases 2 and 3 was normalized against the power for case 1 and plotted as a percentage in Figure 11. For reference, the average order of magnitude of the case 1 power was approximately , with more detail on the unmoored power response of this SRPA available in [20]. The frequency range for this and the following figures was limited by the data available.
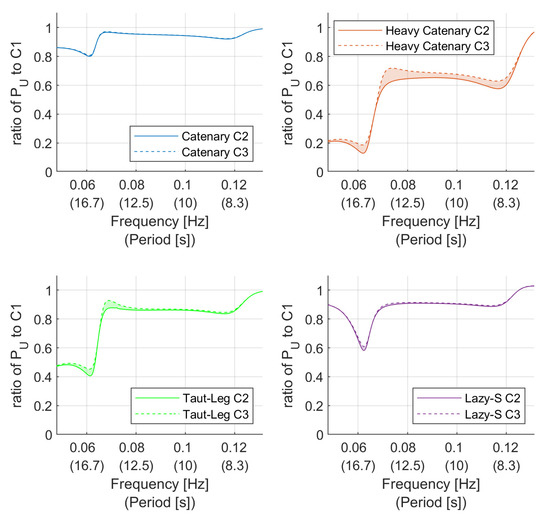
Figure 11.
Ratio of power produced with amplitude control (relative to case 1).
Plotting the useful power in this way shows that case 3 consistently increased the power capture from case 2. This is visualized by the shaded regions for each plot.
The magnitude of the difference was determined by integrating the curves in Figure 11 and Figure 12 to obtain the cumulative power of the WEC across a discrete set of frequencies as if waves were exciting each of them. This resulted in Figure 13 and Figure 14.
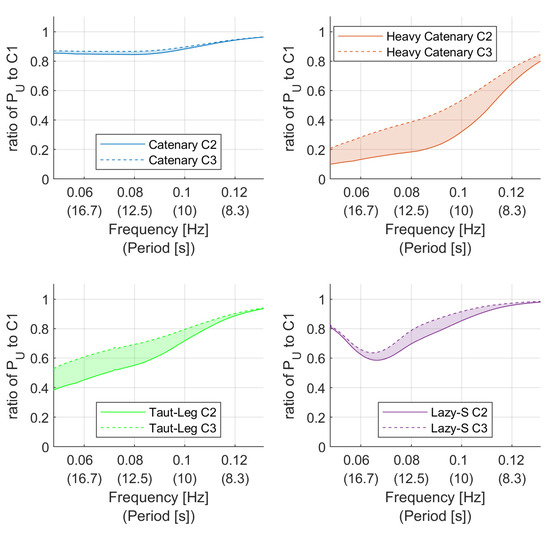
Figure 12.
Ratio of power produced with complex conjugate control (relative to case 1).
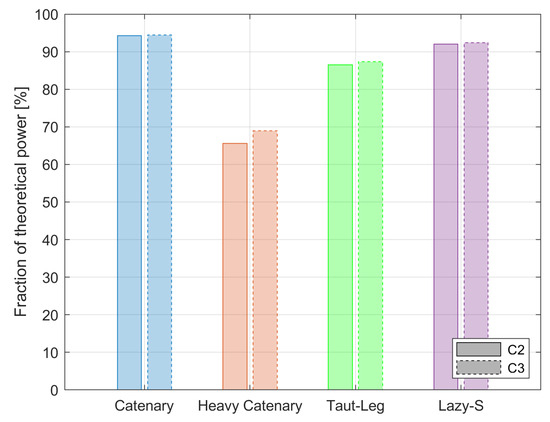
Figure 13.
Cumulative useful power produced with amplitude control and varying moorings normalized against the no mooring case.
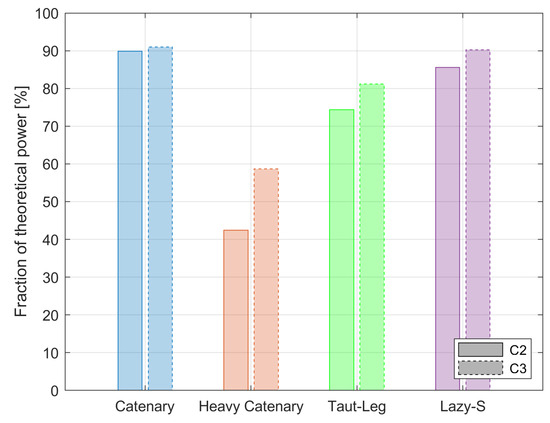
Figure 14.
Cumulative useful power produced with complex conjugate control and varying moorings normalized against the no mooring case.
3.2. Influence on WEC Design
Finally, the effect of the moorings on the control of the PTO was investigated. The real and complex parts of the impedance were plotted for amplitude control and complex conjugate control in Figure 15 and Figure 16 respectively. The range of the PTO was not restricted by physical design limits to show the effect of the moorings at each frequency. Note that only case 3 was plotted as, by definition, case 2 had the same control as case 1.
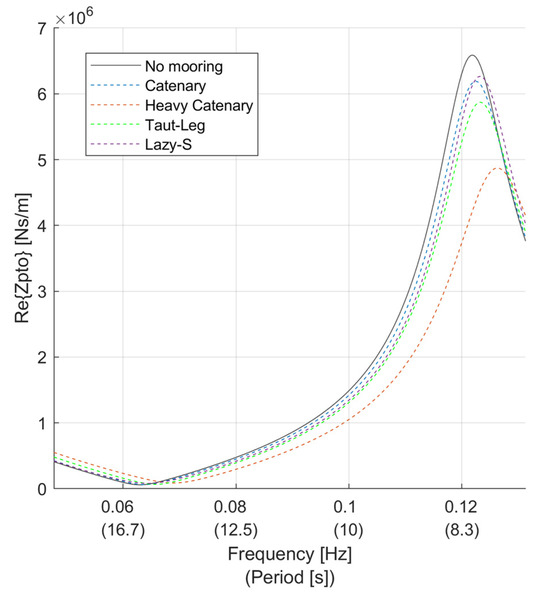
Figure 15.
PTO impedance for different moorings with amplitude control.
Figure 16.
PTO impedance for different moorings with complex conjugate control.
The real component of the PTO is affected similarly for amplitude and complex conjugate control, but the complex component has the potential to be reduced. The complex part of the mooring is comprised of mass and spring elements, where mass increases the impedance and stiffness reduces it. This is due to the coefficient on mass being , while the coefficient on stiffness is , which is commonly rewritten as . The dependence of these terms on also suggests mass has more influence on the overall impedance at high frequencies, whereas stiffness has more influence at low frequencies.
4. Discussion
The results of Figure 11 and Figure 12 are intuitive if one considers the control concepts employed. In amplitude control, the power is maximized by setting the PTO damping coefficient to the intrinsic damping of the WEC. So, when the mooring impedance is not included in determining the PTO damping there is a mismatch due to the change in , and Equation (16) is no longer enforced. The same is true for complex conjugate control, but the effect is amplified by the real and complex parts both being set incorrectly. Not including the mooring model in Equation (17) yields a non-optimal control response and is not in resonance with the wave excitation, leading to lower power capture. This confirms that including the mooring within the early stage of the design process can enable a designer to make better decisions on how to improve the overall power capture of the WEC.
A more direct measure of the impact the mooring has on a WEC is highlighted in Figure 13 and Figure 14 where we make three key observations. The first is that the mooring tends to reduce the power capture compared to the no-mooring case. This effect ranges from a 5% to a 57% reduction in power capture, depending on the mooring configuration and control method. The second is that designing the controller with the mooring in mind increases the fraction of theoretical power by as much as 16% but can also be nearly negligible, depending again on the choice of mooring and control method. Each mooring has little effect when the PTO is governed by amplitude control, suggesting the moorings have a small damping or drag effect overall. This small effect is contrasted by the larger impact with complex conjugate control, indicating the mooring mass and stiffness are significant factors. That leads to the last result from these figures, which is that the mooring has more impact on complex conjugate control than amplitude control. This suggests that more advanced control methods have a greater dependency on the accuracy of the model of the overall WEC system. So, as WEC developers design advanced control schemes to maximize useful power, it will become more important to characterize and design with a mooring model.
Figure 15 and Figure 16 show how mooring may impact the physical variable range necessary for optimal control of an SRPA. The effect the moorings had on amplitude control was to reduce the damping of the PTO. This effect was most pronounced for the heavy catenary, reducing the peak impedance by 30%, with the other moorings reducing the peak by approximately 8% on average. The moorings had a similar effect on the real part of complex conjugate control. Again, the heavy mooring had the largest effect due to its high mass and the other moorings were grouped together. Worth noting is that the mooring had a desirable effect on the reactive part of the PTO as well. All four moorings reduced the envelope (difference from minimum to maximum value) of the real and complex components of the PTO. The range from minimum to maximum reactance was reduced by 40% with the heavy mooring and approximately 8% for the others. Larger components usually come with a greater cost, so by reducing the real part of the impedance, the associated damper is smaller and likely costs less. The same holds for the complex part, which manifests as springs and masses. This suggests that including the mooring in early design has the potential to reduce the construction cost of an SRPA by preventing over-design of the PTO.
5. Conclusions
In this paper, we presented a methodology for characterizing a complex mooring system to be included in a linear, frequency-domain model for WEC power analysis. This methodology is useful for the early stage conceptual refinement of the system to reduce design exploration in high-fidelity modeling.
Two key assumptions were made in this work. The first is the heave-only assumption, which simplifies the circuit model. Additional degrees of freedom, such as pitch and surge, may be considered with the circuit approach but complicate the hydrodynamic parameters, which would become functions of two or more variables. The mooring will also contribute to other degrees of freedom and require further characterization. Using a linear model of the WEC and the mooring systems neglects some of the real dynamics and generally overestimates power capture. Any non-linear effects are best represented with high fidelity but computationally demanding modeling tools, such as was used to gather the data for characterizing the mooring in this research.
Characterization was performed with the aid of the mechanical circuit framework, demonstrating that characterizing a mooring system only requires knowledge of the force it exerts, given the velocity of the WEC. A method for characterization, including system identification to ensure stability and controllability was also presented. It was shown that the inclusion of the mooring model in the early design of a WEC can have a significant impact on the ultimate useful power capture of the device, with this impact being proportional to control complexity. The effect on the control of the system was also demonstrated to be significantly affected by the mooring system and suggests that PTO systems may be designed with a smaller operating range than would otherwise be expected when analyzing a system without the inclusion of a mooring model, leading to potential savings.
Author Contributions
Conceptualization, S.F., B.B., K.B. and A.S.H.; methodology, S.F., B.B., K.B. and A.S.H.; software, S.F.; validation, S.F. and A.S.H.; formal analysis, S.F. and A.S.H..; investigation, S.F.; resources, B.B.; data curation, S.F.; writing—original draft preparation, S.F.; writing—review and editing, K.B., B.B. and A.S.H.; visualization, S.F.; supervision, B.B., K.B. and A.S.H.; project administration, B.B. and K.B.; funding acquisition, B.B. All authors have read and agreed to the published version of the manuscript.
Funding
This research was funded by The Natural Sciences and Engineering Research Council of Canada RGPIN-2018-05749 and The British Columbia Ministry of Energy, Mines and Low Carbon Innovation CA22MAN0071. This research was partially funded by The McCain Foundation Fellowship Award in Innovation, and the New Brunswick Innovation Foundation.
Institutional Review Board Statement
Not applicable.
Informed Consent Statement
Not applicable.
Data Availability Statement
Data generated by simulations and used to characterize moorings available online: Funk, Spencer (2023). Mooring simulation data. figshare. Dataset. https://doi.org/10.6084/m9.figshare.24465274.
Conflicts of Interest
The authors declare no conflict of interest.
Nomenclature
| Acronyms | Hydrostatic stiffness force | ||
| DOF | Degrees of freedom | Inertia force | |
| FFT | Fast Fourier transform algorithm | Magnitude of mooring force on spar | |
| PTO | Power take-off | Force due to power take-off | |
| SID | System identification | Thevenin equivalent single-body force | |
| SRPA | Self-reacting point absorber | Hydrostatic stiffness of float | |
| WEC | Wave energy converter | Hydrostatic stiffness of spar | |
| C1 | Case 1: power capture and control without mooring dynamics | Mass of float | |
| C2 | Case 2: power capture with mooring dynamics | Mass of spar | |
| C3 | Case 3: power capture and control with mooring dynamics | Polynomial numerator of transfer function, polynomial denominator of transfer function | |
| Parameters | |||
| Phase of mooring force with respect to spar velocity | Time (seconds) | ||
| Frequency of wave exciting the system (Hz) | Heave velocity of float | ||
| Discrete frequency system oscillates at (rad/s) | Heave velocity of the spar | ||
| Added mass of the float | Relative velocity between float and spar | ||
| Added mass of the spar | Heave position of spar | ||
| Radiation damping of float | Total impedance of the float | ||
| Radiation damping of spar | Total impedance of the spar | ||
| Excitation force per unit wave amplitude acting on the float | Impedance of the mooring | ||
| Excitation force per unit wave amplitude acting on the spar | Impedance of the power take-off device | ||
| Added mass force | PTO impedance governed by amplitude (AC) and complex conjugate (CC) control | ||
| Radiation damping force | Thevenin equivalent single-body intrinsic impedance | ||
References
- UNFCCC The Paris Agreement; United Nations: New York, NY, USA, 2015.
- Mork, G.; Barstow, S.; Kabuth, A.; Pontes, M.T. Assessing the Global Wave Energy Potential. Proc. Int. Conf. Offshore Mech. Arct. Eng.—OMAE 2010, 3, 447–454. [Google Scholar] [CrossRef]
- Falnes, J. Wave-Energy Conversion Through Relative Motion Between Two Single-Mode Oscillating Bodies. J. Offshore Mech. Arct. Eng. 1999, 121, 32–38. [Google Scholar] [CrossRef]
- Babarit, A.; Clément, A.H.; Gilloteaux, J.-C. Optimization and Time-Domain Simulation of the SEAREV Wave Energy Converter. Am. Soc. Mech. Eng. Digit. Collect. 2008, 41960, 703–712. [Google Scholar]
- Beatty, S.J.; Hall, M.; Buckham, B.J.; Wild, P.; Bocking, B. Experimental and Numerical Comparisons of Self-Reacting Point Absorber Wave Energy Converters in Regular Waves. Ocean Eng. 2015, 104, 370–386. [Google Scholar] [CrossRef]
- Kalidoss, S.; Banerjee, A. Site-Specific Modeling of Self-Reacting Point Absorber in Real Wave Spectrum. Ocean Eng. 2021, 238, 109736. [Google Scholar] [CrossRef]
- Engström, J.; Kurupath, V.; Isberg, J.; Leijon, M. A Resonant Two Body System for a Point Absorbing Wave Energy Converter with Direct-Driven Linear Generator. J. Appl. Phys. 2011, 110, 124904. [Google Scholar] [CrossRef]
- Alves, M.; Traylor, H.; Sarmento, A. Hydrodynamic Optimization of a Wave Energy Converter Using a Heave Motion Buoy. In Proceedings of the European Wave and Tidal Energy Conference, Porto, Portugal, 11–13 September 2007. [Google Scholar]
- Liang, C.; Zuo, L. On the Dynamics and Design of a Two-Body Wave Energy Converter. Renew. Energy 2017, 101, 265–274. [Google Scholar] [CrossRef]
- Clark, C.E.; Garcia-Teruel, A.; DuPont, B.; Forehand, D. Towards Reliability-Based Geometry Optimization of a Point-Absorber with PTO Reliability Objectives. In Proceedings of the European Wave and Tidal Energy Conference, Naples, Italy, 1–6 September 2019. [Google Scholar]
- Fitzgerald, J.; Bergdahl, L. Including Moorings in the Assessment of a Generic Offshore Wave Energy Converter: A Frequency Domain Approach. Mar. Struct. 2008, 21, 23–46. [Google Scholar] [CrossRef]
- Liu, Y.; Bergdahl, L. Frequency-Domain Dynamic Analysis of Cables. Eng. Struct. 1997, 19, 499–506. [Google Scholar] [CrossRef]
- Jaya Muliawan, M.; Gao, Z.; Moan, T.; Babarit, A. Analysis of a Two-Body Floating Wave Energy Converter With Particular Focus on the Effects of Power Take-Off and Mooring Systems on Energy Capture. J. Offshore Mech. Arct. Eng. 2013, 135, 031902. [Google Scholar] [CrossRef]
- Davidson, J.; Ringwood, J.V. Mathematical Modelling of Mooring Systems for Wave Energy Converters—A Review. Energies 2017, 10, 666. [Google Scholar] [CrossRef]
- Gubesch, E.; Abdussamie, N.; Penesis, I.; Chin, C. Effects of Mooring Configurations on the Hydrodynamic Performance of a Floating Offshore Oscillating Water Column Wave Energy Converter. Renew. Sustain. Energy Rev. 2022, 166, 112643. [Google Scholar] [CrossRef]
- Cerveira, F.; Fonseca, N.; Pascoal, R. Mooring System Influence on the Efficiency of Wave Energy Converters. Int. J. Mar. Energy 2013, 3–4, 65–81. [Google Scholar] [CrossRef]
- Ortiz, J.P. The Influence of Mooring Dynamics on the Performance of Self Reacting Point Absorbers. Ph.D. Thesis, University of Victoria, Victoria, BC, Canada, 2016. [Google Scholar]
- Wang, L.; Rui, S.; Guo, Z.; Gao, Y.; Zhou, W.; Liu, Z. Seabed Trenching near the Mooring Anchor: History Cases and Numerical Studies. Ocean Eng. 2020, 218, 108233. [Google Scholar] [CrossRef]
- Rui, S.; Zhou, Z.; Jostad, H.P.; Wang, L.; Guo, Z. Numerical Prediction of Potential 3-Dimensional Seabed Trench Profiles Considering Complex Motions of Mooring Line. Appl. Ocean Res. 2023, 139, 103704. [Google Scholar] [CrossRef]
- Bubbar, K.; Buckham, B. On Establishing Generalized Analytical Phase Control Conditions in Two Body Self-Reacting Point Absorber Wave Energy Converters. Ocean Eng. 2020, 197, 106879. [Google Scholar] [CrossRef]
- Bubbar, K.; Buckham, B.; Wild, P. A Method for Comparing Wave Energy Converter Conceptual Designs Based on Potential Power Capture. Renew. Energy 2018, 115, 797–807. [Google Scholar] [CrossRef]
- Têtu, A.; Ferri, F.; Kramer, M.B.; Todalshaug, J.H. Physical and Mathematical Modeling of a Wave Energy Converter Equipped with a Negative Spring Mechanism for Phase Control. Energies 2018, 11, 2362. [Google Scholar] [CrossRef]
- Bacelli, G.; Coe, R.G.; Patterson, D.; Wilson, D. System Identification of a Heaving Point Absorber: Design of Experiment and Device Modeling. Energies 2017, 10, 472. [Google Scholar] [CrossRef]
- Haider, A.S.; Brekken, T.K.A.; Coe, R.G.; Bacelli, G.; McCall, A. On Real-Time Hybrid Testing of Ocean Wave Energy Conversion Systems: An Experimental Study. IEEE Open J. Ind. Appl. 2022, 3, 30–40. [Google Scholar] [CrossRef]
- ProteusDS|A Flexible Dynamic Analysis Tool for Ocean Industries|DSA. Available online: https://dsaocean.com/proteusds/overview/ (accessed on 7 April 2022).
- Bailey, H.; Robertson, B.R.D.; Buckham, B.J. Wave-to-Wire Simulation of a Floating Oscillating Water Column Wave Energy Converter. Ocean Eng. 2016, 125, 248–260. [Google Scholar] [CrossRef]
- Weber, J.; Mouwen, F.; Parish, A.; Robertson, D. Wavebob—Research & Development Network and Tools in the Context of Systems Engineering. In Proceedings of the Eighth European Wave and Tidal Energy Conference, Uppsala, Sweden, 7–11 September 2009. [Google Scholar]
- Yang, S.-H.; Ringsberg, J.W.; Johnson, E.; Hu, Z. Experimental and Numerical Investigation of a Taut-Moored Wave Energy Converter: A Validation of Simulated Mooring Line Forces. Ships Offshore Struct. 2020, 15, S55–S69. [Google Scholar] [CrossRef]
- Harris, C.M.; Crede, C.E.; Trent, H.M. Shock and Vibration Handbook; Physics Today: College Park, MD, USA, 1962; Volume 15. [Google Scholar] [CrossRef]
- Budal, K.; Falnes, J. Optimum Operation of Improved Wave-Power Converter. Mar. Sci. Commun. 1977, 3. [Google Scholar]
- Nebel, P. Maximizing the Efficiency of Wave-Energy Plant Using Complex-Conjugate Control. Proc. Inst. Mech. Eng. Part J. Syst. Control Eng. 1992, 206, 225–236. [Google Scholar] [CrossRef]
- Paduano, B.; Pasta, E.; Faedo, N.; Mattiazzo, G. Control Synthesis via Impedance-Matching in Panchromatic Conditions: A Generalised Framework for Moored Systems. In Proceedings of the European Wave and Tidal Energy Conference, Bilbao, Spain, 3–7 September 2023. [Google Scholar]
- Touzon, I.; Nava, V.; Gao, Z.; Mendikoa, I.; Petuya, V. Small Scale Experimental Validation of a Numerical Model of the HarshLab2.0 Floating Platform Coupled with a Non-Linear Lumped Mass Catenary Mooring System. Ocean Eng. 2020, 200, 107036. [Google Scholar] [CrossRef]
- Touzon, I.; Nava, V.; de Miguel, B.; Petuya, V. A Comparison of Numerical Approaches for the Design of Mooring Systems for Wave Energy Converters. J. Mar. Sci. Eng. 2020, 8, 523. [Google Scholar] [CrossRef]
- System Identification Toolbox. Available online: https://www.mathworks.com/products/sysid.html (accessed on 31 July 2023).
- Ilchmann, A.; Wirth, F. On Minimum Phase. Automatisierungstechnik 2013, 61, 805–817. [Google Scholar] [CrossRef]
Disclaimer/Publisher’s Note: The statements, opinions and data contained in all publications are solely those of the individual author(s) and contributor(s) and not of MDPI and/or the editor(s). MDPI and/or the editor(s) disclaim responsibility for any injury to people or property resulting from any ideas, methods, instructions or products referred to in the content. |
© 2023 by the authors. Licensee MDPI, Basel, Switzerland. This article is an open access article distributed under the terms and conditions of the Creative Commons Attribution (CC BY) license (https://creativecommons.org/licenses/by/4.0/).