Article

Integration of a Geothermal Plant in a System with High Renewable Energy Penetration for Desalination Plant Self-Consumption

by
Fernando Montesdeoca-Martínez
1 and
Sergio Velázquez-Medina
2,*
1
School of Industrial and Civil Engineering, Campus de Tafira s/n, University of Las Palmas de Gran Canaria, 35017 Las Palmas de Gran Canaria, Spain
2
Department of Electronics and Automatics Engineering, Campus de Tafira s/n, University of Las Palmas de Gran Canaria, 35017 Las Palmas de Gran Canaria, Spain
*
Author to whom correspondence should be addressed.
J. Mar. Sci. Eng. 2023, 11(2), 353; https://doi.org/10.3390/jmse11020353
Submission received: 10 January 2023 / Revised: 27 January 2023 / Accepted: 29 January 2023 / Published: 5 February 2023
(This article belongs to the Special Issue The Use of Hybrid Renewable Energy Systems for Water Desalination)

Abstract

:
The scarcity of water resources on the island of Gran Canaria (Canary Islands, Spain) is such that 88% of the water supply for human consumption comes from seawater desalination plants. This type of process has a high specific energy consumption. Gran Canaria has an isolated electrical system of low robustness. In this paper, a geothermal plant is designed and integrated into a system that already has non-dispatchable renewable generation (wind and photovoltaic) in order to meet, based on a self-consumption regime, the energy demand of a high-capacity desalination plant. The aim is for the diversified renewable system to improve the stability and management of renewable electrical energy generation. Geothermal plant production can adapt to the energy balance between demand and non-dispatchable renewable generation. The geothermal plant’s design is based on an organic Rankine cycle and its resulting power is 4.16 MW. Its integration in the renewable generation system significantly improves the contribution of renewables in meeting the desalination plant’s energy demand and therefore reducing its dependency on the island’s electrical system. The mean cost of electrical energy generation with the diversified renewable system is 57.37 EUR/MWh, considerably lower than the mean cost of conventional generation on Gran Canaria of 153.9 EUR/MWh.

1. Introduction

Directive (EU) 2018/2001 of the European Parliament and of the Council [1] sets a minimum 32% share of energy from renewable sources in the European Union’s gross final consumption of energy as a binding overall target for 2030. One of the novel strategic lines established in this regulatory framework to ensure that this goal can be met concerns self-consumption and the recognition of three distinct types of self-consumer: (i) renewable self-consumer, (ii) jointly acting renewable self-consumers, and (iii) renewable energy communities.
Spain’s integrated National Energy and Climate Plan for 2021–2030 [2] raises this target quota to 42% of the final energy use, with a 74% contribution of renewables to electrical energy demands for the same time horizon. At the end of 2021, this contribution was 48% [3].
The Canary archipelago (Spain) consists of eight islands. Except for Lanzarote and Fuerteventura, which are interconnected, each island has an isolated electrical system. Despite the abundant wind and solar resources of the archipelago, the contribution of renewables to electrical energy demand was just 20% in 2021 [4], which is considerably short of the 45% target set by the Canary Government for 2025 [5]. Of the total amount of energy generated from renewable sources, 97.9% was from non-dispatchable wind and photovoltaic sources [4]. The large-scale integration of such non-dispatchable energy sources in weak electrical systems, such as those found on islands, complicates the guaranteed stable supply of electrical energy and needs to be complemented with the incorporation of energy storage systems and other dispatchable renewable energy sources. With this in mind, the Canary Government, in the context of new energy strategies developed in 2022, established a series of targets within the framework of dispatchable and sustainable energy generation [6]. One of the strategies considered involves the potential exploitation of geothermal energy. As they are of volcanic origin, the Canary Islands constitute the only Spanish territory with the possibility of exploiting high-temperature geothermal resources [7]; however, as yet, there are no geothermal plants for the generation of electricity.
Geothermal energy is one of the most efficient, continuous, and clean renewable sources, with average emissions of just 38 g CO2 equivalent/kWh [8]. The incorporation of this renewable and dispatchable energy would allow a reduction in the participation of conventional, non-renewable technologies in the energy mix of the islands of the Canary archipelago.
The case study developed in this paper considers the island of Gran Canaria, which has 852,688 inhabitants [9] and an installed electrical power of 1255.20 MW [10], corresponding to 39.2% and 37.5% of the respective corresponding values for the archipelago as a whole. Despite it being the territory with the highest density of reservoirs in the world [11], its high population density and the scarcity of water resources makes it heavily dependent on the use of seawater desalination plants, for which their high energy consumption constitutes a significant load for the island’s electrical system. In 2021 [12], desalinated water production on the island amounted to 83.6 hm3, obtained mostly using reverse osmosis (RO) technologies. This value corresponds to 52.3% of the total water supply and 88% of the supply for human consumption [12]. Desalination processes entail an annual energy consumption of 350 GWh, which is equivalent to 20% of the island’s total energy consumption [13], a value that is considerably higher than the 1% for Spain as a whole [14]. The high energy intensity of these processes has led the island’s governing bodies to promote emerging pilot solutions to try to reduce specific consumption in desalination to 1.5 kWh/m3 [15]. Another strategy concerns meeting the energy demand of desalination plants via the exploitation of renewable energy sources [16].
Schallenberg-Rodríguez et al. [17] studied the wave energy supply of a 15,000 m3/day grid-connected seawater RO (SWRO) desalination plant situated on the north coast of Gran Canaria. In a pilot area of 7.82 km2, the results showed that the total annual energy produced using technologies such as Wavepiston and Wave Dragon exceeded 100% of the annual energy demand of the desalination plant (18,987 MWh/year) but with considerable energy surpluses and deficits and a highly unstable hourly pattern. For its part, Weptos technology was able to meet 85% of the plant’s annual energy demand and achieved better energy stability, but it also presented high energy surpluses and deficits. The authors also analysed a hybrid generation system of 80% wave energy and 20% solar energy, with which it was possible to reduce the hours of null or very low production for most situations. It was concluded that an hourly energy analysis must be made for each wave energy technology to determine whether the incorporation of photovoltaic energy resulted in an improvement or not.
Different studies have been published, proposing the use of geothermal energy to meet the energy needs of desalination plants. Calise et al. [18] proposed a solar–geothermal trigeneration system to supply a small community with fresh water, heating, and cooling. The proposed system was based on an organic Rankine cycle (ORC) of 1.20 MW from which electricity is generated via geothermal energy and solar energy captured by parabolic trough collectors (PTCs). The medium-enthalpy geothermal brine is used to heat spaces in winter and cool them in summer. Finally, this brine is then used to drive a multi-effect distillation (MED) to desalinate the seawater. This trigeneration system obtained 4.60 GWh/year in electricity production, heat recovery of 83.1 GWh/year for heating and cooling, and 85,200 m3 of annual desalinated water production.
In [19], an integrated solar–geothermal system was proposed for the production of cooling, hot water, electricity, and desalinated water. The system requires a geothermal well, PTCs, an ORC, a single-effect Li/Br and water absorption chiller, and an SWRO desalination unit. Thermoelectric generators (TEGs) are used instead of a condenser to increase the electricity generated by the ORC. The temperature of the geothermal brine raised from 160–190 °C to 320–380 °C thanks to the solar energy captured by the PTCs. The authors claim that using TEGs instead of a condenser is more efficient, with respective electrical powers of 1.061 MW vs. 0.95 MW and respective desalinated water productions of 30.25 m3/h vs. 27.41 m3/h.
Zhang et al. [20] analysed an integrated system based on flash-binary geothermal and gas turbine cycles and a multi-effect seawater desalination subsystem for the cogeneration of electrical energy and freshwater. The geothermal fluid exhibits high temperatures (180.05 °C). The system achieved a net electrical power of 8183 kW and a freshwater production of 16.11 kg/s.
A trigeneration system has also been proposed based on the hybridization of a modified Kalina cycle to generate electricity, RO-based seawater desalination to obtain distilled water, and the electrolysis of the water at low temperatures to produce hydrogen [21]. On the basis of high-temperature geothermal fluids (188 °C), the system was able to generate 4795 kW of electrical power, 19.9 kg/s of distilled water and 5.3 kg/h of hydrogen.
The proposal of Kaczmarczyk et al. [22] consists of a system in which low enthalpy geothermal water (80–95 °C) is used to generate electricity and produce desalinated water. For this, geothermal fluid is transported to a brackish water desalination plant after part of its heat energy has been used for the evaporation of the working fluid used in the Kalina cycle or the ORC. After analysing different configurations, the Kalin cycle based on an ammonia–water mix (89% ammonia) was found to provide the best results, with a gross power output of 1622 kW, a gross generated electrical energy of 6489 MWh/year, and a desalinated water production of 3933 m3/day on the basis of a mass flow rate of 100 kg/s of geothermal water at 95 °C.
In [23], a study was conducted on the combination of a flash-binary geothermal system with humidification–dehumidification desalination processes. The results showed that 5.87 MW of power could be generated along with 11.42 kg/s of desalinated water on the basis of a 45 kg/s mass flow rate of high-enthalpy geothermal fluid (1000 kJ/kg).
Pietrasanta et al. [24] developed a nonlinear optimization mathematical model in which different configurations were compared based on the combination of a single flash or double flash geothermal plant with an MED and/or RO desalination system. The results showed that, for a fixed electrical energy generation of 70 MW, a single flash geothermal plant with an MED desalination system was the optimal configuration for freshwater demands of 720–2880 m3/h, whereas for freshwater demands of 4320–5040 m3/h, the best option comprises a double flash geothermal plant with MED and RO desalination systems. In the single flash system, 420 kg/s of geothermal fluid would be extracted at 250 °C, while in the double flash system, the mass flow rate and temperature would increase to 480 kg/s and 320 °C, respectively.
In general, the cases studied in the literature refer to desalination processes with low levels of production capacity and therefore low energy demand, except for some cases in which high mass flow rates of high-temperature geothermal fluid are employed.
The public-owned SWRO desalination plant considered in the present study is situated in the southeast of Gran Canaria and has a production capacity of 33,000 m3/day [25]. The plant runs under practically constant operating conditions throughout the day. A plan has been drawn up based on increasing the plant’s capacity to 40,000 m3/day and/or supplying electrical energy demands by mostly wind/solar energy mixes [26].
The novel contribution of the study undertaken in the present paper involves the additional incorporation in the original renewable energy mix of an ORC geothermal installation, taking advantage of the known medium-temperature geothermal resources in the area of the desalination plant, which are considered to have the highest geothermal potential on the island [27]. As far as the authors are aware, no proposals have been made in the literature with respect to the use of ORC geothermal plants that exploit medium-temperature resources and operate as facilities for the self-consumption of a high-capacity SWRO desalination plant. Bearing in mind the low dispatchability of wind and solar energy, the additional incorporation of the geothermal plant, with dispatchable electrical energy capacity, significantly improves the instantaneous availability of renewable energy, enhancing the extent to which supply can meet demand, as well as grid safety and stability. The self-consumption proposal contributes to optimizing distributed and decentralized generation systems [28] that are necessary for the best possible management of isolated electrical energy systems such as that of Gran Canaria [6]. For this, the present paper considers the design of a geothermal plant and its incorporation into the renewable energy mix initially scheduled for the desalination plant. An analysis is then undertaken on the energy balance of the new diversified renewable energy system.

2. Materials and Methods

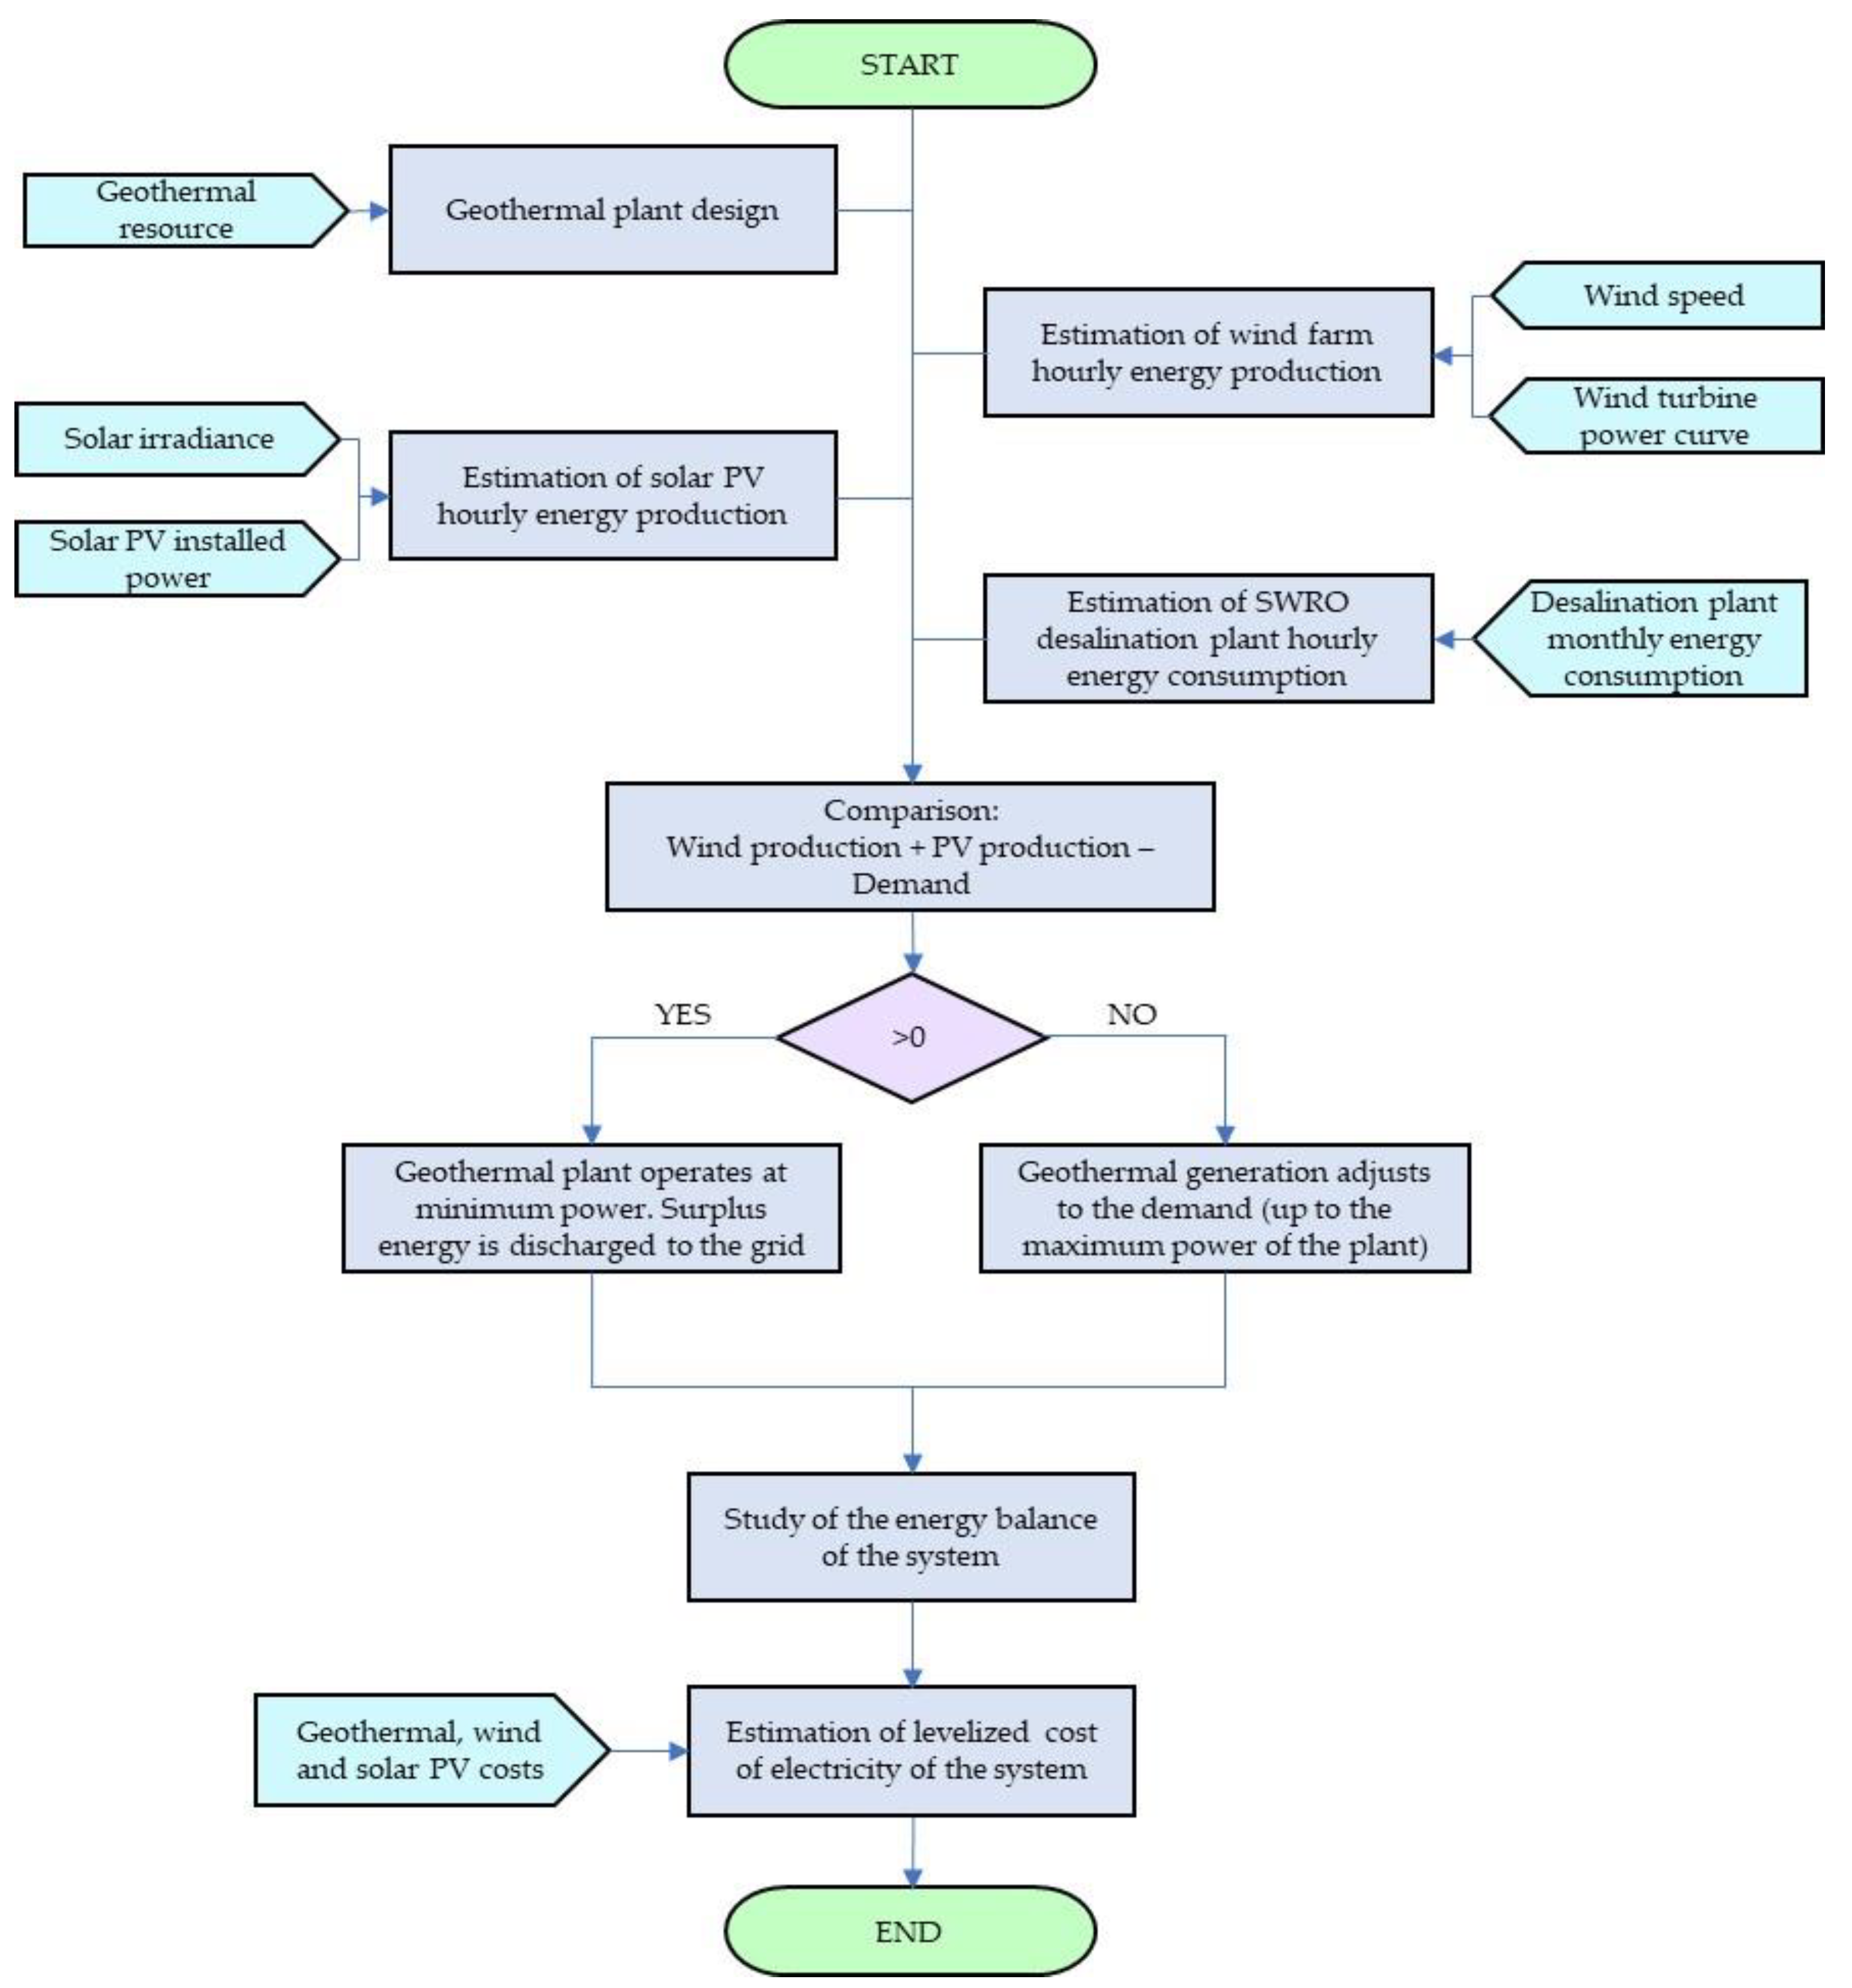
2.1. Method Developed

Figure 1 shows the method followed in the work described in this paper.

2.2. Description of the Diversified Renewable System

An initial plan was drawn up by the plant’s management team to install an 8.8 MW wind farm and 2 photovoltaic plants each of 400 kW (PV-1 and PV-2).
The design and integration of a geothermal binary plant in the initially conceived renewable system were considered. This is the only type of geothermal technology that can exploit medium-temperature geothermal resources for the production of electrical energy. Figure 2 shows the location of renewable generation facilities and the desalination plant. The original plan also included an electrical connection of the wind farm and PV-2 (see Figure 2) with the desalination plant via a medium voltage cable (20 kV).

2.3. Design of the Proposed Geothermal Generation System

The purpose of the proposed geothermal system, the flow diagram of which is represented in Figure 3, is to capture the heat energy of the geothermal fluid and use it to generate electricity. The system is based on binary cycle technology, with a geothermal fluid extraction and reinjection circuit and another closed circuit through which an organic working fluid circulates as an ORC system. The system is characterised by its high volatility and low boiling point and subjected to the following processes:
  • Process 1-2: Expansion. The working fluid in vapour state expands in the turbine, converting kinetic energy into mechanical energy, which is subsequently transformed into electrical energy via a generator.
  • Process 2-3: Condensation. The working fluid is condensed after transferring its heat energy to cold water from a cooling tower.
  • Process 3-4: Compression. The pressure of the working fluid in a liquid state is increased to take it to the evaporator using a process pump.
  • Processes 4-5 and 5-1: Pre-heating and evaporation. After the geothermal fluid has been extracted, its heat energy is transferred to the working fluid via a preheater and evaporator. Pre-heating corresponds to process 4-5 and evaporation corresponds to process 5-1. After absorbing all the heat, the working fluid reaches the saturated vapour state.
Numerous recent publications studied this specific technology for the generation of electricity from geothermal resources. Loni et al. [29] undertook a detailed review of geothermal-driven ORC systems for power generation, claiming that they can be economically viable investments with high energy efficiencies.
In [30], a review was undertaken of geothermal ORCs in which it was highlighted that the efficiency and energy generation costs of ORC geothermal systems vary significantly depending on the characteristics of the different case studies analysed.
Yan et al. [31] carried out a thermodynamic analysis of the ORC of a geothermal system. Among the main findings was that increasing the evaporation temperature can improve the efficiency, power, and economy of the system.
In [32], an algorithm was developed for the comprehensive evaluation of ORC geothermal systems used in liquid-dominated geothermal fields of medium/high temperature. The models that were developed allowed the examination of environmental characteristics, safety, and thermodynamic and techno-economic performance when using different working fluids in order to obtain orientational information for the optimum ORC design.

2.3.1. Energy Capacity of the Geothermal Resource

The design and calculation of geothermal installations is conditioned by the energy capacity of the geothermal resource. Situated in the southeast of Gran Canaria is a zone with recognized or estimated medium-temperature geothermal resources. In 1981, the Geological and Mining Institute of Spain (IGME by its initials in Spanish) conducted two surveys, one 670 m and the other 648 m deep, obtaining heat gradients of 65 °C/km and 75 °C/km, respectively [33]. These values are around twice that of a normal heat gradient. Based on this information, it is argued in [27] that there is a high probability that the geothermal resource is confined in a geothermal reservoir at a depth of some 2 km and a temperature of 130 °C. The depth was established based on the interpretation of a 3D electrical resistivity model [6]. It is estimated that this reservoir occupies a surface area of some 150 km2 (see Figure 2).
Considering the characteristics of one of the wells analysed in [34], for which its temperature and depth are similar to those of the geothermal reservoir studied in the present paper, it is estimated that the geothermal water of the aquifer is subject to a pressure of 185 bar. Knowing the temperature and pressure of the geothermal water, its density can be estimated at around 1010 kg/m3 [35].

2.3.2. Initial Design Parameters

Before determining the thermodynamic states given in the ORC, three design parameters are required as an initial hypothesis:
  • Turbine input temperature (T1): This is established based on the temperature of the geothermal resource at the mouth of the production well (Ta), which is slightly lower than the initial temperature of the geothermal fluid at the deepest level of the aquifer due to heat losses that take place as the fluid rises (close to 2 °C per kilometre). In the case study of the present paper, the geothermal reservoir is at a temperature of 130 °C, and at the mouth of the production well, the temperature of the geothermal fluid will therefore be 126 °C. On the basis of this latter temperature, it is assumed as a hypothesis that the temperature of the working fluid before entering the turbine will be 95 °C.
  • Condensation temperature (T3): This is established based on the type of heat rejection system employed and the mean ambient temperature. In this case, it is considered that the working fluid condensation process will be at 25 °C, which is slightly lower than the mean annual ambient temperature [36].
  • Geothermal fluid reinjection temperature (Tc): This is established by taking into consideration that the geothermal fluid has to be reinjected at a temperature that is sufficient for preserving the temperature and pressure of the reservoir. For the particular case studied in this paper, reinjecting geothermal water at a temperature of 84 °C was decided upon.
In addition, the isentropic efficiencies of the turbine ( η s ST 101 ) and the process pump ( η s P 104 ) must be known. These can be established at 85% and 80%, respectively.

2.3.3. Determination of Thermodynamic States

The ORC thermodynamic simulation was performed using the free TermoGraf software [37]. The known thermodynamic properties are introduced in order to determine the following thermodynamic states:
  • State 1: Corresponds to the turbine’s working fluid input. The working fluid must be in saturated a vapour state at the turbine’s inlet and so its steam quality is 1 (x1 = 1 p.u.). The temperature, T1, was set as explained in the previous subsection. By introducing the values of x1 and T1 in the simulator, it is possible to determine the rest of the thermodynamic properties of the working fluid in state 1 (P1, h1, and s1).
  • State 2: Corresponds to the turbine’s working fluid output or the condenser’s working fluid input, which is the same. After exiting the turbine, the working fluid is isobarically condensed, and so the pressure in 2 coincides with the pressure in 3 (P2 = P3). The procedure for obtaining the value of P3 is explained below. Expansion is an isentropic process in the ideal cycle, with specific entropy values in states 1 and 2s therefore coinciding (s1 = s2s) since subscript s corresponds to the final state after an isentropic process. Introducing the values of P2 and s2s in the simulator, it is possible to obtain the rest of the thermodynamic properties of the working fluid in the 2s state, including the specific enthalpy (h2s). However, in the real process, the irreversibility of the turbine must be taken into account. Based on specific enthalpies h1 and h2s and the isentropic efficiency of the turbine (see Equation (1)), the specific enthalpy in 2 can be calculated (h2). With the values of P2 and h2, the simulator provides the rest of the thermodynamic properties of state 2.
η s ST 101 = h 1 h 2 h 1 h 2 s
  • State 3. The condensation temperature, T3, was established as explained in the previous subsection. As the working fluid is in a saturated liquid state, the vapour’s quality is 0 (x3 = 0 p.u.). Introducing the values of T3 and x3 in the simulator, it is possible to obtain the rest of the thermodynamic properties of state 3 (P3, h3, and s3).
  • State 4. Working fluid heat absorption (Process 4-1) takes place through an isobaric process, and so the pressure in states 4 and 1 coincides (P4 = P1). In the ideal cycle, the compression process is isentropic, and so specific entropies are the same in states 3 and 4s (s3 = s4s). Introducing the values of P4 and s4s in the simulator, it is possible to obtain the rest of the thermodynamic properties of the working fluid in state 4s, including the specific enthalpy (h4s). However, in the real process, the isentropic efficiency of the process pump must be taken into account. Based on specific enthalpies h3 and h4s and the isentropic efficiency of the process pump (see Equation (2)), the specific enthalpy in state 4 can be calculated (h4). Introducing P4 and h4, the simulator can provide the rest of the thermodynamic properties in state 4.
η s P 104 = h 4 s h 3 h 4 h 3

2.3.4. Selection of the Working Fluid

The choice of working fluid is an important factor in the design of the geothermal plant as its thermodynamic behaviour directly influences the plant’s performance. However, in addition to the thermodynamic properties of the working fluid, other factors need to be taken into account, including environmental and health impacts and the safety level during operation.
With respect to thermodynamic properties, organic fluids allow the exploitation of medium-temperature geothermal resources as their low boiling point allows them to evaporate at lower temperature conditions than water would require. Organic fluids can be classified in three groups: wet, isentropic, and dry. The differentiating factor is the value of the slope of the saturated vapor curve. Dry fluids are the most interesting option for ORC geothermal plants as their positive curve allows them to remain in superheated vapour states throughout the expansion process in the turbine, thereby avoiding the unfavourable situation of the existence of humidity in the turbine. The use of wet and isentropic fluids was therefore discarded.
The quantification of the environmental impact of the organic fluid was carried out by analysing the ozone depletion potential (ODP) and global warming potential (GWP) indicators. Organic fluids with high ODP and GWP values were discarded.
The most commonly used organic fluids in ORC geothermal plants are pentane, isopentane, and butane [38]. These three fluids have zero ODP and a very low GWP. They are also low in toxicity but highly flammable [39]. Therefore, of these three fluids, a decision was made to the one with the best thermodynamic behaviour (i.e., that which achieves the best thermal efficiency of the cycle and the highest enthalpy drop across the turbine).

2.3.5. Thermal Efficiency of the Thermodynamic Cycle

Knowing all states, it is possible to determine the overall thermal efficiency of the thermodynamic cycle using Equation (3) [38]. The value normally ranges between 10% and 13% [38].
η th = 1 h 2 h 3 h 1 h 4  

2.3.6. Law of Conservation of Energy

The calculation of the ORC equipment is based on the first law of thermodynamics, Equation (4), which reflects the law of the conservation of energy:
Δ   U ˙ =   Q ˙   W ˙ = m ˙ out · h out m ˙ in · h in
where
  • Δ   U ˙ : variation of the internal energy of the system (in kW);
  •   Q ˙ : amount of heat transferred to the system (in kW);
  •   W ˙ : work carried out by the system (in kW);
  •   m ˙ : mass flow rate (in kg/s);
  • h: specific enthalpy (in kJ/kg).
The sign will be positive when the system absorbs heat or work is performed on it, and it is negative when it transfers heat or it does work on its surroundings.
Bernoulli’s principle, Equation (5), is a consequence of the energy conservation law and can be applied when there is only an exchange of mechanical energy. This principle represents the conservation of energy in fluids that are transported along a streamline:
p ϱ · g + v 2 2 g + z = constant
where
  • p: static pressure of the fluid (in Pa);
  • ϱ: density of the fluid (in kg/m3);
  • g: gravitational constant (9.81 m/s2);
  • v: fluid flow velocity (in m/s);
  • z: height with respect to a reference level (in m).
A formula that is commonly used together with Bernoulli’s equation is the Hazen–Williams equation, Equation (6), which is applied for the calculation of hydraulic losses:
h L = 6.05 · 10 5 · Q 1.85 · L eq C 1.85 · d 4.87
where
  • h L : hydraulic losses (in bar);
  • Q: flow rate (in l/min);
  • Leq: equivalent pipe length (in m);
  • C: constant that depends on the pipe material;
  • d: internal diameter of the pipe (in mm).

2.3.7. Sizing of the Equipment

Production Pump P-101

The given hot water in an aquifer will tend to rise naturally through the production well due to the high pressure levels it is subjected to. Nonetheless, it is possible that the pressure is insufficient for the water to rise to the surface of the well. Complementary pumping equipment is then required to enable its extraction. In this case, a submersible electric pump is used.
The manometric height or head of the geothermal water column that rises naturally due to the pressure potential of the aquifer is given by Equation (7):
H column = P aquifer   ϱ geo   · g  
where
  • Hcolumn: manometric head of the geothermal water column (in mWC);
  • Paquifer: hydrostatic pressure of the aquifer (in Pa);
  • ϱgeo: density of the geothermal fluid (in kg/m3).
Thus, the submersible pump should be situated at least at the depth of point i1 (see Figure 4).
The production pump has to apply sufficient pressure to the geothermal water that it can overcome the height difference and the hydraulic losses in the transport of the geothermal fluid, including the pressure drop in the pipes of evaporator E-102 and preheater E-101. In addition, it needs to contribute sufficient pressure to avoid the cavitation of the geothermal fluid due to its drop in pressure. For this, the pressure at which the geothermal fluid has to be before its passage through reinjection pump P-102 (point j1) is established, and this must be higher than the vapour pressure of the geothermal water at the corresponding temperature. Bernoulli’s equation (Equation (5)) is therefore applied from point i1 to point j1 to determine the manometric head that pump P-101 must provide (HP-101).
For the particular case of the geothermal installation considered in the present paper, a decision was made to extract a maximum volumetric flow of 1000 m3/h of geothermal fluid or a mass flow rate of 280.56 kg/s, which is the same. In this way, an excess extraction of geothermal fluid is avoided, thereby prolonging the useful life of the geothermal field.

Reinjection Pump P-102

This equipment is required to reinject the geothermal water in the aquifer at minimum temperature and pressure conditions that ensure the preservation and extension of the useful life of the geothermal field. For the particular case of the installation of the present paper, a decision was made to reinject the geothermal water at a temperature of 84 °C, which is 46 °C lower than the field’s production temperature. This cooling causes damage to the geothermal field, which is compensated by means of the reinjection of geothermal fluids at a pressure higher than the initial hydrostatic pressure of the field. In this case, a decision was made to perform the reinjection at 20 bar more than the initial hydrostatic pressure of the aquifer, which is to say at 205 bar. This was performed for several reasons, with the main one being to meet the premise of preserving the pressure of the aquifer. Another reason is that this pressure is below the critical pressure of the water (220.89 bar), thereby avoiding the water entering a compressible liquid state. Once these conditions are established, Bernoulli’s equation (Equation (5)) is applied from point i2, situated before pump P-102, to point j2, situated at the bottom of the geothermal reservoir.

Preheater E-101 and Evaporator E-102

A preheating process of the working fluid is carried out in preheater E-101 to raise its temperature to its boiling point from the heat yielded by the geothermal fluid. The latent heat that the working fluid requires for evaporation is transferred with the evaporator E-102 until the saturated vapour state is reached (state 1). Table 1 shows the energy balance equations of the E-101 preheater (Equation (8)), the E-102 evaporator (Equation (9)), and the rest of the main equipment of the ORC.
The two processes can be treated as a single global heat exchange process in which the working fluid passes from a subcooled liquid (state 4) to saturated vapour (state 1), and for which its energy balance is shown in Equation (13):
m ˙ geo · cp geo · ( T a T c ) =   m ˙ wf · ( h 1 h 4 )
where
  •   m ˙ geo : mass flow rate of the geothermal fluid (in kg/s);
  • cp geo : specific heat of the geothermal fluid (in kJ/kg·°C);
  •   m ˙ wf : mass flow rate of the working fluid (in kg/s).
Using Equation (13), the mass flow rate of the working fluid is resolved. In this regard, it should be noted that a higher temperature of the geothermal fluid will entail a higher mass flow of working fluid and, hence, higher power capture.
After the design of the two heat exchangers is carried out following [40], the pressure drops in the pipes were calculated following [41] and the shell-side pressure drop was calculated following the simplified Delaware method [42].

Turbine ST-101

Considering that working fluid expansion in the turbine is adiabatic and that the kinetic and potential energy variation of the flow is negligible, the power absorbed by the turbine can be obtained (   W ˙ 1 2 ). The corresponding energy balance equation (Equation (10)) is shown in Table 1. Part of the absorbed power cannot be delivered in the form of useful mechanical power to the turbine shaft due to manometric, volumetric, and mechanical losses. The total mechanical efficiency ( η mec ) takes into consideration these three types of losses and is established at 87% [43]. Equation (14) represents the calculation of the useful mechanical energy delivered to the turbine shaft.
  P ˙ ST 101 =   W ˙ 1 2 · η mec  

Heat Dissipation System

To condense the working fluid after its passage through the turbine, a system is required that can dissipate the heat that the fluid brings with it. In this case, the heat dissipation system is based on a wet, closed-circuit cooling tower (T-101 A/B). Housed inside the cooling tower are coils that act as a condenser (condenser E-103), as the working fluid flows through them in a saturated vapour state until condensing. Cold water sprayed over these coils from the cooling tower (state 8i) absorbs the heat yielded by the working fluid in its condensation, with the resulting energy balance that is shown in Equation (11) and Table 1. Based on the result of the heat power yielded by the working fluid in the condenser and the cooling capacity of the selected cooling tower, the number of cooling towers that are required can be determined. The manufacturer indicates the mass flow rate with which each cooling tower works. In addition, taking into account the average climate conditions in the area of the case study of the present paper (dry bulb temperature of 20.48 °C and relative humidity of 67.33% [36]), it is considered that the cooling water (states 6, 7 and 8i) is at 21.5 °C. In this way, using Equation (11), the temperature of the cooling water after absorbing the heat yielded by the working fluid (state 8f) is resolved.
Subsequently, the psychrometric chart is used to determine the thermodynamic properties of the air that enters the cooling tower from the outside (state 9), for which its dry bulb temperature and relative humidity match the average climate conditions described above and of the air that exits the cooling tower (state 10), considering that the latter has a dry bulb temperature of 34 °C and a relative humidity of 95%.
The air mass, water mass, and energy balances in the cooling tower are shown in Table 2, where   m ˙ a ,   m ˙ v , and m ˙ correspond, respectively, to the mass flow rates of air, water vapour, and water, and ω is the humidity ratio.

Process Pump P-104

The process pump provides the pressure required for the working fluid to initiate the heat absorption process in preheater E-101 and evaporator E-102. Considering that the compression is adiabatic and that there is no variation in the kinetic and potential energy of the flow, the work that the process pump must carry out on the working fluid to complete the compression process can be obtained. The corresponding energy balance equation, Equation (12), can be found in Table 1.

2.3.8. Electrical Power Absorbed by Pumps and Fans

The electrical power absorbed by the pumps is calculated using Equation (18):
  P ˙ Pump = H Pump   ·   m ˙ · g η Pump
where
  • H Pump : manometric head to be supplied by the pump (in mWC);
  • m ˙ : mass flow rate of the fluid that passes through the pump (in kg/s);
  • η Pump : pump efficiency.
The power absorbed by the fans to overcome the drop in static pressure given in the cooling tower and to correctly transport the required mass flow of air is given by Equation (19) [44]:
  P ˙ fan = ( m a ˙ ϱ a ) · Δ P static η fan
where
  •   P ˙ fan : electrical power absorbed by the fan (in W);
  • m a ˙ : mass flow of air that passes through the fan (in kg/s);
  • ϱ a : air density (in kg/m3);
  • ΔPstatic: static pressure drop in the circuit (in Pa);
  • ηfan: efficiency.

2.3.9. Net Power of the Geothermal Plant

Taking as a starting point the useful power delivered to the turbine shaft, the losses that take place when transforming mechanical energy into electrical energy need to be considered. For this, this useful power is multiplied by the electrical efficiency of the generator ( η e ), which is around 96% [43]. The gross electrical power of the geothermal plant can then be calculated using Equation (20).
  P ˙ ge =   P ˙ ST 101 · η e
The net electrical power of the geothermal plant, Equation (22), is the difference between the gross electrical power and the power consumed by the auxiliary equipment, Equation (21):
  P ˙ aux =   P ˙ P 101 +   P ˙ P 102 +   P ˙ P 103 +   P ˙ P 104 +   P ˙ fan
  P ˙ ne =   P ˙ ge   P ˙ aux

2.3.10. Geothermal Generation

Of the three renewable energy sources that supply electrical energy to the plant, geothermal energy is the only type that is dispatchable. This can be taken advantage of by adapting geothermal generation to the energy balance result at each instant. For this, a strategy is proposed in the present paper based on scheduling the hourly production of electrical energy by the geothermal plant on the basis of the demand of the desalination plant and the generation of non-dispatchable wind and solar energy. In this way, when the energy demand of the desalination plant exceeds wind and solar generation, the electrical energy generation of the geothermal plant is adapted to the resulting demand up to its maximum power ( P ˙ ne ). If an energy deficit in the balance of the system continues despite the geothermal plant generating energy at the maximum power, the desalination plant can then take electrical energy from the grid. In contrast, in the case of surplus energy, because wind and solar sources are generating more power than is being demanded by the desalination plant, the electrical energy production of the geothermal plant can be reduced to a technical operating minimum, which corresponds to 25% of its rated power. This avoids the plant having to be shut down, extends the useful life of the geothermal plant as the flow of the geothermal fluid will be lower thanks to the annular valve (VLV-101) regulation, preserves the geothermal field for a longer time, and reduces the generation of excess energy. Any excess energy produced by the renewable generation system is injected into the grid.
In the event that the resulting energy demand, after discounting wind and solar contributions, is between 25% and 100% of the rated power of the geothermal plant, geothermal generation can be adapted to that demand, eliminating in this case the existence of energy deficits and surpluses.
To analyse the behaviour of the geothermal plant, it is convenient to consider its energy efficiency. For this, the parameters given by Equations (23) and (24) can be used:
EFLH = E geo P ne
CF geo = E geo P ne · t
where
  • EFLH: equivalent full load hours (in h/year);
  • E geo : electrical energy produced by the geothermal plant in a year (MWh/year);
  • P ne : net rated electrical power of the geothermal plant (in MW);
  • CFgeo: capacity factor of the geothermal facility;
  • t: total number of annual hours (8760 h/year).

2.4. Estimation of Wind Generation

In order to effectively mitigate energy shortages [45], installing two wind turbines 2.3 MW Enercon E-70 and one 4.2 MW Enercon E-115 [46] is planned, resulting in a total installed power of 8.8 MW. The technical data and operating curves of the aforementioned wind turbine models were taken from [47].
Hourly wind data (wind speed and direction) for the period 2005–2007 were obtained from a weather station (WS) situated on the terrain where the installation of wind turbines is planned. The anemometer of the WS was situated at a height of 20 m above ground level (agl). The data were provided by the Canary Technological Institute (ITC by its initials in Spanish) [48], a public company of the Canary Government, which includes, among its activities research, development and innovation (R + D + i) in environmental sustainability and energy efficiency.
To calculate the hourly wind speed at the hub height of the two wind turbines, Equation (25) [49] was used:
V = V ref · ( H H ref ) n
where
  • V: wind speed at hub height (in m/s);
  • Vref: reference wind speed (in m/s);
  • H: hub height (in m);
  • Href: reference height (in m);
  • n: roughness exponent.
The roughness exponent, n, Equation (26), is a parameter that depends on the coefficient of relative roughness Z0.
n = 1 Ln ( H ref Z 0 ) [ 0.088 1 0.088 · Ln ( H ref 10 ) ] · Ln ( V ref 6 )
As the wind turbines are close to the sea, a roughness class of 0 was considered, which corresponds to a coefficient of relative roughness, Z0, of 0.0002 [50].
The hub height of the E-70 wind turbine model is 60 m agl and that of the E-115 model is 80 m. Table 3 shows the results for the mean monthly wind speeds at heights of 60 m agl and 80 m agl obtained from the observed data at 20 m agl.
The estimation of the hourly wind generation for each of the wind turbines was made on the basis of the wind speed data and the power curve of the turbines.
The calculation of the wind speeds at the corresponding hub heights of each generator, as well as the subsequent calculation of hourly wind generation, was performed using a routine developed by the authors in Matlab.

2.5. Estimation of Photovoltaic Solar Generation

In addition to the installation of wind turbines to supply desalination with electrical energy, installing two 400 kW photovoltaic plants was also planned [51]. The photovoltaic potential was estimated using the online platform PVGIS [52]. The geographic coordinates of the area where the two plants are to be installed were introduced into the programme (Table 4), as well as the inclination and real azimuth (in this case, 20° and 0°, respectively) [51]. The platform returned 24 data for each month of the year, corresponding to the mean solar irradiance values for each hour. Table 5 and Table 6 show the mean hourly solar irradiance values at the sites of PV-1 and PV-2, respectively. The equivalent peak sun hours is calculated using Equation (27):
EPSH = G G max
where
  • EPSH: equivalent peak sun hours;
  • G: hourly solar irradiance (in W/m2);
  • Gmax: maximum solar irradiance (1000 W/m2).
To estimate the hourly production of the photovoltaic plants, Equation (28) is used:
E PV = EPSH · P PV
where
  • EPV: hourly photovoltaic productions (in kWh);
  • PPV: installed photovoltaic power (in kW).

2.6. Energy Demand of the Desalination Plant

The demand data were provided by the desalination plant’s owning entity for the period 2019–2021. Given the atypical conditions of 2020 and 2021 due to the COVID-19 pandemic, it was deemed convenient to use the standardised demand data from 2019. As can be seen in Table 7, the hourly energy demand profile for a typical winter and summer day is very similar, presenting in both cases a strong correlation with the price of contracted energy, which varies according to different time slots over the course of a day. Typical winter and summer days are based on the mean hourly electricity demand values in the months of January and July, respectively. The distribution of the price ranges according to the corresponding time slot can be consulted in [53].
The power contracted by the desalination plant is 6.3 MW. However, in certain periods of the day, demands can reach values higher than 9 MW.

2.7. Energy Balance Study

The electrical energy strategy of the geothermal plant aims to increase the proportion of renewable energy that is produced and then consumed by the desalination plant, hereinafter referred to as the degree of self-consumption (DSC), Equation (29), and the proportion of the demand of the desalination plant that is met by self-consumed renewable energy, hereinafter referred to as the degree of satisfied demand (DSD), as shown in Equation (30).
DSC = Annual   self - consumed   renewable   energy Annual   renewable   energy   produced
DSD = Annual   self - consumed   renewable   energy Annual   desalination   plant   demand
With this strategy, the goal is to minimize the energy transition between the island’s grid system and the desalination plant’s electrical energy system. In addition, the proportion of the generated annual renewable energy that is surplus energy injected into the grid, the surplus energy ratio (SER), was calculated using Equation (31).
SER = Annual   surplus   energy Annual   renewable   energy
Using the available hourly wind and photovoltaic generation data and the hourly electrical energy demand of the desalination plant, it is possible to adjust the electrical energy generation of the geothermal plant to the energy needs for each hour of the year. In this way, the hourly energy balance of the global system can be determined.

2.8. Levelized Cost of Energy (LCOE) of the Diversified Renewable Generation System

The LCOE for each of the renewable generation sources was calculated using Equation (32):
LCOE = CAPEX · CRF + C O & M t = 1 T E i  
where
  • CAPEX: initial investment cost (in EUR);
  • CRF: capital recovery factor;
  • C O & M : annual operating and maintenance costs (in EUR/year);
  • T: total number of hours in a year (in h).
The capital recovery factor, Equation (33), depends on the discount rate and the useful life (economic lifetime) of the installation:
CRF = r ( 1 + r ) Lt ( 1 + r ) Lt 1
where
  • r: discount rate. A discount rate of 3% is considered a realistic value in stable macroeconomic situations;
  • Lt: lifetime of the installation (in years). In this study, a useful life of 25 years was taken for the geothermal plant [54] and the photovoltaic plants and of 20 years for the wind farm.
The degree of the contribution of each renewable energy source differs according to instant “i”. For this reason, the LCOE value will differ for each instant and is calculated using Equation (34):
LCOE i = j = 1 3 LCOE j · E ji j = 1 3 E ji
where
  • LCOEi: the mean levelized cost of renewable generation for instant “i” (in EUR/MWh);
  • LCOEj: the mean levelized cost for renewable generation source “j” (geothermal, wind and photovoltaic);
  • Eji: energy generated by renewable source “j” in instant “i” (in MWh).
Finally, the mean weighted annual LCOE is calculated using Equation (35):
LCOE ¯ = i = 1 T LCOE i · E i i = 1 T E i
where
  • LCOE ¯ : the mean annual weighted cost for the diversified renewable generation system (in EUR/MWh);
  • Ei: electrical energy generated in instant “i” by the diversified renewable generation system (in MWh).

3. Results and Discussion

3.1. Adapted Solution in the Design of the Geothermal Plant

In the analysis of the different thermodynamic behaviours of the ORC for each of the three organic fluids considered, it was found that pentane achieved the best thermal efficiency of the cycle and the highest enthalpy drop across the turbine (Figure 5). Pentane was therefore selected as the working fluid for the ORC, with an overall thermal efficiency obtained (see Equation (3)) of 13.2%.
Table 8 shows the thermodynamic states of pentane in the ORC:
Figure 6 shows the diagrams of temperature–entropy (T-s) and pressure–enthalpy (P-h) of the ORC using pentane as the working fluid.

3.1.1. Production Pump P-101

The extraction of the geothermal water is performed via a single production well with steel piping of 350 mm in diameter in accordance with the transported flow [55]. A slotted cylindrical filter (S-101) is positioned at the deepest extraction point.
As explained in Section 2.3.1., the hydrostatic pressure of the aquifer is 185 bar [34]. Hence, the height of the geothermal water column is 1867.16 mWC. It was therefore decided to position the submersible production pump at a depth of 132.84 m. The total manometric head for the production pump is then 149.68 mWC. Given the maximum geothermal fluid mass flow rate of 280.56 kg/s and a 75% pump electrical efficiency, the production pump consumes a power of 549.28 kW. The submersible, vertical, and multi-stage SJT pump of Sulzer [56] was considered the most suitable due to its geothermal water extraction capacity under the required flow rate and manometric head conditions.

3.1.2. Reinjection Pump P-102

Geothermal water reinjection is carried out via a single reinjection well with 350 mm diameter steel pipes. The total manometric head, which needs to be provided by reinjection pump P-102, is 128.42 mWC. According to the manufacturer (Sulzer), the horizontal, single-stage, radially split OHH process pump [57] is one of the most suitable for geothermal fluid reinjection. Its operating range allows it to work at the required pressure and flow rate for reinjection, and a decision was therefore made to select this pump to perform the injection process. Assuming an electrical efficiency of 75%, this pump consumes an electrical power of 471.28 kW.

3.1.3. Preheater E-101 and Evaporator E-102

From the energy balance equation with respect to the global heat exchange process in preheater E-101 and evaporator E-102 (Equation (13)), a pentane mass flow rate of 104.62 kg/s is obtained on the basis of the maximum geothermal water mass flow rate of 280.56 kg/s.
Both preheater E-101 and evaporator E-102 are counterflow shell and tube exchangers configured with two shell passes and four tube passes. Figure 7 represents the temperature–heat (T-Q) diagram of the two heat exchangers.

3.1.4. Turbine ST-101

The useful mechanical power delivered to the turbine shaft is 5793.05 kW. The predesigned Siemens D-R U steam turbine [58] was selected given its suitability for organic fluid expansion in the ORC. This multi-stage model with a single-valve inlet allows a maximum turbine speed of 10,000 rpm.

3.1.5. Heat Dissipation System

After analysing various wet, closed-circuit cooling tower catalogues, the S4 model of the MCC series of Torraval [59] was chosen with its cooling capacity of 1900 kW. As it was necessary to dissipate a heat output of 43,116.89 kW (Equation (16)), a total of 23 cooling towers were required. The selected cooling tower works with a water flow rate of 29.4 l/s. A total mass flow rate of 676.2 kg/s of cooling water is therefore required, for which its temperature rises from 21.5 °C to 36.76 °C upon absorbing the heat yielded by the pentane in its condensation.
Table 9 shows the psychrometric properties of the air that enters the cooling tower (state 9) and of the air that exits it (state 10), where the following is the case:
  • TDB: dry bulb temperature (in °C);
  • RH: relative humidity (in %);
  • TWB: wet bulb temperature (in °C);
  • ω: humidity ratio (in kgw/kga);
  • h: enthalpy at saturation (in kJ/kga);
  • v: specific volume (in m3/kga).
From the cooling tower’s mass and energy balances (Table 2), it was observed that the mass air flow required by each cooling tower is 25.68 kg/s. Based on this value and assuming a static pressure drop of the circuit of 200 Pa [60] and a fan efficiency of 60%, the fan of each cooling tower absorbs a power of 6.91 kW under the described conditions.
For its part, the impulse pump of each cooling tower consumes 4 kW to supply the water flow rate proposed by the manufacturer [59].

3.1.6. Process Pump P-104

The mechanical work that pump P-104 provides for the pentane to complete its compression process is 97.03 kW, which corresponds to a manometric head of 94.55 m. Adding the hydraulic losses in the tube and shell sections of heat exchangers E-101 and E-102, the total manometric head amounts to 106.83 m. Considering the flow rate of the working fluid and the total manometric head, the MegaCPK pump model of the manufacturer KSB [61] was selected. This single-stage radially split volute casing pump is suitable for pumping organic products [61]. According to its operating curve, it has an efficiency of 84.7% for the aforementioned flow rate and manometric head, absorbing a power of 129.44 kW.
It should be noted that the piping sections of the ORC, which transport the pentane in liquid and vapour states, have nominal diameters of 300 mm and 100 mm, respectively [62].

3.1.7. Net Electrical Power

The gross electrical power is 5561.33 kW, equivalent approximately to the mean power of currently installed binary cycle geothermal plants [63].
The steam turbine shaft is coupled to a DIG156 alternator manufactured by AvK [64], which can generate an apparent maximum power of 7000 kVA at a frequency of 50 Hz and a voltage of 10 kV.
The production and reinjection processes and process pumps, along with the fans and pumps of the 23 cooling towers, entail a total auxiliary consumption of 1400.91 kW, which results in a net electrical power of 4160.42 kW with respect to the geothermal plant.

3.2. Energy Balance

The results obtained in the energy balance study show that the desalination plant has a total annual energy consumption of 49,435.14 MWh and that the diversified renewable generation system is able to produce 52,481.50 MWh, of which 28,954.64 MWh is from the wind farm, 1883.67 MWh is from the photovoltaic plants, and 21,643.19 MWh is from the geothermal plant, equivalent in the latter case to 5202.16 equivalent full load hours and a capacity factor of 59.4%.
As can be seen in Table 10, the integration of the geothermal plant in the original renewable generation system increases the proportion of self-consumed renewable energy by the desalination plan, decreases the proportion of surplus renewable energy dumped into the island grid system, and significantly increases the renewable energy contribution to satisfy demands. In the latter case, the contribution rises from 42% to 79% thanks to the operation of the geothermal plant at the maximum output at moments of low wind and photovoltaic generation, enabling a safe and stable supply to the desalination plant of a significant amount of renewable energy. These indicators show the improvement obtained via the integration of the geothermal plant in the new, diversified renewable generation system.
Figure 8 represents the results of the hourly energy balance of the system for a typical winter and summer day (based on the mean hourly values of the months of January and July, respectively). It can be seen for the typical winter day that both wind and photovoltaic generation are never able to meet the desalination plant’s demand. However, the integration of the geothermal plant allows the adaptation of total renewable generation energy with respect to demands for a large part of the day and lowers the energy deficit during the night-time period due to the production increase in the desalination plant. It should also be noted that and photovoltaic generation coincides with low desalination plant consumption periods at midday peak wind, giving rise to the generation of an energy surplus, with the geothermal plant working at its established technical operating minimum.
On a typical summer day, geothermal and wind generation are able to meet all the energy demand of the desalination plant during the night. However, desalination plant energy demand falls during the day, with photovoltaic generation entailing an additional contribution to the renewable generation of the system that results in a surplus energy generation (from 8:00 to 23:00), during which time the geothermal plant works at its established technical operating minimum.

3.3. Economic Results

Globally, mean capital investment costs (CAPEX) for onshore wind farms and photovoltaic plants fell by 35% and 92%, respectively, between 2010 and 2021 [65]. In both cases, the slope of this decrease is less marked in the last three years of that period. According to [65], the mean CAPEX value for onshore wind farms in Europe in 2021 was 1623 USD/kW, with a range of values between the 5% and 95% percentiles of 1127 and 2182 USD/kW, respectively. The mean CAPEX values also vary considerably from EU country to EU country. For Spain, the mean value in 2021 was estimated at 1100 USD/kW [65]. For the case study developed in the present paper, keeping in mind that the output of the wind farm is not high and hence the economy of scale cannot be fully taken advantage of, a slightly higher CAPEX benchmark value of 1200 EUR/kW was selected.
With respect to photovoltaic plants, the mean CAPEX value for 2021 was 857 USD/kW [65], with a range of values between the 5% and 95% percentiles of 571 USD/kW and 1982 USD/kW. For Spain, the mean value in 2021 was 916 USD/kW. Bearing in mind the specific capacity of the photovoltaic installations of the case study in the present paper, a CAPEX benchmark value of 1100 EUR/kW was selected.
The mean CAPEX value for geothermal plants is high in comparison and has both increased and fallen between 2010 and 2021 [65]. This is because the mean value is determined by the low number of geothermal plants that are installed each year. In 2021, only 11 geothermal plants were commissioned, with CAPEX values varying from 1978 USD/kW to 6548 USD/kW, giving rise to a mean CAPEX value of 3991 USD/kW [65]. However, at least 8 of these 11 projects have a power over 10 MW and are based on flash-type, dry steam, and binary cycle technologies. Therefore, bearing in mind the type of technology and power of the geothermal plant proposed in this paper, a decision was made to calculate the mean CAPEX value exclusively of the binary cycle geothermal plants with a power ranging between 1 and 10 MW and commissioned in the period of 2018–2021. The resulting value is 5493 USD/kW [65]. Taking into account the extremely low implementation of geothermal plants in Spain, the CAPEX value of the geothermal plant of the present case study was set at 5800 EUR/kW.
As for the operating and maintenance costs, considering the mean values obtained for 2021 in [65], values of 45 and 14 EUR/kW per year were established for wind and photovoltaic plants, respectively, of the present case study. The geothermal plant maintenance and operating costs were set at 110 EUR/kW per year [54].
Table 11 shows the LCOE for each renewable generation technology.
Taking into account the fact that the operating regime of the wind and photovoltaic installations depends on the potential of the resource at each instant and the operating hypothesis of the geothermal plant, the mean hourly LCOE of the diversified renewable generation system will vary depending on the hour of the day and the period of the year. Figure 9 shows the LCOE results for a typical winter and a typical summer day. It can be observed that on summer days, the LCOE is lower due to a higher contribution of wind and photovoltaic installations for satisfying demands.
The mean annual weighted LCOE of the diversified renewable generation system is 57.37 EUR/MWh. This value is significantly lower than the most recent official total cost of conventional generation on the island of Gran Canaria of 153.9 EUR/MWh [10].

4. Conclusions

The integration of a 4.16 MW binary cycle geothermal plant, designed in the study developed in the present paper, in the original non-dispatchable renewable generation system (wind + photovoltaic) for supplying the energy needs of a high production capacity SWRO desalination plant situated on the island of Gran Canaria (Spain) entailed a 37% increase (from 42% to 79%) in the renewable energy contribution for meeting the demand of the desalination plant and a 7% reduction in the proportion of surplus renewable energy dumped into the island’s grid system.
The mean LCOE of the resulting diversified renewable generation system (geothermal + wind + photovoltaic) was 57.37 EUR/MWh, which is significantly lower than the cost of conventional electrical energy generation of 153.9 EUR/MWh in Gran Canaria.
The exploitation of geothermal energy and its implementation as a distributed, self-consumption energy generation system entails an improvement in the stability and reliability of the electrical energy supply due to its dispatchability. The integration of such systems should be considered in strategic plans in which an increase in the contribution of renewable generation for satisfying energy demands is projected, especially in insular and/or weak electrical systems.

Author Contributions

Conceptualisation, F.M.-M. and S.V.-M.; methodology, F.M.-M.; formal analysis, F.M.-M. and S.V.-M.; investigation, F.M.-M. and S.V.-M.; writing—original draft preparation, F.M.-M. and S.V.-M.; writing—review and editing, S.V.-M.; supervision, S.V.-M. All authors have read and agreed to the published version of the manuscript.

Funding

This research was co-funded by ERDF funds, INTERREG MAC 2014-2020 programme, within the ACLIEMAC project (MAC2/3.5b/380) and E5DES project (MAC2/1.1a/309). No funding sources had any influence on study design, collection, analysis, or interpretation of data; manuscript preparation; or the decision to submit for publication. The APC was funded by invitation of the guest editor of the special issue.

Institutional Review Board Statement

Not applicable.

Informed Consent Statement

Not applicable.

Data Availability Statement

The data presented in this study, which have not been specifically referenced in the paper, are available upon request from the corresponding author. They are not publicly available as they are considered confidential data by the respective companies.

Acknowledgments

The authors would like to express their thanks to the Southeast Consortium of Municipalities of Gran Canaria for their collaboration in providing relevant information for the study developed.

Conflicts of Interest

The authors declare no conflict of interest.

Nomenclature

Acronyms
CFCapacity factor
DSCDegree of self-consumption. See Equation (29)
DSDDegree of satisfied demand. See Equation (30)
EFLHEquivalent full load hours. See Equation (23)
GWPGlobal warming potential
LCOELevelized cost of energy
ODPOzone depletion potential
ORCOrganic Rankine cycle
ROReverse osmosis
SERSurplus energy ratio. See Equation (31)
SWROSea water reverse osmosis
Main variables
hSpecific enthalpy (in kJ/kg)
HManometric head (in mWC)
  m ˙ geo   Mass flow rate of the geothermal fluid (in kg/s)
  m ˙ wf   Mass flow rate of the working fluid (in kg/s)
PPressure (in Pa or bar)
  P ˙ ne   Net electrical power of the geothermal plant (in kW)
RHRelative humidity (in %)
sSpecific entropy (in kJ/kg·°C)
TTemperature (in °C)
TDBDry bulb temperature (in °C)
TWBWet bulb temperature (in °C)
vSpecific volume (in m3/kga)
ωHumidity ratio (in kgw/kga)
xSteam quality (in p.u.)

References

  1. European Parliament and of the Council. Directive (EU) 2018/2001 of the European Parliament and of the Council. 2018. Available online: https://eur-lex.europa.eu/legal-content/EN/TXT/PDF/?uri=CELEX:32018L2001 (accessed on 5 December 2022).
  2. Ministry for the Ecological Transition and the Demographic Challenge of the Government of Spain (MITECO). Energy and Climate National Integrated Plan (PNIEC) 2021–2030. 2020. Available online: https://www.miteco.gob.es/images/es/pnieccompleto_tcm30-508410.pdf (accessed on 5 December 2022). (In Spanish).
  3. Canary Government. Sustainable Energy Strategy in the Canary Islands. 2022. Available online: https://www.lamoncloa.gob.es/serviciosdeprensa/notasprensa/transicion-ecologica/Documents/2022/160222_EstrategiaSostenible_Canarias.pdf (accessed on 5 December 2022). (In Spanish).
  4. Spanish Electrical System Operator (REE). REData-Generation Structure in the Canary Islands. 2021. Available online: https://www.ree.es/es/datos/generacion/potencia-instalada (accessed on 5 December 2022). (In Spanish).
  5. Canary Government. Canary Islands Energy Strategy 2015–2025. 2017. Available online: https://www.gobiernodecanarias.org/energia/descargas/SDE/Portal/Planificacion/Planes/EECan25_DocumentoPreliminar_junio2017.pdf (accessed on 5 December 2022). (In Spanish).
  6. Canary Government. Canary Islands Dispatchable Generation Strategy (v1 edition). 2022. Available online: https://www3.gobiernodecanarias.org/ceic/energia/oecan/images/Documentos/Estudios/D4_Estrategia_Generaci%C3%B3n_Gestionable.pdf (accessed on 5 December 2022). (In Spanish).
  7. Geological and Mining Institute of Spain (IGME). Geothermal Energy in Spain. Available online: https://www.igme.es/geotermia/presentacion2.htm (accessed on 5 December 2022). (In Spanish).
  8. World Nuclear Association. Carbon Dioxide Emissions from Electricity. 2022. Available online: https://www.world-nuclear.org/ (accessed on 5 December 2022).
  9. Canary Islands Institute of Statistics (ISTAC). Population of the Canary Islands. 2021. Available online: https://www3.gobiernodecanarias.org/istac/statistical-visualizer/visualizer/data.html?resourceType=dataset&agencyId=ISTAC&resourceId=E30245A_000002&version=1.1#visualization/table (accessed on 5 December 2022). (In Spanish).
  10. Canary Government. Canary Islands Yearly Energy Report. 2020. Available online: https://www3.gobiernodecanarias.org/ceic/energia/oecan/files/Anuario_Energetico_de_Canarias_2020.pdf (accessed on 5 December 2022). (In Spanish).
  11. Torres-Herrera, H.J.; Lozano-Medina, A. Methodological Proposal for the Assessment Potential of Pumped Hydropower Energy Storage: Case of Gran Canaria Island. Energies 2021, 14, 3553. [Google Scholar] [CrossRef]
  12. Ministry for the Ecological Transition and the Demographic Challenge of the Government of Spain (MITECO). Hydrological Plans and Water Resources Monitoring Report-Appendix 1.17-Gran Canaria. 2021. Available online: https://www.miteco.gob.es/es/agua/temas/planificacion-hidrologica/17-gca_2021_tcm30-481576.pdf (accessed on 5 December 2022). (In Spanish).
  13. Borge-Diez, D.; García-Moya, F.J.; Cabrera-Santana, P.; Rosales-Asensio, E. Feasibility analysis of wind and solar powered desalination plants: An application to islands. Sci. Total Environ. 2021, 764, 142878. [Google Scholar] [CrossRef] [PubMed]
  14. Institute for Energy Diversification and Saving of the Government of Spain (IDAE). Prospective Study. Energy Consumption in the Water Sector. Available online: https://www.idae.es/uploads/documentos/documentos_Estudio_de_prospectiva_Consumo_Energetico_en_el_sector_del_agua_2010_020f8db6.pdf (accessed on 5 December 2022). (In Spanish).
  15. Canary Islands Institute of Technology (ITC). ITC Explores New Advanced Technological Developments in Seawater Desalination. 2022. Available online: https://www3.gobiernodecanarias.org/noticias/el-itc-explora-nuevos-desarrollos-tecnologicos-avanzados-en-desalacion-de-agua-de-mar/?format=pdf (accessed on 5 December 2022). (In Spanish).
  16. Canary Government. Renewable Energies in Hydraulic Infrastructures of Gran Canaria. Available online: https://www3.gobiernodecanarias.org/presidencia/fdcan/project/energias-renovables-en-infraestructuras-hidraulicas/ (accessed on 5 December 2022). (In Spanish).
  17. Schallenberg-Rodríguez, J.; Del Rio-Gamero, B.; Melian-Martel, N.; Lis Alecio, T.; González Herrera, J. Energy supply of a large size desalination plant using wave energy. Practical case: North of Gran Canaria. Appl. Energy 2020, 278, 115681. [Google Scholar] [CrossRef]
  18. Calise, F.; Dentice d’Accadia, M.; Macaluso, A.; Vanoli, L.; Piacentino, A. A novel solar-geothermal trigeneration system integrating water desalination: Design, dynamic simulation and economic assessment. Energy 2016, 115, 1533–1547. [Google Scholar] [CrossRef]
  19. Assareh, E.; Alirahmi, S.M.; Ahmadi, P. A Sustainable model for the integration of solar and geothermal energy boosted with thermoelectric generators (TEGs) for electricity, cooling and desalination purpose. Geothermics 2021, 92, 102042. [Google Scholar] [CrossRef]
  20. Zhang, L.; Sobhani, B. Comprehensive economic analysis and multi-objective optimization of an integrated power and freshwater generation cycle based on flash-binary geothermal and gas turbine cycles. J. Clean. Prod. 2022, 364, 132644. [Google Scholar] [CrossRef]
  21. Cao, Y.; Xu, D.; Togun, H.; Dhahad, H.; Azariyan, H.A.; Azariyan, H.; Farouk, N. Feasibility analysis and capability characterization of a novel hybrid flash-binary geothermal power plant and trigeneration system through a case study. Int. J. Hydrog. Energy 2021, 46, 26241–26262. [Google Scholar] [CrossRef]
  22. Kaczmarczyk, M.; Tomaszewska, B.; Bujakowski, W. Innovative desalination of geothermal wastewater supported by electricity generated from low-enthalpy geothermal resources. Desalination 2022, 524, 115450. [Google Scholar] [CrossRef]
  23. Kolahi, M.-R.; Amidpour, M.; Yari, M. Multi-objective metaheuristic optimization of combined flash-binary geothermal and humidification dehumidification desalination systems. Desalination 2020, 490, 114456. [Google Scholar] [CrossRef]
  24. Pietrasanta, A.M.; Mussati, S.F.; Aguirre, P.A.; Morosuk, T.; Mussati, M.C. Water-renewable energy Nexus: Optimization of geothermal energy-powered seawater desalination systems. Renew. Energy 2022, 196, 234–246. [Google Scholar] [CrossRef]
  25. Insular Water Council of Gran Canaria. Hydrological Plan of the Hydrographic Demarcation of Gran Canaria. 2021. Available online: http://www.aguasgrancanaria.com/pdfs/Inundaciones/01-ES120_PH_PPP-Memoria.pdf (accessed on 5 December 2022). (In Spanish).
  26. Agüimes City Hall. Southeast Plans to Produce Up to 40,000 m3 of Desalinated Water Per Day from Renewable Energy Sources. 2020. Available online: https://aguimes.es/el-sureste-proyecta-producir-hasta-40-000-m3-diarios-de-agua-desalada-a-partir-de-fuentes-de-energia-renovables/ (accessed on 5 December 2022). (In Spanish).
  27. Institute for Energy Diversification and Saving of the Government of Spain (IDAE). Evaluation of Geothermal Energy Potential. 2011. Available online: https://www.idae.es/uploads/documentos/documentos_11227_e9_geotermia_A_db72b0ac.pdf (accessed on 5 December 2022). (In Spanish).
  28. Santana-Sarmiento, F.; Velázquez-Medina, S. Development of a Territorial Planning Model of Wind and Photovoltaic Energy Plants for Self-Consumption as a Low Carbon Strategy. Complexity 2021, 2021, 6617745. [Google Scholar] [CrossRef]
  29. Loni, R.; Mahian, O.; Najafi, G.; Sahin, A.; Rajaee, F.; Kasaeian, A.; Mehrpooya, M.; Bellos, E.; Le Roux, W. A critical review of power generation using geothermal-driven organic Rankine cycle. Therm. Sci. Eng. Prog. 2021, 25, 101028. [Google Scholar] [CrossRef]
  30. Haghighi, A.; Pakatchian, M.; El Haj Assad, M.; Nguyen Duy, V.; Alhuyi Nazari, M. A review on geothermal Organic Rankine cycles: Modeling and optimization. J. Therm. Anal. Calorim. 2020, 144, 1799–1814. [Google Scholar] [CrossRef]
  31. Yan, J.; Jia, W.; Li, K.; Yu, H.; Guo, X. Energy analysis of cyclic parameters of organic Rankine cycle system. Int. J. Low-Carbon Technol. 2021, 16, 341–350. [Google Scholar] [CrossRef]
  32. Zhang, N.; Wang, Q.; Yu, Z.; Yu, G. A non-structural fuzzy decision method developed for organic Rankine cycles used in liquid-dominated geothermal fields of medium/high temperature. Energy Convers. Manag. 2021, 231, 113861. [Google Scholar] [CrossRef]
  33. Canary Islands Institute of Technology (ITC). Geothermal Strategy in the Canary Islands. 2020. Available online: https://www3.gobiernodecanarias.org/ceic/energia/oecan/images/Documentos/Estudios/D5_Estrategia_Geotermia_Canarias.pdf (accessed on 5 December 2022). (In Spanish).
  34. Tureyen, O.I.; Sarak, H.; Gulgor, A.; Erkan, B.; Satman, A. A Study on the Production and Reservoir Performance of the Germencik Geothermal Field. In Proceedings of the Thirty-Ninth Workshop on Geothermal Reservoir Engineering, Stanford, CA, USA, 24 February 2014. [Google Scholar]
  35. Champel, B. Discrepancies in brine density databases at geothermal conditions. Geothermics 2006, 35, 600–606. [Google Scholar] [CrossRef]
  36. Ministry of Development of the Government of Spain. DA DB-HE/2: Verification of Limitation of Superficial and Interstitial Condensations in the Enclosures. 2013. Available online: https://www.cgate.es/hit/Hit2016-2/DA-DB-HE-2_-_Condensaciones.pdf (accessed on 5 December 2022). (In Spanish).
  37. University of Zaragoza. TermoGraf. Available online: http://termograf.unizar.es/ (accessed on 5 December 2022). (In Spanish).
  38. DiPippo, R. Geothermal Power Plants: Principles, Applications, Case Studies and Environmental Impact, 3rd ed.; Butterworth-Heinemann (Elsevier): Oxford, UK, 2012. [Google Scholar]
  39. Wang, X.; Levy, E.K.; Pan, C.; Romero, C.E.; Banerjee, A.; Rubio-Maya, C.; Pan, L. Working fluid selection for organic Rankine cycle power generation using hot produced supercritical CO2 from a geothermal reservoir. Appl. Therm. Eng. 2019, 149, 1287–1304. [Google Scholar] [CrossRef]
  40. Perry, R.H.; Green, D.W.; Maloney, J.O. Perry’s Chemical Engineers’ Handbook, 7th ed.; McGraw-Hill: New York, NY, USA, 1997. [Google Scholar]
  41. Process Engineer’s Tools. Shell-Tube Heat Exchanger: Pressure Drop in the Tubes. Available online: https://powderprocess.net/Tools_html/Thermodynamics/Shell_Tube_Pressure_Drop_Tube_Side.html (accessed on 5 December 2022).
  42. Serth, R.W. Process Heat Transfer. In Principles and Applications, 1st ed.; Elsevier: Amsterdam, The Netherlands, 2007. [Google Scholar]
  43. Pinedo-Mines, C.; Ramírez-Pintado, E. Analysis and Evaluation of the Geothermal Potential for Its Use through a Binary Cycle Plant for the Generation of Electrical Power in the Corongo-Ancash Region, Peru. 2015. Available online: http://repositorio.uns.edu.pe/handle/UNS/2001 (accessed on 5 December 2022). (In Spanish).
  44. Khaireh, A. Cooling System Design for a Binary Power Plant in North-Goubhet Field, Djibouti. Geothermal Training Programme. Reykjavik. 2012. Available online: https://orkustofnun.is/gogn/unu-gtp-report/UNU-GTP-2012-18.pdf (accessed on 5 December 2022).
  45. Song, J.; Chen, J.; Wu, Y.; Li, L. Topology Optimization-Driven Design for Offshore Composite Wind Turbine Blades. J. Mar. Sci. Eng. 2022, 10, 1487. [Google Scholar] [CrossRef]
  46. Sánchez-Ramírez, J. Self-Consumption Wind Farm Associated with the Water Cycle of the Southeast Consortium of Municipalities of Gran Canaria. 2021. Available online: https://www.surestegc.org/ (accessed on 5 December 2022). (In Spanish).
  47. Enercon. Technical Data of Enercon Wind Turbines. Available online: https://www.enercon.de/en/products/ (accessed on 5 December 2022).
  48. Canary Islands Institute of Technology (ITC). Available online: https://www.itccanarias.org/web/es/ (accessed on 5 December 2022). (In Spanish).
  49. Saint-Drenan, Y.-M.; Besseau, R.; Jansen, M.; Staffell, I.; Troccoli, A.; Dubus, L.; Schmidt, J.; Gruber, K.; Simões, S.G.; Heier, S. A parametric model for wind turbine power curves incorporating environmental conditions. Renew. Energy 2020, 157, 754–768. [Google Scholar] [CrossRef]
  50. Danish Wind Industry Asociation. Roughness Classes and Roughness Lengths. Available online: www.windpower.org (accessed on 5 December 2022).
  51. Sánchez-Ramírez, J. Implementation of Renewable Energies for the Water Cycle of the Southeast Consortium of Municipalities of Gran Canaria. Installation of a Photovoltaic Plant at IDAM Phase III and IV. 2021. Available online: https://www.surestegc.org/ (accessed on 5 December 2022). (In Spanish).
  52. Photovoltaic Geographical Information System (PVGIS). 2022. Available online: https://joint-research-centre.ec.europa.eu/pvgis-photovoltaic-geographical-information-system_en (accessed on 5 December 2022).
  53. Roams Energy. 6.1 TD Tariff. 2022. Available online: https://energia.roams.es/luz/tarifa/6-1/ (accessed on 5 December 2022). (In Spanish).
  54. International Renewable Energy Agency (IRENA). Geothermal Power: Technology Brief. 2017. Available online: https://www.irena.org/-/media/Files/IRENA/Agency/Publication/2017/Aug/IRENA_Geothermal_Power_2017.pdf (accessed on 5 December 2022).
  55. Polytechnic University of Catalonia. Pipe Calculation Bases. Available online: https://upcommons.upc.edu/bitstream/handle/2099.1/17145/ANEXO?sequence=7 (accessed on 5 December 2022). (In Spanish).
  56. Sulzer. SJT Vertical Turbine Pump. 2015. Available online: https://www.sulzer.com/spain/-/media/files/products/pumps/vertical-pumps/brochures/sjt_vertical_turbine_pump_e10004.pdf?la=en (accessed on 5 December 2022).
  57. Sulzer. OHH and OHHL ISO 13709 (API 610) Type OH2 Single Stage end Suction Process Pumps. 2015. Available online: https://www.sulzer.com/-/media/files/products/pumps/single-stage-pumps/brochures/ohh_ohhl_singlestageendsuctionprocesspumps_e00697.pdf?la=en (accessed on 5 December 2022).
  58. Siemens Energy. Dresser-Rand Steam Turbines. 2022. Available online: https://www.siemens-energy.com/global/en/offerings/power-generation/steam-turbines/d-r-steam-turbines.html (accessed on 5 December 2022).
  59. Torraval. MCC-MCE-HBR: Evaporative Coolers and Condensers. Available online: www.torraval.com (accessed on 5 December 2022). (In Spanish).
  60. Parra-Sanchez, R. Technical-Economic Study of the Industrial Implementation of a Cooling Tower. 2018. Available online: https://oa.upm.es/52155/1/PFC_RAQUEL_PARRA_SANCHEZ.pdf (accessed on 5 December 2022). (In Spanish).
  61. KSB. Characteristic Curves Booklet. 2018. Available online: https://www.ksb.com/en-global (accessed on 5 December 2022).
  62. Spirax-Sarco Engineering. Technical Reference Guide-Steam Distribution. Available online: https://www.fnmt.es/documents/10179/10666378/Distribucion+del+vapor.pdf/fca09a6d-70ab-da86-5d9d-f19321638315#:~:text=La%20velocidad%20del%20vapor%20m%C3%A1xima%20aceptable%20es%20de%2025%20m%2Fs (accessed on 5 December 2022). (In Spanish).
  63. Institute for Energy Diversification and Saving of the Government of Spain (IDAE). Renewable Energies Plan 2011–2020. 2011. Available online: https://www.idae.es/uploads/documentos/documentos_11227_PER_2011-2020_def_93c624ab.pdf (accessed on 5 December 2022). (In Spanish).
  64. Stamford, A.v.K. DIG156 Alternator. Available online: https://www.stamford-avk.com/es/alternators/avk/dig156 (accessed on 5 December 2022). (In Spanish).
  65. International Renewable Energy Agency (IRENA). Renewable Power Generation Costs in 2021. 2022. Available online: https://www.irena.org/-/media/Files/IRENA/Agency/Publication/2022/Jul/IRENA_Power_Generation_Costs_2021.pdf?rev=34c22a4b244d434da0accde7de7c73d8 (accessed on 5 December 2022).
Figure 1. Method developed in the present study.
Jmse 11 00353 g001
Figure 2. (a) Location of Gran Canaria and the geothermal resources; (b) relative location of the desalination plant and renewable facilities.
Jmse 11 00353 g002
Figure 3. Geothermal system flow diagram.
Jmse 11 00353 g003
Figure 4. Principle schematic for sizing of the P-101 pump.
Jmse 11 00353 g004
Figure 5. Enthalpy drop across the turbine and thermal efficiency of the cycle for pentane, butane, and isopentane.
Jmse 11 00353 g005
Figure 6. (a) T-s diagram of the ORC using pentane as the working fluid; (b) P-h diagram of the ORC using pentane as the working fluid. Numbers 1 to 5 visualise the thermodynamic states of the the working fluid.
Jmse 11 00353 g006
Figure 7. T-Q diagram of heat exchangers E-101 and E-102. Letters a, b, c, and numbers 1, 4, 5 visualise the thermodynamic states of the geothermal fluid and the working fluid, respectively.
Jmse 11 00353 g007
Figure 8. (a) Energy balance of the system on a typical winter day; (b) energy balance of the system on a typical summer day. The green area corresponds to energy surplus when renewable generation exceeds electricity demand, and to energy deficit in the opposite case.
Jmse 11 00353 g008
Figure 9. LCOE of the diversified renewable generation system for a typical winter and summer day.
Jmse 11 00353 g009
Table 1. Energy balance equations of the main equipment of the ORC.
EquipmentEnergy Balance EquationEquation
E-101   m ˙ geo · cp geo · ( T b T c ) =   m ˙ wf · ( h 5 h 4 ) (8)
E-102   m ˙ geo · cp geo · ( T a T b ) =   m ˙ wf · ( h 1 h 5 ) (9)
ST-101 W ˙ 1 2 =   m ˙ wf · ( h 1 h 2 ) (10)
E-103   m ˙ wf · ( h 2 h 3 ) =   m ˙ 8 · cp H 2 O · ( T 8 f T 8 i ) (11)
P-104 W ˙ 3 4 =   m ˙ wf · ( h 4 h 3 ) (12)
Table 2. Air mass balance (Equation (15)), water mass balance (Equation (16)), and energy balance (Equation (17)) in the T-101 A/B cooling tower.
Mass or Energy Balance Equation Equation
  m ˙ a 9 =   m ˙ a 10 =   m ˙ a (15)
  m ˙ 8 +   m ˙ a · ω 9 =   m ˙ 7 +   m ˙ a · ω 10 (16)
  m ˙ 8 · h 8 f + ( m ˙ a 9 + m ˙ v 9 ) · h 9 = m 7 ˙ · h 7 + ( m ˙ a 10 + m ˙ v 10 ) · h 10 (17)
Table 3. Mean wind speed (in m/s).
Height (m agl)206080
January4.485.035.19
February5.445.986.13
March4.875.395.53
April8.418.878.99
May8.709.139.25
June8.939.349.46
July10.9411.2511.33
August10.0010.4010.51
September8.659.129.25
October4.925.445.58
November6.356.846.97
December4.545.095.24
Table 4. Geographic coordinates of the sites of the two photovoltaic plants.
Photovoltaic PlantUTMXUTMY
PV-1458,042.73,076,671.3
PV-2460,035.63,080,652.4
Table 5. Mean solar irradiance at PV-1 (in W/m2) [52].
Month7 h8 h9 h10 h11 h12 h13 h14 h15 h16 h17 h18 h19 h
January023255458624749779761654496285440
February0752975056908138598407455733611330
March01593896158099019529227996194061781
April4224147068285294896490380062842019314
May8327850170387195296191480263242621034
June8828048769485395096191981765044623553
July70259474686851965100096186068947325064
August46237461681850964100095984467145322235
September252254556728339439528757675773631401
October1205421633787870871794659478265470
November013233954369379181874060242820900
December05827848063173776572761743622200
Table 6. Mean solar irradiance at PV-2 (in W/m2) [52].
Month7 h8 h9 h10 h11 h12 h13 h14 h15 h16 h17 h18 h19 h
January021254459621739761749640490283410
February0732985036827988388177215623541310
March01593886107968749248817746074011751
April4224246767583691993388277761341119314
May8428050269384692994188978962542320834
June8828049069184894296091881065244823553
July70260478685854964100096486269147825264
August46239466681848966100095985067345522335
September262254516698219209338617595743611411
October1206422624778847848762641469261460
November013034153068476880072359142320700
December05628047863073276471259842822000
Table 7. Mean hourly desalination plant energy demand on a typical winter and summer day (in kW).
Period0 h1 h2 h3 h4 h5 h6 h7 h8 h9 h10 h11 h
Winter9028.39028.39028.39028.39028.39028.39028.39028.35097.05097.02130.02130.0
Summer9299.39299.39299.39299.39299.39299.39299.39299.36140.06140.02286.42286.4
Period12 h13 h14 h15 h16 h17 h18 h19 h20 h21 h22 h23 h
Winter2130.02130.02130.05097.05097.05097.02130.02130.02130.02130.05097.05097.0
Summer2286.42286.42286.46140.06140.06140.02286.42286.42286.42286.46140.06140.0
Table 8. Thermodynamic states of pentane in the ORC.
StateT (°C)P (bar)h (kJ/kg)s (kJ/kg·°C)
195.005.27590.191.76
252.230.69526.551.79
325.000.69114.410.42
425.205.27115.340.42
595.005.27287.900.94
Table 9. Psychrometric properties of the air at the cooling tower’s inlet and outlet.
ParameterState 9State 10
TDB20.4834.00
RH67.3395.00
TWB16.4933.24
ω   0.01010.033
h46.30117.92
v 0.840.92
Table 10. Indicators and energy ratios of the renewable generation system with and without geothermal plant integration.
Energy IndicatorWithout Geothermal EnergyWith Geothermal Energy
Self-consumed energy (MWh/year)20,771.4339,029.69
Energy surplus (MWh/year)10,066.8813,451.81
Energy deficit (MWh/year)28,663.7110,405.45
DSC67.4%74.4%
DSD42%79%
SER32.6%25.6%
Table 11. LCOE (EUR/MWh) for each renewable generation technology.
Geothermal PlantWind FarmPhotovoltaic Plants
85.1738.1932.77
Disclaimer/Publisher’s Note: The statements, opinions and data contained in all publications are solely those of the individual author(s) and contributor(s) and not of MDPI and/or the editor(s). MDPI and/or the editor(s) disclaim responsibility for any injury to people or property resulting from any ideas, methods, instructions or products referred to in the content.

