Abstract
In the context of the increasing frequency and intensity of natural disasters, assessing the risk of typhoon disasters can provide significant assistance for risk control and emergency management of typhoon disasters. In this paper, based on the three-dimensional information diffusion method, the formal expected loss model is transformed into a computable typhoon risk assessment model. The fuzzy information in the small sample data is deeply mined, and the typhoon disaster risk assessment with the expected loss as the connotation is carried out, and the probability density distribution estimation of disaster-causing factors at different levels and the functional relationship identification between disaster-causing factors at different levels and direct economic loss rate are realized by using the information matrix. At the same time, combined with the frequency of typhoon occurrence, the annual risk of disasters is predicted to make up for the problem of insufficient marine environmental data and improve the calculation accuracy of risk assessment models. Taking Guangdong Province as an example, a typhoon risk assessment was conducted, estimating the probability distribution, direct economic loss rate distribution, and annual loss expectation of typhoon disasters under different wind speed scales and extreme wave heights. The results indicate that the risk estimation value of the three-dimensional information diffusion model is higher than that of the traditional model, which weakens the limitations of the low-dimensional information diffusion model and makes the evaluation results more reasonable and reliable.
1. Introduction
Typhoon disaster is one of the main disasters in coastal areas, and its high frequency, suddenness, wide range of influence and intensity of disaster [1,2,3,4,5,6] have brought great losses to the development of marine resources and the economic and social development of coastal areas. Additionally, in the climate context of global warming and sea level rise [7,8,9,10,11], the frequency of typhoons has climbed year by year, causing the life property damage is increasing year by year, and the threat to society and economy is becoming more and more serious. For example, in July 2021, the severe Typhoon In-Fa was affected by typhoons such as “Cempaka” and “Nepartak”, which were active at the same time and influenced each other, causing a total of 4.82 million people across China. Zhengzhou was the scene of a rare extreme and continuous heavy rainfall disaster triggered by “In-Fa”, which caused economic losses of more than 65.5 billion RMB (Ren Min Bi) in just one disaster. With the continuous growth of urban population and economy, the risk level of typhoon disasters has further increased. Therefore, it is important to strengthen typhoon disaster risk management and disaster prevention and mitigation by fully considering the relationship between the risk of each disaster-causing factor and the vulnerability of the disaster-bearing body, making scientific and reasonable quantitative calculations to realize typhoon disaster risk assessment with expected losses in a small sample.
The key to typhoon hazard risk assessment is to find the conditions of typhoon risk change, and the ocean environment is harsh, and the sample data are insufficient, so it is important to accurately quantify the typhoon hazard risk while making full use of the incomplete information in the small sample data for typhoon hazard risk assessment [12,13]. In order to make a reasonable assessment of the risk of the causative factors of typhoon hazards, methods such as the index system evaluation method, weighted comprehensive evaluation method, and fuzzy mathematical method have been applied to risk assessment [14,15,16]. Based on the natural risk index method and the weighted comprehensive evaluation method, Chen et al. [17] constructed a risk evaluation system for typhoon hazards in eastern Guangdong and used GIS technology for regional classification of hazard levels to provide a scientific basis for formulating planning strategies for typhoon hazards in eastern Guangdong. Wang et al. [18] used AHP hierarchical analysis and GIS technology to establish an evaluation model with subsystems of typhoon-caused disasters, social disaster prevention and mitigation, and natural disaster-bearing and conducted a disaster risk assessment and disaster rating analysis for major coastal cities in China that experienced severe typhoon disasters. Zhao et al. [19] used hierarchical analysis to construct a three-level evaluation index system of population, economy, and infrastructure from the perspective of disaster-bearing bodies. They explored the socio-economic sensitivity and spatial and temporal distribution patterns of typhoon disasters in Zhejiang Province. Based on the formation mechanism of natural disaster risk, Shang et al. [20] established an evaluation index system by considering 10 indicators in three aspects, including the sensitivity of the disaster-emitting field, the hazard of the disaster-causing force, and the exposure of the disaster-bearing body, and used the mutation level method to construct an evaluation model. The above models are devoted to using multiple factors and evaluation indicators to analyze the risk of typhoon disaster factors and the vulnerability of disaster-bearing bodies, and then use the evaluation system to study typhoon risk losses. The evaluation of typhoon loss amount is mostly semi-qualitative and semi-quantitative, but there is insufficient research on the specific loss amount, and the evaluation results are highly subjective. Liu et al. [21] used the information diffusion principle to assess the risk of multiple natural hazards in the Yangtze River Delta assessment, the transcendent probability distribution of risk to human life from multiple hazards, and the method was able to use a relatively small amount of data for multi-hazard risk assessment. Based on the stochastic process, Huang et al. [22] used a two-dimensional normal information diffusion method to fuzzy infer typhoon disaster loss values and improved the sample function of the stochastic process of typhoon disaster to further estimate the annual risk of typhoon disaster, and concluded that estimating typhoon risk with a probability distribution model could improve the estimation accuracy. Therefore, using the probability distribution model to realize the quantitative calculation of typhoon risk and solve the problem of insufficient information of small sample data caused by the lack of information data is important to improve the accuracy of typhoon disaster risk assessment.
The probability distribution model risk assessment of typhoon disaster is based on historical disaster information and quantitative expression of typhoon disaster risk using the expected value of losses to characterize the vulnerability function relationship between different levels of disaster-causing factors and disaster losses of typhoons. The information diffusion method generates an information matrix by converting independent sample points into a fuzzy set, which can effectively identify the causal function relationship between the causal factors and disaster losses and has been widely used in the risk analysis of fire [23], drought [24], flood [25], soil erosion [26], and other disasters. Liu et al. [27] estimated the annual disaster loss expectations of several vulnerability indicators of typhoon disasters in Guangdong Province based on a two-dimensional normal information diffusion method, and the results showed that the information diffusion method greatly improved the efficiency of using incomplete information of small samples. Liu et al. [28] established a super-probability assessment model for extreme typhoon disasters in South China based on the information diffusion method and realized the risk assessment of extreme typhoon disasters in South China with a small sample by considering the factors of the disaster-bearing body, and their results showed the superiority of the method. Yu et al. [29] and others used a risk assessment model based on information diffusion theory to assess the risk of typhoons along the southeastern coast of China based on the area of typhoon damage, damage, and loss during the period 2001–2015. The above studies introduced the information diffusion method into the risk assessment to effectively improve the accuracy of the assessment and solve the problem of low accuracy of the model calculation results in the case of small samples, and the calculation results are more reasonable. Due to the limitation of data, the previous studies only focus on single causative factors, such as the frequency of typhoons in the study area and the maximum wind level of typhoon landing, etc. The studies on multiple causative factors are less involved and cannot provide a more accurate description of the vulnerability of the disaster-bearing body. Therefore, considering the combined effect of multiple disaster-causing factors and quantifying the typhoon losses under different levels of disaster-causing factors, the multidimensional information diffusion method can be applied to typhoon disaster risk assessment to make the calculation results more reasonable.
Based on the above analysis, this paper proposes a multi-causal factor typhoon risk assessment model based on the information diffusion theory, which can make full use of the fuzzy information in small sample data to improve the calculation accuracy. At the same time, combine multiple causal factors of typhoon occurrence to estimate the probability density distribution under different risk source causal factors and identify the typhoon vulnerability function, to realize the multi-causal factor risk assessment model with expected losses in the small sample. In the second part of this paper, a normal information diffusion model is constructed to estimate the probability distribution of typhoon hazards under different wind speed scales and extreme wave heights. A three-dimensional information diffusion model is used to estimate the distribution of direct economic loss rate of typhoon hazard under the combined effect of maximum wind speed scale and extreme wave heights. Additionally, the risk of typhoon hazard loss under different levels of risk-causing factors is obtained by multiplicative risk coupling. The third part uses the data of 19 typhoons affecting Guangdong Province from 2005–2016 to conduct an example analysis of risk assessment of typhoon disasters under different wind speed scales and extreme wave heights. The fourth part makes an analysis and conclusion of the research in this paper.
2. Theoretical Model
2.1. Construction of Probability Distribution of Disaster-Causing Factors of Risk Sources
The hazard of typhoons lies in gales, heavy rain, huge waves, and storm surge. The severe gale and storm waves will lead to the failure of urban protective works, so the maximum wind speed scale and extreme wave height at typhoon landfall is selected as the representative disaster-causing factors in this paper. To make full use of the ambiguous information in the incomplete information of the measured small sample data, the normal information diffusion method is used to generate a two-dimensional information matrix, which acts similar to a probability histogram but estimates the two-dimensional probability density distribution more accurately than a histogram, so that the probability density function can be better estimated with fewer sample points.
Suppose the sample observations of maximum wind speed scale (rounded according to the National Standard of “Wind Class”) and extreme wave height are , and the value interval [], [] is determined according to the capacity of the sample set and the maximum and minimum values of the elements. Then, choose appropriately small step size and to obtain the set of all taken values (theoretical domain), and generate the theoretical domain corresponding to the maximum wind speed scale and extreme wave height , .
Let be the two-dimensional diffusion function of the sample set X and Y on U × V. Based on the information diffusion theory, the elements in X and Y are subjected to two-dimensional normal information diffusion at U × V as follows:
where is the information content of the sample point observations on U × V. The diffusion coefficients are solved [30,31,32,33] as
where and are the minimum and maximum values in the sample set X, respectively.
Let:
is the total information of the sample observations () on U × V.
From Equation (4), the total amount of information over U × V for all sample observations can be obtained.
Further from Equation (5), the discrete probability distribution estimates of the probability distributions of and at and .
The probability distribution matrices for different maximum wind speed scale and extreme wave heights at × , can be obtained as
With the help of the information matrix, not only the joint probability distribution of maximum wind speed scale and extreme wave height can be estimated at discrete points, but also the general causal function relationship can be identified at discrete points as a way to identify the vulnerability function relationship of maximum wind speed scale-wave height and direct economic loss rate.
2.2. Typhoon Vulnerability Function Estimation
Vulnerability represents the ability of the disaster-bearing body to cope with damage, and its core is the vulnerability of the disaster-bearing body system, and the research focuses on identifying the relationship of “risk source intensity—damage degree of the bearing body”, i.e., the vulnerability function. Based on the function of information matrix, the vulnerability function of discrete maximum wind speed scale-wave height and direct economic loss rate is generated by the following information matrix.
The maximum wind speed scale , extreme wave height and the corresponding disaster loss rate values are compiled from the collected disaster information to form a sample set :
Determine the maximum-minimum value taking interval of , , and . Select appropriately small step sizes , , and to generate discrete theoretical domains of , , and , denoted by , , and , respectively:
The information carried by each sample point in S was assigned to in the point sets , , and W by the amount using the normal information diffusion formula [30]. Using the law of normal distribution, the points of the sample set are spread over the input and output domains , , and W:
where is the information of the sample point observations on × × . The diffusion coefficients are solved as Equation (2).
Then, let:
The original information matrix of the sample set on × × is obtained as shown in Equation (13), after which it is normalized in columns to obtain the fuzzy relationship matrix as in Equation (14). Using the fuzzy inference model, the output is obtained from the input , which leads to the vulnerability function (Equation (18)).
The inputs of the samples in this paper are the sample observations of the maximum wind speed scale and extreme wave height at two-dimensional points , and the input set is fuzzified according to the one-dimensional normal information diffusion formula shown in Equations (15) and (16) before fuzzy inference.
where , . According to and , the fuzzy output set of the direct economic loss rate on W is obtained using the fuzzy approximate inference Formula (17):
Using the center of gravity method again, the fuzzy set is transformed into the fuzzy value (direct economic loss rate value) as shown in Equation (18):
Under the small sample condition, can better reflect the causal relationship between the maximum wind speed scale-extreme wave height and the direct economic loss rate in Equation (7) , which is a vulnerability function with high accuracy.
By using the information diffusion method, we only need to determine the sample value interval, choose an appropriately small step size, and substitute the original sample data into the sequential calculation to obtain the estimated value of the direct economic loss rate as follows (The detailed process is shown in Figure 1).
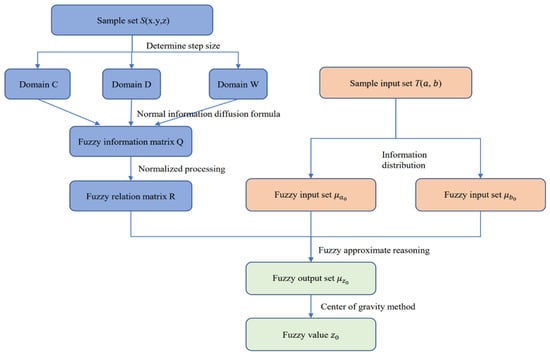
Figure 1.
Maximum wind speed scale—extreme wave height—direct economic loss rate three-dimensional information diffusion method process.
2.3. Risk Assessment Model
The probabilistic risk analysis method uses a probability distribution function to characterize the intensity of the risk source, a vulnerability function to describe the vulnerability of the risk bearer and a loss expectation as a measure of risk. A typhoon risk assessment model that comprehensively portrays the integrated role of risk sources and risk bearers should completely contain three basic elements: time, space, and level values (risk metric values that indicate risk magnitude, level, etc.). Therefore, for typhoon risk assessment models, corresponding time elements must be added to eliminate systematic errors. In this paper, we adopt the modified method of Guo et al. [34], add corresponding time elements to the risk assessment model to eliminate the systematic error, combine the frequency of typhoon occurrence, and construct the typhoon disaster risk assessment model with expected loss as the connotation. Additionally, the modified typhoon risk assessment model is as follows:
where is the frequency of typhoons occurring in the study area in one year; and are typhoon disaster-causing factors; is the probability distribution of typhoon disaster-causing factors; and is the vulnerability function of typhoon disaster-causing factors.
In this paper, a multi-hazard-causing factor typhoon risk assessment model with expected loss as the implication is constructed based on the three-dimensional information diffusion method, and its model structure is shown in Figure 2.
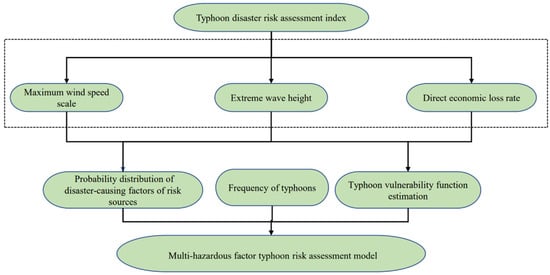
Figure 2.
Multi-hazardous factor typhoon risk assessment model structure.
3. Engineering Calculation Example
3.1. Data Source
Guangdong Province is bordered by the South China Sea and has 3368 km of coastline, which is ranked first in China. This paper takes Guangdong Province as the study area (Figure 3) and uses information diffusion technology to carry out the risk assessment of typhoon disasters in this study area, and the data collected and used are mainly wind and wave data, typhoon data, and basic situation data of the research area, and the wind and wave data and typhoon data come from the typhoon statistics set of Scammon Island and Scammon Ocean Observatory, respectively. In addition, this paper finds information from the China Marine Disaster Bulletin, Guangdong Provincial Marine Disaster Bulletin, and China Meteorological Disaster Yearbook in the past years and statistics of 19 typhoons’ disaster data in the middle of 2005–2016. Additionally, considering factors such as population growth and inflation, data such as resident population and GDP of Guangdong Province in the past years were collected (from the website of National Bureau of Statistics www.stata.gov.cn (e.g., accessed on 23 July 2022)), see Figure 4.
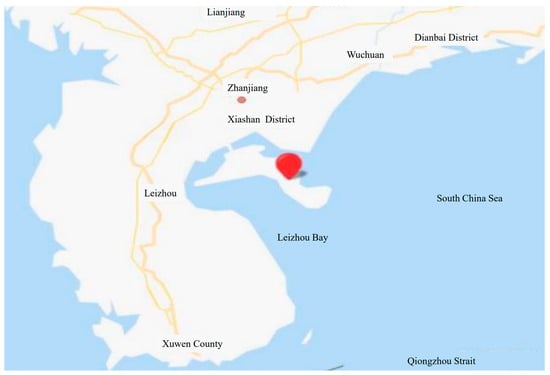
Figure 3.
Study area location.
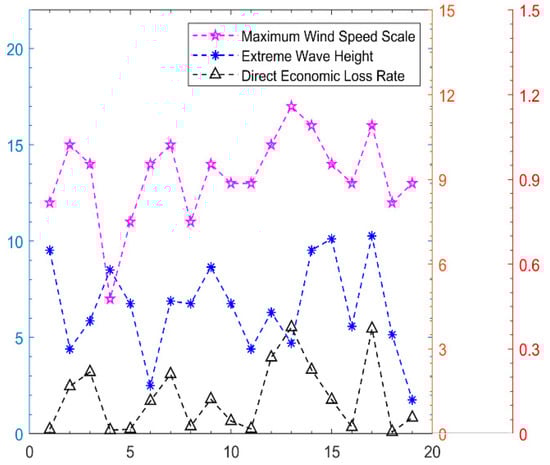
Figure 4.
Typhoon disaster data.
Based on the collected relevant typhoon and wind wave data, from which the maximum wind speed scale and its accompanying extreme wave height were selected as samples, the information shows that the maximum wind speed scale at landfall of typhoons affecting Guangdong Province during 2005–2016 ranged from 7 to 17 values. The extreme wave height ranged from 1.2 to 7.0 m. The K-S test was used to statistically test the samples. The specific calculation results are shown in Table 1.

Table 1.
K-S test results of maximum wind speed scale and extreme wave height.
From the calculation results in Table 1, we can see that: the significance probability p-values of extreme wave height and maximum wind speed scale using the K-S test are 0.1279 and 0.1632, which are greater than the significance level of 0.05, respectively. Additionally, each sample data passed the hypothesis test, so it can be considered that the typhoon data samples obeyed the normal distribution law during 2005–2016, which provides a theoretical basis for the following estimation based on the two-dimensional information diffusion model. This provides a theoretical basis for the following estimation of the probability distribution based on the two-dimensional information diffusion model and the estimation of typhoon losses based on the three-dimensional information diffusion model.
3.2. Model Calculation
3.2.1. Estimation of Probability Distribution
The sample data of 19 typhoons in Guangdong Province during 2005–2016 were selected, and the maximum landfall wind speed scale and extreme wave height were noted as
In the above sample data, the minimum value of landing maximum wind speed scale is 7 and the maximum value is 17, and the minimum value of wave height extreme value is 1.2 m and the maximum value is 7.0 m. Based on its maximum and minimum values, the discrete domain can be constructed as [5.5, 17.5], [1, 7.6], respectively, at this time, the step of landing maximum wind speed scale is 0.5 and the step of extreme wave height is 0.275. The control points are all 25, then their discrete theoretical domains are as follows
The calculated diffusion coefficients and are 1.4919 and 0.8652, respectively, and the probability distributions of landing maximum wind speed scale and extreme wave height are obtained from Equations (1)–(5) of the two-dimensional information diffusion model as shown in Figure 5 and Table 2.
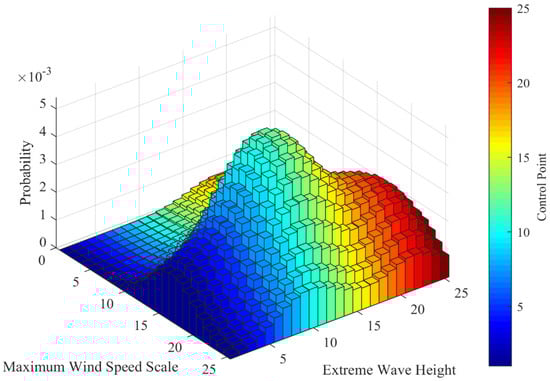
Figure 5.
Probability density distribution of disaster—causing factors at different levels.
Table 2.
Probability distribution of maximum wind speed scale and extreme wave height.
From Table 2 and Figure 5, it can be seen that the typhoon has the highest probability of occurrence when the maximum wind speed is 13 and the extreme wave height is 4.3 m, followed by typhoons with a maximum wind speed of 12 and 14. The probability of occurrence of different maximum wind speeds and extreme wave height varies, with the overall change pattern increasing and then decreasing, and the overall probability value decreases as the intensity of typhoon risk sources increases later. However, the probability of occurrence of each risk factor of typhoons cannot be used as a measure of risk, for example, the probability values of severe typhoons “Kai Tak” and “Rumbia” are large, but the direct economic loss rate is only 0.0449% and 0.0170%, so it is obviously unreasonable to take the probability value of the disaster factor as the measure of risk.
3.2.2. Estimation of Typhoon Disaster Losses at Different Levels of Risk-Causing Factors
Since the risk of the same direct loss is different for different regions and years, it is obviously unreasonable to compare the risk size by direct economic loss alone. As the output sample and collate the typhoon data to obtain the sample set .
The domain steps of x, y, z are chosen as 0.5, 0.275 and 0.0175, respectively, and the theoretical domains ,, and of x, y, z are constructed as follows:
The diffusion coefficients , are calculated as 1.4919, 0.8652, and 0.0553, respectively using Equation (2), which are processed using the three-dimensional normal information diffusion formula of Equation (13) and then superimposed using Equation (13) to generate the original three-dimensional information matrix Q of x, y, z:
After that, fuzzy relation inference is performed using Equation (14) to obtain the fuzzy relation matrix R of x, y, z.
Using the one-dimensional information distribution formula shown in Equations (15) and (16), the maximum wind speed scale x and extreme wave height y of typhoon landfall are fuzzified, and according to the definition of the theoretical domain, the fuzzy sets = “typhoon maximum wind speed scale is 14” and = “typhoon extreme wave height is 7.6 m” can be expressed as follows.
Fuzzy approximation reasoning using Equation (17) yields the following affiliation values for the loss set z with respect to the element c in the thesis domain W:
Similarly, the affiliation degrees of all elements in W can be calculated so that the fuzzy output set of direct economic loss can be obtained by fuzzy approximate inference from the above values , and R:
The center of gravity method shown in Equation (18) for is non-fuzzy to obtain its disambiguation value .
After defuzzifying the output fuzzy set , the fuzzy value of the output is obtained. The direct economic loss rate is estimated to be 0.2157% for the “maximum wind speed scale of 14 and extreme wave height of 7.6 m”. The direct economic loss values can be obtained for all control points in the same way (due to a large number of control points, it is not appropriate to list them all, the table only indicates the values at typical control points, the same below). The information diffusion calculation results are shown in Table 3 and Figure 5.
Table 3.
Calculation results of direct economic loss rate under different wind speed scales and extreme wave heights.
From Table 3 and Figure 6, we can see the estimated values of losses for different wind speed scales and extreme wave heights, and compare with the historical data, the above-inferred values of direct economic loss rate corresponding to different maximum wind speed scale and extreme wave heights of typhoons are basically accurate. For example, the maximum wind speed scale of typhoon “Hagupit” was 15, the extreme wave height was 4.7 m, and the direct economic loss rate was 0.2109%, which was approximated by the three-dimensional information diffusion method to be 0.2167%.
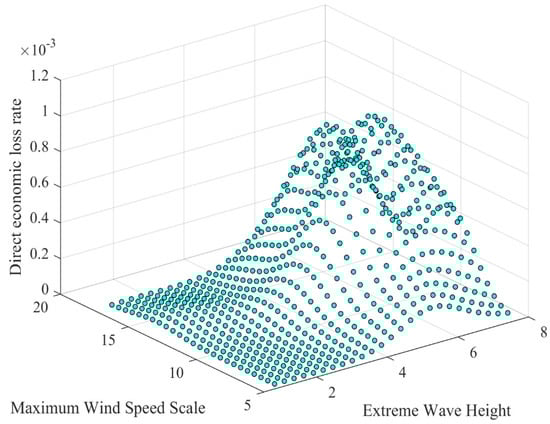
Figure 6.
Calculation results of direct economic loss rate.
Meanwhile, the conditional probability distribution of the extreme wave height is calculated based on the existing probability distribution of the maximum wind speed scale-extreme wave height (Table 2). For example, when the maximum wind speed scale is 12, the probability values of different extreme wave heights are summed by . Then the conditional distribution columns of different extreme wave heights are obtained by dividing each probability value by S, respectively (see Table 4). Additionally, the direct economic loss rates under different wind speed scales are obtained by using the risk synthesis rule (risk = probability × loss) according to Table 3 and Table 4 (see Table 5).
Table 4.
Conditional probability distribution based on maximum wind speed scale.
Table 5.
Estimated direct economic loss rate under different wind speed scale conditions.
Comparing the three-dimensional information diffusion model based on conditional probability with the inference results of direct economic loss rate based on the two-dimensional information diffusion model (Figure 7), when the wind speed scale is greater than 10, the slope of the vulnerability curve increases continuously. The direct economic loss rate increases significantly, showing an overall upward trend, which aligns with the cognitive law that the loss increases with the disaster level, reflecting the rationality of the information diffusion method. When the maximum wind speed scale is greater than 12, the projected value based on the 3D information diffusion model is slightly larger than that of the 2D information diffusion model, while when the maximum wind speed scale is greater than 12, the projected value is slightly smaller than that of the latter, analyzing this reason, because the model in this paper takes into account the influence of the extreme wave height, the extreme wave height corresponding to the sample data below level 12 is small. In contrast, the extreme wave height corresponding to the high wind speed scale typhoon is high, so the projected result shows the accuracy and stability of the 3-D information diffusion model and the necessity of considering other factors such as extreme wave height.
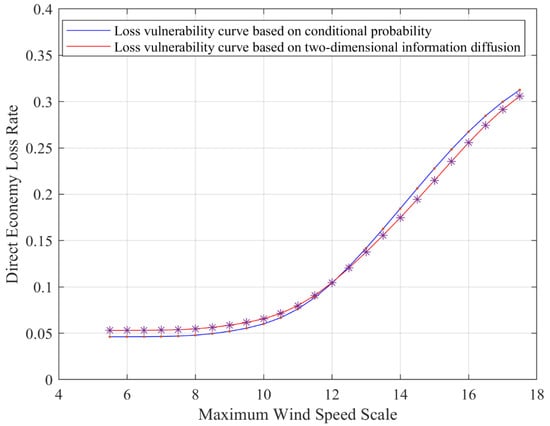
Figure 7.
Direct economic loss rate at different wind speed scale.
The advantages of the 3D information diffusion model are further analyzed, and the results of the 2D and 3D information diffusion approximations are compared in Table 6 (the 2D information diffusion model only considers the maximum wind speed scale).
Table 6.
Inference results of two-dimensional and three-dimensional information diffusion.
As can be seen from Table 6, the two-dimensional information diffusion model only considers the maximum wind speed scale, so the inferred values of direct economic loss rates for the same wind speed scale are the same, while the three-dimensional information diffusion model has different results due to the consideration of the extreme wave height factor. The actual typhoon data show that the maximum wind speed at landfall is the same, but the direct economic loss rate is not the same, such as Typhoon 0601 “Chanchu” and Typhoon 0814 “Hagupit”, which maximum wind speed scale at landfall is 15, and the direct economic loss rate is 0.1677% and 0.2109%, respectively, and the two-dimensional information diffusion approximation is 0.2314%, while the three-dimensional information diffusion approximation is 0.2119% and 0.2167%, which is closer to the real value. Therefore, the estimation results of the 3D information diffusion model are more accurate and closer to the true values than the 2D information diffusion model when estimating the losses of typhoon disasters, which reflects the necessity of considering multiple contributing factors for typhoon disaster risk assessment.
3.2.3. Typhoon Risk Coupling
Since the probability distributions of typhoon maximum wind speed scale and extreme wave height and the vulnerability function of typhoon maximum wind speed scale-extreme wave height-direct economic loss rate obtained by 3D information diffusion are discrete distributions, the integral calculation form of the risk model is applied:
The average annual frequency of typhoons from 2005–2016 = 1.58, then the expected value of losses from the typhoon risk assessment model based on the update time factor under the conditions of maximum wind speed scale and extreme wave height is = 0.2542%.
The arithmetic mean of the calculated direct economic loss rate is 0.1273%, which is lower than the expected value calculated using the information diffusion technique because the calculation of the mean value considers the probability of occurrence of each loss value to be equal. While the probability density histogram shows that the probability of occurrence of each class of typhoon is different, and the nonlinearity of wind speed scale and extreme wave height sway the degree of loss, so the risk value of the disaster is not equal to the arithmetic mean.
The mean value of annual risk for typhoons is R′ = 0.2011%.
The comparison of the annual disaster loss expectation and mean value of the vulnerability indicator (direct economic loss rate) using the information diffusion method is shown in Table 7.
Table 7.
Inferred values of annual loss expectations and their arithmetic mean for typhoon hazards.
From the above table, it is easy to see that the inferred values of expected losses of annual typhoon disasters based on the information diffusion method are all greater than the arithmetic mean. The inferred values of the direct economic loss rate using the two-dimensional information diffusion model are 12.53% higher than the arithmetic mean. The inferred values of the three-dimensional information diffusion model are 26.40% higher than the arithmetic mean and 12.33% higher than the inferred values of the two-dimensional information diffusion model, which shows that using the mean value as the risk degree of the typhoon will lead to low evaluation results. In addition, it is similar to the expected 0.26% of direct economic loss rate of the coastal cities of south-central Guangdong calculated in the paper [35]. Additionally, it also shows that it is more reasonable to use the expected loss as the quantitative index of risk.
4. Conclusions
In this paper, a typhoon disaster loss risk assessment model with expected loss as the connotation was constructed based on the three-dimensional information diffusion method, and the following conclusions were obtained for the risk assessment of typhoon disasters with typhoon samples in Guangdong Province from 2005 to 2016:
- (1)
- This paper transforms the formal expected loss model into a computable typhoon risk model based on the three-dimensional information diffusion method. It obtains the typhoon probability distribution and direct economic loss rate distribution under different wind speed scales and extreme wave heights. Additionally, the results are basically consistent with reality, which can provide a reference for the practical application of worldwide typhoon disaster risk assessment engineering.
- (2)
- The maximum wind speed scale and extreme wave height of the typhoon at landfall are considered, which reduces the limitation of risk assessment by a single uniform disaster factor and improves the efficiency of using small sample data. For example, the estimated direct economic loss rate of Typhoon Hagupit “0814” is 0.2167%, which is closer to the real value of 0.2109%.
- (3)
- The risk value of the multi-causal factor typhoon risk assessment model with expected loss is slightly higher than the traditional model, and the annual expected loss risk value is 12.33% higher than that of the traditional model, which reduces the limitations of the low-dimensional information diffusion model and makes the evaluation results more reasonable and reliable.
Author Contributions
Conceptualization, G.L.; methodology, L.W. and G.L.; software, Y.T.; validation, G.L. and Y.X.; formal analysis, S.S.; investigation, J.Y.; resources, Y.X. and S.S.; data curation, Y.T. and W.Y.; writing—original draft preparation, W.Y.; writing—review and editing, J.Y.; visualization, Y.X.; supervision, L.W.; project administration, Y.X.; funding acquisition, G.L. All authors have read and agreed to the published version of the manuscript.
Funding
This research was funded by the National Natural Science Foundation of China (No. 52071306), the Natural Science Foundation of Shandong Province (No. ZR2019MEE050), which the authors show their gratitude.
Institutional Review Board Statement
Not applicable.
Informed Consent Statement
Not applicable.
Data Availability Statement
Not applicable.
Conflicts of Interest
The authors declare no conflict of interest.
References
- Xiang, C.Y.; Gao, S.Z.; Liu, D. Overview of typhoon activity in the Northwest Pacific and South China Sea in 2021. J. Mar. Meteorol. 2022, 42, 39–49. [Google Scholar] [CrossRef]
- Liu, G.; Chen, B.; Gao, Z.; Fu, H.; Jiang, S.; Wang, L.; Yi, K. Calculation of Joint Return Period for Connected Edge Data. Water 2019, 11, 300. [Google Scholar] [CrossRef]
- Liu, G.; Chen, B.; Jiang, S.; Fu, H.; Wang, L.; Jiang, W. Double Entropy Joint Distribution Function and its Application in Calculation of Design Wave Height. Entropy 2019, 21, 64. [Google Scholar] [CrossRef] [PubMed]
- Liu, G.; Chen, B.; Wang, L.; Zhang, S.; Zhang, K.; Lei, X. Wave Height Statistical Characteristic Analysis. Limnology 2019, 37, 448–460. [Google Scholar] [CrossRef]
- Xu, J.C.; Ren, Q.W.; Shen, Z.Z. Low strain pile testing based on synchrosqueezing wavelet transformation analysis. J. Vibroeng. 2016, 18, 813–825. [Google Scholar] [CrossRef]
- Chen, B.; Kou, Y.; Wang, Y.; Zhao, D.; Liu, S.; Liu, G.; Wang, L.; Han, X. Analysis of storm surge characteristics based on stochastic process. AIMS Math. 2021, 6, 1177–1190. [Google Scholar] [CrossRef]
- Chen, B.; Kou, Y.; Wu, F.; Wang, L.; Liu, G. Study on evaluation standard of uncertainty of design wave height calculation model. J. Oceanol. Limnol. 2021, 39, 1188–1197. [Google Scholar] [CrossRef]
- Chen, B.Y.; Kou, Y.; Zhao, D.; Wu, F.; Wang, L.P.; Liu, G.L. Maximum Entropy Distribution Function and Uncertainty Evaluation Criteria. China Ocean Eng. 2021, 35, 238–249. [Google Scholar] [CrossRef]
- Zhou, X.; Cai, X.; Zhang, H.; Zhang, Z.; Jin, T.; Chen, H.; Deng, W. Multi-strategy competitive-cooperative co-evolutionary algorithm and its application. Inf. Sci. 2023, 635, 328–344. [Google Scholar] [CrossRef]
- Deng, W.; Xu, J.J.; Gao, X.Z.; Zhao, H.M. An enhanced MSIQDE algorithm with novel multiple strategies for global optimi-za-tion problems. IEEE Trans. Syst. Man Cybern. Syst. 2022, 52, 1578–1587. [Google Scholar] [CrossRef]
- Wang, L.P.; Chen, B.Y.; Chen, C.; Chen, Z.; Liu, G. Application of Linear Mean-Square Estimation in Ocean Engineering. China Ocean Eng. 2016, 30, 149–160. [Google Scholar] [CrossRef]
- Wang, L.P.; Chen, B.; Zhang, J.; Chen, Z. A New Model for Calculating the Design Wave Height in Typhoon-Affected Sea Areas. Nat. Hazards 2013, 67, 129–143. [Google Scholar] [CrossRef]
- Wang, L.; Xu, X.; Liu, G.; Chen, B.; Chen, Z. A New Method to Estimate Wave Height of Specified Return Period. Chin. J. Oceanol. Limnol. 2017, 35, 1002–1009. [Google Scholar] [CrossRef]
- Rakwatin, P.; Sansena, T.; Marjang, N.; Rungsipanich, A. Using Multi-Temporal Remote Sensing Data to Estimate 2011 Flood Area and Volume Over Chao Phraya River Basin, Thailand. Remote Sens. Lett. 2013, 4, 243–250. [Google Scholar] [CrossRef]
- Aye, Z.C.; Jaboyedoff, M.; Derron, M.H. An Interactive Web-GIS Tool for Risk Analysis: A Case Study in the Fella River Basin, Italy. Nat. Hazards Earth Syst. Sci. 2016, 16, 85–101. [Google Scholar] [CrossRef]
- Karbassi, A.R.; Maghrebi, M.; Lak, R.; Noori, R.; Sadrinasab, M. Application of sediment cores in reconstruction of long-term temperature and metal contents at the northern region of the Persian Gulf. Desert 2019, 24, 109–118. [Google Scholar]
- Chen, K.J.; Chen, Y.Y.; Chen, J.J. Assessment and analysis of typhoon hazard risk in the recent 30 years in eastern Guangdong. Soil Water Conserv. Res. 2019, 26, 362–366+372. [Google Scholar] [CrossRef]
- Wang, J.; Yang, Y.J.; Wang, J.; Lv, Y.Y.; Luan, K.F. Typhoon disaster risk assessment of Chinese coastal cities based on the last 20 a historical data. Ocean Forecast. 2021, 38, 24–30. [Google Scholar]
- Zhao, J.T.; Dong, L.; Chu, S.H.; Zhang, H. Socio-economic sensitivity analysis of typhoon disaster--An example of Zhejiang Province. J. Langfang Norm. Coll. (Nat. Sci. Ed.) 2022, 22, 69–72+100. [Google Scholar]
- Shang, Z.H.; Zhou, M.Y.; Liang, Q.S.; Yang, S.H.; Zhang, R.L.; Zheng, K.H. Risk assessment of rice typhoon hazard in Zhanjiang City, Guangdong Province. Disaster Sci. 2021, 36, 85–90. [Google Scholar]
- Liu, B.; Siu, Y.L.; Mitchell, G.; Xu, W. Exceedance probability of multiple natural hazards: Risk assessment in China’s Yangtze River Delta. Nat. Hazards 2013, 69, 2039–2055. [Google Scholar] [CrossRef]
- Huang, C.F. A computer simulation method to evaluate the reliability of typhoon risk models. J. Nat. Hazards 2020, 29, 24–35. [Google Scholar] [CrossRef]
- Liu, X.; Zhang, J.; Cai, W.; Tong, Z. Information diffusion-based spatio-temporal risk analysis of grassland fire disaster in northern China. Knowl.-Based Syst. 2010, 23, 53–60. [Google Scholar] [CrossRef]
- Zhong, L.; Liu, L.; Liu, Y. Natural Disaster Risk Assessment of Grain Production in Dongting Lake Area, China. Agric. Agric. Sci. Procedia 2010, 1, 24–32. [Google Scholar] [CrossRef]
- Wang, J.Y.; Chen, J.J.; Lin, J.; Yang, K.; Ma, Z.G.; Huang, R.C.; Xu, Z.H. Agricultural flood risk assessment in Fujian Province based on information diffusion theory. J. Nat. Resour. 2012, 27, 53–62. [Google Scholar]
- Xu, L.F.; Xu, X.G.; Meng, X.G. Risk assessment of soil erosion in different rainfall scenarios by RUSLE model coupled with Information Diffusion Model: A case study of Bohai Rim, China. Catena 2012, 100, 74–82. [Google Scholar] [CrossRef]
- Liu, G.L.; Li, Y.X.; Li, X.; Han, L.Z. Risk analysis of typhoon disaster in Guangdong Province based on information diffusion technology. J. Saf. Environ. 2021, 21, 1684–1692. [Google Scholar] [CrossRef]
- Liu, H.X.; Lu, Y.J.; Wang, M.L.; Guang, T. Risk assessment of extreme typhoon hazard in South China based on information diffusion technique. J. Trop. Oceanogr. 2020, 39, 31–41. [Google Scholar]
- Yu, S.B.; Yu, H.R.; Ji, C.H.; Lu, Y.Q. Risk assessment of typhoons along the southeast coast based on information diffusion. Disaster Sci. 2019, 34, 73–77. [Google Scholar]
- Huang, C.F. A formal model for dynamic risk analysis of natural hazards. Disaster Sci. 2015, 30, 4–5. [Google Scholar]
- Huang, C.F.; Guo, J.; Ai, F.L.; Wu, T. The basic paradigm of flood hazard risk analysis and its application. J. Nat. Hazards 2013, 22, 11–23. [Google Scholar] [CrossRef]
- Xu, Q.J.; Pan, J.L.; Liu, H.X. Typhoon disaster risk estimation based on three-dimensional information diffusion and stochastic process. J. Nanning Norm. Univ. (Nat. Sci. Ed.) 2020, 37, 54–69. [Google Scholar]
- Huang, C.F. A virtual case of dynamic risk analysis of natural disasters. Disaster Sci. 2015, 30, 1–11. [Google Scholar]
- Guo, J.; Zhao, S.J.; Huang, C.F. Research on systematic error and correction of probabilistic risk of natural disasters. Syst. Eng. Theory Pract. 2017, 37, 523–534. [Google Scholar]
- Shang, Z.H.; Li, X.Y. Typhoon disaster risk assessment in coastal areas of Guangdong Province. J. Lingnan Norm. Univ. 2015, 36, 136–142. [Google Scholar]


Disclaimer/Publisher’s Note: The statements, opinions and data contained in all publications are solely those of the individual author(s) and contributor(s) and not of MDPI and/or the editor(s). MDPI and/or the editor(s) disclaim responsibility for any injury to people or property resulting from any ideas, methods, instructions or products referred to in the content. |
© 2023 by the authors. Licensee MDPI, Basel, Switzerland. This article is an open access article distributed under the terms and conditions of the Creative Commons Attribution (CC BY) license (https://creativecommons.org/licenses/by/4.0/).