Article

Assessing the Impact of the 2004 Indian Ocean Tsunami on South Andaman’s Coastal Shoreline: A Geospatial Analysis of Erosion and Accretion Patterns

1
Centre for Climate Change and Water Research, Suresh Gyan Vihar University, Jaipur 302017, India
2
Department of Geography, School of Environment and Earth Sciences, Central University, Bathinda 151401, Punjab, India
3
Institute for Global Environmental Strategies, Hayama 240-0115, Japan
4
School of Agricultural and Life Sciences, The University of Tokyo, 1-1-1 Yayoi, Tokyo 113-8654, Japan
*
Authors to whom correspondence should be addressed.
J. Mar. Sci. Eng. 2023, 11(6), 1134; https://doi.org/10.3390/jmse11061134
Submission received: 17 April 2023 / Revised: 24 May 2023 / Accepted: 25 May 2023 / Published: 28 May 2023
(This article belongs to the Special Issue Natural and Human Impacts in Coastal Areas)

Abstract

:
The 2004 Indian Ocean earthquake and tsunami significantly impacted the coastal shoreline of the Andaman and Nicobar Islands, causing widespread destruction of infrastructure and ecological damage. This study aims to analyze the short- and long-term shoreline changes in South Andaman, focusing on 2004–2005 (pre- and post-tsunami) and 1990–2023 (to assess periodic changes). Using remote sensing techniques and geospatial tools such as the Digital Shoreline Analysis System (DSAS), shoreline change rates were calculated in four zones, revealing the extent of the tsunami’s impact. During the pre- and post-tsunami periods, the maximum coastal erosion rate was −410.55 m/year, while the maximum accretion was 359.07 m/year in zone A, the island’s east side. For the 1990–2023 period, the most significant coastal shoreline erosion rate was also recorded in zone A, which was recorded at −2.3 m/year. After analyzing the result, it can be seen that the tsunami severely affected the island’s east side. To validate the coastal shoreline measurements, the root mean square error (RMSE) of Landsat-7 and Google Earth was 18.53 m, enabling comparisons of the accuracy of different models on the same dataset. The results demonstrate the extensive impact of the 2004 Indian Ocean Tsunami on South Andaman’s coastal shoreline and the value of analyzing shoreline changes to understand the short- and long-term consequences of such events on coastal ecosystems. This information can inform conservation efforts, management strategies, and disaster response plans to mitigate future damage and allocate resources more efficiently. By better understanding the impact of tsunamis on coastal shorelines, emergency responders, government agencies, and conservationists can develop more effective strategies to protect these fragile ecosystems and the communities that rely on them.

1. Introduction

A tsunami consists of ocean waves caused by a sudden water displacement, typically due to an earthquake, volcanic eruption, or underwater landslide [1]. Meteor impacts and other large-scale disturbances can also generate tsunamis. These waves rank among the most destructive natural hazards affecting coastal areas.
When tsunamis create landfalls with massive amounts of energy, they can destroy structures and reshape coastal geography, geomorphology, and ecosystems [2]. They can cause extensive damage, disrupt human lives, and affect subsistence, infrastructure, and economic activities. The unprecedented devastation of the 2004 Indian Ocean earthquake and tsunami, with a magnitude of 9.3 off the coast of Sumatra, resulted in the deaths of approximately 230,000 people in countries along the Indian Ocean rim [3].
Praveen et al. (2011) [4] simulated the 2004 tsunami along India’s southwest coast and Lakshadweep Islands, finding that numerical simulations aligned reasonably well with observations. Computational modeling studies for the Islands region, such as that of Usha et al. (2009) [5], discovered that these areas are highly vulnerable to tsunami risks. Compared to the western side, the eastern and southern sides of the islands seem to have tremendous potential for damage.
Coastlines are among the most dynamic parts of the Earth’s surface and are highly vulnerable to erosion and accretion caused by natural disasters, such as tsunamis, flooding, cyclones, storm surges, wave action, tidal and wind changes, and sea-level variations [6,7]. The effects of global warming may be felt most prominently in coastal areas. Obtaining shoreline data and understanding the rate of change over time is crucial for monitoring coastal zones.
Shorelines can be subjected to recede (erosion), advance (accretion), and remain stable (no changes) in relation to the mainland. Factors such as coastal elevation, slope, geomorphology, and rising sea levels contribute to varying degrees of shoreline change in different areas [8]. The shoreline, as viewed from a single perspective, represents the transition from land to water, serving as a dynamic indicator of coastal erosion and accretion [9]. Both natural and human-induced disturbances impact the erosion and accretion of ecosystems, causing shoreline changes [10,11,12]. Shorelines change shape and size in response to environmental factors [13].
Over the past four decades, coastal regions have experienced rapid population growth and various forms of development [14]. Coastlines change due to seasonal and long-term weather variations, but development in coastal zones often conflicts with natural shoreline processes. Coastal geomorphology helps to understand the relative erodibility of different landforms and their influences on coastal processes. India’s coastal regions face significant risks, such as erosion and inundation, due to rapid coastal geomorphology changes caused by fluvial influences, sea-level change, tropical cyclones, and storm surges [15].
Shoreline changes occur over various timescales and are typically studied using ground survey techniques or remote sensing interpretations. Ground survey techniques provide high accuracy and detailed information, but are expensive, while remote sensing techniques using high-resolution sensors are more cost-effective [16,17,18,19]. Remote sensing and geographic information systems (GIS) can effectively extract information on potential inundation zones and sea-level rise [20]. GIS-based digital shoreline analysis tools have been employed recently to detect morphological changes in rivers or coastal areas.
The Digital Shoreline Analysis System (DSAS) v5.1, an add-on to the ESRI ArcGIS software, calculates shoreline rate of change statistics from a timeseries of multiple shoreline positions extracted from satellite data [21,22,23]. DSAS is a user-friendly tool for studying shoreline changes using a statistical approach, providing valuable insights into coastal environmental changes [13,24]. Numerous studies have used this tool to examine various coastal regions and riverbanks in India [25,26,27,28,29], describing shoreline changes and their impacts on habitats and coastlines. The Indian shoreline is also subjected to coastal erosion and accretion due to several hydroclimatic events. Around 1144 km of the Indian shoreline has been eroded. The coastal land area lost due to erosion was 36.8 m2; however, the increase in land area due to coastal deposition was 40.42 m2 during the last decade [30]. Natural and anthropogenic activities are both responsible for coastal erosion and accretion. Due to climate change, the sea level is expected to increase, which is vulnerable for coastal regions [31]. The northern Tamil Nadu coasts of India were analyzed to find the impact due to climate change. The maximum accretion rate in these regions was 23.24 m/year, and the maximum erosion rate was −11.15 m/year, from 1990 to 2022 [32].
India’s Andaman and Nicobar Islands (ANI) are vulnerable to earthquakes and subsequent tsunamis, which can result in land uplift, beach erosion, sediment transport, and deposition [33]. Reports have documented subsidence and emergence in the northern and middle Andaman districts within the South Andaman group of Islands [34].
The examination and analysis of coastal zones are crucial for understanding the vulnerability of coastal areas to the depletion of bioresources, sea-level rise, and coastal erosion, as well as predicting the dynamic changes in shoreline trends. Coastal shoreline change detection can help elucidate the coastline’s dynamics and impact on natural and human resources. Detailed studies on coastal shoreline changes in South Andaman following the tsunami are lacking. Thus, the primary goal of this research is to provide comprehensive information on coastal shoreline changes due to the tsunami’s significant impact, using multi-temporal satellite data and geospatial techniques.
South Andaman is an island in the Andaman and Nicobar archipelago in the Bay of Bengal, India, as depicted in Figure 1a. It is the Andaman group’s southernmost and largest island of the Andaman and Nicobar Islands (Figure 1b). The 2004 Indian Ocean earthquake and tsunami affected South Andaman and the entire Andaman and Nicobar Islands, causing widespread destruction, loss of lives, and significant damage to infrastructure and property in South Andaman and the surrounding islands. The tsunami impact was analyzed by dividing the South Andaman coastal areas into four zones, designated A, B, C, and D, as shown in Figure 1c. Landsat images were used to digitize the coastal shoreline pre- and post-tsunami.

2. Materials and Methods

2.1. Coastal Erosion Mapping Using DSAS Tool

The 2004 Indian Ocean tsunami significantly impacted the Andaman and Nicobar Islands, resulting in considerable coastal erosion. To evaluate the degree of coastal erosion following the tsunami, the Digital Shoreline Analysis System (DSAS) v5.1 was employed to examine coastal erosion and shoreline alterations. DSAS v5.1 allows for a quantitative analysis of coastal erosion and accretion, which is crucial for coastal management and planning. The immediate changes were assessed in South Andaman’s coastal shoreline due to the tsunami in four zones: zone A, zone B, zone C, and zone D, as shown in Figure 1c. Additionally, periodic changes in the coastal shoreline were calculated on the east side of a 10 km stretch of South Andaman.
A Geographic Information System (GIS) can determine changes in accretion and erosion along the coastal shoreline by comparing past and present shoreline positions [35]. This study used various multi-temporal Landsat images (TM, ETM+, and OLI) collected between 2003 and 2004 to analyze immediate changes due to the tsunami. For periodic changes from 1990 to 2020, a series of multi-temporal Landsat images (TM, ETM+, and OLI) were employed. Landsat images were utilized to calculate the periodic changes in the coastal shoreline.
This study employed end point rate (EPR) and net shoreline movement (NSM) statistical methods for immediate and periodic shoreline change analysis. The methods EPR, NSM, and SCE (shoreline change envelope) were selected for use in the shoreline erosion studies due to their distinct advantages and applicability in analyzing different aspects of shoreline change. EPR provides a straightforward measure of the overall erosion or accretion rate, NSM allows for the assessment of net shoreline movement over time, considering both erosional and accretional changes, and SCE enables a more detailed examination of localized variations in erosion or accretion rates along the shoreline. Net shoreline movement (NSM) represents the distance between each transects oldest and most recent shorelines, with units in meters. Shoreline change envelope (SCE) measures the distance (in meters) rather than the rate. The SCE value signifies the most significant distance among all shorelines intersecting a given transect, as illustrated in Figure 2. Since the total distance between two shorelines has no sign, the SCE value is always positive.
In the DSAS (v5.1) tool, two different types of calculations can be performed. Shoreline change envelopes (SCE) and net shoreline movement (NSM) are used to calculate the distance change. The end point rate (EPR) is used to calculate the statistics of the rate change per year.
E P R i m m e d i a t e = C o a s t a l   s h o r e l i n e 2004 C o a s t a l   S h o r e l i n e 2005 01   Y e a r s
E P R p e r i o d i c a l = C o a s t a l   s h o r e l i n e 1990 C o a s t a l   S h o r e l i n e 2020 30   Y e a r s
The linear regression rate (LRR) is evaluated by fitting a least-squares regression line to all shoreline points along a specific transect. The linear regression method of calculating shoreline change rates assumed a linear change trend between the earliest and latest shoreline dates. The slope of this trend line represents the rate of change in the coastal shoreline.
The shoreline change rate along each transect for all periods (i.e., 1990, 2000, 2010, and 2020) is computed by plotting the points where transects intersect shorelines. The linear regression equation used to calculate the shoreline movement is provided below:
L = b + m x
where L is the shoreline movement, x is the date, m is the rate of shoreline movement (LRR), and b is the intercept.

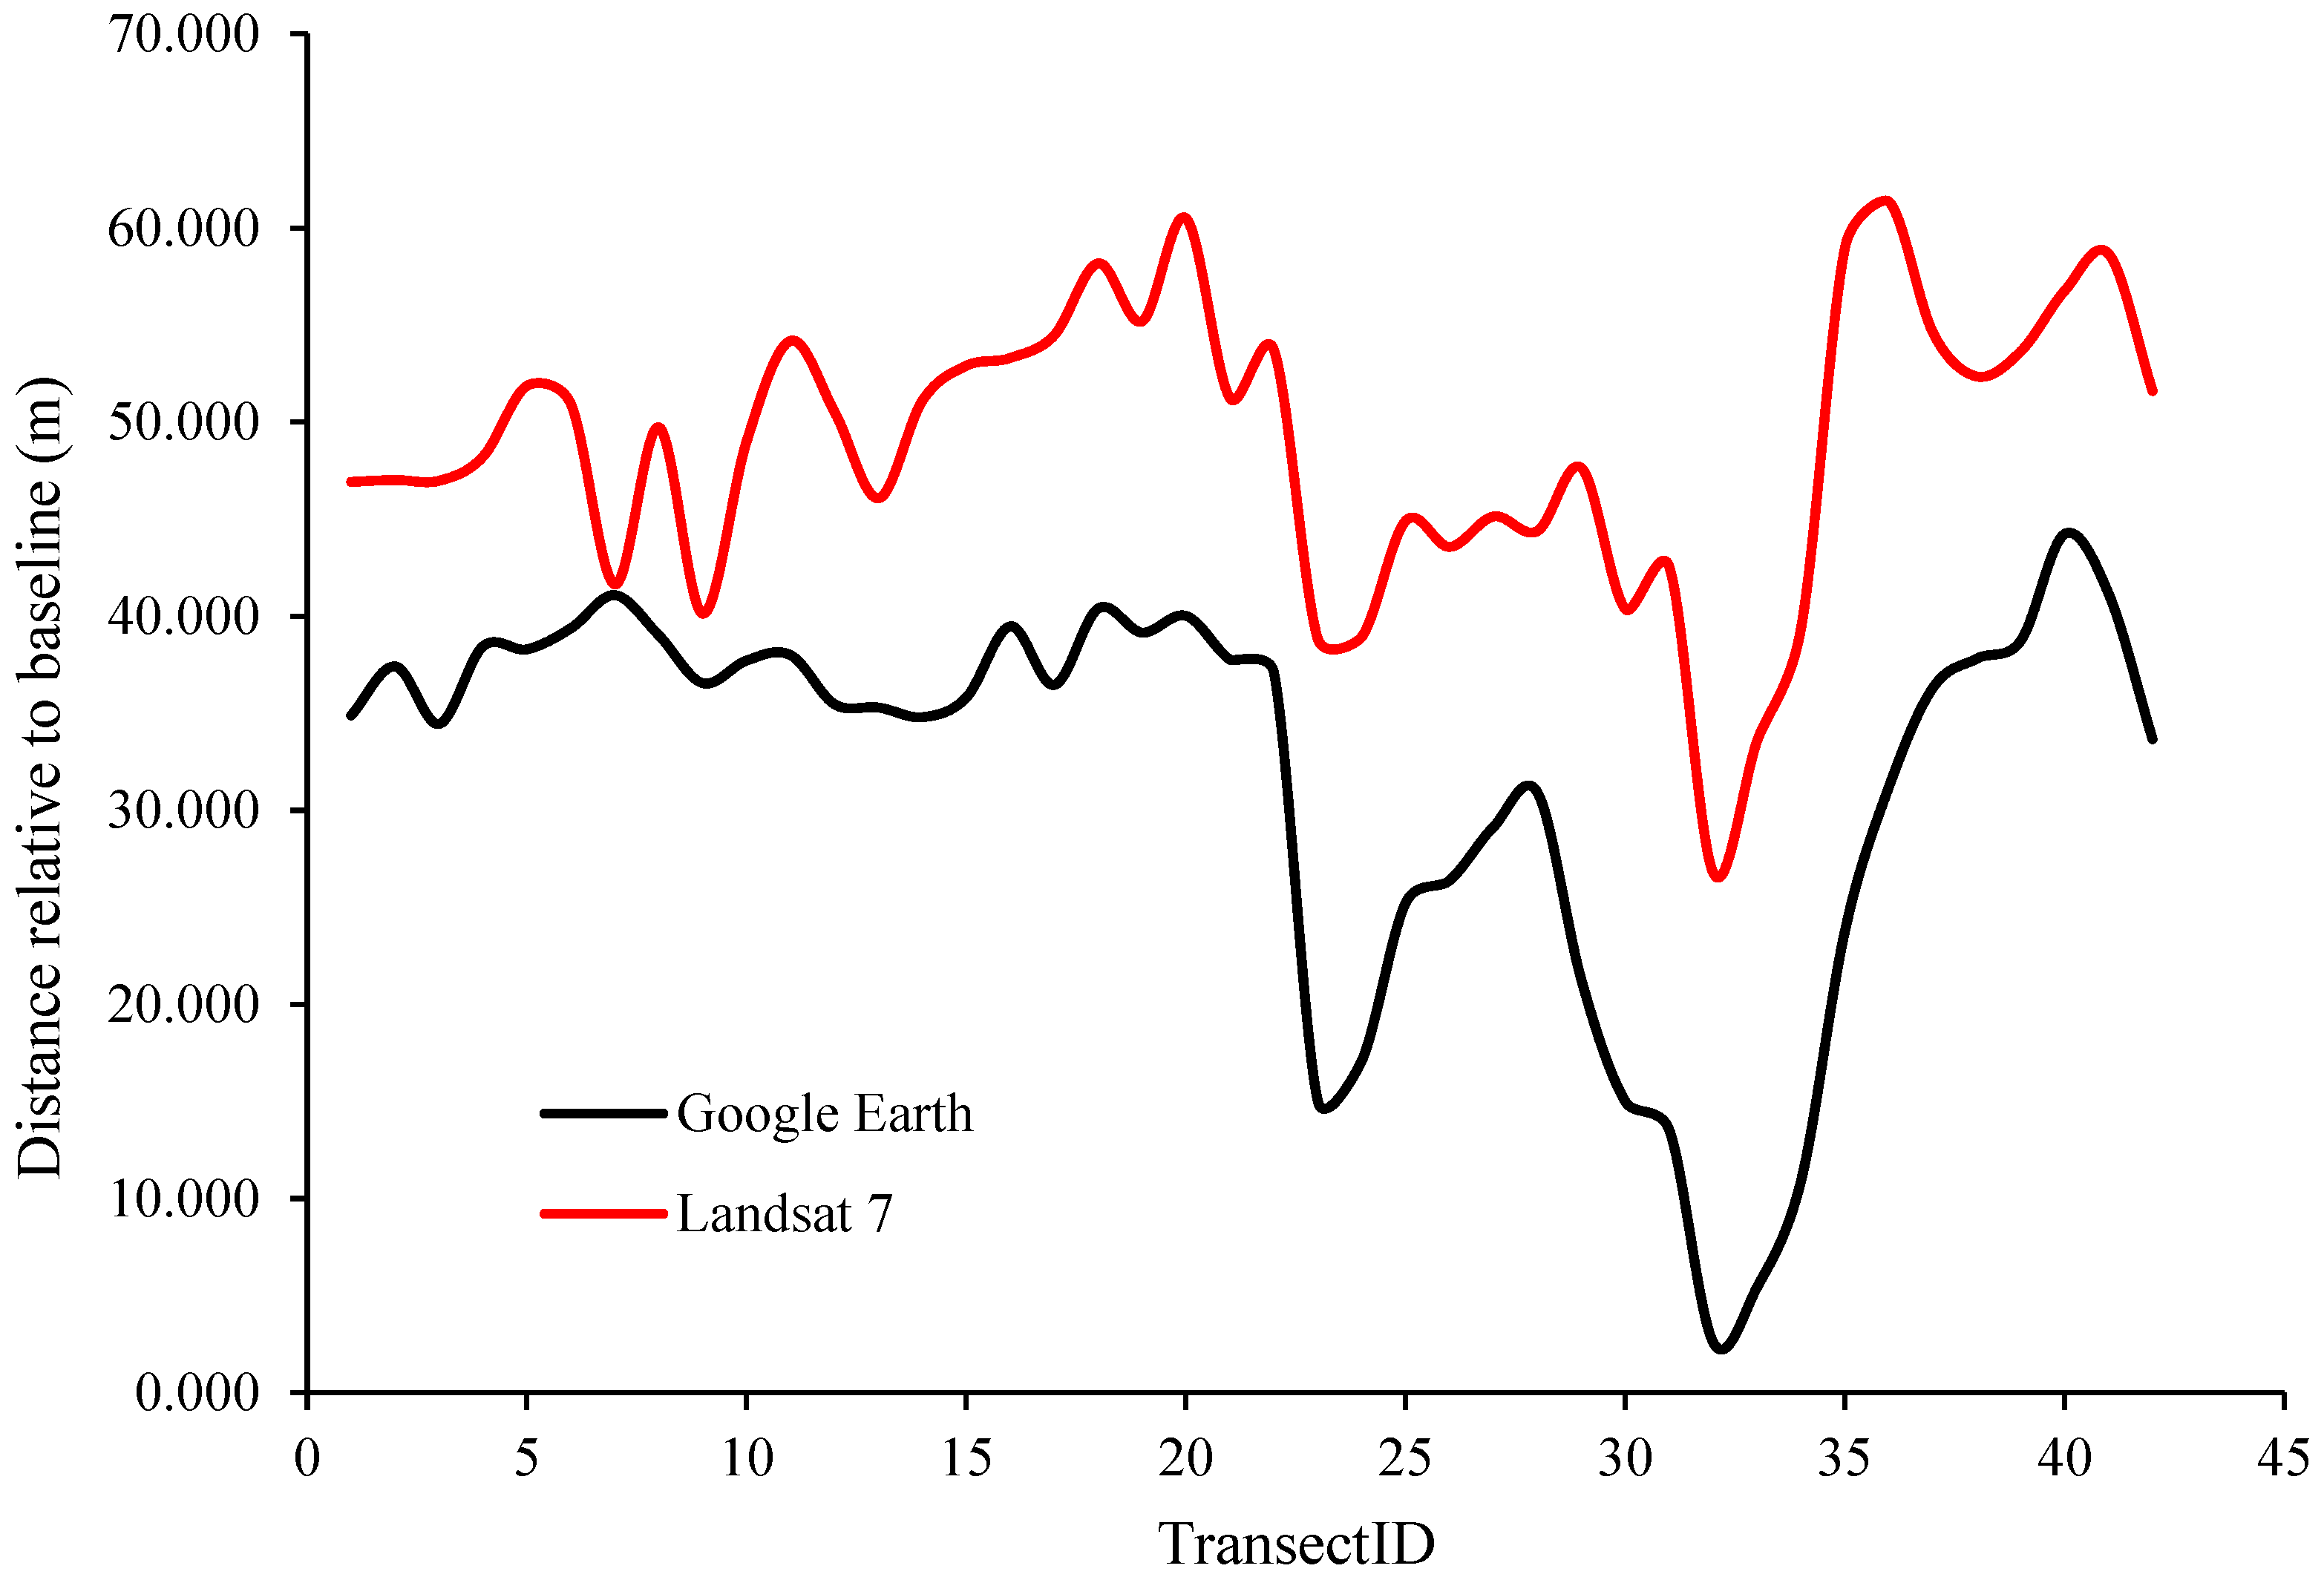
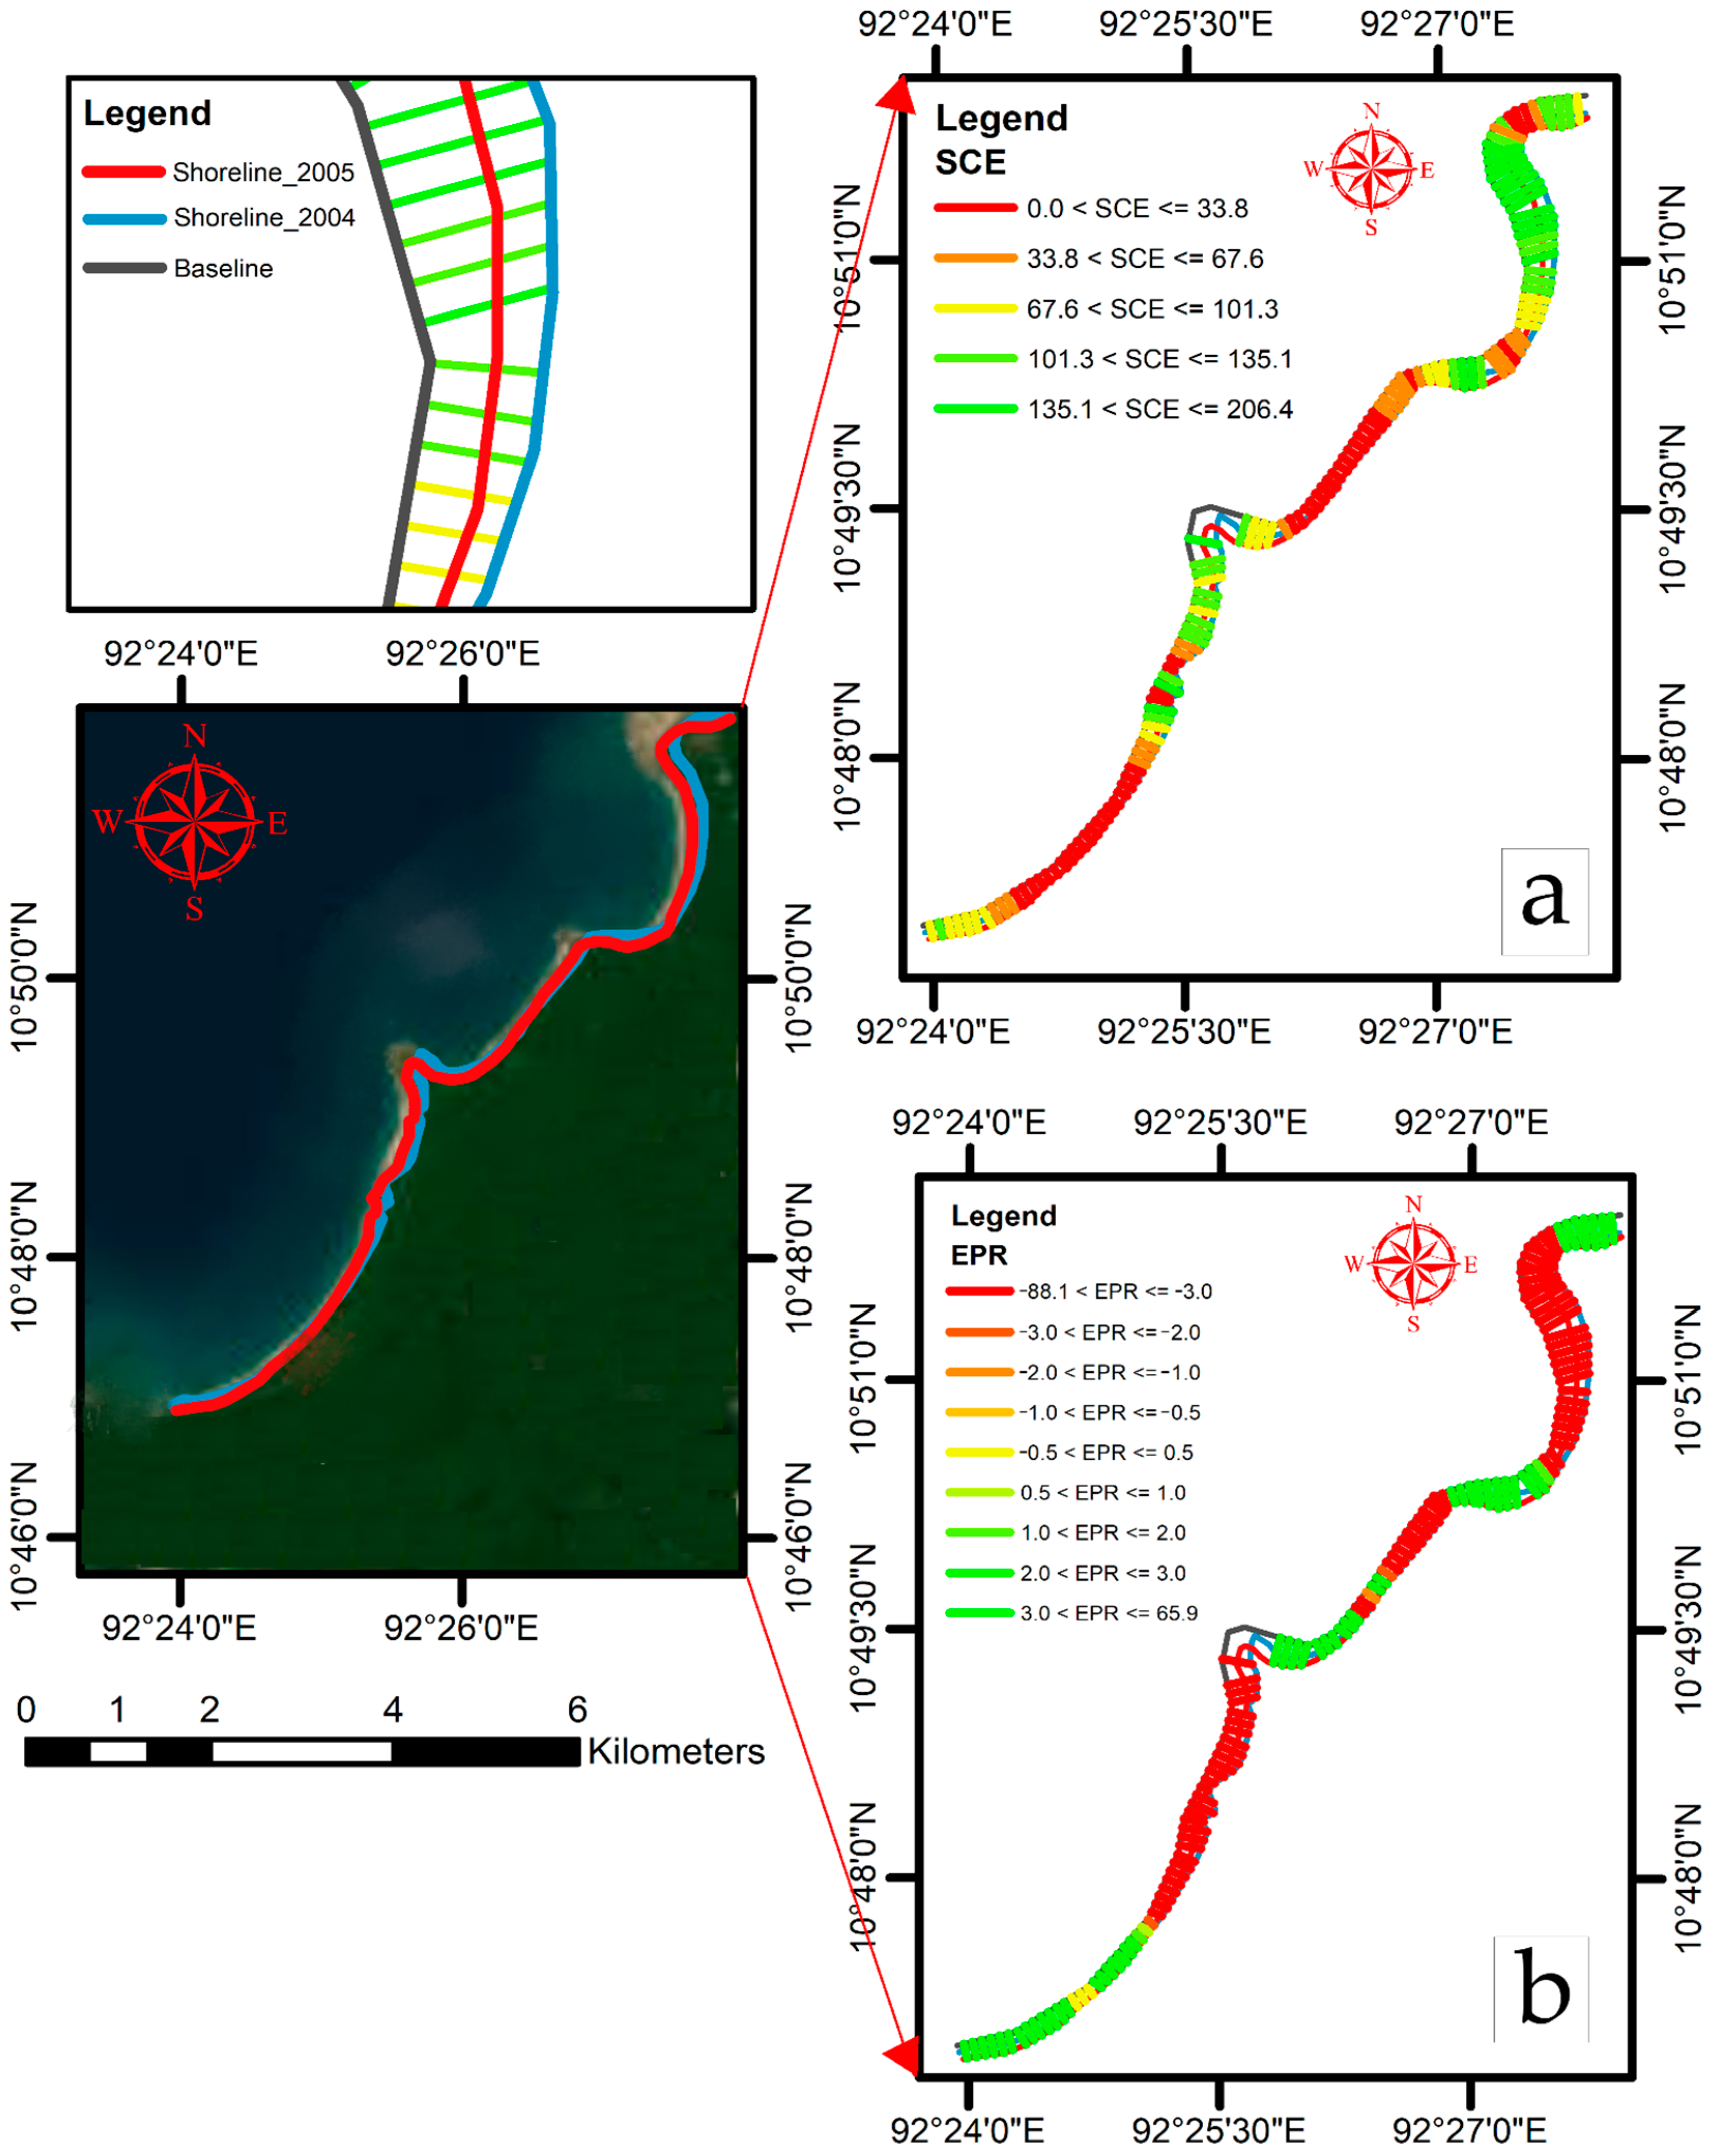
2.2. Validation of Coastal Shoreline of Landsat-7 and Google Earth Images

The RMSE method was chosen to be used for the purpose of validating the coastal shoreline of South Andaman. When validating Landsat-7 and Google Earth’s ability to detect coastal shorelines, the root mean square error (RMSE) was used as a criterion to evaluate the two platforms’ performance. The RMSE was determined through the use of Equation (3). As can be seen in Figure 3, a calculation was performed to determine the distance that separates each transect from the baseline to the riverbank line, which can be seen in Google Earth and satellite images.
R M S E = i = 1 n ( c o a s t a l   l i n e   g o o g l e   e a r t h ) ( c o a s t a l   l i n e   L a n d s a t   7 ) T r a n s e c t   n o .

3. Results

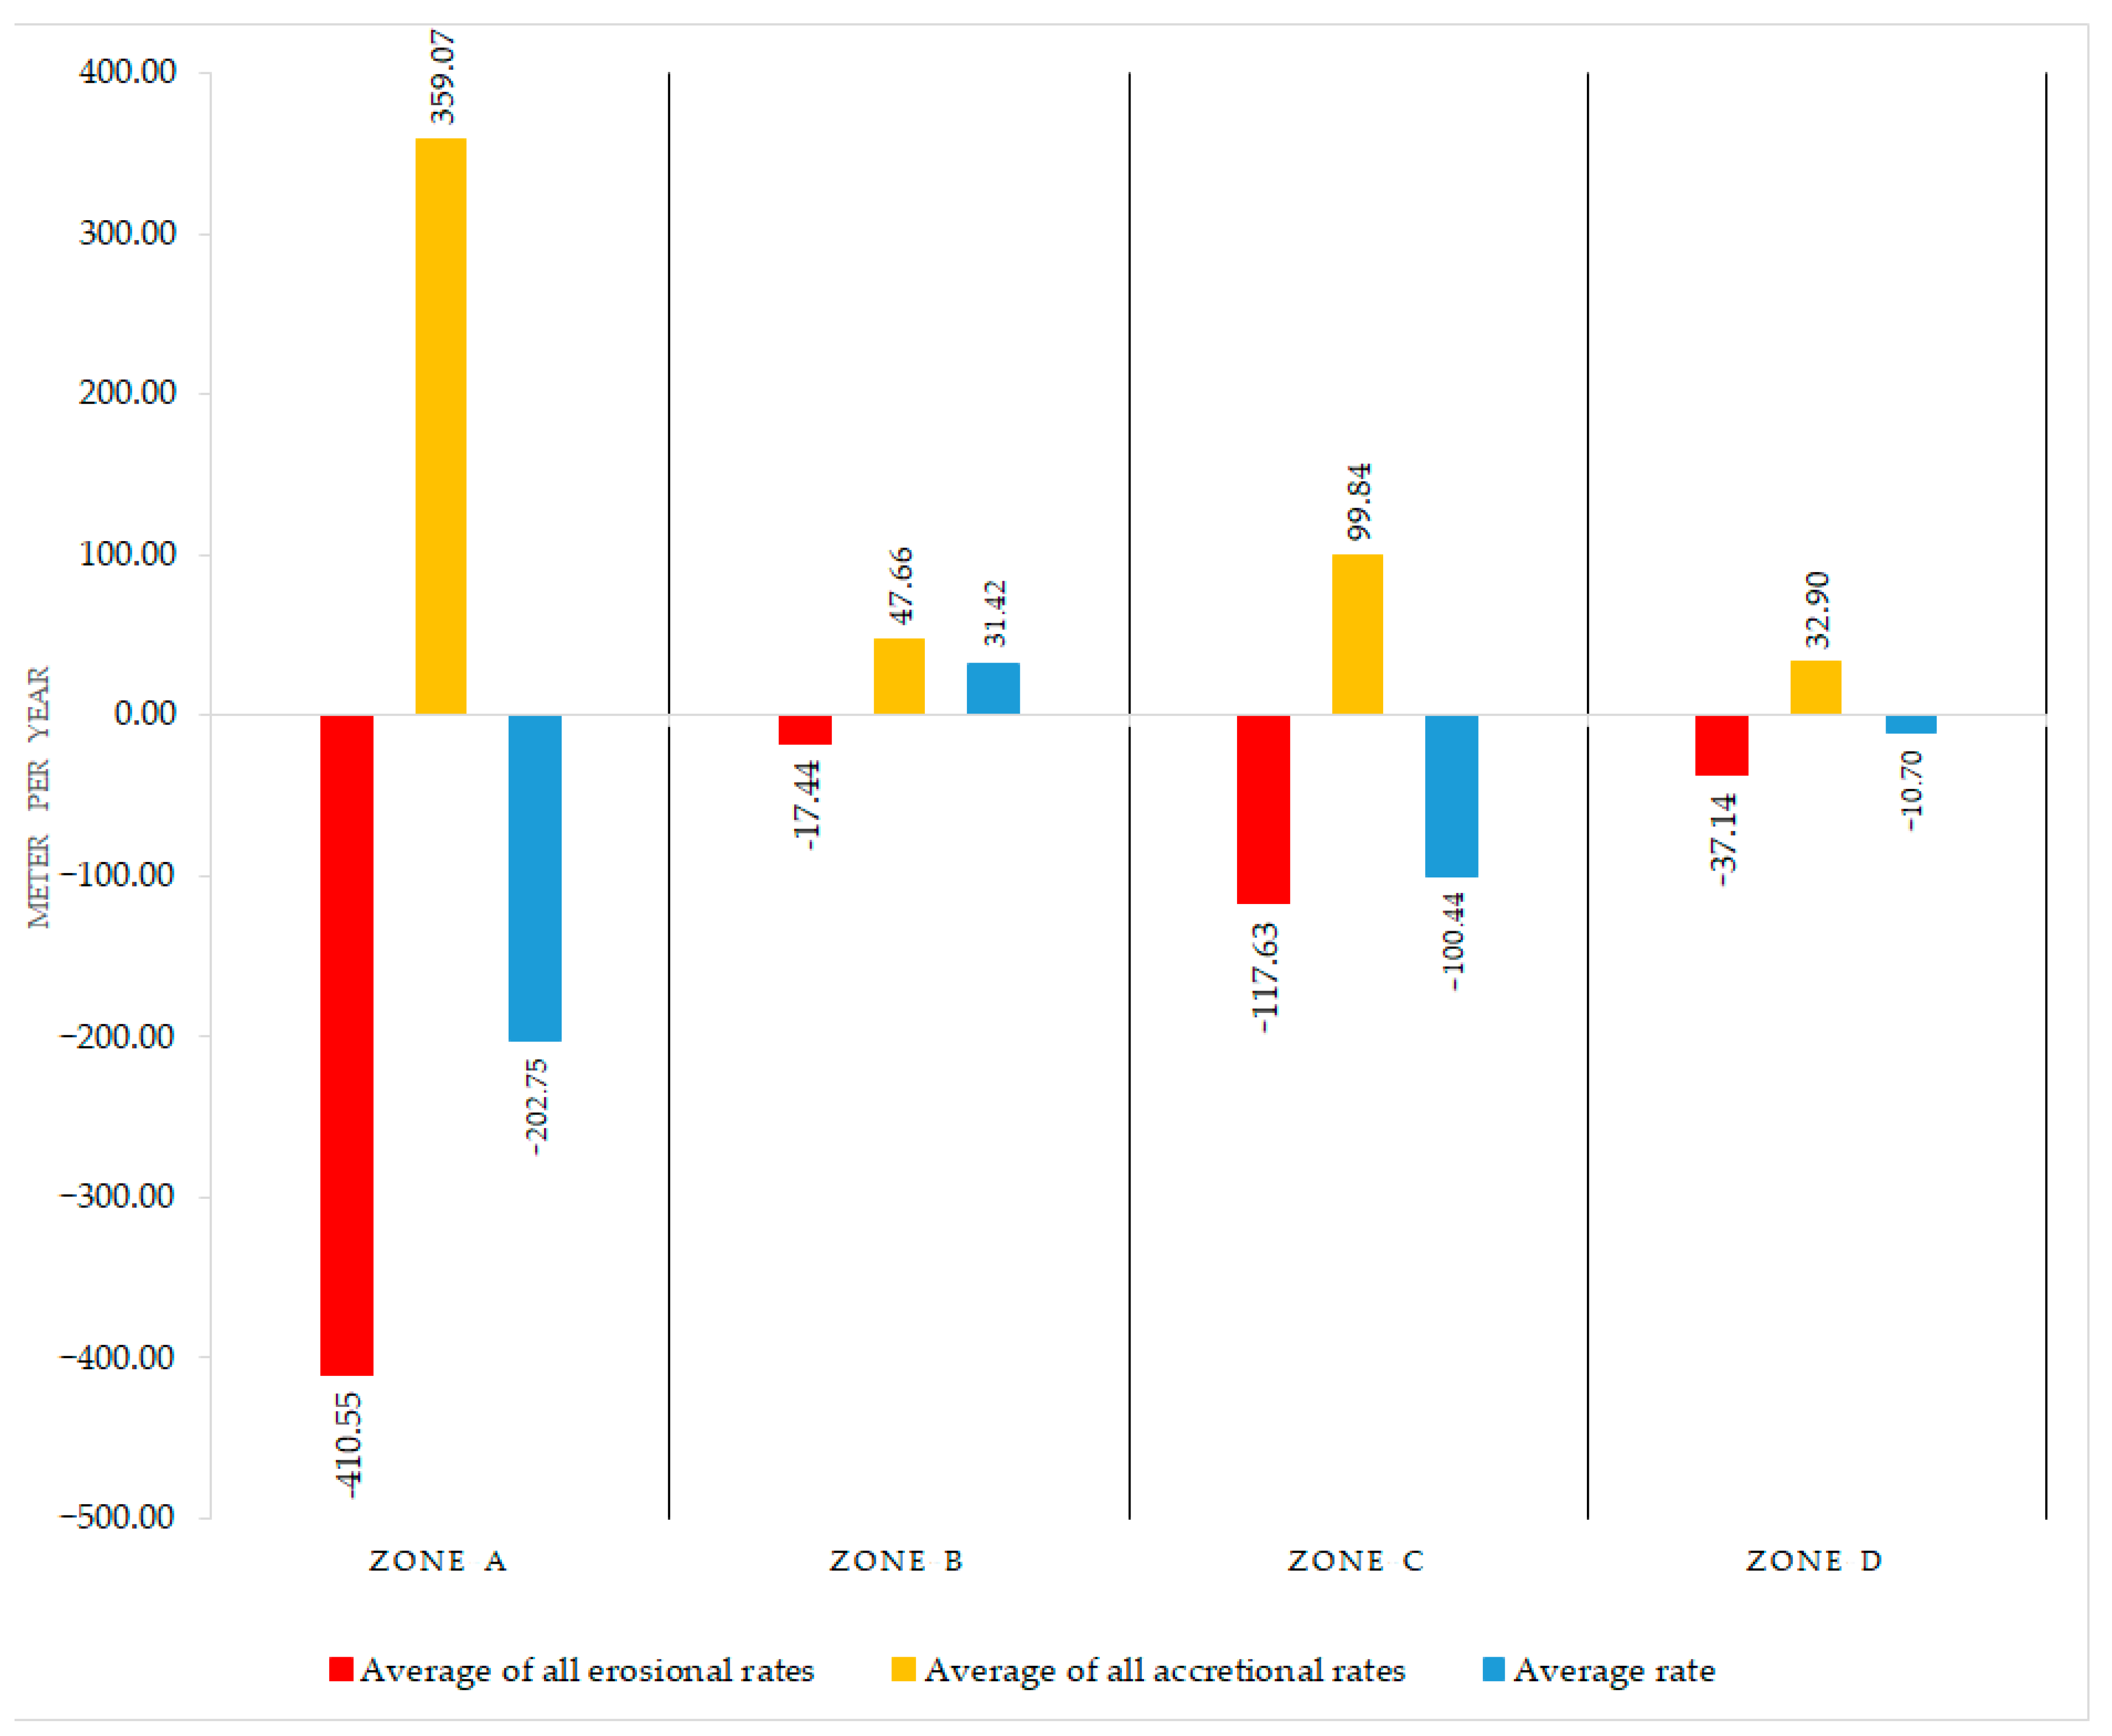
3.1. Analysis of Coastal Erosion Pre- and Post-Tsunami

Shoreline Change Envelope (SCE) and Erosion Potential Ratio (EPR) serve as crucial tools for interpreting the dynamics of coastal shoreline transformation. Their application provides essential insights into coastal management by quantifying rates of erosion and accretion, predicting potential changes, and thereby guiding interventions to ensure sustainable shoreline management [36]. Coastal shoreline change can potentially have an impact on coastal ecosystems. The greatest amount of shoreline retreat was observed in zone B, which had an average shoreline change envelope distance change of 120.36 m per year between the coastal lines of 2004 and 2005 (Table 1). The end point rate was determined by taking the average of all the rates of erosion and calculating it to be −410.55 m/year in zone A, while the accretion rate was recorded at 359.07 m/year in zone A (Table 2).
The immediate erosion and accretion at all four zones were different from each other, representing the impact of the tsunami. Figure 4 represents immediate coastal line changes due to the 2004–2005 tsunami in zone A, South Andaman. Figure 4a shows the migration of the 2005 coastal line from the 2004 coastal line. The maximum coastline migration was observed in the upper part of zone A. It can be seen in the figure that there was extensive coastal migration after the tsunami. Figure 4b shows the end point rate, which shows the erosion and accretion of the coastal shoreline between 2004 and 2005. Extensive erosion is shown on zone A’s upper and lower parts after the tsunami.
Figure 5 represents immediate coastal line changes due to the tsunami (2004–2005) in zone B of South Andaman. Figure 5b shows the end point rate, which shows erosion and accretion of the coastal shoreline between 2004 and 2005. Extensive erosion is shown on the left side of zone B after the tsunami.
Figure 6 represents immediate coastal line changes due to the 2004–2005 tsunami in zone C, South Andaman. Figure 6b shows the end point rate, which shows erosion and accretion of the coastal shoreline between 2004 and 2005. Extensive erosion is shown in zone C after the tsunami.
Figure 7 also represents immediate coastal line changes due to the 2004–2005 tsunami in zone D, South Andaman, where the erosion and accretion of the coastal line were almost recorded at the same rate.
The maximum average erosion rate observed between 2004 and 2005 after the tsunami in zone A was −410.55 m/year, and the maximum accretion rate was also observed in zone A, which recorded 359.07 m/year, as shown in Figure 8. Zones A and C were the most affected parts, as demonstrated by this tsunami’s very high erosion and accretion rates compared to zones B and D. Zone B was the least affected zone, with the lowest erosion and accretion rates.

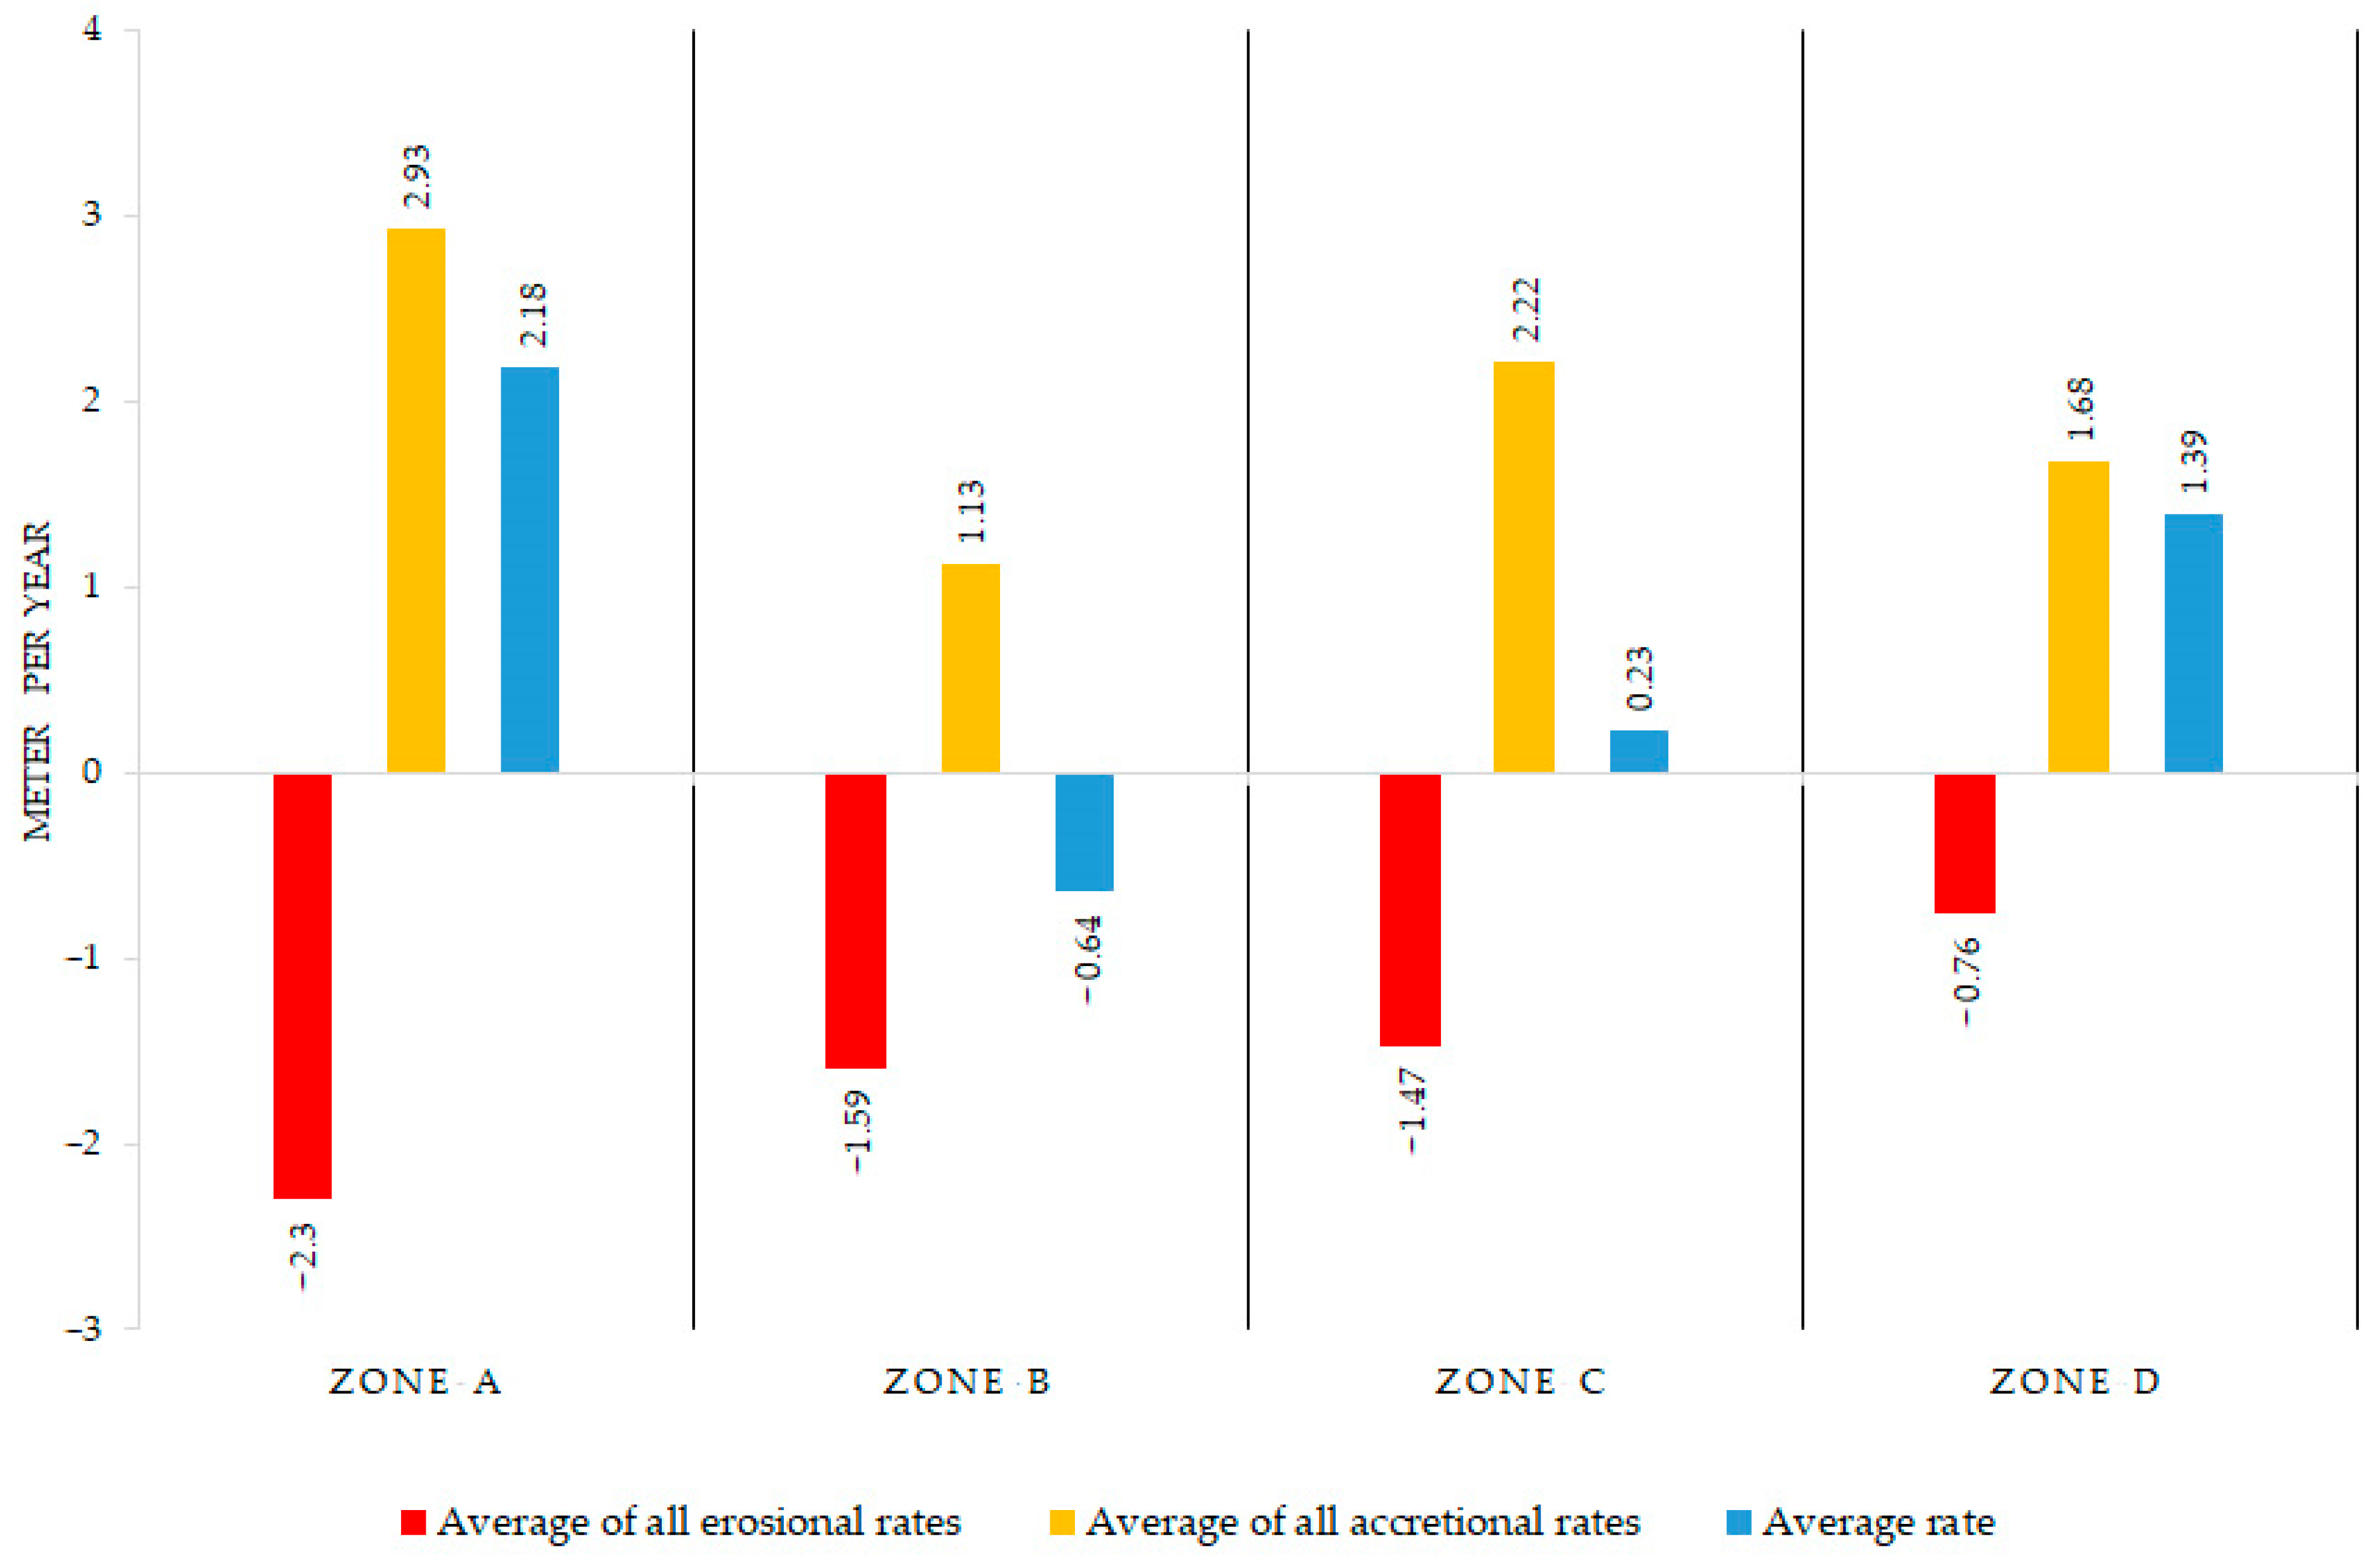
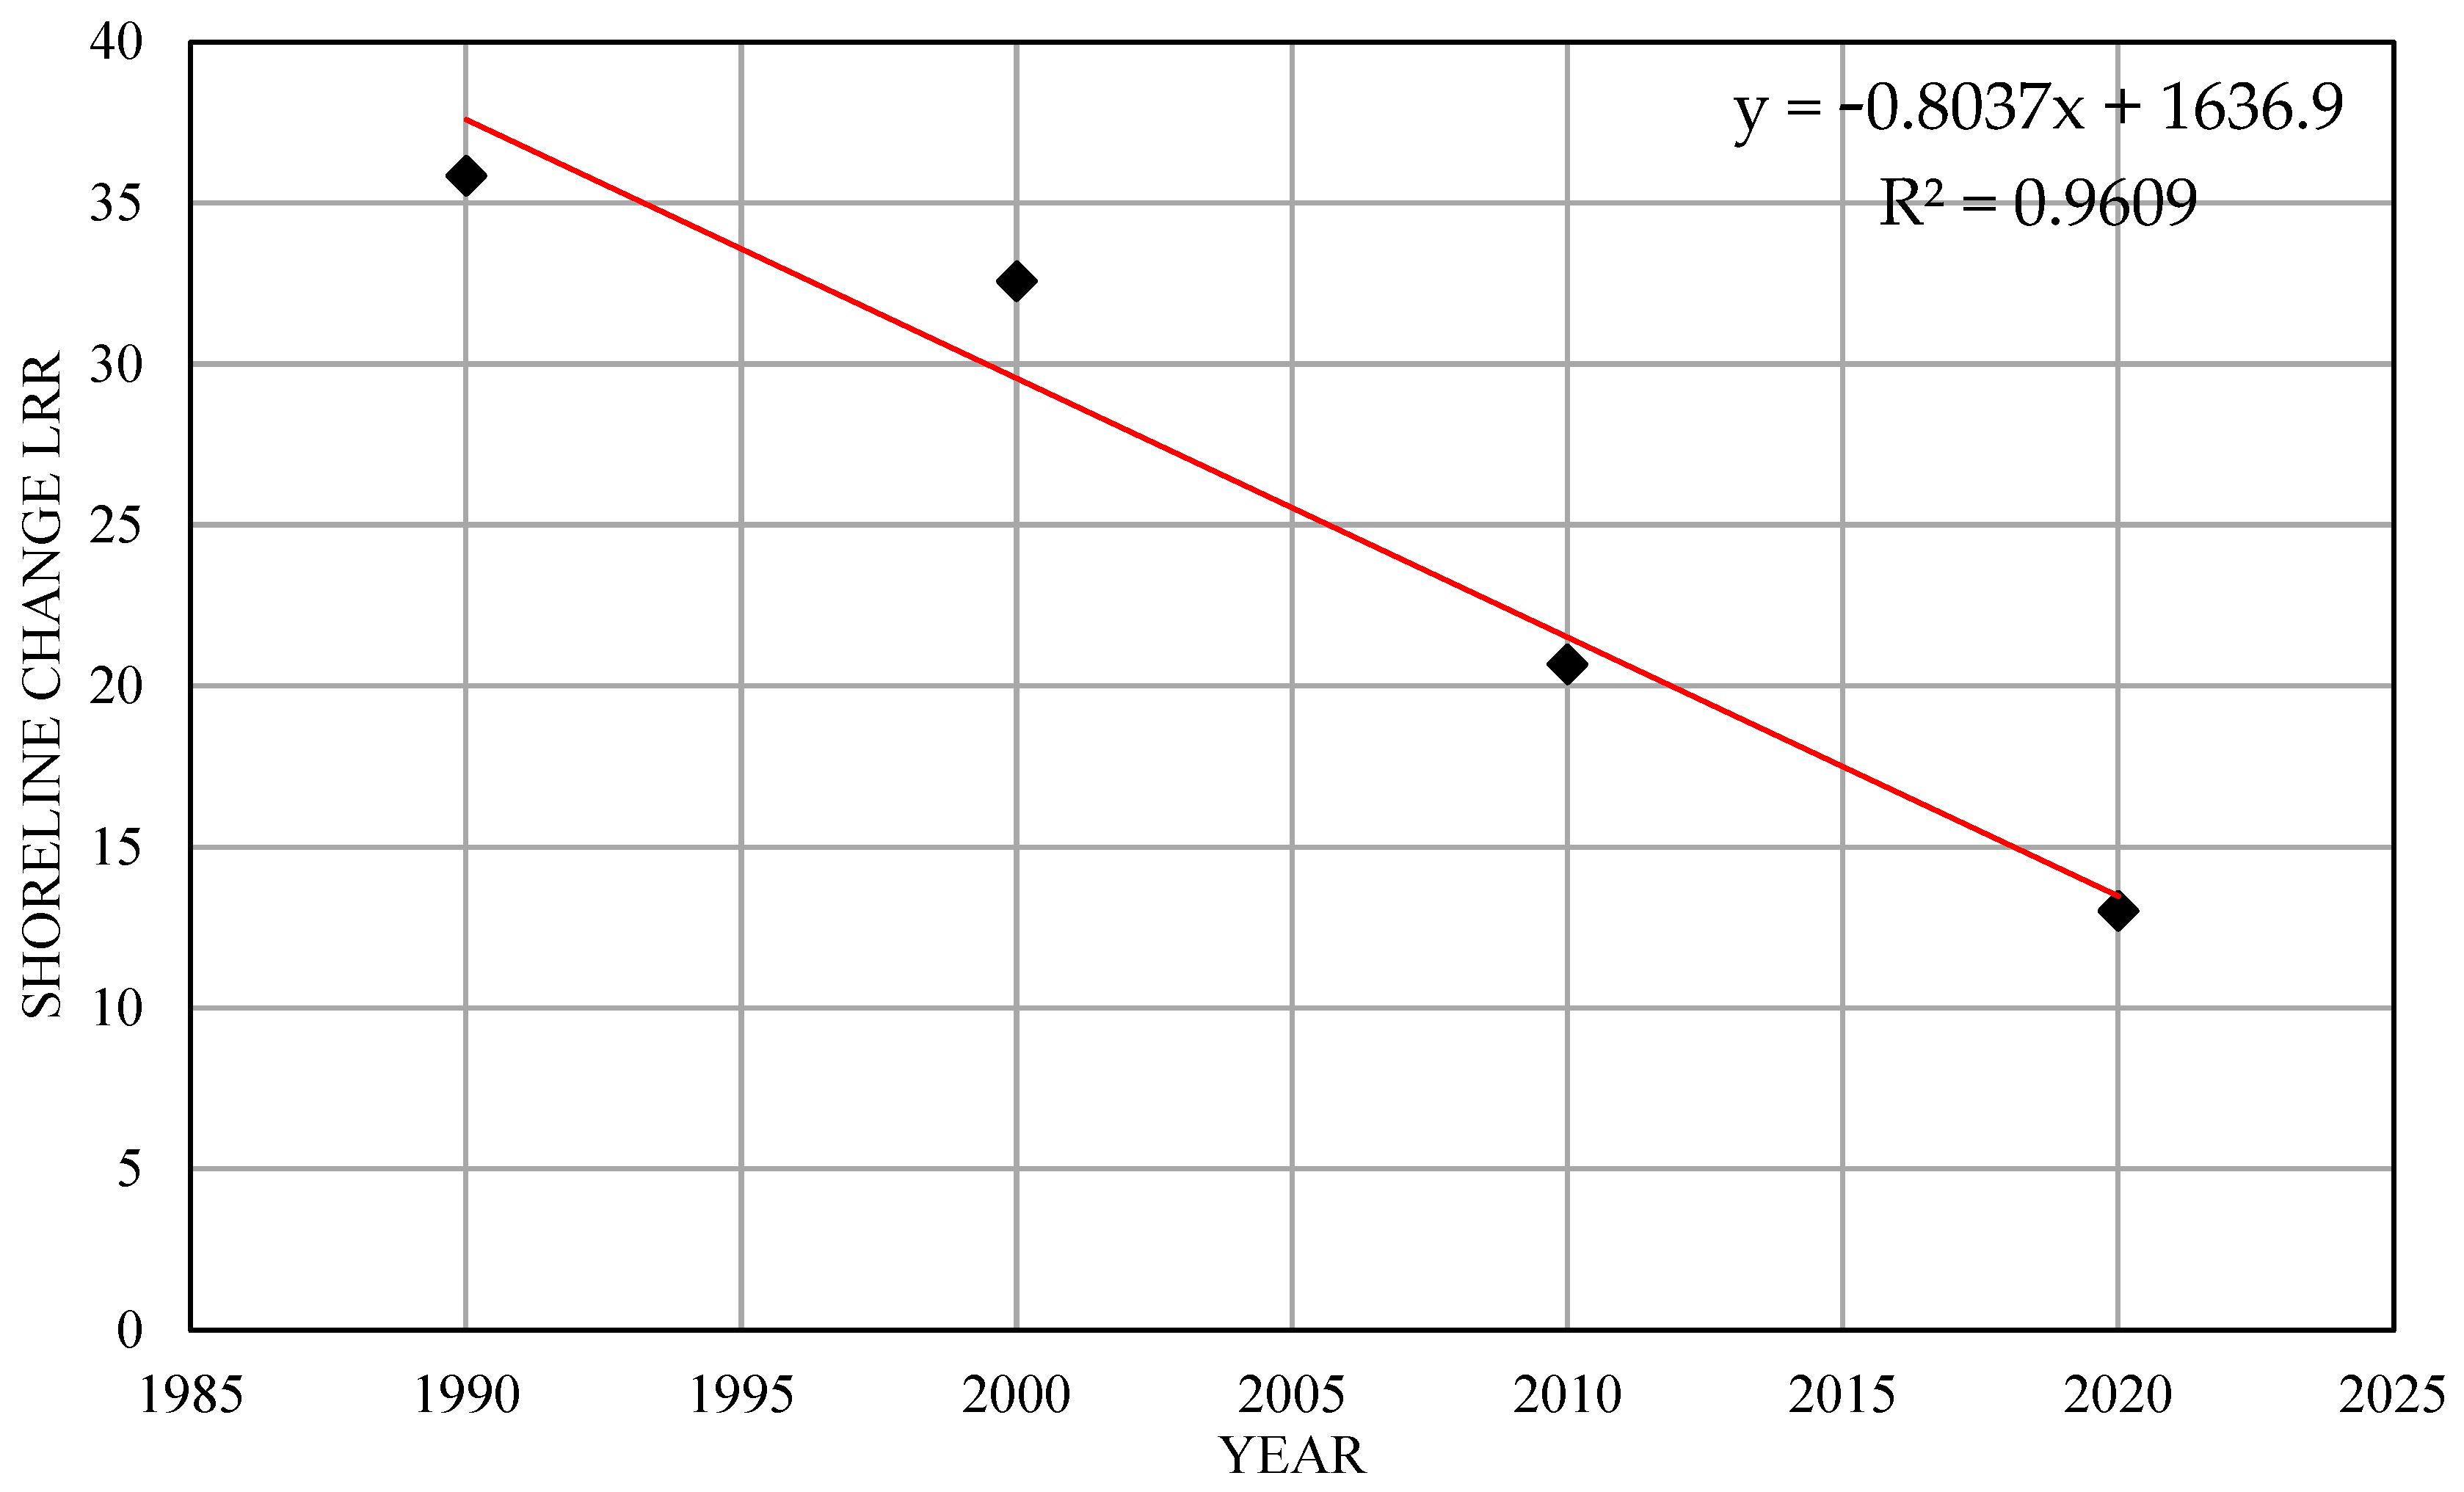
3.2. Periodical Coastal Erosion

The term “periodic coastal shoreline changes” refers to the cyclical and recurrent fluctuations in the position of the coastal shoreline [37,38]. Both natural and human-caused factors can be blamed for these changes. The coastal shoreline change analysis made an effort to determine the rate of change of the coastal shoreline on South Andaman Island from a timeseries of various shoreline positions. Using SEC, NSM, EPR, and LRR methods, an investigation into the shoreline change rate in South Andaman was carried out.
The shoreline change envelope (SCE), net shoreline movement (NSM), end point rate (EPR), and linear regression rate (LRR) have been calculated as part of a statistical analysis of the coastal erosion of South Andaman Island from 1990 to 2023. This analysis was conducted by applying the tools of DSAS (v5.1) after identifying South Andaman Island’s coastal shoreline using images from different periods taken by Landsat. The years 1990 through 2023 are included in the scope of this study’s time period.
The results of the periodical SCE are included in Table 3. The shoreline change envelope (SCE) was measured at a range of distances, and the average change distance was recorded at 105.06 m in zone C.
The results of the NSM are included in Table 4. The net shoreline movement (NSM) shows the distance between the oldest (1990) and the most recent shorelines (2023). Maximum shoreline migration between 1990 and 2023 was recorded in zone A, at 71.12 m.
Table 5, containing the end point rate findings, is provided below. This study examined the variations in coastal shoreline erosion and accretion between 1990 and 2023 through the analysis of end point rate data. The zone referred to as A showed the highest recorded rate of periodical erosion, which was −2.18 m/year, and conversely, it also showed the highest recorded rate of accretion, which was 2.93 m/year.
Figure 9, Figure 10, Figure 11 and Figure 12 present periodic coastal line changes (1990–2023) of all four zones of South Andaman and the analysis of erosion and accretion along the South Andaman coastal shoreline, and the findings provide insights into the long-term trends of shoreline dynamics in the region, taking into account various factors that influence coastal erosion and accretion, including the impact of the 2004 tsunami. Figure 9 also represents the periodical coastal line changes (1990–2023) of zone A in South Andaman, whereby the total transect created in zone A was 215. Figure 9c shows this zone’s extensive erosion and accretion. The analysis resulted in the generation of EPR 217 transects, as illustrated in Figure 10. Figure 10c depicts that the highest rate of erosion was measured within the range of −0.4 m/year to – 3 m/year of zone B. The erosion and accretion profiles of the zones are periodically illustrated in Figure 11c and Figure 12c. In the conclusion of the periodical coastal line changes, zone A showed the maximum erosion and accretion, calculated as −2.3 m/year and 2.93 m/year, respectively.
The Figure 13 shows the average periodical coastal erosional and accretional rates in meters per year for four zones. Zone-A has the highest average erosional rate, while Zone-D has the lowest. This means that the coastline in Zone-A is retreating at a rate of 2.3 m/year, while the coastline in Zone-D is advancing at a rate of 0.76 m/year. Zone A has also the highest accretion rate of 2.93 m/year, followed by Zone C with 2.22 m/year. Zone B has the lowest accretion rate of 1.13 m/year, followed by Zone D with 1.68 m/year.
The differences in the erosional rates between the zones can be attributed to a number of factors, including climate, vegetation, and topography [39]. For example, Zone-A is a desert, which is characterized by low rainfall and high winds. These conditions contribute to the high erosional rate in Zone-A. Zone-D is a coastal zone, which is characterized by high rainfall and deposition of sediment from rivers. These conditions contribute to the low erosional rate in Zone-D.
The linear regression rate-of-change statistic was calculated using a least-squares regression line to fit all the shoreline points along a transect. This method minimizes the sum of squared residuals (offset distances) between each data point and the regression line. The equation used for calculating the linear regression rate-of-change statistic is as follows:
y = 0.8037 x + 1636.9
The negative slope of the linear regression rate (LRR) graph, as shown in Figure 14 that indicates that the coastal shoreline has experienced erosion over time. This analytical insight reveals that the coastline has been subject to a long-term decline, which is crucial for understanding the ongoing coastal processes, informing coastal management decisions, and guiding the development of effective adaptation and mitigation measures. By studying this linear regression rate-of-change statistic, researchers can better understand the dynamics of coastal erosion and accretion in the region, ultimately contributing to better coastal zone management and planning.
One crucial insight from this study is the role of tsunamis, such as the one in 2004, in contributing to the observed shoreline changes. The findings demonstrated that the South Andaman Island coastal environment experienced significant erosion without any accretion transects being detected [40]. This calls for further investigation into factors driving erosion and the implications for coastal ecosystems and communities. Additionally, the results emphasized the importance of long-term monitoring and targeted interventions to address erosion and protect the island’s coastal resources [41].
The tsunami that struck the Indian Ocean in 2004 played a significant role in altering the coastal shorelines of the Andaman and Nicobar Islands. Generated by a massive 9.3-magnitude earthquake off the coast of Sumatra, this powerful tsunami led to the displacement of a vast quantity of water, causing waves to travel at high speeds across the ocean [42]. As these waves reached coastal areas, they brought massive amounts of energy with them, resulting in substantial alterations to the coastal shorelines.
In the Andaman and Nicobar Islands, the tsunami’s impact manifested itself through extensive erosion and accretion processes that reshaped the coastlines. Some areas experienced severe erosion, where the shoreline receded further inland, while others underwent accretion, where sediment deposition expanded the shoreline seaward. The changes in shoreline morphology were especially evident in the South Andaman region, where the tsunami’s force significantly affected the coastal environment.
The tsunami’s aftermath also led to other significant consequences for the affected coastal communities. In addition to the immediate loss of life and destruction of infrastructure, the altered shorelines disrupted ecosystems and altered the habitats of various species. The changes in coastal geomorphology also had implications for human activities, including fishing and tourism, which are crucial for the livelihoods of many coastal communities.
Understanding the role of the tsunami in reshaping the coastal shorelines is crucial for informing disaster management plans, coastal zone management, and conservation efforts. By studying the impacts of the 2004 tsunami, researchers can gain insights into the short- and long-term effects of such events on coastal ecosystems and communities. In order to lessen future damage from tsunamis and other coastal hazards, governments and agencies can use this knowledge to develop more effective disaster response strategies and allocate resources more effectively.

4. Discussion

Our study underscores the importance of utilizing geospatial tools, including the Digital Shoreline Analysis System (DSAS) v5.1 and satellite imagery, in managing and monitoring coastal areas. The application of these advanced technologies reveals their capacity to generate vital information, instrumental for stakeholders such as policymakers and conservationists. This wealth of information informs the creation of adaptive management strategies, safeguarding the ecological integrity of coastal areas and enhancing their resilience against future calamities. Additionally, the findings of this research could furnish the foundational data required for proficient coastal zone management and planning, while also driving the formation of adaptation and mitigation strategies in response to escalating sea levels.
The study’s implications extend beyond environmental considerations, shedding light on the significant socioeconomic facets of coastal erosion and shoreline changes [43]. Coastal zones, with South Andaman Island being a case-in-point, support numerous communities whose livelihoods, whether it be fishing, tourism, or agriculture, depend heavily on the coastal ecosystem services [44,45,46]. Thus, observed coastal erosion poses a threat not only to the ecological health of these regions, but also to the communities relying on these resources, leading to far-reaching consequences.
Among the socioeconomic challenges emanating from coastal erosion is the potential displacement of people due to the erosion of land and infrastructure. A stark example is the 2004 tsunami that wreaked havoc on homes, businesses, and public infrastructure, rendering vast numbers of people homeless and economically vulnerable. Further, coastal erosion can hamper local economies by impacting tourism sectors, which substantially depend on unspoiled beaches and coastal attractions.
Food security represents another crucial socioeconomic aspect that can be affected by shoreline changes. Communities along the coast are often reliant on fishing as a primary source of income and sustenance [47]. Erosion-induced loss of coastal habitats such as mangroves and coral reefs could result in declining fish stocks and other marine resources. This scenario jeopardizes the livelihoods of local fishermen while posing a serious threat to the food security of the broader community [48].
The influence of wave activity on coastal behavior is particularly significant during storm events. Intense wave action can hasten the erosion of coastal landforms such as shorelines, cliffs, and dunes, causing loss of sediment and land [49]. Conversely, wave action from specific directions can lead to accretion, resulting in sediment deposition and land gain, especially in sheltered regions. Storms and wave attacks play a crucial role in sediment transport along the coast, altering beach profiles and redistributing sediment in adjacent areas. The complex interaction between storms, waves, and the coastal environment shapes and modifies various landforms, such as sea cliffs, sand dunes, spits, and barrier islands, with wave attack intensity and direction influencing their formation and evolution [50].
To address these socioeconomic challenges, policymakers and stakeholders must incorporate both ecological and socioeconomic perspectives into coastal management strategies [51,52]. This approach might involve investing in coastal protection measures, including seawalls and artificial reefs, to mitigate erosion impacts and preserve critical habitats. Moreover, endorsing sustainable development practices such as eco-tourism and responsible fishing can contribute to the long-term sustainability of coastal economies, while also protecting the environment [53].
Our study on coastal shoreline changes in South Andaman Island offers vital insights into the intricate interplay between ecological processes and socioeconomic conditions. By integrating both environmental and socioeconomic considerations into coastal as well as inland management strategies, we can develop more comprehensive and effective methods to conserve these essential ecosystems and ensure the well-being of the communities dependent on them [54,55,56].

5. Conclusions

In conclusion, this study provided valuable insights into the periodic coastal shoreline changes and the impact of the 2004 Indian Ocean tsunami on South Andaman Island. The analysis utilized various methodologies, such as the shoreline change envelope (SCE), net shoreline movement (NSM), end point rate (EPR), and linear regression rate (LRR), revealing significant coastal erosion along the island’s coastline. The South Andaman Island coastal line change rates were determined in four zones using remote sensing techniques and geospatial tools, including the Digital Shoreline Analysis System (DSAS), to assess the impact of the tsunami. The study revealed that in zone A, located on the island’s eastern side, the maximum coastal erosion rate during the pre- and post-tsunami periods was recorded at −410.55 m/year, whereas the maximum accretion was observed at 359.07 m/year. During the period from 1990 to 2023, the eastern island region, denoted as zone A, exhibited the most notable rate of coastal line erosion, which was measured at −2.3 m/year. Using geospatial tools, such as the Digital Shoreline Analysis System (DSAS) v5.1 and satellite imagery, their potential to provide critical information for policymakers, conservationists, and other stakeholders on the state of coastal environments was demonstrated. The average erosional rate was recorded at −0.81 m/year, which can contribute to developing adaptive management strategies that help preserve the ecological integrity of coastal areas and ensure their resilience against future disasters.
However, this study has some potential limitations. The analysis primarily used satellite imagery, which is subject to variations due to cloud cover, atmospheric conditions, or image resolution. Additionally, the study’s scope was limited to the period from 1990 to 2020, which may not capture the full range of shoreline changes and the impacts of other natural or human-induced factors on the coastal environment. Overall, this study contributes to understanding coastal shoreline changes and the impacts of natural disasters such as tsunamis on coastal environments. The insights gained can inform future research and policy development, helping to ensure the long-term sustainability and resilience of these vital ecosystems and the communities that depend on them. However, further research is necessary to address the limitations and expand on the findings of this study, ultimately providing a more comprehensive understanding of coastal dynamics and effective management strategies.

Author Contributions

Conceptualization, S.S. and S.K.S.; methodology, S.S.; software, S.S.; validation, S.K. and D.K.P.; formal analysis, S.K.S.; investigation, P.K.; resources, S.S.; data curation, G.M.; writing—original draft preparation, S.S.; writing—review and editing, D.K.P., V.P. and G.M; visualization, G.M.; supervision, S.K.S. and G.M. All authors have read and agreed to the published version of the manuscript.

Funding

This research received no external funding.

Institutional Review Board Statement

Not applicable.

Informed Consent Statement

Not applicable.

Data Availability Statement

The data are available upon reasonable request from the first author.

Acknowledgments

We would like to express our profound gratitude to the three anonymous reviewers, whose insightful comments and constructive feedback were instrumental in enhancing the quality of this manuscript. Their expertise and meticulous attention to detail helped us refine our analysis and strengthen our arguments. We greatly appreciate the time and effort they devoted to scrutinizing our work. We also extend our thanks to all those who provided technical support and assistance over the course of this study. Lastly, we acknowledge the invaluable contribution of the community living around South Andaman Island, who shared their experiences and provided local knowledge that enriched our research.

Conflicts of Interest

The authors declare no conflict of interest.

References

  1. Available online: https://www.noaa.gov/education/resource-collections/ocean-coasts/tsunamis (accessed on 10 March 2023).
  2. Devi, E.U.; Shenoi, S.S.C. Tsunami and the effects on coastal morphology and ecosystems: A report. Proc. Indian Natl. Sci. Acad. 2012, 78, 513–521. [Google Scholar]
  3. Britannica, T. Editors of Encyclopaedia. Indian Ocean Tsunami of 2004. Encyclopedia Britannica. Available online: https://www.britannica.com/event/Indian-Ocean-tsunami-of-2004 (accessed on 28 March 2023).
  4. Praveen, S.S.; Reshmi, A.K.; Dhanya, P.; Kalarani, S.A.; Kurian, N.P.; Murthy, M.R.; Hameed, T.S.; Prakash, T.N. Numerical simulation of the December 26, 2004, tsunami on the southwest coast and Lakshadweep islands of India. Mar. Geod. 2011, 34, 59–67. [Google Scholar] [CrossRef]
  5. Usha, T.; Murthy, M.R.; Reddy, N.T.; Murty, T.S. Vulnerability assessment of Car Nicobar to tsunami hazard using numerical model. Sci. Tsunami Hazards 2009, 28, 15. [Google Scholar]
  6. Debnath, J.; Sahariah, D.; Saikia, A.; Meraj, G.; Nath, N.; Lahon, D.; Annayat, W.; Kumar, P.; Chand, K.; Singh, S.K.; et al. Shifting Sands: Assessing Bankline Shift Using an Automated Approach in the Jia Bharali River, India. Land 2023, 12, 703. [Google Scholar] [CrossRef]
  7. Mukhopadhyay, A.; Mukherjee, S.; Hazra, S.; Mitra, D. Sea Level Rise and Shoreline Changes: A Geoinformatic Appraisal of Chandipur Coast, Orissa. Int. J. Geol. Earth Environ. Sci. 2011, 1, 9–17. [Google Scholar]
  8. Salghuna, N.N.; Bharathvaj, S.A. Shoreline Change Analysis for Northern Part of the Coromandel Coast. Aquat. Procedia 2015, 4, 317–324. [Google Scholar] [CrossRef]
  9. Genz, A.S.; Fletcher, C.H.; Dunn, R.A.; Frazer, L.N.; Rooney, J.J. The predictive accuracy of shoreline change rate methods and alongshore beach variation on Maui, Hawaii. J. Coast. Res. 2007, 23, 87–105. [Google Scholar] [CrossRef]
  10. Jayakumar, K.; Malarvannan, S. Assessment of shoreline changes over the Northern Tamil Nadu Coast, South India using WebGIS techniques. J. Coast. Conserv. 2016, 20, 477–487. [Google Scholar] [CrossRef]
  11. Kv, P.; Sriganesh, J.; Annadurai, R. Coastal Structures’ Influence on the North Chennai Shore using Remote Sensing and GIS Techniques. Adv. Res. Public 2015, 2, 3–4. [Google Scholar]
  12. Mahapatra, M.; Ratheesh, R.; Rajawat, A.S. Shoreline Change Analysis along the Coast of South Gujarat, India, Using Digital Shoreline Analysis System. J. Indian Soc. Remote Sens. 2014, 42, 869–876. [Google Scholar] [CrossRef]
  13. Abdul Maulud, K.N.; Selamat, S.N.; Mohd, F.A.; Md Noor, N.; Wan Mohd Jaafar, W.S.; Kamarudin, M.K.A.; Ariffin, E.H.; Adnan, N.A.; Ahmad, A. Assessment of Shoreline Changes for the Selangor Coast, Malaysia, Using the Digital Shoreline Analysis System Technique. Urban Sci. 2022, 6, 71. [Google Scholar] [CrossRef]
  14. Kumar, T.S.; Mahendra, R.S.; Nayak, S.; Radhakrishnan, K.; Sahu, K.C. Coastal vulnerability assessment for Orissa State, East Coast of India. J. Coast. Res. 2010, 26, 523–534. [Google Scholar] [CrossRef]
  15. Woodruff, J.D.; Irish, J.L.; Camargo, S.J. Coastal flooding by tropical cyclones and sea-level rise. Nature 2013, 504, 44–52. [Google Scholar] [CrossRef] [PubMed]
  16. Du, Y.; Zhang, Y.; Ling, F.; Wang, Q.; Li, W.; Li, X. Water Bodies’ Mapping from Sentinel-2 Imagery with Modified Normalized Difference Water Index at 10-m Spatial Resolution Produced by Sharpening the SWIR Band. Remote Sens. 2016, 8, 354. [Google Scholar] [CrossRef]
  17. Ford, M. Shoreline changes interpreted from multi-temporal aerial photographs and high resolution satellite images: Wotje Atoll, Marshall Islands. Remote Sens. Environ. 2013, 135, 130–140. [Google Scholar] [CrossRef]
  18. Debnath, J.; Sahariah, D.; Lahon, D.; Nath, N.; Chand, K.; Meraj, G.; Kumar, P.; Singh, S.K.; Kanga, S.; Farooq, M. Assessing the impacts of current and future changes of the planforms of river Brahmaputra on its land use-land cover. Geosci. Front. 2023, 14, 101557. [Google Scholar] [CrossRef]
  19. Tha, T.; Piman, T.; Bhatpuria, D.; Ruangrassamee, P. Assessment of Riverbank Erosion Hotspots along the Mekong River in Cambodia Using Remote Sensing and Hazard Exposure Mapping. Water 2022, 14, 1981. [Google Scholar] [CrossRef]
  20. Murali, M.; Ali, P.Y.; Narayana, A.C. Geospatial Technologies and Climate Change. Mar. Geod 2014, 38, 26–39. [Google Scholar] [CrossRef]
  21. Daud, S.; Milow, P.; Zakaria, R.M. Analysis of Shoreline Change Trends and Adaptation of Selangor Coastline, Using Landsat Satellite Data. J. Indian Soc. Remote Sens. 2021, 49, 1869–1878. [Google Scholar] [CrossRef]
  22. Nassar, K.; Mahmod, W.E.; Fath, H.; Masria, A.; Nadaoka, K.; Negm, A. Shoreline change detection using DSAS technique: Case of North Sinai coast, Egypt. Mar. Georesour. Geotechnol. 2019, 37, 81–95. [Google Scholar] [CrossRef]
  23. Thieler, E.R.; Himmelstoss, E.A.; Zichichi, J.L.; Ergul, A. Digital Shoreline Analysis System (DSAS) version 4.0— An ArcGIS extension for calculating shoreline change. U.S. Geol. Surv. Open-File Rep. 2008, 1278. Available online: http://woodshole.er.usgs.gov/project-pages/DSAS/ (accessed on 12 April 2023).
  24. Himmelstoss, E.A.; Henderson, R.E.; Kratzmann, M.G.; Farris, A.S. Digital Shoreline Analysis System (DSAS) Version 5.0 User Guide. U.S. Geol. Surv. Open-File Rep. 2018, 2021–1091, 1–104. [Google Scholar]
  25. Mageswaran, T.; Sachithanandam, V.; Sridhar, R.; Mahapatra, M.; Purvaja, R.; Ramesh, R. Impact of sea level rise and shoreline changes in the tropical island ecosystem of Andaman and Nicobar region, India. Nat. Hazards 2021, 109, 1717–1741. [Google Scholar] [CrossRef]
  26. Jayanthi, M.; Thirumurthy, S.; Samynathan, M.; Duraisamy, M.; Muralidhar, M.; Ashokkumar, J.; Vijayan, K.K. Shoreline change and potential sea level rise impacts in a climate hazardous location in southeast coast of India. Environ. Monit. Assess. 2018, 190, 1–14. [Google Scholar] [CrossRef]
  27. Ahammed, K.K.B.; Pandey, A.C. Shoreline morphology changes along the Eastern Coast of India, Andhra Pradesh by using geospatial technology. J. Coast. Conserv. 2019, 23, 331–353. [Google Scholar] [CrossRef]
  28. Vidya, R.; Biradar, R.S.; Inamdar, A.B.; Srivastava, S.; Pikle, M. Assessment of shoreline changes of Alibag coast (Maharashtra, India) using remote sensing and GIS. J. Mar. Biol. Assoc. India 2015, 57, 83–89. [Google Scholar] [CrossRef]
  29. Yunus, A.P.; Dou, J.; Avtar, R.; Narayana, A.C. Shoreline and coastal morphological changes induced by the 2004 indian ocean tsunami in the Katchal Island, Andaman and Nicobar–A study using archived satellite images. Coast. Res. Libr. 2016, 14, 65–77. [Google Scholar] [CrossRef]
  30. Ratheesh, R.; Rajput, P.; Bhatti, H.; Rajawat, A.S.; Rajak, D.R. Quantification of shoreline changes along the entire Indian coast using Indian Remote Sensing satellite images of 2004–2006 and 2014–2016. Curr. Sci. 2023, 124, 578–584. [Google Scholar] [CrossRef]
  31. Ankrah, J.; Monteiro, A.; Madureira, H. Shoreline Change and Coastal Erosion in West Africa: A Systematic Review of Research Progress and Policy Recommendation. Geoscience 2023, 13, 59. [Google Scholar] [CrossRef]
  32. Thomas, G.A.J.; Ravindranath, R.R.S.; Jeyagopal, S.; Yoganandham, S.T. Statistical analysis of shoreline change reveals erosion and baseline are increasing off the northern Tamil Nadu Coasts of India. Environ. Monit. Assess. 2023, 195, 409. [Google Scholar] [CrossRef]
  33. Singh, S.; Meraj, G.; Kumar, P.; Singh, S.K.; Kanga, S.; Johnson, B.A.; Prajapat, D.K.; Debnath, J.; Sahariah, D. Decoding Chambal River Shoreline Transformations: A Comprehensive Analysis Using Remote Sensing, GIS, and DSAS. Water 2023, 15, 1793. [Google Scholar] [CrossRef]
  34. Rajendran, C.P.; Rajendran, K.; Anu, R.; Earnest, A.; Machado, T.; Mohan, P.M.; Freymueller, J. Crustal deformation and seismic history associated with the 2004 Indian Ocean earthquake: A perspective from the Andaman-Nicobar Islands. Bull. Seismol. Soc. Am. 2007, 97, S174–S191. [Google Scholar] [CrossRef]
  35. Pereira, G.F.; Gurugnanam, B.; Goswami, S.; Choudhury, S. Application of Geospatial Techniques to Determine Coastal Erosion and Accretion along the Ramanathapuram Shore, Tamil Nadu, India. J. Geol. Soc. India 2022, 98, 1261–1270. [Google Scholar] [CrossRef]
  36. Tomar, P.; Singh, S.K.; Kanga, S.; Meraj, G.; Kranjčić, N.; Đurin, B.; Pattanaik, A. GIS-Based Urban Flood Risk Assessment and Management—A Case Study of Delhi National Capital Territory (NCT), India. Sustainability 2021, 13, 12850. [Google Scholar] [CrossRef]
  37. Kinsela, M.A.; Morris, B.D.; Linklater, M.; Hanslow, D.J. Second-Pass Assessment of Potential Exposure to Shoreline Change in New South Wales, Australia, Using a Sediment Compartments Framework. J. Mar. Sci. Eng. 2017, 5, 61. [Google Scholar] [CrossRef]
  38. Appeaning Addo, K.; Larbi, L.; Amisigo, B.; Ofori-Danson, P.K. Impacts of Coastal Inundation Due to Climate Change in a CLUSTER of Urban Coastal Communities in Ghana, West Africa. Remote Sens. 2011, 3, 2029–2050. [Google Scholar] [CrossRef]
  39. Sil, B.S.; Ashwini, K.; Annayat, W.; Debnath, J.; Farooq, M.; Meraj, G. Observing Spatiotemporal Inconsistency of Erosion and Accretion in the Barak River Using Remote Sensing and GIS Techniques. Conservation 2023, 3, 14–31. [Google Scholar] [CrossRef]
  40. Quang, D.N.; Ngan, V.H.; Tam, H.S.; Viet, N.T.; Tinh, N.X.; Tanaka, H. Long-Term Shoreline Evolution Using DSAS Technique: A Case Study of Quang Nam Province, Vietnam. J. Mar. Sci. Eng. 2021, 9, 1124. [Google Scholar] [CrossRef]
  41. Bera, A.; Meraj, G.; Kanga, S.; Farooq, M.; Singh, S.K.; Sahu, N.; Kumar, P. Vulnerability and Risk Assessment to Climate Change in Sagar Island, India. Water 2022, 14, 823. [Google Scholar] [CrossRef]
  42. Kongsen, S.; Phantuwongraj, S.; Choowong, M.; Chawchai, S.; Udomsak, S.; Chansom, C.; Ketthong, C.; Surakiatchai, P.; Miocic, J.M.; Preusser, F. Multi-proxy approach to identify the origin of high energy coastal deposits from Laem Son National Park, Andaman Sea of Thailand. Quat. Int. 2022, 625, 82–95. [Google Scholar] [CrossRef]
  43. Debnath, J.; Sahariah, D.; Lahon, D.; Nath, N.; Chand, K.; Meraj, G.; Farooq, M.; Kumar, P.; Kanga, S.; Singh, S.K. Geospatial modeling to assess the past and future land use-land cover changes in the Brahmaputra Valley, NE India, for sustainable land resource management. Environ. Sci. Pollut. Res. 2022. [Google Scholar] [CrossRef] [PubMed]
  44. Meraj, G. Assessing the Impacts of Climate Change on Ecosystem Service Provisioning in Kashmir Valley India. Ph.D. Thesis, Suresh Gyan Vihar University, Jaipur, India, 2021. [Google Scholar]
  45. Meraj, G.; Singh, S.K.; Kanga, S.; Islam, M.N. Modeling on comparison of ecosystem services concepts, tools, methods and their ecological-economic implications: A review. Model. Earth Syst. Environ. 2022, 8, 15–34. [Google Scholar] [CrossRef]
  46. Meraj, G.; Farooq, M.; Singh, S.K.; Islam, M.N.; Kanga, S. Modeling the sediment retention and ecosystem provisioning services in the Kashmir valley, India, Western Himalayas. Model. Earth Syst. Environ. 2022, 8, 3859–3884. [Google Scholar] [CrossRef]
  47. Ndhlovu, N.; Saito, O.; Djalante, R.; Yagi, N. Assessing the Sensitivity of Small-Scale Fishery Groups to Climate Change in Lake Kariba, Zimbabwe. Sustainability 2017, 9, 2209. [Google Scholar] [CrossRef]
  48. Mozumder, M.M.H.; Wahab, M.A.; Sarkki, S.; Schneider, P.; Islam, M.M. Enhancing Social Resilience of the Coastal Fishing Communities: A Case Study of Hilsa (Tenualosa Ilisha H.) Fishery in Bangladesh. Sustainability 2018, 10, 3501. [Google Scholar] [CrossRef]
  49. Griggs, G.; Reguero, B.G. Coastal Adaptation to Climate Change and Sea-Level Rise. Water 2021, 13, 2151. [Google Scholar] [CrossRef]
  50. Zhang, Y.; Hou, X. Characteristics of Coastline Changes on Southeast Asia Islands from 2000 to 2015. Remote Sens. 2020, 12, 519. [Google Scholar] [CrossRef]
  51. Kanga, S.; Singh, S.K.; Meraj, G.; Kumar, A.; Parveen, R.; Kranjčić, N.; Đurin, B. Assessment of the Impact of Urbanization on Geoenvironmental Settings Using Geospatial Techniques: A Study of Panchkula District, Haryana. Geographies 2022, 2, 1–10. [Google Scholar] [CrossRef]
  52. Yang, L.; Jiao, H. Spatiotemporal Changes in Ecosystem Services Value and Its Driving Factors in the Karst Region of China. Sustainability 2022, 14, 6695. [Google Scholar] [CrossRef]
  53. Meraj, G. Ecosystem service provisioning–underlying principles and techniques. SGVU J. Clim. Chang. Water 2020, 7, 56–64. [Google Scholar]
  54. Lavane, K.; Kumar, P.; Meraj, G.; Han, T.G.; Ngan, L.H.B.; Lien, B.T.B.; Van Ty, T.; Thanh, N.T.; Downes, N.K.; Nam, N.D.G.; et al. Assessing the Effects of Drought on Rice Yields in the Mekong Delta. Climate 2023, 11, 13. [Google Scholar] [CrossRef]
  55. Meraj, G.; Kanga, S.; Ambadkar, A.; Kumar, P.; Singh, S.K.; Farooq, M.; Johnson, B.A.; Rai, A.; Sahu, N. Assessing the Yield of Wheat Using Satellite Remote Sensing-Based Machine Learning Algorithms and Simulation Modeling. Remote Sens. 2022, 14, 3005. [Google Scholar] [CrossRef]
  56. Farooq, M.; Mushtaq, F.; Meraj, G.; Singh, S.K.; Kanga, S.; Gupta, A.; Kumar, P.; Singh, D.; Avtar, R. Strategic Slum Upgrading and Redevelopment Action Plan for Jammu City. Resources 2022, 11, 120. [Google Scholar] [CrossRef]
Figure 1. Study area map displaying (a) the India region, (b) the Andaman and Nicobar Islands, and (c) the selection of zones (A, B, C, and D) for assessing the immediate impact and periodical impact of the tsunami on South Andaman’s coastal shoreline.
Jmse 11 01134 g001
Figure 2. A shoreline dataset including baseline (black), transect (gray), and shoreline data (multicolor) to illustrate the relationship between net shoreline movement (NSM) and shoreline change envelope (SCE).
Jmse 11 01134 g002
Figure 3. Comparison of root mean square error (RMSE) values for Landsat-7 and Google Earth, showcasing the accuracy of these data sources in analyzing coastal shoreline changes.
Jmse 11 01134 g003
Figure 4. Immediate coastal line changes (2004–2005) of zone A of South Andaman: (a) shoreline change envelop (SCE) showing the migration of the 2005 coastal line from the 2004 coastal line, and (b) end point rate (EPR) showing erosion and accretion of the coastal shoreline between 2004 and 2005.
Jmse 11 01134 g004
Figure 5. Immediate coastal shoreline changes (2004–2005) of zone B, South Andaman: (a) shoreline change envelop (SCE) showing the migration of the 2005 coastal line from the 2004 coastal line, and (b) end point rate showing erosion and accretion of the coastal shoreline between 2004 and 2005.
Jmse 11 01134 g005
Figure 6. Immediate coastal shoreline changes (2004–2005) of zone C, South Andaman: (a) shoreline change envelop (SCE) showing the migration of the 2005 coastal line from the 2004 coastal line, and (b) end point rate showing erosion and accretion of the coastal shoreline between 2004 and 2005.
Jmse 11 01134 g006
Figure 7. Immediate coastal shoreline changes (2004–2005) of zone D, South Andaman: (a) shoreline change envelop (SCE) showing the migration of the 2005 coastal line from the 2004 coastal line, and (b) end point rate showing erosion and accretion of the coastal shoreline between 2004 and 2005.
Jmse 11 01134 g007
Figure 8. Comprehensive representation of erosion and accretion patterns in the South Andaman coastal shoreline, categorized by zones, to demonstrate the varying impacts on each area.
Jmse 11 01134 g008
Figure 9. Periodical changes (1990–2023) of zone A, South Andaman: (a) showing the most significant distance between the shoreline, (b) distance between the oldest (1990) and most recent shorelines (2023), and (c) end point rate, showing erosion and accretion of the coastal shoreline between 1990 and 2023.
Jmse 11 01134 g009
Figure 10. Periodical changes (1990–2023) of zone B, South Andaman: (a) showing the most significant distance between the shoreline, (b) distance between the oldest (1990) and most recent shorelines (2023), and (c) end point rate, showing erosion and accretion of the coastal shoreline between 1990 and 2023.
Jmse 11 01134 g010
Figure 11. Periodical changes (1990–2023) of zone C, South Andaman: (a) showing the most significant distance between the shoreline, (b) distance between the oldest (1990) and most recent shorelines (2023), and (c) end point rate, showing erosion and accretion of the coastal shoreline between 1990 and 2023.
Jmse 11 01134 g011
Figure 12. Periodical changes (1990–2023) of zone D, South Andaman: (a) showing the most significant distance between the shoreline, (b) distance between the oldest (1990) and most recent shorelines (2023), and (c) end point rate, showing erosion and accretion of the coastal shoreline between 1990 and 2023.
Jmse 11 01134 g012
Figure 13. Comprehensive representation of periodical erosion and accretion patterns in the South Andaman coastal shoreline, categorized by zones, to demonstrate the varying impacts on each area.
Jmse 11 01134 g013
Figure 14. Cross-plot illustrating shoreline change through the linear regression rate (LRR), showcasing the relationship between shoreline positions and time.
Jmse 11 01134 g014
Table 1. Shoreline change envelope (m) of all zones for immediate effect on the coastal shoreline changes.
Shoreline Change EnvelopeZone AZone BZone CZone D
Number of transects (overall)200537544129
Average distance (m)108.86120.36115.9174.75
Maximum distance (m)236.61199.51260.88206.33
Transect ID (maximum distance, m)1641551413
Minimum distance (m)0.480.021.980.01
Transect ID (minimum distance, m)138390292125
Table 2. End point rate (m/year) of all zones for immediate effect on the coastal shoreline changes.
End Point RateZone AZone BZone CZone D
Number of transects (overall)200537544129
Avg. rate (m/year)−202.7531.42−100.44−10.7
Number of erosional transects14613450174
% of all transects that are erosional73%24.95%92.10%57.36%
Greatest value of erosion (m)−862.11−27.51−261.59−88.07
Transect ID (maximum value, erosion)16447851413
All erosional rates (m/year) (average)−410.55−17.44−117.63−37.14
Number of accretional transects544034355
% of all transects that are accretional27%75.05%7.90%42.64%
% of transects with statistically significant accretion27%74.86%7.90%39.53%
Greatest value of accretion (m)686.5366.5197.9465.89
Transect ID (maximum value, accretion)1151538742
All accretional rates (m/year) (average)359.0747.6699.8432.9
Table 3. Periodical shoreline change envelope (m) of all zones of the coastal shoreline changes.
Shoreline Change EnvelopeZone AZone BZone CZone D
Number of transects (overall)215217224259
Average distance (m)9681.39105.0657.43
Maximum distance (m)258.31175.33259.49176.07
Transect ID (maximum distance, m)1069196200
Minimum distance (m)0.9817.0223.78.36
Transect ID (minimum distance, m)17513171225
Table 4. Periodical net shoreline movement (m) of all zones of the coastal shoreline changes.
Net Shoreline Movement (m)Zone AZone BZone CZone D
Number of transects (overall)215217224259
Average distance (m)71.12−20.827.4145.54
Number of transects (negative distance)3814112131
% of all transects (negative distance)17.67%64.98%54.02%11.97%
Maximum negative distance165.99−125.37−104.61−110.2
Maximum negative distance, transect ID186426272
Average of all negative distances42.59−51.95−48.13−24.8
Number of transects (positive)17776103228
% of all transects (positive distance)82.33%35.02%45.98%88.03%
Maximum positive distance258.31112.01218.81176.07
Maximum positive distance, transect ID1069193200
Average of all positive distances95.5436.9372.6555.11
Table 5. Periodical end point rate (m/year) of all zones of the coastal shoreline changes.
End Point RateZone AZone BZone CZone D
Number of transects (overall)215217224259
Avg. rate (m)2.18−0.640.231.39
Number of erosional transects3814112131
% of all transects that are erosional14.88%63.13%53.12%11.2%
Greatest value of erosion (m) −5.08−3.83−3.2−3.37
Transect ID (maximum value, erosion)186426272
All erosional rates (meter/year) (average)−2.3−1.59−1.47−0.76
Number of accretional transects17776103228
% of all transects that are accretional82.33%35.02%45.98%88.03%
% of transects with statistically significant accretion79.53%34.1%44.64%87.64%
Greatest value of accretion (m)7.913.426.695.38
Transect ID (maximum value, accretion) 1069193200
All accretional rates (meter/year) (average)2.931.132.221.68
Disclaimer/Publisher’s Note: The statements, opinions and data contained in all publications are solely those of the individual author(s) and contributor(s) and not of MDPI and/or the editor(s). MDPI and/or the editor(s) disclaim responsibility for any injury to people or property resulting from any ideas, methods, instructions or products referred to in the content.

