Abstract
This trial aimed to assess the growth performance of trout (Oncorhynchus mykiss) fed novel formulations, evaluate fish welfare status, and determine flesh quality as part of the evaluation of sustainable feeds. A control diet containing fish meal and soy products (CTRL) was compared to: a diet with processed animal proteins (PAP); a diet without PAP (NoPAP); a PAP diet lower in protein (PAP−); and a NoPAP diet higher in protein (NoPAP+). Groups of 50 fish, weighing 58.84 ± 1.39 g (IBW), were allocated to 20 tanks and fed with formulated diets ad libitum over 91 days. Better growth performance was observed after the experiment in fish fed the NoPAP+ diet when compared to other diets. Protein retention was higher in CTRL diets than in PAP and PAP− diets. Protein and phosphorous digestibility were lower in fish fed PAP− diet. Diets did not influence the texture analysis. However, sensory analysis revealed higher acceptance for fish fed the NoPAP diet when compared to the PAP diet. Lysozyme was higher in the NoPAP diet than in other treatments. In addition, long-term predictions using FEEDNETICSTM software suggest some of these alternative formulations may be economically sustainable. Overall, these results support the hypothesis that the new formulations are viable options for trout farming.
1. Introduction
Over the past few decades, considerable effort has been made to find practical alternatives to reduce the aquafeed industry’s reliance on marine-derived ingredients, i.e., fish meal (FM) and fish oil (FO). Sustainability concerns, i.e., responsible consumption and production and life below water goals from the United Nations (UN) Sustainable Development Goals (SDGs), have been the main driving forces behind such efforts [1,2]. Additionally, due to the unlikely increase in global production of FM and FO beyond current levels, it is expected that in the near future the overall supply will become increasingly insufficient to meet the already reduced current inclusion levels in many species and sustain the still growing aquaculture production [3,4,5].
So far, research undertaken since the 1960s and 1970s has led to the successful large-scale replacement of FM and FO by alternative ingredients from terrestrial plant sources. Presently, it is a common practice in aquafeed production to use ingredients derived from various terrestrial plants (e.g., soybean, canola, lupin, peas, wheat, corn, and linseed) as partial substitutes for FM and FO [6,7,8]. However, there are in some cases serious limitations in using these types of ingredients as total substitutes of FM and FO [3], as most plant ingredients have relatively limited nutritional value (e.g., imbalanced amino acid and fatty acid profiles) and/or biological components (e.g., anti-nutritional factors) that can negatively affect the performance, health, and well-being of some fish species [9].
Given the aforementioned achievements as well as the associated limitations, in recent years there has been a slight shift in aquafeed research, with the focus being progressively placed on expanding the range of alternative sources of ingredients.
Protein sources, such as processed animal proteins from terrestrial animals (PAPs; e.g., poultry by-product meal, blood meal, and feather meal), insect meal (e.g., black soldier fly and yellow mealworm), single-cell protein (SCP; e.g., microalgae, yeasts, bacteria, and protists), and macroalgae (e.g., Ulva, Gracilaria, and Laminaria), have been increasingly studied as potential novel alternatives to FM and terrestrial plant proteins [10,11]. Some have been shown to be well utilized by fish when incorporated at moderate levels, as is the case with PAPs that are already being used on a commercial scale [12]. Others still require further research in order to be considered viable options to be used at larger scales, as is the case with insect meal, with outcomes varying substantially with the processing methods applied, inclusion levels considered, and insect/fish species evaluated [13]. Other alternative protein sources, such as fish protein hydrolysates (FPH), have also gained attention in recent years since they can be produced from waste discarded by fish processing units (e.g., heads, skin, muscle, viscera, and bones), thus contributing to increasing the circularity of resources [14]. A detailed overview of the research carried out to date on the impact of these new protein sources on fish performance and health, along with other considerations for large-scale use, can be found in various reviews available in the literature [10,13,15,16].
Finding new alternatives to replace FO has also been a growing concern in aquafeed research, as it is critical to the sustainable growth of aquaculture. Marine fish, for example, require considerable levels of long-chain polyunsaturated fatty acids (LC-PUFAs) [17]. However, available alternatives to FO from terrestrial plant sources, such as canola, linseed, or soybean oils, have low levels of LC-PUFAs, e.g., arachidonic acid (ARA), eicosapentaenoic acid (EPA), and docosahexaenoic acid (DHA) [18,19,20]. This limits the incorporation of vegetable oils (VO) at high levels in aquafeeds for marine fish, as it can lead to reduced performance and adverse health issues in fish [21]. For this reason, current research has focused on developing aquafeeds that allow the use of relatively high levels of VO without impairing fish performance. Such research has been based on testing the incorporation of oils highly rich in LC-PUFAs, as is the case with oils extracted from some microalgae species [22,23,24]. However, due to the still relatively high cost of these types of ingredients, their incorporation is currently limited to small amounts on a commercial scale. Nevertheless, in the specific case of rainbow trout (Oncorhynchus mykiss), studies have demonstrated that it is possible to totally replace FO with VO without compromising growth performance or nutrient utilization efficiency [25,26]. However, the use of finfish diets rich in omega-3 fatty acids has been advised in these cases to ensure that this food product is still a viable source of omega-3 fatty acids in the human diet. This makes the search for alternative sources of LC-PUFAs a valid and relevant effort for the development of more sustainable feeding not only of marine species but of other fish species (i.e., diadromous and freshwater), including rainbow trout.
Consumer acceptance and fillet quality are also important components when developing novel aquafeeds, since consumers are at the top of the supply chain. Consumers presently are more likely to care about the sustainability of the products they are buying. Although few studies have been published on the consumer acceptance of farmed fish fed aquafeeds with alternative ingredients, the existing ones indicate that consumers are generally willing to accept the inclusion of these types of ingredients in the fish diet (e.g., insect meal) [27,28]. Other studies revealed that the level of education influences the choice of sustainable seafood consumption in Germany [29], but the choice of more sustainable aquaculture is also country-dependent and strongly impacted by misleading information from the media [30]. In terms of the impact of novel aquafeeds on the fillet quality of fish, previous research has found that, in most cases, FM and FO replacement do not lead to significant negative effects [31,32]. However, this type of sensory analysis is context-specific, and performing it in new contexts can provide a more holistic view of the overall impact of novel diets while also taking consumer perception into account [33].
Given the importance of finding practical solutions to reduce the inclusion of FM and FO in aquafeeds, the present study, carried out in the context of the EU-funded GAIN (Green Aquaculture Intensification in Europe) project (www.gain2020.com), focused on the evaluation of the impact of novel diets formulated with emerging ingredients on rainbow trout (Oncorhynchus mykiss) through the objectives of (1) an in vivo growth trial, carried out over 91 days under controlled conditions; (2) flesh quality and sensory analysis of fish after the in vivo trial; and (3) in silico extrapolation scenarios, performed considering commercial-like farming conditions.
2. Materials and Methods
2.1. Diets
The diet formulation framework followed to produce the test aquafeeds aimed to prioritize the use of ingredients derived from by-products (e.g., PAPs and aquaculture/fisheries by-products), as well as the inclusion of a high diversity of other novel alternative sources (e.g., micro and macroalgae, microbial meal, and insect meal), with the goal of finding more sustainable ready-to-use formulations that can be readily adopted by the aquafeed industry.
The alternative ingredients selected were defined based on circularity principles, contributing towards low waste in the agri-food value chain to optimize sustainability within the current/predictable regulatory framework. The diets were formulated according to the known nutritional requirements for rainbow trout (Oncorhynchus mykiss) [17] and manufactured by extrusion at SPAROS facilities. The trial comprised five experimental diets (Table 1). In particular, a control diet (CTRL), mimicking a good-quality commercial diet, contained a low inclusion level of fish meal along with traditional soy products, which was compared against four alternative formulations: a diet rich in processed terrestrial animal proteins (PAP); another one without the inclusion of PAPs (NoPAP); a diet similar to PAP but with a lower protein content (PAP−); and a diet similar to NoPAP but with a higher protein content (NoPAP+). All diets included a mix of fish protein hydrolysates produced by the GAIN project consortium based on turbot, salmon, seabream, and seabass by-products. All diets were formulated to be isolipidic, and the first three aforementioned (i.e., CTRL, PAP, and NoPAP) were also isoenergetic and isoproteic. Dietary amino acid and fatty acid contents are available in Tables S1 and S2.

Table 1.
Formulation and proximate composition of the experimental diets for trout (O. mykiss).
All powder ingredients were admixed accordingly to the target formulation in a double-helix mixer (model 500 L, TGC Extrusion, Roullet-Saint-Estèphe, France) and ground (below 400 µm) in a micro-pulverizer hammer mill (model SH1, Hosokawa-Alpine, Augsburg, Germany). Diets (pellet size changed according to species and fish size) were manufactured with a twin-screw extruder (model BC45, Clextral, France) with a screw diameter of 55.5 mm. Extrusion conditions: feeder rate (80–85 kg/h), screw speed (247–266 rpm), water addition in barrel 1 (345–360 mL/min), temperature barrel 1 (30–35 °C), temperature barrel 3 (105–120 °C). Extruded pellets were dried in a vibrating fluid bed dryer (model DR100, TGC Extrusion, Firminy, France). After cooling, an oil blend was embedded by vacuum coating (model PG-10VCLAB, Dinnissen, Sevenum, The Netherlands). Coating conditions were: pressure (700 mbar); spraying time under vacuum (approximately 90 s); return to atmospheric pressure (120 s). Immediately after coating, diets were packed in sealed plastic buckets and shipped to the research site, where they were stored at room temperature but in a cool and aerated emplacement. Representative samples of each diet were taken for composition analysis.
2.2. Growth Trial
The growth trial was conducted at the experimental facilities of Fondazione Edmund Mach (FEM, San Michele all’Adige, Italy). A rainbow trout (Oncorhynchus mykiss) batch (approx. 2000 individuals), which originated from a bigger resident FEM stock, was transferred to the experimental facilities and kept in sanitary quarantine for 6 days. At the start of the trial, fish were manually sorted by weight to constitute a homogenous subsample of 1000 individuals.
Groups of 50 fish, with a mean initial body weight (IBW) of 58.84 ± 1.39 g, were randomly allocated in 20 tanks (approx. 1000 L, 700 L of water). All tanks were located indoors, supplied with well water in an independent flow-through rearing scheme, and subjected to a natural photoperiod (46°11′30.3″ N, 11°08′05.3″ E). Water quality parameters, such as temperature and dissolved oxygen, were monitored repeatedly during the trial. The mean water temperature was 13.3 ± 0.2 °C, and the dissolved oxygen was 8.0 ± 0.8 mg/L. Each diet was tested in four replicates in a randomized design. Fish were fed by hand until apparent satiation, twice a day (09.00 a.m. and 02.00 p.m.), six days per week (no feeding on Sundays), over 91 days. Administered feed per tank was registered on a daily basis. Anesthetized fish were individually weighed and measured at the start (day 0) and end (day 91) of the trial, whereas a bulk weight of all fish in each tank was carried out in the middle of the trial (day 49). At the start, 30 fish from the same source stock were sampled and stored at −20 °C for subsequent whole-body composition analysis. At the end of the trial, five fish from each tank were euthanized, from which blood samples were collected for lysozyme analysis, and six fish from each tank were sacrificed for whole-body composition analysis. In addition, twenty fish collected from the tanks fed with CTRL, PAP, and NoPAP diets were killed by a sharp blow to the head, bled, gutted, stored on ice, and sent to the lab for sensory analysis with a trained panel. The remaining individuals in each tank were assigned to flesh quality analysis (TPA and color).
2.3. Apparent Digestibility Measurements
Feces were sampled at day 91 to determine the apparent digestibility coefficients (ADC) of the diets by the indirect method [34]. All the different diets in which fish were fed throughout the experimental period contained yttrium oxide (Y2O3) at 0.02% as an inert marker. Feces were collected from all anesthetized fish by stripping [35], pooled per tank into a plastic container, and two subsamples (100 g each) were stored frozen at −20 °C until lab analysis.
2.4. Analytical Methods
The analysis of diets, whole fish, and feces was made with analytical duplicates, following in most cases the methodology described by [36]. Dry matter after drying at 105 °C for 24 h; total ash by combustion (550 °C during 6 h) in a muffle furnace; crude protein (N × 6.25) by a flash combustion technique followed by a gas chromatographic separation and thermal conductivity detection with a Leco N Analyzer (Model FP-528, Leco Corporation, USA); crude lipid by petroleum ether extraction (40–60 °C) using a Soxtec™ 2055 Fat Extraction System (Foss, Hillerød, Denmark), with prior acid hydrolysis with 8.3 M HCl; gross energy in an adiabatic bomb calorimeter (Werke C2000, IKA, Hohenems, Austria); total phosphorus according to ISO 27085:2009 by ICP-AES methodology) [37]; yttrium concentration in feed and feces was determined by atomic absorption spectrometry (SpectrAA 220 FS, Varian) [38]. For mineral analysis, dry samples were weighed (50–200 mg) in quartz vessels. Samples were then digested in 6 mL of nitric acid (HNO3 tracer grade, 70%) in a Discovery SP-D microwave digestion unit according to the following program: 200 °C; 4 min ramp; 3 min hold. The samples were then cooled to room temperature, and a final volume of 10 mL was achieved by adding ultrapure water. The samples were subsequently diluted 16x in ultrapure water, and standard curves were prepared in ultrapure water. Mineral quantification was performed by MP-AES (Agilent, model 4200). Blank samples containing only the decomposition acid were included to measure the matrix effects of decomposition, which were subtracted from every element in each sample.
2.5. Evaluation Criteria
Growth performance and feed utilization were evaluated according to the following equations:
Relative growth rate:
where ‘e’ is Euler’s number and g = (ln (FBW) − ln (IBW))/days.
RGR (%BW/day) = (eg − 1) × 100
Feed conversion ratio:
FCR = crude feed intake/weight gain
Weight gain was corrected for mortality and sampled when necessary.
Feed intake:
FI (%BW/day) = (crude feed intake/(IBW + FBW)/2/days) × 100.
Protein efficiency ratio:
PER = wet weight gain/crude protein intake.
The contractions IBW and FBW are assigned for initial mean body weight and final mean body weight, respectively, both expressed in grams (g).
Retention was calculated accordingly using the following equation: where NFF is the nutrient content of the final fish and NIF is the nutrient content of the initial fish, both expressed as a percentage.
Apparent digestibility coefficients (ADC) of dietary nutrients and energy in the experimental diets were calculated according to the NRC [17]:
2.6. Lysozyme
The lysozyme activity was slightly adjusted to the protocol of [39]. The phosphate buffer consisted of 0.05 M NaH2PO4 + 0.05 M Na2HPO4 and was modified with 85% H3PO4 to a pH of 6.2. An amount of 30 mg of Micrococcus luteus (0.6 mg/mL, SIGMA M3770) was mixed with 50 mL of buffer on a daily basis, while 20 mg of lysozyme from egg whites (Lot SLCC4285, 40,382 units/mg, Sigma L6876) was mixed with 20 mL of buffer weekly. The lysozyme-buffer solution was diluted to 1000 U/mL. For the measurement, 96 flat-bottomed well plates (Brandplate 781660) were used and measured in a Berthold Tristar LB941. After calibration of standard curves, 10 µL and 5 µL of plasma were pipetted into the wells with 10 µL and 15 µL of buffer to get a total volume of 20 µL per well. Right before the measurement started, M. luteus was added at 130 µL to the standard curve and all sample preparations. The measurement took place at 450 nm every minute for 10 min. The plate was shaken for 5 s before the first measurement. For each measurement, the standard curve, the samples, and the blanks were measured in triplicate. Between measurements, the solutions were stored at 4 °C and the samples at −20 °C.
2.7. Fish and Fillet Quality Analysis
2.7.1. Body Indexes
The experimental pool consisted of 100 rainbow trout with an average weight of 306.1 ± 55.0 g, representing 5 fish from each tank (20 fish per treatment) collected at the end of the trial. After being killed, the fish were covered with ice and stored at 1 °C for 24 h. The day after, fish were eviscerated, and carcasses, whole viscera, liver, and mesenteric fat were weighted. Then, carcass yield (CY), hepatosomatic index (HSI), viscerosomatic index (VSI), and mesenteric fat index (MFI) were calculated as follows:
CY (%) = 100 × [fish weight (g) − visceral weight (g)/fish weight (g)]
HSI (%) = 100 × [liver weight (g)/fish weight (g)]
VSI (%) = 100 × [visceral weight (g)/fish weight (g)]
MFI (%) = 100 × [mesenteric fat weight (g)/fish weight (g)]
Fish were filleted afterwards.
2.7.2. Texture Profile Analysis (TPA)
The right fillet from each sample (100 fish) was assigned to the Texture Profile Analysis (TPA). Textural features were measured at room temperature on a sample of muscle (a section of 4 × 4 cm) withdrawn from the epaxial region of the fillet. TPA was carried out using a Zwick Roell® 109 texturometer (Ulm, Germany) equipped with a 1 kN load cell and a cylindrical probe (10 mm). Two consecutive cycles (downstroke and upstroke), with a five-second break between them, were set, and the deformation was limited to 50% of the total thickness by a crosshead speed of 100 mm/min. The raw data were collected and analyzed by the Test-Xpert II software version 3.0 (Zwick GmbH and Co. KG, Ulm, Germany). As suggested [40], the following parameters were determined:
- hardness (N), defined as the maximum force required to compress the sample;
- cohesiveness, defined as the area of work during the second compression divided by the area of work during the first compression (Area 2/Area 1);
- gumminess, calculated as hardness × cohesiveness;
- resilience (Nmm), calculated by dividing the upstroke energy of the first compression by the downstroke energy of the first compression (Area 4/Area 3);
- adhesiveness (Nmm), defined as the negative force area under the baseline between compression cycles.
2.7.3. Fillet Color
A Konica-Minolta CR-400 colorimeter was utilized for color measurement carried out according to the CIE Lab system [41]. Flesh color was measured in triplicate on the cranial, dorsal, and caudal sections of the left fillet (Figure 1), recording L* (lightness), a* (redness index), and b* (yellowness index) parameters, then chroma and hue were calculated. Chroma is an expression of the intensity of the color, and hue is an angular measurement of tint.
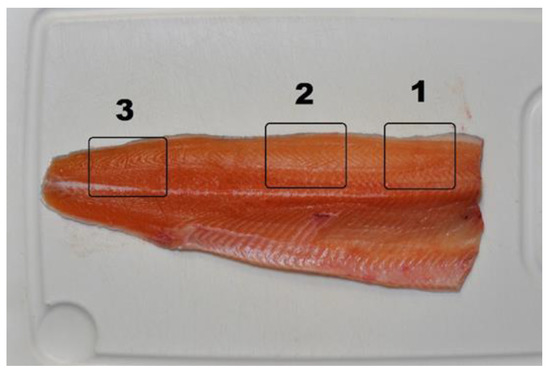
Figure 1.
Sampling points for color analysis on the fillet ((1) cranial, (2) dorsal, and (3) caudal).
CIE Lab and CIE LCh are similar color spaces; the difference between them is the different coordinate systems used to describe the space. The relationships between their respective coordinates are, therefore, as follows:
L* (LAB) ≡ L* (LCH)
C* = √(a*2 + b*2)
h* = arctan(b*/a*)
After that, it is possible to calculate the perceptual difference between samples. Color spaces have been developed to mathematically describe the color that a person can feel with an unaided eye, as there was a need to distinguish colors and define them as similar, identical, or completely different. ΔE is a distance vector in the color space, and his value determines the difference between two measures. Color differences (ΔE) were calculated according to the following formula:
where α and β represent alternatively the mean color values of different treatments. ΔE lab is a single number that represents the ‘distance’ between two given colors, and this distance is proportional to the perceptual difference between them [42]. A standard observer perceives the differences in color presented above as follows:
Δ𝐸 (𝛽 − 𝛼) = [ (𝐿 ∗𝛽 − 𝐿 ∗𝛼)2 + (𝑎 ∗𝛽 − 𝑎 ∗𝛼)2 + (𝑏 ∗𝛽 − 𝑏 ∗𝛼)2 ]0.5
|
|
|
|
|
2.7.4. Sensory Analysis
Fifty fish collected from tanks fed the CTRL, PAP, and NoPAP diets were slaughtered and shipped packed in ice to a specialized laboratory for sensory analysis.
All tests took place at sense test—society for the study of sensory analysis of food products (Porto, Portugal), in a specific tasting room for sensory testing of food products (ISO 8589 sensory analysis—general guidance for the design of test rooms), and were performed by a panel of 100 individuals accustomed to the products being tested. Thus, the effects of physiological factors and physical conditions on human judgment were reduced. All features and products were analyzed using close to natural light (6500 K). Before each test session, a preliminary explanation was given to the tasters on the conditions and rules of the sensory test. Moreover, all rules were handed out with the proof sheets.
The trout fillets were baked in the oven for approximately 12 min at 170 °C, and a small portion was served to each taster. Each sample was served on a white dish. In the tasting booth, a knife, a fork, paper napkins, a glass of water, a spittoon, and crackers were available to the tasters. The tasters were told that the crackers should only be used between tasting sessions in order to easily remove the taste from the mouth.
After tasting, each tester answered a questionnaire in which the parameters appearance, odor, taste, and texture, as well as global acceptance of the flesh, were evaluated. The evaluation consisted of giving scores from 1 to 9, where 1 referred to “extremely disliked” and 9 referred to “extremely liked”. Means and standard deviations from the scores given were calculated, and statistical analysis was performed as described in item 2.9.
2.8. Extrapolation of Trial Results Using a Nutrient-Based Model
The results obtained in the in vivo trial were extrapolated in silico using the FEEDNETICSTM nutrient-based model (software; FEEDNETICS, 2022, Olhão, SPAROS) [43]. The main objective of this application was to evaluate the long-term impact of the experimental diets on the zootechnical and economic performance of rainbow trout cultivated under commercial-like farming conditions.
2.8.1. Model Validation for Trial Conditions
Before running extrapolation scenarios, the model was validated for the conditions in which the trial was conducted in order to assess whether the fish performance predicted by the model is consistent with the observations made in the trial. This gives additional confidence in the robustness of the model in predicting the nutritional effects of the experimental diets under other farming conditions. In addition, it allows us to infer if there are any potential factors not considered by the model that could affect fish performance.
The model validation was performed at the tank level, where the input data considered to run the model were based on measurements/analyses performed during the trial (i.e., daily number of fish, initial average fish weight, daily water temperature, daily amount of feed, and diet composition). The model results and robustness were evaluated qualitatively, through visual inspection of the model behavior over time in comparison with point observations made during the trial, and quantitatively, by estimating the mean absolute percentage error (MAPE) between the model predictions and point observations (i.e., performed in sampling days), as follows:
where
n is the number of predicted-observed value pairs.
Pi is the predicted value.
Oi is the observed value.
2.8.2. Fish Performance under Commercial-like Farming Conditions: Extrapolation Scenarios
Extrapolation scenarios of rainbow trout fed the experimental diets were run with the model, considering hypothetical farming conditions close to what can be found in commercial settings. As a base scenario, we considered an initial average body weight of 50 g, an initial number of fish of 20,000 individuals, and a monthly mortality rate of 1% over the entire simulation period. In each scenario, the feeding rates used by the model were based on a common feeding table adjusted for rainbow trout. Data on diet proximate composition and digestibility were defined based on the analyzed/measured values, while data on diet amino acid profile and price were defined based on values estimated from the dietary ingredient composition. For each diet (i.e., CTRL, PAP, NoPAP, NoPAP+, PAP−), two extrapolation scenarios were run: one considering a constant temperature of 12 °C and the other considering a constant temperature of 16 °C. In total, 10 extrapolation scenarios were run, and their results were evaluated considering a harvest fish weight of about 400 g. Table 2 presents a brief overview of the input data used to run this model application.
Table 2.
Input data used to run the extrapolation scenarios in silico with the FEEDNETICSTM software.
2.9. Statistical Analysis
The data are presented as the mean of four replicates ± standard deviation. Prior to ANOVA or ANCOVA for body indexes NP K-W, values expressed as percentages were subjected to the arcsin square root transformation. Statistical significance was tested at the 0.05 probability level. Statistical tests for growth performance, lysozyme, digestibility, and all analytical methods were performed using the R software (R version 4.1.0; R Core Team, 2021), and flesh quality analysis was performed using STATISTICA (version 13, TIBCO Software Inc., Palo Alto, CA, USA). Regarding the sensory panel analysis, the Wilcoxon non-parametric test was applied to compare the samples pair-wise.
3. Results
3.1. Growth Performance
The results on the growth performance of fish fed the experimental diets are presented in Table 3. Final body weight (FBW) ranged between 291.9 ± 7.3 g and 335.6 ± 6.2 g. This means an individual weight gain of over 200 g compared to their initial body weight (IBW). The NoPAP+ and PAP diets led to better growth in terms of weight gain and relative growth rate (RGR) compared to the CTRL diet, whereas no significant differences were registered between fish fed the CTRL, NoPAP, and PAP− diets. Fish fed the PAP- and NoPAP+ diets showed the worst and the best feed conversion ratio (FCR), respectively, both significantly different (p < 0.05) from the other dietary treatments. The verified feed intake (VFI) was significantly higher in the low-protein diet and lower in the CTRL. Protein efficiency ratio (PER) was lower in diets with PAPs. No significant differences (p > 0.05) were found in the whole-body composition of fish in terms of moisture, ash, crude protein, crude fat, energy, or phosphorus (Table S3).
Table 3.
Growth performance and feed utilization of rainbow trout fed the experimental diets for 91 days.
3.2. Nutrient Retention
The results of crude protein, crude fat, and energy retention in fish fed the experimental diets are shown in Table 4. Fish fed new-formulated diets did not present significant differences in crude fat and energy retention (p > 0.05). However, fish fed the PAP and PAP− diets presented significantly lower (p < 0.05) crude protein retention when compared to fish fed the CTRL diet.
Table 4.
Nutrient and energy retention of rainbow trout fed the experimental diets for 91 days.
3.3. Apparent Digestibility Coefficients
The apparent digestibility coefficients (ADCs) of the experimental diets are presented in Table 5. Fish fed the PAP− diet presented significantly lower digestibility for crude protein and total phosphorus (Total P) when compared to fish fed the other diets. On the other hand, fish fed the NoPAP+ and PAP diets had significantly higher crude fat digestibility when compared to fish fed the CTRL diet, while significantly higher energy digestibility was observed in fish fed PAP when compared to fish fed the CTRL and PAP− diets.
Table 5.
Apparent digestibility coefficients (ADCs) of rainbow trout fed the experimental diets for 91 days.
3.4. Lysozyme
Lysozyme analysis presented different results among dietary treatments (Figure 2). Fish fed the NoPAP diet presented a significantly higher (p < 0.05) concentration (U/mL) of plasma lysozyme when compared to fish fed the CTRL, NoPAP+, and PAP diets.
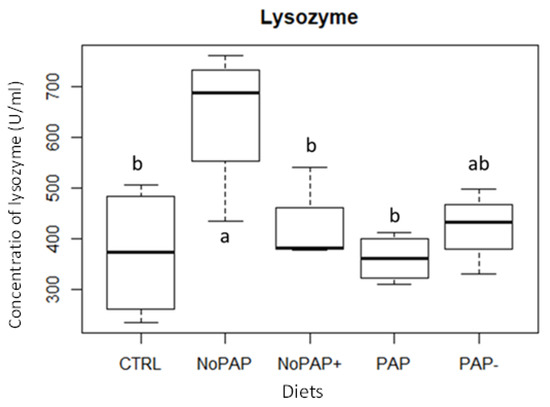
Figure 2.
Lysozyme concentration (U/mL) in trout plasma after experimental period. Different letters indicate significant differences (one-way ANOVA, p < 0.05; Tukey post hoc test, n = 4).
3.5. Viscerosomatic Measurements
The mean weight of the liver, mesenteric fat, and gastrointestinal tract of rainbow trout fed the experimental diets is represented in Figure S1. These values, when added together, represent roughly the whole visceral weight of a fish. Using final body weight (FBW) as a predictor, an ANCOVA on organ and tissue weight was performed. The mean liver weight was significantly higher (p < 0.05) in fish fed the PAP diet (3.43 ± 0.64 g) in relation to fish fed the NoPAP, NoPAP+, and CTRL diets, being that the last one registered the lower mean liver weight (2.99 ± 0.71 g). A similar trend is evident in the mean gastrointestinal tract weight, where the fish fed the PAP diet had the highest value (25.7 ± 4.95 g) and were significantly different from fish fed the NoPAP and NoPAP+ diets, which registered 22.04 ± 6.18 g and 22.65 ± 3.50 g, respectively. No significant differences were observed in the quantity of mesenteric fat between dietary treatments.
The main morphological indexes are shown in Table 6. Morphological differences are mainly detected where carcass yield (CY) differs between diets. Fish fed the CTRL and NoPAP+ diets presented significantly higher (p < 0.05) carcass yields compared to fish fed the other diets. Moreover, it should be pointed out that significant differences (p < 0.05) are notable between CTRL/NoPAP+ and PAP−/PAP groups by mean ANOVA analysis followed by LSD Fisher post hoc comparisons. The viscerosomatic index (VSI) is inversely related to CY. This explains a significantly higher (p < 0.05) VSI for fish fed the PAP and PAP− diets compared to fish fed the CTRL and NoPAP+ diets. The same goes for hepatosomatic index (HSI), where fish fed the CTRL and NoPAP+ diets showed significantly lower values (p < 0.05) compared to fish fed the PAP and PAP− diets.
Table 6.
Morphological indexes of carcass yield (CY), hepatosomatic index (HSI), mesenteric fat index (MFI), and viscerosomatic index (VSI) of rainbow trout fed the experimental diets for 91 days.
3.6. Fillet Quality
3.6.1. Fillet Texture
Textural features were measured 24 h after post-mortem on 100 fillets by texture profile analysis (TPA) using a Zwick Roell® 109 texturometer (Ulm, Germany). Outliers were removed from the dataset by Grubb’s Test, and then a K-W ANOVA was performed. The data are presented in Table 7. The majority of variables (hardness, cohesiveness, resilience, and gumminess) did not show significant differences (p > 0.05) between the experimental diets, whereas statistical differences were observed in adhesiveness. Control and NoPAP+ diets obtained the highest value with 0.44 Nmm, in contrast with PAP−, which obtained the lowest value with 0.33 Nmm. Applying a multiple comparison test (mean of ranks), control differs from PAP and PAP- diets, but NoPAP+ differs only from PAP− due to the higher SD.
Table 7.
Texture profile analysis of fillet of rainbow trout fed the experimental diets for 91 days.
3.6.2. Fillet Color
Color parameters (CIELab values) are significantly different (p < 0.05) among dietary treatments (Table 8). The lightness (L*) of the flesh of fish fed the CTRL and NoPAP+ diets is similar and significantly lower (p < 0.05) than those of the other three diets (NoPAP, PAP, and PAP−). However, it is possible to discriminate the flesh color related to the NoPAP+ from the CTRL diet by the indexes of red (a*) and yellow (b*), both higher in the former than in the latter. Moreover, the red index is rather high for fish fed the PAP− diet too, and it is significantly different (p < 0.05) from the CTRL and NoPAP dietary treatments. In terms of the CIE L*C*h color system, the NoPAP+ and PAP− dietary treatments registered the highest chroma value (or color saturation), but their hue differs clearly between them due to the b* index. This shows us that the flesh color of fish fed the NoPAP+ diet segregates from the other diets since it is in a different quarter of the color space (+b* quarter vs. –b* quarter).
Table 8.
Color analysis of fillet of rainbow trout fed the experimental diets for 91 days.
As shown in Table 9, an unexperienced observer may notice a difference in the flesh color of rainbow trout fed the NoPAP+ diet in relation to the other experimental diets. However, this analysis indicates that it would be more difficult to perceive the difference induced by the CTRL diet compared to the PAP and PAP− diets, as well as the difference induced by the NoPAP diet compared to the PAP− diet. Only the instrumental measurement can discriminate between the other matches.
Table 9.
Total color differences (ΔE Lab) in CIELab color space presented as pairwise comparisons. ∆E < 1—observer does not notice the difference (white background colour), 1 < ∆E < 2—only expe-rienced observer can notice the difference (green background colour), 2 < ∆E < 3.5—unexperienced observer also notices the difference (yellow background colour).
To understand how the colors are different, we can say that a pale gray, pink, or brown color is one feature of the flesh of farmed rainbow trout fed without carotenoids. The instrumental data and the main color indexes suggest that CTRL, PAP, and NoPAP diets range close to this target, whereas a mild pink/orange pigmentation of fillets was observed in the flesh of rainbow trout fed the NoPAP+ diet compared to the other dietary treatments. In contrast with the NoPAP+ treatment, the lack of yellow (b*) in the flesh of fish fed the PAP− diet results in a shift of hue from orange to purple/blue in the eyes of an observer. To conclude, rainbow trout fed the CTRL, PAP, and NoPAP diets showed a flesh color that could be considered by consumers to be more natural in appearance. A visual comparison can be made between the pictures below (Figure 3).
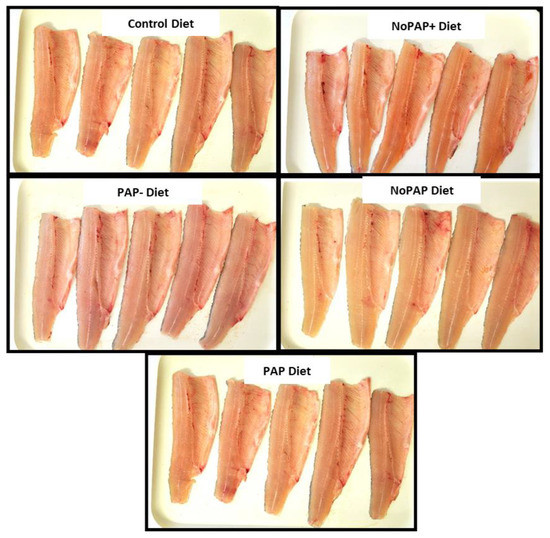
Figure 3.
Each picture shows a subsample of fillets analyzed by colorimeter and CIE Lab method.
3.7. Sensory Analysis
Sensory analysis of baked rainbow trout revealed few differences, resulting in high general acceptance by consumers (Table 10). Consumers considered that fish fed the NoPAP diet had better texture than fish fed the PAP diet, which consequently is reflected in the higher global acceptance of fish fed the NoPAP diet.
Table 10.
Sensory analysis of fillet of rainbow trout fed the experimental diets for 91 days.
3.8. Extrapolation of Trial Results Using a Nutrient-Based Model
3.8.1. Model Validation for Trial Conditions
The validation results (Figure S2) indicate that the model is able to predict the growth pattern of rainbow trout fed the experimental diets over the 91-day trial period, presenting an overall MAPE of 11.2%. Nevertheless, it should be pointed out that for all tanks, the model tends to consistently underestimate fish growth by a similar magnitude. As the model calibration used in this application is generic for rainbow trout, these deviations can be associated with strain/population effects. In this case, the fish used in the in vivo trial may be slightly more efficient at retaining nutrients due to genetic differences than the generic model calibration for rainbow trout considers. Given this, and since the deviation between the predicted and observed values presents a similar magnitude between diets and tanks, we decided to run the extrapolation scenarios for all diets without any special concerns.
3.8.2. Fish Performance under Commercial-like Farming Conditions: Exploitation Scenarios
Table 11 shows the results of the extrapolation scenarios, generated in silico with the FEEDNETICSTM model, of rainbow trout cultivated under commercial-like farming conditions at two constant temperatures, i.e., 12 °C and 16 °C. The results are presented for the time point at which fish reach an average harvest weight of about 400 g.
Table 11.
Results of the extrapolation scenarios run in silico with the FEEDNETICSTM software, representing fish fed the experimental diets under commercial-like farming conditions at two constant temperatures (12 °C and 16 °C). All results are relative to the time point at which fish reach an average harvest weight of about 400 g.
For both temperature scenarios, the model suggests better performance in terms of growth and feed conversion when fish are fed the PAP and NoPAP+ diets. Surprisingly, the NoPAP diet presented the highest FCR, even outperforming the CTRL diet at 12 °C. When looking at economic performance (economic conversion ratio—ECR) and nutrient waste indicators (total N and P waste), the figures change dramatically. In economic terms, both the CTRL and PAP diets are the most cost-efficient, with impressively lower feeding costs of up to 36% compared to the other diets. Regarding nutrient waste, for both temperature scenarios, the PAP− diet results in the lowest total N waste, while the NoPAP+ diet results in the lowest total P waste. Overall, the greatest negative impacts in terms of N and P waste are induced by the CTRL and NoPAP diets.
4. Discussion
This study is part of the GAIN project, in which a high diversity of novel alternative sources to FM, FO, and traditional vegetable ingredients were tested in trout feeds. It shows new insights for the inclusion of a combination of circular economy-driven ingredients for trout farming. Within the GAIN project, these novel formulation concepts were further tested in gilthead seabream [44], turbot [45], European seabass [46], and Atlantic salmon (in prep.). The results presented thus far support the hypothesis that using a combination of sustainable ingredients is a viable formulation concept, as for some of the tested formulations, no negative effects on fish performance or consumer acceptance were observed. Due to the complexity of the diet formulations tested in this study, it is difficult to make direct comparisons with other published studies, as most of them focused on evaluating one single ingredient at a time. Therefore, we will largely focus this discussion on other GAIN outputs.
4.1. Growth and Feed Performance
In the present study, rainbow trout kept the same growth pattern on the CTRL diet when fed diets containing low amounts of processed land animal proteins (PAP-) or without land animal proteins (NoPAP). These results corroborate findings reported by [11,47], where rainbow trout fed moderate amounts of poultry meal and insect meal showed good acceptance by fish. Additionally, trout presented better performance once fed improved versions of these diets, namely when fed NoPAP+ and PAP diets. The values of FCR, weight gain, and final body weight were generally better in fish fed the NoPAP+ diet when compared to the other diets. Thus, the quality and quantity of the novel ingredients used to replace FM and FO may have contributed to the increase in weight gain and relative growth rate (RGR) in trout fed with these two diets.
Furthermore, turbot-fed diets with the same concept of circular economy-driven ingredients showed no difference in FCR [43]. However, seabass fed NoPAP diets showed lower final body weight and similar weight gain when fed NoPAP+ compared to control [44]. On the other hand, sea bream tends to behave like turbot and do not present huge differences in growth performance parameters when fed sustainable ingredients [42]. This is also in line with the good results obtained previously with PAP-rich and alternative plant formulations for gilthead seabream [41], but a diet similar to the NoPAP diet led to poorer performance. Thus, different fish species may have different performance when fed complex alternative formulations such as those tested in the GAIN project.
In the present study, crude protein retention was lower in trout fed the PAP and PAP– diets when compared to the CTRL diet. Although diets that include proteins from land animals tend to be well accepted by fish [48], some studies have reported that the replacement of 20% of FM by poultry protein concentrate led to lower protein retention in a barramundi experiment [49]. Back to the present work, we can link protein retention with two other parameters. One is the protein efficiency ratio (PER), which was lower in the PAP-fed group, and the second is the digestibility of protein, which was lower in PAP− fed group. There are many factors that can influence the digestibility and nutritional value of land animal proteins, such as the processing methods used to treat PAPs in general, which can affect their nutritional quality, consequently leading to lower digestibility [49]. Another possible explanation may be related to the fact that these two diets, PAP and PAP−, have been formulated with higher contents of whole peas (20.8% and 31.8%, respectively). In contrast to pea protein concentrates, which can easily replace FM in salmon and seabream diets [29,50,51], whole peas are not subjected to pre-treatment before being used in fish feeds. Whole plant ingredients have a high fiber content, which is considered to be an antinutritional factor [52]. This same author reports that raw/whole pea protein is less digestible by rainbow trout when compared to a reference diet containing soy bean meal. Therefore, the combination of PAPs and high-quality whole peas could be the reason behind the lower performance of fish fed the PAP and PAP− diets in the present study. Still, we cannot conclude that the diets rich in processed land animal proteins have a negative effect on trout, as the growth performance was good and there was a complex mixture of ingredients in the diets tested. However, it may be speculated that if a higher quality of processed land animal proteins and/or a lower whole pea inclusion were used, an even higher performance may have been registered.
4.2. Welfare Indicators
It is important to mention that a lower digestibility of protein can lead to a lower digestibility of energy. This fact can be clearly seen in Table 4 with fish fed the PAP− diet. Thus, there is a clear unbalanced digestibility that might be leading to differences in some welfare indicators, such as the hepatosomatic index (HSI) and the viscerosomatic index (VSI). In the case of this study, higher values for HSI and VSI were found in fish fed both PAP and PAP- diets when compared to the CTRL and NoPAP+ diets. On the contrary, fish fed these same diets showed lower carcass yield (CY) when compared to the CTRL and NoPAP+ diets. In the case of seabass fed diets with the same concepts, the VSI was lower when compared to the control, although the HSI was not statistically different [44]. In addition, turbot fed with a mix of ingredients also presented a lower value when fed a PAP diet when compared to control fish [43]. The values that were found in this study for these indexes are in congruence with other findings from the literature [53]. Even as a welfare indicator, the discrepancy observed between treatments should not be taken as a bad or good result but only as differences reflecting disparate diet formulations, which may also represent adaptation to them.
It is commonly accepted that HSI provides an indication of the status of energy reserves and of the general metabolic activity of fish, and HSI values not exceeding 2% are generally associated with good hepatic functionality [43,44,53]. In the present study, all the HSI indexes ranged from 0.90 to 1.03%, well below this limit. Nonetheless, it must be noted that HSI values were significantly lower in all dietary groups containing a high concentration of vegetal ingredients (CTRL, NoPAP, and NoPAP+). A decrease in HSI might be attributed to reduced liver fat content. Randazzo et al. [47] reported a higher presence and distribution of lipids, fatty acids, and glycogen in the liver of rainbow trout fed graded levels of insect or poultry meal compared to fish fed a vegetable-rich diet.
Lysozyme is an important bactericidal enzyme of the humoral immune system, and it is considered a biomarker of the humoral response in fish [54]. In this study, it was possible to observe that the amount of lysozyme was markedly higher in trout fed the NoPAP diet than in trout fed the CTRL, NoPAP+, and PAP diets. The increase in serum lysozyme has been linked with the inclusion of some dietary ingredients in trout feeds, such as probiotics [55,56], fermented lupin [57], and seaweeds [58]. It is difficult to explain the increase in lysozyme due to the complexity of the formulations and the high number of ingredients used. Still, the presence of seaweed and microbial biomass may have contributed to this. However, no difference was found in the other diets tested where seaweeds and microbial biomass were added at the same level. Moreover, lysozyme levels tended to maintain similar values in seabass [44] fed diets in the same formulation context. In any case, other humoral parameters would be needed to confirm the putative effect of the NoPAP diet on trout innate immunity. Still, a diet with the NoPAP concept fed to gilthead seabream was shown to affect the expression of at least four genes (in the intestine or head kidney) involved in immune responses [42].
4.3. Fillet Analysis
Flesh color is one of the major quality attributes of farmed trout, which is generally marketed as pigmented (red) or non-pigmented (white) flesh. Salmonids depend on dietary supplements of pigments to achieve muscle color; in fact, they cannot synthesize carotenoids de novo [59]. Trout produced with diets containing no added pigments present a lower C* value and an increased L* than pigmented fish, and flesh color is expected to be white, grey, off-white, or pale pink, like the fillets of fish fed with CTRL, NoPAP, PAP, and PAP− diets. Conversely, increased dietary carotenoid levels implicate the increment of average values of a* and b* and a decrement of L* in the muscle, as measured in the fish samples from the NoPAP+ group and stated by numerous authors [60,61,62,63]. Carotenoids (β-carotene, astaxanthin) and yellow xanthophylls (lutein and zeaxanthin) are molecules widespread both in terrestrial vegetables and seaweeds [64], so the variation of color measured in NoPAP+ may be attributed to high proportions of the vegetable ingredients, particularly pea protein and starch. Color differences between fish fed NoPAP+ and other diets are confirmed by ΔE; spatial distances underline that consumers could perceive a difference in color (2 < ΔE < 3.5) [42].
The TPA analysis did not show significant differences between the diets and excluded the adhesiveness parameter, but in the samples “pressure sensitive” like fish meat, harder products also create more pressure between the product and the base and thus may also create an improved bond (apparent adhesion) [65]. Anyway, NoPAP fillets achieved higher values for nearly all the measured variables (except adhesiveness). It is interesting to note that the consumer panel discriminates against No PAP compared to other samples, and this sample had the best score for textural features after cooking. The effect of cooking on salmonid flesh is not clear; some authors reported a decline in hardness [66,67] and others an increase [68,69]. Nevertheless, the reason why consumers perceived differences in textural features in line with the laboratory analysis is not clear and should be investigated [70,71].
4.4. Sensory Analysis
Despite the good performance of fish after being fed with these alternative ingredients, there are still concerns for the final consumer regarding their use in aquafeeds. These concerns range from the taste, appearance, and texture of the fish to zoonotic and risk assessment worries [72]. In the present study, we aimed to evaluate consumer acceptance of the fillet after feeding the fish for 91 days with the tested diets. Results showed that overall, people accepted the fillet of fish fed the NoPAP diet better than the group fed the PAP diet. Interestingly, these fish were the ones that presented, in general, better growth performance when compared to fish fed the PAP diets. Moreover, it is difficult to point out one single explanation for this, but it is important to highlight that PAP diets contained high quantities of land animal processed protein, such as feather meal and blood meal, that could have affected the texture attributes assessed here. On the other hand, differences in taste, appearance, and odor were not observed by the consumers participating in this analysis. In accordance with this, sensory analyses made in the laboratory were assessed by Petereit et al. [44] in seabass fed the same circularity concept diets. No differences were observed in consistency, frozen fat separation, protein separation, juice separation, or taste.
4.5. Long-Term Prediction FEEDNETICSTM
The extrapolation scenarios run in FEEDNETICSTM show that the experimental diets have, in zootechnical terms, the potential to substitute current typical commercial diets (such as the CTRL diet). However, the high prices of some ingredients make some of them still an unviable option in economic terms. For example, the NoPAP and NoPAP+ diets lead to up to 38% higher feeding costs, which may compromise their use on a commercial scale. However, due to the lower cost of ingredients, the PAP and PAP− diets can lead to reduced feeding costs by up to 13.8% compared to the CTRL diet. Therefore, one of the most critical aspects of enabling the widespread adoption of alternative diet formulations, such as those presented in this paper, definitely involves reducing the costs of some novel ingredients. This challenge is fundamental and a high priority for the industry, as, when overcome, it will allow faster progress towards a more sustainable intensification of aquaculture. In addition, it may also be pointed out that the present analysis was performed taking current ingredient prices into consideration. Future price changes can rapidly make the figures presented here obsolete. Thus, this type of economic analysis is something that should be done regularly, taking into account the specificities of each farm/system.
These results put the use of novel diets under commercial farming conditions into perspective. In the first place, it is important to highlight that the relative performance of diets may change considerably with the farming conditions considered. This means that the diet that induces the best performance at a given temperature profile and/or when considering a given mortality rate may not be the same when these conditions change. In second place, it should be noted that while one diet can outperform on some important indicators (e.g., growth rate and feed conversion), it can also underperform on other, no less important ones (e.g., economic conversion and nutrient waste). The overall performance of diets is, in most cases, context-dependent, and the selection of one over the other may also differ from system to system (e.g., flow-through or RAS), as the specificities and limitations between them are distinct. Nevertheless, from the overall analysis of these results, it can be said that currently the PAP and PAP− diets seem to be viable alternatives to the CTRL diet (mimicking a typical commercial diet), as they present similar or even better performance in several aspects (i.e., zootechnical, economic, and environmental).
5. Conclusions
The findings of this research provide insights for the use of emerging ingredients in trout farming, covering important aspects in terms of zootechnical performance, welfare, and consumer acceptance. In general, it can be stated that trout accepted well the new formulations containing a wide range of emerging ingredients. Minor differences were detected in growth performance and feed conversion, but even the lowest values are still within a good performance range.
A limitation of this study is related to the fact that the formulation concepts were based on the use of a combination of different emerging ingredients rather than a classical FM replacement study with a single ingredient. Thus, the results of some indicators are hard to relate to single ingredients and consequently difficult to compare with other studies already published.
Since feeds interfere directly with the fish flesh's color, texture, and odor, sensory analysis is crucial to detecting consumer acceptance since they are strong drivers for consumer decisions. In the present study, consumers preferred the odor of fish fed the NoPAP diet. However, general acceptance did not show statistical differences. These findings suggest that the diets did not interfere with consumer acceptance.
Some emerging ingredients still have high prices or low availability in the market, making them unfeasible options for use on an industrial scale. The long-term prediction using the FEEDNETICSTM tool showed that the economic conversion ratio as well as formulation costs were favorable in diet PAP−, in comparison to the CTRL diet. However, as mentioned above, future changes in ingredient prices may rapidly change the outcomes of the economic analysis presented here. Performing analysis of this kind on a regular basis is advisable. This is something that can be done easily with prediction tools based on mathematical models like FEEDNETICSTM.
Clearly, feed formulations such as NoPAP and PAP, devoid of fish meal and containing a basket of alternative protein sources, are valuable options to support accelerated growth, good health, and a low feed conversion ratio in rainbow trout.
Supplementary Materials
The following supporting information can be downloaded at: https://www.mdpi.com/article/10.3390/jmse11061135/s1.
Author Contributions
All authors contributed significantly to the study’s performance. More specifically: conceptualization, L.E.C.C., B.H.B., J.J. and J.D.; methodology, all authors; software, L.E.C.C. and F.S.; investigation, G.d.V.P., J.J. and J.D.; data curation, G.d.V.P. and F.F.; writing—original draft preparation, G.d.V.P., F.S., J.P. and F.F.; writing—review and editing, G.d.V.P. and L.E.C.C.; supervision, L.E.C.C. and F.F. All authors have read and agreed to the published version of the manuscript.
Funding
This research was funded by the European Union’s Horizon 2020 Research and Innovation Program under grant agreement no. 773330 (GAIN, Green Aquaculture Intensification). This publication reflects the views only of the authors, and the European Commission cannot be held responsible for any use that may be made of the information contained therein. Pereira G.V. is supported by the FCT—Foundation for Science and Technology recruitment call of CEECIST/00168/2018.
Institutional Review Board Statement
All procedures involving animals were carried out in strict accordance with EU legal frameworks relating to the protection of animals used for scientific purposes (Directive 2010/63/EU). The approval was issued by the Ethics Committee of the Istituto Zooprofilattico Sperimentale delle Venezie, giving the rights to Fondazione Edmund Mach (n. 9750/2019) to perform the experiment.
Informed Consent Statement
Not applicable.
Data Availability Statement
Not applicable.
Acknowledgments
We also acknowledge the support of the fish trial team of FEM and the feed production team of Sparos. The authors thank the GAIN teams of IIM (CSIC), ANFACO, Salten Havbrukspark, and Wageningen University for providing ingredients included in the feed formulations.
Conflicts of Interest
The authors declare no conflict of interest.
References
- Glencross, B.D.; Booth, M.; Allan, G.L. A feed is only as good as its ingredients—A review of ingredient evaluation strategies for aquaculture feeds. Aquac. Nutr. 2007, 13, 17–34. [Google Scholar] [CrossRef]
- Naylor, R.L.; Hardy, R.W.; Bureau, D.P.; Chiu, A.; Elliott, M.; Farrell, A.P.; Forster, I.; Gatlin, D.M.; Goldburg, R.J.; Nichols, P.D. Feeding aquaculture in an era of finite resources. Proc. Natl. Acad. Sci. USA 2009, 106, 15103–15110. [Google Scholar] [CrossRef] [PubMed]
- Hardy, R.W. Utilization of plant proteins in fish diets: Effects of global demand and supplies of fishmeal. Aquac. Res. 2010, 41, 770–776. [Google Scholar] [CrossRef]
- Péron, G.; Mittaine, J.F.; Le Gallic, B. Where do fishmeal and fish oil products come from? An analysis of the conversion ratios in the global fishmeal industry. Mar. Policy 2010, 34, 815–820. [Google Scholar] [CrossRef]
- Bianchi, M.C.G.; Cjopin, F.; Farme, T.; Franz, N.; Fuentevilla, C.; Garibaldi, L.; Laurenti, A.L.G. The State of World Fisheries and Aquaculture 2020; Sustainability in Action; FAO: Rome, Italy, 2020. [Google Scholar] [CrossRef]
- Hardy, R.W. Aquaculture feeds and ingredients: An overview. In New Technologies in Aquaculture; Burnell, G., Allan, G., Eds.; Woodhead Publishing Limited: New York, NY, USA, 2009; pp. 370–386. [Google Scholar]
- Lazzarotto, V.; Corraze, G.; Leprevost, A.; Quillet, E.; Dupont-Nivet, M.; Médale, F. Three-year breeding cycle of rainbow trout (Oncorhynchus mykiss) fed a plant-based diet, totally free of marine resources: Consequences for reproduction, fatty acid composition and progeny survival. PLoS ONE 2015, 10, e0117609. [Google Scholar] [CrossRef] [PubMed]
- Ytrestøyl, T.; Aas, T.S.; Åsgård, T. Utilisation of feed resources in production of Atlantic salmon (Salmo salar) in Norway. Aquaculture 2015, 448, 365–374. [Google Scholar] [CrossRef]
- Colombo, S.M. Physiological considerations in shifting carnivorous fishes to plant-based diets. In Fish Physiology; Benfey, T.J., Farrell, A.P., Brauner, C.J., Eds.; Academic Press: Cambridge, MA, USA, 2020; Volume 38, pp. 53–82. [Google Scholar]
- Aragão, C.; Gonçalves, A.T.; Costas, B.; Azeredo, R.; Xavier, M.J.; Engrola, S. Alternative Proteins for Fish Diets: Implications beyond Growth. Animals 2022, 12, 1211. [Google Scholar] [CrossRef]
- Cardinaletti, G.; Di Marco, P.; Daniso, E.; Messina, M.; Donadelli, V.; Finoia, M.G.; Petochi, T.; Fava, F.; Faccenda, F.; Contò, M.; et al. Growth and Welfare of Rainbow Trout (Oncorhynchus mykiss) in Response to Graded Levels of Insect and Poultry By-Product Meals in Fishmeal-Free Diets. Animals 2022, 12, 1698. [Google Scholar] [CrossRef]
- Galkanda-Arachchige, H.S.; Wilson, A.E.; Davis, D.A. Success of fishmeal replacement through poultry by-product meal in aquaculture feed formulations: A meta-analysis. Rev. Aquac. 2020, 12, 1624–1636. [Google Scholar] [CrossRef]
- Bandara, T. Alternative feed ingredients in aquaculture: Opportunities and challenges. J. Entomol. Zool. Stud. 2018, 6, 3087–3094. [Google Scholar]
- Siddik, M.A.; Howieson, J.; Fotedar, R.; Partridge, G.J. Enzymatic fish protein hydrolysates in finfish aquaculture: A review. Rev. Aquac. 2021, 13, 406–430. [Google Scholar] [CrossRef]
- Hua, K.; Cobcroft, J.; Cole, A.; Condon, K.; Jerry, D.; Mangott, A.; Praeger, C.; Vucko, M.; Zeng, C.; Zenger, K.; et al. The Future of Aquatic Protein: Implications for Protein Sources in Aquaculture Diets. One Earth 2019, 1, 316–329. [Google Scholar] [CrossRef]
- Jones, S.W.; Karpol, A.; Friedman, S.; Maru, B.T.; Tracy, B.P. Recent advances in single cell protein use as a feed ingredient in aquaculture. Curr. Opin. Biotechnol. 2020, 61, 189–197. [Google Scholar] [CrossRef]
- NRC National Research Council. Nutrient Requirements of Fish and Shrimp; The National Academies Press: Washington, DC, USA, 2011; p. 376.
- Regost, C.; Arzel, J.; Robin, J.; Rosenlund, G.; Kaushik, S.J. Total replacement of fish oil by soybean or linseed oil with a return to fish oil in turbot (Psetta maxima): 1. Growth performance, flesh fatty acid profile, and lipid metabolism. Aquaculture 2003, 217, 465–482. [Google Scholar] [CrossRef]
- Oliva-Teles, A.; Enes, P.; PerLues, H. Replacing fishmeal and fish oil in industrial aquafeeds for carnivorous fish. In Feed and Feeding Practices in Aquaculture; Davis, A., Ed.; Woodhead Publishing: Swaston, CA, USA, 2015; pp. 203–233. [Google Scholar]
- Ruiz-Lopez, N.; Usher, S.; Sayanova, O.V.; Napier, J.A.; Haslam, R.P. Modifying the lipid content and composition of plant seeds: Engineering the production of LC-PUFA. Appl. Microbiol. Biotechnol. 2015, 99, 143–154. [Google Scholar] [CrossRef] [PubMed]
- Izquierdo, M.S.; Montero, D.; Robaina, L.; Caballero, M.J.; Rosenlund, G.; Ginés, R. Alterations in fillet fatty acid profile and flesh quality in gilthead seabream (Sparus aurata) fed vegetable oils for a long term period. Recovery of fatty acid profiles by fish oil feeding. Aquaculture 2005, 250, 431–444. [Google Scholar] [CrossRef]
- Carvalho, M.; Montero, D.; Rosenlund, G.; Fontanillas, R.; Ginés, R.; Izquierdo, M. Effective complete replacement of fish oil by combining poultry and microalgae oils in practical diets for gilthead sea bream (Sparus aurata) fingerlings. Aquaculture 2020, 529, 735696. [Google Scholar] [CrossRef]
- Santigosa, E.; Constant, D.; Prudence, D.; Wahli, T.; Verlhac-Trichet, V. A novel marine algal oil containing both EPA and DHA is an effective source of omega-3 fatty acids for rainbow trout (Oncorhynchus mykiss). J. World Aquac. Soc. 2020, 51, 649–665. [Google Scholar] [CrossRef]
- Bélanger, A.; Sarker, P.K.; Bureau, D.P.; Chouinard, Y.; Vandenberg, G.W. Apparent digestibility of macronutrients and fatty acids from microalgae (Schizochytrium sp.) fed to rainbow trout (Oncorhynchus mykiss): A potential candidate for fish oil substitution. Animals 2021, 11, 456. [Google Scholar] [CrossRef]
- Greene, D.H.; Selivonchick, D.P. Effects of dietary vegetable, animal and marine lipids on muscle lipid and hematology of rainbow trout (Oncorhynchus mykiss). Aquaculture 1990, 89, 165–182. [Google Scholar] [CrossRef]
- Richard, N.; Kaushik, S.; Larroquet, L.; Panserat, S.; Corraze, G. Replacing dietary fish oil by vegetable oils has little effect on lipogenesis, lipid transport and tissue lipid uptake in rainbow trout (Oncorhynchus mykiss). Br. J. Nutr. 2006, 96, 299–309. [Google Scholar] [CrossRef]
- Mancuso, T.; Baldi, L.; Gasco, L. An empirical study on consumer acceptance of farmed fish fed on insect meals: The Italian case. Aquac. Int. 2016, 24, 1489–1507. [Google Scholar] [CrossRef]
- Ferrer Llagostera, P.; Kallas, Z.; Reig, L.; Amores de Gea, D. The use of insect meal as a sustainable feeding alternative in aquaculture: Current situation, Spanish consumers’ perceptions and willingness to pay. J. Clean. Prod. 2019, 229, 10–21. [Google Scholar] [CrossRef]
- Hoerterer, C.; Petereit, J.; Krause, G. Informed choice: The role of knowledge in the willingness to consume aquaculture products of different groups in Germany. Aquaculture 2022, 556, 738319. [Google Scholar] [CrossRef]
- Petereit, J.; Hoerterer, C.; Krause, G. Country-specific food culture and scientific knowledge transfer events—Do they influence the purchasing behaviour of seafood products? Aquaculture 2022, 560, 738950. [Google Scholar] [CrossRef]
- Sanchez-Lozano, N.B.; Martinez-Llorens, S.; Tomas-Vidal, A.; Cerda, M.J. Effect of high-level fish meal replacement by pea and rice concentrate protein on growth, nutrient utilization and fillet quality in gilthead seabream (Sparus aurata L.). Aquaculture 2010, 298, 83–89. [Google Scholar] [CrossRef]
- Matos, E.; Gonçalves, A.; Bandarra, N.; Colen, R.; Nunes, M.L.; Valente, L.M.P.; Dinis, M.T.; Dias, J. Plant proteins and vegetable oil do not have detrimental effects on post-mortem muscle instrumental texture, sensory properties and nutritional value of gilthead seabream. Aquaculture 2012, 358, 205–212. [Google Scholar] [CrossRef]
- Calanche, J.B.; Beltran, J.A.; Hernandez, A.A.J. Aquaculture and sensometrics: The need to evaluate sensory attributes and the consumers’ preferences. Rev. Aquac. 2020, 12, 805–821. [Google Scholar] [CrossRef]
- De La Noüe, J.; Choubert, G. Digestibility in Rainbow Trout: Comparison of the Direct and Indirect Methods of Measurement, Prog. Fish Cult. 1986, 48, 190–195. [Google Scholar] [CrossRef]
- Austreng, E. Digestibility determination in fish using chromic oxide marking and analysis of contents from different segments of the gastrointestinal tract. Aquaculture 1978, 13, 265–272. [Google Scholar] [CrossRef]
- AOAC. Official Methods of Analysis, 18th ed.; Association of Official Analytical Chemists: Gaithersburgs, MD, USA, 2006. [Google Scholar]
- ISO 27085:2009; Animal Feeding Stuffs. Determination of Calcium, Sodium, Phosphorus, Magnesium, Potassium, Iron, Zinc, copper, Manganese, Cobalt, Molybdenum, Arsenic, Lead and Cadmium by ICP-AES. International Organisation for Standardization: Geneva, Switzerland, 2009; p. 24.
- Reis, P.A.; Valente, L.M.P.; Almeida, C.M.R. A fast and simple methodology for determination of yttrium as an inert marker in digestibility studies. Food Chem. 2008, 108, 1094–1098. [Google Scholar] [CrossRef]
- Milla, S.; Mathieu, C.; Wang, N.; Lambert, S.; Nadzialek, S.; Massart, S.; Henrotte, E.; Douxfils, J.; Mélard, C.; Mandiki, S.N.; et al. Spleen immune status is affected after acute handling stress but not regulated by cortisol in Eurasian perch, Perca fluviatilis. Fish Shellfish. Immunol. 2010, 28, 931–941. [Google Scholar] [CrossRef]
- Bourne, M.C. Texture profile analysis. Food Technol. 1978, 32, 62–66. [Google Scholar]
- C.I.E. Compagnie Internationale de l’Eclairage. International. In Commission on Illumination, Recommendations on Uniform Colorspaces; Supplement No. 2 to CIE Publication No. 15.2; Bureaucentral: Paris, France, 1978. [Google Scholar]
- Mokrzycki, W.; Tatol, M. Color difference ΔE: A survey. Mach. Graph. Vis. 2011, 20, 383–411. [Google Scholar]
- Soares, F.M.R.C.; Nobre, A.M.D.; Raposo, A.I.G.; Mendes, R.C.P.; Engrola, S.A.D.; Rema, P.J.A.P.; Conceição, L.E.C.; Silva, T.S. Development and Application of a Mechanistic Nutrient-Based Model for Precision Fish Farming. J. Mar. Sci. Eng. 2023, 11, 472. [Google Scholar] [CrossRef]
- Piazzon, M.C.; Naya-Català, F.; Pereira, G.V.; Estensoro, I.; Del Pozo, R.; Calduch-Giner, J.A.; Nuez-Ortín, W.G.; Palenzuela, O.; Sitjà-Bobadilla, A.; Dias, J.; et al. A novel fish meal-free diet formulation supports proper growth and does not impair intestinal parasite susceptibility in gilthead sea bream (Sparus aurata) with a reshape of gut microbiota and tissue-specific gene expression patterns. Aquaculture 2022, 558, 738362. [Google Scholar] [CrossRef]
- Hoerterer, C.; Petereit, J.; Lannig, G.; Johansen, J.; Pereira, G.V.; Conceição, L.E.C.; Pastres, R.; Buck, B.H. Sustainable fish feeds: Potential of emerging protein sources in diets for juvenile turbot (Scophthalmus maximus) in RAS. Aquac. Int. 2022, 30, 1481–1504. [Google Scholar] [CrossRef]
- Petereit, J.; Hoerterer, C.; Bischoff-Lang, A.A.; Conceição, L.E.C.; Pereira, G.; Johansen, J.; Pastres, R.; Buck, B.H. Adult European Seabass (Dicentrarchus labrax) Perform Well on Alternative Circular-Economy-Driven Feed Formulations. Sustainability 2022, 14, 7279. [Google Scholar] [CrossRef]
- Randazzo, B.; Zarantoniello, M.; Gioacchini, G.; Cardinaletti, G.; Belloni, A.; Giorgini, E.; Faccenda, F.; Cerri, R.; Tibaldi, E.; Olivotto, I. Physiological response of rainbow trout (Oncorhynchus mykiss) to graded levels of Hermetia illucens or poultry by-product meals as single or combined substitute ingredients to dietary plant proteins. Aquaculture 2021, 538, 736550. [Google Scholar] [CrossRef]
- Moutinho, S.; Martínez-Llorens, S.; Tomás-Vidal, A.; Jover-Cerdá, M.; Oliva-Teles, A.; Peres, H. Meat and bone meal as partial replacement for fish meal in diets for gilthead seabream (Sparus aurata) juveniles: Growth, feed efficiency, amino acid utilization, and economic efficiency. Aquaculture 2017, 468, 271–277. [Google Scholar] [CrossRef]
- Simon, C.J.; Salini, M.J.; Irvin, S.; Blyth, D.; Bourne, N.; Smullen, R. The effect of poultry protein concentrate and phosphorus supplementation on growth, digestibility and nutrient retention efficiency in barramundi Lates calcarifer. Aquaculture 2019, 498, 305–314. [Google Scholar] [CrossRef]
- Øverland, M.; Sørensen, M.; Storebakken, T.; Penn, M.; Krogdahl, Å.; Skrede, A. Pea protein concentrate substituting fish meal or soybean meal in diets for Atlantic salmon (Salmo salar)—Effect on growth performance, nutrient digestibility, carcass composition, gut health, and physical feed quality. Aquaculture 2009, 288, 305–311. [Google Scholar] [CrossRef]
- Hansen, J.Ø.; Shearer, K.D.; Øverland, M.; Penn, M.H.; Krogdahl, Å.; Mydland, L.T.; Storebakken, T. Replacement of LT fish meal with a mixture of partially deshelled krill meal and pea protein concentrates in diets for Atlantic salmon (Salmo salar). Aquaculture 2011, 315, 275–282. [Google Scholar] [CrossRef]
- Thiessen, D.L.; Campbell, G.L.; Addizi, P.D. Digestibility and growth performance of juvenile rainbow trout (Oncohychus mykiss) fed with pea and canola products. Aqua. Nutr. 2003, 9, 67–75. [Google Scholar] [CrossRef]
- Sallam, A.E.; El-feky, M.M.; Ahmed, M.S.; Mansour, A.T. Potential use of whey protein as a partial substitute of fishmeal on growth performance, non-specific immunity and gut histological status of juvenile European seabass, Dicentrarchus labrax. Aquac. Res. 2021, 53, 1527–1541. [Google Scholar] [CrossRef]
- Girón-Pérez, M.I.; Velázquez-Fernández, J.; Díaz-Resendiz, K.; Diaz-Salas, F.; Canto-Montero, C.; Medina-Diaz, I.; Zaitseva, G. Immunologic parameters evaluations in Nile tilapia (Oreochromis niloticus) exposed to sublethal concentrations of diazinon. Fish Shellfish Immunol. 2009, 27, 383–385. [Google Scholar] [CrossRef]
- Mohammadian, T.; Nasirpour, M.; Tabandeh, M.R.; Heidary, A.A.; Ghanei-Motlagh, R.; Hosseini, S.S. Administrations of autochthonous probiotics altered juvenile rainbow trout Oncorhynchus mykiss health status, growth performance and resistance to Lactococcus garvieae, an experimental infection. Fish Shellfish Immunol. 2019, 86, 269–279. [Google Scholar] [CrossRef]
- Ramos, M.A.; Gonçalves, J.F.M.; Batista, S.; Costas, B.; Pires, M.A.; Rema, P.; Ozório, R.O.A. Growth, immune responses and intestinal morphology of rainbow trout (Oncorhynchus mykiss) supplemented with commercial probiotics. Fish Shellfish Immunol. 2015, 45, 19–26. [Google Scholar] [CrossRef]
- Davies, S.J.; El-Haroun, E.R.; Hassaan, M.S.; Bowyer, P.H. A Solid-State Fermentation (SSF) supplement improved performance, digestive function and gut ultrastructure of rainbow trout (Oncorhynchus mykiss) fed plant protein diets containing yellow lupin meal. Aquaculture 2021, 545, 737177. [Google Scholar] [CrossRef]
- Vazirzadeh, A.; Marhamati, A.; Rabiee, R.; Faggio, C. Immunomodulation, antioxidant enhancement and immune genes up-regulation in rainbow trout (Oncorhynchus mykiss) fed on seaweeds included diets. Fish Shellfish Immunol. 2020, 106, 852–858. [Google Scholar] [CrossRef]
- Barbosa, M.J.; Morais, R.; Choubert, G. Effect of carotenoid source and dietary lipid content on blood astaxanthin concentration in rainbow trout (Oncorhynchus mykiss). Aquaculture 1999, 176, 331–341. [Google Scholar] [CrossRef]
- Skrede, G.; Storebakken, T. Instrumental colour analysis of farmed and wild Atlantic salmon when raw, baked and smoked. Aquaculture 1986, 53, 279–286. [Google Scholar] [CrossRef]
- Choubert, G.; Blanc, J.-M.; Courvalin, C. Muscle carotenoid content and colour of farmed rainbow trout fed astaxanthin or canthaxanthin as affected by cooking and smoke-curing procedures. Int. J. Food Sci. 1992, 27, 277–284. [Google Scholar] [CrossRef]
- Christiansen, R.; Struksnæs, G.; Estermann, R.; Torrissen, O.J. Assessment of flesh colour in Atlantic salmon, Salmo salar L. Aquac. Res. 1995, 26, 311–321. [Google Scholar] [CrossRef]
- Wathne, E.; Bjerkeng, B.; Storebakken, T.; Vassvik, V.; Odland, A.B. Pigmentation of Atlantic salmon (Salmo salar) fed astaxanthin in all meals or in alternating meals. Aquaculture 1998, 159, 217–231. [Google Scholar] [CrossRef]
- Wells, M.L.; Potin, P.; Craigie, J.S.; Raven, J.A.; Merchant, S.S.; Helliwell, K.E.; Smith, A.G.; Camire, M.E.; Brawley, S.H. Algae as nutritional and functional food sources: Revisiting our understanding. J. Appl. Phycol. 2017, 29, 949–982. [Google Scholar] [CrossRef]
- Texture Profile Analysis Texture Technologies Corp. and Stable Micro Systems, Ltd. Available online: https://texturetechnologies.com/resources/texture-profile-analysis (accessed on 15 May 2023).
- Mørkøre, T.; Hansen, A.Å.; Unander, E.; Einen, O. Composition, liquid leakage, and mechanical properties of farmed rainbow trout: Variation between fillet sections and the impact of ice and frozen storage. J. Food Sci. 2006, 67, 1933–1938. [Google Scholar] [CrossRef]
- Aussanasuwannakul, A.; Kenney, P.B.; Weber, G.M.; Yao, J.; Slider, S.D.; Manor, M.L.; Salem, M. Effect of sexual maturation on growth, fillet composition, and texture of female rainbow trout (Oncorhynchus mykiss) on a high nutritional plane. Aquaculture 2010, 317, 79–88. [Google Scholar] [CrossRef]
- Ginés, R.; Valdimarsdottir, T.; Sveinsdottir, K.; Thorarensen, H. Effects of rearing temperature and strain on sensory characteristics, texture, colour and fat of Arctic charr (Salvelinus alpinus). Food Qual. Prefer. 2004, 15, 177–185. [Google Scholar] [CrossRef]
- Martelli, R.; Franci, O.; Lupi, P.; Faccenda, F.; Parisi, G. Physico-Chemical Traits of Raw and Cooked Fillets of Rainbow Trout (Oncorhynchus mykiss) from Different Strains and Farms. Ital. J. Anim. Sci. 2014, 13, 3417. [Google Scholar] [CrossRef]
- Husein, Y.; Secci, G.; Dinnella, C.; Parisi, G.; Fusi, R.; Monteleone, E.; Zanoni, B. Enhanced utilisation of nonmarketable fish: Physical, nutritional and sensory properties of ‘clean label’ fish burgers. Int. J. Food Sci. Technol. 2019, 54, 593–601. [Google Scholar] [CrossRef]
- Bruni, L.; Secci, G.; Husein, Y.; Faccenda, F.; Medeiros, A.C.L.; Parisi, G. Is it possible to cut down fishmeal and soybean meal use in aquafeed limiting the negative effects on rainbow trout (Oncorhynchus mykiss) fillet quality and consumer acceptance? Aquaculture 2021, 543, 736996. [Google Scholar] [CrossRef]
- Morales, J.B.C.; Tomás-Vidal, A.; Cusiyunca, P.E.R.; Martínez-Llorens, S.; Marquina, P.L.; Jover-Cerdá, M.; Beltrán, J.A. An Approach to the Spanish Consumer’s Perception of the Sensory Quality of Environmentally Friendly Seabass. Foods 2021, 10, 2694. [Google Scholar] [CrossRef] [PubMed]


Disclaimer/Publisher’s Note: The statements, opinions and data contained in all publications are solely those of the individual author(s) and contributor(s) and not of MDPI and/or the editor(s). MDPI and/or the editor(s) disclaim responsibility for any injury to people or property resulting from any ideas, methods, instructions or products referred to in the content. |
© 2023 by the authors. Licensee MDPI, Basel, Switzerland. This article is an open access article distributed under the terms and conditions of the Creative Commons Attribution (CC BY) license (https://creativecommons.org/licenses/by/4.0/).