Abstract
Sea surface temperature (SST) is crucial in ocean research and marine activities. It makes predicting SST of paramount importance. While SST is highly affected by different oceanic, atmospheric, and climatic parameters, few papers have investigated time-series SST prediction based on multiple features. This paper utilized multi features of air pressure, water temperature, wind direction, and wind speed for time-series hourly SST prediction using deep neural networks of convolutional neural network (CNN), long short-term memory (LSTM), and CNN–LSTM. Models were trained and validated by different epochs, and feature importance was evaluated by the leave-one-feature-out method. Air pressure and water temperature were significantly more important than wind direction and wind speed. Accordingly, feature selection is an essential step for time-series SST prediction. Findings also revealed that all models performed well with low prediction errors, and increasing the epochs did not necessarily improve the modeling. While all models were similarly practical, CNN was considered the most suitable as its training speed was several times faster than the other two models. With all this, the low variance of time-series data helped models make accurate predictions, and the proposed method may have higher errors while working with more variant features.
1. Introduction
The water temperature at the ocean’s surface is called sea surface temperature (SST). It is one of the most fundamental parameters for understanding, monitoring, and forecasting the exchange of energy, momentum, and moisture between the oceans and the atmosphere [1]. In addition, SST data are essential for a wide variety of research fields, including evaluation of climate and ocean models, observational quantification of climate change and variability, ocean ecology, oceanography, and geology [2]. SST change has noticeable impacts on global climate, marine ecosystems, and biological systems. Therefore, SST prediction is practical in various environmental studies, such as predicting marine disaster prevention, global warming, fishing, mining, and ocean military affairs [3].
Studies on SST prediction are mainly categorized into numerical (physic-based) and data-driven techniques [4]. The numerical methods utilize physics and mathematics by formulating the equations to forecast [5]. They focus on many parameters and complex equation operations and need several engineering calculations to extract evolution trends [6]. In addition to their complexity, these methods demand great computational time and effort [7], and their accuracy is highly dependent on the spatial domain [6,8,9]. The latest studies have increasingly applied data-driven approaches. These methods aim to learn SST patterns from collected data and use them to predict the future. Applied data-driven methods include machine learning and statistical techniques [5], such as the Markov model [10], time-series and linear regression analysis [11], support vector machines (SVM) [12], neural networks [13,14,15], etc.
In contrast to numerical methods, neural network models use observed data to automatically calculate and adjust model parameters, making them practical for time-series prediction at different scales [1]. Neural network models work convincingly, considering the flexibility and ability to model complex patterns. Expanding the meteorological ground measurement sites has significantly enhanced the precision, accuracy, and variety of meteorological data [8]. This has put forward higher requirements for time-series prediction of SST using deep neural networks.
H. O. Aydınlı et al. [16] employed recurrent neural network (RNN) long and short-term memory (LSTM) for time-series daily SST prediction. Adam stochastic optimization was applied in this study, and the proposed approach was promising for accurate and practical forecasting. L. Xu et al. [17] aimed for spatiotemporal time-series prediction of SST using regional Convolution long short-term memory. This study considered the regional distribution information and daily SST prediction performed well. C. Xiao et al. [5] utilized different machine learning methods of Adaboost, LSTM, LSTM-Adaboost, and optimized support vector regression (SVR), and optimized the feed forward back propagation neural network for short and mid-term SST forecasting. It was found that LSTM-Adaboost outperformed other methods as this combination avoids overfitting. C. Xiao et al. [18] used convolutional neural network and long short-term memory (CNN–LSTM) and SVR for short and mid-term spatiotemporal SST prediction using time-series satellite data. Results indicated that CNN–LSTM outperformed SVR and was highly promising for short and mid-term daily SST forecasting. Q. Zhang et al. [14] performed short and long-term SST prediction using SVR, multi-layer perceptron regression, and LSTM. The results showed that LSTM had low prediction errors and outperformed other methods.
Different architectures of neural network models have been utilized for SST prediction [5], including the ordinary feed-forward neural network [7], the wavelet neural network [13], the nonlinear autoregressive neural network [19], the LSTM [14], convolutional neural network (CNN) [20], and the CNN–LSTM [21]. Each neural network model benefits from its specific architecture.
LSTM can learn long-term dependencies and performs effectively with a wide range of issues, and with its recurrent structure, it can remember further periods. While the previous machine learning methods (e.g, ordinary neural networks) may face difficulty extracting the long-term SSTs data, the LTSM model enhances prediction quality and accuracy by fetching temporal dependencies among these data [22]. The CNN model is suitable for learning complex features [23]. It can extract the features of sequence multivariable samples, enabling it to act well for time-series forecasting [24]. The CNN–LSTM merges CNN and LSTM architectures and benefits from both. In conclusion, the CNN and the CNN–LSTM networks are as successful as LSTM in time-series SST prediction.
As mentioned above, different neural network techniques have been evaluated for SST prediction. In addition to the modeling approach, modeling features play a vital role in final prediction accuracy [25,26]. SST is directly related to oceanic, atmospheric, and climatic parameters. Thus, SST prediction based on these parameters is essential [27,28]. To the authors’ knowledge, no similar study has been found targeting SST prediction using the multi features: SST, air pressure, water temperature, wind direction, and wind speed. The main objective of this paper is to propose a modeling approach for time-series hourly SST prediction based on the CNN, LSTM, and CNN–LSTM methods. Short-term (hourly) SST forecasting is a particular need for daily life since, in recent years, the global trend of frequent extreme climatic disasters has been observed [6,29]. The modeling was applied to two 10-year datasets from South Korea. The findings may be practical for planners and decision-makers and can be helpful for future works that aim for time-series prediction with deep neural networks.
2. Materials and Methods
2.1. Study Area and Dataset
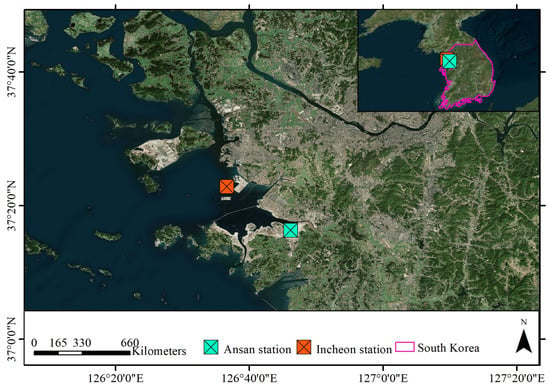
This study used two datasets from the South Korea Hydrographic and Oceanographic Agency. The first dataset, DT_0001, was measured at the Incheon station located at the latitude of 37.380° and the longitude of 126.611°. The second dataset, DT_0008, was measured at the Ansan station located at the latitude of 37.271° and the longitude of 126.770° (Figure 1). These 2 stations are part of 46 operating tide stations in South Korea that are used for accurate and online monitoring of marine and meteorological parameters for marine safety and research. They are equipped with different digital devices, including GNSS (Global Navigation Satellite System), digital float level gauge, radar type level gauge, laser type level gauge, pressure level gauge, the CT sensor, a meteorological sensor, etc.
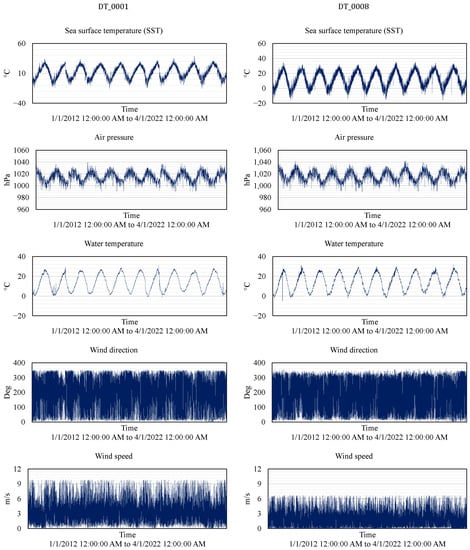
These datasets contained measured minute-by-minute parameters of SST, air pressure, water temperature, wind direction, and wind speed from 1 January 2012 12:00:00 AM to 4 January 2022 12:00:00 AM. Therefore, hourly data records were generated by averaging features. The statistical information and time-series of hourly data records are given in Table 1 and Figure 2, respectively. Water temperature was measured with the CT sensor fixed at the datum level inside a cylinder (the water height above the datum level varied due to tides and waves).
2.2. Methodology
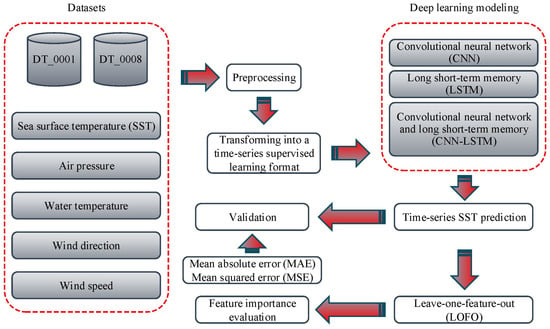
The general framework of this study is shown in Figure 3. It includes five main steps of data collection, data preparation, time-series modeling, prediction assessment, and feature importance evaluation as follows:
- Data collection: Two datasets, including five parameters of SST, air pressure, water temperature, wind direction, and wind speed, were obtained from the Korea Hydrographic and Oceanographic Agency. These parameters were selected according to deficiencies in the literature;
- Data preparation: Datasets were preprocessed to normalize features and remove outliers. Then, data records were transformed into a time-series format for supervised learning;
- Time-series modeling: SST time-series modeling was performed using three deep learning methods—CNN, LSTM, and CNN–LSTM—with different epochs of 10, 20, and 50;
- Prediction assessment: Time-series prediction of SST was performed with created models. Then, models were validated using mean absolute error (MAE) and mean squared error (MSE) metrics;
- Feature importance evaluation: The leave-one-feature-out (LOFO) method was utilized with MEA and MSE metrics to understand the relative importance of features in modeling.
2.3. Materials
2.3.1. Convolutional Neural Network (CNN)
One of the species of deep learning models is the CNN network. This model can learn abstracted features [23] and is practical for analyzing visual images [28,30]. In addition, the CNN model also has a layer that can learn the features of sequence multivariable data, which makes it suitable for any prediction task. The structure of a typical CNN model is shown in Figure 4. Accordingly, the CNN network comprises several layers, including a convolutional layer, a pooling layer, a flattening layer, and a fully connected layer [31].
The convolutional layer is the primary part of the CNN network that works on sliding windows and weight sharing to decline processing complexity. A kernel function is used in this layer to extract different features from the input data. The proofing layer is next. This layer is created to decrease the feature map size by decreasing the connection between layers and executing feature maps separately. The proofing layer seeks to effectively train the model by decreasing the dimensionality and extracting the prevailing features [32]. Applying the flattening layer before proceeding with the fully connected linked layer is essential to make a one-dimensional vector. This is because the fully connected linked layer includes weights and biases with the neurons to link the neurons between the different layers [31].
2.3.2. Long Short-Term Memory (LSTM)
The LSTM is a particular kind of RNN introduced by Hochreiter and Schmidhuber [33]. The standard RNN model cannot learn long-term dependence. Accordingly, LSTM was created to solve the problem of long-term dependence and to deal with the vanishing gradient issue. The LSTM contains memory cells and gates to adjust the network’s information and recall information over long periods [31].
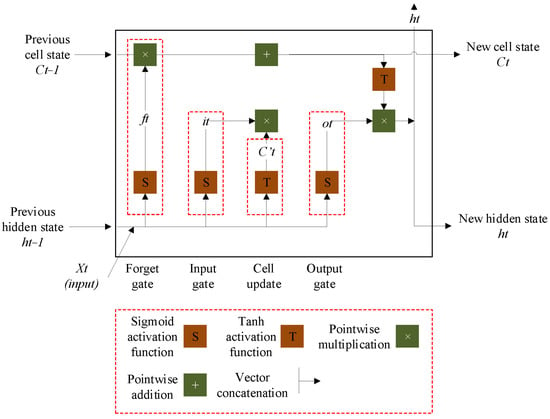
Generally, an LSTM model includes memory blocks or cells. These cells have two states, including the cell state and the hidden state. In the LSTM network, cells make significant decisions by storing or ignoring information about essential components called gates. The gates are formed as forget, input, and output gates. According to the architecture of the LSTM network shown in Figure 5, the operation of the LSTM model has three steps: first, the network performs with the forget gate to investigate what sort of information should be ignored or stored for the cell state. The computation begins with considering the input at the current time step (xt) and the previous value of the hidden state (h(t−1)) with the sigmoid function (S) as follows [31]:
In the second step, the network computation continues by converting the old cell state (C(t−1)) into a new state (Ct). This procedure chooses which new information has to be included in the long-term memory. To obtain the new cell state value, the computation process should consist of the reference value from the forgetting gate, the input gate, and the cell update gate value as follows [31]:
After the cell status update is finished, the last step is to indicate the value of the hidden state (ht). The objective of this process is for the hidden state to operate as the network’s memory, including information about previous data, and used for predictions. According to the following equations, to define the value of the hidden state, the computation should have the reference value of the new cell state and the output gate (ot) [31]:
In the above equations, ft, it, and ot are the outputs of sigmoid functions (S). They are between 0 and 1 and control the information that is forgotten in the old cell state (C(t−1)), the stored information (C’t) in the new sell state (Ct), and the output information (ht) from the cell. wf, wi, wc, and wo are the weights used for the concatenation (shown by []) of the new input xt and output of the previous cell. The corresponding biases are defined by bf, bi, bc, and bo [1].
2.3.3. Convolutional Neural Network and Long Short-Term Memory (CNN–LSTM)
The CNN–LSTM is a hybrid model that utilizes the capacities of CNN to learn the internal representation of time-series data and obtain essential features such as LSTM to detect short-term and long-term dependencies [34]. The CNN–LSTM model is an extension of encoder–decoder architecture. The encoder section includes one-dimensional CNN layers, and the decoder consists of LSTM layers. The one-dimensional CNN performs well for time-series problems as the convolution kernel goes into a firm direction to automatically extract unseen features in the time direction. Accordingly, LSTM receives the extracted features from the CNN to provide sequence prediction [24].
2.3.4. Validation Metrics
The MAE and MSE were the validation metrics used to assess the models’ performance. These two metrics are suitable for investigating the modeling error. MAE and MSE are equal to the mean absolute and mean squared values of errors between the real and predicted values, respectively. MAE is practical for evaluating the mean prediction errors and is not sensitive to significant errors. In contrast, MSE is sensitive to outliers and does not consider similar error weights. Accordingly, using these two metrics for prediction validation gives essential information. MAE and MSE are calculated using the following two equations, respectively [35]:
where n is the number of samples, is the predicted value, and is the actual value.
3. Results
First, modeling datasets were transformed into a time-series supervised learning format to create predictive models. The modeling inputs were SST (t − 1), air pressure (t − 1), water temperature (t − 1), wind direction (t − 1), and wind speed (t − 1), and the modeling target was SST (t) (t is the time step). Each time, models were trained and validated with 85% and 15% of one dataset, respectively. To train predictive models, first, data were preprocessed. The data preprocessing included the following steps:
- Nan values were replaced with the bfill method;
- Any feature record outside the range of (mean − 3 × STD, mean + 3 × STD) was considered an outlier and replaced with the bfill method;
- All features were normalized in the [0, 1] range.
Table 2 shows the statistical information of preprocessed data records for each season. CNN, LSTM, and CNN–LSTM models were created using the Google laboratory environment and Keras python library. In the Google laboratory, the GPU was set as the hardware accelerator. Models were created with the root mean square error loss function, time steps of 24, batch size of 32, and different epochs of 10, 20, and 50. Models’ architectures are shown in Table 3.
Models were validated using MAE and MSE metrics. Table 4 illustrates MAE and MSE values of train and test data. No significant errors were observed in the predictions, and no considerable difference was between the models’ validation metrics. On average, for the DT_0001 dataset, the MAE of train data were 0.0066 (CNN), 0.0081 (LSTM), and 0.0203 (CNN–LSTM); the MAE of test data were 0.0067 (CNN), 0.0085 (LSTM), and 0.0219 (CNN–LSTM); the MSE of train data were 0.0001 (CNN), 0.0001 (LSTM), and 0.0008 (CNN–LSTM); and the MSE of test data were 0.0001 (CNN), 0.0002 (LSTM), and 0.0009 (CNN–LSTM), respectively. Correspondingly, 0.0096 (CNN), 0.0102 (LSM), and 0.0118 (CNN–LSTM); 0.0097 (CNN), 0.0106 (LSTM), and 0.0125 (CNN–LSTM); 0.0002 (CNN), 0.0002 (LSTM), and 0.0002 (CNN–LSTM); 0.0002 (CNN), 0.0002 (LSTM), and 0.0003 (CNN–LSTM) were similar values for the DT_0008 dataset. Increasing the epochs did not necessarily improve modeling, and prediction errors for both datasets were similar. For CNN, LSTM, and CNN–LSTM, the highest difference between MAE and MSE values of different epochs did not reach 0.002, 0.003, and 0.007, respectively. However, CNN, LSTM, and CNN–LSTM were the most accurate models. The lowest errors were related to CNN with 10 epochs, and the highest errors were related to CNN–LSTM with 10 epochs. In addition, LSTM and CNN–LSTM similarly needed almost twice as much time as CNN to be trained.
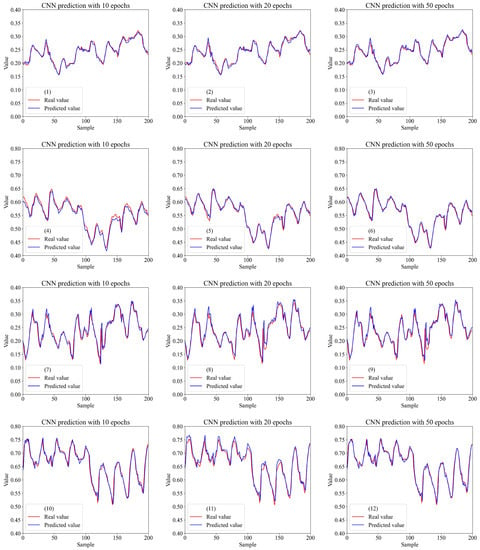
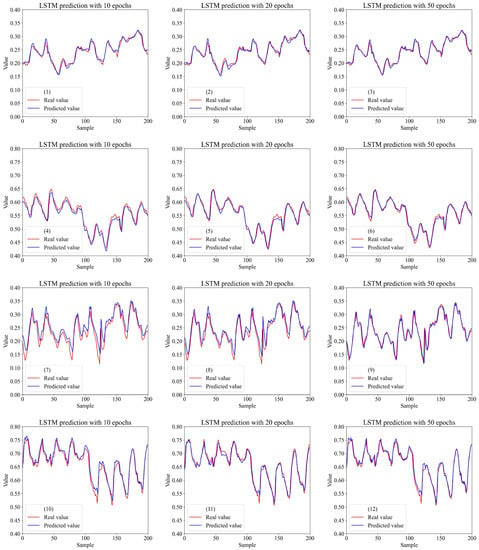
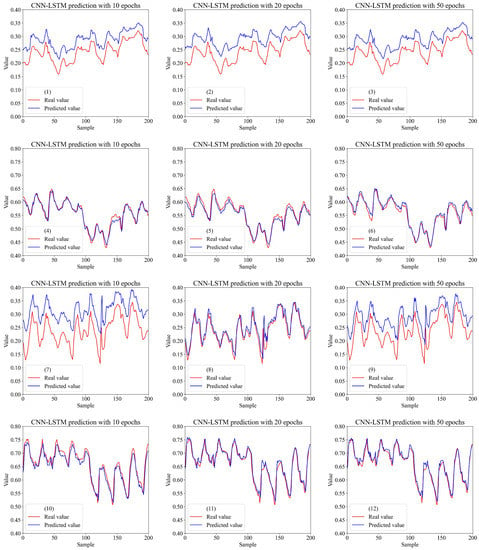
We plotted models’ predictions to understand if they follow the trends of real sample values. Figure 6, Figure 7 and Figure 8 show predictions of 200 train and test samples by CNN, LSTM, and CNN–LSTM models with different epochs, respectively. There were slight differences between predicted and real values of train samples in CNN–LSTM outputs, and it is evident that all predictions followed real values trends.
Figure 6.
Comparing CNN predictions with real values. Prediction of DT_0001 train samples with 10 (1), 20 (2), and 50 (3) epochs. Prediction of DT_0001 test samples with 10 (4), 20 (5), and 50 (6) epochs. Prediction of DT_0008 train samples with 10 (7), 20 (8), and 50 (9) epochs. Prediction of DT_0008 test samples with 10 (10), 20 (11), and 50 (12) epochs.
Figure 7.
Comparing LSTM predictions with real values. Prediction of DT_0001 train samples with 10 (1), 20 (2), and 50 (3) epochs. Prediction of DT_0001 test samples with 10 (4), 20 (5), and 50 (6) epochs. Prediction of DT_0008 train samples with 10 (7), 20 (8), and 50 (9) epochs. Prediction of DT_0008 test samples with 10 (10), 20 (11), and 50 (12) epochs.
Figure 8.
Comparing CNN–LSTM predictions with real values. Prediction of DT_0001 train samples with 10 (1), 20 (2), and 50 (3) epochs. Prediction of DT_0001 test samples with 10 (4), 20 (5), and 50 (6) epochs. Prediction of DT_0008 train samples with 10 (7), 20 (8), and 50 (9) epochs. Prediction of DT_0008 test samples with 10 (10), 20 (11), and 50 (12) epochs.
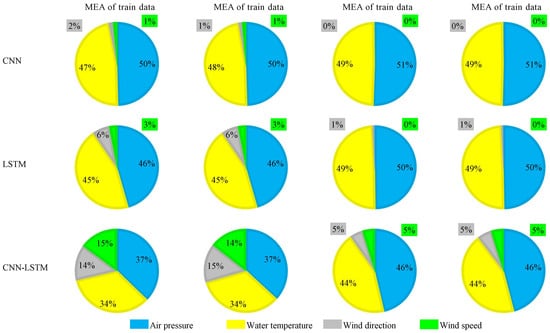
To better understand which parameter was more practical in modeling, we applied the LOFO method. LOFO computes the importance of a set of modeling features based on a selected validation metric by iteratively removing one feature from the set and validating the model performance. MAE and MSE metrics were used to calculate the features’ importance with LOFO. Results are indicated in Figure 9. Other observations were almost similar except for LOFO results based on the MAE metric for CNN–LSTM. Air pressure and water temperature with similar weights were more important than wind direction and wind speed for SST prediction.
4. Discussion
This study applied three deep learning models—CNN, LSTM, and CNN–LSTM—to two datasets for time-series hourly SST prediction. Datasets were pre-processed before modeling to avoid disturbing the training step, and models were trained with different epochs. Predictive supervised models are general with respect to new data when prediction errors of test data are low [36]. Similarly, validation results of all models revealed that prediction errors of test data were as slight as prediction errors of train data, and their generalizability was confirmed.
Temperature time-series prediction becomes more challenging when the time sequence becomes larger [37]. SST variance is lower with a minor time sequence, and slight variations make predicting the future much more accessible. In this study, there were rarely sharp changes in time-series hourly SST data, and it helped proposed deep learning models to perform well for short-term prediction. Long-term forecasting is more complicated, but deep learning methods have also performed well for long-term temperature prediction [38]. However, time-series prediction of more variant parameters may be more challenging for deep learning models.
Consistent with previous works [39,40,41], increasing epochs did not necessarily decline modeling errors. This is because too few epochs may prevent a deep learning model from converging, and too many epochs may prevent it from overfitting [42]. Although CNN, LSTM, and CNN–LSTM methods had similar performance and the difference between their prediction errors was not remarkable, CNN can be considered the more suitable method for further studies. Compared to LSTM and CNN–LSTM, CNN had slightly lower errors but significantly higher learning speed. However, there are different findings in the literature that evaluated these models’ performance for temperature prediction [20,38,43,44,45,46]. Moreover, as CNN–LSTM is a hybrid model that exploits the benefits of both CNN and LSTM to improve its prediction accuracy, it was expected that CNN–LSTM would perform more accurately than the other models [34]. However, our findings, in line with previous works [47,48], showed that single deep neural network models (CNN and LSTM) with proper architectures could perform more accurately than their merged hybrid model (CNN–LSTM).
The fact that neural network models depend highly on the architecture [49,50,51] can explain the different findings about the accuracy of CNN, LSTM, and CNN–LSTM models in temperature prediction. For example, a too-small bath size can decrease the loss function resulting in the model’s lack of convergence, and a too-large batch size can decrease the training rate, increasing training time. A large time step may lead to some information being lost, whereas a small time step may lead to data redundancy and reduced training speed [42].
Since oceans have extensive and complex dynamic systems, the distribution and variation of SST are dependent on different factors. Multi variable SST prediction is a suitable technique for overcoming this issue [52]. Accordingly, we utilized different parameters for time-series SST prediction. While prediction errors were slight, the LOFO method was applied to evaluate modeling feature importance. Results indicated that air pressure and water temperature had similar weights and were significantly more important than wind direction and wind speed. However, there are different statements about important features that affect SST in the literature [52,53,54]. Wind speed affects the vertical heat flux, which could change SST [55]. Previous works observed SST-induced wind speed and wind direction perturbations [56,57,58]. However, the uniform seasonal distribution of these parameters can limit their effect on SST [55].
Similarly, we observed that the range of wind speed and wind direction values were almost similar in different seasons. It should also be noted that seasonal variation of wind direction and wind speed can be different for different regions [53], and the geographical location of the data affects the SST prediction [17]. Nevertheless, all mentioned effective parameters in the literature could not be applied in modeling as many modeling features may hinder the performance of machine learning models. The best option is to perform a feature selection method before training the models.
All created models generally had accurate predictions and followed real data trends well. The proposed models could learn the relationships between SST, air pressure, water temperature, wind direction, and wind speed and extract the information from many data records. They were also practical for SST prediction in different geographical situations, as low prediction errors were observed for both used datasets. Our findings confirmed that deep learning models could be promising tools to predict time-series hourly SST prediction. With all this, it should be noted that data-driven methods such as deep learning models depend on the precision and accuracy of training samples. In this study, we assumed high precision and accuracy of the samples. However, we had no information about the exact water depth at which the CT sensor measured the water temperature parameter. In future works, applying optimization methods for tuning deep neural network models for more accurate predictions can be investigated.
5. Conclusions
This study utilized CNN, LSTM, and CNN–LSTM models for hourly SST forecasting. Data records included multivariate features and were obtained from two different stations. The conclusions are as follows:
- According to validation metrics, the highest MAE (0.0261) and MSE (0.0011) for the DT_001 dataset and the highest MAE (0.0145) and MSE (0.0004) for the DT_0008 dataset were related to CNN–LSTM by 10 epochs and CNN–LSTM by 20 epochs, respectively. Considering the calculated MAE and MSE values, the usability of proposed network architectures and modeling features for hourly SST prediction is confirmed. We introduced CNN as a more practical method as it was faster than the other two models. Nevertheless, all three models showed high-performance levels and had slight prediction errors.
- We observed different findings about the validation of CNN, LSTM, and CNN–LSTM models in similar works as neural network architecture differed. This indicates the high importance of adjusting neural network layers.
- Low variant time-series SST data enhanced the modeling. Therefore, the proposed approach may have higher prediction errors if data becomes more variant.
- The LOFO method indicated that on average, air pressure (0.441) and water temperature (0.423) had remarkably higher feature importance weights than wind direction (0.072) and wind speed (0.064). However, there were different statements about the effectiveness of these features in the literature. The best choice is to perform a feature selection method before time-series SST modeling.
- Generally, applying deep neural networks is a suitable method for time-series prediction as it can explain complex relationships between different features.
Author Contributions
Conceptualization, F.F., A.S.-N. and J.S.B.; Data curation, F.F., J.S.B. and D.H.; Formal analysis, F.F. and S.V.R.-T.; Funding acquisition, S.-M.C.; Investigation, A.S.-N., S.V.R.-T. and D.H.; Methodology, A.S.-N. and J.S.B.; Project administration, A.S.-N. and S.-M.C.; Resources, D.H. and S.-M.C.; Software, F.F. and A.S.-N.; Supervision, A.S.-N. and S.-M.C.; Validation, F.F. and S.V.R.-T.; Visualization, J.S.B.; Writing—original draft, F.F. and J.S.B.; Writing—review and editing, A.S.-N., S.V.R.-T. and S.-M.C. All authors have read and agreed to the published version of the manuscript.
Funding
This research was supported by the MSIT (Ministry of Science and ICT), Korea, under the ITRC (Information Technology Research Center) support program (IITP-2023-RS-2022-00156354), supervised by the IITP (Institute for Information and communications Technology Planning and Evaluation) and the Ministry of Trade, Industry and Energy (MOTIE), and the Korea Institute for Advancement of Technology (KIAT) through the International Cooperative R&D program (Project No. P0016038).
Informed Consent Statement
Not applicable.
Data Availability Statement
The datasets used and/or analyzed during the current study are available from the corresponding author on reasonable request.
Conflicts of Interest
The authors declare that the research was conducted in the absence of any commercial or financial relationships that could be construed as a potential conflict of interest.
References
- Xiao, C.; Chen, N.; Hu, C.; Wang, K.; Gong, J.; Chen, Z. Short and mid-term sea surface temperature prediction using time-series satellite data and LSTM-AdaBoost combination approach. Remote Sens. Environ. 2019, 233, 111358. [Google Scholar] [CrossRef]
- Merchant, C.J.; Embury, O.; Bulgin, C.E.; Block, T.; Corlett, G.K.; Fiedler, E.; Good, S.A.; Mittaz, J.; Rayner, N.A.; Berry, D. Satellite-based time-series of sea-surface temperature since 1981 for climate applications. Sci. Data 2019, 6, 223. [Google Scholar] [CrossRef] [PubMed]
- Bouali, M.; Sato, O.T.; Polito, P.S. Temporal trends in sea surface temperature gradients in the South Atlantic Ocean. Remote Sens. Environ. 2017, 194, 100–114. [Google Scholar] [CrossRef]
- Patil, K.; Deo, M.; Ravichandran, M. Prediction of sea surface temperature by combining numerical and neural techniques. J. Atmos. Ocean. Technol. 2016, 33, 1715–1726. [Google Scholar] [CrossRef]
- Patil, K.R.; Iiyama, M. Deep Learning Models to Predict Sea Surface Temperature in Tohoku Region. IEEE Access 2022, 10, 40410–40418. [Google Scholar] [CrossRef]
- Wu, S.; Fu, F.; Wang, L.; Yang, M.; Dong, S.; He, Y.; Zhang, Q.; Guo, R. Short-Term Regional Temperature Prediction Based on Deep Spatial and Temporal Networks. Atmosphere 2022, 13, 1948. [Google Scholar] [CrossRef]
- Aparna, S.; D’souza, S.; Arjun, N. Prediction of daily sea surface temperature using artificial neural networks. Int. J. Remote Sens. 2018, 39, 4214–4231. [Google Scholar] [CrossRef]
- Manessi, F.; Rozza, A. Learning Combinations of Activation Functions. In Proceedings of the 2018 24th International Conference on Pattern Recognition (ICPR), Beijing, China, 20–24 August 2018; pp. 61–66. [Google Scholar]
- Milliff, R.F.; Large, W.G.; Morzel, J.; Danabasoglu, G.; Chin, T.M. Ocean general circulation model sensitivity to forcing from scatterometer winds. J. Geophys. Res. Ocean. 1999, 104, 11337–11358. [Google Scholar] [CrossRef]
- Xue, Y.; Leetmaa, A. Forecasts of tropical Pacific SST and sea level using a Markov model. Geophys. Res. Lett. 2000, 27, 2701–2704. [Google Scholar] [CrossRef]
- Kug, J.S.; Kang, I.S.; Lee, J.Y.; Jhun, J.G. A statistical approach to Indian Ocean sea surface temperature prediction using a dynamical ENSO prediction. Geophys. Res. Lett. 2004, 31, L09212. [Google Scholar] [CrossRef]
- Lins, I.D.; Araujo, M.; das Chagas Moura, M.; Silva, M.A.; Droguett, E.L. Prediction of sea surface temperature in the tropical Atlantic by support vector machines. Comput. Stat. Data Anal. 2013, 61, 187–198. [Google Scholar] [CrossRef]
- Patil, K.; Deo, M.C. Prediction of daily sea surface temperature using efficient neural networks. Ocean. Dyn. 2017, 67, 357–368. [Google Scholar] [CrossRef]
- Zhang, Q.; Wang, H.; Dong, J.; Zhong, G.; Sun, X. Prediction of sea surface temperature using long short-term memory. IEEE Geosci. Remote Sens. Lett. 2017, 14, 1745–1749. [Google Scholar] [CrossRef]
- Al Shehhi, M.R.; Kaya, A. Time series and neural network to forecast water quality parameters using satellite data. Cont. Shelf Res. 2021, 231, 104612. [Google Scholar] [CrossRef]
- Aydınlı, H.O.; Ekincek, A.; Aykanat-Atay, M.; Sarıtaş, B.; Özenen-Kavlak, M. Sea surface temperature prediction model for the Black Sea by employing time-series satellite data: A machine learning approach. Appl. Geomat. 2022, 14, 669–678. [Google Scholar] [CrossRef]
- Xu, L.; Li, Q.; Yu, J.; Wang, L.; Xie, J.; Shi, S. Spatio-temporal predictions of SST time series in China’s offshore waters using a regional convolution long short-term memory (RC-LSTM) network. Int. J. Remote Sens. 2020, 41, 3368–3389. [Google Scholar] [CrossRef]
- Xiao, C.; Chen, N.; Hu, C.; Wang, K.; Xu, Z.; Cai, Y.; Xu, L.; Chen, Z.; Gong, J. A spatiotemporal deep learning model for sea surface temperature field prediction using time-series satellite data. Environ. Model. Softw. 2019, 120, 104502. [Google Scholar] [CrossRef]
- Patil, K.; Deo, M.; Ghosh, S.; Ravichandran, M. Predicting sea surface temperatures in the North Indian Ocean with nonlinear autoregressive neural networks. Int. J. Oceanogr. 2013, 2013, 11. [Google Scholar] [CrossRef]
- Qiao, B.; Wu, Z.; Tang, Z.; Wu, G. Sea surface temperature prediction approach based on 3D CNN and LSTM with attention mechanism. In Proceedings of the 2022 24th International Conference on Advanced Communication Technology (ICACT), Pyeongchang, Korea, 13–16 February 2022; pp. 342–347. [Google Scholar]
- Jonnakuti, P.K.; Bhaskar Tata Venkata Sai, U. A hybrid CNN-LSTM based model for the prediction of sea surface temperature using time-series satellite data. In Proceedings of the EGU General Assembly Conference Abstracts, Sessions, Vienna, 15 January 2020; p. 817. [Google Scholar]
- Yang, Y.; Dong, J.; Sun, X.; Lima, E.; Mu, Q.; Wang, X. A CFCC-LSTM model for sea surface temperature prediction. IEEE Geosci. Remote Sens. Lett. 2017, 15, 207–211. [Google Scholar] [CrossRef]
- Ghosh, A.; Sufian, A.; Sultana, F.; Chakrabarti, A.; De, D. Fundamental concepts of convolutional neural network. Recent Trends Adv. Artif. Intell. Internet Things 2020, 172, 519–567. [Google Scholar]
- Agga, A.; Abbou, A.; Labbadi, M.; El Houm, Y.; Ali, I.H.O. CNN-LSTM: An efficient hybrid deep learning architecture for predicting short-term photovoltaic power production. Electr. Power Syst. Res. 2022, 208, 107908. [Google Scholar] [CrossRef]
- Kordi, F.; Yousefi, H. Crop classification based on phenology information by using time series of optical and synthetic-aperture radar images. Remote Sens. Appl. Soc. Environ. 2022, 27, 100812. [Google Scholar] [CrossRef]
- Ghanbari, R.; Sobhani, B.; Aghaee, M.; Oshnooei Nooshabadi, A.; Safarianzengir, V. Monitoring and evaluation of effective climate parameters on the cultivation and zoning of corn agricultural crop in Iran (case study: Ardabil province). Arab. J. Geosci. 2021, 14, 387. [Google Scholar] [CrossRef]
- Khosravi, Y.; Bahri, A.; Tavakoli, A. Investigation of Sea Surface Temperature (SST) and its spatial changes in Gulf of Oman for the period of 2003 to 2015. J. Earth Space Phys. 2020, 45, 165–179. [Google Scholar]
- Tang, C.; Hao, D.; Wei, Y.; Zhao, F.; Lin, H.; Wu, X. Analysis of Influencing Factors of SST in Tropical West Indian Ocean Based on COBE Satellite Data. J. Mar. Sci. Eng. 2022, 10, 1057. [Google Scholar] [CrossRef]
- Ghanbari, R.; Heidarimozaffar, M.; Soltani, A.; Arefi, H. Land surface temperature analysis in densely populated zones from the perspective of spectral indices and urban morphology. Int. J. Environ. Sci. Technol. 2023, 20, 2883–2902. [Google Scholar] [CrossRef]
- Habeck, C.; Gazes, Y.; Razlighi, Q.; Stern, Y. Cortical thickness and its associations with age, total cognition and education across the adult lifespan. PLoS ONE 2020, 15, e0230298. [Google Scholar] [CrossRef]
- Aksan, F.; Li, Y.; Suresh, V.; Janik, P. CNN-LSTM vs. LSTM-CNN to Predict Power Flow Direction: A Case Study of the High-Voltage Subnet of Northeast Germany. Sensors 2023, 23, 901. [Google Scholar] [CrossRef]
- Aslam, S.; Herodotou, H.; Mohsin, S.M.; Javaid, N.; Ashraf, N.; Aslam, S. A survey on deep learning methods for power load and renewable energy forecasting in smart microgrids. Renew. Sustain. Energy Rev. 2021, 144, 110992. [Google Scholar] [CrossRef]
- Hochreiter, S.; Schmidhuber, J. Long short-term memory. Neural Comput. 1997, 9, 1735–1780. [Google Scholar] [CrossRef]
- Alhussein, M.; Aurangzeb, K.; Haider, S.I. Hybrid CNN-LSTM model for short-term individual household load forecasting. IEEE Access 2020, 8, 180544–180557. [Google Scholar] [CrossRef]
- Farhangi, F.; Sadeghi-Niaraki, A.; Razavi-Termeh, S.V.; Choi, S.-M. Evaluation of Tree-Based Machine Learning Algorithms for Accident Risk Mapping Caused by Driver Lack of Alertness at a National Scale. Sustainability 2021, 13, 10239. [Google Scholar] [CrossRef]
- Khorrami, M.; Khorrami, M.; Farhangi, F. Evaluation of tree-based ensemble algorithms for predicting the big five personality traits based on social media photos: Evidence from an Iranian sample. Personal. Individ. Differ. 2022, 188, 111479. [Google Scholar] [CrossRef]
- Ozbek, A.; Sekertekin, A.; Bilgili, M.; Arslan, N. Prediction of 10-min, hourly, and daily atmospheric air temperature: Comparison of LSTM, ANFIS-FCM, and ARMA. Arab. J. Geosci. 2021, 14, 622. [Google Scholar] [CrossRef]
- Tran, T.T.K.; Bateni, S.M.; Ki, S.J.; Vosoughifar, H. A review of neural networks for air temperature forecasting. Water 2021, 13, 1294. [Google Scholar] [CrossRef]
- Sunny, M.A.I.; Maswood, M.M.S.; Alharbi, A.G. Deep learning-based stock price prediction using LSTM and bi-directional LSTM model. In Proceedings of the 2020 2nd Novel Intelligent and Leading Emerging Sciences Conference (NILES), Giza, Egypt, 24–26 October 2020; pp. 87–92. [Google Scholar]
- Zahroh, S.; Hidayat, Y.; Pontoh, R.S.; Santoso, A.; Sukono, F.; Bon, A. Modeling and forecasting daily temperature in Bandung. In Proceedings of the international conference on industrial engineering and operations management, Riyadh, Saudi Arabia, 26–28 November 2019; pp. 406–412. [Google Scholar]
- Toharudin, T.; Pontoh, R.S.; Caraka, R.E.; Zahroh, S.; Lee, Y.; Chen, R.C. Employing long short-term memory and Facebook prophet model in air temperature forecasting. Commun. Stat.-Simul. Comput. 2023, 52, 279–290. [Google Scholar] [CrossRef]
- Hou, J.; Wang, Y.; Zhou, J.; Tian, Q. Prediction of hourly air temperature based on CNN–LSTM. Geomat. Nat. Hazards Risk 2022, 13, 1962–1986. [Google Scholar] [CrossRef]
- Zhang, Z.; Dong, Y. Temperature forecasting via convolutional recurrent neural networks based on time-series data. Complexity 2020, 2020, 8. [Google Scholar] [CrossRef]
- Roy, D.S. Forecasting the air temperature at a weather station using deep neural networks. Procedia Comput. Sci. 2020, 178, 38–46. [Google Scholar] [CrossRef]
- Choi, H.-M.; Kim, M.-K.; Yang, H. Deep-learning model for sea surface temperature prediction near the Korean Peninsula. Deep. Sea Res. Part II Top. Stud. Oceanogr. 2023, 208, 105262. [Google Scholar] [CrossRef]
- Wei, L.; Guan, L. Seven-day Sea Surface Temperature Prediction using a 3DConv-LSTM model. Front. Mar. Sci. 2022, 9, 2606. [Google Scholar] [CrossRef]
- Heryadi, Y.; Warnars, H.L.H.S. Learning temporal representation of transaction amount for fraudulent transaction recognition using CNN, Stacked LSTM, and CNN-LSTM. In Proceedings of the 2017 IEEE International Conference on Cybernetics and Computational Intelligence (CyberneticsCom), Phuket, Thailand, 20–22 November 2017; pp. 84–89. [Google Scholar]
- Garcia, C.I.; Grasso, F.; Luchetta, A.; Piccirilli, M.C.; Paolucci, L.; Talluri, G. A comparison of power quality disturbance detection and classification methods using CNN, LSTM and CNN-LSTM. Appl. Sci. 2020, 10, 6755. [Google Scholar] [CrossRef]
- Smith, B.A.; McClendon, R.W.; Hoogenboom, G. Improving air temperature prediction with artificial neural networks. Int. J. Comput. Intell. 2006, 3, 179–186. [Google Scholar]
- Fahimi Nezhad, E.; Fallah Ghalhari, G.; Bayatani, F. Forecasting maximum seasonal temperature using artificial neural networks “Tehran case study”. Asia-Pac. J. Atmos. Sci. 2019, 55, 145–153. [Google Scholar] [CrossRef]
- Park, I.; Kim, H.S.; Lee, J.; Kim, J.H.; Song, C.H.; Kim, H.K. Temperature prediction using the missing data refinement model based on a long short-term memory neural network. Atmosphere 2019, 10, 718. [Google Scholar] [CrossRef]
- Guo, X.; He, J.; Wang, B.; Wu, J. Prediction of Sea Surface Temperature by Combining Interdimensional and Self-Attention with Neural Networks. Remote Sens. 2022, 14, 4737. [Google Scholar] [CrossRef]
- Qu, B.; Gabric, A.J.; Zhu, J.-n.; Lin, D.-R.; Qian, F.; Zhao, M. Correlation between sea surface temperature and wind speed in Greenland Sea and their relationships with NAO variability. Water Sci. Eng. 2012, 5, 304–315. [Google Scholar]
- Rugg, A.; Foltz, G.R.; Perez, R.C. Role of mixed layer dynamics in tropical North Atlantic interannual sea surface temperature variability. J. Clim. 2016, 29, 8083–8101. [Google Scholar] [CrossRef]
- Al-Shehhi, M.R. Uncertainty in satellite sea surface temperature with respect to air temperature, dust level, wind speed and solar position. Reg. Stud. Mar. Sci. 2022, 53, 102385. [Google Scholar] [CrossRef]
- Gaube, P.; Chickadel, C.; Branch, R.; Jessup, A. Satellite observations of SST-induced wind speed perturbation at the oceanic submesoscale. Geophys. Res. Lett. 2019, 46, 2690–2695. [Google Scholar] [CrossRef]
- O’Neill, L.W.; Chelton, D.B.; Esbensen, S.K. The effects of SST-induced surface wind speed and direction gradients on midlatitude surface vorticity and divergence. J. Clim. 2010, 23, 255–281. [Google Scholar] [CrossRef]
- Wick, G.A.; Emery, W.J.; Kantha, L.H.; Schlüssel, P. The behavior of the bulk–skin sea surface temperature difference under varying wind speed and heat flux. J. Phys. Oceanogr. 1996, 26, 1969–1988. [Google Scholar] [CrossRef]
Disclaimer/Publisher’s Note: The statements, opinions and data contained in all publications are solely those of the individual author(s) and contributor(s) and not of MDPI and/or the editor(s). MDPI and/or the editor(s) disclaim responsibility for any injury to people or property resulting from any ideas, methods, instructions or products referred to in the content. |
© 2023 by the authors. Licensee MDPI, Basel, Switzerland. This article is an open access article distributed under the terms and conditions of the Creative Commons Attribution (CC BY) license (https://creativecommons.org/licenses/by/4.0/).
