Abstract
The active sound navigation and ranging (SONAR) transmission system emits acoustic pulses underwater using a wave generator, a SONAR power amplifier (SPA), and a projector. The acoustic pulse travel in the direction of the target and return as an echo to a hydrophone to learn the range or speed of the object. Often the same device is used as a hydrophone and a projector; in this context, it is known as a transducer. In order to obtain a maximum range of detection in the SONAR, it is desirable to generate the maximum amount of acoustic power until the point in which the echo can be detectable in an atmosphere with non-wished noise. Therefore, a high value of source level (SL) is required that depends largely on the value of electrical power applied to the transducer (). However, when trying to obtain the maximum range of detection in the SONAR system there are the following three peculiar limitations that affect performance: The cavitation, the reverberation, and the effect of interaction in the near field. In this paper, an experimental measurement methodology is presented to detect the cavitation effects in a tonpilz-type transducer for an active SONAR transmission system using a transducer as a projector and a calibrated hydrophone in a hydroacoustic tank by measuring the parameters of total harmonic distortion of the fundamental waveform (THD-F) of the generated acoustic pulse, transmitting voltage response (TVR) to characterize the system and sound pressure level (SPL) that indicates the intensity of sound at a given distance. Whereas the reverberation and the interaction effect in the near field are objects of other study cases. A 570.21 W and THD-F < switched-mode power amplifier (SMPA) prototype was developed to excite the electroacoustic transducer employing a full-bridge inverter (FBI) topology and a digital controller using a field-programmable gate array (FPGA) for unipolar sine pulse width modulation (SPWM) to generate a continuous wave (CW) acoustic pulse at a frequency 11.6 kHz. The results obtained show that from the level of W with the transducer at 1 of depth, the value of THD-F increases significantly while the behavior of the TVR and SPL parameters is affected since it is not as expected and is attributed when cavitation occurs.
1. Introduction
Today, the sound navigation and ranging (SONAR) systems are widely used in military applications such as the classification and detection of submarines, mines, or surface ships, as well as for subaqueous communications and identification of obstacles. In commercial applications, the SONAR is used to look for fossil deposits, banks of fish, seismic exploration, characterization, and measurement of the depth of the seabed. The word SONAR was coined after the war as the counterpart of radio detection and ranging (RADAR), as it is mentioned in [1]. Figure 1 shows the general architecture of a SONAR system.
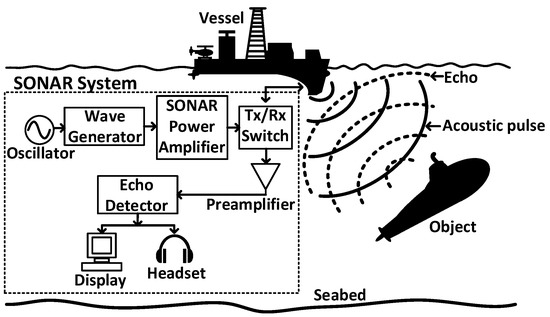
Figure 1.
General architecture of the SONAR system.
The SONAR operates in passive and active modes. Passive SONAR only listens to underwater acoustic sound radiated by various noise sources using a hydrophone and employs signal processing to analyze the nature of the signal in the frequency spectrum. The active SONAR emits acoustic pulses underwater using a wave generator, a SONAR power amplifier (SPA), and a projector. The acoustic pulse travel in the direction of the target and return as an echo to a hydrophone to learn the range or speed of the object. Often the same device is used as a hydrophone and a projector; in this context, it is known as a transducer [2]. In order to obtain a maximum range of detection in the SONAR, it is desirable to generate the maximum amount of acoustic power until the point in which the echo can be detectable in an atmosphere with non-wished noise. Therefore, a high value of source level (SL) is required and is defined by Equation (1) at a radial distance in far-field (r) of 1 . SL depends largely on the value of electrical power applied to the transducer () and of directivity index (DI), which generally takes a value between 10 and 30 for a flat wave as it is mentioned [3].
In general, the main topic of the articles found in the literature regarding passive SONAR is focused on signal processing with the development of object detection and classification algorithms. While the main topic of active SONAR focuses on the topology of the SPA to excite the transducer, increase the energy efficiency with the selection of power transistors and reduce the amount of total harmonic distortion of the fundamental waveform (THD-F) using different modulation techniques. Therefore, the experimentation literature on the operation of the active SONAR transmission system is limited, specifically when trying to obtain the maximum range of detection in the SONAR system there are the following three peculiar limitations that affect performance [1]: The cavitation generates bubbles on the surface of the transducer face and causes beam pattern degradation and acoustic power losses, the reverberation generates multiple echoes of the transmitted acoustic pulse from targets that are not of interest to the same source in the area from which the transmission is made and which becomes unwanted acoustic noise and the effect of interaction in the near field that is part of the SONAR design and occurs in large arrays of closely spaced projector elements. In this paper, an experimental measurement methodology is presented to detect the cavitation effects in a tonpilz-type transducer for an active SONAR transmission system using a transducer as a projector and a calibrated hydrophone in a hydroacoustic tank by measuring the parameters of THD of the generated acoustic pulse, transmitting voltage response (TVR) to characterize the system and sound pressure level (SPL) that indicates the intensity of sound at a given distance. Whereas the reverberation and the interaction effect in near-field are objects of other study cases.
2. Proposed Methodology
The measurement of electroacoustic parameters is essential to detect the effects of cavitation in the tonpilz transducer since cavitation is one of the main limiting factors in the performance of the active SONAR transmission system. Before the description of the experimental measurement methodology proposed to detect cavitation, the topics described below are addressed.
2.1. Cavitation
It is a phenomenon that takes place in the transducer when a negative pressure is generated, this happens when the signal emitted in the average hearing aid surpasses the environmental noise. Therefore, with little depth or in shallow water, more cavitation occurs, leading to bubbles forming on the surface of the transducer face. This, as a result, gives a degradation in the pattern of the beam, and there are losses of acoustic power radiated by the projector () due to the absorption and dispersion of the underwater waves by the bubbles, the transferred efficiency of the transmission system to the transducer is reduced. Therefore, with the increase in in some point, cavitation will take place. The cavitation is based on the depth and the intensity of the radiated acoustic power of the projector () that can be minimized to avoid exceeding the threshold that is shown in Figure 2.
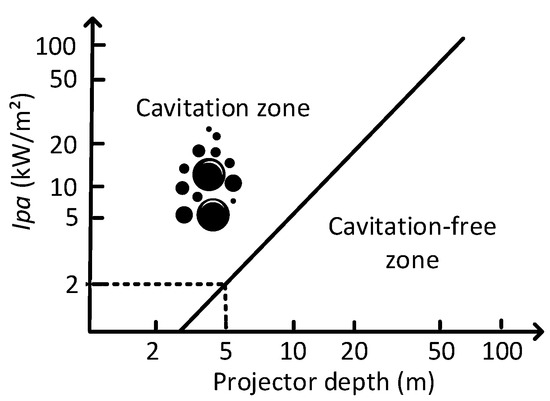
Figure 2.
Cavitation threshold for projectors.
Because cavitation takes a finite amount of time to build up, the threshold changes based on the pulse length and the transmission frequency, as mentioned in [1,2,4]; this is shown in Figure 3. It is observed that for pulse length (), the threshold is increased by about 3 for pulses up to 0.5 , but between 10 and 100 , it changes little, and for the frequency (), the threshold changes little up to 10 , but between 10 and 300 it increases linearly with the frequency.
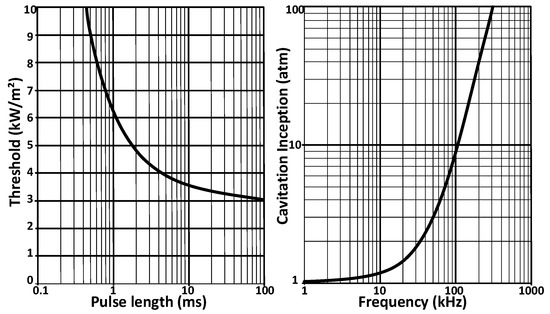
Figure 3.
Cavitation as a function of and f.
The value of the maximum electrical power applied to the projector () to avoid cavitation in the transducer is defined by Equation (2). It is observed that the limiting factor to diminish cavitation is the capacity to control the value of through .
where:
- = Radiated surface area, ;
- = Value of the cavitation threshold, ;
- = Factor of pulse length;
- = Transmission frequency factor, .
When cavitation bubbles occur on the face of the transducer, the sound pressure waveform can be affected in three different ways, as mentioned in [5] these are shown in Figure 4. In (a), the cavitation does not occur, while in (b), the negative peak touches the zero pressure line as the signal increases, which represents the threshold of cavitation, in (c), the excitation level of the transducer increases, and mild cavitation occurs that distorts the waveform, and in (d) violent cavitation occurs that causes a total rupture of the pressure wave and greatly distorts the waveform.
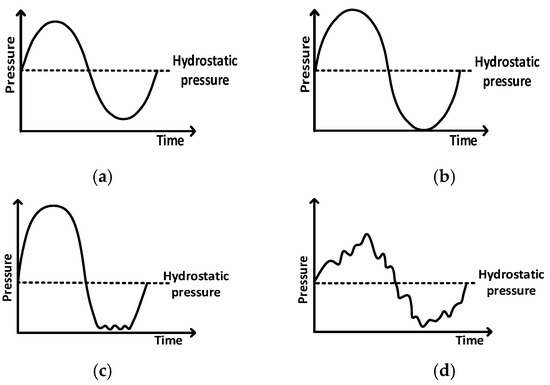
Figure 4.
Sound pressure waveform before and after cavitation. (a) No cavitation, (b) threshold of cavitation, (c) mild cavitation, (d) violent cavitation.
2.2. Transducer
Diverse types of transducers, such as projectors and hydrophones, exist that are used in passive or active SONAR. Figure 5 shows the tonpilz-type transducer that was used as the projector for this paper, such as the designs and models that appear in [6,7,8,9,10], which are found in active SONAR systems since they generally work in a frequency range below 20 .
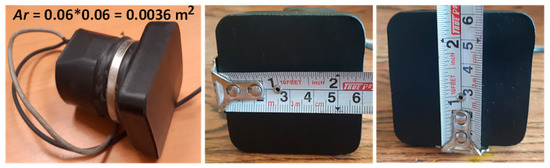
Figure 5.
Tonpilz-type transducer.
The transducer uses piezoelectric material as a sensible element based on Lead Zirconate Titanate (PZT) - by its chemical nomenclature. In general, a transducer is a process or device that turns energy from one form to another one. Therefore, the acoustic transducer has the property to turn the electrical energy into acoustic energy or vice versa, as it is shown in Figure 6.
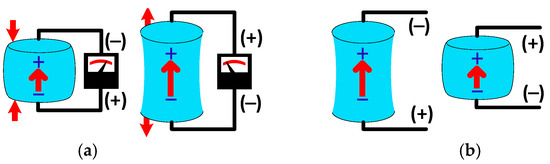
Figure 6.
The behavior of piezoelectric material: (a) generator, (b) motor.
The frequency behavior of the transducer is shown in Figure 7a, where a low impedance in the resonance frequency appears (), whereas in the antiresonance frequency (), a high impedance is obtained. These frequencies are determined by the characteristics of the piezoelectric ceramics of the transducer due to the composition of material, thickness, volume, and form of the element as described in [11] with the equivalent electrical circuit of the transducer Butterworth-Van Dyke as shown in Figure 7b.
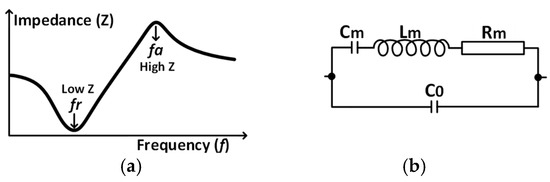
Figure 7.
Characteristics of transducer: (a) frequency response, (b) equivalent electrical circuit.
The equivalent circuit considers the capacitance of the mechanical circuit (, Inductance of the mechanical circuit (), resistance caused by mechanical losses () and which is (capacitance of ceramic at ) − ().
The value of the impedance of the transducer () in air and water is different. When is measured in the water changes and , because the impedance of radiation in the water is much greater than in the air since the radiation load is added to the mass of radiation () and the radiation resistance (). The air density is small, and the load of mass of radiation is for typical underwater-sound transducers, where is the dynamic mass of the transducer and the mechanical resonance occurs at the frequency at which the mass reactance () cancels the compliance reactance (), where is the electrical/mechanical deformation and is the electrical/mechanical stiffness that occurs in resonance. When the transducer is submerged, add the mass of water to the mass as shown in Figure 8, and it produces that will be reduced in a value between 10 and 20% for piston-type transducers, as mentioned in [6].
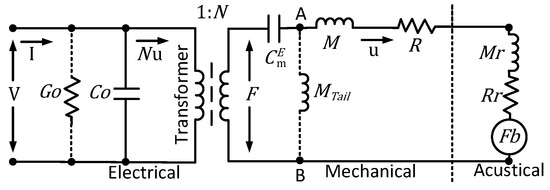
Figure 8.
Concentrated transducer electrical circuit.
The electrical circuit can represent a mechanical vibrating system by replacing the voltage with a force , the current with a velocity , is the turns ratio of the ideal transformer with the transduction coefficient, the inductor is the tail mass between AB, is electrical loss conductance and is the acoustic radiation source such as a projector.
On the other hand, because of the equivalent electrical circuit of the transducer, it has the parallel capacitor , which affects the transferred efficiency of the SPA to the transducer, as mentioned in [11]. Normally a parallel inductor () or a series inductor () is usually placed to the transducer as shown in the electric circuit in Figure 9 and that are defined by Equations (3) and (4), respectively. With the inductor, the impedance phase of the transducer () is tuned, ideally near zero degrees in to cancel the effect of to increase the efficiency. From the point of view of the total impedance () of the Equation (5), the aim is to cancel the capacitive reactance () by means of the inductive reactance () where resonance occurs and obtain a resistive load so that the electrical power is consumed with greater efficiency.
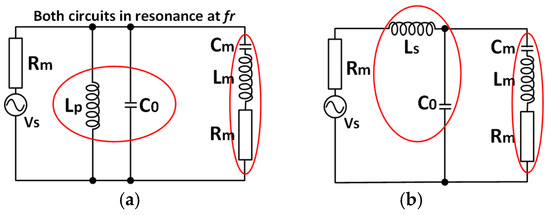
Figure 9.
Transducer tuning electrical circuits. (a) parallel tuning, (b) series tuning.
Usually, due to the electrical-acoustics conversion. The relation of these two powers defines the electro-acoustic efficiency () of the transducer-like projector through Equation (6), and its value generally varies between 20 and 70% depending on the construction of the transducer and its bandwidth, as mentioned in [1,2,6]. Generally, the transducer that operates as a projector has a narrow band and thus is consequently activated near where a greater amount of is obtained.
The measurement of was carried out with the Analog Discovery 2 impedance analysis equipment with the WaveForms software from the manufacturer Digilent, as shown in Figure 10. Whereas Figure 11 shows a frequency sweep of 5 to 20 applied to the transducer tonpilz, where the value is shown and in air and water, where is observed that a balance must be chosen between efficiency and electrical power. The values measurements of the , , and referred in the air will be , , and , and the measurements when the transducer is submerged in the water will be , , and respectively. Table 1 shows a summary of the values obtained from the measurements and shows that the value of is 9.3% less to and is 74.7% greater than .
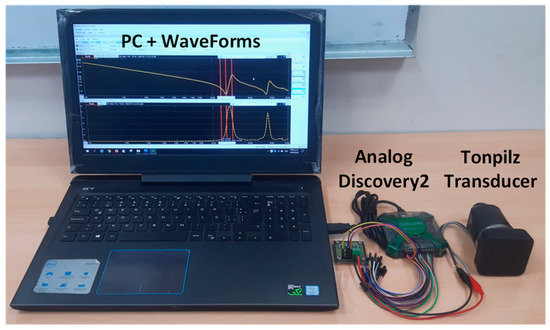
Figure 10.
Equipment of impedance measurement of the transducer.
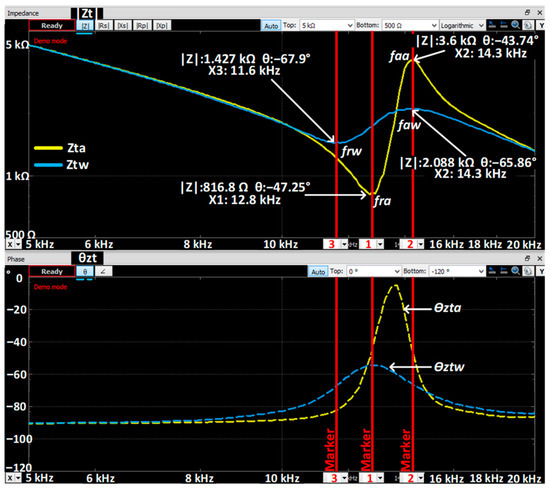
Figure 11.
Transducer impedance measurement in air and water.

Table 1.
Transducer measurements values.
2.3. SONAR Power Amplifier
The SONAR power amplifier (SPA), in general terms, is an electronic power system that increases the voltage magnitude of an electrical input signal that is typically in the range of 1–3 V RMS to apply it to the transducer and generate acoustic energy as shown in Figure 12. Generally, the output voltage of the SPA is greater than 1 due to the high impedance of the transducer.
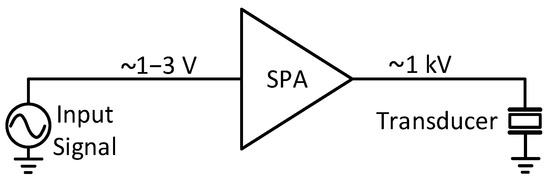
Figure 12.
SPA general system.
The SPA topologies are characterized by their mode of operation and can be linear or switched. The linear power amplifier (LPA) activates BJT transistors in the active region, so the electrical efficiency is around 60% and employs topologies such as those shown in Table 2 and mentioned in [12,13]. Active SONAR transmission systems generally handle powers from 1 to 40 kilowatts (), as mentioned in [2], which are installed to operate on submarines or surface units such as ships that require minimizing as much as possible the space and weight of installed equipment. This makes the LPA impractical for these applications because it presents a low energy efficiency since obtaining a high power implies having a large, expensive, and inefficient system.
Table 2.
Conduction characteristics of LPA.
On the other side, the block diagram of the switch-mode power amplifier (SMPA) is shown in Figure 13, which employs topologies such as class B (push-pull), D, S, etc. The efficiency of the SMPA is between 85 and 95%, as mentioned in [14,15], and it has low electrical losses because the MOSFET transistors are not activated all time since a bipolar or unipolar pulse-width modulation (PWM) is often used; therefore, its efficiency is greater than that of LPA. In order to control the SPA gain and decrease the total harmonic distortion (THD), sinusoidal pulse-width modulation (SPWM) is usually used, as shown in [16], by comparing a triangular carrier signal () and a sine modulator signal () as shown in Figure 14. The ratio of peak voltage amplitudes of the modulating signal () and carrier signal () is the amplitude modulation index (), which can vary between 0 and 1 and which is defined in Equation (7). Furthermore, should be considered to be 10 times less than the value of to obtain an acceptable waveform quality.
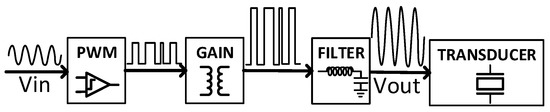
Figure 13.
SMPA block diagram.
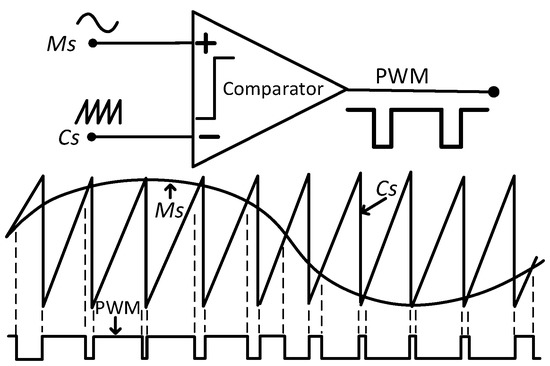
Figure 14.
Comparison between carrier and modulation signal.
In order to raise the voltage and obtain a greater amount of , a transformer is used to provide galvanic isolation and impedance coupling between the energy source and the connected load. The voltage level is controlled by the transformation relation (), which is defined by Equation (8) and indicates that if raises the voltage or if reduces the voltage. The output power () and the apparent impedance of the primary winding () of the transformer are defined by Equations (9) and (10), respectively. Figure 15 shows an ideal transformer in which the losses it presents are not considered, as mentioned in [17].
where:
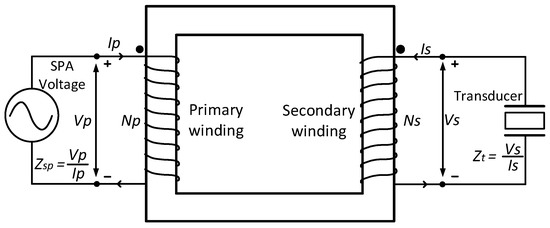
Figure 15.
Ideal transformer with connected transducer.
- = Current of the primary or secondary winding;
- = Voltage of the primary or secondary winding;
- = Number of turns of the primary or secondary winding;
- = Phase angle of voltage concerning current.
In the SPA, there are three types of second-order Butterworth low-pass LC filters used, which can be of bridge-tied load (BTL) configuration or its equivalent in single-ended (SE), as shown in Figure 16 and mainly depend on whether the modulation is bipolar or unipolar. The selection of inductor (L) or capacitor (C) values is a critical parameter to attenuate the high frequency of and obtain an output voltage at the fundamental frequency of , as mentioned in [18]. The ratio of impedance LC filter () and determine the damping factor (DF) that is defined by Equation (11), where it is observed that the higher its value, the better the vibration of the transducer will be controlled by the SPA.
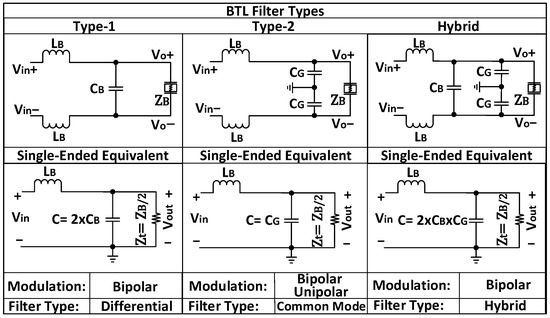
Figure 16.
Filter types and their equivalent circuits SE.
The cut-off frequency (), the quality factor () should ideally be , the inductor and capacitor are defined by Equations (12), (13), (14) and (15) respectively, where and is the load resistance.
In the literature, there are several topologies of SMPA to excite the transducer, which mainly focus on increasing energy efficiency with the selection of power transistors and reducing the content of THD using different modulation techniques. Table 3 shows a summary of the most important characteristics of commonly used SPA technologies such as class B [19,20,21], class D [22,23,24], full-bridge inverter (FBI) [25,26,27,28], multilevel inverter (MLI) [29,30] and T-type inverter [31,32].
Table 3.
Characteristics of SPA topologies.
The SPA topology selected for the active SONAR transmission system is a full-bridge inverter with an SPWM controller, as shown in Figure 17. This topology offers good performance, such as low THD, uses four transistors, so the control is simple, has high power capacity, and the implementation is practical since the size is moderate compared to the power capacity handled by the system. The transistors are activated with a unipolar SPWM modulation technique to have a modulated output voltage of three levels ( and ), which is incremented by means of a transformer and passes through an LC filter of BTL Type-2 configuration in common mode to obtain a voltage that is applied to the transducer connected with .
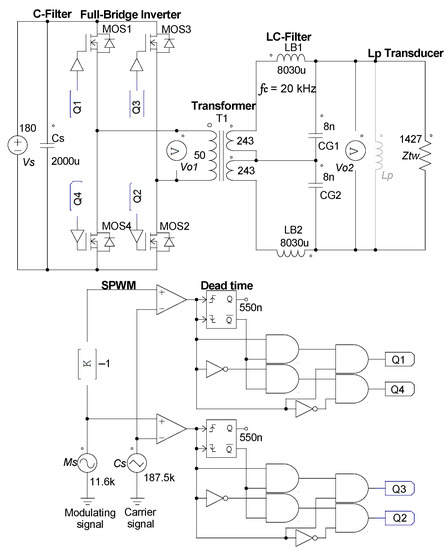
Figure 17.
SPA topology for the active SONAR transmission system.
2.4. Pulse Types
The underwater acoustic pulses transmitted by the active SONAR transmission system are generated by an oscillator and waveform controller and returned as echoes to the transducer or hydrophone. The most commonly used pulses in active SONAR are continuous wave (CW) and frequency modulation (FM) as mentioned in [2,4,33,34].
The CW pulse is a transmission pulse of constant frequency and duration of pulse length () in seconds. It is narrowband with a bandwidth pulse Hz, has low range resolution, high Doppler effect, and can be a shapeless pulse where the amplitude is constant for or shaped pulse where the amplitude changes during , as shown in Figure 18.
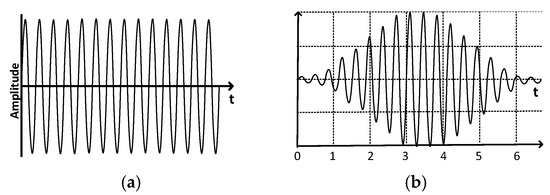
Figure 18.
Types of CW transmission pulses: (a) shapeless pulse, (b) shaped pulse.
The FM pulse, also known as the CHIRP pulse, is a transmission pulse where the frequency changes the ascending or descending order during in seconds, while in the SONAR, the pulse is not frequency modulated at all. It is broadband where the value of is not the inverse of , has a high definition in range, a low Doppler effect, and which is classified as linear frequency modulation (LFM), nonlinear frequency modulation (NLFM), and hyperbolic frequency modulation (HFM) as shown in Figure 19.
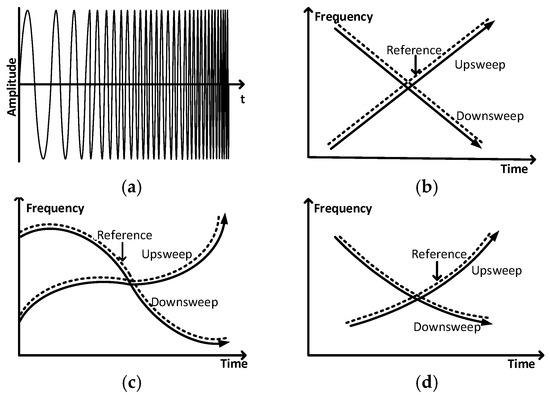
Figure 19.
Types of FM transmission pulses: (a) FM pulse, (b) LFM pulse, (c) NLFM pulse, and (d) HFM pulse.
2.5. Measurement Methodology
The measurement parameters to detect the cavitation effects in a tonpilz-type transducer for an active SONAR transmission system are through the THD-F of the generated acoustic pulse to know the quality of the waveform, TVR to characterize the SONAR system and the SPL that indicates the intensity of the sound at a specified distance. Once the behavior of the system with the TVR is known, the aim is to measure how the cavitation bubbles affect the SPL.
The TVR is measured in decibels () and provides the pressure in a medium of transmission per unit electrical excitation related to the transmission frequency, which is measured in the direction of the maximum response axis (MRA), as shown in Figure 20. The TVR is the most used electroacoustic parameter to estimate the performance of transducers, underwater electroacoustic systems, or some part of the SONAR system. To obtain the TVR there are various calibration methods for projectors, as mentioned in [35], which can be made by measurements of voltage, current, phase, sound pressure, speed of the particle, or its proportions. The measurement method proposed in this paper is the comparison calibration method, due to one of the fastest and simplest methods. This method uses a calibrated hydrophone at a radial separation distance in a far field () of 1 from the projector with an acoustic reference pressure in the water () of 1 . The proposed TVR measurement system using the comparison method is shown in Figure 21, where voltage measurements are made to obtain the TVR value using Equation (16), as mentioned in [5].
where:
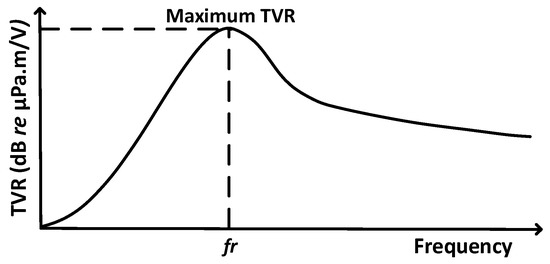
Figure 20.
A typical graph of TVR.
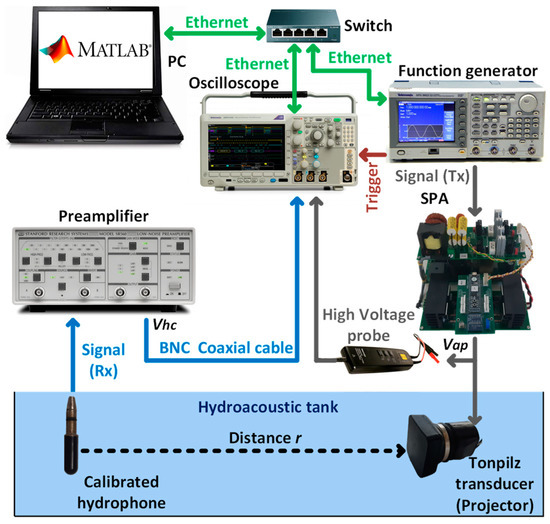
Figure 21.
Proposed TVR measurement system.
- ;
- ;
- = Hydrophone open-circuit voltage;
- = Preamplifier gain;
- = Hydrophone voltage coupling loss;
- = Hydrophone sensitivity;
- = Voltage applied to the projector;
- = Amplifier voltage ratio;
- = Amplifier gain.
On the other hand, SPL is a widely used parameter for sound pressure measurements in acoustic systems. In practical measurement terms, it is defined by Equation (17), where the characteristics of the emission source do not intervene. The objective of measuring the SPL is that with the increase in the electrical power , the acoustic power will increase, and at some point, cavitation will occur due to the characteristics of the projector that limit the amount of . Cavitation causes bubbles to form on the surface of the projector face, and that causes a decrease .
For the square-face tonpilz-type transducer, the minimum separation criterion between the projector and the hydrophone () should be considered with Equation (18), where is the length of one side of the face of the square-face transducer and λ is the wavelength. It is recommended that the measurement is in the far field and not in the near field, as mentioned in [1,2]. Near-field measurement causes large variations with undesired behavior, so far-field measurement is preferable.
2.6. Calibrate Hydrophone
The calibrated hydrophone is essential for underwater measurements due to its frequency response at the reception; it has low variation and high sensitivity within a bandwidth. The calibrated hydrophone used is the model 8103 from the manufacturer Brüel & Kjær, as shown in Figure 22, and its characteristics are presented as follows: Frequency range: 4 a 200 ± 1 , : −211.5 = 26.6 . The values obtained from the hydrophone calibration are provided by the manufacturer and are shown in Figure 23 [36].
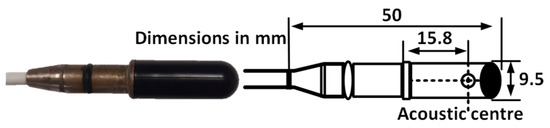
Figure 22.
Calibrated hydrophone B&K.
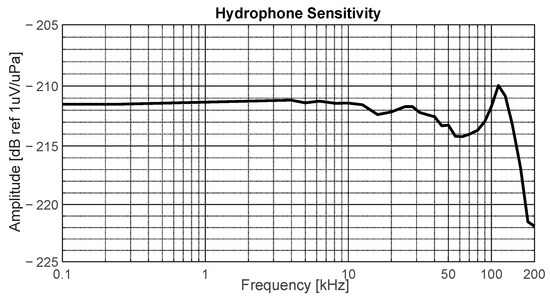
Figure 23.
Hydrophone frequency response.
3. Implementation and Results
Figure 24 shows the implementation of the SPA with the tonpilz transducer, which has an isolated FBI with a transformer, a type-2 LC filter, and a Cmod-A7 controller that incorporates a 12 clock and a field-programmable gate array (FPGA) Artix-7 for unipolar SPWM modulation. The design of the magnetic components was carried out with the geometry of the core (), as mentioned in [37]. For the transformer, the value was obtained by Equation (19), and the nickel/zinc (Ni/Zn) ferrite core of the manufacturer TDK model PQ 40/40 was used. While for the inductors and , the value of was obtained by Equation (20), and an iron powder toroid core from manufacturer Micrometals model T131-26 was used.
where:
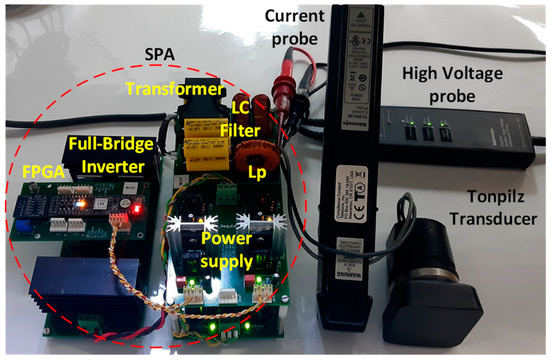
Figure 24.
SPA implementation with the tonpilz transducer.
- Total apparent power;
- Voltage regulation that has a value 5%;
- Electrical conditions coefficient;
- Energy-handling capability.
Figure 25 shows the waveform of the full-bridge inverter output voltage with a value of with unipolar SPWM modulation and an effective input voltage of 150 with frequencies of and while Figure 26 shows the value of by Equation (10) with a value of . On the other hand, the amount of total harmonic distortion of the fundamental waveform (THD-F) of the output voltage of the SPA or voltage applied to the projector () depends on several considerations in the parameters such as the values of , , and that is controlled by means of . Therefore, when changing any value of these parameters, the value of THD-F will change. Figure 27 shows a value of THD-F with a CW transmission pulse with values of , and . Table 4 shows a summary of and THD-F of with different values of .
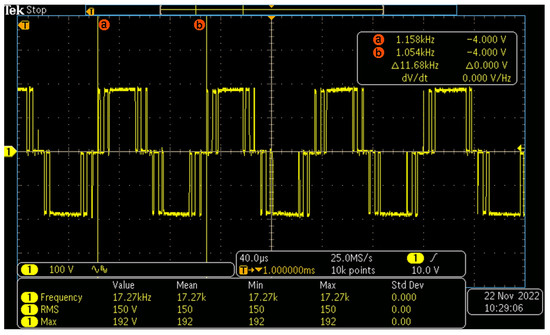
Figure 25.
Full-bridge inverter output voltage, .
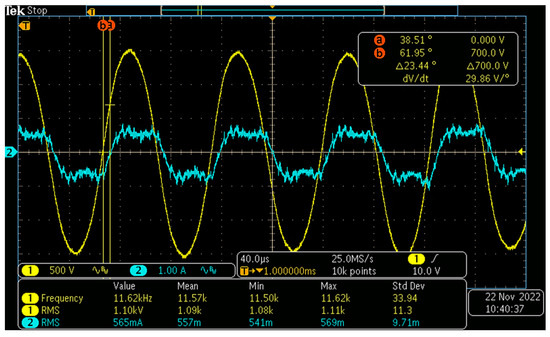
Figure 26.
Electrical power W, CW pulse, Ma = 0.9.
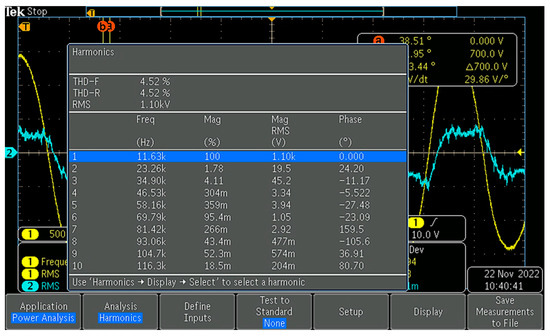
Figure 27.
Amount of THD-F, CW pulse, .
Table 4.
Electrical power and THD-F of vs. Ma.
A way to detect cavitation is visual. Therefore, as an observation method, the transducer was placed in the infrastructure of a hydroacoustic tank that is covered with sound-absorbing wedges and has dimensions of 9 long, 4.5 wide, and 4.5 depth, as shown in Figure 28. The projector was mounted on a structural aluminum profile with a longitudinal and transverse middle location of the hydroacoustic, where only for this observation test a waterproof camera was placed inside the tank as shown in Figure 29. The value of was obtained with Equation (2) and was the following values: , for a depth = 1 , for and for , for . When Pe > Pm the cavitation occurs, forming bubbles in the face of the transducer, as shown in Figure 30, and Table 5 shows a summary of transducer cavitation observation, which for this observation experiment was presented from a value of with power value with respect to the results of Table 4, where × indicates no cavitation and ✓ presence of cavitation.
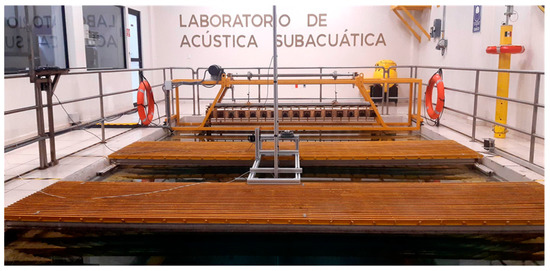
Figure 28.
Hydroacoustic tank of the laboratory of underwater acoustics.
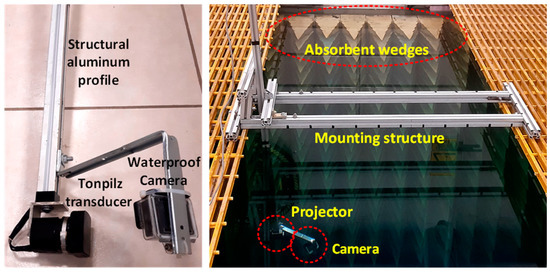
Figure 29.
Mounting of the transducer with a waterproof camera.
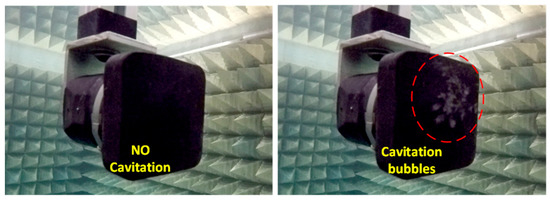
Figure 30.
Cavitation in transducer tonpilz.
Table 5.
Observation of transducer cavitation.
In order to detect cavitation with a measurement parameter, the projector, and the hydrophone were mounted in the hydroacoustic tank, as shown in Figure 31, while Figure 32 shows the instruments and measurement equipment that were used, and their characteristics are briefly described below:
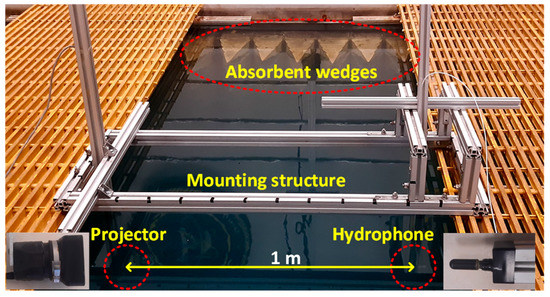
Figure 31.
Mounting of transducer and hydrophone.
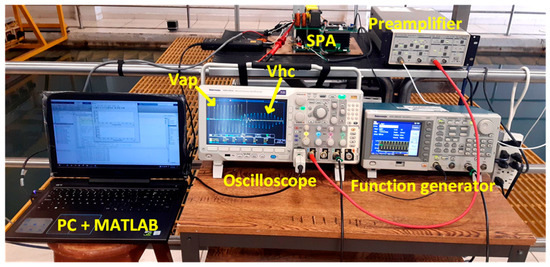
Figure 32.
Instruments and measuring equipment.
- Oscilloscope MDO3024, Bandwidth , Sampling Rate ;
- Function generator AFG3022C, Bandwidth , Sampling Rate ;
- Low-Noise Preamplifier SR560, Bandwidth , 4 nV/√Hz input noise.
Table 6 shows a summary of the results obtained in the measurement of THD-F of the generated acoustic pulse, which is the open circuit voltage of the calibrated hydrophone () with different values of . The results show that the cavitation bubbles affect the waveform; the amount of THD-F begins to increase significantly from a value of and slightly changes its amplitude, as shown in Figure 33.
Table 6.
THD-F of vs. Ma.
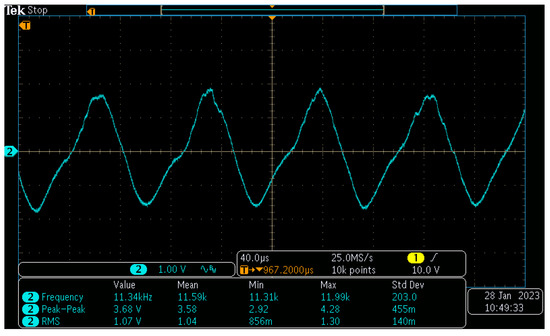
Figure 33.
waveform with cavitation, Ma = 0.9.
The TVR and SPL measurement parameters that generally measure the performance of the active SONAR transmission system were obtained with the measurements of the voltages and are placed in a program with MATLAB® software where a local area network (LAN) of Ethernet communication is available, assigning internet protocol (IP) addresses to the computer equipment, the oscilloscope, and the function generator. The program sends and receives commands in backus-naur form (BNF) notation that uses different symbols and special characters in ASCII code, based on a standard commands for programmable instruments (SCPI) language using a programming environment defined by messages, instrument response, and data format [38,39]. For example SOURce1:FREQuency 100% Generator source signal at the frequency of 100 . It is important to mention that in order for the instruments to communicate the computer equipment with MATLAB®, the NI-VISA package must be installed [40]. This package is an instrument controller that uses an application programming interface (API).
Figure 34 shows the TVR, which indicates the frequency where the active SONAR system is most efficient in transmitting the underwater acoustic pulse. It can be seen that the highest value of the TVR is in kHz that corresponds to the measurement of , which is shown in Figure 11. The TVR was obtained with the following characteristics:
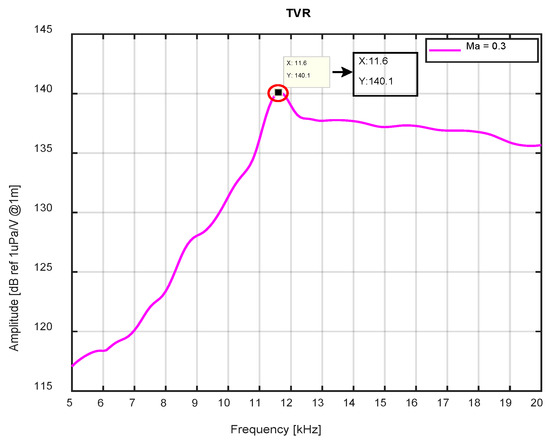
Figure 34.
TVR of the SONAR system with tonpilz transducer.
- Initial frequency (): ;
- Final frequency (): ;
- Frequency step (): ;
- Signal type: CW burst;
- Pulse length () = ;
- Pulse Repetition Interval (PRI): ;
- Amplifier voltage ratio (): Direct measurement;
- Electrical attenuation of the hydrophone (): ;
- Radial distance of hydrophone to the projector (): 1 m;
- Depth: ;
- Amplifier gain (): Direct measurement;
- Preamplifier gain (): .
Figure 35 shows the TVR with different levels of , and it can be seen that in most cases, the TVR tends to have a similar behavior because the values of and increase or decrease in the same proportion. However, the results show that from a value of the behavior of the TVR is not as expected, where the most significant change in the behavior of the TVR occurs at the resonance frequency where the cavitation occurs. On the other hand, Figure 36 shows the SPL with different levels of at a distance of 1 m from the projector with respect to the calibrated hydrophone. The results show that the SLP generated by the active SONAR transmission system gradually increases with respect to the value of . However, for the cases where the value of and where cavitation occurs, the behavior of the SPL is not as expected. The behavior of the TVR and SPL parameters is similar for the cases where cavitation occurs, as shown in Table 5 and Table 6, where it affects the amplitude and, consequently, the performance of the system. Therefore, the previous results show the values of where cavitation is detected.
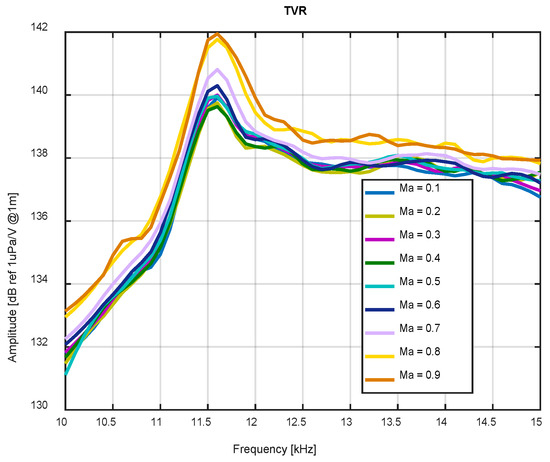
Figure 35.
TVR of the SONAR system with different values of .
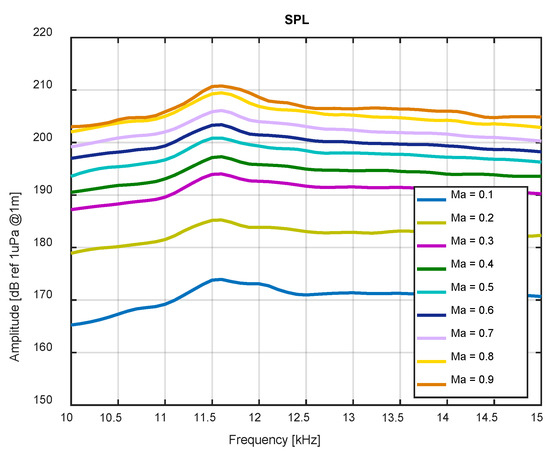
Figure 36.
SPL of the SONAR system with different values of .
4. Conclusions
An experimental measurement methodology is presented to detect the cavitation effects in a tonpilz-type transducer for an active SONAR transmission system using a transducer as a projector and a calibrated hydrophone in a hydroacoustic tank. In the active SONAR transmission system, the transducer was excited using a developed prototype of SPA with an electrical output power of 570.21 W and THD-F < . A full-bridge inverter topology with SPWM modulation was used to generate a CW acoustic pulse, and the efficiency of the system was increased with the connection of the parallel inductor to the transducer, obtaining a lag of 23.44° of the current with respect to the voltage.
The results show that the cavitation in the transducer was detected with a visual observation method with a waterproof camera where the cavitation occurred at the levels of and with the transducer at 1 of depth. Cavitation was also detected by measuring the amount of THD-F of from the value of , which corresponds to a value of W, and it is suggested to measure this parameter with an oscilloscope. On the other hand, the results of the measurements of the behavior of the TVR and SPL parameters show that cavitation is detected from the value of , because the behavior of these parameters is not as expected, and it is suggested that they be measured to know in more detail the performance of the active SONAR transmission system.
With the results obtained, it can be deduced that a practical application to detect cavitation in an active SONAR transmission system that is in operation is by measuring the amount of THD-F of the echo of the acoustic pulse that returns to the same transducer or hydrophone. Therefore, the power controller of the SONAR system must regulate the level of based on the experimentation of the value of THD-F of the echo of the acoustic pulse.
As future work for the developed active SONAR transmission system, the implementation of a closed-loop controller to regulate the level and prevent cavitation in the transducer by measuring the amount of THD-F of the echo of the acoustic pulse. Moreover, add in the SPA a closed loop circuit to control the SPL level for CW and FM acoustic transmission pulses at different frequencies.
Author Contributions
Conceptualization, R.V. and H.L.; methodology, R.V.; software, R.V.; validation, H.L., R.V.C.-S., N.V. and A.E.-C.; formal analysis, R.V.C.-S., N.V. and A.E.-C.; investigation, R.V.; resources, R.V. and H.L.; data curation, H.L. and A.E.-C.; writing—original draft preparation, R.V. and H.L.; writing—review and editing, R.V.C.-S., N.V. and A.E.-C.; visualization, R.V.; supervision, H.L. All authors have read and agreed to the published version of the manuscript.
Funding
This research received no external funding.
Institutional Review Board Statement
No applicable.
Informed Consent Statement
No applicable.
Data Availability Statement
No applicable.
Conflicts of Interest
The authors declare no conflict of interest.
References
- Urick, R.J. Principles of Underwater Sound for Engineers, 3rd ed.; McGraw-Hill: New York, NY, USA, 1983; pp. 1–14, 44–78, 110–128, 161–219. [Google Scholar]
- Waite, A.D. Sonar for Practising Engineers, 3rd ed.; John Wiley & Sons: Hoboken, NJ, USA, 2002; pp. 1–12, 50–66, 103–118, 161–174. [Google Scholar]
- Tichý, J.; Erhart, J.; Kittinger, E.; Privratska, J. Fundamentals of Piezoelectric Sensorics: Mechanical, Dielectric, and Thermodynamical Properties of Piezoelectric Materials; Springer Science & Business Media: Cham, Switzerland, 2010; pp. 1–13. [Google Scholar]
- Hodges, R.P. Underwater Acoustics: Analysis, Design and Performance of Sonar, 1st ed.; John Wiley & Sons: Hoboken, NJ, USA, 2010; pp. 1–15, 63–68, 241–253. [Google Scholar]
- Acoustic Measurements for SONAR Transducer Test Personnel Student Guide; Naval Underwater Systems Center: New London, CT, USA, 1990; pp. II-37–64, II-99–100.
- Sherman, C.H.; Butler, J.L. Transducers and Arrays for Underwater Sound, 2nd ed.; Springer International Publishing: Cham, Switzerland, 2016; pp. 1–30, 58–73, 455–460, 580–582. [Google Scholar]
- Pyo, S.; Afzal, M.S.; Lim, Y.; Lee, S.; Roh, Y. Design of a wideband tonpilz transducer comprising non-uniform piezoceramic stacks with equivalent circuits. Sensors 2021, 21, 2680. [Google Scholar] [CrossRef] [PubMed]
- Wei, Y.; Yang, X.; Chen, Y.; Zhang, Z.; Zheng, H. Modeling of High-Power Tonpilz Terfenol-D Transducer Using Complex Material Parameters. Sensors 2022, 22, 3781. [Google Scholar] [CrossRef] [PubMed]
- Kim, J.; Roh, Y. Modeling and design of a rear-mounted underwater projector using equivalent circuits. Sensors 2020, 20, 7085. [Google Scholar] [CrossRef] [PubMed]
- Pyun, J.Y.; Kim, Y.H.; Park, K.K. Design of Piezoelectric Acoustic Transducers for Underwater Applications. Sensors 2023, 23, 1821. [Google Scholar] [CrossRef] [PubMed]
- APC International, Ltd. Piezoelectric Ceramics: Principles and Applications; APC International: Mill Hall, PA, USA, 2002; pp. 8–23, 80–108. [Google Scholar]
- Cordell, B. Designing Audio Power Amplifiers, 2nd ed.; McGraw-Hill: New York, NY, USA, 2019; pp. 3–45, 166–188, 713–721. [Google Scholar]
- Self, D. Audio Power Amplifier Design, 6th ed.; Taylor & Francis: New York, NY, USA, 2013; pp. 2–22, 422–447. [Google Scholar]
- Sahin, O.U. The Design and Implementation of a SONAR Power Amplifier. In Proceedings of the 2018 IEEE 18th International Power Electronics and Motion Control Conference (PEMC), Budapest, Hungary, 26–30 August 2018; pp. 199–204. [Google Scholar]
- Mei, S.; Hu, Y.; Xu, H.; Wen, H. The Class D Audio Power Amplifier: A Review. Electronics 2022, 11, 3244. [Google Scholar] [CrossRef]
- Rashid, M.H. Electrónica de Potencia: Circuitos, Dispositivos y Aplicaciones, 4th ed.; Pearson Educación: Mexico City, Mexico, 2015; pp. 282–349. [Google Scholar]
- Stephen, J.C. Máquinas Eléctricas, 5th ed.; McGraw-Hill: Mexico City, Mexico, 2012; pp. 1–22, 50–70. [Google Scholar]
- SLAA701A. LC Filter Design Application Report; Texas Instrument: Dallas, TX, USA, 2016. [Google Scholar]
- Bianchi, D.; Quaglia, F.; Mazzanti, A.; Svelto, F. Analysis and design of a high voltage integrated class-B amplifier for ultra-sound transducers. IEEE Trans. Circuits Syst. I Regul. Pap. 2014, 61, 1942–1951. [Google Scholar] [CrossRef]
- Choi, H. Prelinearized Class-B Power Amplifier for Piezoelectric Transducers and Portable Ultrasound Systems. Sensors 2019, 19, 287. [Google Scholar] [CrossRef] [PubMed]
- Ramos, F.; Arnold, F. A Performance Evaluation of Class-B Amplifiers for Driving Piezoelectric Transducers. In Proceedings of the 2021 IEEE UFFC Latin America Ultrasonics Symposium (LAUS), Gainesville, FL, USA, 4–5 October 2021; pp. 1–4. [Google Scholar]
- Colli-Menchi, A.I.; Sánchez-Sinencio, E. A high-efficiency self-oscillating class-D amplifier for piezoelectric speakers. IEEE Trans. Power Electron. 2014, 30, 5125–5135. [Google Scholar] [CrossRef]
- Song, H.Y.; Wen, M.; Da Chen, G.; Deng, H.C. Design and Implementation of a Class D Power Amplifier for a Transmitter in a Sonar System. In Proceedings of the 2015 International Industrial Informatics and Computer Engineering Conference, Xi’an, Shaanxi, China, 10–11 January 2015; Atlantis Press: Amsterdam, The Netherlands; pp. 1647–1650. [Google Scholar]
- Ebrahimi, R.; Ayobi, N.; Ghasemi, P.S.; Aghdam, E.N. Real-Time Control of Resonance Point of Piezoelectric Transducers Based on Class D Power Converter. In Proceedings of the 2019 27th Iranian Conference on Electrical Engineering (ICEE), Yazd, Iran, 30 April–2 May 2019; pp. 336–340. [Google Scholar]
- Panchalai, V.N.; Chacko, B.P.; Sivakumar, N. Digitally controlled power amplifier for underwater electro acoustic transducers. In Proceedings of the 2016 3rd International Conference on Signal Processing and Integrated Networks (SPIN), Noida, India, 11–12 February 2016; pp. 306–311. [Google Scholar]
- Song, S.M.; Kim, I.D.; Lee, B.H.; Lee, J.M. Design of High-Efficiency High-Power Transmitter for Active Sonar. In Proceedings of the 2018 21st International Conference on Electrical Machines and Systems (ICEMS), Jeju, Republic of Korea, 7–10 October 2018; pp. 2183–2188. [Google Scholar]
- Song, S.M.; Kim, I.D.; Lee, B.H.; Lee, J.M. A Study on Feedback and Feedforward Control of High Power Transmitters for Active Sonar. In Proceedings of the 2019 IEEE 4th International Future Energy Electronics Conference (IFEEC), Singapore, 25–58 November 2019; pp. 1–5. [Google Scholar]
- Lee, B.H.; Baek, J.E.; Kim, D.W.; Lee, J.M.; Sim, J.Y. Optimized Design of a Sonar Transmitter for the High-Power Control of Multichannel Acoustic Transducers. Electronics 2021, 10, 2682. [Google Scholar] [CrossRef]
- Sreekumar, A.; Panchalai, V.N.; Chacko, B.P.; Thekkath, P. Multilevel converter for excitation of underwater transducers. In Proceedings of the 2015 International Conference on Advances in Computing, Communications and Informatics (ICACCI), Kochi, India, 10–13 August 2015; pp. 651–655. [Google Scholar]
- Chacko, B.P.; Panchalai, V.N.; Sivakumar, N. Multilevel digital sonar power amplifier with modified unipolar SPWM. In Proceedings of the 2015 International Conference on Advances in Computing, Communications and Informatics (ICACCI), Kochi, India, 10–13 August 2015; pp. 121–125. [Google Scholar]
- Schweizer, M.; Kolar, J.W. High efficiency drive system with 3-level T-type inverter. In Proceedings of the 2011 14th European Conference on Power Electronics and Applications, Birmingham, UK, 30 August–1 September 2011; pp. 1–10. [Google Scholar]
- Zhang, Z.; Zhang, J.; Wu, X. A single phase T-type inverter operating in boundary conduction mode. In Proceedings of the 2016 IEEE Energy Conversion Congress and Exposition (ECCE), Milwaukee, WI, USA, 18–22 September 2016; pp. 1–6. [Google Scholar]
- Patel, K.; Neelakantan, U.; Gangele, S.; Vacchani, J.G.; Desai, N.M. Linear frequency modulation waveform synthesis. In Proceedings of the 2012 IEEE Students’ Conference on Electrical, Electronics and Computer Science, Bhopal, India, 1–2 March 2012; pp. 1–4. [Google Scholar]
- Bhushan, A.P.; Manoj, G. Study on High Frequency Pulser Based Power Amplifier for Underwater Imaging Sonar Application. In Proceedings of the 2018 International Conference on Control, Power, Communication and Computing Technologies (ICCPCCT), Kannur, India, 23–24 March 2018; pp. 96–99. [Google Scholar]
- Bobber, R.J. Underwater Electroacoustic Measurements; Naval Research Laboratory: Washington, DC, USA, 1970; pp. 1–15, 134–190. [Google Scholar]
- BP 0317–23; Hydrophone Types 8103, 8104, 8105 and 8106. Hottinger Brüel&Kjær A/S: Nærum, Denmark, 2021.
- McLyman, C.W.T. Transformer and Inductor Design Handbook, 4th ed.; Dekker: New York, NY, USA, 2011; pp. 3/34–44, 7/0–30, 9/0–19. [Google Scholar]
- 071-1639-04; AFG3000 Series Arbitrary/Function Generators Programmer Manual. Tektronix: Beaverton, OR, USA, 2015.
- 077-0510-09; MDO4000/B, MSO/DPO4000B and MDO3000 Series Oscilloscopes Programmer Manual. Tektronix: Beaverton, OR, USA, 2017.
- National Instrument—Virtual Instrument Software Architecture (NI-VISA). Available online: https://www.ni.com/es-mx/support/downloads/drivers/download.ni-visa.html#409839 (accessed on 10 June 2023).


Disclaimer/Publisher’s Note: The statements, opinions and data contained in all publications are solely those of the individual author(s) and contributor(s) and not of MDPI and/or the editor(s). MDPI and/or the editor(s) disclaim responsibility for any injury to people or property resulting from any ideas, methods, instructions or products referred to in the content. |
© 2023 by the authors. Licensee MDPI, Basel, Switzerland. This article is an open access article distributed under the terms and conditions of the Creative Commons Attribution (CC BY) license (https://creativecommons.org/licenses/by/4.0/).