Abstract
During the process of laying submarine pipelines using the R-lay (short for reel-lay) method, the interaction between the pipeline and the laying equipment undergoes continual fluctuations, leading to bending in the pipeline induced by the stochastic dynamics of various external loads. Considering the challenge in forecasting the dynamic behavior of pipeline bending moments and ovality throughout this procedure, we constructed a finite element-based shell element model for a 6-inch pipeline. In this paper, a multi-step simulation approach was used to replicate the pipeline laying process, and the dynamic response in pipeline bending moments and ovality during the winding, unwinding, and straightening processes was analyzed. Additionally, the effects of the pipeline’s diameter–thickness ratio and material properties on the dynamic response process were also studied. The results show that the dynamic response in bending moments and ovality is closely related to the curvature of the pipeline; a brief peak will appear at the critical point where the pipeline deforms, and the peak is related to the different bending stages of the pipeline, with the winding stage having a greater impact on the peak than the unwinding stage. During the unwinding process, a reverse bending moment will occur. The dynamic response of pipeline bending moments and ovality is influenced to some extent by the pipeline’s diameter–thickness ratio and material properties, with the diameter–thickness ratio demonstrating a more conspicuous impact.
1. Introduction
In the realm of offshore oil and gas resource extraction, the deployment of subsea pipelines for oil and gas conveyance stands as an indispensable component. The R-lay method (short for reel-lay) serves as a method for laying subsea pipelines and enables efficient installation of pipelines with diameters below 20 inches. Owing to its cost effectiveness, high laying efficiency, minimal installation risks, exceptional safety record, and ease of control during deployment, it has emerged as a cornerstone technology for deep-sea oil and gas pipeline installation [1,2,3]. Nevertheless, pipelines laid using the R-lay method undergo repeated bending and experience repeated elastic–plastic deformations, which can affect their performance. To ensure the safety of pipeline design, it is necessary to study the dynamic response of bending moments and ovality during the pipeline laying process.
As the pipe undergoes deformation, transitioning gradually from an elastic state to a plastic state, it experiences permanent changes in its cross-sectional shape, gradually shifting from a circular to an elliptical configuration—an occurrence referred to as “ovalization”. Ovalization reduces the bending stiffness of the pipe and leads to instability of limit loads, and deformation in the circumferential direction leads to circumferential compression and tension. The non-uniform strain distribution within the pipe segment along the circumferential axis governs the extent of ovality [4]. Although some degree of recovery occurs when the pipe is unwound from the reel, a degree of permanent ellipticity persists, exerting a noteworthy impact on the pipe’s performance.
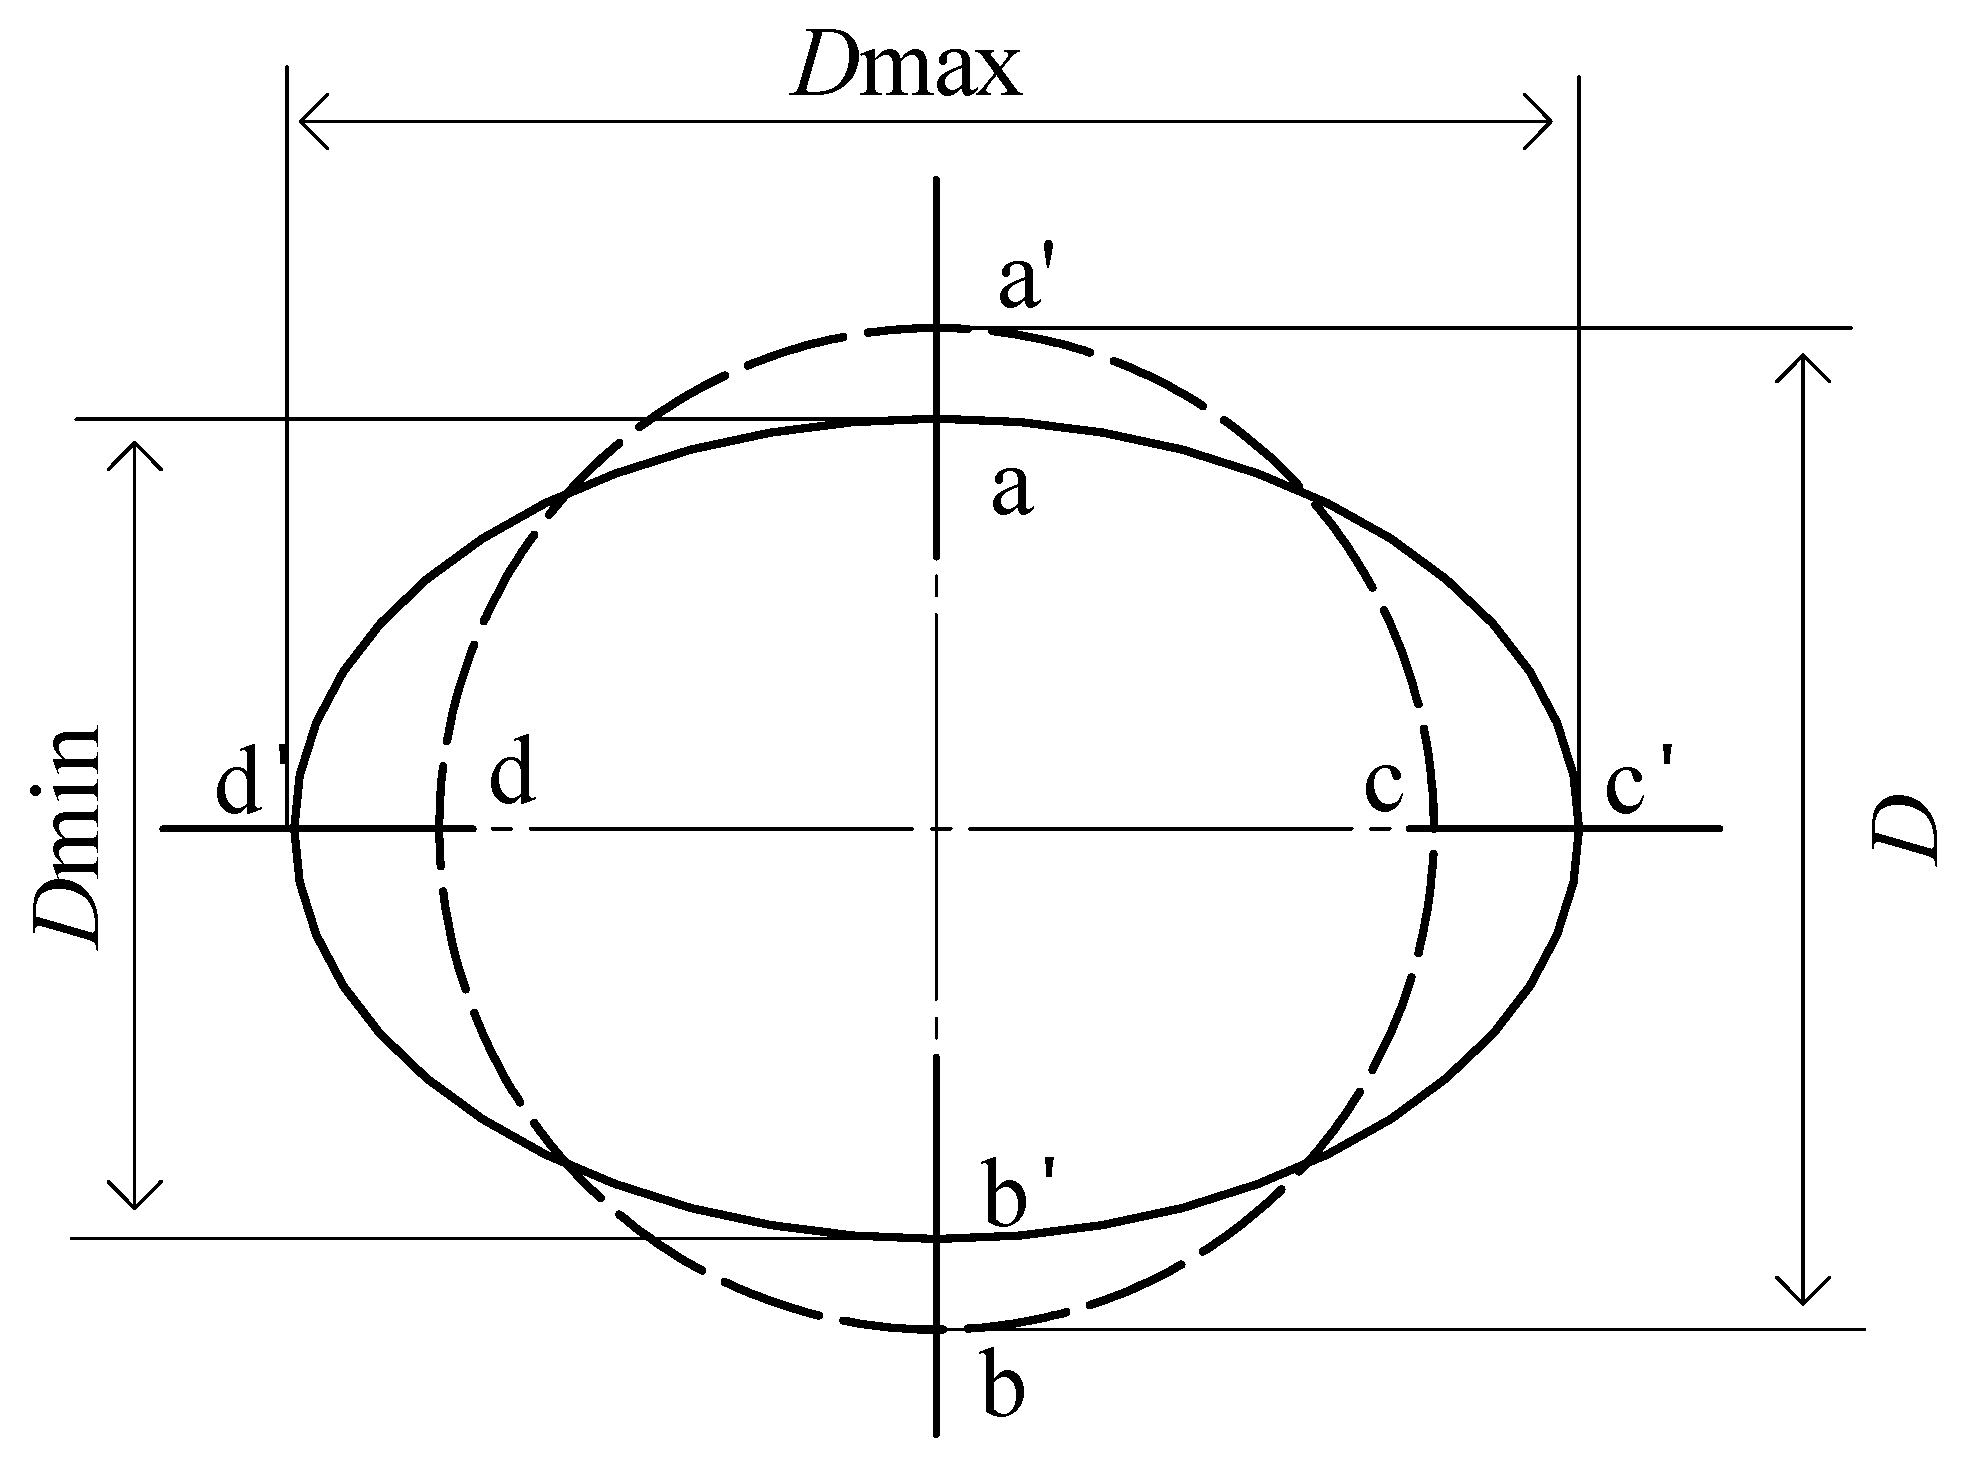
where D is the original pipe diameter, Dmax is the maximum diameter of the deformed pipe, and Dmin is the minimum diameter of the deformed pipe, as shown in Figure 1.
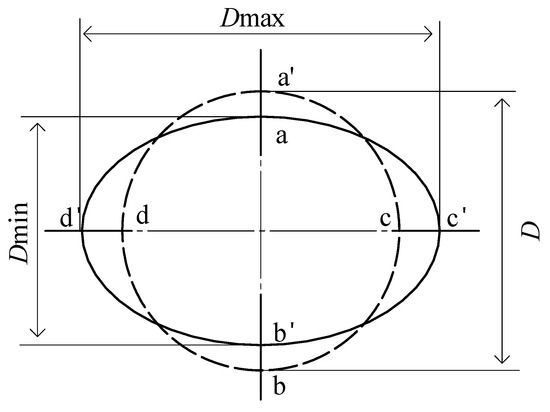
Figure 1.
Definition of ovalization.
Researchers have devoted extensive efforts to the investigation of cross-sectional deformations in pipelines for many years. Brazier [5] was the first to observe the flattening phenomenon during pipeline bending and derived a straightforward theoretical equation linking the bending moment to ovality in thin-walled pipelines. Ades [6] simplified the flattened shape of the cross-section into an ovality and obtained a formula for calculating the ultimate bending moment of elastic–plastic pipelines. The work of Reissner and Weinitschke [7] provided a comprehensive theoretical foundation for understanding pipeline ovality. Kyriakides and Shaw [8] delved into the non-elastic behavior of circular pipes under cyclic bending, establishing that cyclic bending inevitably leads to increased ovality in the cross-section. Poonaya and Thinvongpituk et al. [9,10] introduced a theoretical model elucidating the failure mechanism of thin-walled circular pipes under pure bending, partitioning the bending process into three stages: the elastic stage, ovalization stage, and structural collapse stage. They validated their theories through experimental tests employing pipes with varying diameter-to-thickness ratios, demonstrating good agreement between theoretical predictions and experimental outcomes. Li et al. [11] conducted experiments showcasing that under combined loading of internal pressure and cyclic bending, continuous thinning of the pipe’s diameter and wall thickness occurs, even when nominal stresses induced by internal pressure remain within the elastic limits along the circumferential and radial directions. Azadeh and Taheri [12] refined the empirical formula proposed by Kyriakides [8], enabling the prediction of the number of cycles leading to local instability in the pipe cross-section. Lian et al. [13] asserted the inevitability of the flattening phenomenon in the process of straightening metal pipes and scrutinized this phenomenon through the lens of elastic–plastic deformation theory.
The R-lay method, recognized as a pivotal technology for submarine pipeline installation, has garnered substantial attention from researchers. Tawns [14] pointed out that reel-lay installation provided an effective approach for installing small to medium-sized pipelines in shallow and deep waters, enabling rapid installation within a limited timeframe, even under harsh weather conditions. Martinez and Brown [15] emphasized the precision achieved by theoretical models in finite element analysis, particularly in capturing nonlinear behavior and complex analytical processes, enabling a more accurate understanding and simulation of industrial processes, including reel-lay technology. Gong et al. [16] conducted numerical simulations employing a three-dimensional finite element model within the ABAQUS framework in 2011. Their investigation delved into the influence of key factors such as load paths, material properties, and the diameter-to-thickness ratio on pipeline buckling behavior, drawing significant conclusions through parameter studies. This work provided a robust theoretical foundation for the design of deepwater pipelines. Manouchehri [17] systematically elucidated the mechanical mechanisms underpinning the reel-lay and straightening processes. Meissner et al. [18] presented results from collapse tests on pipes subjected to full-scale reel winding simulations, shedding light on the impact of repeated bending on pipe collapse behavior. Guo et al. [19] undertook a series of bending tests to explore the effects of the diameter-to-thickness ratio on both inelastic and elastic bending performance, revealing an increasing prominence of local buckling phenomena with rising diameter-to-thickness ratios. Shitamoto and Hisamune [20] discovered through experiments, ranging from small-scale to full-scale, that mechanical properties of pipes exhibited consistent behavior after strain aging. Dawood and Kenny [21] developed a three-dimensional continuum model to simulate reel-lay installation’s bending and straightening processes, validating their model through physical experiments conducted on a bending test rig and a four-point bending test frame, providing comprehensive insights into the mechanical performance of pipes during reel-lay installation. Chatzopoulou et al. [22] leveraged advanced material models and finite element tools in 2015 to investigate the influence of cyclic loading induced by bending on the mechanical properties of thick-walled seamless steel pipes. Their results revealed significant anisotropy and ovalization in pipes due to cyclic bending during the winding process. Consequently, the mechanical resistance of wound pipes was lower than that of unwound pipes, attributable to cross-sectional ovalization occurring at the end of the winding process. Sriskandarajah and Rao [4] conducted full-scale experiments, encompassing material tests, bending tests, simulation winding, and straightening processes, subsequently comparing the findings with finite element model results, thereby offering valuable recommendations for precise model development. Liao and Wang [23] employed the finite element method to simulate five bending stages, exploring the influence of material and geometric parameters on residual stresses in pipelines. Additionally, they investigated the effects of residual stresses on the external pressure capacity and tensile capacity of pipes. Liu et al. [24] introduced two modeling approaches aimed at simulating the winding and unwinding processes of pipes. They employed nonlinear strain-hardening materials and subjected the pipes to three cycles to assess their influence on the structural performance of the pipelines. Ju et al. [25] developed a finite element simulation model and engineered a specialized 6-inch reel-lay experimental apparatus designed explicitly for the winding process within the R-lay method. Their investigations unveiled the distinct impacts of various parameters on the pipe winding process, including the diameter-to-thickness ratio.
Many prior investigations into R-lay-method pipelines have employed simplified models of the pipe straightening process, which do not align with real-world operational conditions, or have omitted finite element simulations. In this study, we introduce a comprehensive multi-step simulation approach designed to replicate the entirety of the R-lay method installation process. We delve into the dynamic response of the pipe, focusing on its bending moment and cross-sectional ovality, utilizing the Ramberg–Osgood model. Additionally, we analyze how variations in the pipe’s diameter-to-thickness ratio and material yield strength impact this response.
2. Modeling and Analysis
Aiming at the dynamic response problem of pipeline bending moment and ovality during the laying process of the R-lay method, this paper conducts a theoretical analysis of the R-lay method’s laying system. Additionally, it introduces a finite element modeling framework designed to precisely depict the dynamic response issues associated with bending moment and ovality.
2.1. System Description
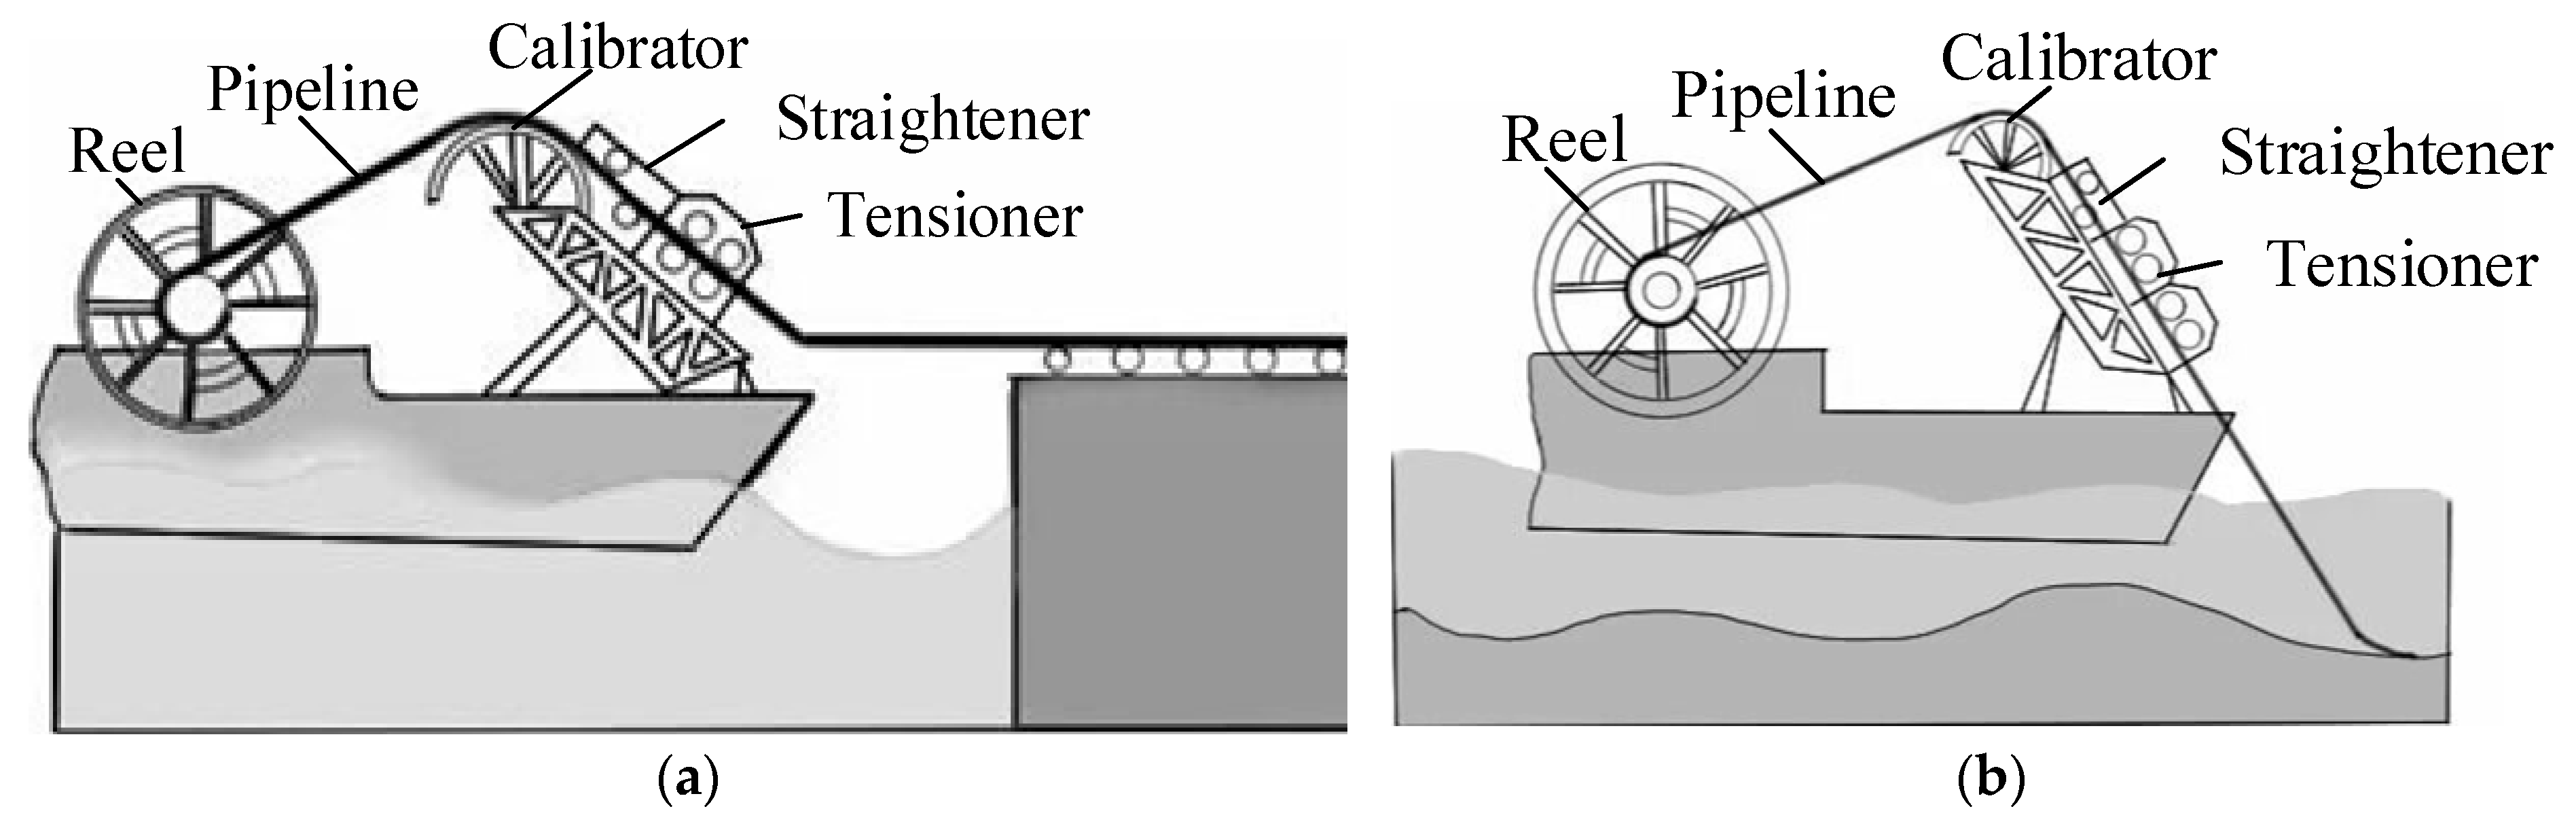
The R-lay installation system typically comprises a carousel and a pipelay system. The pipelay system encompasses various components, including a tensioner, straightener, and calibrator, among others. The geometric characteristics and positional arrangements of these components exert substantial influence on the stress experienced by the pipeline during installation.
As shown in Figure 2, the R-lay method can be divided into the winding stage and the unwinding straightening stage. The reel serves as the storage for the pipeline, which, after welding at the port, is wound onto the reel. Throughout this phase, the pipeline undergoes its initial plastic deformation and exhibits its first instance of ovality. This ovality continues to grow as the pipeline is entirely wound onto the reel but eventually stabilizes once the winding process is complete.

Figure 2.
Schematic diagram of R-lay system: (a) winding stage; (b) unwinding stage.
Once the pipelaying vessel is positioned, the pipelaying process commences. The pipeline reverses and unwinds from the reel, incurring its second plastic deformation. Throughout this phase, the pipeline’s ovality decreases, and its curvature approaches zero. Nonetheless, the pipeline cannot fully regain its original shape, resulting in residual ovality and residual curvature. Consequently, pipe straightening becomes imperative in the subsequent stage following unwinding to ensure that the curvature of the pipeline, once laid on the seabed, remains within a specified range. In the course of the pipelaying process, the pipeline traverses a calibrator before entering the straightener and tensioner. The tensioner provides the requisite tensile force for the pipeline’s movement, while the calibrator, in conjunction with the straightener, applies reverse bending stress. Through three-point straightening, residual bending curvature is eliminated, achieving pipe straightening. When the pipeline passes through the calibrator, it undergoes its third plastic deformation, and the process of entering and exiting the calibrator mirrors the aforementioned winding and unwinding phases. During the straightening process, the pipeline undergoes its fourth plastic deformation. Ultimately, the pipeline is submerged in water, concluding the lowering process.
2.2. Analysis of the Laying Process
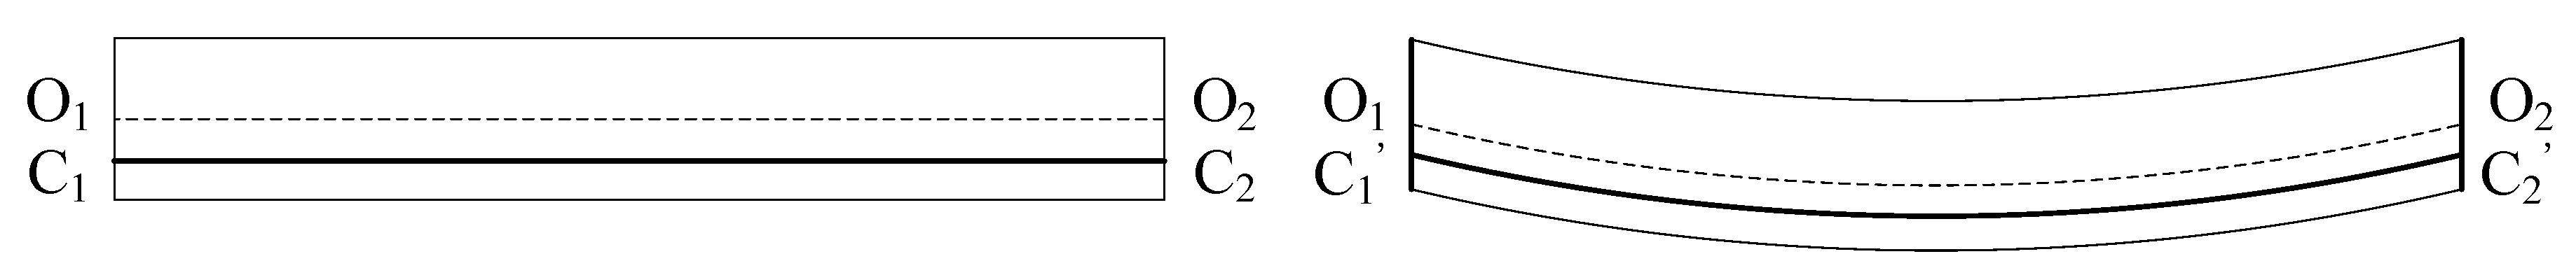
Given the challenges in acquiring precise data regarding the intricate external loads and deformations of the pipeline post-winding, subsequent calculations pose significant difficulties. As a result, this paper exclusively centers on a theoretical analysis of the pipe winding process. It conducts a theoretical analysis of pure bending on the pipe, incorporating assumptions of uniaxial stress and plane cross-section [26]. Within the framework of these assumptions, as shown in Figure 3, the length C1’C2’ of fiber C1C2, situated at a distance z from the neutral axis O1O2, following bending, can be calculated using Equation (2).
where R represents the radius of curvature following the bending of the neutral shaft, and κ denotes the curvature of the neutral shaft post-bending. The strain at the fiber C1’C2’ can be determined using Equation (3).
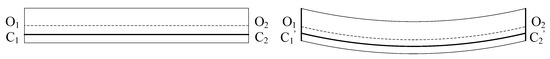
Figure 3.
Bending of pipeline.
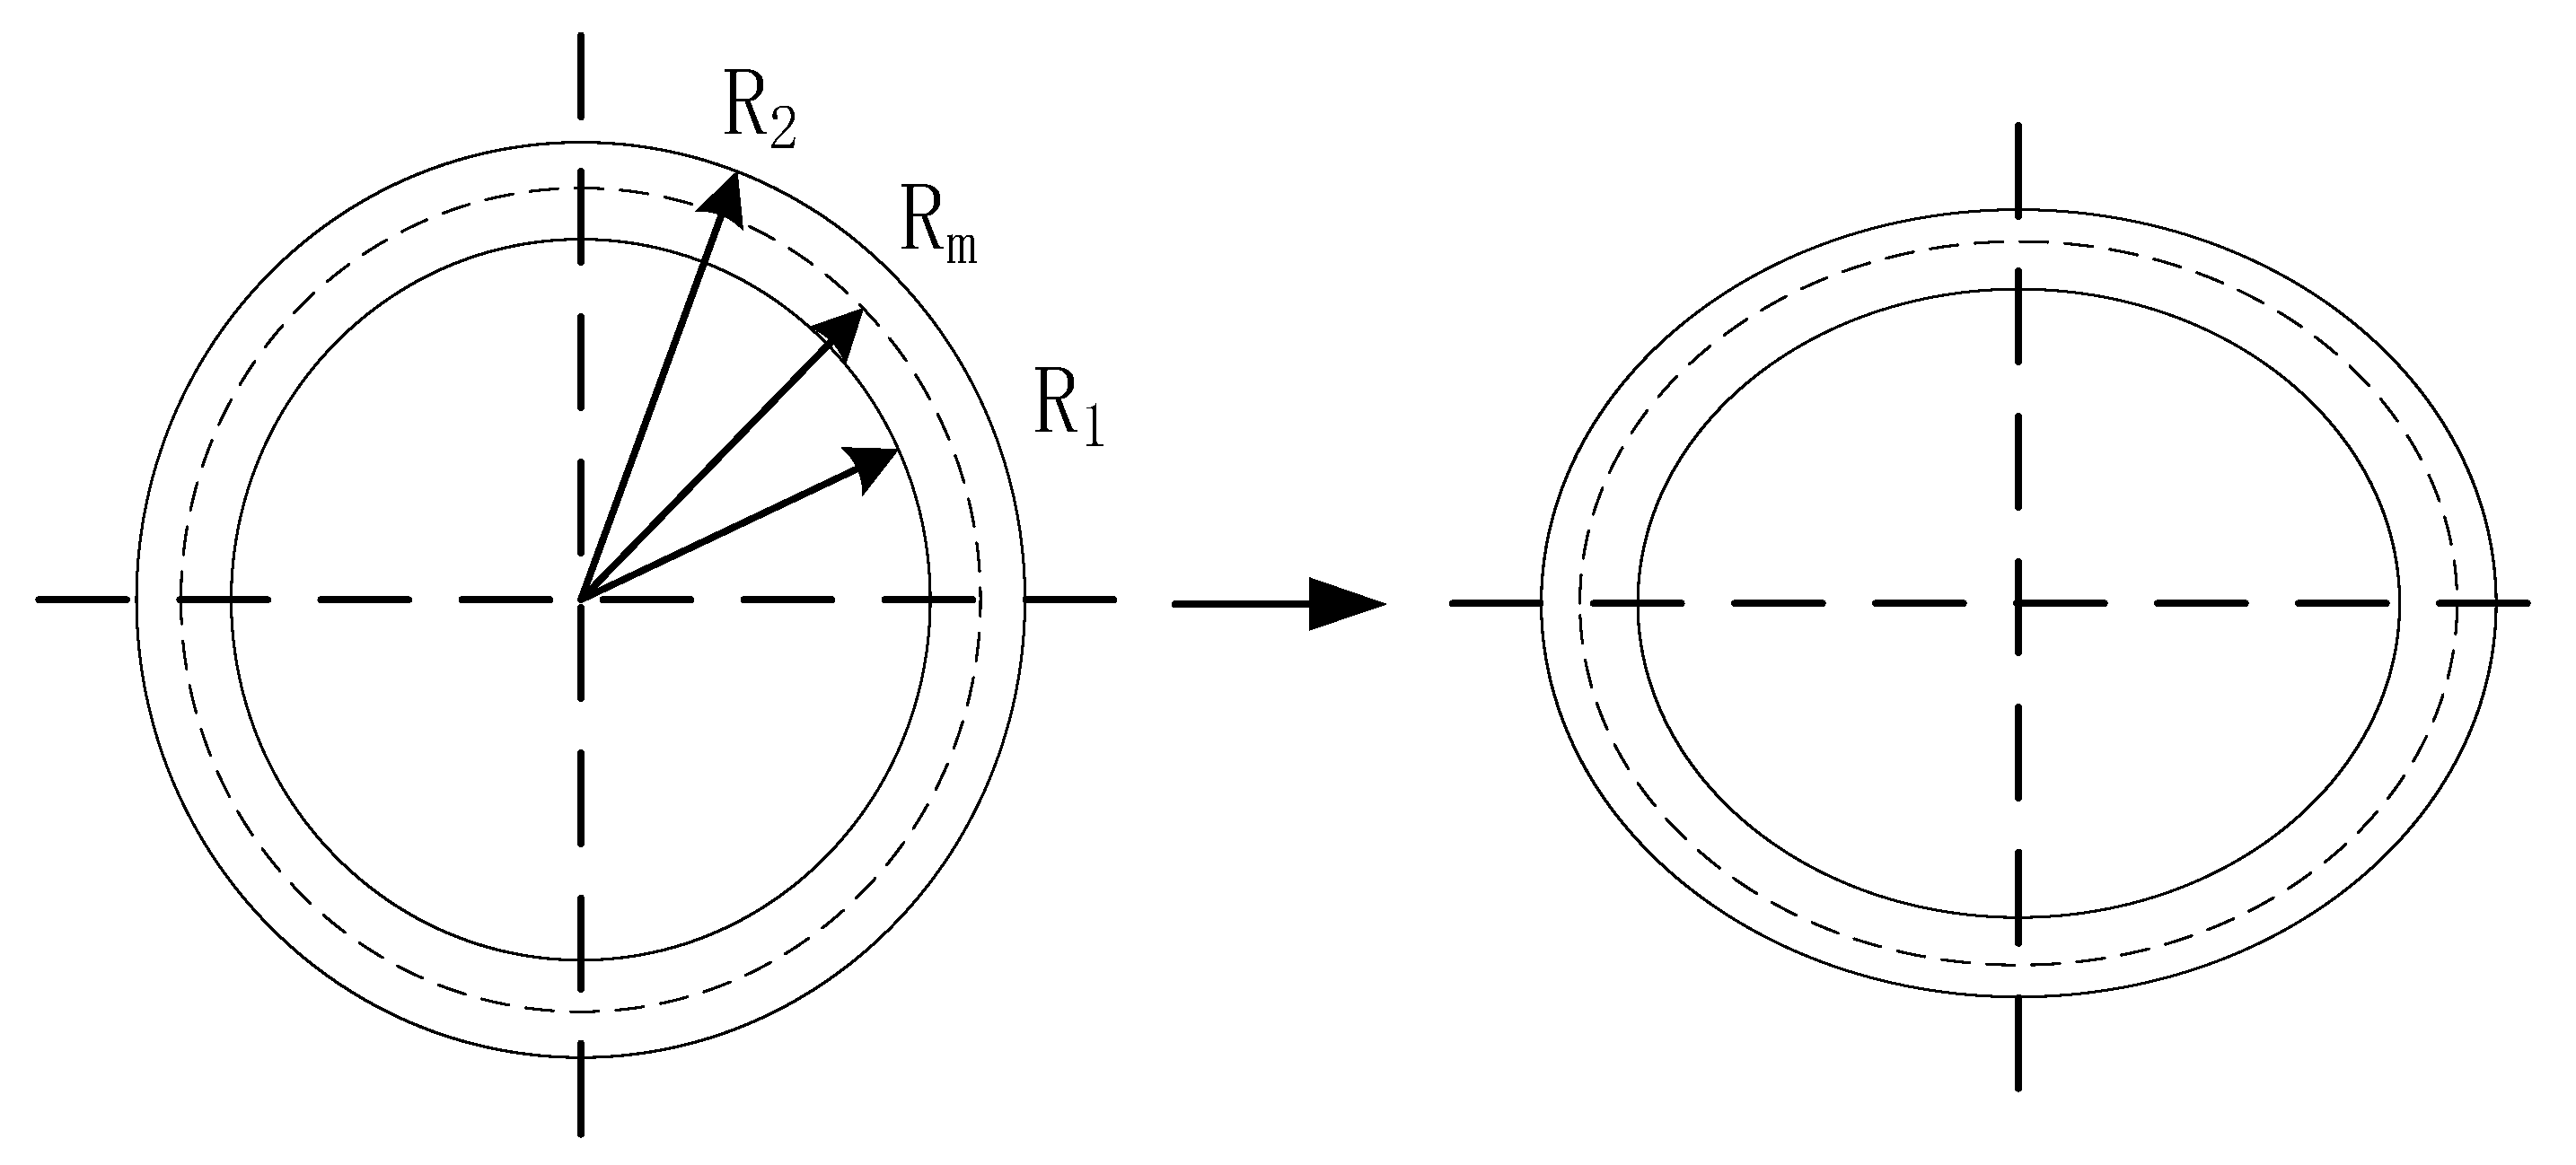
The pipe’s cross-sectional inner diameter is denoted as R1, while its outer diameter is represented as R2. The material is treated as a linear reinforced elastoplastic material, with its stress–strain relationship described by Equation (4):
where εS represents the strain value at the initial yield of the material. The maximum elastic curvature is κe = εs/R2 = 0.0256. E represents the elastic modulus of the material, the strengthening modulus of elasticity is EP = 6 GPa, and λ denotes the strengthening coefficient λ = E/EP.
When the outermost fiber of the pipe reaches yield, the stress at a distance z from the neutral axis is given by σz = σs × z/R2, the maximum elastic bending moment of the annular section is Me, and σs represents the yield strength of the pipe material.
where α = R1/R2 represents the ratio of the inner and outer radii of the pipeline, and σs denotes the yield strength of the pipe material.
When the section reaches the plastic limit state, σz = σs in the entire section, the bending moment borne by the section reaches its maximum value, identified as the plastic limit bending moment of the annular section, denoted as MP.
When the bending moment M (Me ≤ M ≤ Mp) is applied to the cross-section, the fiber located at the neutral axis, where c = εS/κ, reaches its initial yield point, and μ = Ep/E represents the ratio of the modulus of the material in the two stages.
Equation (7) can be obtained from (3) and (4).
When c ≤ R1,
When R1 ≤ c ≤ R2,
When R2 ≤ c, .
When conducting an analysis of the pipe cross-section, it is assumed that the cross-section of the pipe always remains flat (without warpage). During the winding process, the pipe cross-section changes as shown in Figure 4.
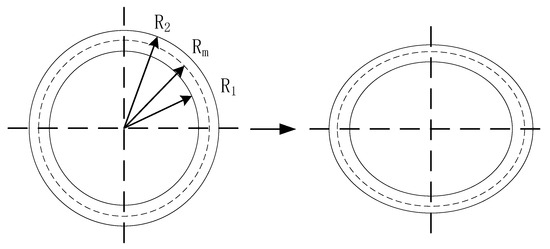
Figure 4.
Pipe cross-section.
The section ovality ∆D/D calculation formula is shown in (10):
where Rm represents the middle diameter of the original straight pipe, t denotes the thickness of the pipe, ρc represents the radius after bending of the pipe, and ρc = 1/κ. The relationship between ovality ∆D/D and curvature κ in the winding stage can be obtained using Equation (11):
2.3. Finite Element Model
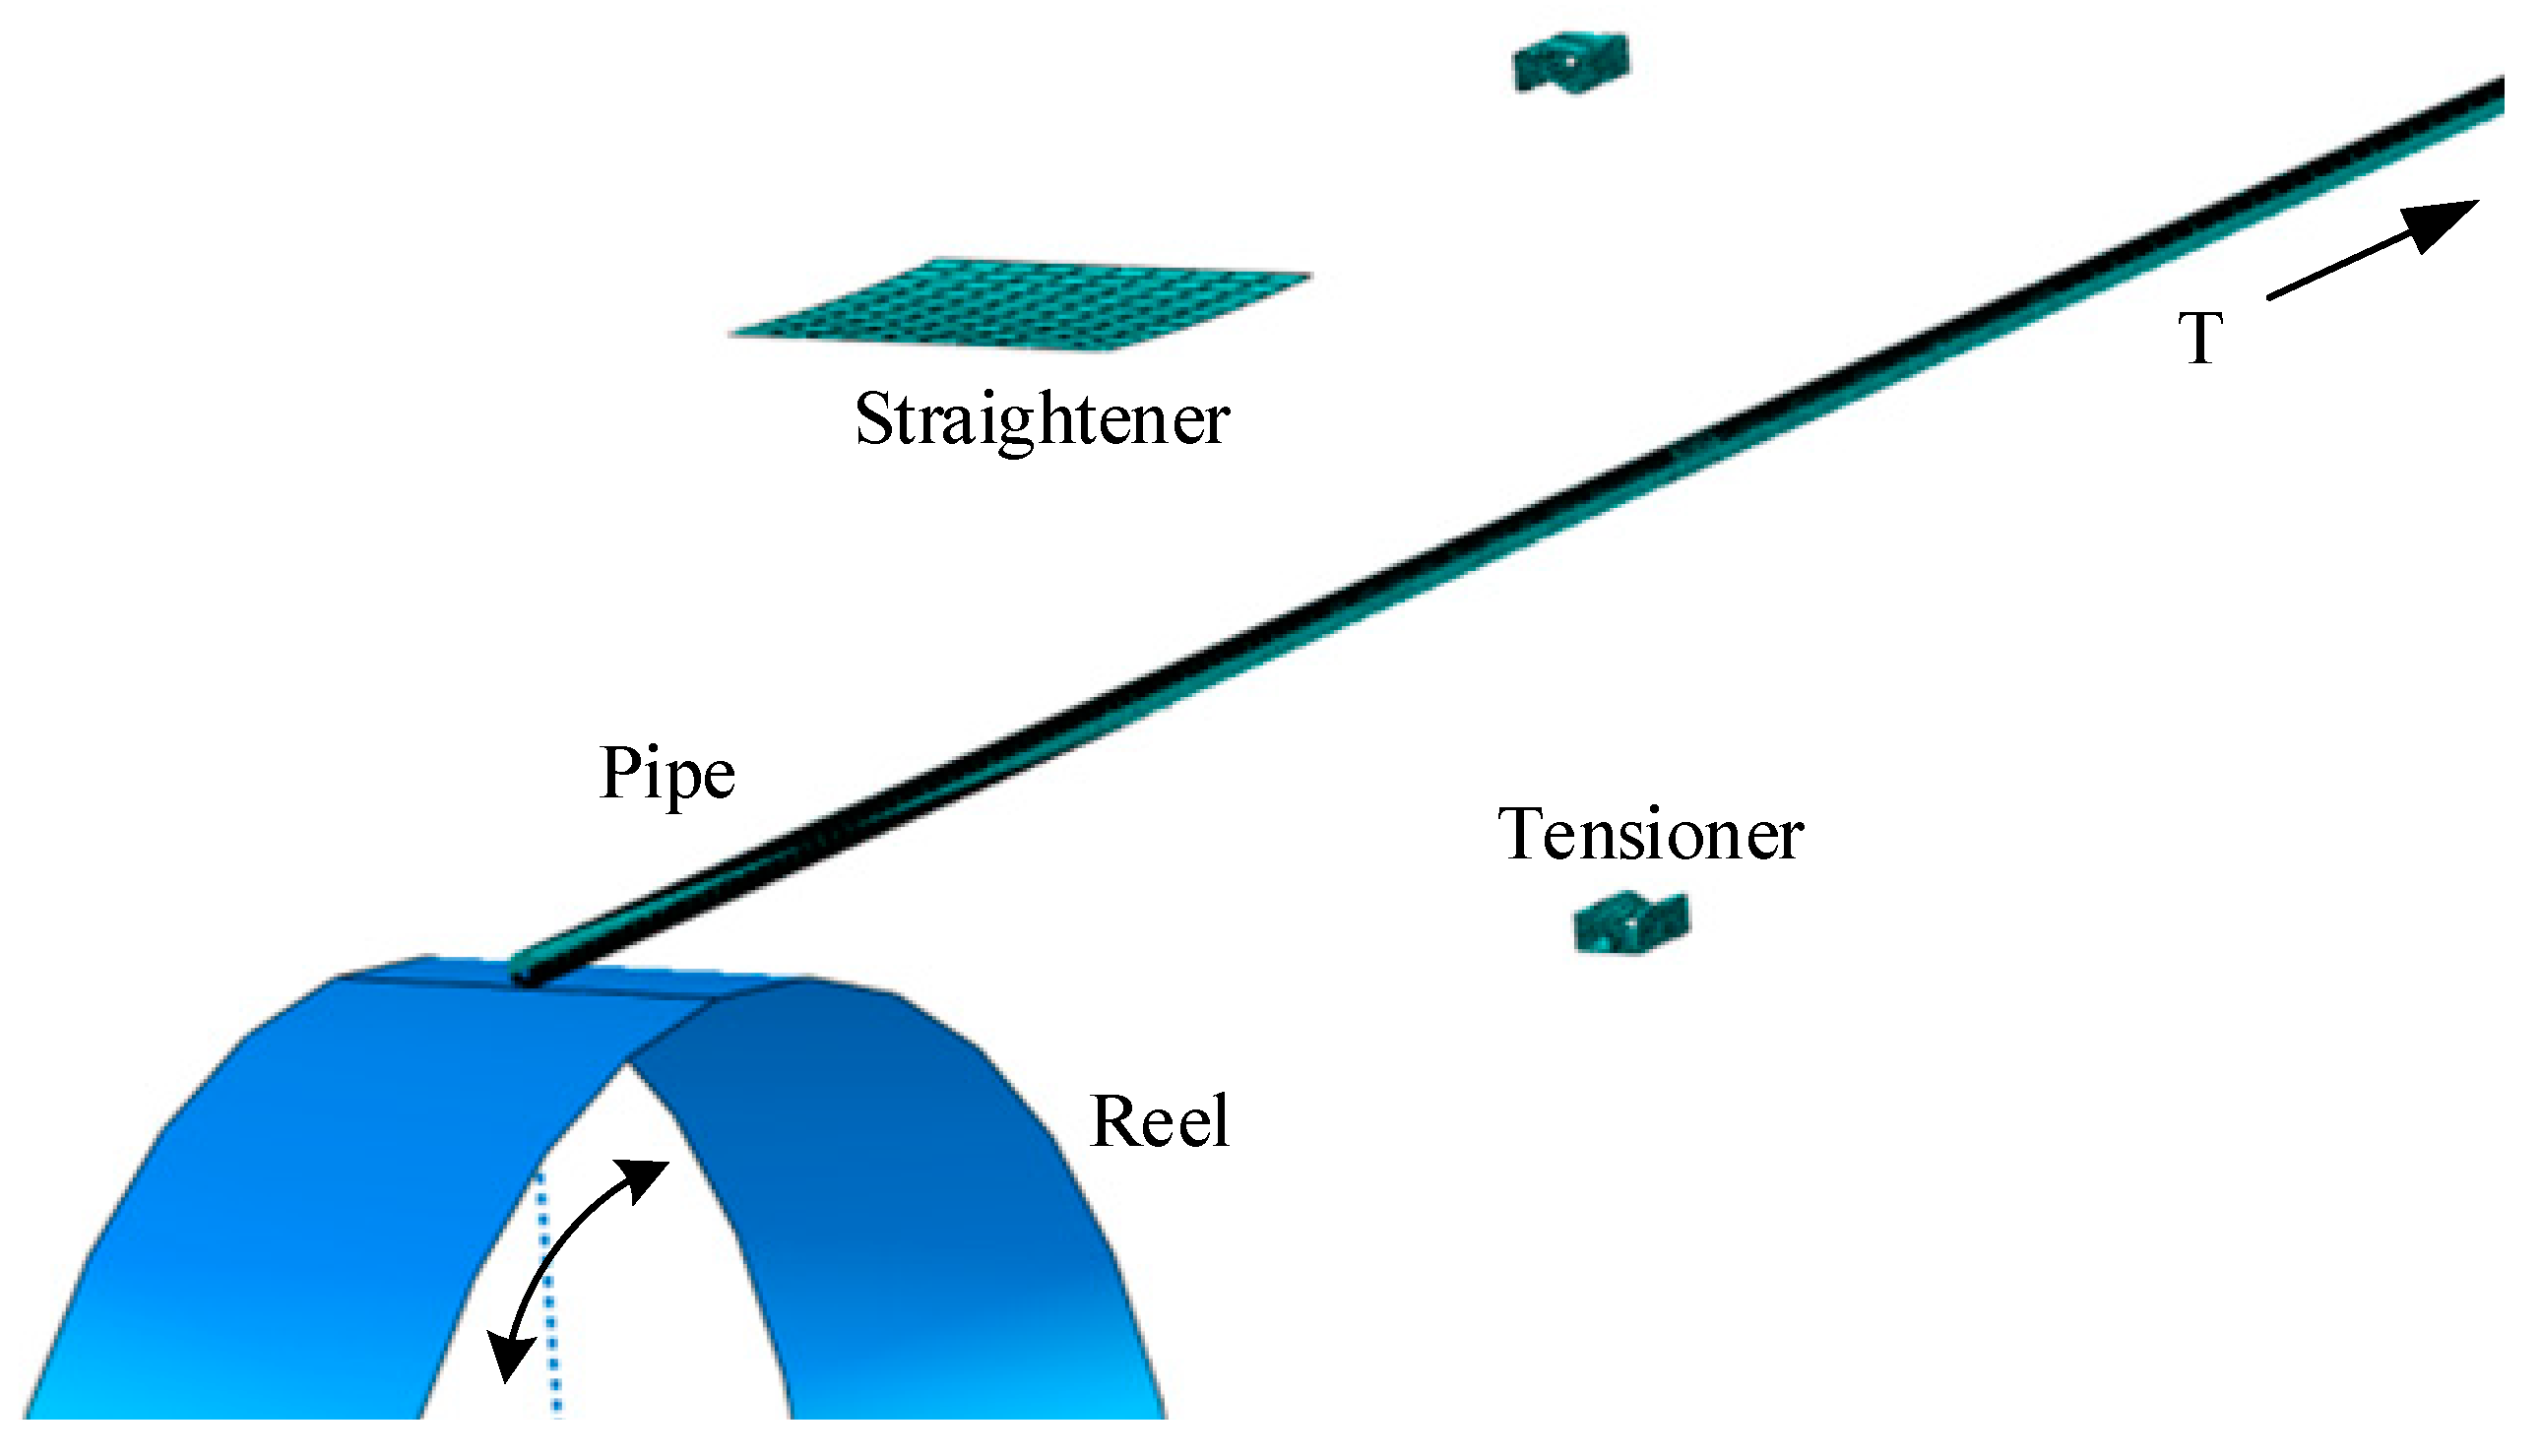
The finite element model comprises the pipeline, reel, calibrator, tensioner, and straightener. To streamline the computational complexity, the calibrator and reel share the same diameter in this investigation. Both the reel and calibrator are represented using an identical model. The analysis encompasses multiple steps aimed at replicating the winding, unwinding, and straightening phases inherent to the reel-lay method. The model setup is illustrated in Figure 5. The primary focus of this paper centers on comprehending the pipeline’s deformation throughout the bending and straightening procedures. It is noteworthy that components in contact with the pipeline exhibit significantly greater stiffness compared to the pipeline itself. Consequently, rigid material models are employed to represent these components. The reel is characterized as an analytically rigid surface with a radius of 4 m. The pipeline model consists of shell elements featuring a diameter of D = 0.168 m and various diameter-to-thickness ratios (10/15/20), extending over a length of 480D. One end of the pipeline connects to the reel, and this connection is established through binding constraints at the contact points of the pipe end-face and the reel. Additionally, a line feature connects the center of the end face to the center of the reel, enabling synchronous rotation of the pipeline with the reel.
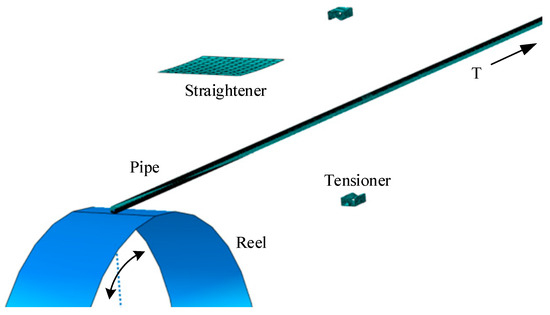
Figure 5.
Finite element model.
In the winding process, the pipeline encounters resistance as it moves upward, attributed to its own weight and friction between the pipeline and the ground. Conversely, in the unwinding process, the pipeline undergoes tension due to the tensioner. These forces in both stages act along the axial direction of the pipeline. To ensure uniform force distribution on the pipeline, a constant tension force (T = 1,000,000 N) [25] is applied at the center of the end face of the pipeline model.
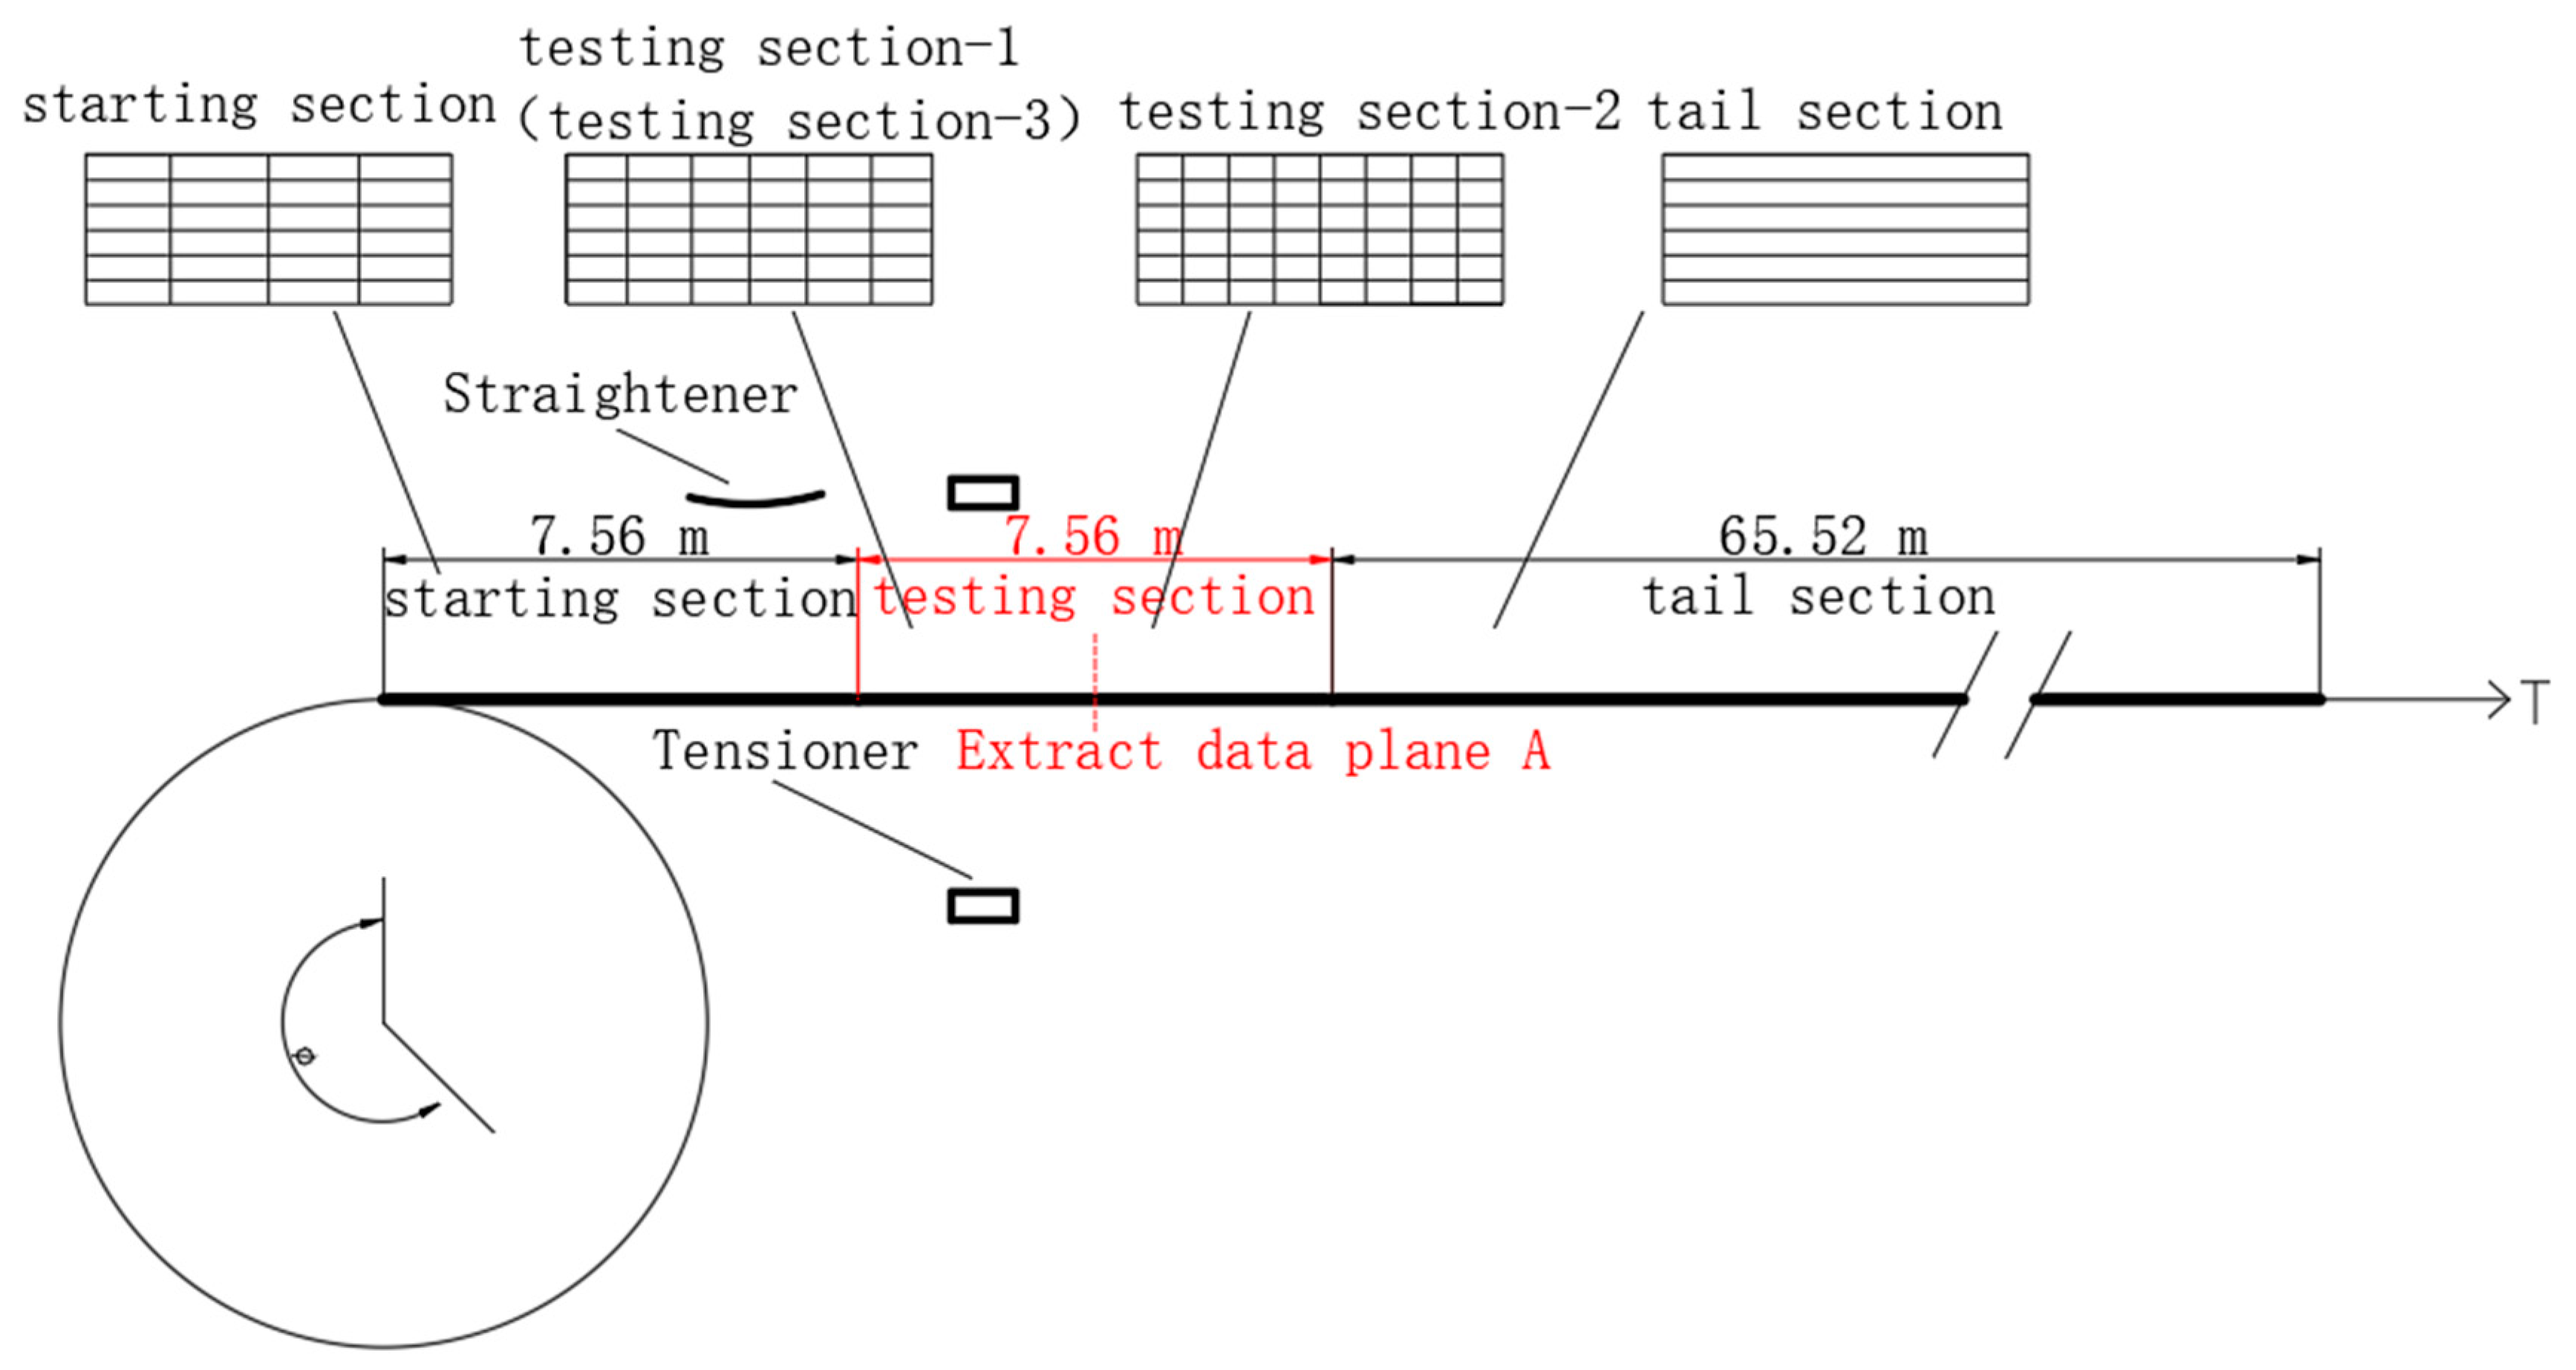
The pipeline is segmented from left to right into three distinct sections: a 7.56 m long starting section, a 7.56 m long testing section (labeled as section A), and a 65.52 m long tail section. The data extraction plane is strategically positioned at the midpoint of section A. A total of 120 circumferential grids are evenly distributed along the pipeline, and the distribution of axial grid sizes is visualized in Figure 6. To ensure the precision of the simulation results, finer grids are employed in proximity to the data extraction section. Specifically, the starting section is divided into 60 axial elements, while the tail section consists of 300 elements. Within the testing section, a further subdivision is implemented, organized into three segments from left to right: testing segment-1 spans 3.58 m with 100 axial elements, testing segment-2 covers 0.4 m with 20 axial elements, and testing segment-3 extends for 3.58 m with 100 axial elements.
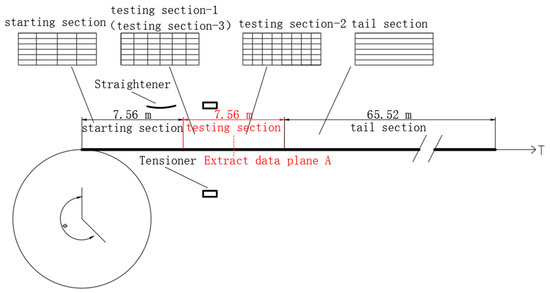
Figure 6.
Diagram of the finite element model.
The straightening device is represented using discrete rigid bodies, featuring a radius of 20 m and a length of 2 m. Simulating the interaction between the pipeline, drum, straightening device, and tensioner employs a master–slave algorithm for surface contact. Given the pipeline’s lower stiffness, it assumes the role of the slave surface. When considering the pipeline’s contact with the drum, relative sliding emerges as a result of pipeline deformation, and the pipeline experiences negligible frictional forces. Consequently, tangential contact is rendered frictionless, permitting limited sliding between the contacting surfaces. Normal contact is defined by an exponential “softening” pressure–overclosure relationship. In this context, “softening” contact implies that the contact relationship is established even when a certain gap exists between the surfaces. Upon actual contact, the contact pressure exhibits rapid escalation, ensuring continuous pressure increase throughout the entire contact duration. As shown in Figure 7, the contact pressure between 0 < C < C0 increases exponentially as the gap decreases.
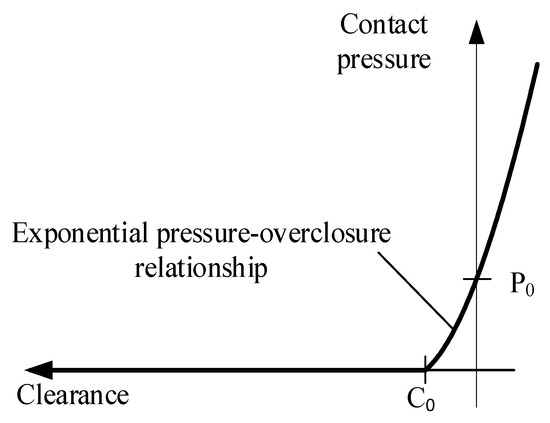
Figure 7.
Exponentially “softening” the contact pressure–overclosure relationship diagram.
When using the exponential “softening” pressure–overclosure relationship, it is necessary to set the initial gap C0 and the actual hard contact pressure P0. The value of C0 is chosen empirically as 0.001 inches, ensuring that the pressure starts to increase within a certain contact distance. The normal contact pressure is set to 500 psi (3.4 MPa) [24].
Deepwater submarine pipeline materials possess exceptional plastic deformation capabilities. To accurately characterize their mechanical properties, scholars predominantly employ the Ramberg–Osgood model.
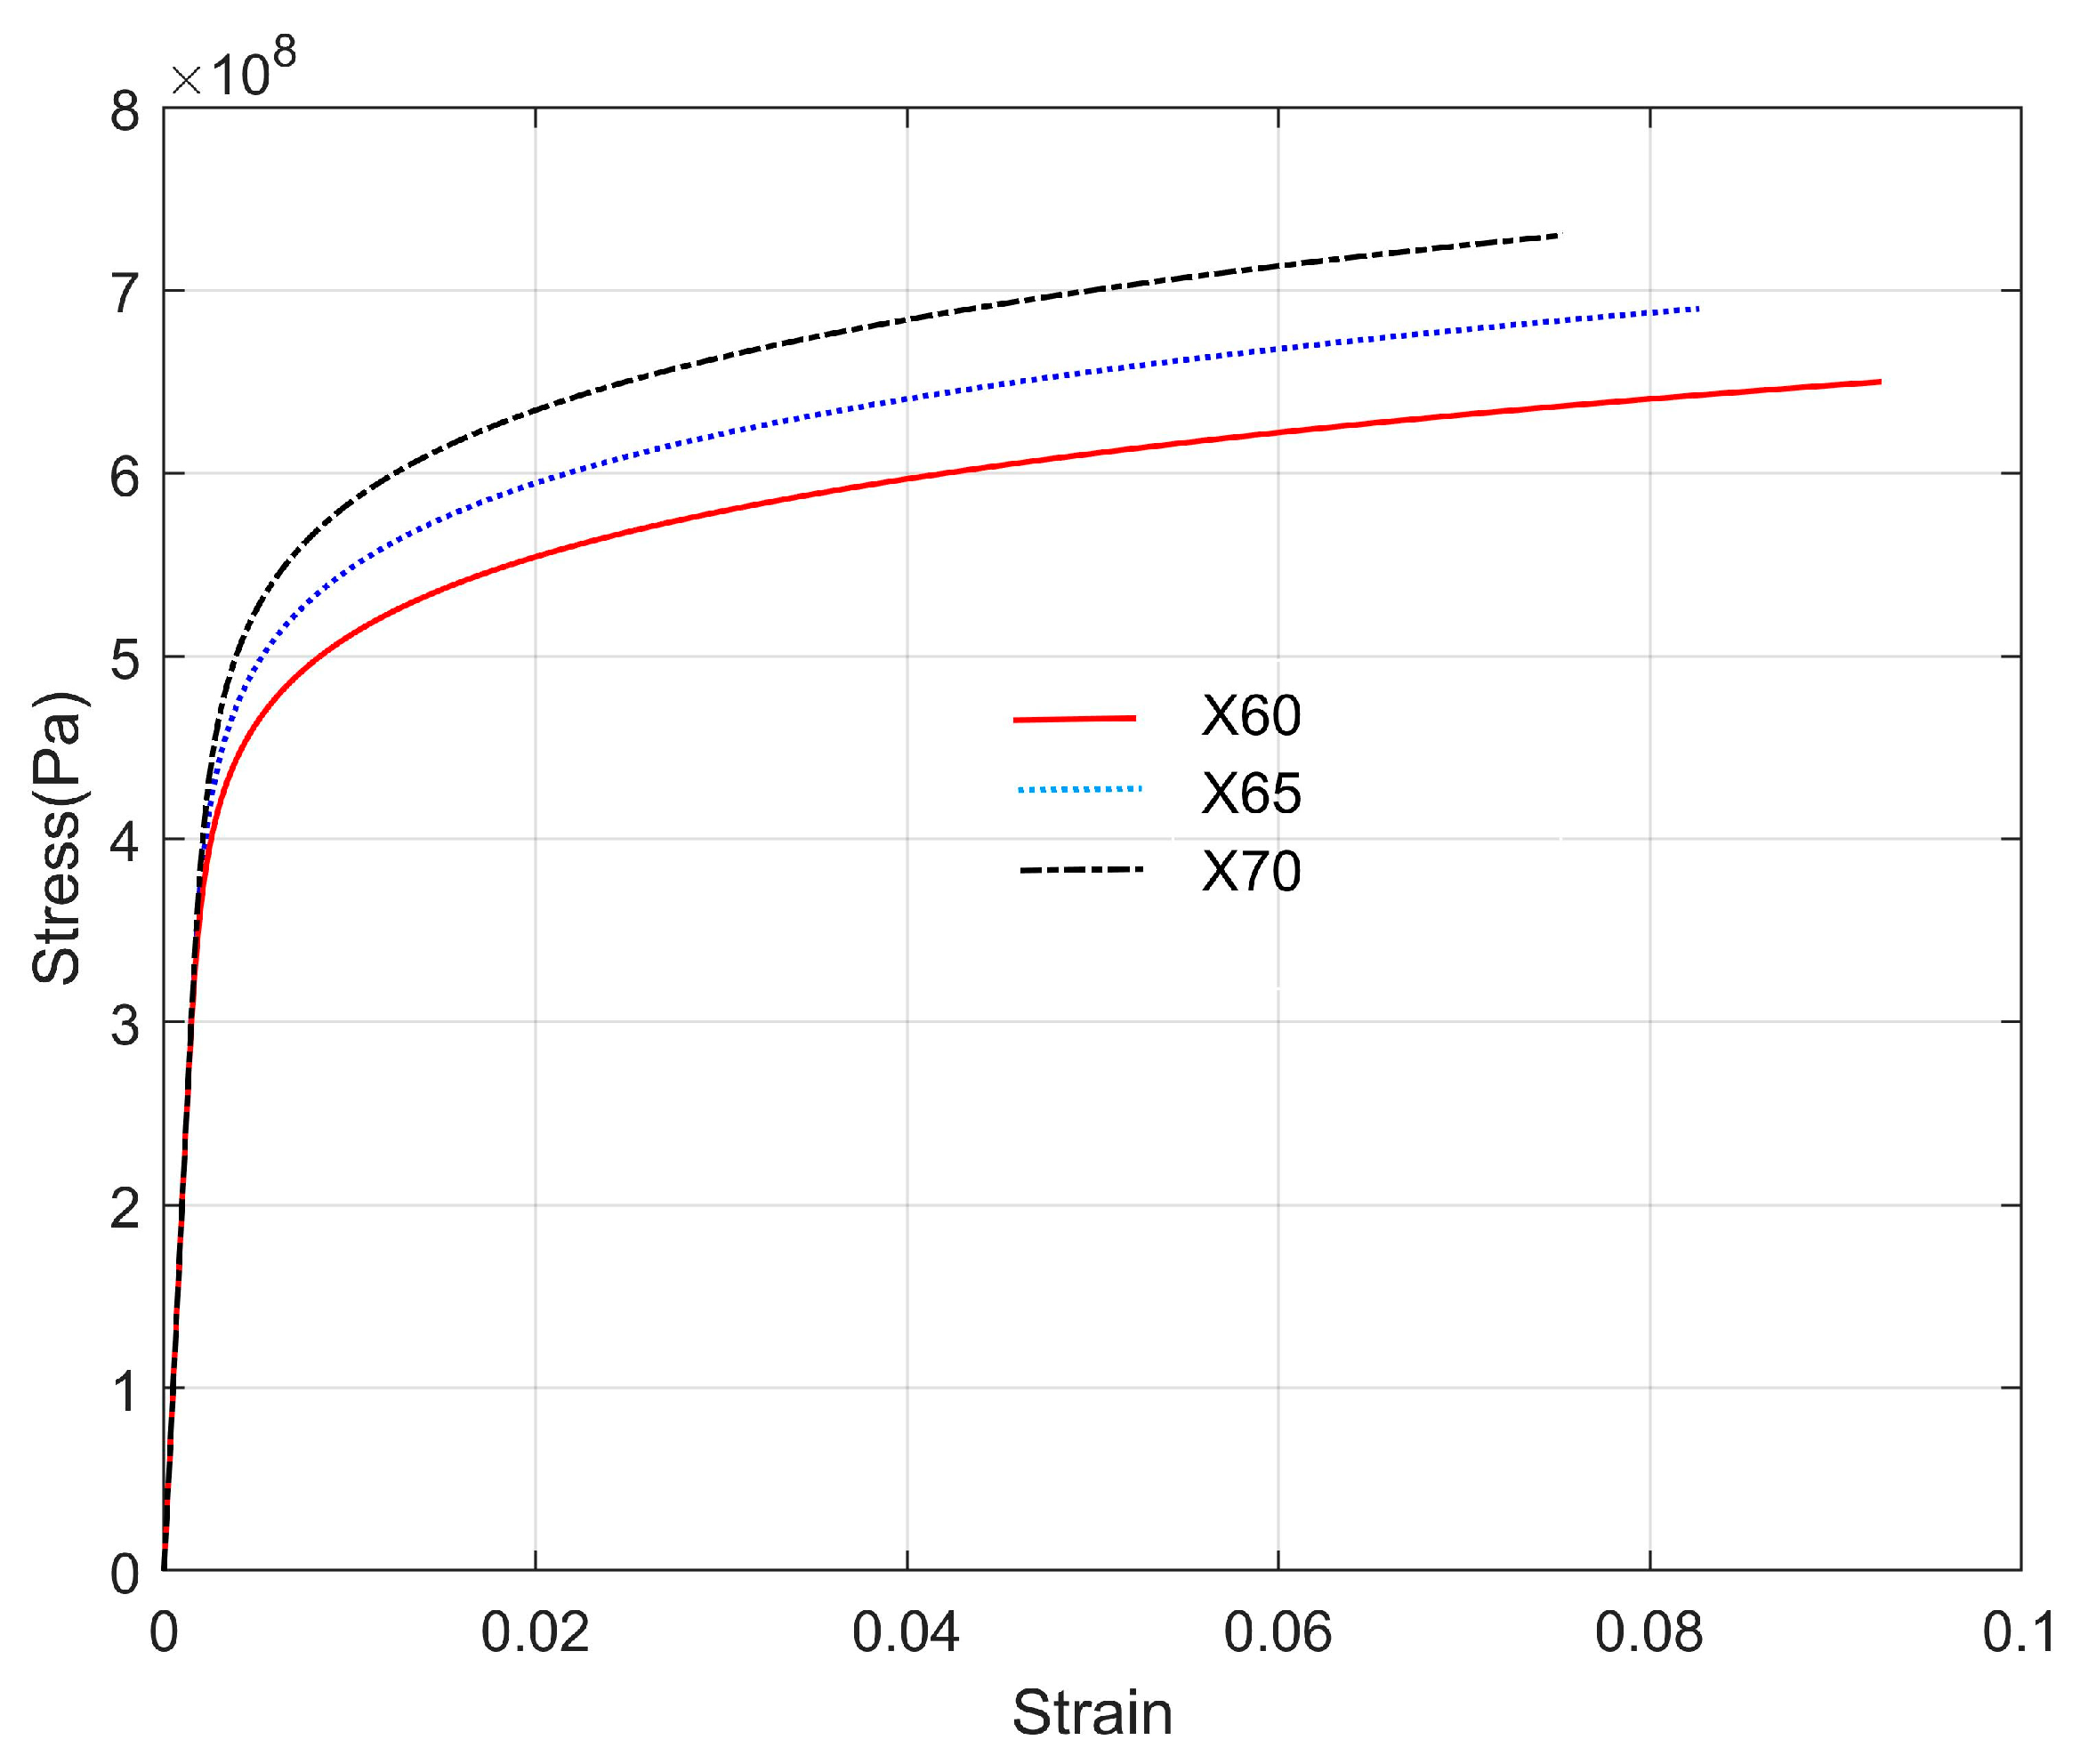
where σ represents stress, E denotes the modulus of elasticity, σy represents the yield stress, and n denotes the hardening index of the material. In this paper, three materials (X60, X65, and X70) were used with consistent hardening indices (n = 10.3) and a shared elastic modulus (E = 207 GPa). The respective yield stresses for these materials are 414 MPa, 448 MPa, and 482 MPa. The relation between stress and strain of the three materials are shown in Figure 8.
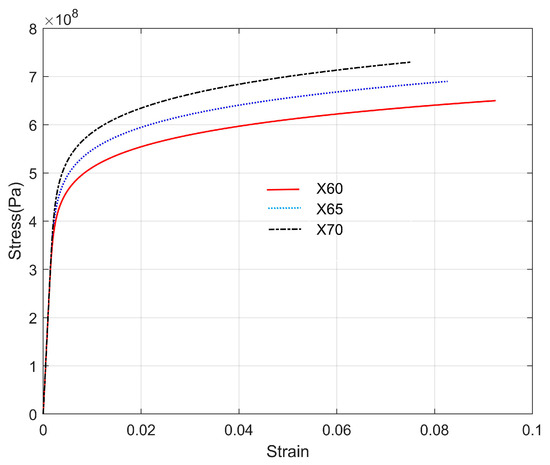
Figure 8.
Relation between stress and strain.
3. Numerical Implementation
A multi-step finite element simulation scheme and a data extraction method were devised to simulate the laying process of R-lay pipelines. The simulation’s accuracy was corroborated through a comparison with theoretical values.
3.1. Simulation of Reeling and Unreeling
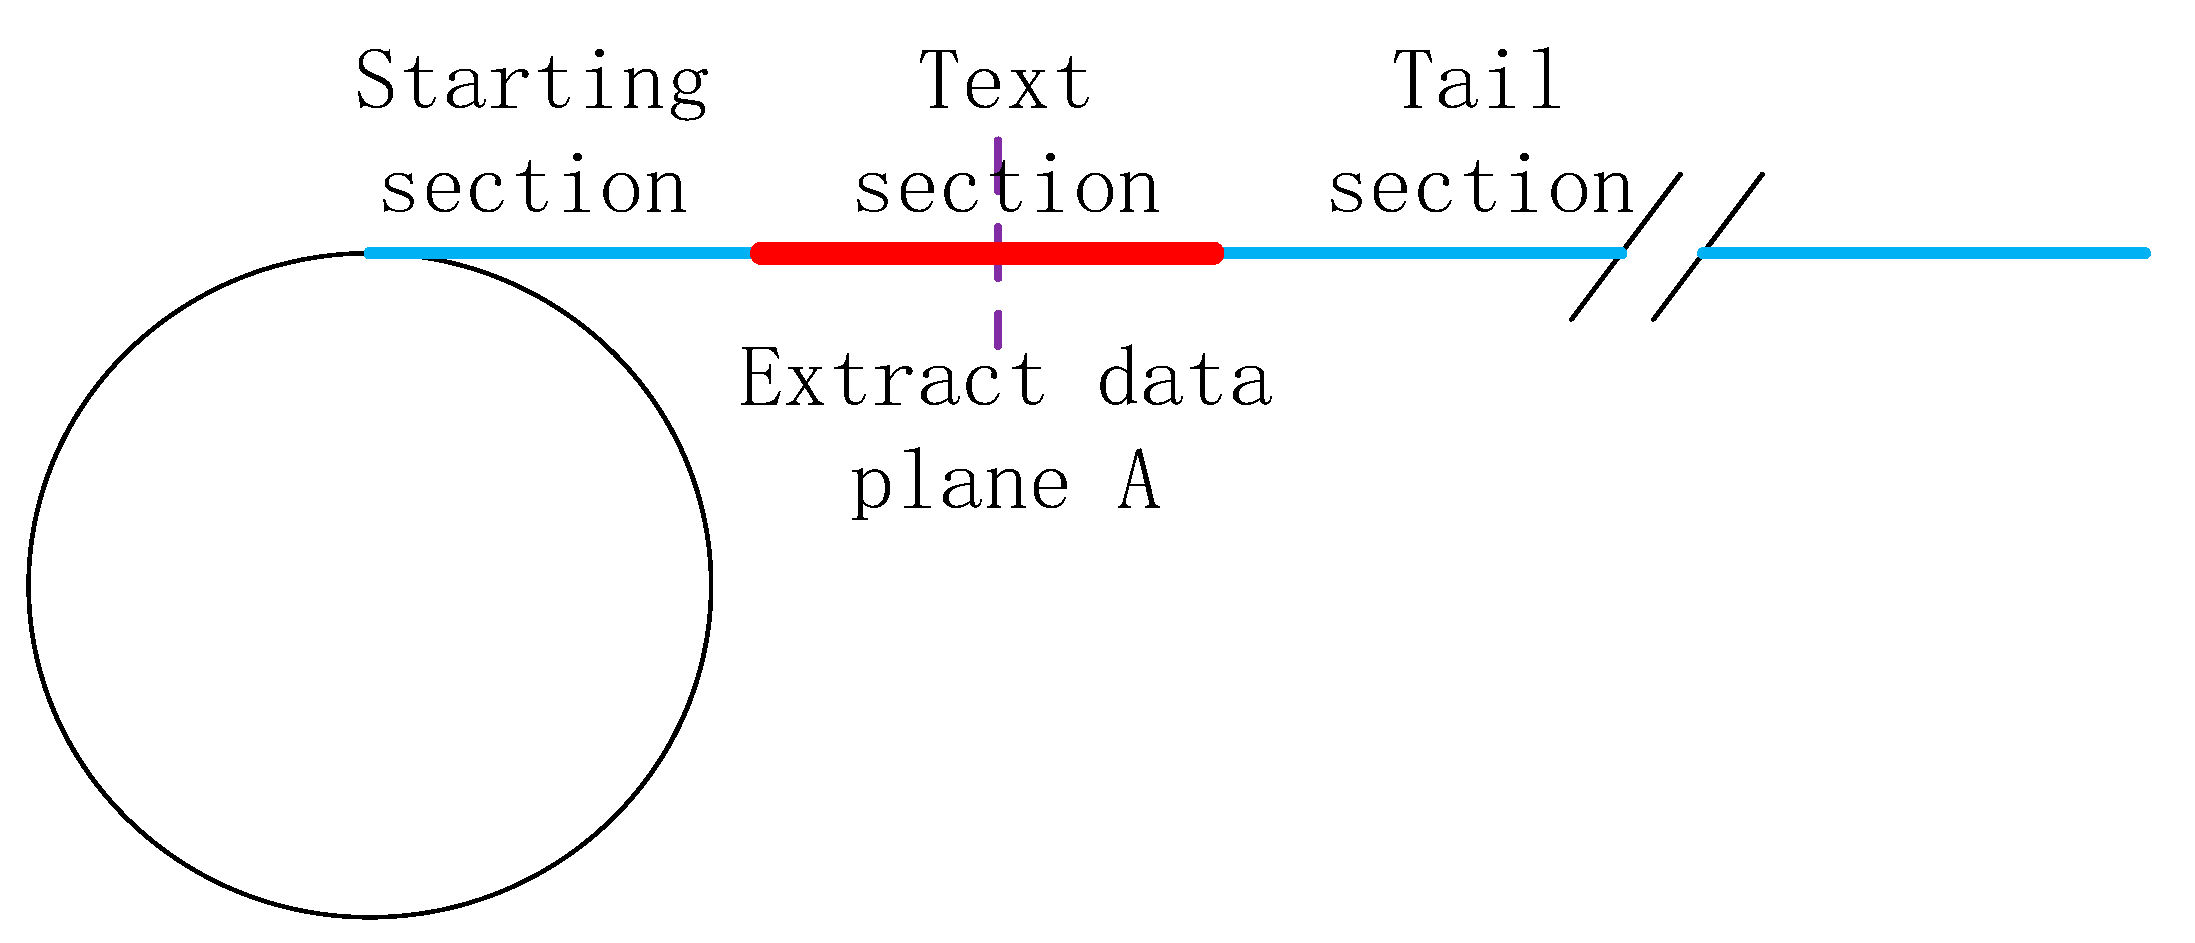
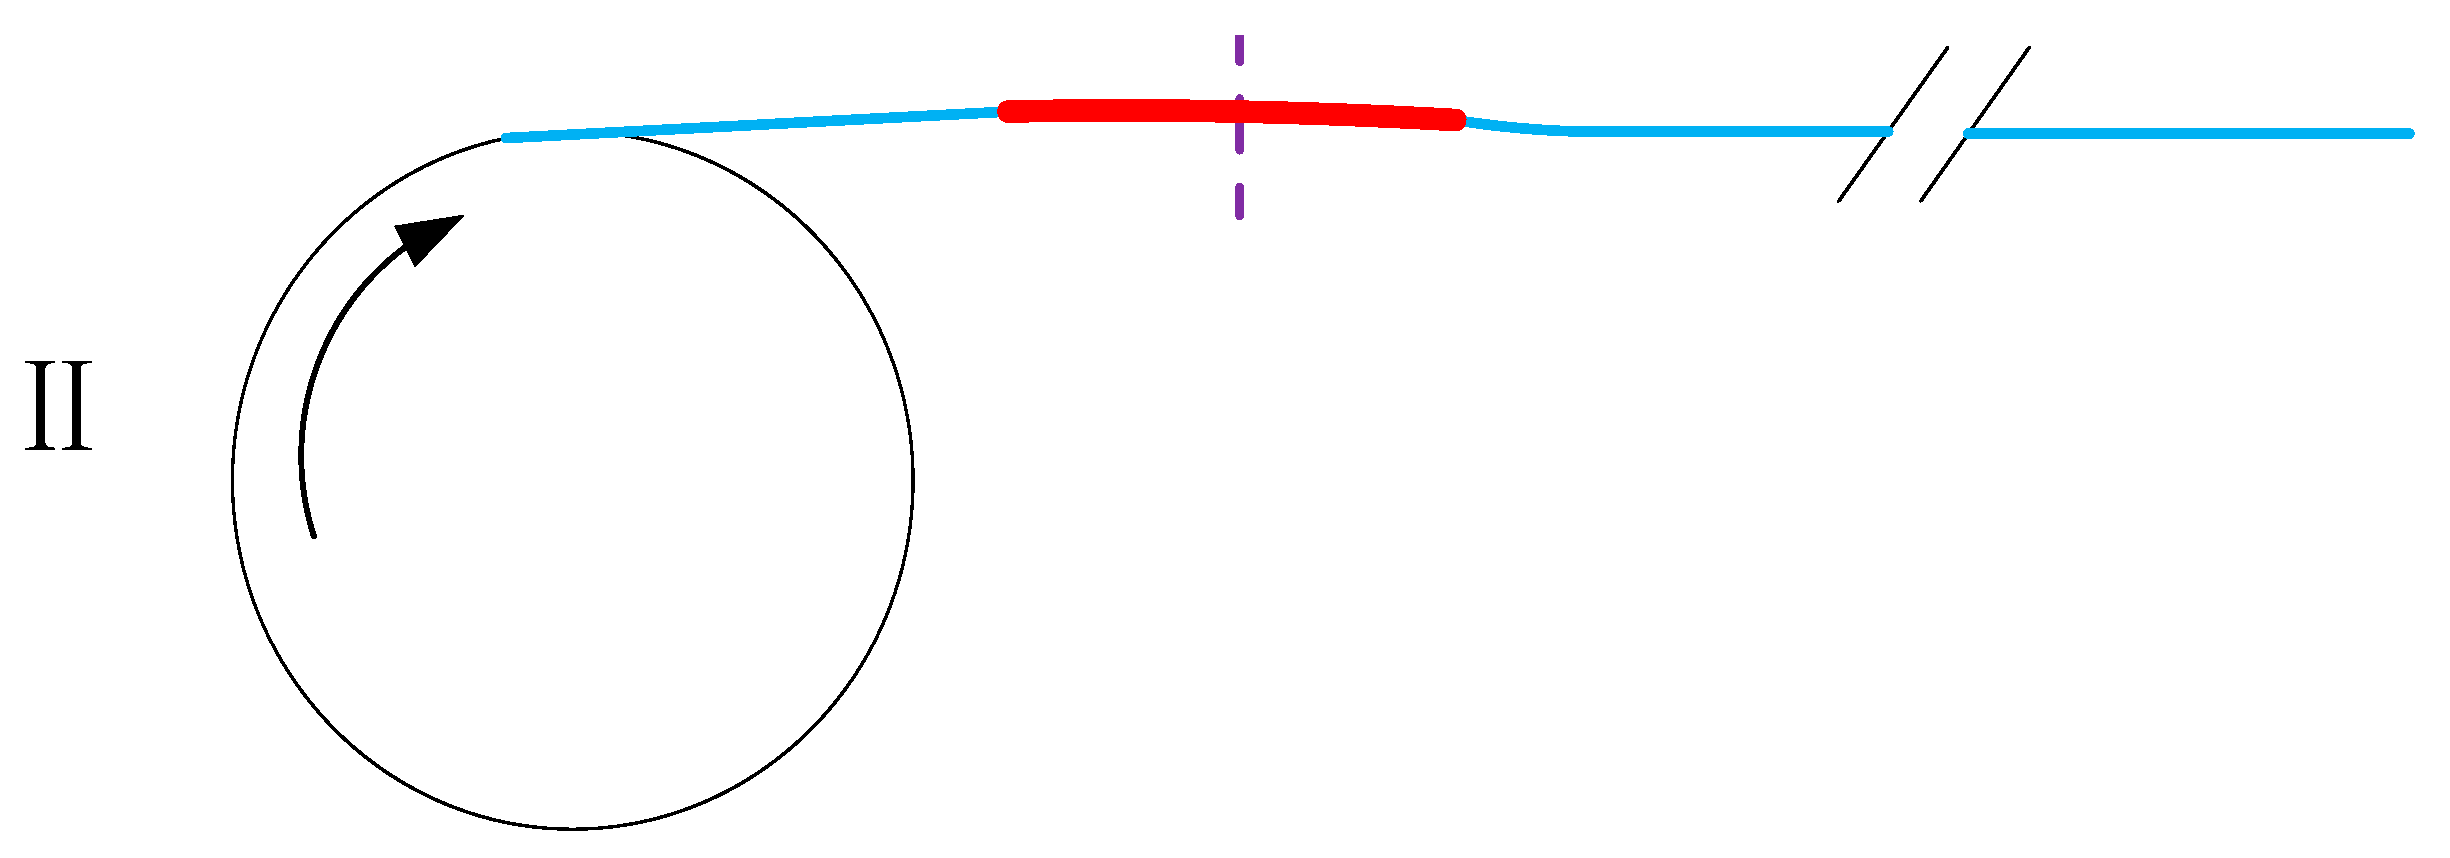
As shown in Figure 9, the corresponding relationship between each analysis step in the multi-step simulation and the actual operating conditions is presented. Each analysis step spans 1 s. The left blue segment denotes the starting section, the prominently highlighted red segment in the middle signifies test section A, and the blue segment on the right-hand side represents the tail section. The vertical dashed line denotes the location of the data extraction plane.
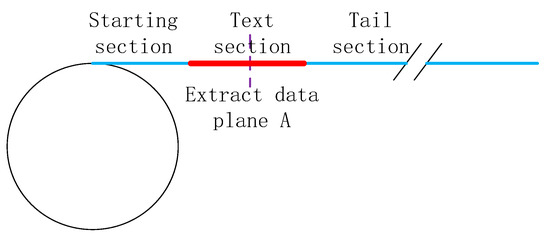
Figure 9.
Two-dimensional diagram.
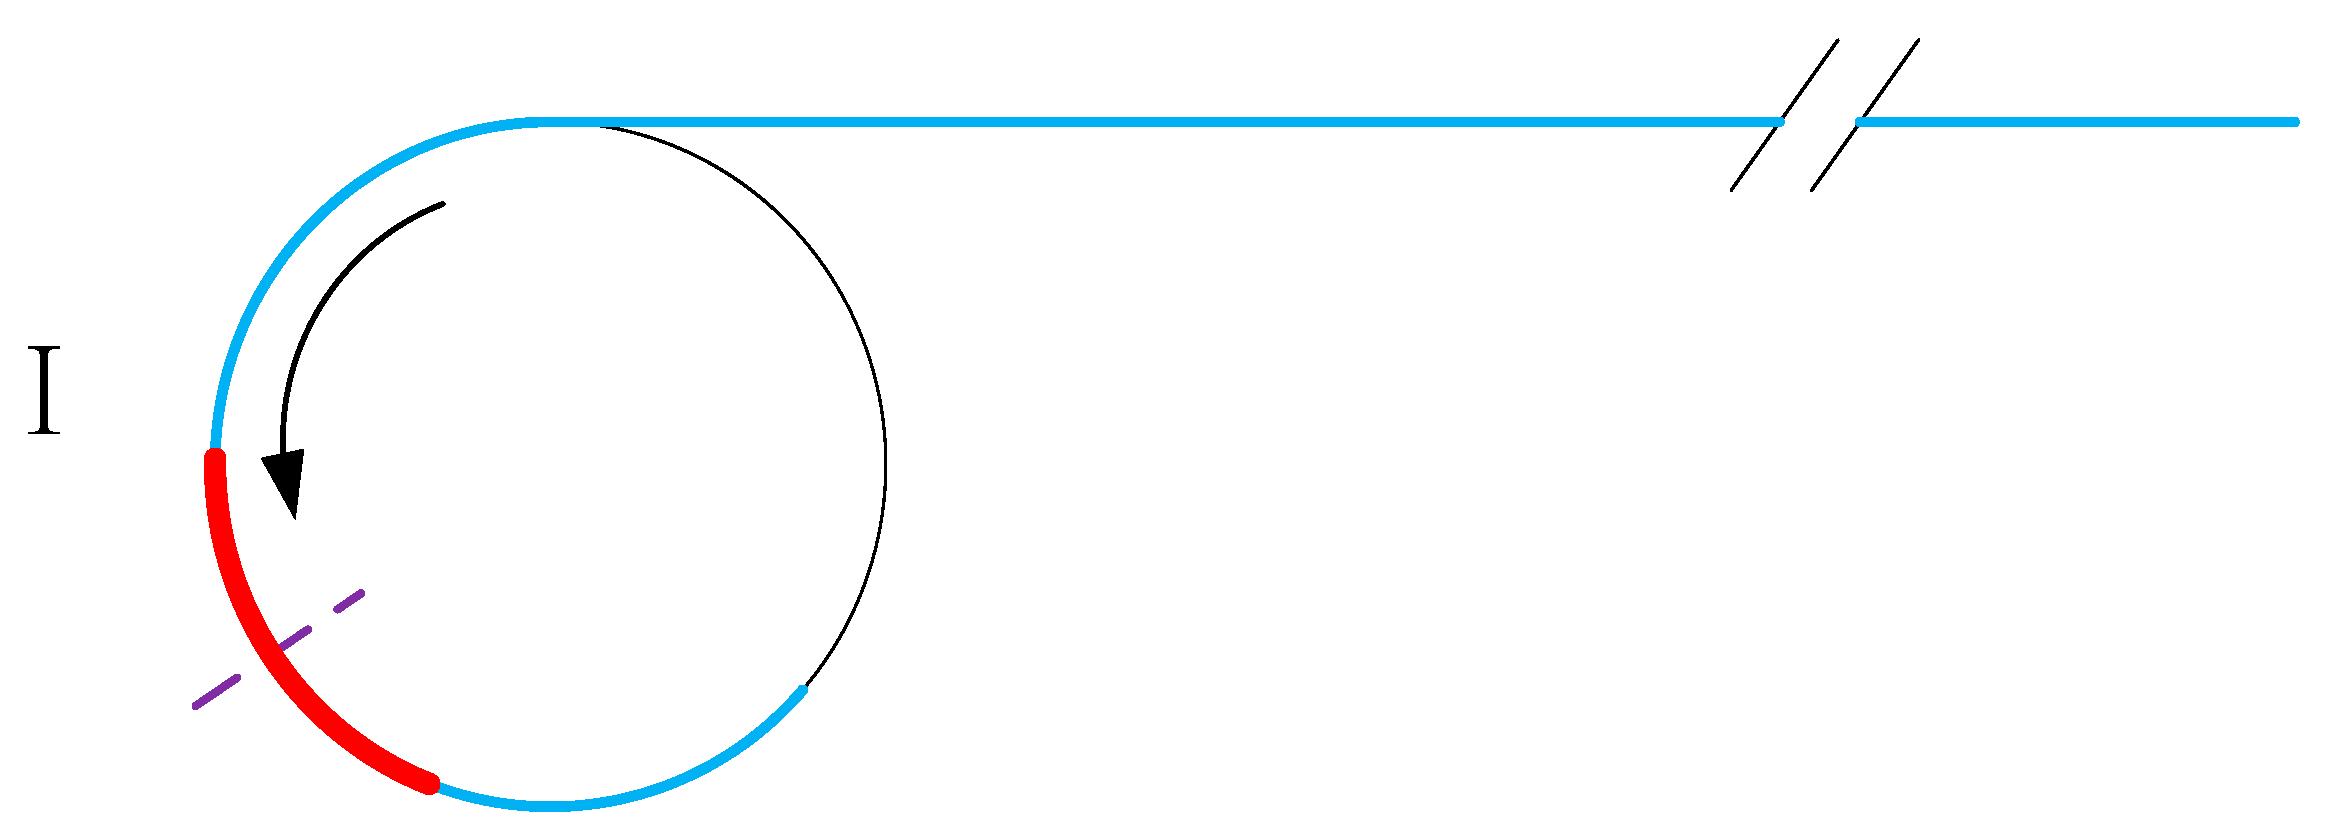
In step Ⅰ, a boundary condition is imposed, involving a counterclockwise rotation of 240° at the reel’s reference point. This causes the pipeline to rotate with the reel and wrap around it, replicating the process of spooling the pipeline onto the reel in the shipyard, as shown in Figure 10.

Figure 10.
Diagram of step Ⅰ.
In step Ⅱ, a boundary condition is implemented, involving a clockwise rotation of 240° at the reel’s reference point. This replicates the process of the pipeline unwinding and departing from the drum during the payout process, as shown in Figure 11.

Figure 11.
Diagram of step Ⅱ.
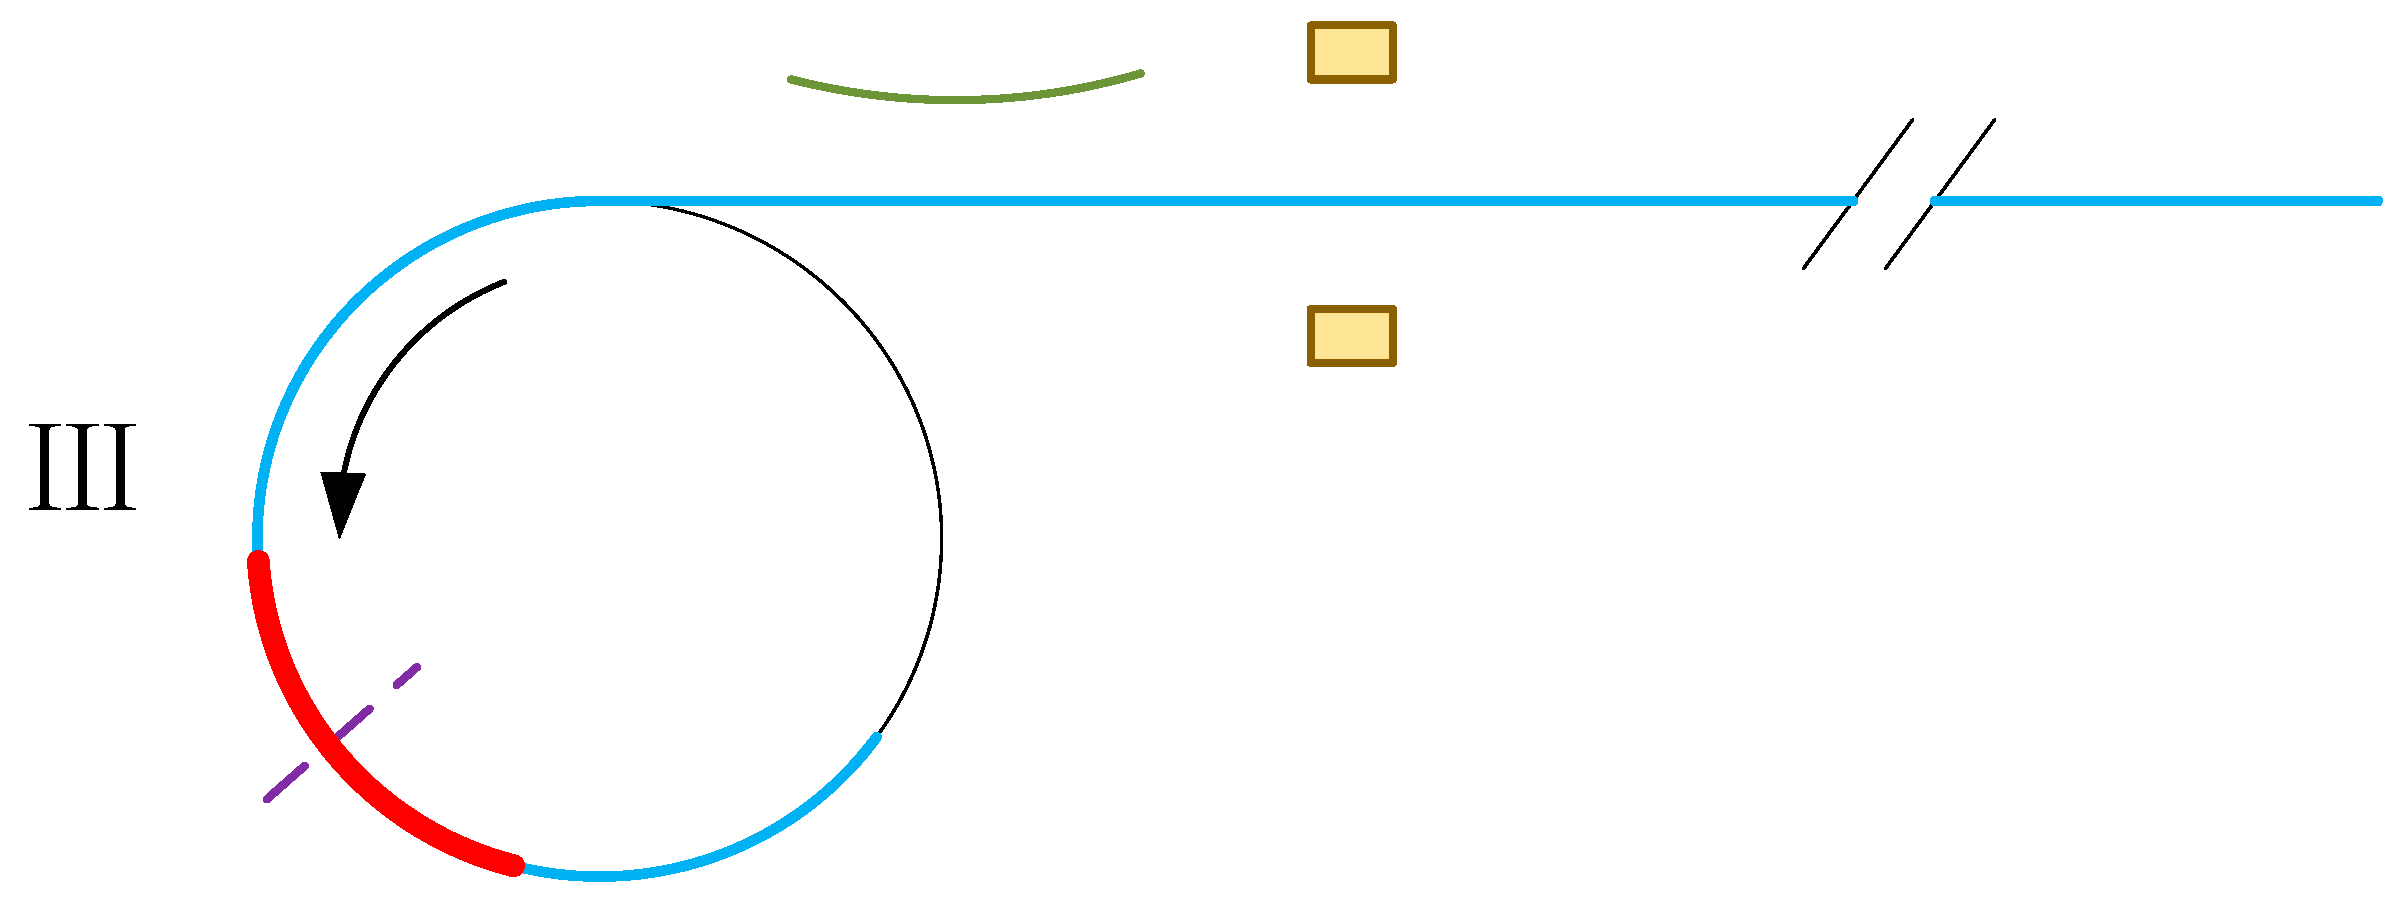
In step Ⅲ, the pipeline’s movement through the calibration unit can be likened to a process akin to re-winding it onto the reel. This simulation aligns with the initial analysis step of the reeling process. To represent this, we apply a boundary condition involving a counterclockwise rotation of 240° at the reel’s reference point, as shown in Figure 12.

Figure 12.
Diagram of step Ⅲ.
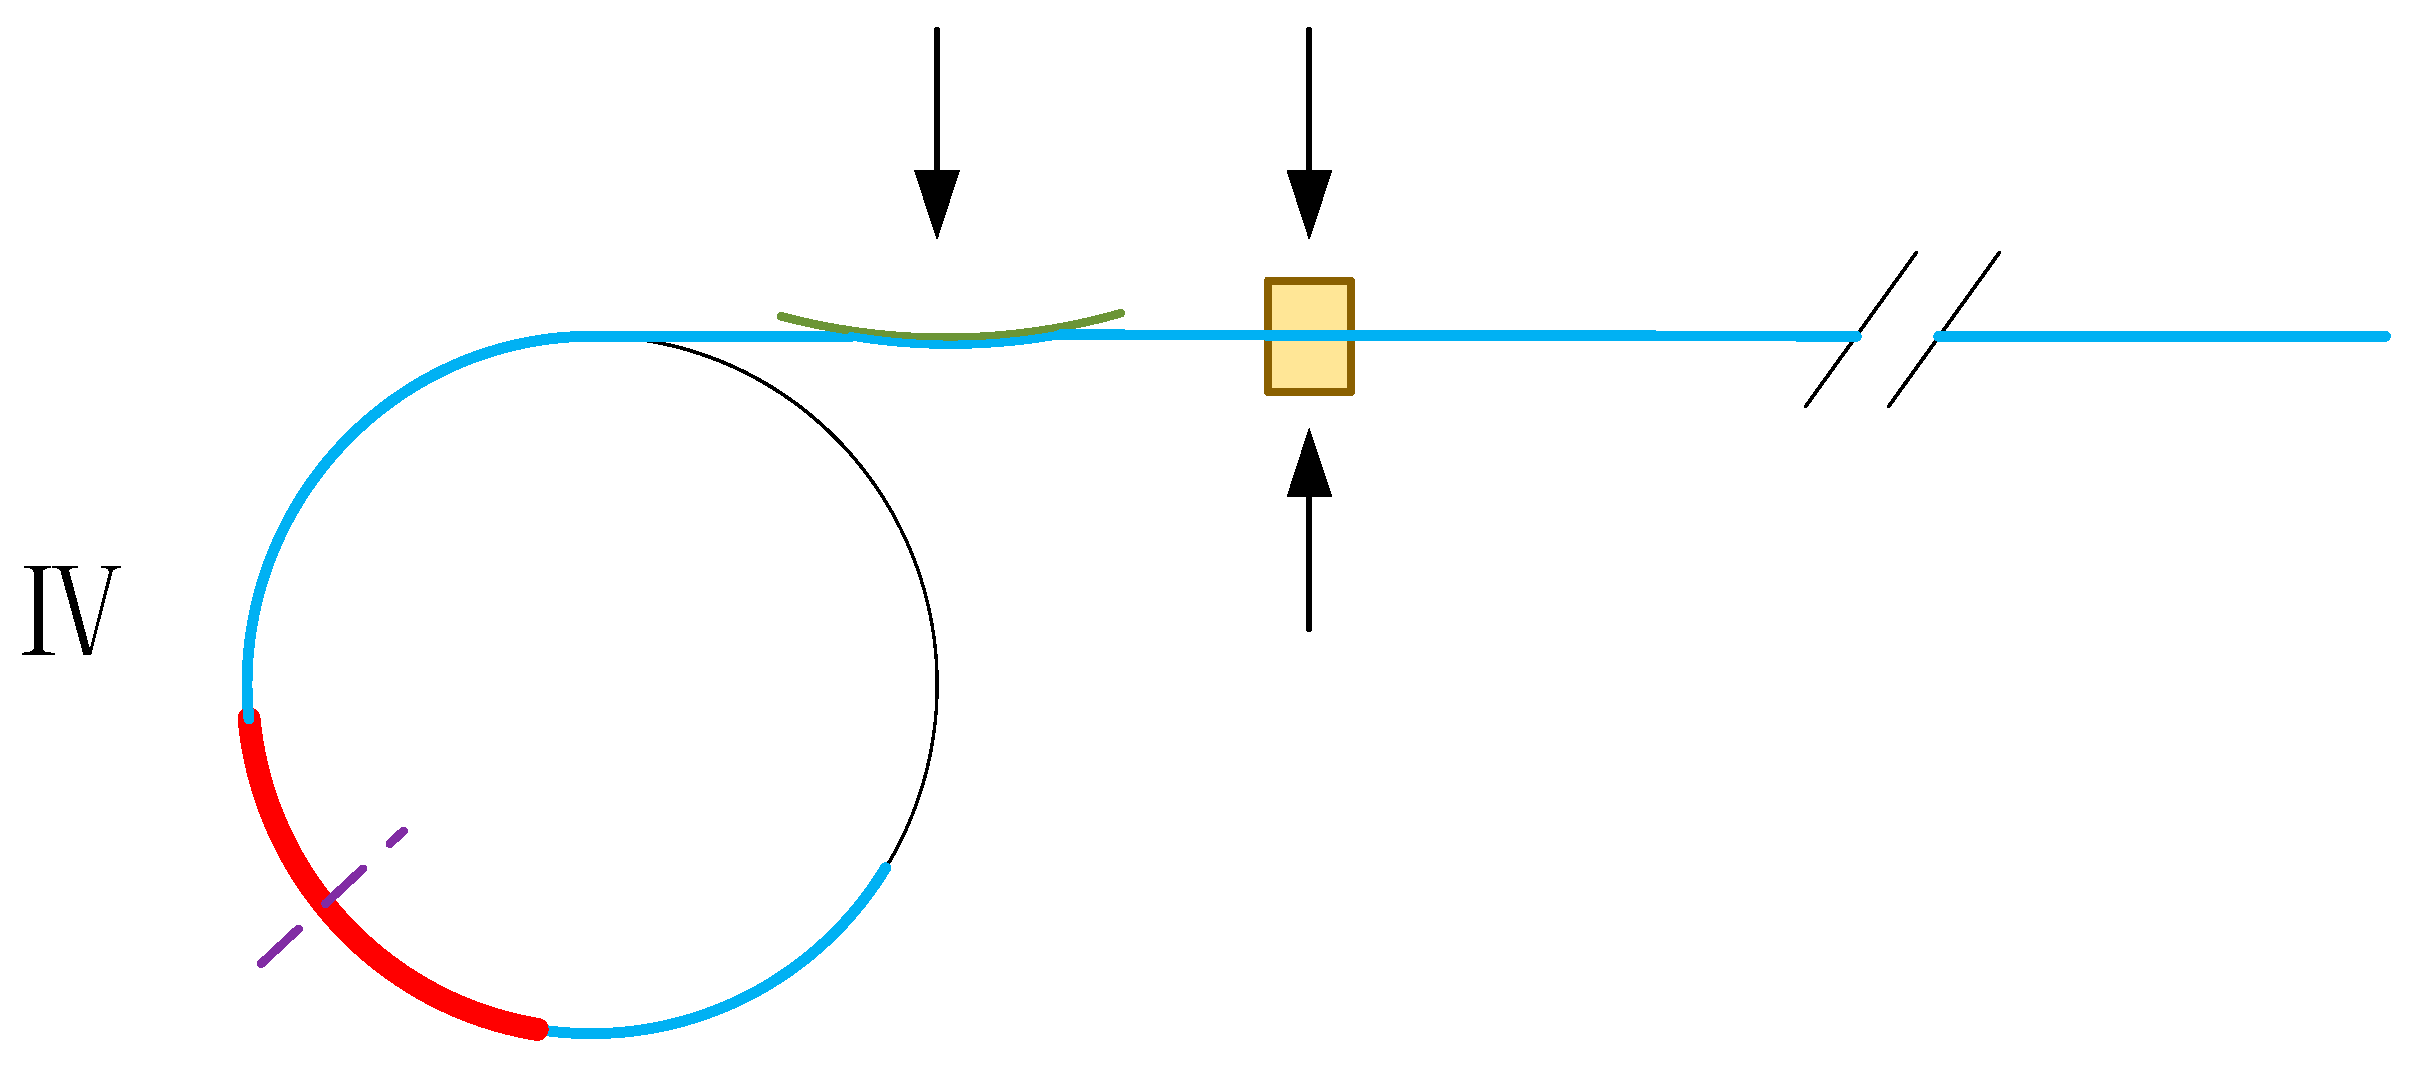
In step Ⅳ, the models of the tensioner and straightener are positioned in preparation for simulating the pipeline straightening process. The straightener maintains pressure even after reaching the initial horizontal position of the pipeline to eliminate residual bending moment. Meanwhile, the two tensioners approach the pipeline, maintaining a gap slightly larger than the pipeline’s diameter to prevent deformation caused by compression. This gap serves as a limiting function. Figure 13 illustrates this process, and it does not affect data extraction.
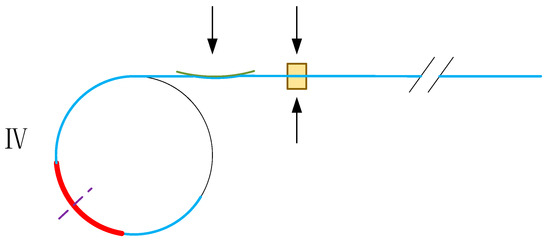
Figure 13.
Diagram of step Ⅳ.
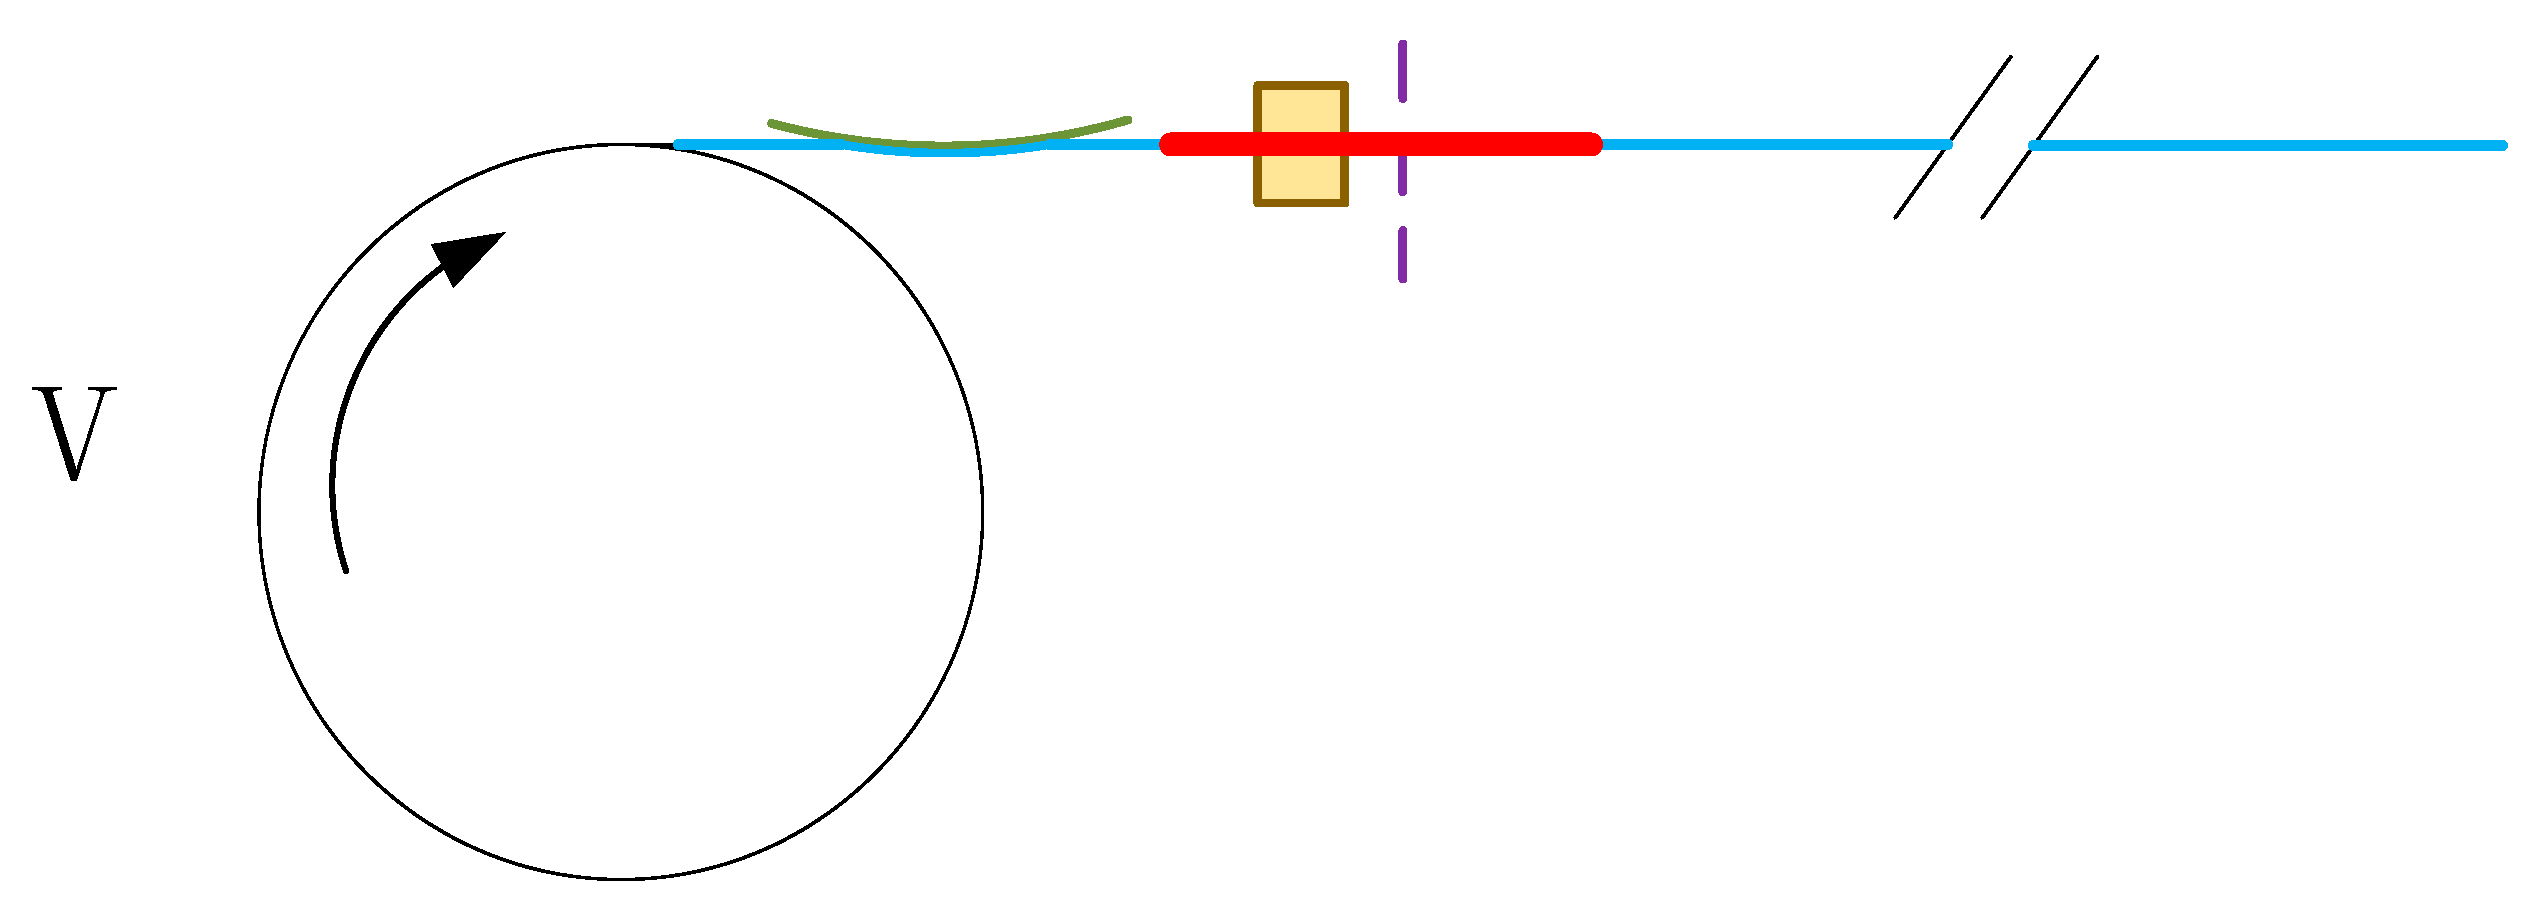
In step Ⅴ, the boundary condition of clockwise rotation of 240° is applied to the reference point of the reel. This step replicates the pipeline’s departure from the reel, corresponding to its exit from the straightener. Simultaneously, the pipeline, having left the straightener, proceeds to pass through both the tensioner and straightener, thereby simulating the straightening process facilitated by these components. Figure 14 illustrates this process.
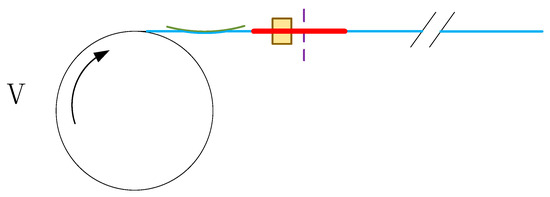
Figure 14.
Diagram of step Ⅴ.
3.2. Model Results
As shown in Figure 1, during the deformation process of the pipeline, by extracting the coordinates of four points a, b, c, and d in section A at different time instances, the values of Dmax and Dmin at each moment can be obtained, thereby determining the ovality of section A at different time instances.
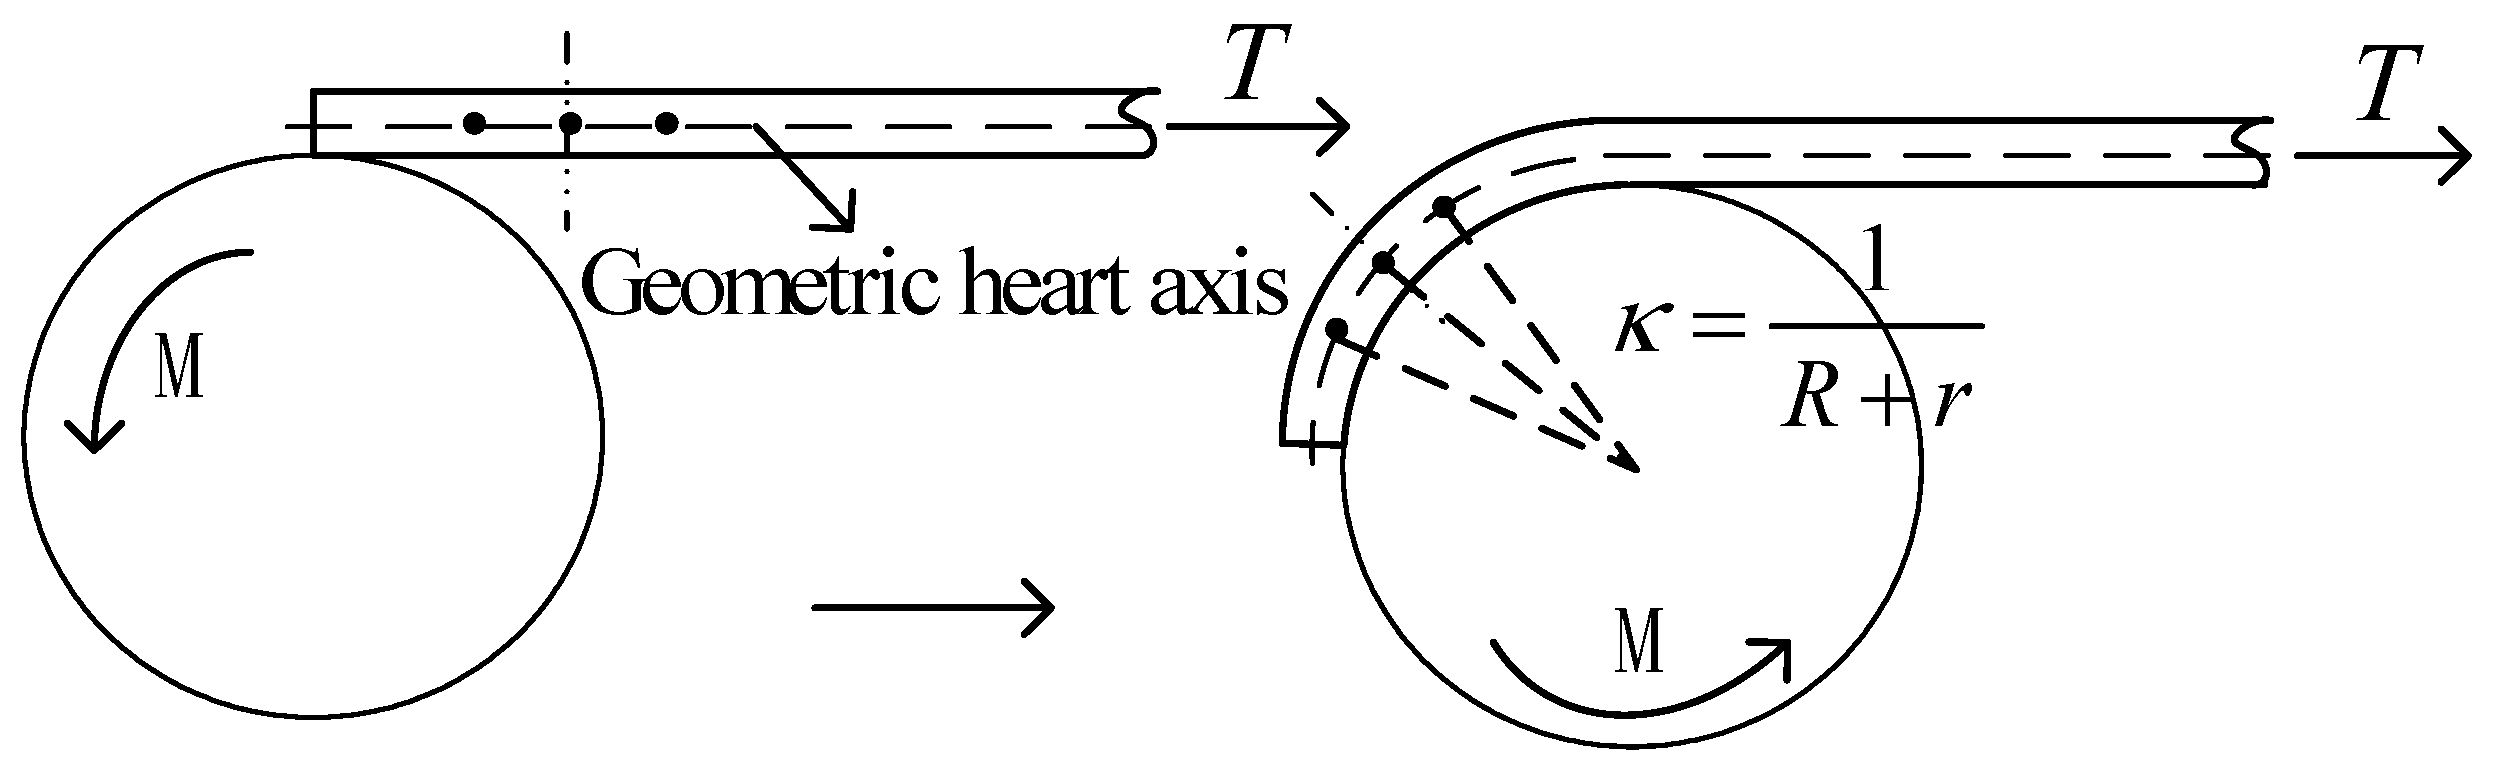
As shown in Figure 15, the curvature radius at the data extraction plane of the pipeline is equal to the radius of the nearby arc. Three points are selected: the center point of the section and two points on the left and right axial axes at distances of 0.2 m. By extracting the coordinates of these points, we can calculate the center of the circle formed by them, subsequently allowing us to determine the pipeline’s curvature, denoted as κ. This curvature is calculated using the equation κ = 1/(R + r), where R represents the bending curvature radius associated with components like the drum, calibrator, or straightener, while r denotes the radius of the pipeline.

Figure 15.
Definition of curvature.
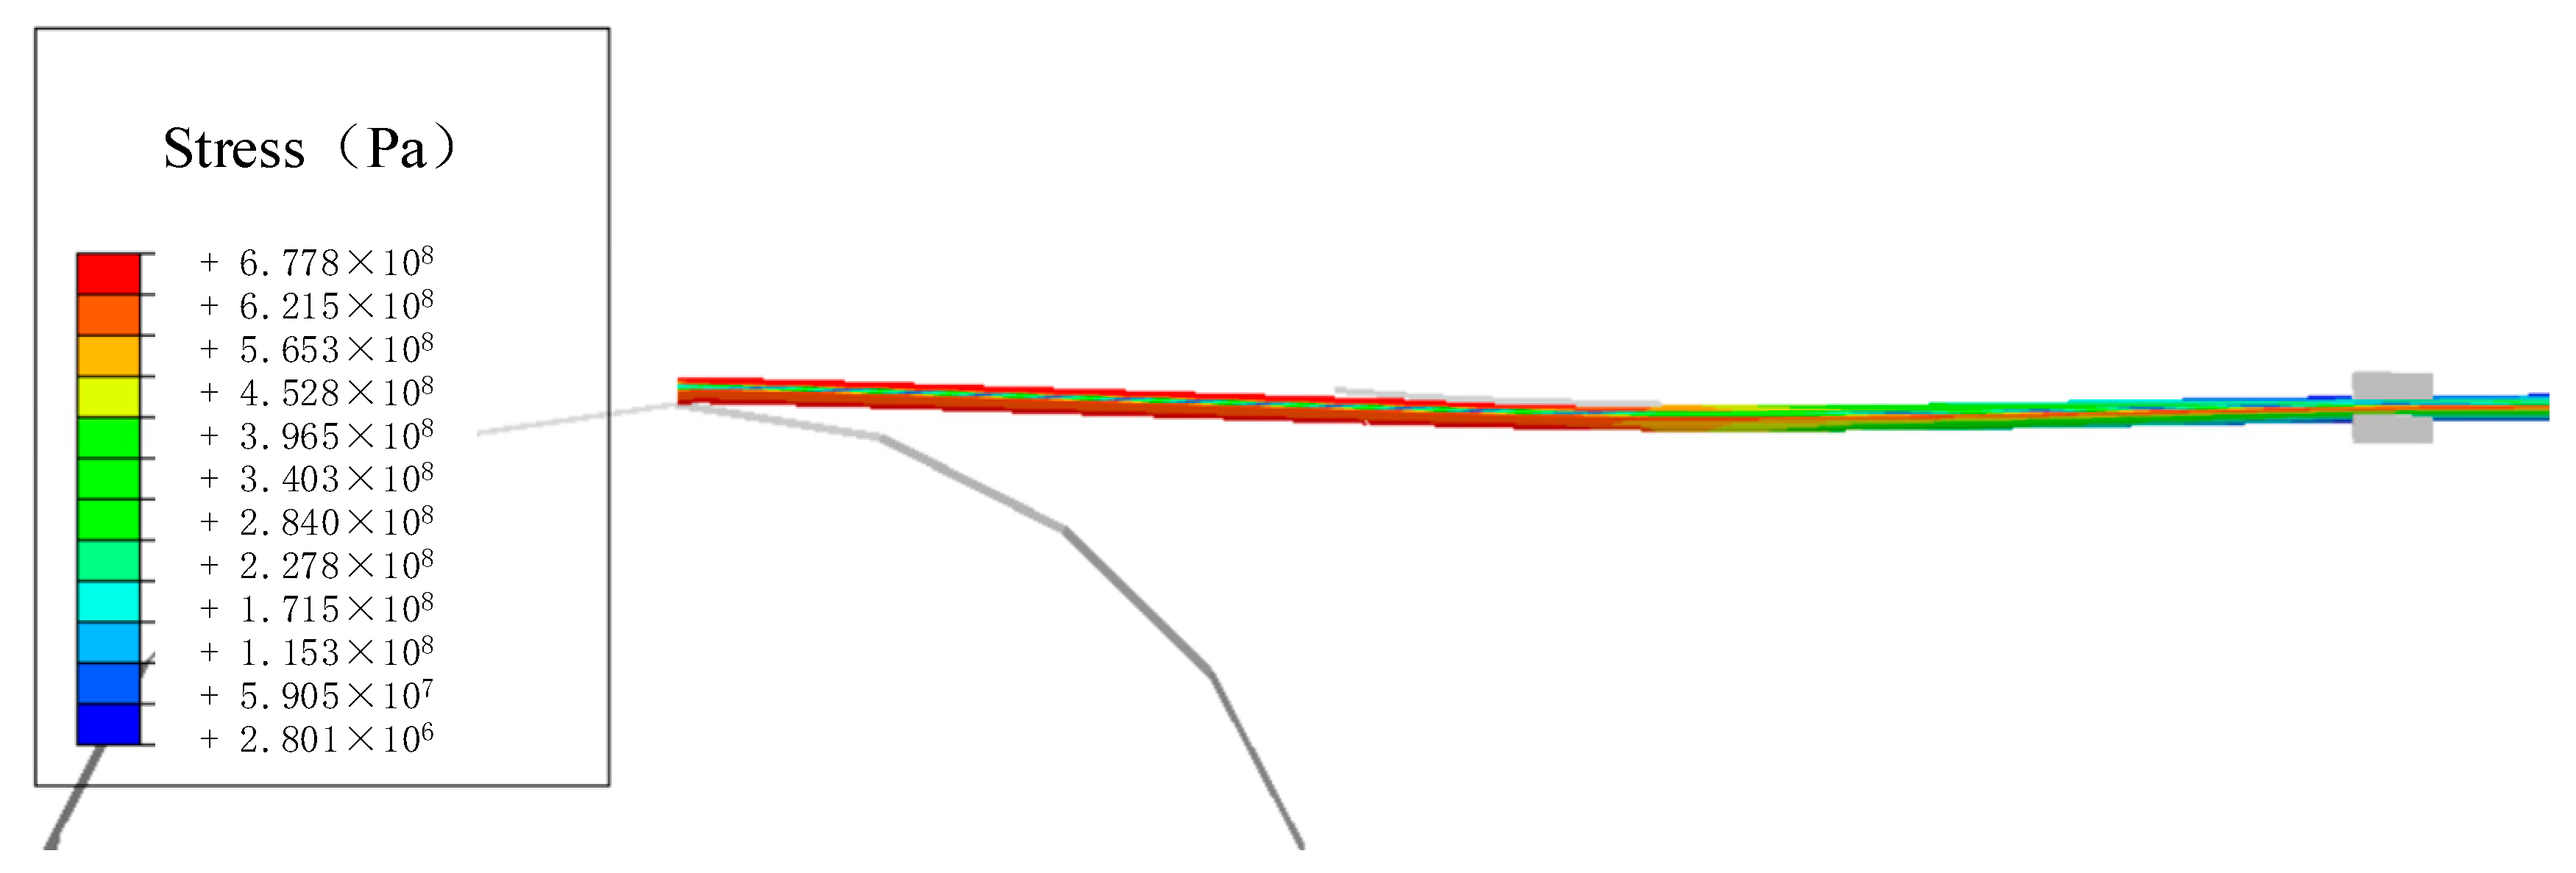
Utilizing the previously mentioned finite element model, the R-lay laying process is simulated using finite element analysis. In Figure 16, the results after the winding, unwinding, and straightening processes are presented. It can be observed from the figure that the pipeline exhibits a reverse bending moment after leaving the drum, and there is a significant reduction in the residual stress after the straightening process.

Figure 16.
The stress distribution of the pipe during reeling.
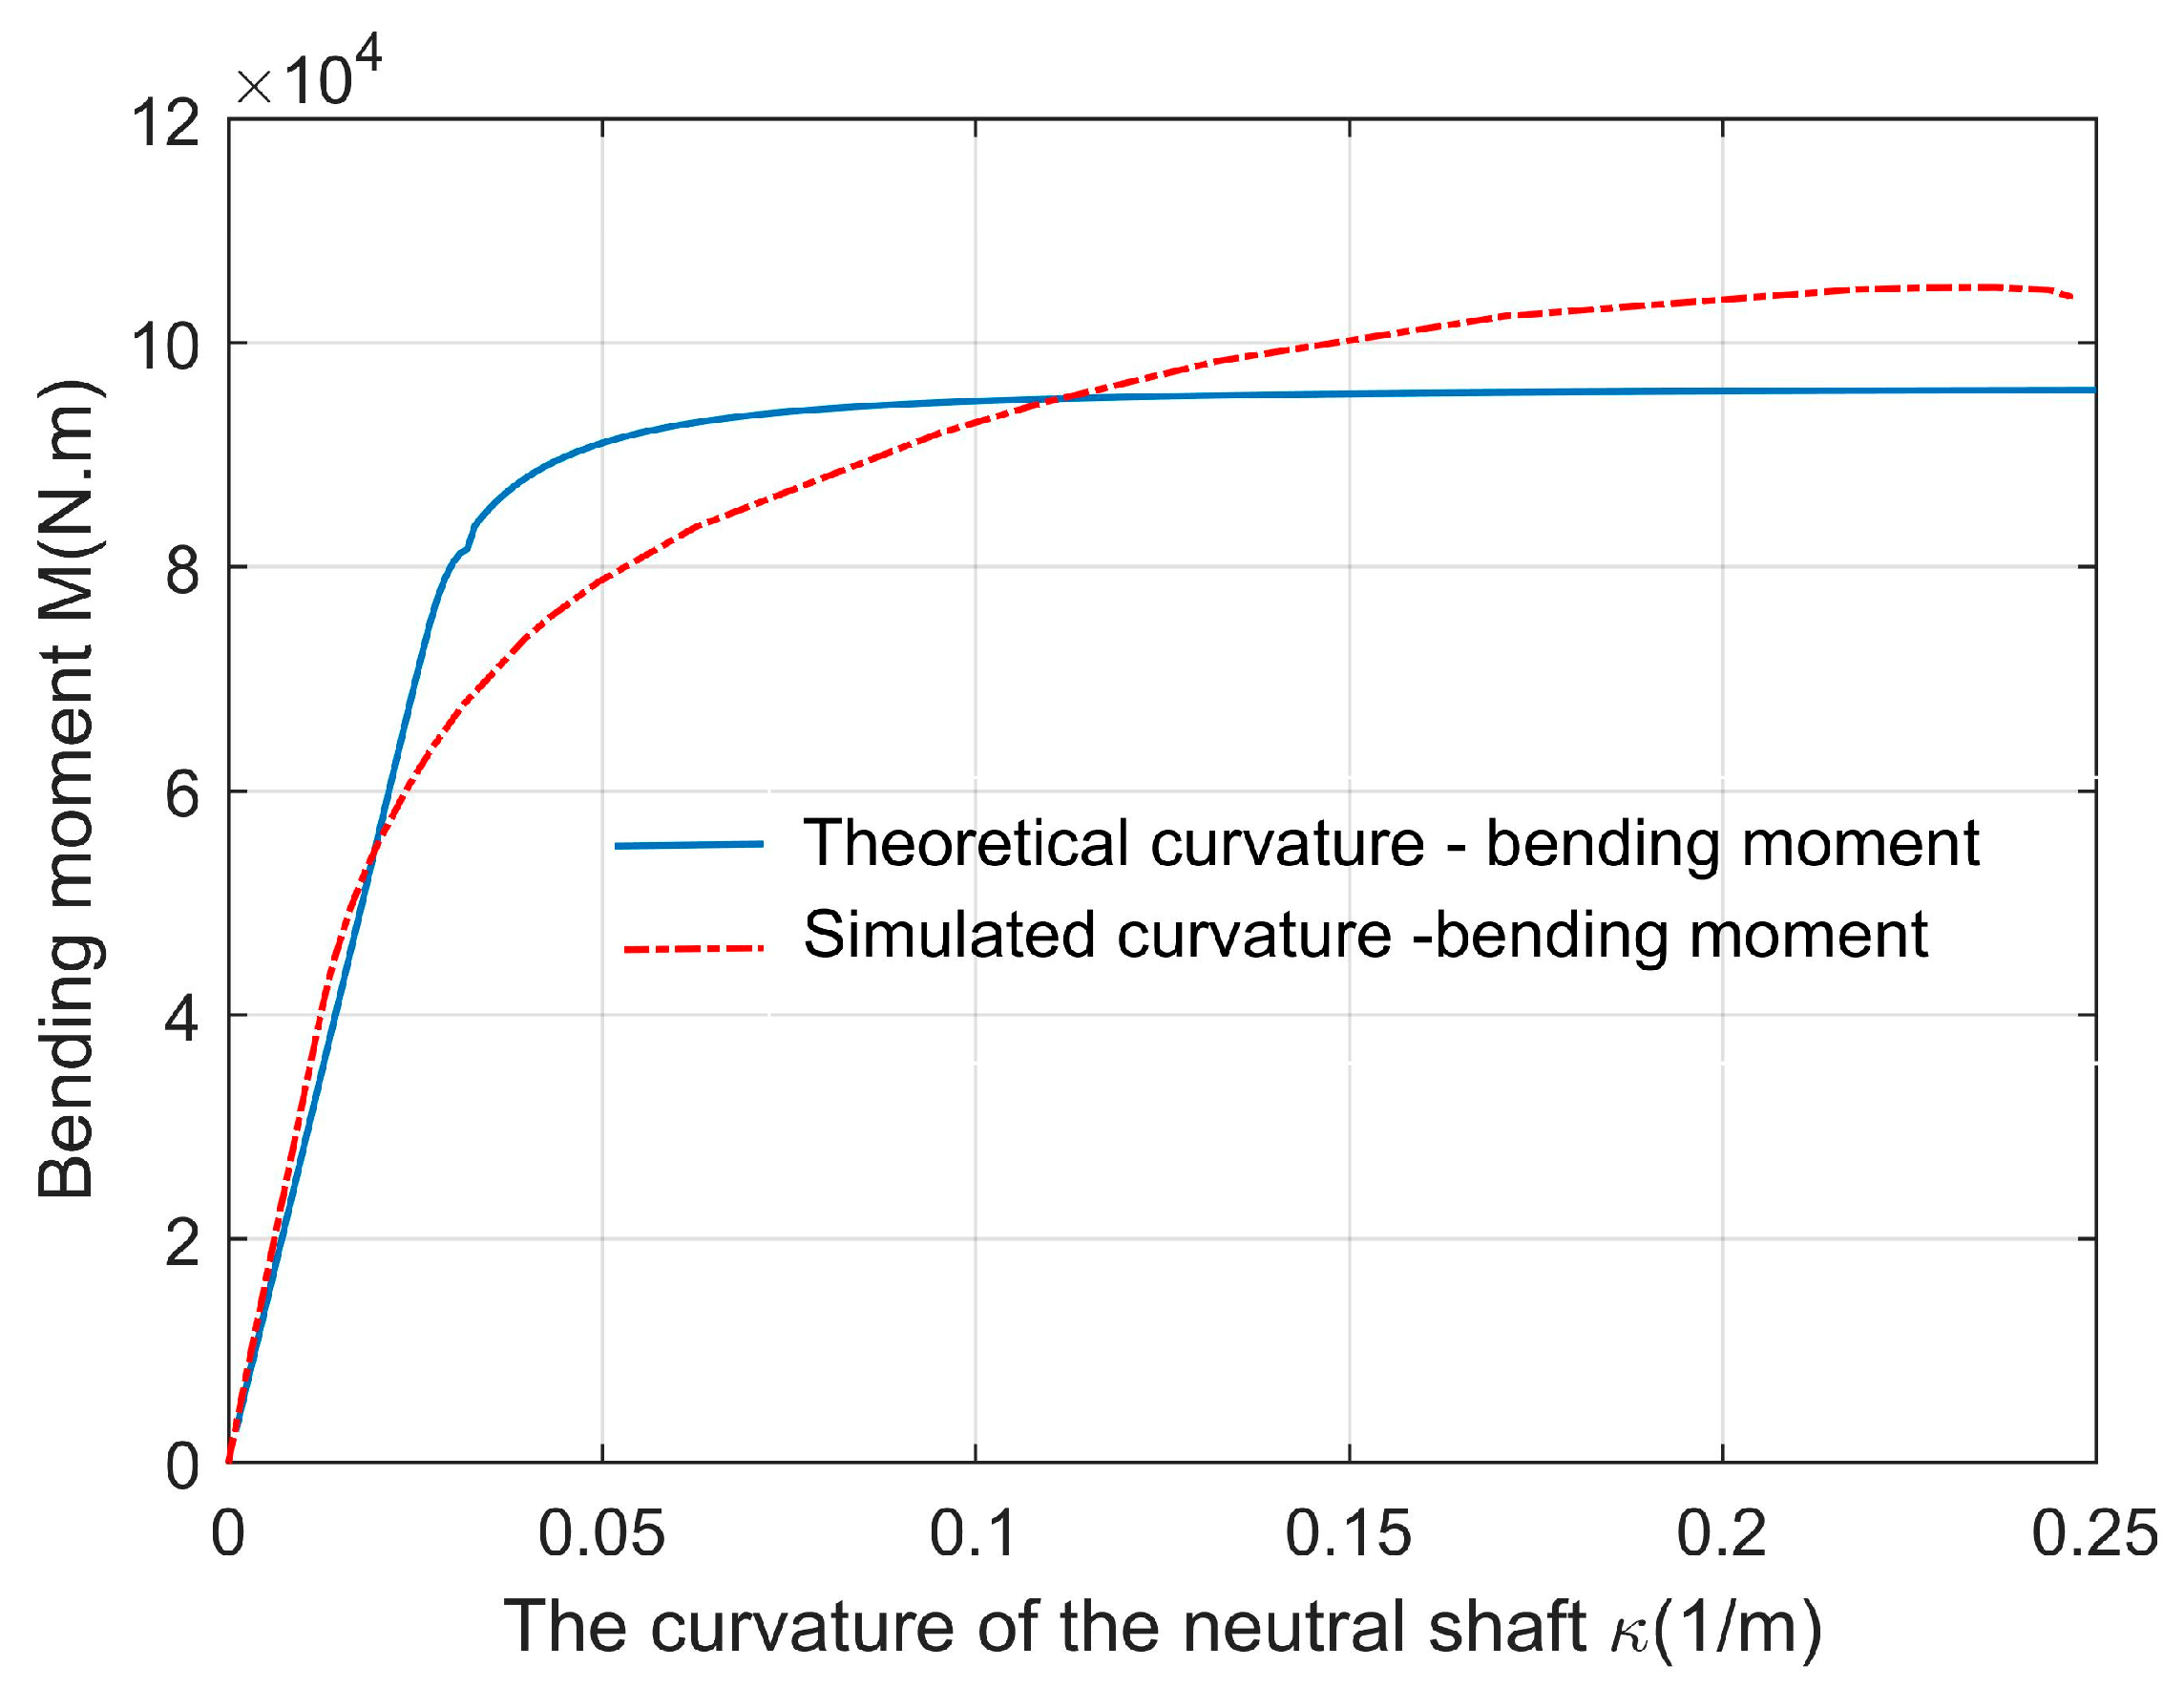
Taking the X65 material with a diameter-to-thickness ratio of 20 as an example, the calculation results of the finite element model in the winding stage are compared with the curvature–moment relationship derived from the above theoretical conclusions. As shown in Figure 17, both curves depict an increase in bending moment values with curvature, following a pattern of rapid increase, gradual slowing, and eventual stabilization. This behavior is associated with the pipe’s transition from elasticity to plasticity. The theoretical curve begins stabilizing as the bending moment approaches, while the simulation curve exhibits a smoother trend. Specifically, the theoretical curve reaches stability when the bending moment is approximately 0.95 × 10⁵ N·m, while the simulation curve demonstrates a smoother performance. However, the bending moment value after stabilization in the simulation is slightly higher than the theoretical value, with a maximum difference of 0.95 × 10⁴ N·m. This discrepancy arises because the forces acting on the pipe with the reel in the finite element simulation differ from the theoretical calculations of pipe bending. In comparison to theoretical calculations, the actual forces on the pipe are more complex, influenced by the random dynamic effects of multiple external loads. Therefore, the simulation reflects conditions closer to actual working conditions, emphasizing the practical value of the finite element simulation results.
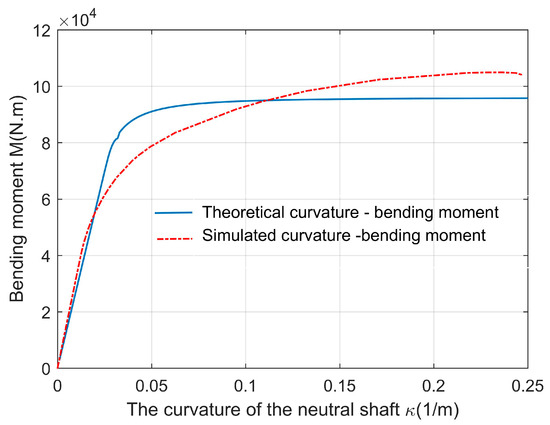
Figure 17.
Comparison of theoretical and simulated variation in bending moment with curvature during reeling process.
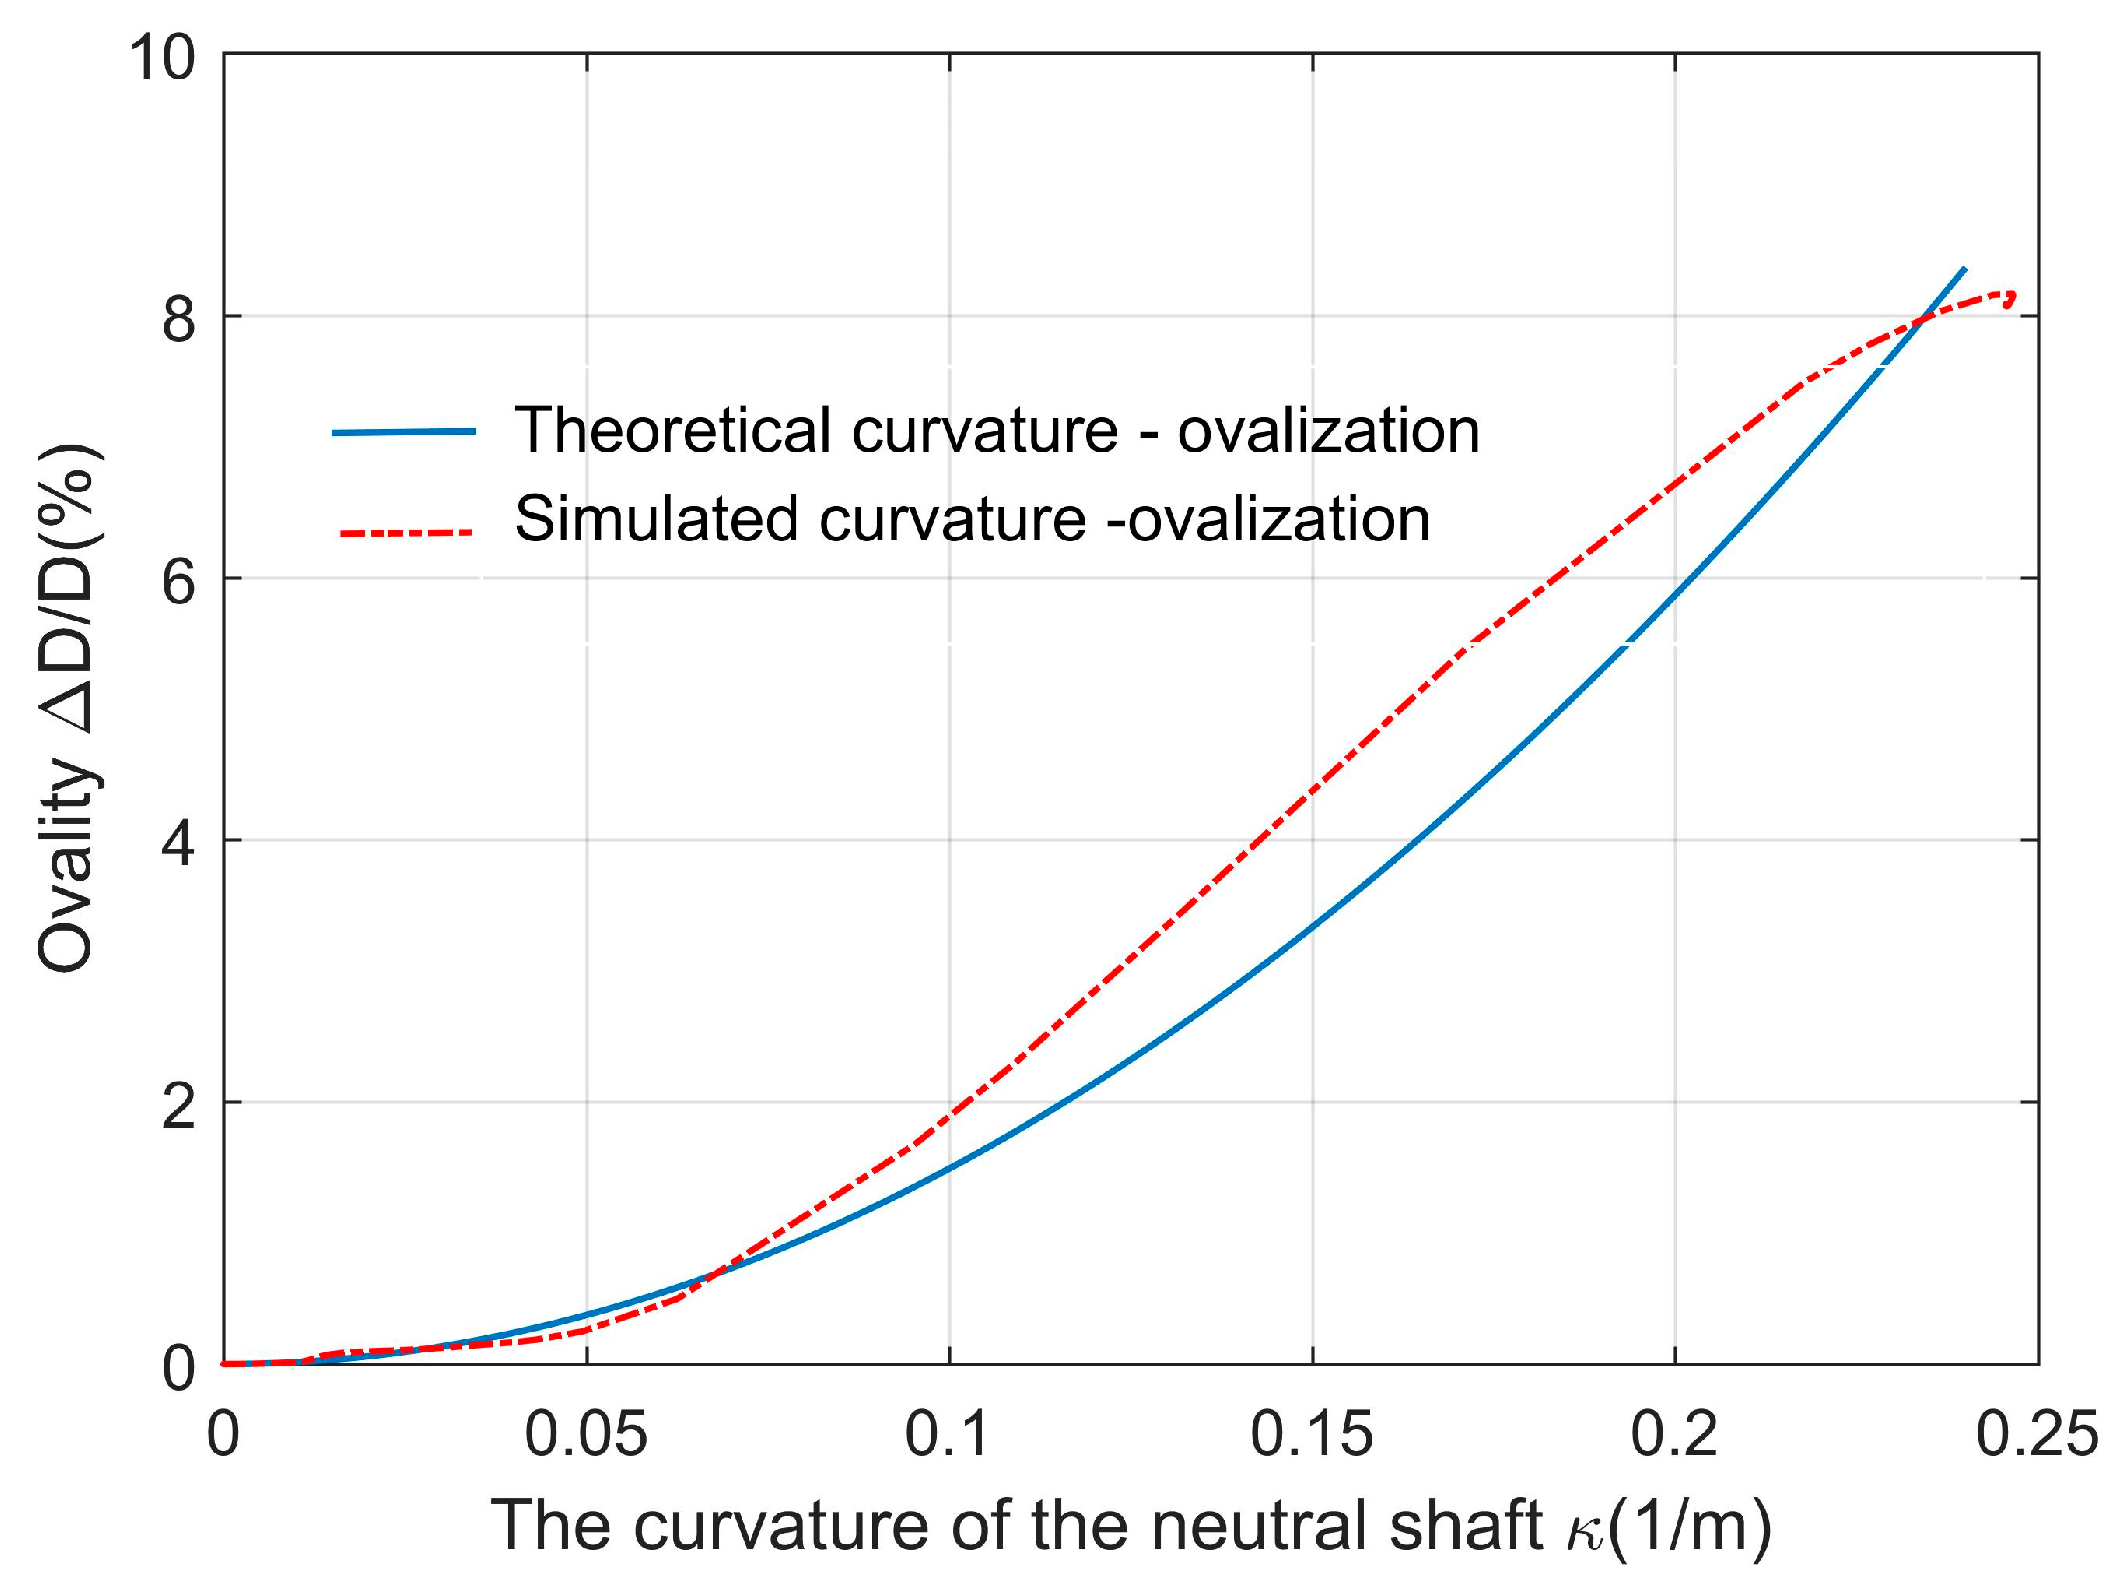
Comparisons were conducted between the finite element model’s calculated results for the winding phase and the theoretical conclusions concerning the ovality–curvature relationship. As shown in Figure 18, both curves demonstrate an increasing trend in ovality with increasing curvature. However, at the same curvature, the simulated ovality values surpass the theoretical values until the curvature reaches 0.25, at which point the simulated ovality gradually stabilizes. In contrast, the theoretical ovality follows a more linear trend, while the finite element simulation results exhibit a pattern of initially gradual changes, followed by rapid shifts, and finally slower variations in ovality. The explanation for this gradual change in ovality near 0.25 will be elaborated upon in the subsequent section. The deviation in ovality is attributed to the previously discussed differences in moments. When subjected to the same curvature, the pipeline in the finite element simulation experiences higher moments, resulting in the phenomenon of the simulated ovality surpassing the theoretical ovality.

Figure 18.
Comparison of theoretical and simulated variation in ovality with curvature during reeling process.
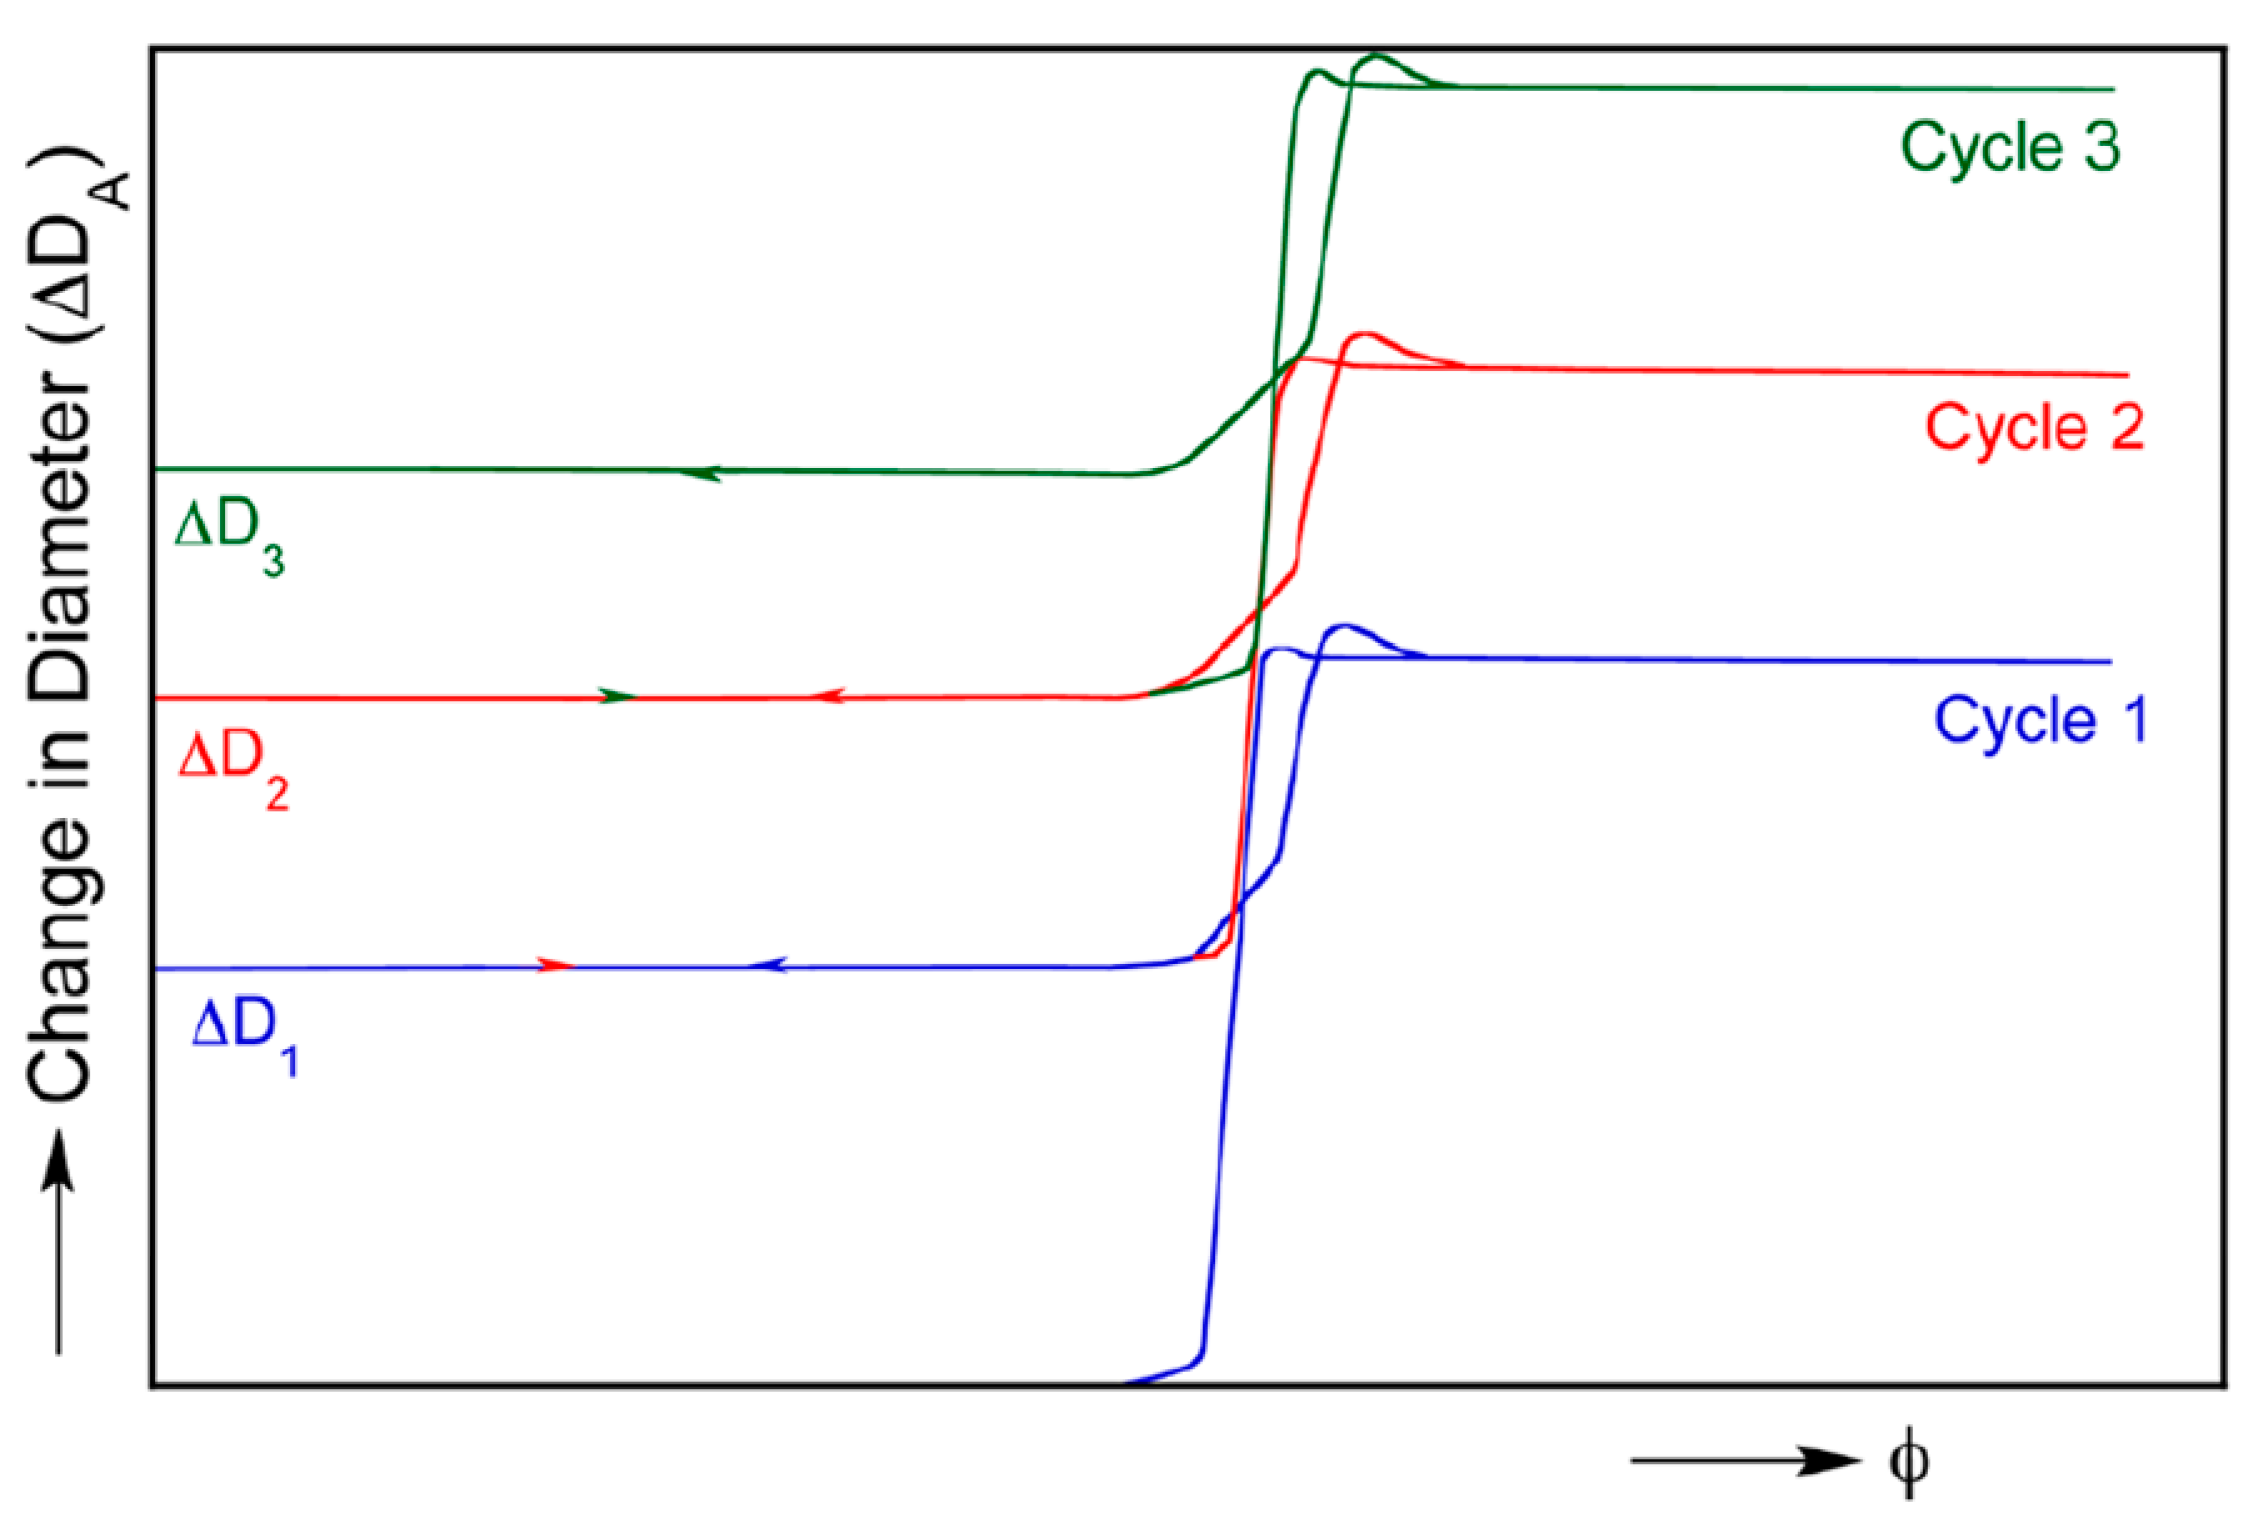
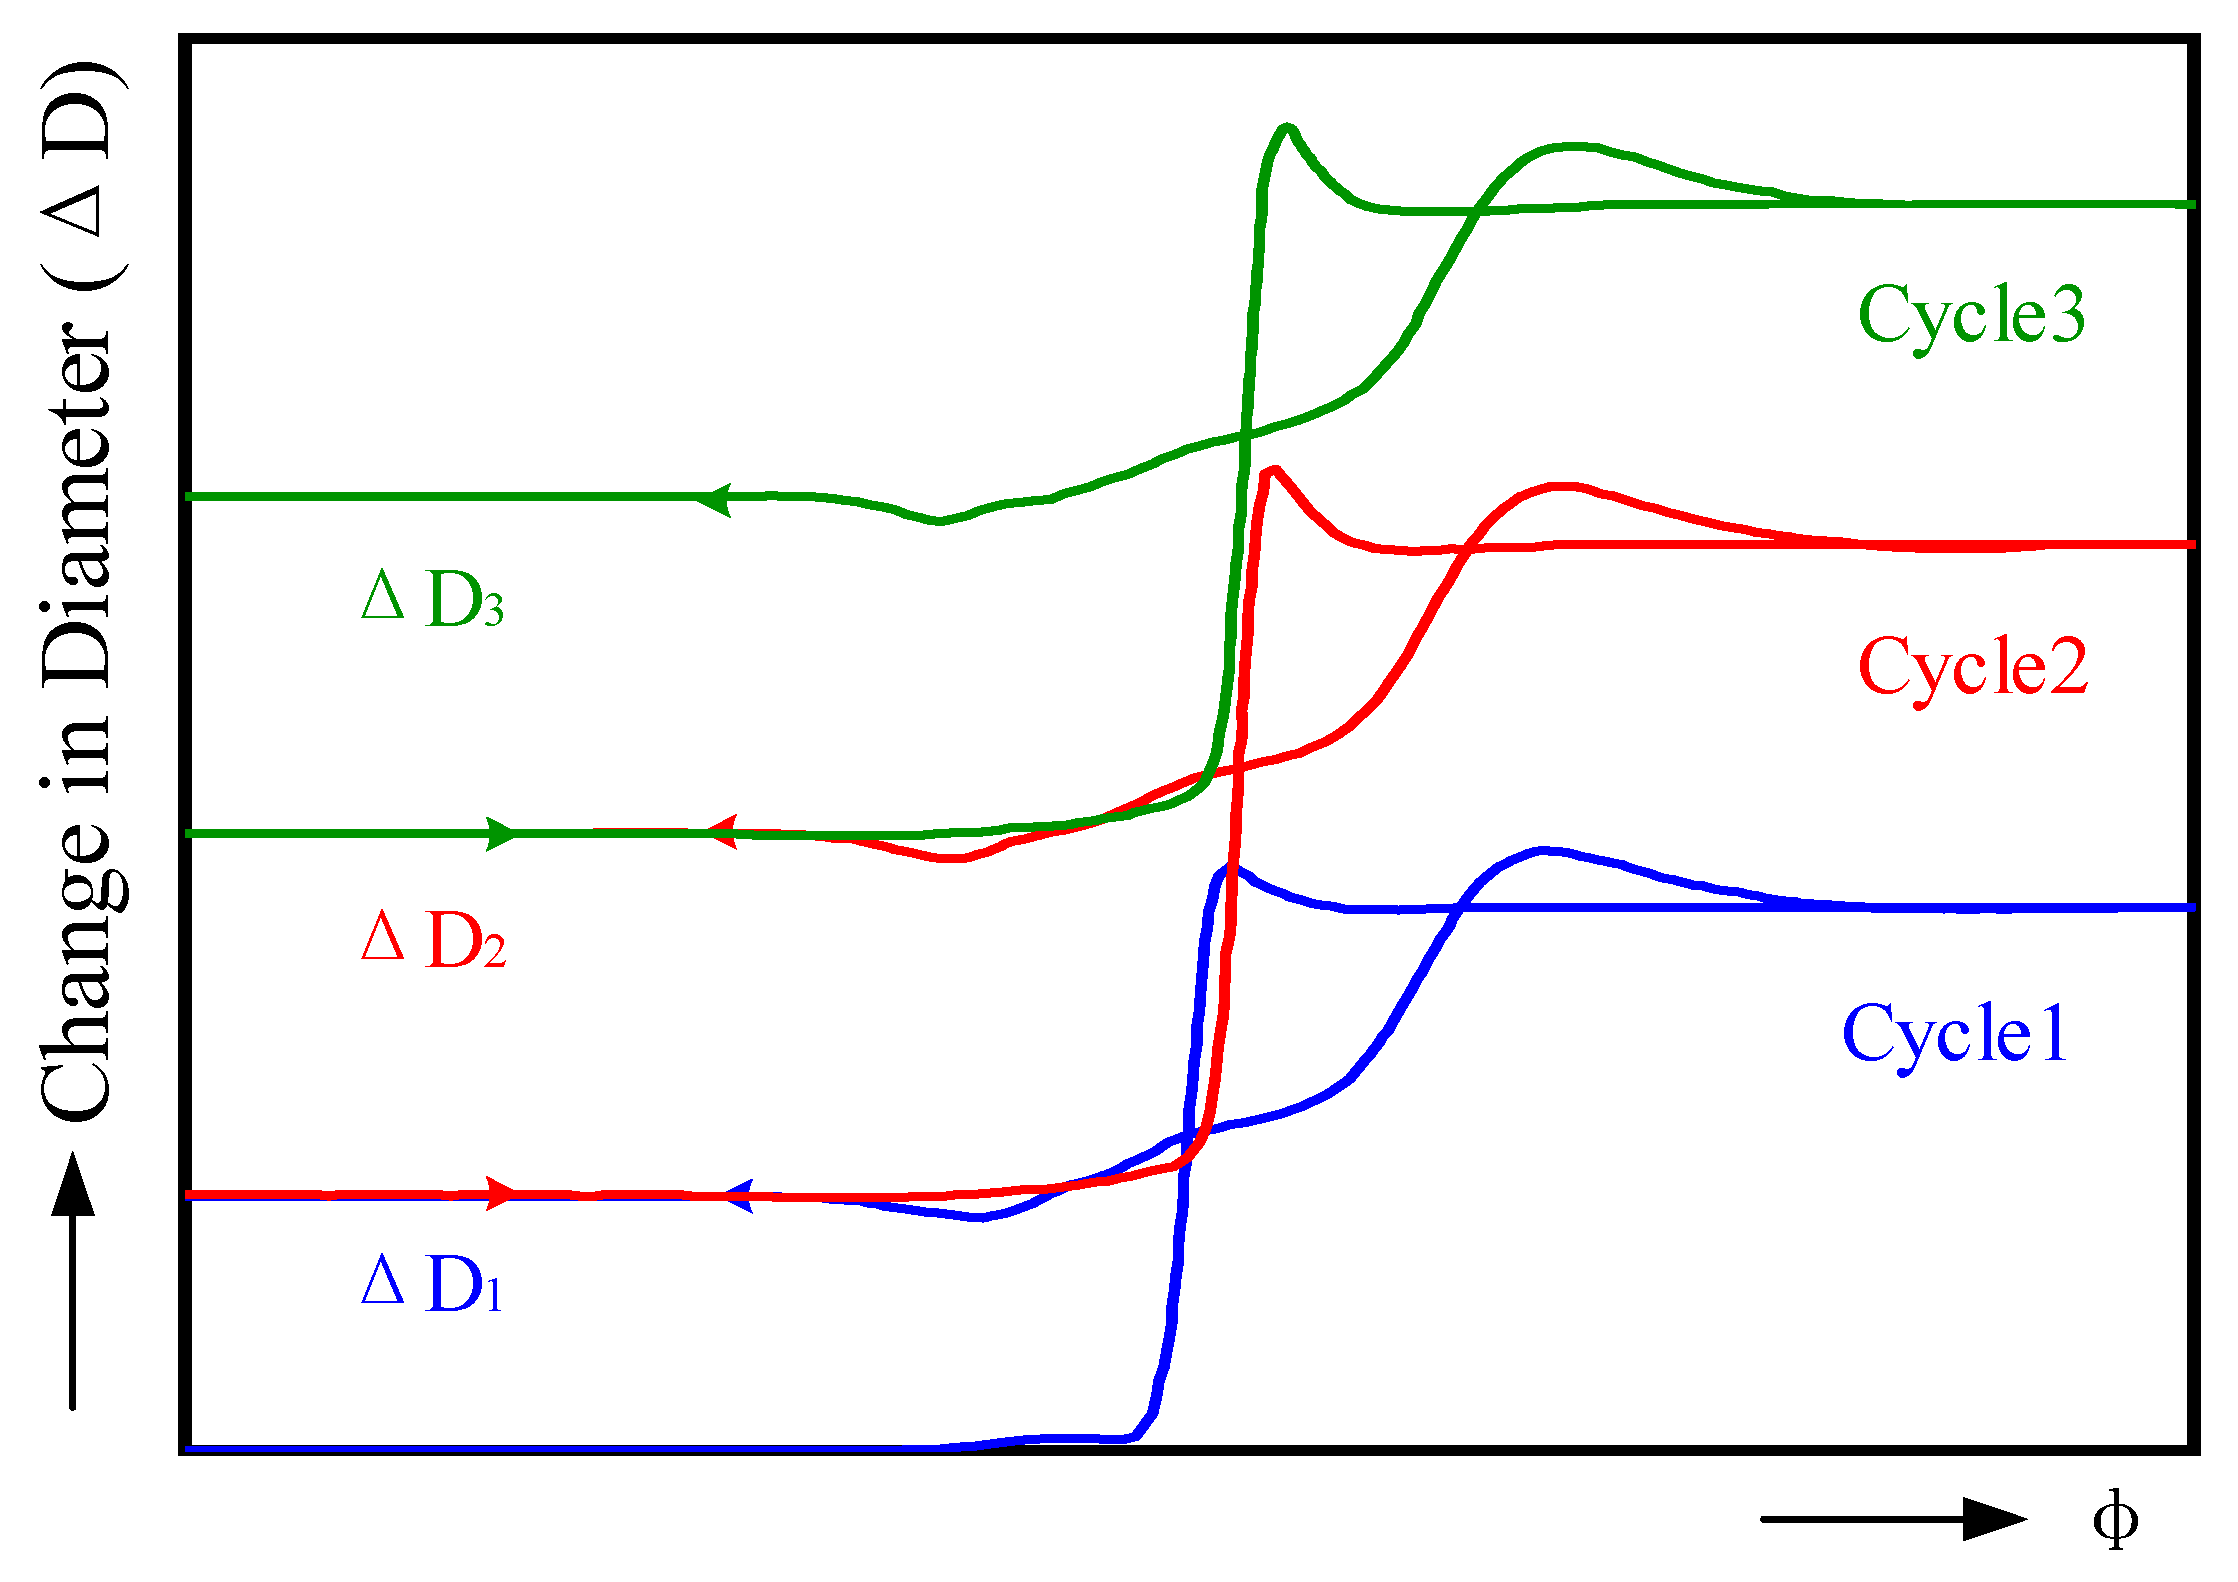
Kyriakides [27] conducted a scaled-down experimental study with a diameter of 1 inch and a diameter-to-thickness ratio of 20 to investigate the relationship between ovality and curvature during the winding and unwinding processes of pipes. The experiments were repeated three times cyclically. Figure 19 illustrates the obtained relationship between ovality and curvature from these experiments. In this paper, utilizing the previously described finite element model, the straightening process is omitted, and three cycles of winding and unwinding simulations are performed. The resulting relationship between ovality and curvature is presented in Figure 20. It is essential to note that there are slight differences in terms of the pipe material and diameter between Kyriakides et al.’s experiments and our study, leading to minor disparities in the results. Nonetheless, the overall trend exhibits a high degree of similarity.
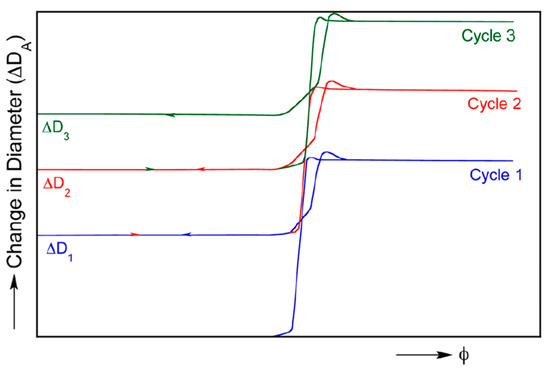
Figure 19.
Experimental cyclic curve of a 1-inch pipeline.

Figure 20.
Simulated cyclic curve of a 6-inch pipeline.
4. Results and Discussion
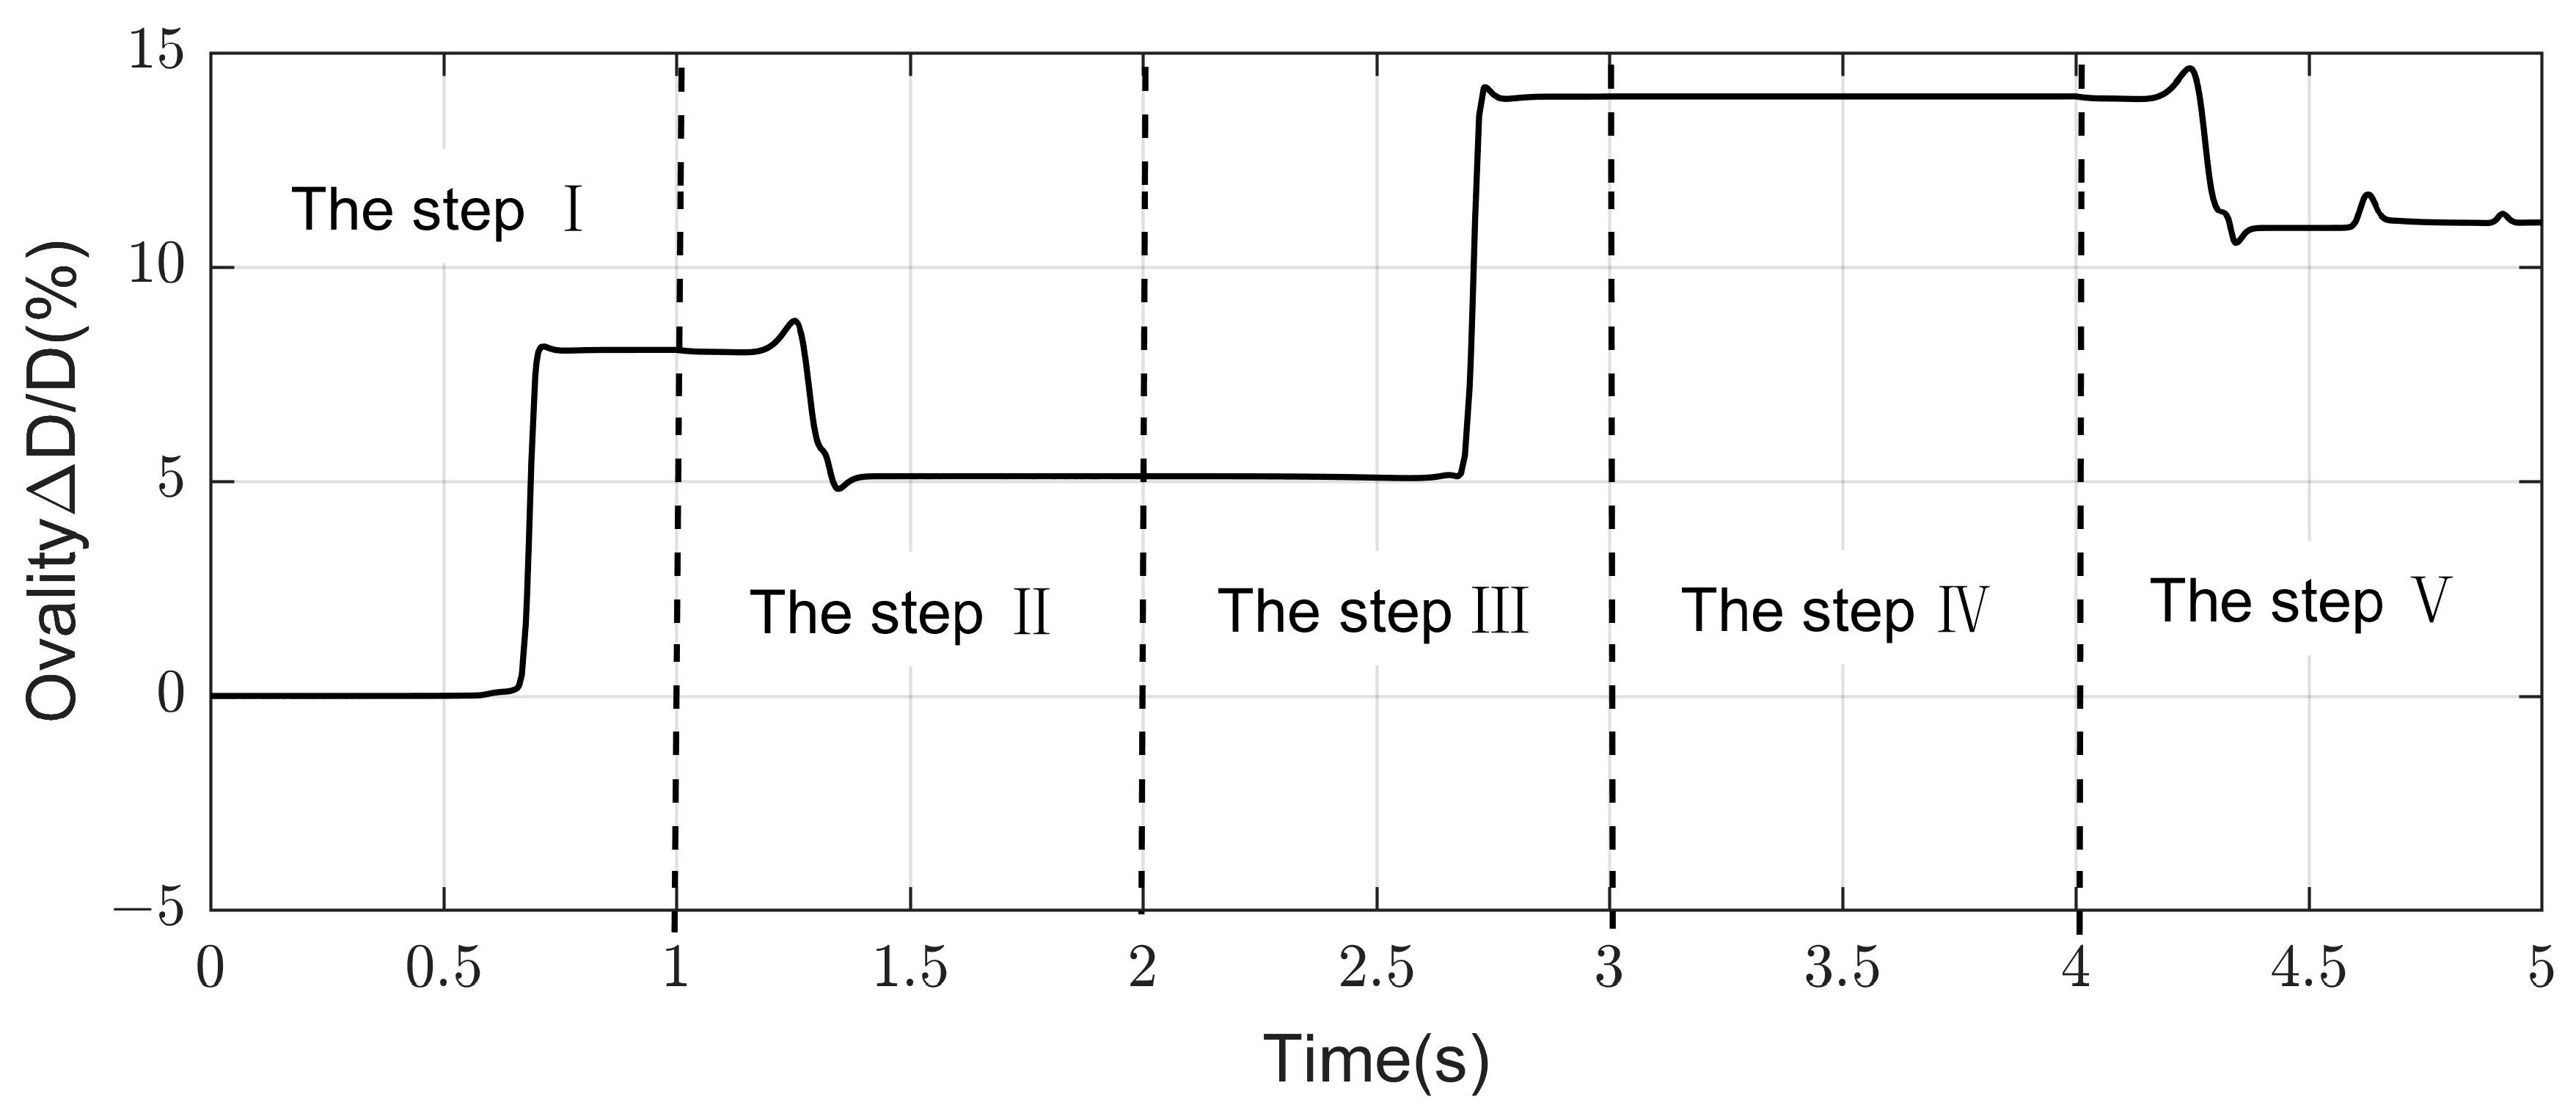
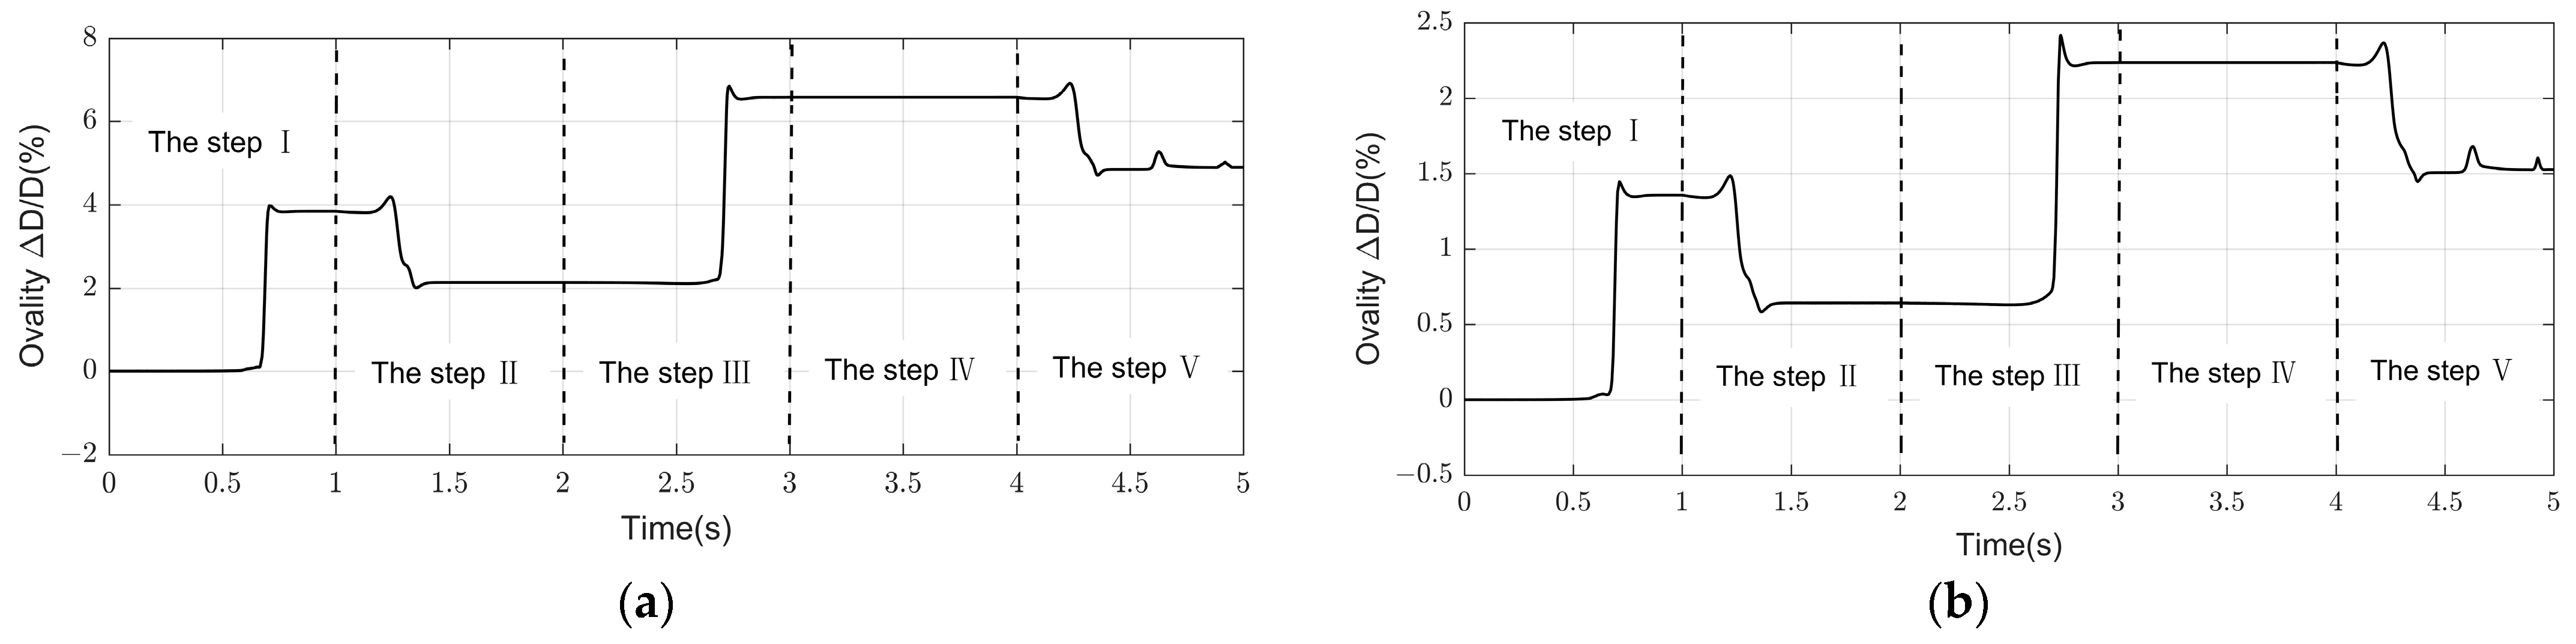
Taking the X65 material with a diameter-to-thickness ratio of 20 as an illustrative case, as illustrated in Figure 21 and Figure 22, the time span from 0 to 1 s corresponds to step I, signifying the process of winding the pipeline onto the reel. The bending moment at section A steadily increases prior to contact with the pipeline, while the ovality exhibits negligible variation during this interval. Upon reaching the reel, both the bending moment and ovality rapidly attain their peak values. Subsequently, following this peak, a transient decay is observed, succeeded by a stable phase. This phenomenon can be attributed to the fact that when the pipeline is entirely wound onto the reel, it experiences the maximum external forces resulting from the combined effects of the reel and the tension at the tail end. This leads to the peak values in the bending moment and ovality at that moment. Once the pipeline is fully wound onto the reel, the influence of tail-end tension and the horizontal component of the reel force gradually diminishes, resulting in a rebound effect within the pipeline. Consequently, the ovality and bending moment marginally decrease and subsequently stabilize. Specifically, the bending moment decreases by 0.04 × 10⁵ N·m, and ovality decreases by 0.07% relative to its peak value. This analytical step underscores the detrimental effect of peak ovality and bending moment at the critical deformation point on the pipeline’s longevity. Furthermore, the gradual decrease in tension at both ends of the pipeline, as observed when the pipeline is fully wound, provides an explanation for the gradual change in ovality near a curvature of 0.25, as discussed in Section 3.
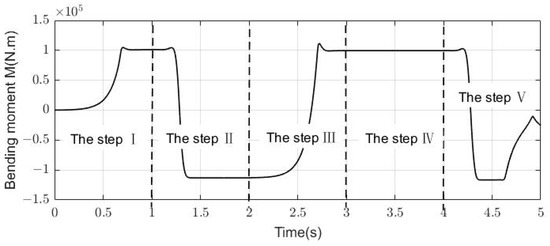
Figure 21.
Bending moment change during pipe reeling.
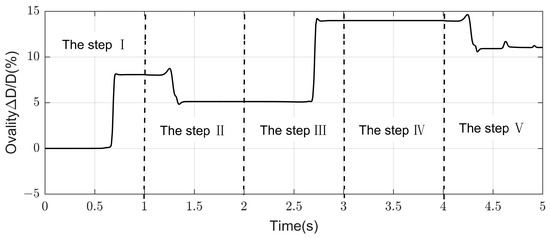
Figure 22.
Ovality change during pipe reeling.
The time span from 1 to 2 s corresponds to the second analytical step, signifying the process of unwinding the pipeline from the reel. During the pre-unwinding transient phase, the ovality and bending moment of the pipeline section remain constant. At the point of departing from the reel, influenced by both the reel and the tension at the tail end, the pipeline is subjected to a substantial external force, resulting in an elevation in the ovality and bending moment to their peak values. The peak comparative stabilization value of the bending moment increased by 0.03 × 10⁵ N·m; the peak stabilization value of ovality increased by 0.68%. Shortly thereafter, section A completely disengages from the reel, and without the reel’s influence, the ovality and bending moment of the pipeline rapidly decrease. The bending moment initially descends to zero and then turns negative due to the straightening effect caused by the tension, resulting in a reverse bending moment of −1.13 × 10⁵ N·m. The ovality of the pipe initially decreases after departing from the reel, then rebounds and remains stable with a rebound rate of −0.28%. This is because the reel compresses the pipeline section during the unwinding process, leading to ovality reduction. Once the section completely disengages from the reel, the reel force diminishes, causing a slight pipeline rebound, resulting in a minor ovality increase. This analytical step clarifies the occurrence of irreversible plastic deformation in the pipeline and the inevitability of encountering peak forces at the critical deformation point.
The time span from 2 to 3 s corresponds to step Ⅲ, representing the simulation of the pipeline entering a calibrator with a radius equal to that of the winding reel. Upon contact with the calibrator, the bending moment and ovality rapidly surge, resembling the peak observed in step 1. Following a brief duration, both parameters subside and reach stability once the pipeline is completely within the calibrator. This analytical step reveals that the mentioned peaks arise at distinct critical points during the process.
It is important to highlight that, in comparison to the initial winding (step Ⅰ), following one curling process, the stabilized bending moment of the second pipeline section during the second winding (step III) decreased by 0.02 × 10⁵ N·m. The stabilized ovality increased by 8.87% when compared to the stabilized value after unwinding. Conversely, the stabilized value of the first section increased by 8.08% compared to its state before the curling process. This suggests that the pipeline’s resistance to deformation has somewhat diminished after a single winding and unwinding cycle.
The time span from 3 to 4 s corresponds to step Ⅳ, which is the preparation process and is unrelated to the simulation data.
The time span from 4 to 5 s corresponds to step Ⅴ, which encompasses the pipeline’s passage through the straightening device and tensioning device subsequent to exiting the calibrator. As the pipeline exits the calibrator, the variations in bending moment and ovality mirror a pattern akin to the unwinding process observed in the second analytical step (1–2 s). The bending moment reaches its zenith and subsequently diminishes until it reaches a stable reverse bending moment of −1.17 × 10⁵ N·m. The ovality peaks, experiences a subsequent decline, and then demonstrates a slight rebound, remaining constant with a rebound rate of −0.3%. The residual ovality increases after reaching stabilization. When the pipeline traverses the straightening device, its behavior bears semblance to the curving process during the winding operation but exhibits distinct characteristics. The bending moment approaches zero during the straightening process, undergoes a brief rebound upon completion, and eventually stabilizes. The cross-sectional ovality exhibits two peaks as the pipe enters and exits the straightener, yet the change in value before and after is minimal. This observation underscores that the impact on cross-sectional ovality is negligible before and after the pipe undergoes buckling changes in the case of a large radius of curvature.
In contrast to the initial unwinding process (step Ⅱ), the stable value of the reverse bending moment during the second unwinding process (step Ⅴ) is smaller. However, the increase in the peak bending moment upon exiting the calibrator remains consistent, at 0.03 × 10⁵ N·m. Likewise, the increase in the ovality’s peak value upon exiting the calibrator is also comparable, and the rebound rate before reaching stability is nearly identical.
Combined with the comparison of step Ⅰ and step Ⅱ with step Ⅲ and step Ⅴ, it is evident that different winding stages in R-lay have a significant impact on the pipeline. This impact is particularly noticeable during the winding stages, primarily evidenced by the reverse bending moment and residual ovality observed at the onset of the second cycle. Furthermore, the second winding stage displays more significant fluctuations in the ovality and bending moment peak values. In contrast, the two unwinding stages exhibit a considerable overlap in their peak values, suggesting a lesser impact on these stages.
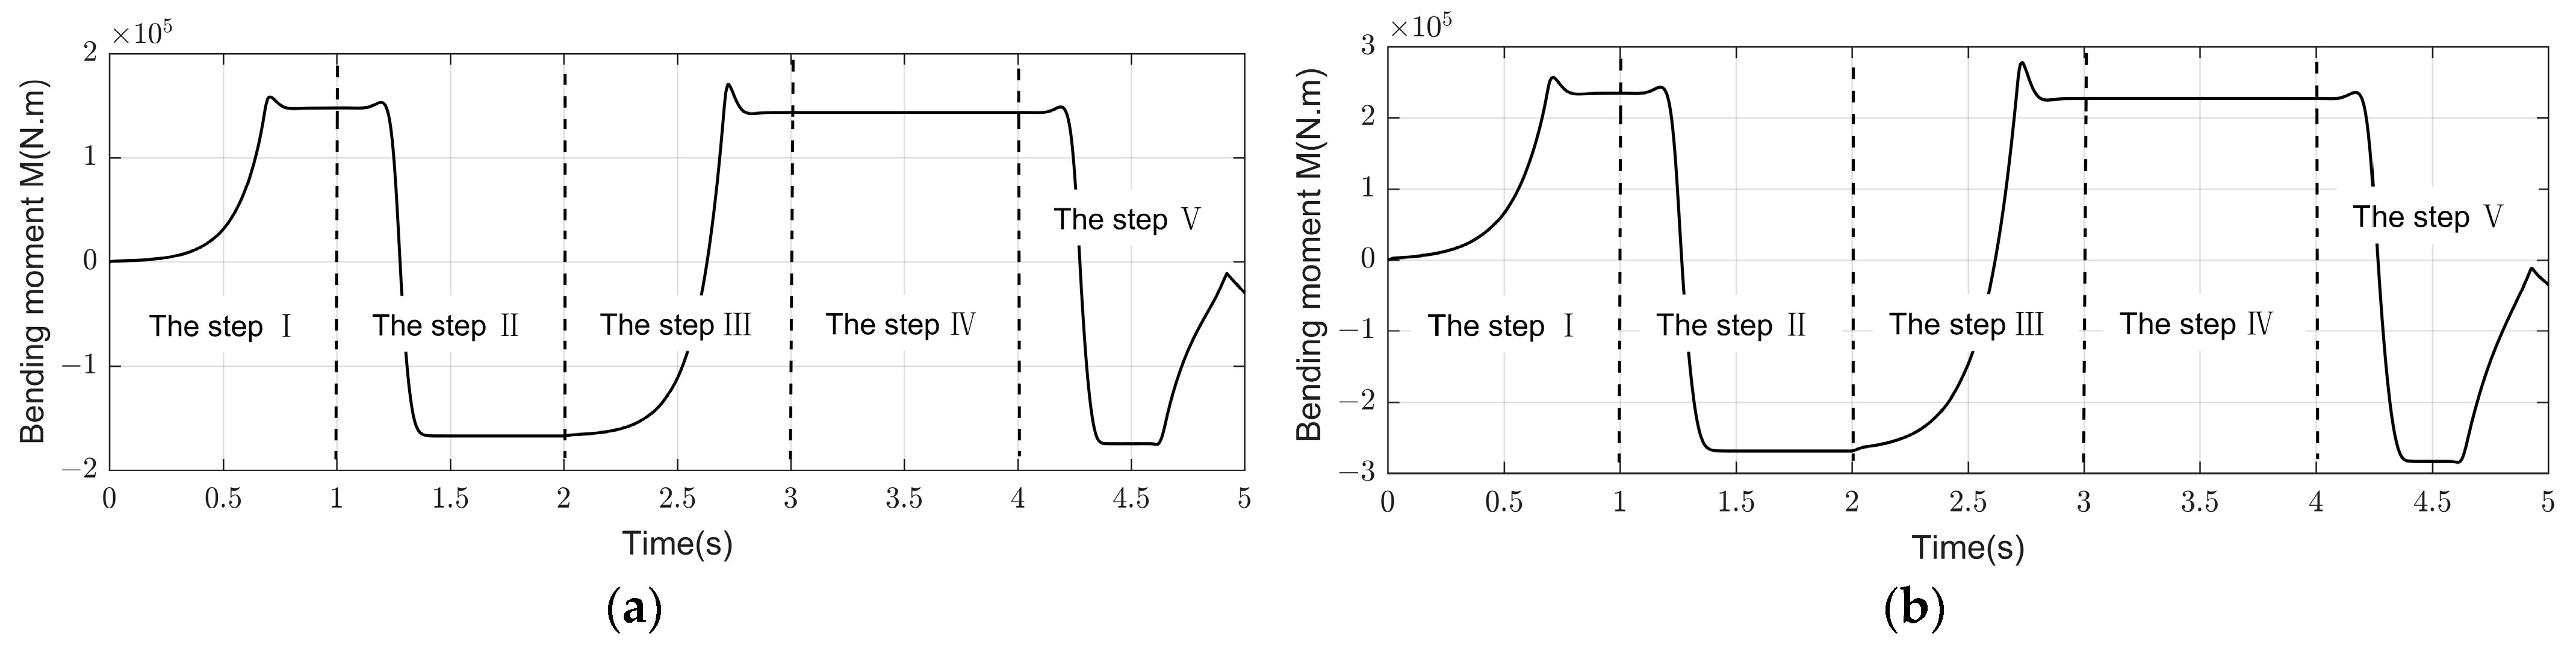
As shown in Figure 23 and Figure 24, the bending moment and ovality dynamic response curves for diameter–thickness ratios of 15 and 10 are examined. Comparisons are made between the first and second analysis steps, as well as the third and fifth analysis steps, to validate the aforementioned conclusions. The results indicate that the pipeline experiences peak values at critical points during winding and unwinding, and these peak values vary during different phases of the winding process. However, the impact during the unwinding stage is minimal. This pattern holds true across various pipe materials, demonstrating high data repeatability. Further elaboration is unnecessary.
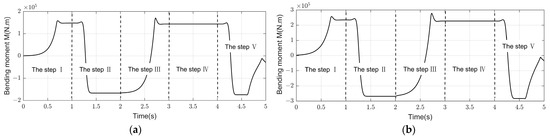
Figure 23.
Bending moment changes during reeling of pipes: (a) pipe diameter-to-thickness ratio of 15; (b) pipe diameter-to-thickness ratio of 10.
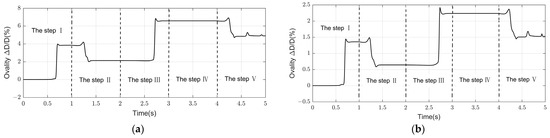
Figure 24.
Ovality changes during reeling of pipes: (a) pipe diameter-to-thickness ratio of 15; (b) pipe diameter-to-thickness ratio of 10.
As illustrated in Figure 25, the relationship between curvature and the bending moment can be segmented into four stages, with winding and unwinding processes displaying contrasting trends. Notably, there is an observable “delay” in the response during the straightening process, which can be attributed to the positions of the calibrator and straightener. Throughout each stage, there is a notable resemblance between curvature and bending moment, particularly during the winding and unwinding processes. The distinction within the winding stage becomes evident in the reverse bending moment, while the unwinding stage exhibits a significant overlap. These observations further corroborate the previously mentioned conclusions.
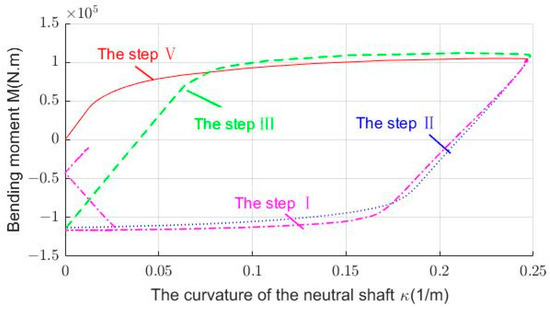
Figure 25.
Variation in bending moment with curvature.
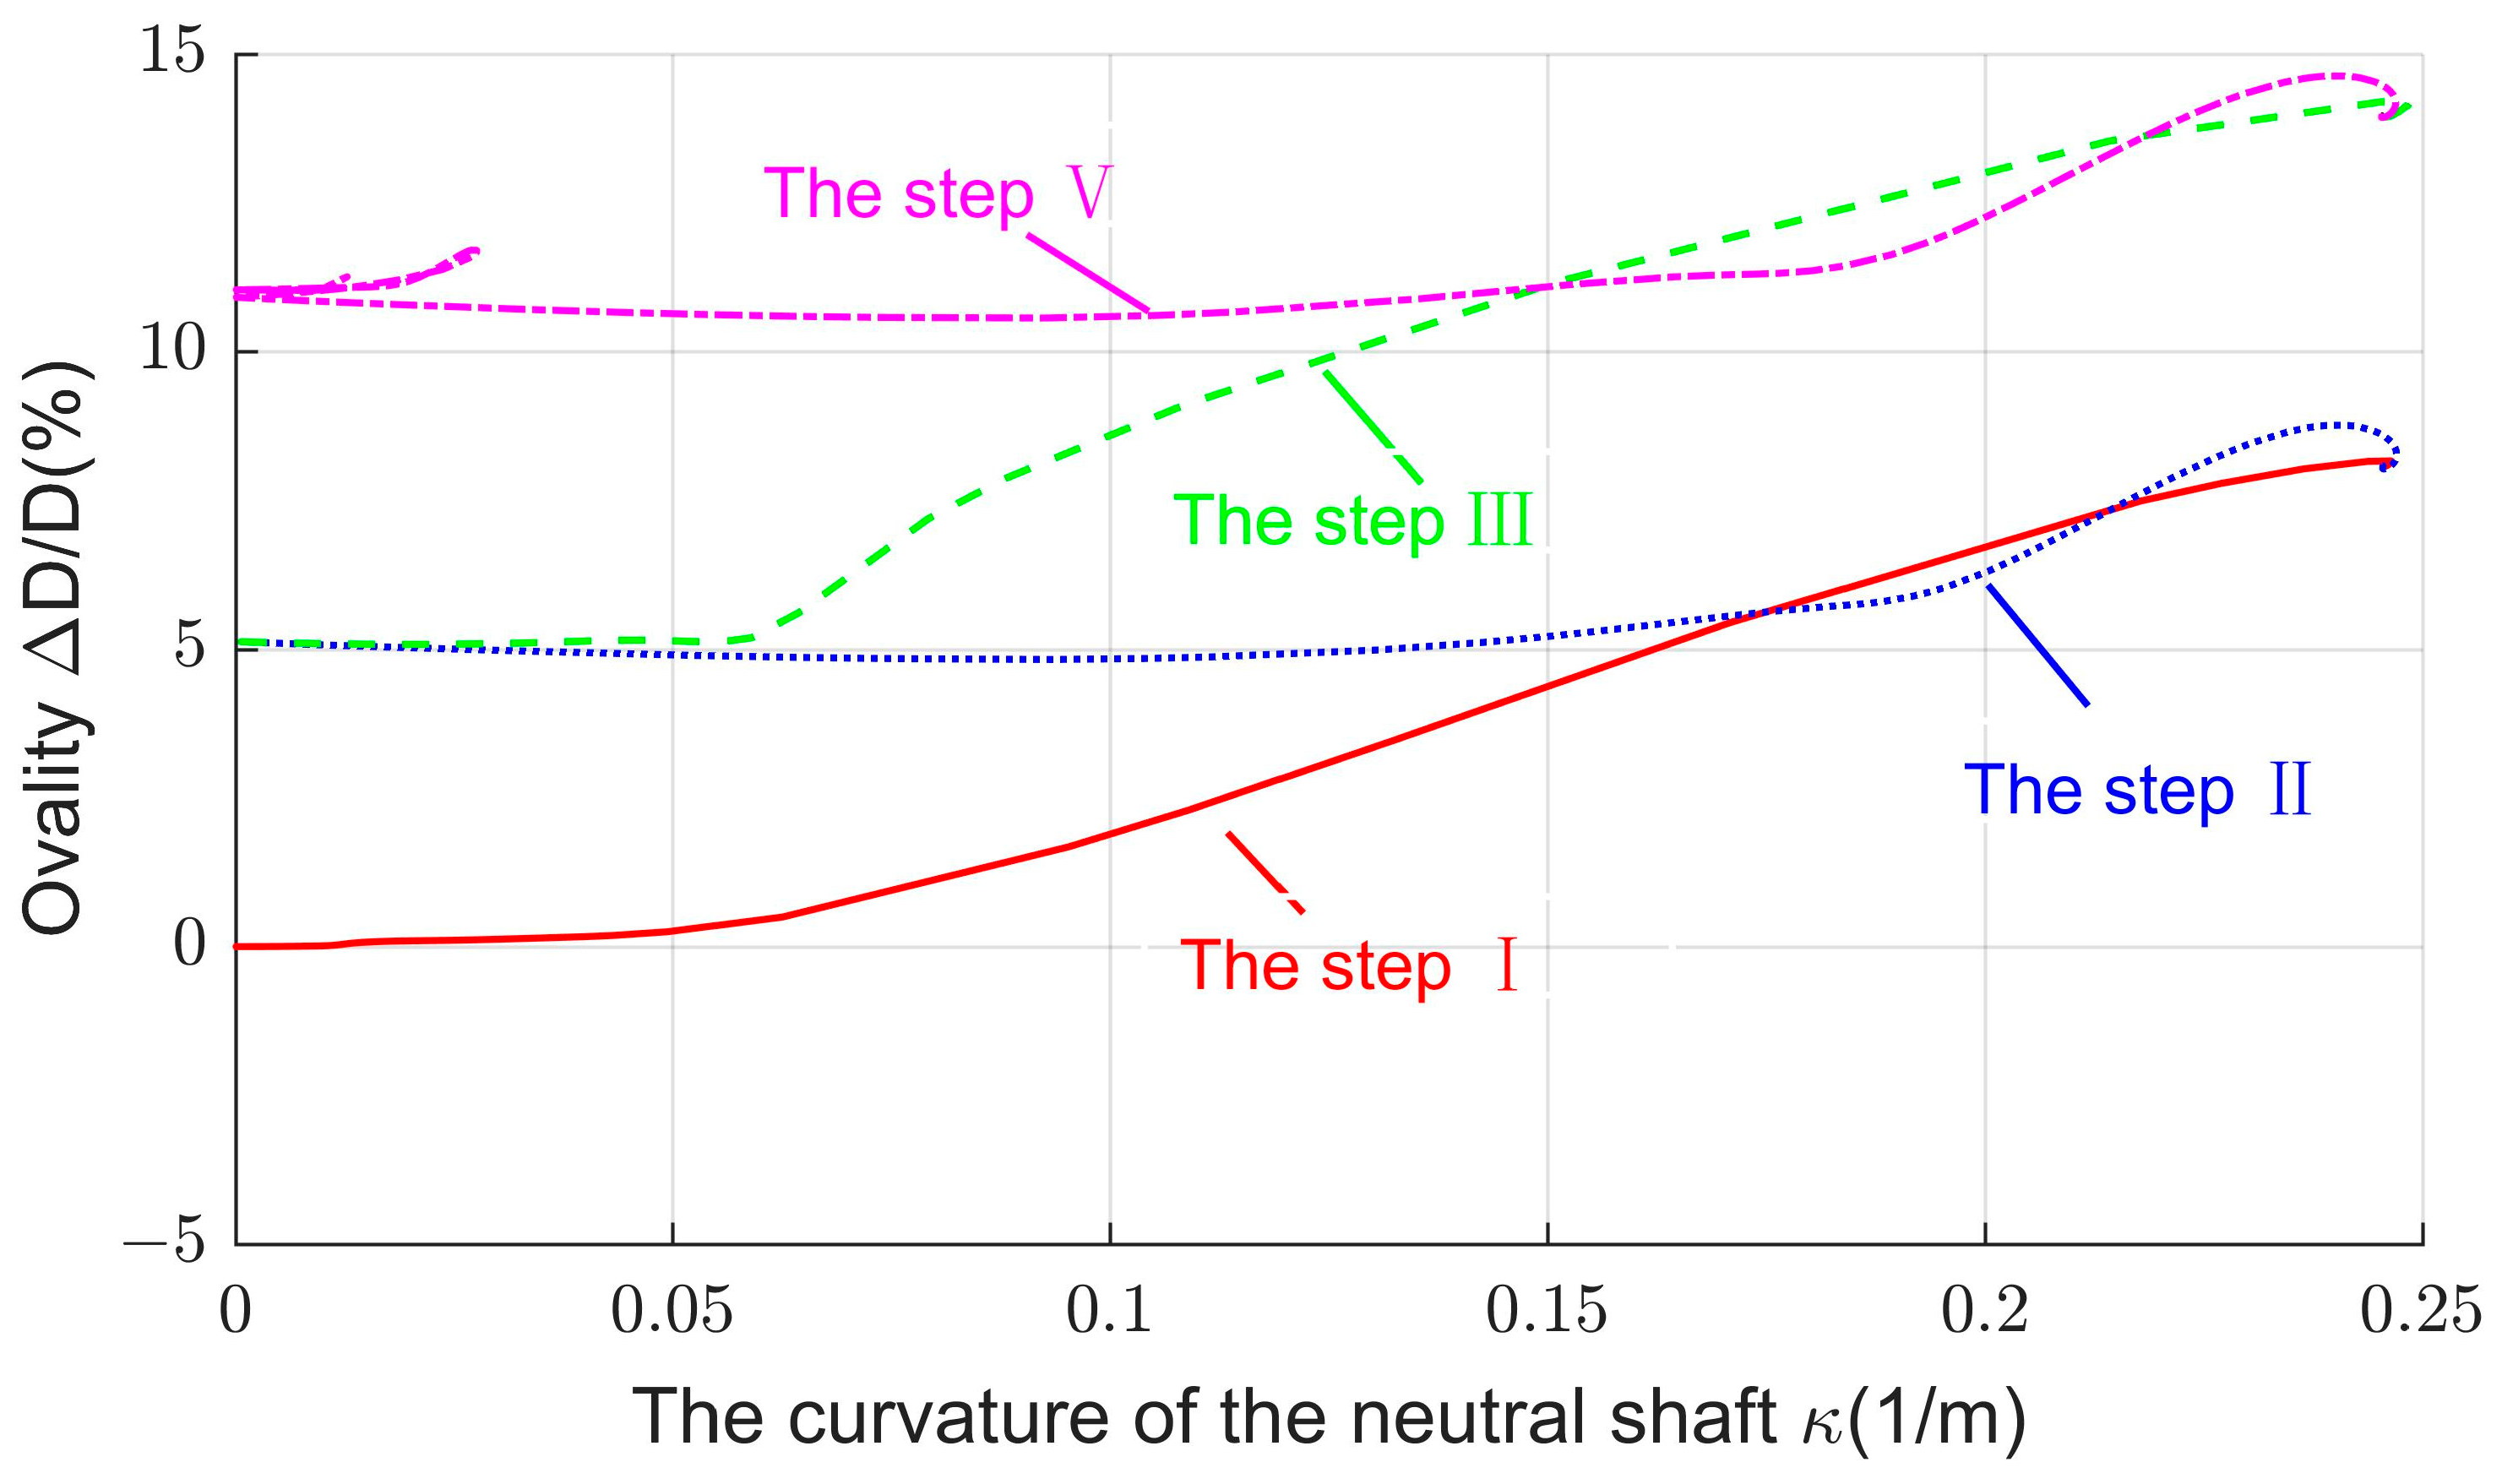
As shown in Figure 26, the winding and unwinding processes corresponding to the first and second analysis steps, as well as the third and fifth analysis steps, exhibit a significant overall similarity, except for the influence of residual ovality and the numerical differences mentioned earlier. The curve following the fifth analysis step represents the straightening stage, characterized by smaller magnitude changes but following a similar trend to the previous analysis steps. The specific response relationship is influenced by the spatial positions of the straightener and tensioner.

Figure 26.
Variation in ovality with curvature.
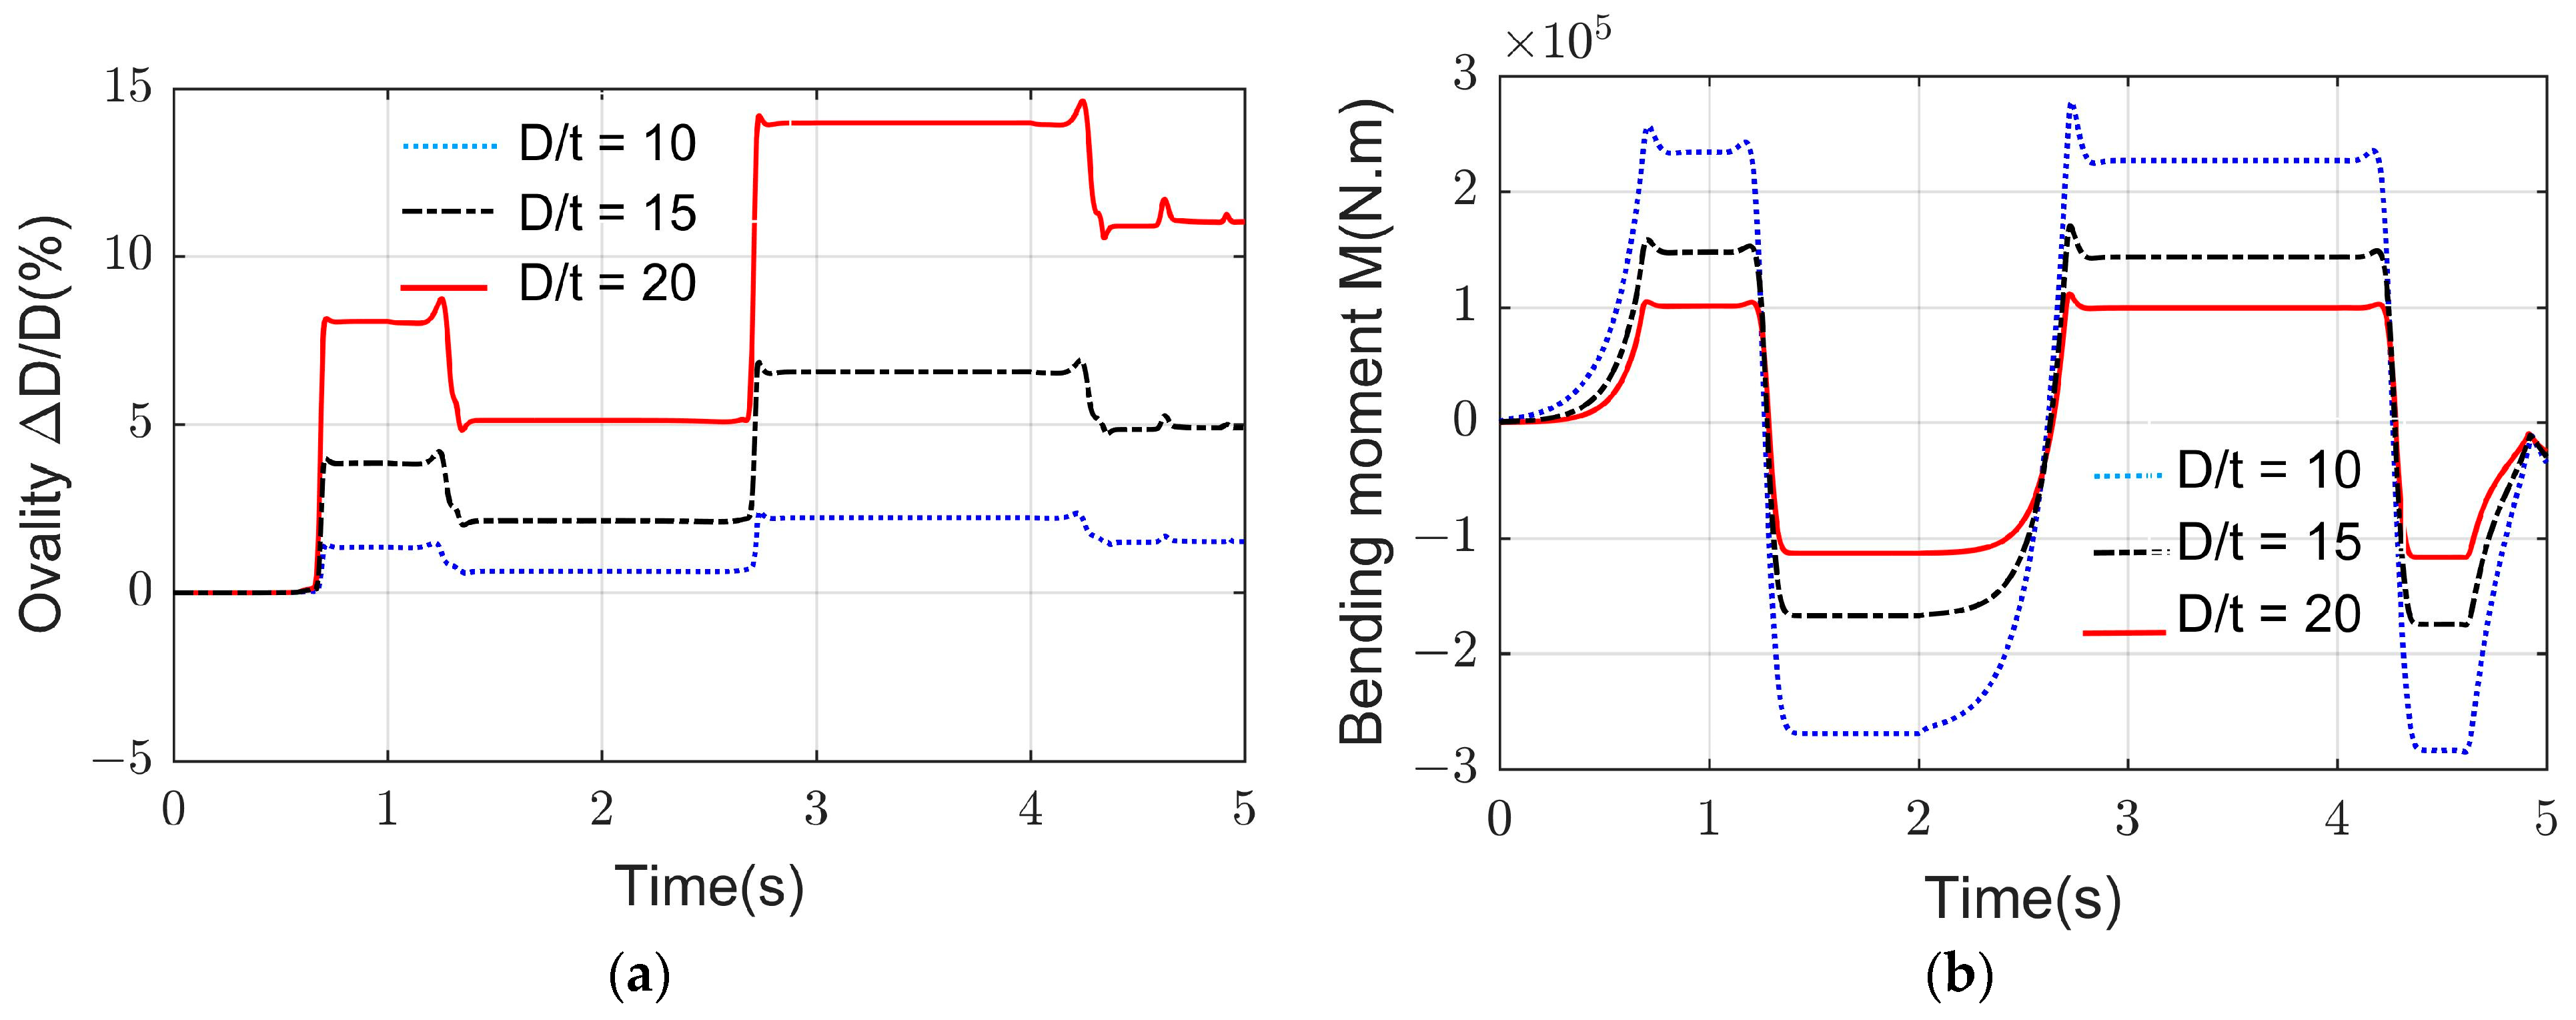
As shown in Figure 27 and Figure 28, where D/t represents the ratio of the pipe diameter to wall thickness, it becomes evident that pipes with a D/t ratio of 10 exhibit the least variation in ovality during the winding process, while pipes with a D/t ratio of 20 display the most significant variation, reaching maximum values of 2.34% and 14.3%, respectively. This trend highlights that as the D/t ratio increases, the ovality of the pipes also increases. Notably, when the D/t ratio reaches 20, the ovality surpasses the range stipulated by DNV standards, rendering the pipes unsuitable for laying operations. Conversely, at any given moment throughout the winding and laying process, pipes with a D/t ratio of 20 experience the lowest bending moment, whereas pipes with a D/t ratio of 10 endure the highest bending moment. This observation suggests that pipes with a higher D/t ratio require less bending moment for deformation.
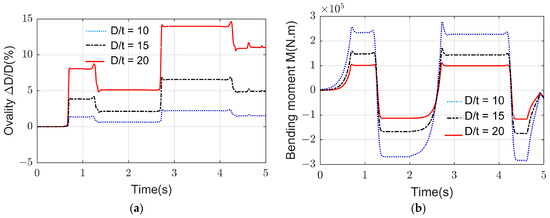
Figure 27.
(a) Effect of D/t on ovality during pipe reeling; (b) effect of D/t on bending moment during pipe reeling.
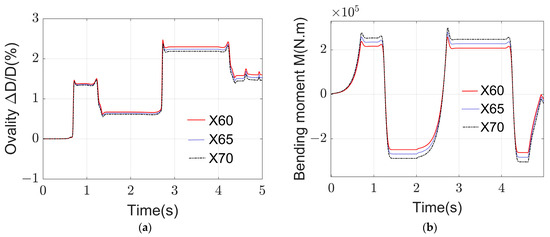
Figure 28.
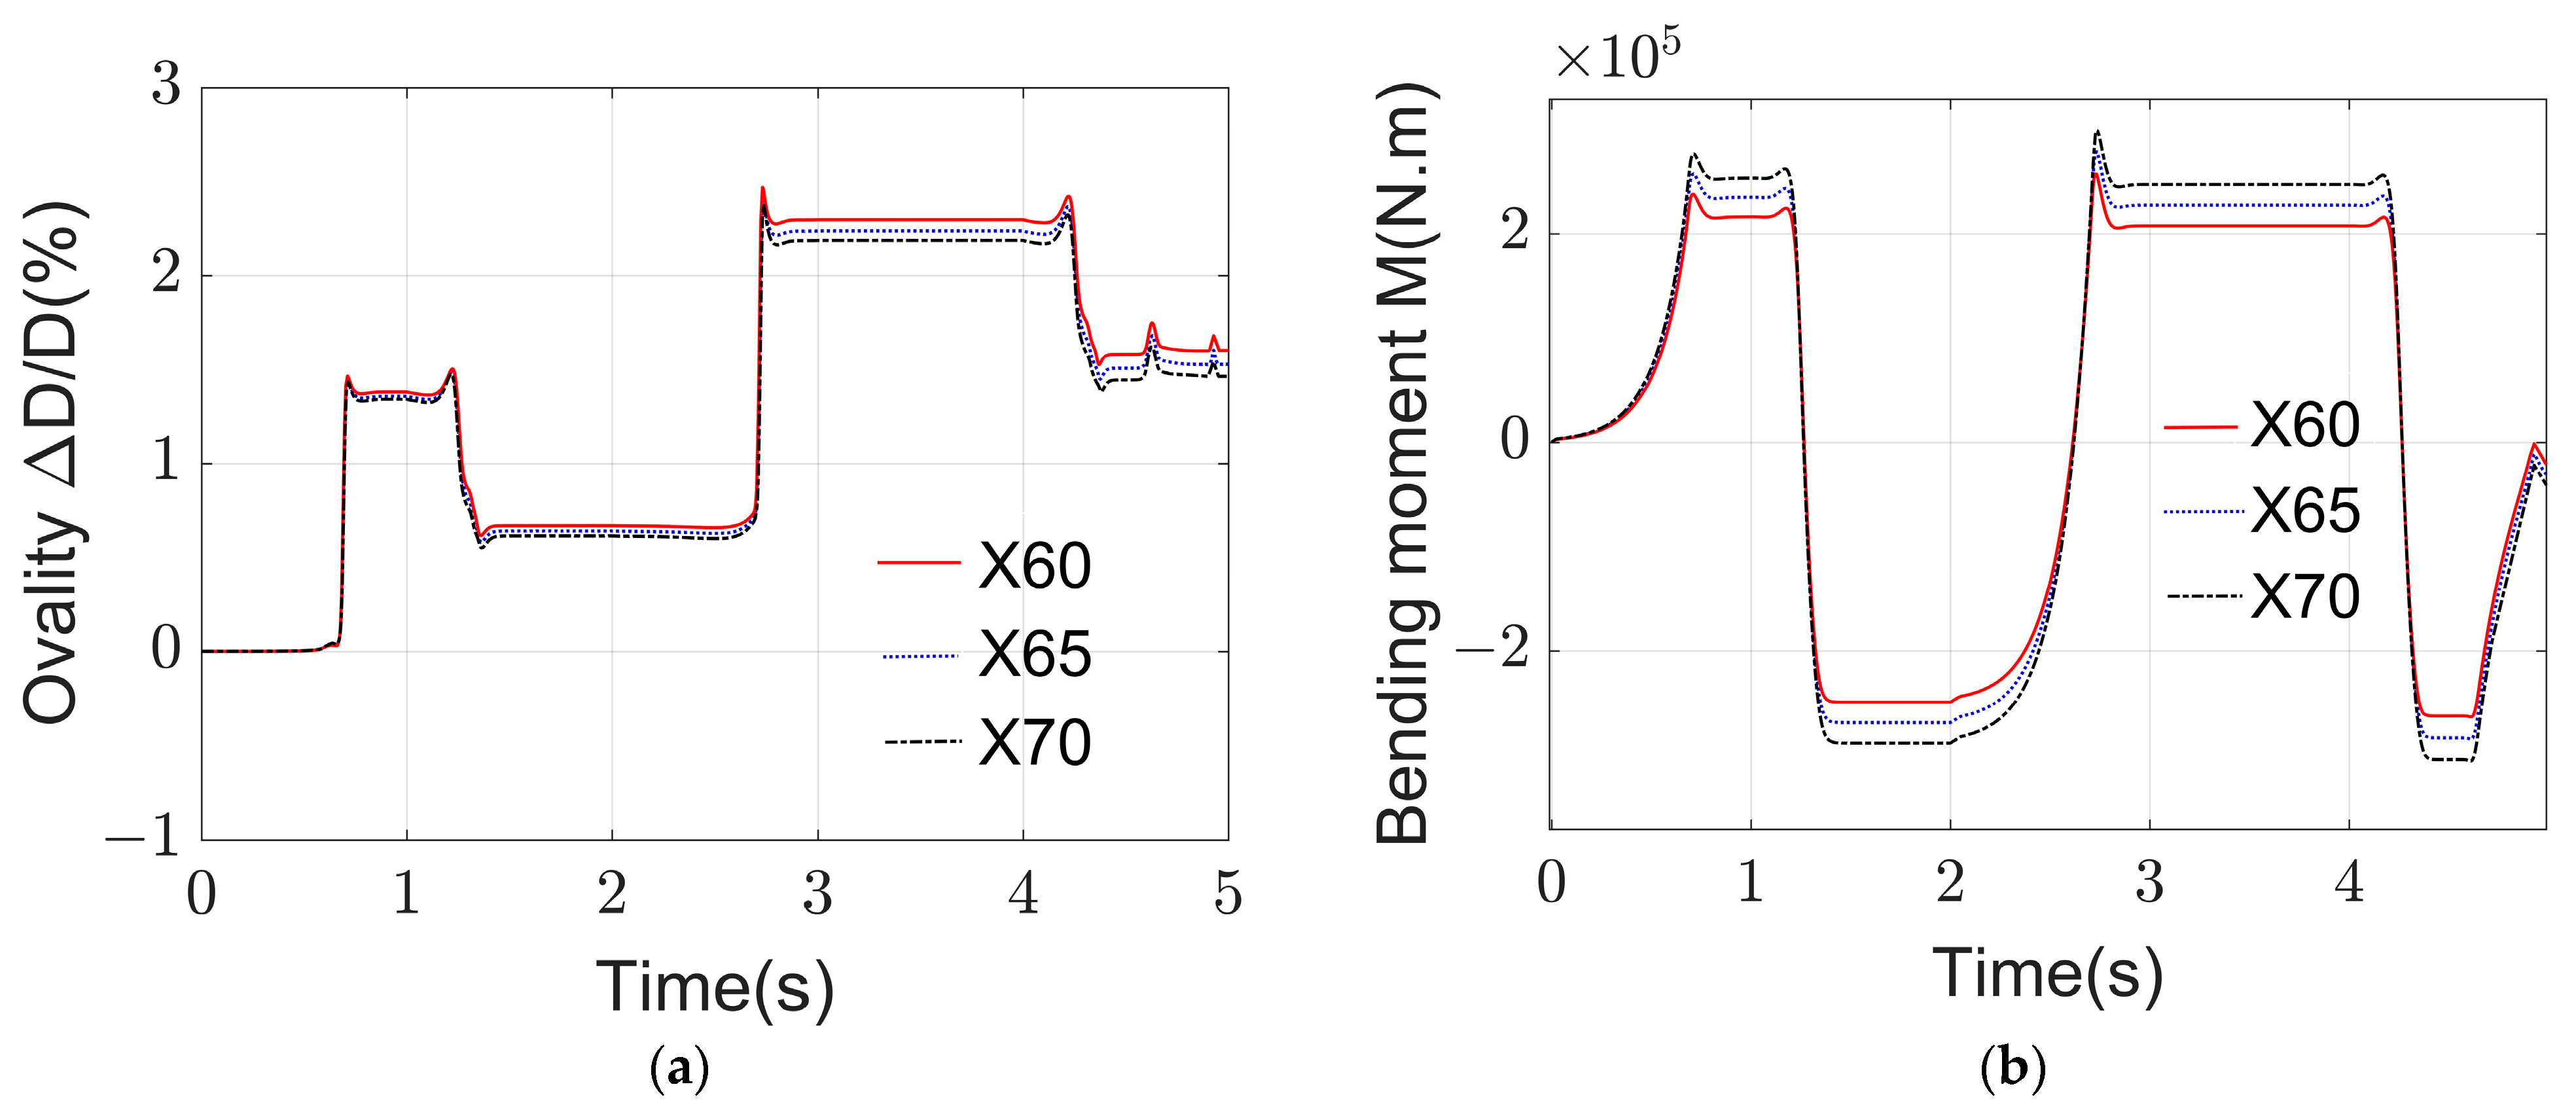
(a) Effect of yield strength on ovality during pipe reeling; (b) effect of yield strength on bending moment during pipe reeling.
As the yield strength increases, the ovality of pipes made of X70 material exhibits the least change during the reeling process, while the ovality of X60 material pipes undergoes the most significant alteration, reaching maximum values of 2.38% and 2.47%, respectively. This implies that pipe ovality decreases with increasing yield strength. Conversely, during any point of winding and laying, pipes made of X70 material experience the highest bending moment, whereas X60 material pipes endure the lowest bending moment. This suggests that an increase in yield strength results in a greater bending moment requirement for pipe deformation.
As shown in Figure 28, it is demonstrated that the material has a peak pattern for the emergence of different curling phases, as previously mentioned.
5. Conclusions
In this paper, a multi-analysis step simulation model simulating the whole process of R-lay laying is established using finite element software, and the accuracy of the finite element model is verified using theoretical analysis and a comparison of the finite element results. Using this established finite element model, the dynamic responses of the ovality and bending moments during the pipelaying process are investigated. And the nonlinear relationship between these variables and curvature is explored, as well as the impact of the pipe diameter–thickness ratio and material parameters on the dynamic responses of section ovality and bending moments during winding. The findings of the analysis are summarized as follows:
- The dynamic responses of pipeline bending moments and ovality during the winding process are intricately linked to curvature. Different buckling stages, whether occurring at the same curvature or different curvatures, exert a substantial influence on these responses. The dynamic response of these parameters does not exhibit a simple linear increase with bending curvature. Instead, it is characterized by a slow response prior to contact with the reel, followed by a rapid change in response during contact. A brief peak is observed at the critical point where the pipe undergoes winding and unwinding deformation. Subsequent to a buckling event, the pipe retains residual ovality and a reverse bending moment, which impacts the peak at the deformation critical point. This influence is primarily evident during the winding stage and has minimal effect during the unwinding stage.
- The material’s yield strength exerts a significant impact on the dynamic response of pipelines when employing the R-lay method. As the yield strength increases, the bending moment experienced during pipelaying at a given moment becomes greater, while ovality decreases. In essence, a higher yield strength enhances the pipeline’s ability to withstand bending moments.
- The ratio of the pipe diameter to thickness exerts a substantial influence on the dynamic response of pipeline laying using the R-lay method. As the diameter to thickness ratio of the pipeline increases, the bending moment experienced during pipeline laying at a given moment decreases, while the ovality increases. In other words, a higher diameter to thickness ratio signifies a reduced ability to withstand bending moments. Additionally, the impact of ovality will persist and accumulate, underscoring the need to control the frequency of pipe bucklings to ensure performance.
The analysis and investigation of the dynamic responses of pipeline bending moments and ovality in the process of R-lay-method pipelaying presented in this paper hold substantial importance in preventing pipeline collapse and refining laying scheme designs. In the future, it is imperative to delve deeper into addressing peak-related issues by further optimizing the finite element simulation approach. Additionally, there is a need to integrate other factors, such as ocean currents and temperature, into the research agenda during wind-based laying. This effort aims to furnish an effective and rational theoretical foundation for pipeline laying technology.
Author Contributions
Conceptualization, F.Y.; methodology, H.C. and Y.J.; software, M.J. and X.C.; validation, L.W.; formal analysis, H.C. and Y.J.; investigation, X.C. and M.Z.; resources, F.Y. and Y.J.; data curation, M.J. and M.Z.; writing—original draft preparation, M.J. and Y.J.; writing—review and editing, H.C. and Y.J.; funding acquisition, F.Y. All authors have read and agreed to the published version of the manuscript.
Funding
This research was funded by China Postdoctoral Science Fund, grant number 2023M734086; National Natural Science Foundation of Heilongjiang Province, grant number YQ2020E033.
Institutional Review Board Statement
Not applicable.
Informed Consent Statement
Not applicable.
Data Availability Statement
Data sharing not applicable.
Conflicts of Interest
The authors declare no conflict of interest.
References
- Li, Z.G.; Wang, C.; He, N.; Zhao, D.Y. An Overview of Deepwater Pipeline Laying Technology. China Ocean. Eng. 2008, 22, 521–532. [Google Scholar]
- Endal, G.; Giske, S.R.; Moen, K.; Sande, S. Reel-lay method to control global pipeline buckling under operating loads. In Proceedings of the 33rd ASME International Conference on Ocean, Offshore and Arctic Engineering, San Francisco, CA, USA, 8–13 June 2014. [Google Scholar]
- Bruschi, R.; Vitali, L.; Marchionni, L.; Parrella, A.; Mancini, A. Pipe technology and installation equipment for frontier deep water projects. Ocean Eng. 2015, 108, 369–392. [Google Scholar] [CrossRef]
- Sriskandarajah, T.; Rao, V. Predictive residual ovality for reel-laid pipelines in deepwater. In International Conference on Offshore Mechanics and Arctic Engineering: American Society of Mechanical Engineers; American Society of Mechanical Engineers: New York, NY, USA, 2015; p. V05BT04A031. [Google Scholar]
- Brazier, L.G. On the flexure of thin cylindrical shells and other “thin” sections. Proc. R. Soc. London. Ser. A, Math. Phys. Sci. 1927, 116, 104–114. [Google Scholar]
- Ades, C. Bending Strength of Tubing in the Plastic Range. J. Aerosol. Sci. 1957, 24, 605. [Google Scholar] [CrossRef]
- Reissner, E.; Weinitschke, H. Finite pure bending of circular cylindrical tubes. Q. Appl. Math. 1963, 20, 305–319. [Google Scholar] [CrossRef]
- Kyriakides, S.; Shaw, P. Inelastic buckling of tubes under cyclic bending. J. Press. Vessel. Technol. 1987, 109, 169–178. [Google Scholar] [CrossRef]
- Poonaya, S.; Teeboonma, U.; Thinvongpituk, C. Plastic collapse analysis of thin-walled circular tubes subjected to bending. Thin-Walled Struct. 2009, 47, 637–645. [Google Scholar] [CrossRef]
- Thinvongpituk, C.; Poonaya, S.; Choksawadee, S.; Lee, M. The ovalisation of thin-walled circular tubes subjected to bending. In Proceedings of the World Congress on Engineering, London, UK, 2–4 July 2008; pp. 2–4. [Google Scholar]
- Li, L.; Shen, Z.X.; Wang, P. Mechanism Study on the Coiled Tubing Deformation under a Combination Loading. In Proceedings of the International Conference on Mechatronics and Materials Processing (ICMMP 2011), Guangzhou, China, 18–20 November 2011; pp. 1528–1532. [Google Scholar]
- Azadeh, M.; Taheri, F. On the response of dented stainless-steel pipes subject to cyclic bending moments and its prediction. Thin-Walled Struct. 2016, 99, 12–20. [Google Scholar] [CrossRef]
- Lian, Y.; Lu, H.; Ma, M.; He, J.; Liu, Q.; Cheng, Q.; Qiao, Y. Straightening process of straight metal pipe considering the flattening effect. In Proceedings of the 14th ASME International Manufacturing Science and Engineering Conference, Erie, PA, USA, 10–14 June 2019. [Google Scholar]
- Tawns, A. Reel-laying of rigid pipelines. Mater. Perform. 2004, 43, 24–26. [Google Scholar]
- Martinez, M.; Brown, G. Evolution of pipe properties during reel-lay process: Experimental characterisation and finite element modelling. In Proceedings of the 24th International Conference on Offshore Mechanics and Arctic Engineering, Halkidiki, Greece, 12–17 June 2005; pp. 419–429. [Google Scholar]
- Gong, S.F.; Yuan, L.; Jin, W.L. Buckling response of offshore pipelines under combined tension, bending, and external pressure. J. Zhejiang Univ. -Sci. A 2011, 12, 627–636. [Google Scholar] [CrossRef]
- Manouchehri, S. A discussion of practical aspects of reeled flowline installation. In Proceedings of the 31st ASME International Conference on Ocean, Offshore and Arctic Engineering, Rio de Janeiro, Brazil, 1–6 July 2012; pp. 531–542. [Google Scholar]
- Meissner, A.; Erdelen-Peppler, M.; Schmidt, T. Impact of Reel-Laying on Mechanical Pipeline Properties Investigated by Full- and Small-Scale Reeling Simulations. Int. J. Offshore Polar Eng. 2012, 22, 282–289. [Google Scholar]
- Guo, L.; Yang, S.; Jiao, H. Behavior of thin-walled circular hollow section tubes subjected to bending. Thin-Walled Struct. 2013, 73, 281–289. [Google Scholar] [CrossRef]
- Shitamoto, H.; Hisamune, N. Effect of full- and small-scale reeling simulation on mechanical properties of weldable 13CR seamless line pipe. In Proceedings of the 32nd ASME International Conference on Ocean, Offshore and Arctic Engineering, Nantes, France, 9–15 June 2013. [Google Scholar]
- Dawood, A.A.; Kenny, S. Finite element method simulating the pipeline mechanical response during reel-lay installation. In Proceedings of the 32nd ASME International Conference on Ocean, Offshore and Arctic Engineering, Nantes, France, 9–15 June 2013. [Google Scholar]
- Chatzopoulou, G.; Karamanos, S.A.; Varelis, G.E. Finite element analysis of cyclically-loaded steel pipes during deep water reeling installation. In Proceedings of the ASME Pressure Vessels and Piping Conference, PVP-2015, Boston, MA, USA, 19–23 July 2015. [Google Scholar]
- Liao, H.; Wang, L. Influence of Reel Lay on Residual Stress and Ultimate Bearing Capacity of Pipe. In Proceedings of the 2015 International Conference on Applied Mechanics, Mechatronics and Intelligent Systems (AMMIS2015); World Scientific: Singapore, 2016; pp. 38–43. [Google Scholar]
- Liu, Y.F.; Kyriakides, S.; Dyau, J.Y. Effects of Reeling on Pipe Structural Performance-Part II: Analysis. J. Offshore Mech. Arct. Eng.-Trans. Asme 2017, 139, 051707. [Google Scholar] [CrossRef]
- Ju, M.; Xing, X.D.; Wang, L.Q.; Yun, F.H.; Wang, X.Y.; Liao, H.Q. Numerical Simulations and Experimental Study on the Reeling Process of Submarine Pipeline by R-Lay Method. J. Mar. Sci. Eng. 2021, 9, 579. [Google Scholar] [CrossRef]
- Xu, Z.L. A Concise Course in Elasticity; Higher Education Press: Beijing, China, 2013. [Google Scholar]
- Kyriakides, S. Effects of Reeling on Pipe Structural Performance-Part I: Experiments. J. Offshore Mech. Arct. Eng.-Trans. Asme 2017, 139, 051706. [Google Scholar] [CrossRef]


Disclaimer/Publisher’s Note: The statements, opinions and data contained in all publications are solely those of the individual author(s) and contributor(s) and not of MDPI and/or the editor(s). MDPI and/or the editor(s) disclaim responsibility for any injury to people or property resulting from any ideas, methods, instructions or products referred to in the content. |
© 2023 by the authors. Licensee MDPI, Basel, Switzerland. This article is an open access article distributed under the terms and conditions of the Creative Commons Attribution (CC BY) license (https://creativecommons.org/licenses/by/4.0/).