Abstract
The aquaculture of marine ranching is of great significance for scientific aquaculture and the practice of statistically grasping existing information on the types of living marine resources and their density. However, underwater environments are complex, and there are many small and overlapping targets for marine organisms, which seriously affects the performance of detectors. To overcome these issues, we attempted to improve the YOLOv8 detector. The InceptionNeXt block was used in the backbone to enhance the feature extraction capabilities of the network. Subsequently, a separate and enhanced attention module (SEAM) was added to the neck to enhance the detection of overlapping targets. Moreover, the normalized Wasserstein distance (NWD) loss was proportionally added to the original CIoU loss to improve the detection of small targets. Data augmentation methods were used to improve the dataset during training to enhance the robustness of the network. The experimental results showed that the improved YOLOv8 achieved the mAP of 84.5%, which was an improvement over the original YOLOv8 of approximately 6.2%. Meanwhile, there were no significant increases in the numbers of parameters and computations. This detector can be applied on platforms for seafloor observation experiments in the field of marine ranching to complete the task of real-time detection of marine organisms.
1. Introduction
Oceans are a “blue granary” that provide humans with access to high-end foods and high-quality proteins. Marine ranching, which is a new form of marine economy, allows for the conservation of biological resources and the repair of the ecological environment. This is an important way to realize the recovery of China’s offshore fishery resources, the harmonious development of the ecosystem, and the use of the “blue carbon sink”. With the increase in the world’s population, food, resource, and environmental problems have become prominent. Thus, effective habitat restoration and resource conservation measures must be developed. Meanwhile, the construction of modernized marine ranching systems can effectively restore marine fishery resources and marine ecosystems [1].
The construction of a marine ranching system requires a significant investment. Can the marine ranching systems that are constructed serve as habitats for target organisms? Is the marine life in them healthy? These questions are directly related to the economic benefits of marine ranching and fisheries. Therefore, there is a strong need for monitoring biodiversity in marine ranching. It is of undoubted importance and urgency to realize the continuous online monitoring of the marine environment and biological resources through seafloor observation networks and to provide high-quality data support for the scientific management of marine pastures and the real-time monitoring of animal resources [2].
One of the major tasks in a seafloor observation network is the provision of long-term continuous real-time observation and monitoring of seafloor organisms. Traditional observations, however, rely mainly on staff to make visual observations and record them, which is inefficient and error prone. To improve the efficiency of the observation of organisms associated with marine ranching, the use of computer vision technology for target detection and assistance in the observation of marine organisms has important research value and application prospects.
Underwater images are different from normal land images. The quality of underwater images is significantly degraded due to uncertainties in the water environment, the absorption and scattering of light by water, and the various media contained in water [3]. With the rise and development of artificial intelligence technology, the introduction of deep learning-based target detection and classification techniques has enabled accurate and fast target detection in complex underwater environments.
There are two main categories of current deep learning-based target detection methods, namely, two-stage detection models and one-stage detection models. Among others, the most prominent two-stage models are R-CNN [4], Fast-RCNN [5], and Faster-RCNN [6]. The main features of two-stage models are the initial generation of a region proposal network with specialized modules, followed by movement to the foreground and adjustment of the bounding box. The model structure is more complex, large, and slow, but it has some advantages in detection accuracy. Lin et al. [7] designed the RoIMix data enhancement method based on Faster-RCNN to solve the problem of having more overlapping, occluded, and blurred targets in underwater images. Their experiments showed that this method could significantly improve the detection performance of Faster-RCNN.
The main representative of the one-stage models is YOLO [8,9,10,11]. Its main feature is the direct input of images into the detection model and the output of results. The main advantages are its simple structure, small size, and high speed. It is more suitable for underwater target detection in marine ranching. For underwater target detection in the field of one-stage modeling, Han et al. [12] first used a combination of max-RGB and shades of gray methods to enhance underwater images. Then, a deep convolutional neural network method was used for underwater target recognition, and good results were achieved. Chen et al. [13] improved YOLOv4 by replacing the upsampling module with a deconvolution module, adding depth-separable convolution, and finally, augmenting the data with an improved mosaic. Zhao et al. [14] reduced the parameters of the model by replacing the backbone network with MobileNetV3. Deformable convolution was also added to improve detection accuracy. Sun et al. [15] proposed LK-YOLO, which improved the performance of the model by introducing a large kernel convolution into the backbone network, thus improving the detection head, as well as the sample matching strategy. Currently, the application of transformers in computer vision tasks is also a popular research direction. Zhang et al. [16] proposed the YOLO-SWFormer, which introduced the Swin-Transformer into the backbone of the model. This effectively improved the detection accuracy of the model. However, at the same time, the detection speed was slow, and the model structure was relatively bloated.
In recent years, attention mechanisms have become an integral part of target detection tasks. Attention mechanisms stem from the study of human vision and its ability to sift through large amounts of information to find important data. Shen et al. [17] proposed the crisscross global interaction strategy (CGIS) for versions of YOLO detectors in order to minimize the interference of the underwater background with the detected target. Yu et al. [18] proposed YOLOv7-net, which added bi-level routing attention (BRA) and a new coordinated attention module (RFCAConv) to YOLOv7. This improved the detection of broken nets in complex marine environments. Lv et al. [19] improved YOLOv5 by adding ASPP structures and a CBAM module combined with the FOCAL loss function. A small target detection head was also added. Li et al. [20] used the RGHS algorithm to improve the image quality. The performance was then improved by adding a triplet attention mechanism and an additional small target detection header. Li et al. [21] improved YOLOv5 by using a Res2Net residual structure with a coordinate attention mechanism and applied it to fish detection. These target detection models had high recognition accuracy, fast detection speed, good robustness, and high practicality.
Based on the above analysis, to accurately and quickly recognize target marine organisms in complex underwater environments, this study proposes an improved YOLOv8 detector. Firstly, the InceptionNeXt block was used in the backbone network. This improved the feature extraction abilities of the model without increasing its number of parameters. Secondly, the SEAM attention mechanism was added to the neck. This enhanced the detection of overlapping targets by increasing the focus on the region of the detected object in the image and weakening the background region. Finally, NWD loss was added to the original CIoU loss to improve the ability to detect small targets. Data augmentation methods were used to improve the dataset during the training process, thus enhancing the robustness of the network. The main research and innovations of this study can be summarized as follows:
- (1)
- Aiming at the characteristics of underwater image features that are not obvious, the backbone network of YOLOv8 was improved by using the InceptionNeXt block, which enhanced its ability to extract image features while maintaining its lightweight advantage.
- (2)
- For the characteristics of underwater images with more overlapping targets, the SEAM attention mechanism was added to the neck, and experimental comparisons were made with two other classical attention mechanisms, which proved that the SEAM was the most effective.
- (3)
- In view of the characteristics of underwater images containing more small targets, NWD loss was added on the basis of the original CIoU loss, and the most suitable ratio of the two functions was found through experiments, which improved the accuracy of small targets detections without causing a loss of detection accuracy for medium and large targets.
- (4)
- In response to the insufficient number of underwater datasets, data from three parts were used to form the final dataset that was used. The dataset was augmented with a combination of Mosaic and MixUp to create the training set during the training process, which improved the generalization ability of the model and avoided the overfitting of the model.
The remainder of this study is organized as follows: In Section 2, we focus on the main structure of the video monitoring system in the seafloor observation network and on the analysis of the specific improvement strategies for the detection model. Section 3 focuses on a general analysis of the dataset and training strategy, as well as the design of the experiments and a discussion of the results. Section 4 provides final conclusions and directions for future work.
2. Materials and Methods
2.1. Design of the Seafloor Video System
2.1.1. General Structural Design
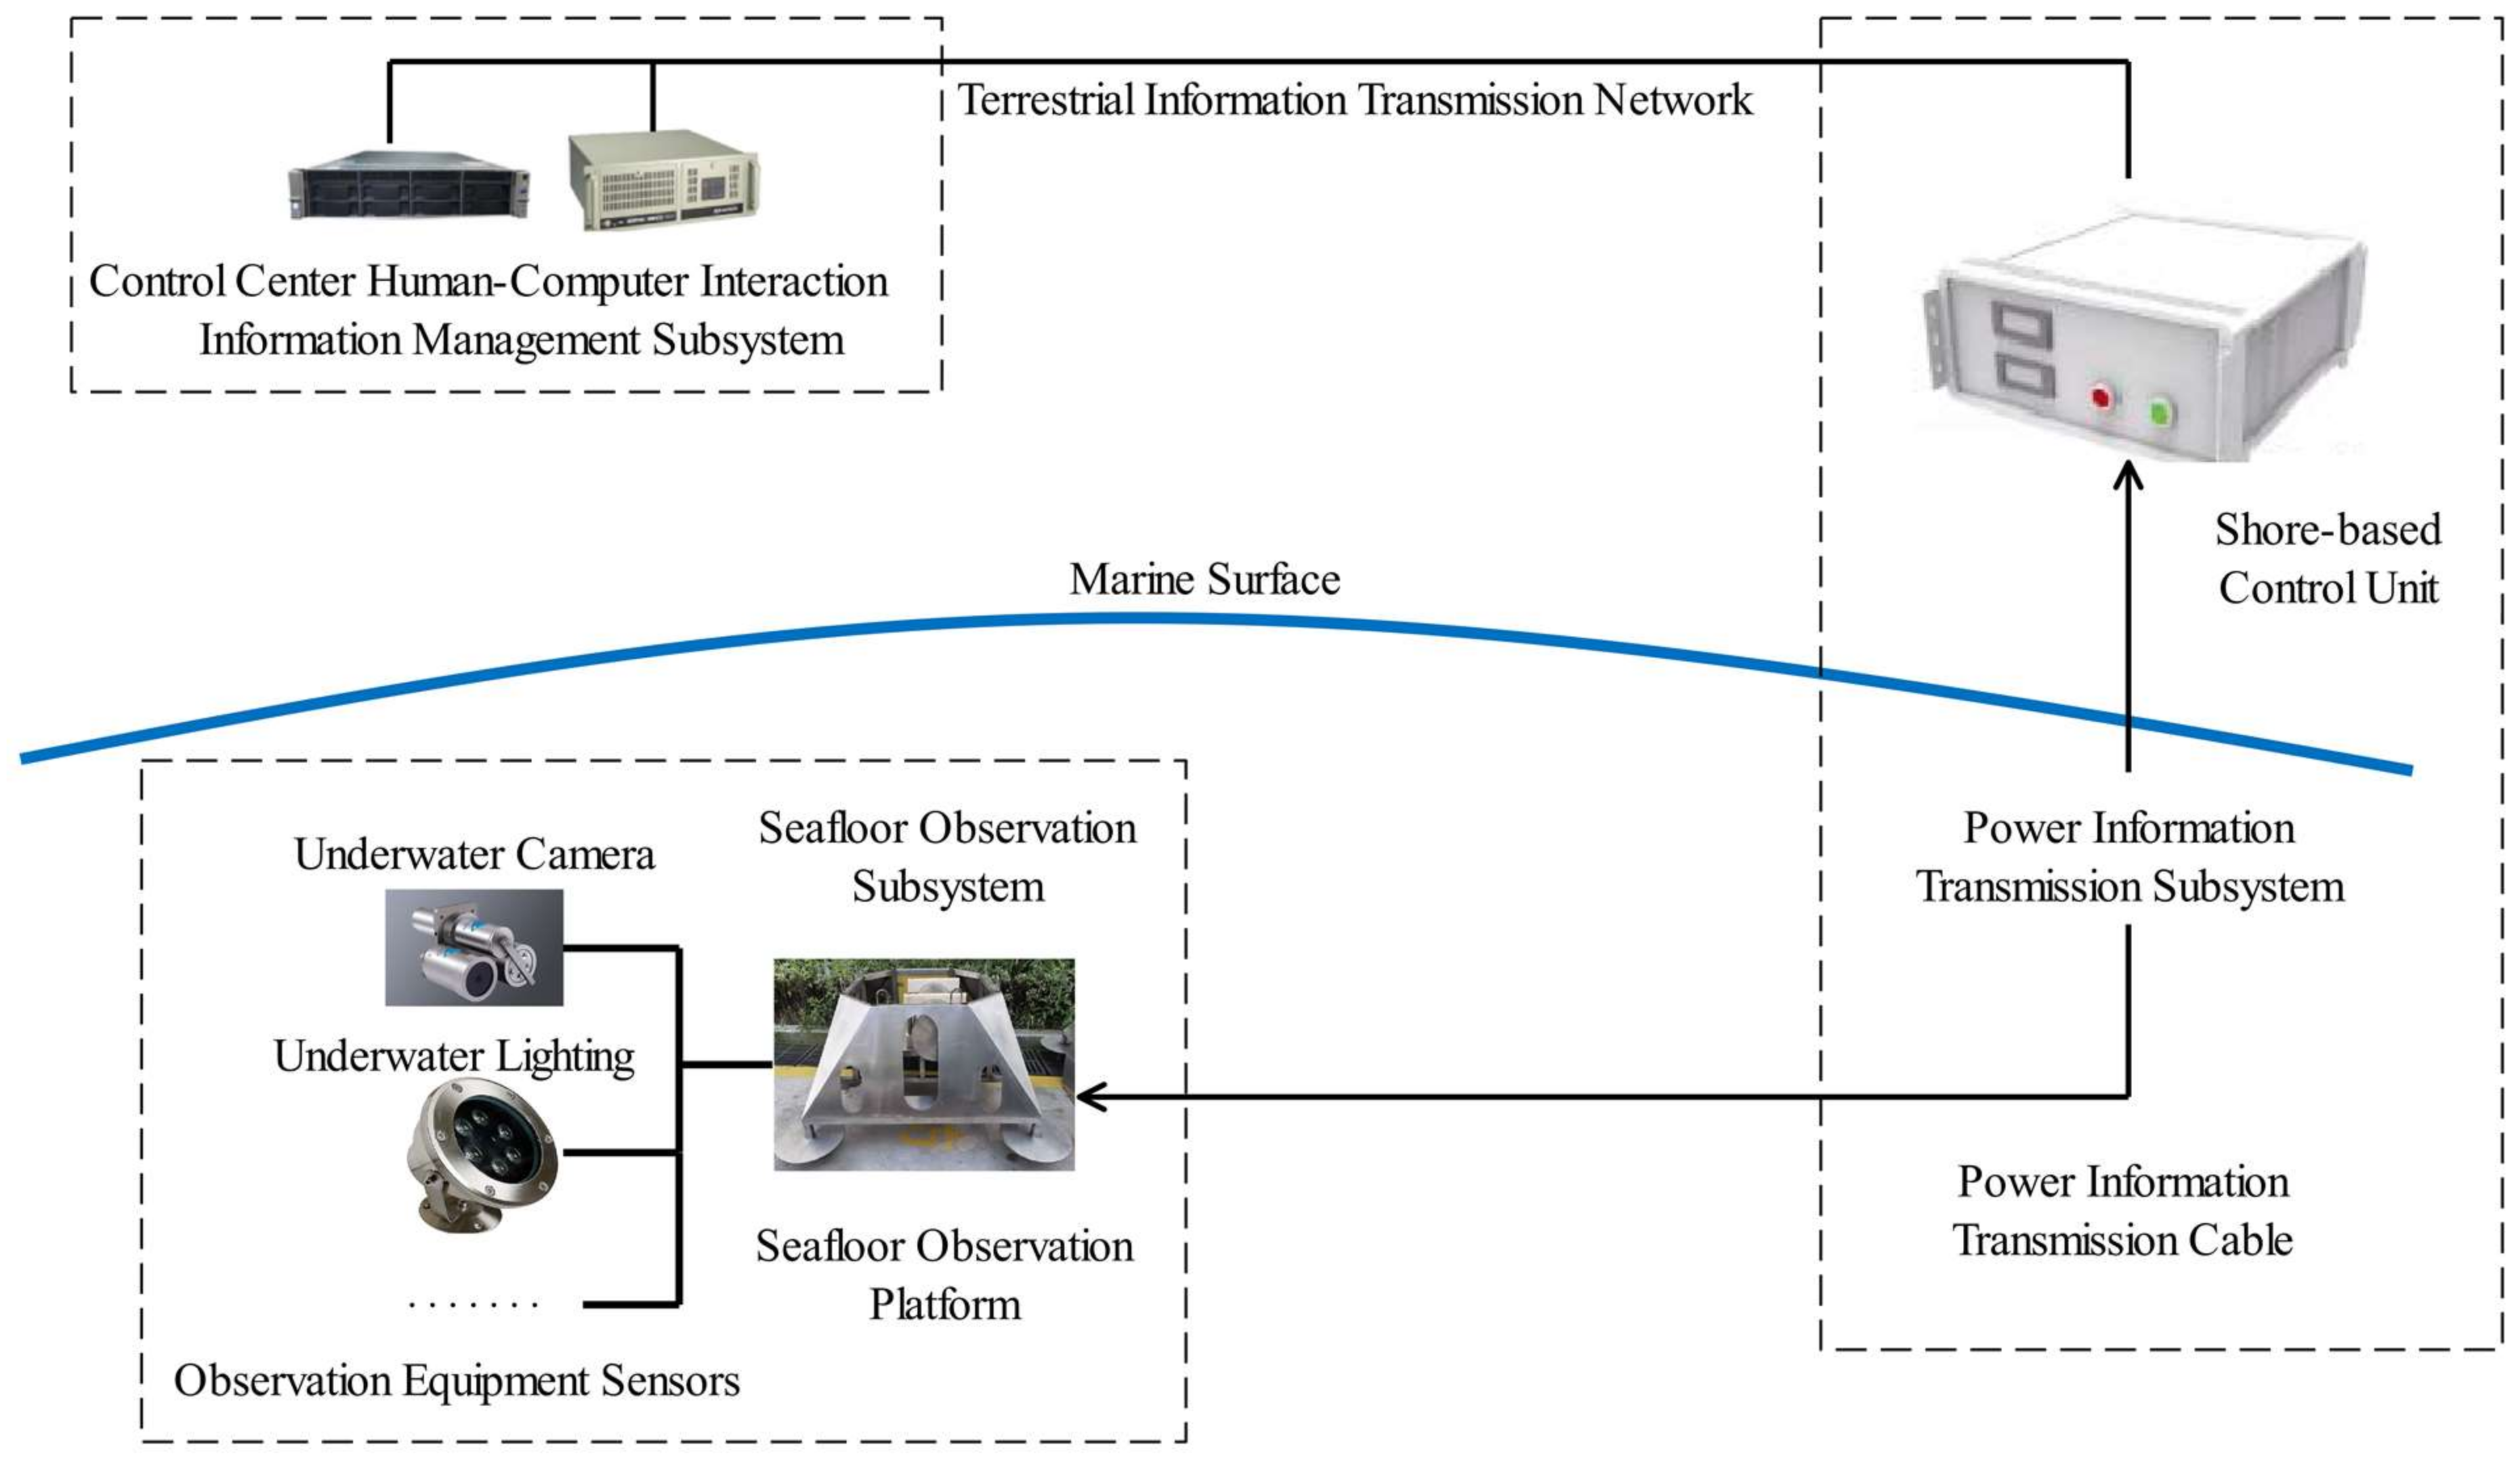
A seafloor video monitoring system can be regarded as an important observation subsystem of a seafloor observation network. The seafloor observation network system used here was designed with a seafloor observation platform as the core. There was two-way transmission of power and information through optoelectronic composite cables. According to functional divisions, a complete seafloor observation network is mainly composed of a seafloor observation subsystem, a power–information transmission subsystem, and a human–computer interaction and information management subsystem in the control center according [22,23]. The human–machine interaction and information management subsystem in the control center mainly consists of various servers and control hosts. They are mainly responsible for the management of observation equipment and data. The core component of the power–information transmission subsystem is the shore-based control unit. This is responsible for delivering energy and transmitting information to various subsea observation instruments. The seafloor observation subsystem is the core part of the whole seafloor observation network. All observation equipment is deployed on the seafloor observation platform. The general architecture of a typical seafloor observation network is shown in Figure 1.
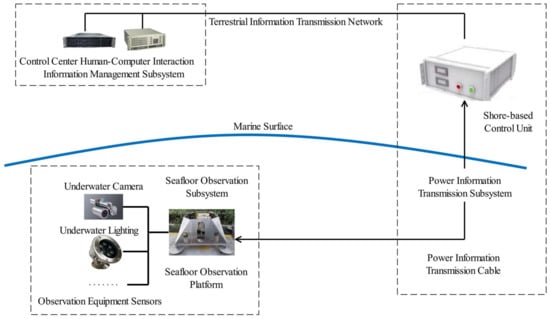
Figure 1.
General architecture of a submarine observation network.
2.1.2. Design of the Video Monitoring System
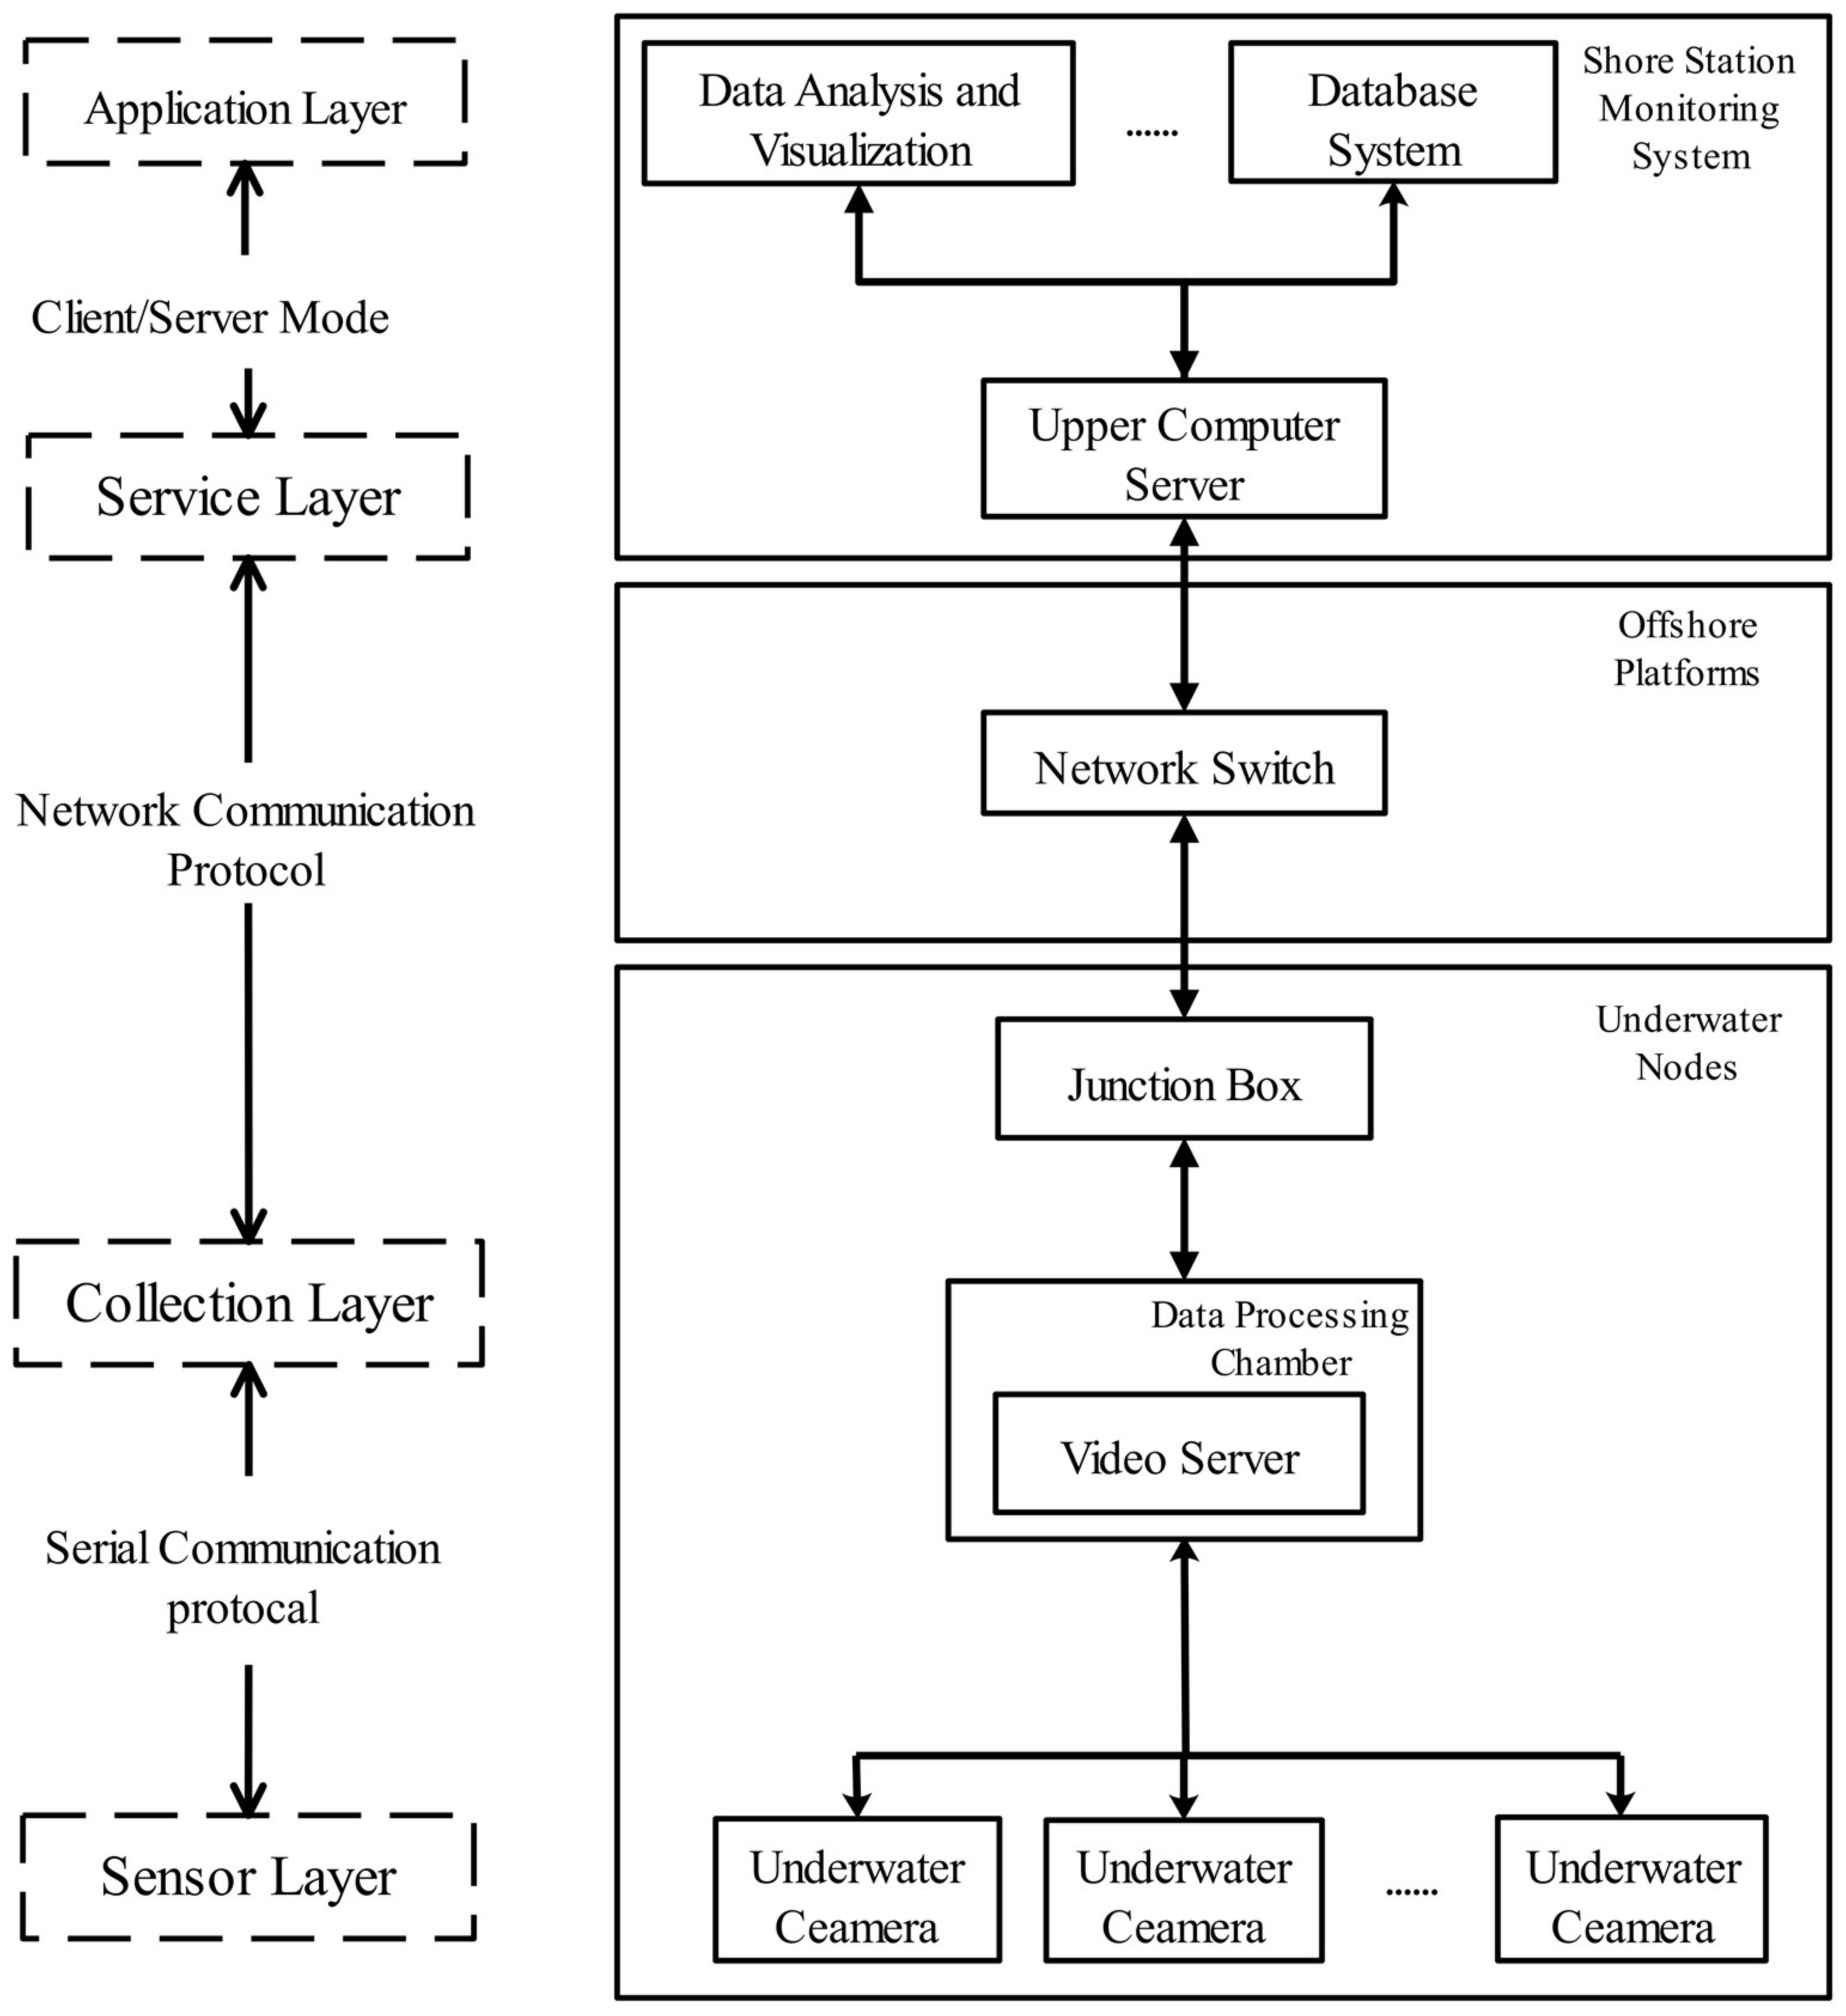
Video monitoring systems for marine ranching can be divided into four main parts: the sensing layer, acquisition layer, application layer, and service layer. The sensing layer is mainly composed of various types of surveillance cameras and lighting equipment, and it is responsible for sensing dynamic information on the marine environment. The acquisition layer collects real-time ocean observation data in the field and forwards the information between the service layer and the sensing layer. The service layer manages various types of information and provides a set of operations related to remote control. The application layer is a layer for scenarios with various user requirements, and it uses different information to meet the project’s requirements. The layers are relatively functionally independent from each other, and the interface among them is of a standard form. Each layer uses the services of the adjacent underlying layer and provides services to its adjacent upper layers [24]. A diagram of the video surveillance system’s architecture is shown in Figure 2.

Figure 2.
Video monitoring system architecture diagram.
The workflow of the entire video monitoring system for marine ranching started with an underwater camera integrated with underwater lighting and a cloud terrace to obtain video and image information of the seafloor for the acquisition of original data, followed by the processing of the image data on the network video server for efficient image compression and coding of the image data. Next, the photoelectric composite cable and TCP/IP video data transmission protocol of the seafloor observation network were used in real time, and the video-image data were transmitted to the upper computer server. Finally, the received video data were decoded and stored to achieve real-time video monitoring of the deep seafloor [25].
2.2. Structure of the Detector
The target detector used in this study was mainly based on YOLOv8. YOLOv8 is the latest version of YOLO. It was refactored on the basis of YOLOv5, and many small strategies for improving the performance of the whole network were added. The authors provided a total of five detectors. In this study, we used the smallest of these: YOLOv8n. We attempted to improved it on the basis of the original detector with respect to the problem of there being more small targets and serious target obscuration when observing marine life. The whole model can be divided into the backbone, neck, and YOLO head. The structure of the whole model is shown in Figure 3.
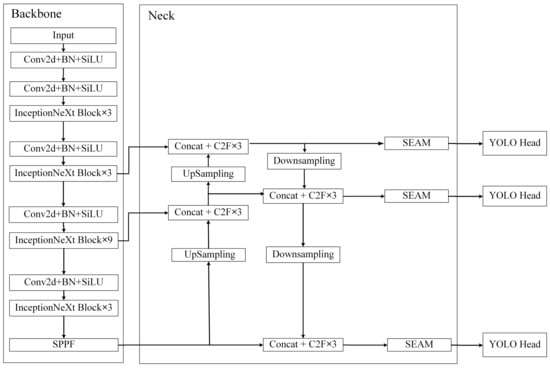
Figure 3.
Improved YOLOv8 network structure diagram.
2.2.1. Backbone
The pre-processed images were fed into the backbone for feature extraction. A major improvement point in the whole feature extraction network was the introduction of the InceptionNeXt block [26] to replace the original C2F block [27], thus enhancing the extraction of the input image features. The InceptionNeXt block is mainly based on ConvNeXt [28] and the idea of Inception [29,30,31,32,33]. The depthwise convolution of the large kernel convolutions in ConvNeXt was decomposed into four parallel branches according to the channel dimension. One-third of the channels were kerned at 3 × 3, one-third of the channels were kerned at 1 × 11, and the remaining third of the channels were kerned at 11 × 1; finally, a constant mapping was added. This decomposition not only reduced the number of parameters and the computational effort, but it also retained the advantages of large kernel depthwise convolution, i.e., it expanded the field of perception and improved the model performance.
After that, the image features were extracted by the MLP block. The main difference from the previous version was the replacement of the original two layers of the fully connected network with two 1 × 1 convolution layers. Finally, the present structure decomposed large convolutional kernels in a simple and quick manner while maintaining comparable performance, achieving a better balance among accuracy, speed, and the number of parameters. The main structure of the InceptionNeXt block is shown in Figure 4.
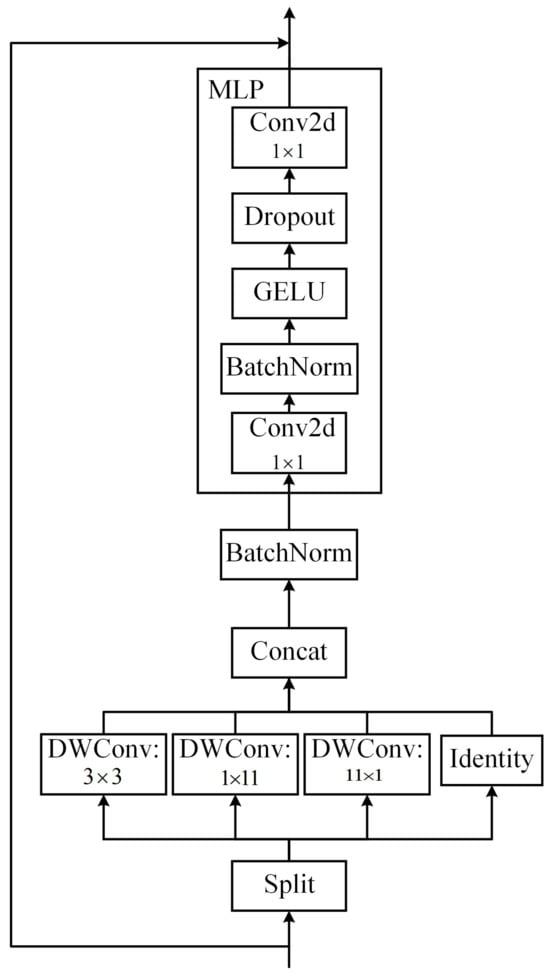
Figure 4.
InceptionNeXt block structure diagram.
2.2.2. Neck
The PANet [34] structure is most commonly used in the neck part of YOLOv8. Iterative extraction occurs, and the output contains features from three dimensions. The problem of occlusion is greater when considering marine organisms, and occlusion between different organisms can lead to misalignment, local blending, and missing features. To address these issues, the separated and enhancement attention module (SEAM) [35] was added to emphasize the object detection region in the image and weaken the background region, thus enhancing the detection of marine organisms in the presence of occlusion. The SEAM was first used for the detection of occluded faces, and a diagram of its structure is shown in Figure 5.

Figure 5.
Illustration of SEAM.
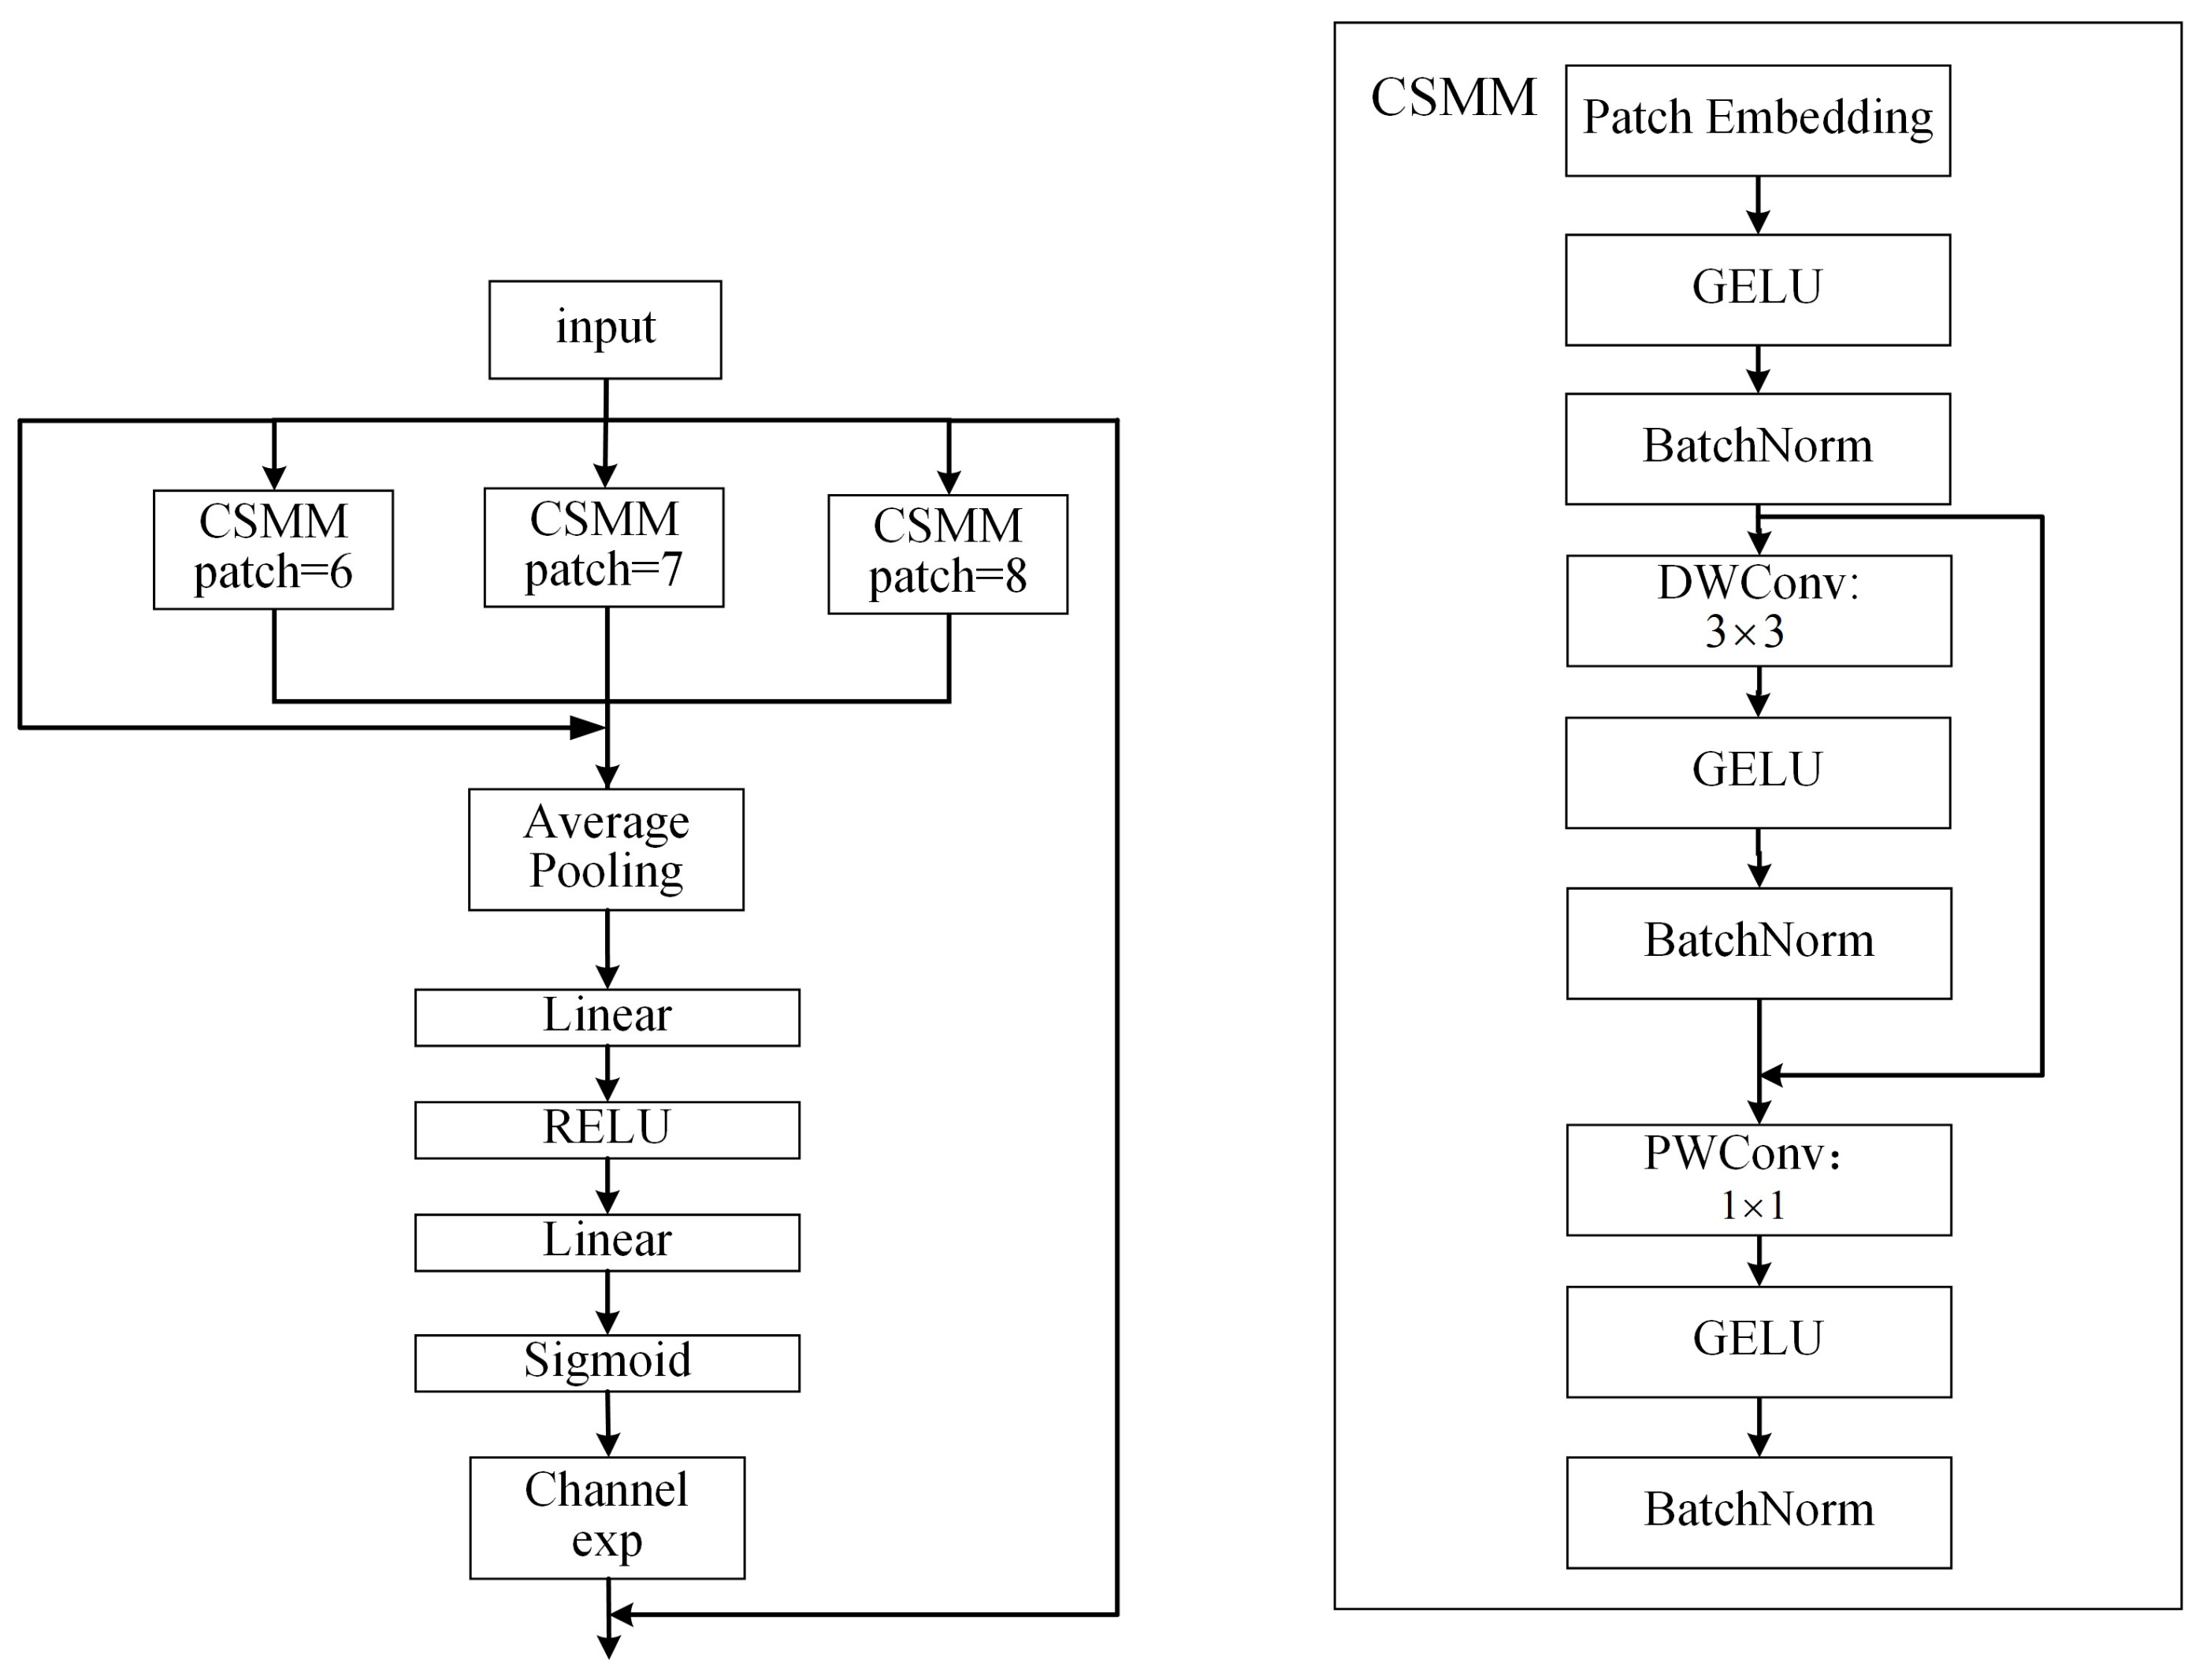
First, the input feature maps were passed through the channel and spatial mixing module (CSSM) to learn the correlations of spatial dimensions and channels. In the CSMM, the input feature map was first sliced into a number of image sequence blocks by using the patch embedding operation, and it was linearly mapped and flattened into a one-dimensional vector. Then, there was a 3 × 3 depthwise convolution with residual connections. The depthwise convolution was operated depth-by-depth, i.e., there was a channel-by-channel separation of the convolutions. Thus, although the depthwise convolution could be used to learn the importance of different channels and reduce the number of parameters, it ignored the relationships of information between channels.
To compensate for this loss, the outputs of the different depth convolutions were subsequently combined through a 1 × 1 pointwise convolution. A two-layer fully connected network was then used to fuse the information from each channel. In this way, the network could strengthen the connections between all channels. After that, the range of values for the logits output from the fully connected layers was [0,1]. Then, the exponential function was used expand it to [1,e]. This exponential normalization provided a monotonic mapping relationship that made the results more tolerant of positional errors. Finally, the output of the SEAM was multiplied by the original features as attention so that the model could handle the occlusion of the detected targets more effectively.
2.2.3. YOLO Head
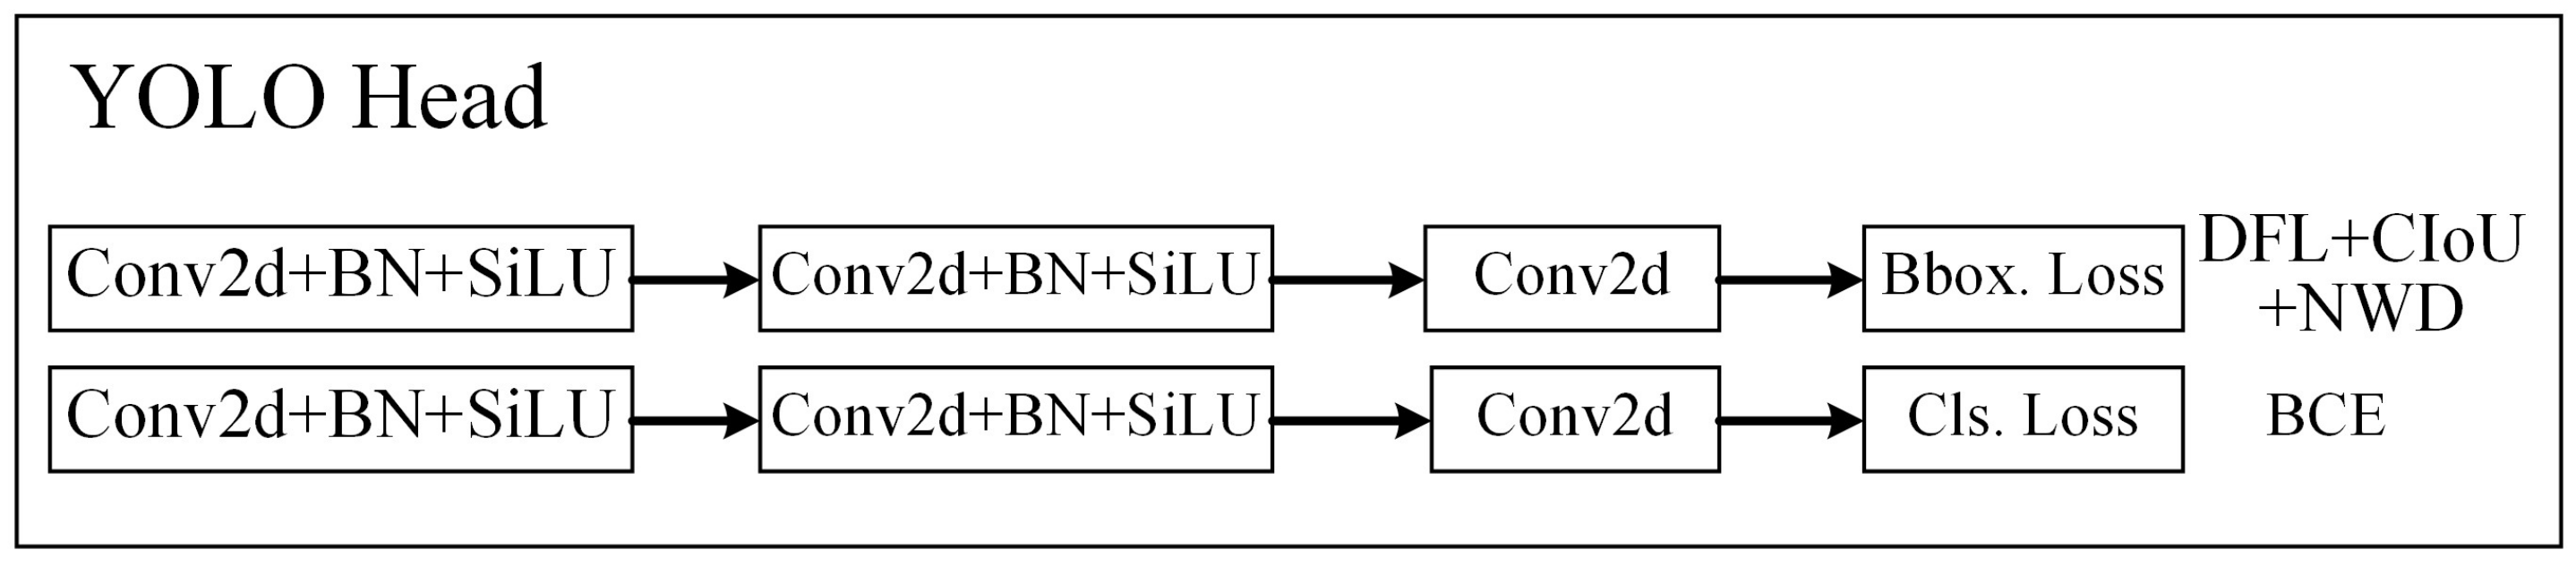
In comparison with the previous generation of YOLOv5, the biggest difference in YOLOv8 was that the head part had changed from the original coupled head based on anchors to a decoupled head without anchors; thus, the categorization task was decoupled from the regression task, and, at the same time, the objectness branch was eliminated. The structure of the YOLO head in YOLOv8 is shown in Figure 6. The loss function of YOLOv8 was mainly composed of two parts: classification loss and regression loss.

Figure 6.
Illustration of YOLO head in YOLOv8.
The classification loss still used the BCE loss. The regression loss used the distribution focal loss and CIoU loss because it needed to be bound to the integral-form representation proposed in the distribution focal loss. The three loss functions were weighted with a ratio of 0.5:1.5:7.5. CIoU is an upgraded version of DIoU. Adding the aspect ratio of the prediction box to DIoU improved the regression accuracy.
The CIoU formula is expressed using Equation (1):
The three terms in the formula correspond to the calculation of the IoU, center-point distance, and aspect ratio, respectively. represents the Euclidean distance between the center points of the prediction frame and the real frame, and c represents the diagonal distance of the smallest closed area that can contain both the predicted and real boxes. The equations for α and v are Equations (2) and (3):
Here, w, h and , represent the height and width of the predicted box and the real box, respectively. The final loss is expressed using Equation (4):
However, CIoU also has its limitations. In particular, it is very sensitive to the deviation in the positions of small targets, which seriously reduces its detection performance for such targets. To improve the detection performance for small targets while retaining the CIoU, the normalized Wasserstein distance (NWD) loss [36] was added. The main process of NWD is to first model the enclosing frame as a 2D Gaussian distribution and then use the Wasserstein distance to calculate the similarity between the corresponding Gaussian distributions. Compared with the traditional IoU, the advantages of the NWD are, firstly, that it can measure the distribution similarity regardless of the overlap between small targets and, secondly, that it is insensitive to targets of different scales and more suitable for measuring the similarities between small targets. The formula for the NWD loss is expressed using Equation (5):
Here, is the distance measure, is the Gaussian distribution of the prediction frame, and is the Gaussian distribution of the GT frame. C is a constant related to the dataset. In this study, we set C to the average absolute size of the targets in dataset. The NWD loss is expressed using Equation (6):
3. Results and Discussion
3.1. Experimental Environment and Datasets
The hardware environment for this study was the following: a laptop with 32 GB RAM, an AMD R9 5900HX CPU, and a 16 GB GeForce RTX 3080 graphics card. All tests were performed in Windows 11.
The dataset used in this study is divided into three main parts. The first was the URPC2021 dataset, which is a publicly available dataset from the 2021 Underwater Robot Picking Contest in China, and it mainly contains four kinds of creatures: echinus, holothurians, starfish, and scallops. The second part was the Wild Fish Marker dataset [37], which was sourced from the National Oceanic and Atmospheric Administration (NOAA) dataset, consisting of more than 1000 tagged fish. Finally, there were several videos and images of marine life taken from the video observations of the Luhaifeng and Laizhou Bay Marine Ranches in Shandong Province, China in 2021. Five types of marine organisms, namely, echinus, holothurians, starfish, scallops, and fish, were detected in this study. First, we needed to intercept and label the marine organisms in the observation videos and pictures. Finally, a corresponding XML configuration file was generated. Among others, this file included the image names, dimensions, information about the location of the labeled box, and the corresponding species of marine organisms. It should be noted that the software used rectangular boxes to label the detection targets, and many marine organisms are extremely irregular in shape. Their locations are dense and overlapping, and they are difficult to strictly separate. Therefore, the labeling process in this study focused on the main part of the animal and did not pay strict attention to its minutiae, such as the fins of fish, the tentacles of holothurians, and the spines of echinus.
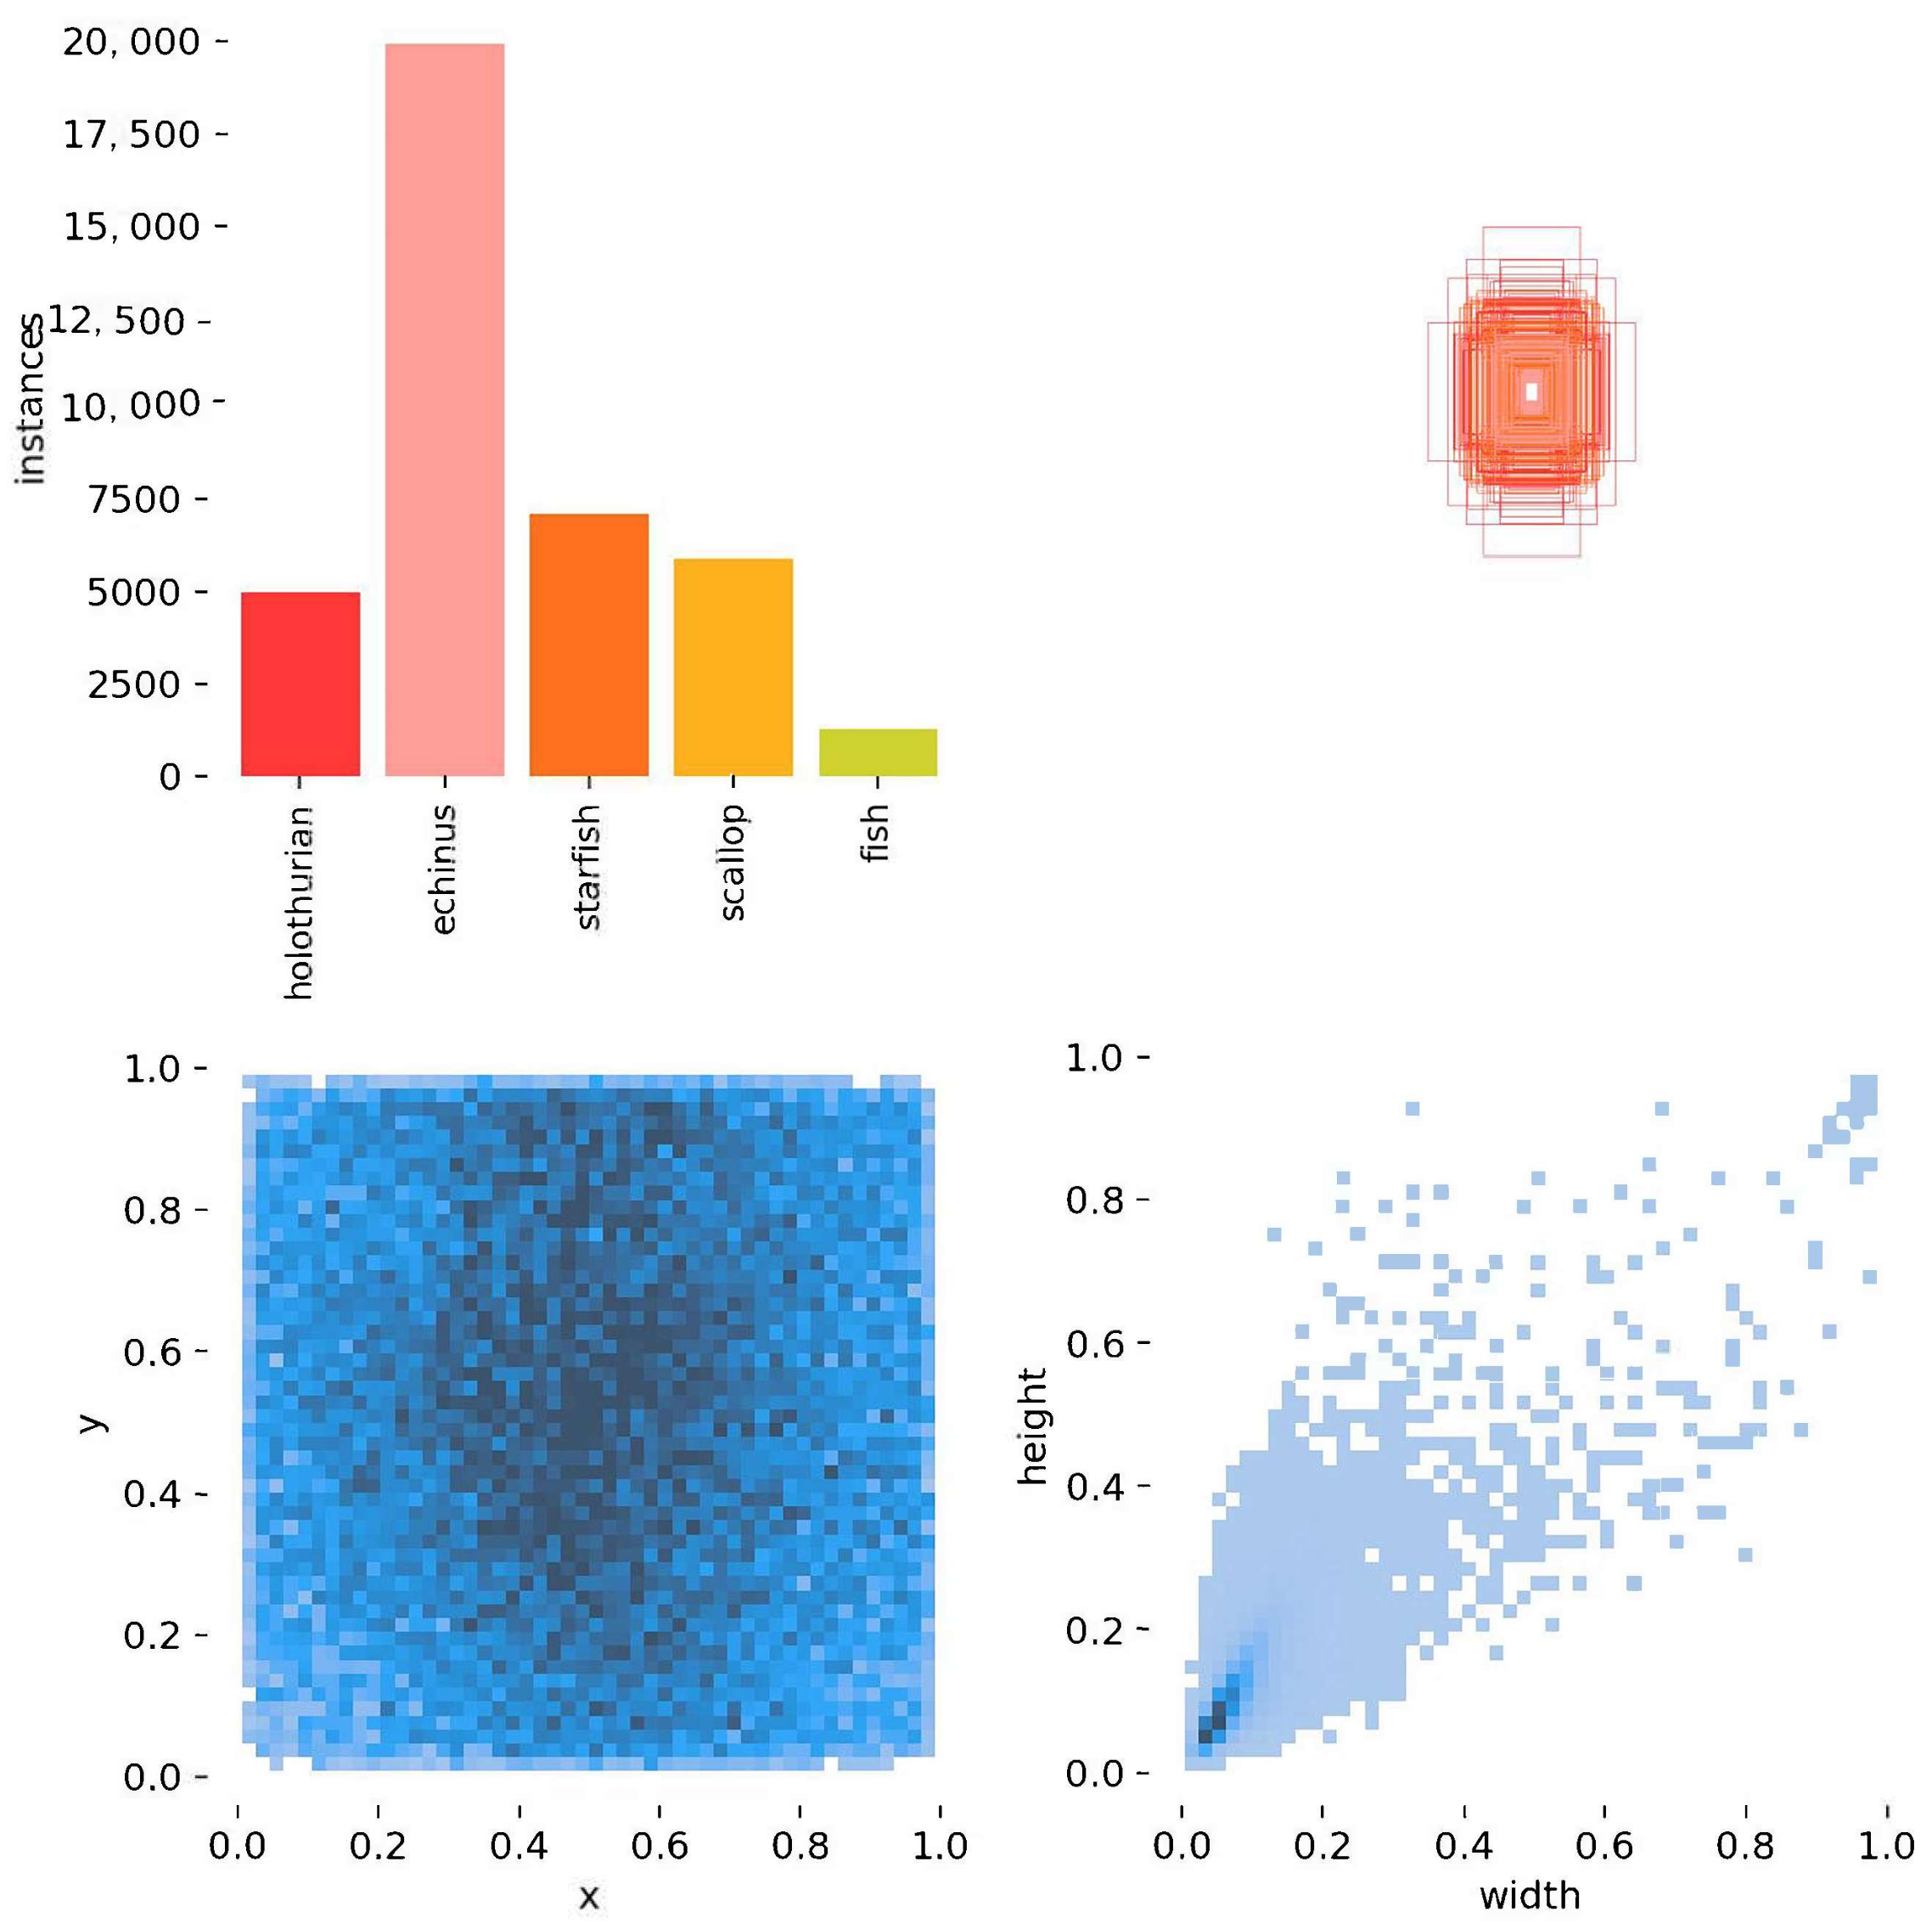
Figure 7 shows the basic information of the training set as a part of the entire dataset. It was divided into four main sections. The upper-left panel shows the number for each detection category. The upper-right panel shows the length and width of each target box, as well as the overall number of boxes and the range of variation. The lower-left panel shows the position of the target’s center point relative to the whole figure. The lower-right panel shows the height-to-width ratio of the target relative to the whole image. By synthesizing the four charts, it was found that the whole dataset was more difficult due to the uneven numbers of detection categories, which had more targets and greater variations in size, as well as more small targets.

Figure 7.
Basic infographic of training set.
3.2. Analysis of the Training Strategies
The dataset also needs to be pre-processed before starting the training. Firstly, all data were randomly divided at a ratio of 8:1:1 among the training set, validation set, and test set. To address the problem of the insufficient quantity and poor quality of marine organism datasets, data enhancement operations were also performed on the training set before training. The enhancement of the training data in this study consisted of three main parts: traditional data enhancement, mosaic data enhancement, and MixUp data enhancement. Traditional data enhancement mainly refers to random image flipping, scaling, and color gamut transformation operations. The steps for the mosaic data enhancement involved randomly combining four images into one. The MixUp enhancement step involved mixing two images at random. Of course, mosaic data enhancement also has its shortcomings because the distribution of the enhanced images was far from the true distribution of natural images and the large number of cutting operations affected the accuracy of the label boxes. Therefore, data augmentation was turned off in the last 30 epochs of training, which were the main reference in YOLOX [38].
The optimizer used for training was AdamW. Its main advantage is that it is very easy to use, and its gradient drop is fast. The corresponding learning rate was 0.001, and the final learning rate was 0.0001 when using the cosine learning rate adjustment strategy during training. The whole training lasted 300 epochs with a batch size of 16. If the training data did not improve within 50 epochs, the training was stopped early. A warmup training [39] strategy was used at the beginning to gradually increase the learning rate, with 10 warmup training epochs.
3.3. Comparison of the Detectors’ Complexity
Currently, there are two main types of target detectors: one-stage detectors and two-stage detectors. Therefore, the models used in this study were the two-stage detectors (Faster-RCNN based on Resnet 50) and similar types of one-stage detectors (YOLOv5n, YOLOv7-tiny, and YOLOv8n). First, the complexity of each model was compared. The two main metrics for complexity analysis in deep learning are the number of computations (FLOPs) and the number of parameters (Params). FLOPs refer to the number of floating-point operations per second, which corresponds to the time complexity. Params refer to the total number of parameters to be trained in the network model, which corresponds to the spatial complexity. Then, the weights of the final trained model were obtained. The main data are shown in Table 1.

Table 1.
Detector complexity comparison chart.
The comparison of the complexity showed that the two-stage detectors were much more complex than the one-stage detectors. Among the one-stage detectors, YOLOv5n had the lowest complexity. YOLOv8n had a significant increase in complexity over that of YOLOv5n. There was not much difference between the improved YOLOv8 and YOLOv8n. The highest complexity was that of YOLOv7-tiny. The number of parameters, the amount of computation, and the sizes of the weights were much higher than those of the other two detectors.
3.4. Performance Evaluation
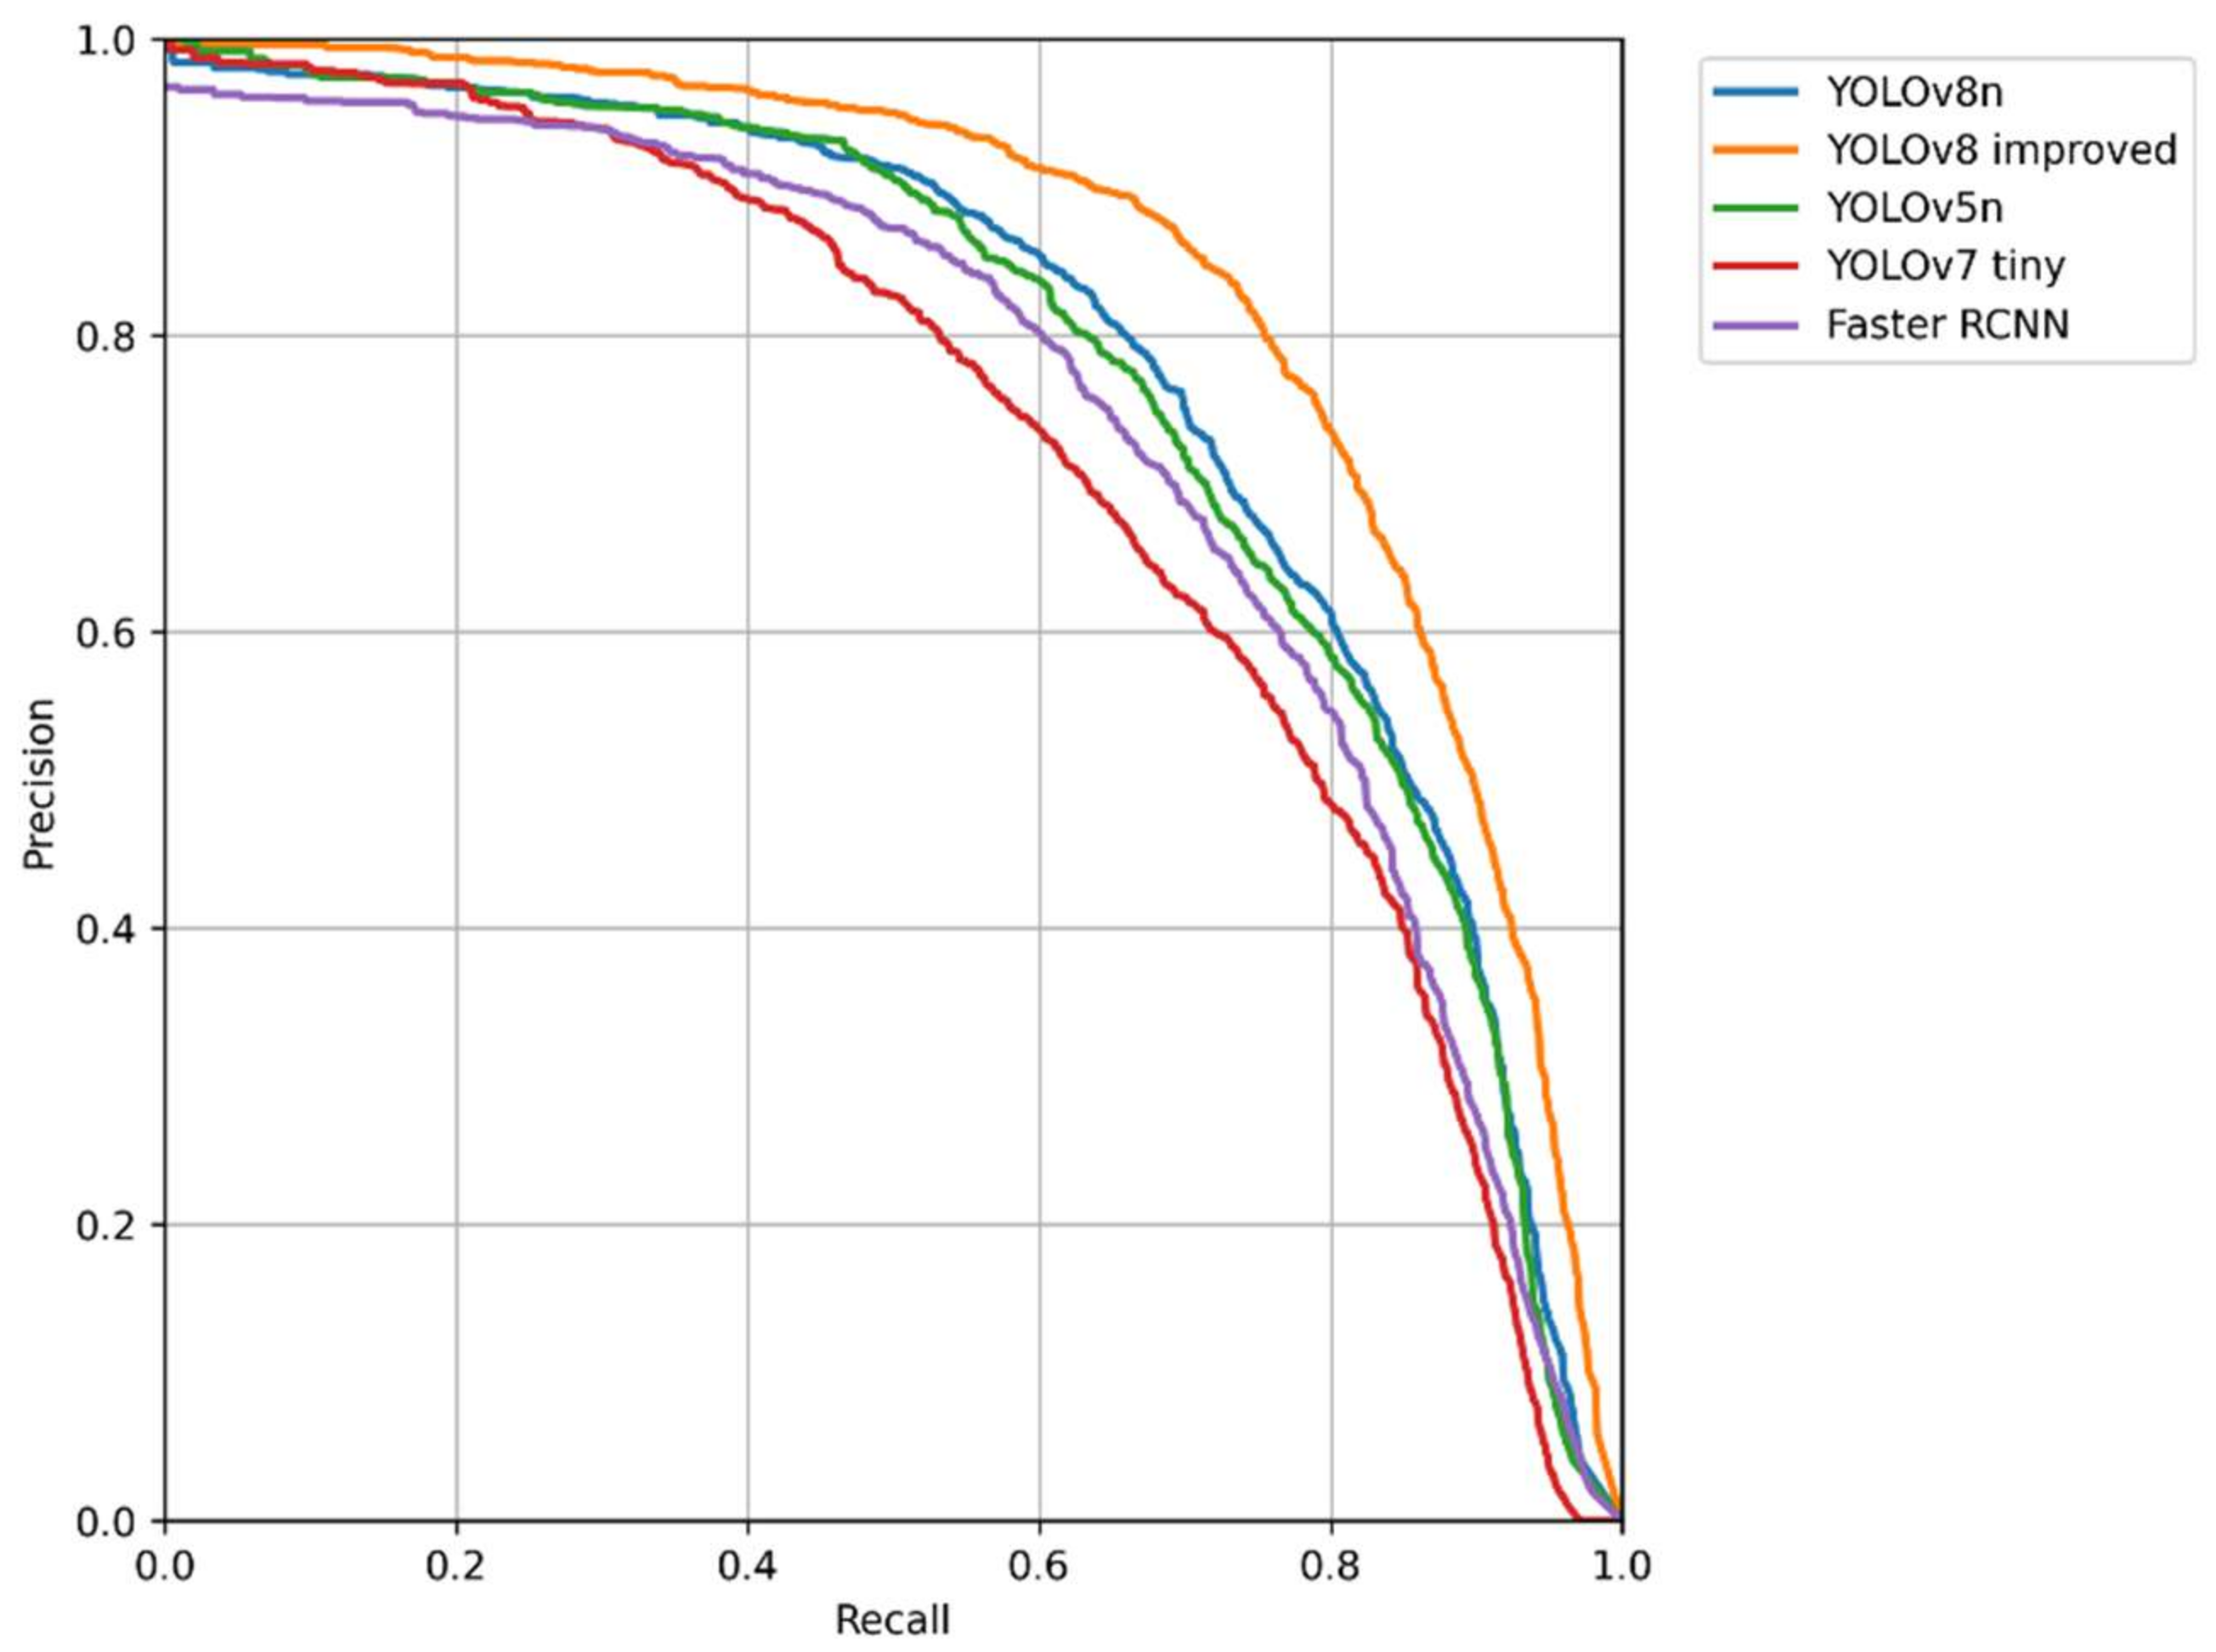
The detection performance of the models was compared. The main evaluation indicators used in this study were the precision, recall, AP, and mAP. The PR curve is a curve with precision as the vertical axis and recall as the horizontal axis. In general, precision and recall are mutually constraining metrics. Therefore, plotting the PR curve can allow one to explore the comprehensive performance of a model. The observation curve can reflect the performance of a deep learning model. The PR curves of the model are shown in Figure 8. By comparing the PR curves, it can be seen that the curve of the improved YOLOv8 completely wrapped around those of the other detectors; therefore, the improved version had better performance.
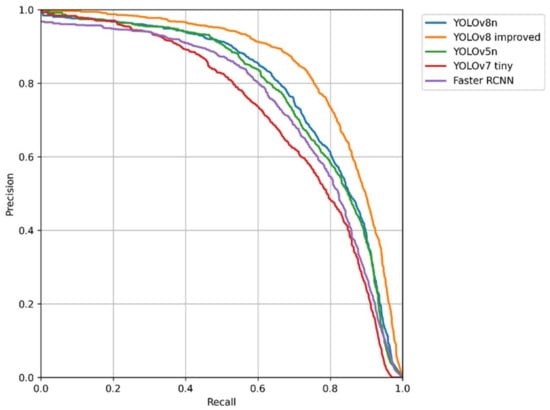
Figure 8.
PR curve comparison chart.
AP refers to the average precision of each class to be detected, and the average of AP values for all classes is the average precision of the whole model (mAP). In the performance evaluation in this study, the mAP@0.5 was calculated. This indicates what the value of mAP is for an IoU threshold of 0.5. The predicted performance metrics for each class in the performance evaluation of these detectors are shown in Table 2.
Table 2.
Predicted performance indicators of marine organism classification.
Other performance indicators were also compared. It can be seen that the detection FPS values were similar for all one-stage detectors with a batch size of 1, with that of YOLOv5n being slightly higher. However, the two-stage detectors had lower FPS values and poorer real-time functioning. According to the mAP, the two-stage detector Faster-RCNN had a slight advantage. Among the one-stage detectors, YOLOv7-tiny had the highest complexity and the most complicated network structure, but this did not result in a performance improvement. YOLOv5n had the lowest complexity, and its mAP was also about 1.9% lower than that of YOLOv8n. The best performance on the data was that of the improved YOLOv8. Compared to those of the original YOLOv8n, the AP of each category and the total mAP were significantly improved. The most obvious boost was for holothurians, with a boost of about 9.7%. This was because holothurians presented the smallest targets and the most serious phenomenon of obscuration. The holothurians in marine ranches mostly inhabit the fine sand in the shallows. Others are in the crevices of reefs. Therefore, the improvement strategies used here were most effective for holothurians.
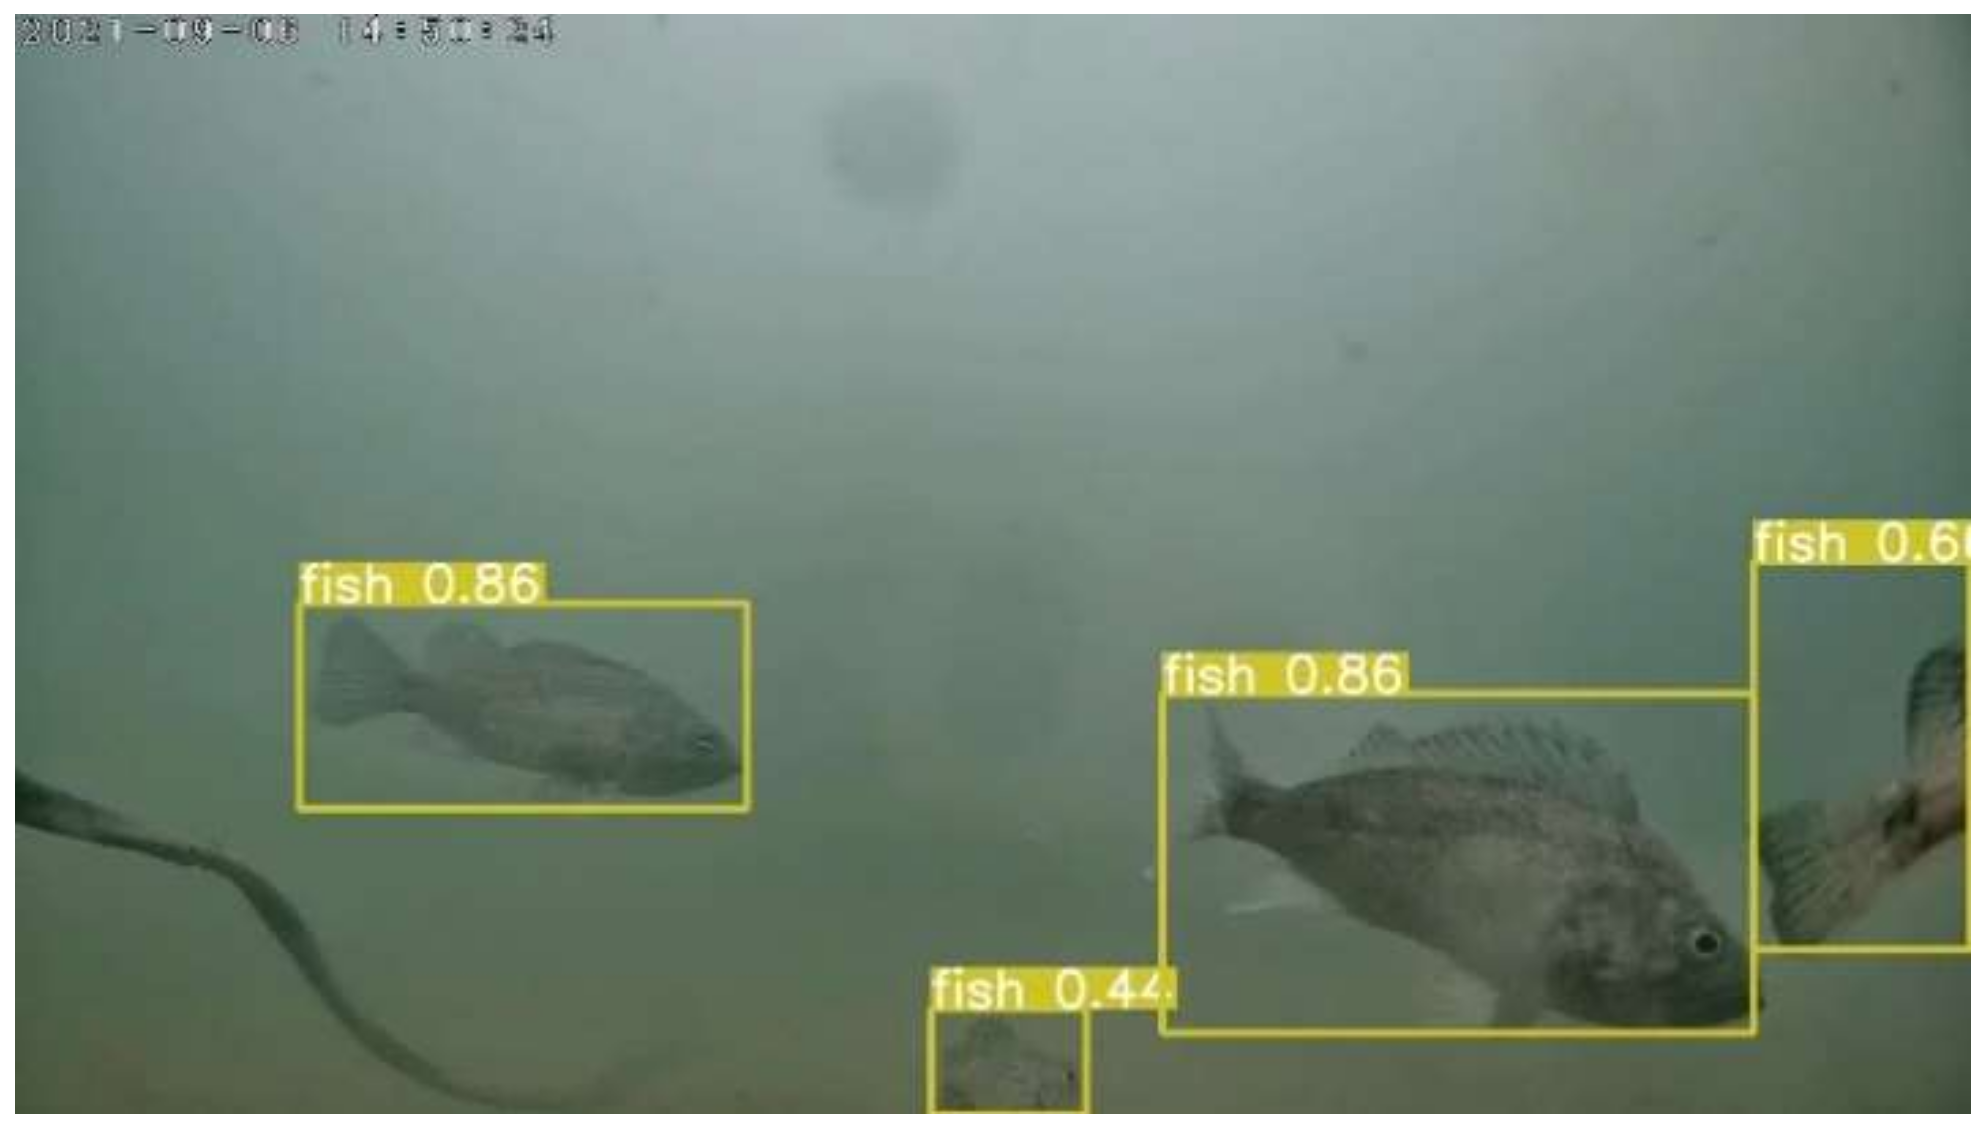
At the end, an example of video detection was conducted while using the improved YOLOv8, and the results are shown in Figure 9. It can be seen that the whole process had excellent detection results. The FPS value was stable at around 40. This indicates that this system is competent in detecting marine organisms in seafloor videos in real time.

Figure 9.
One example of video detection effect.
Overall, although the two-stage detector Faster-RCNN had a slight advantage in terms of the mAP, its structure was complex and functioned poorly in real time, which made it unsuitable for video monitoring systems in seafloor observation network. The one-stage model of the improved YOLOv8 had the best performance indicators. Its performance was improved without essentially changing its complexity. It is the most suitable for applications in video monitoring systems in seafloor observation networks for the detection of marine organisms.
3.5. Comparison of the Testing Results
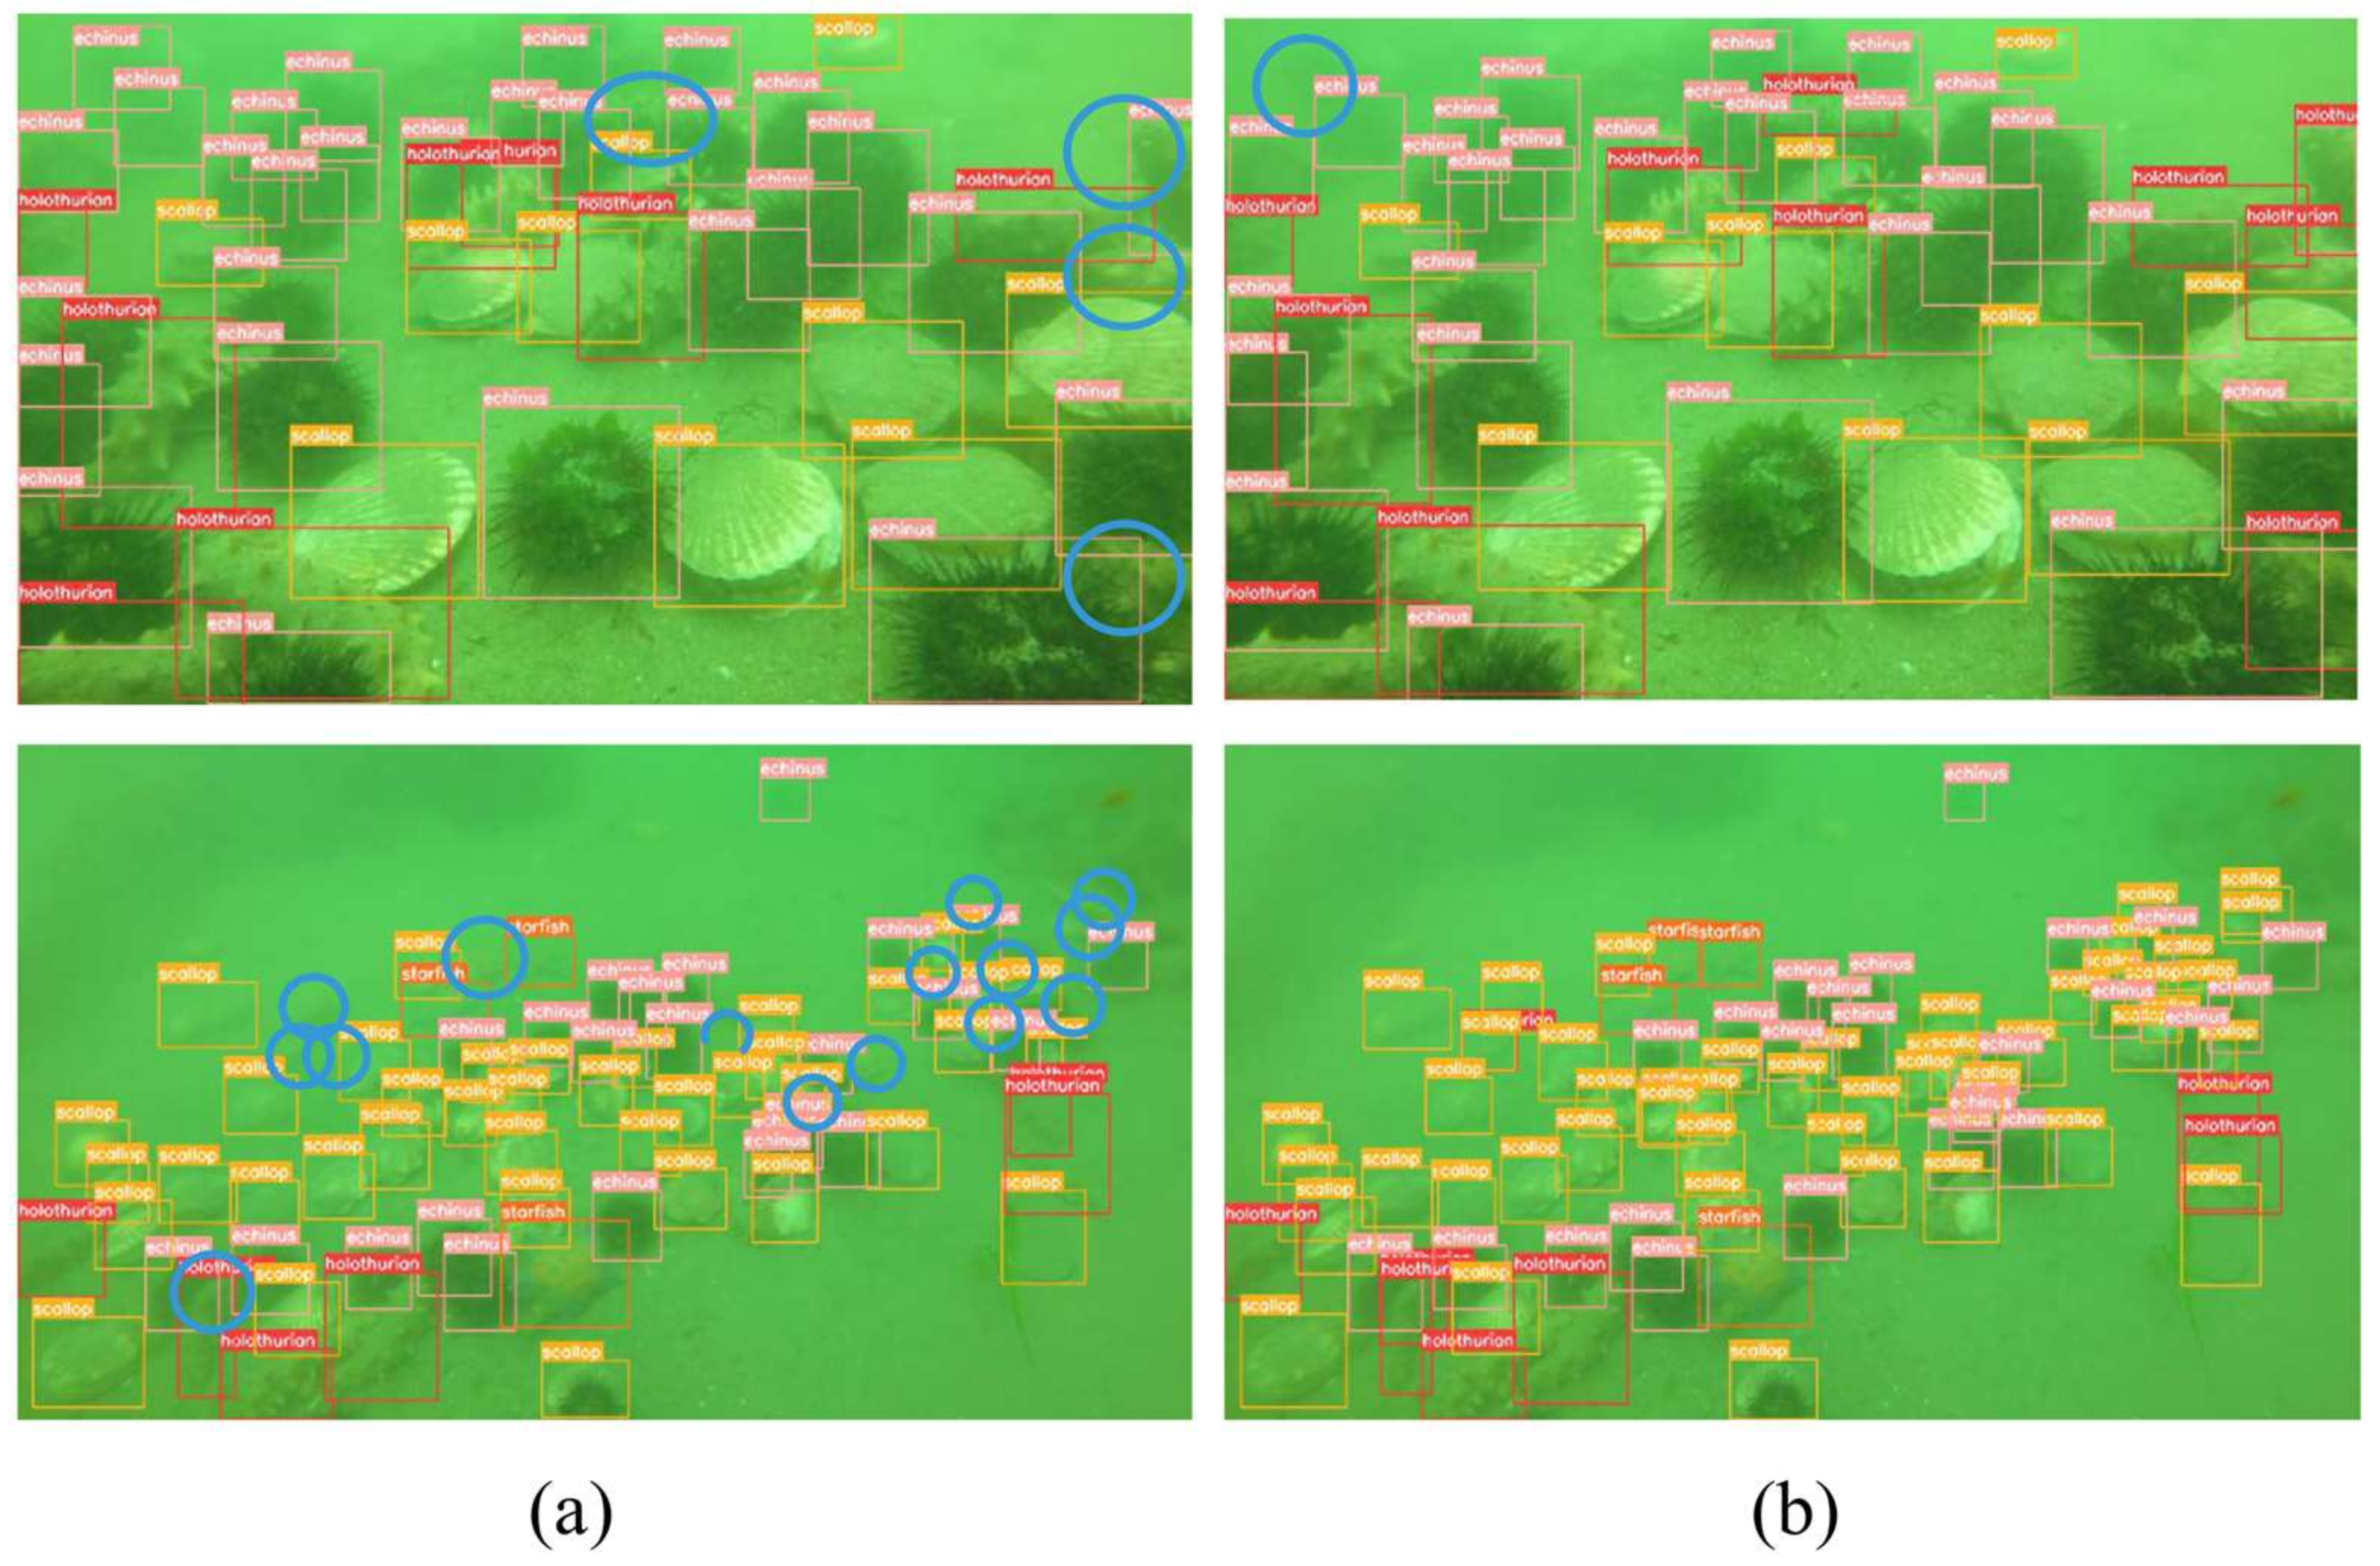
To compare the actual results of detection, we chose four groups of more complex images with small and overlapping targets to explore the actual performance of the two detection networks.
A comparison of the first two sets of detection results is shown in Figure 10. We have used blue circles to mark the misdetections and omissions. The first set of detection images contained a large number of overlapping targets at medium to close range. By comparing the first set of test images, we found that the improved YOLOv8 detected three more holothurians but missing an echinus. The second set of detection images were dominated by a large number of small overlapping targets at a distance. By counting the detected objects in the second group of images, it was seen that the improved YOLOv8 detected a total of 49 scallops (an improvement by 10), 4 starfish (an improvement by 1), 26 echini (an improvement by 2), and 8 holothurians (an improvement by 2). At the same time, the accuracy of target detection—especially for overlapping targets—was significantly improved.
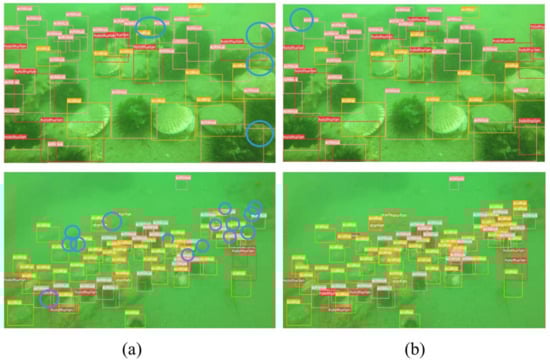
Figure 10.
Comparison of detections 1: (a) detection by YOLOv8; (b) detection by improved YOLOv8.
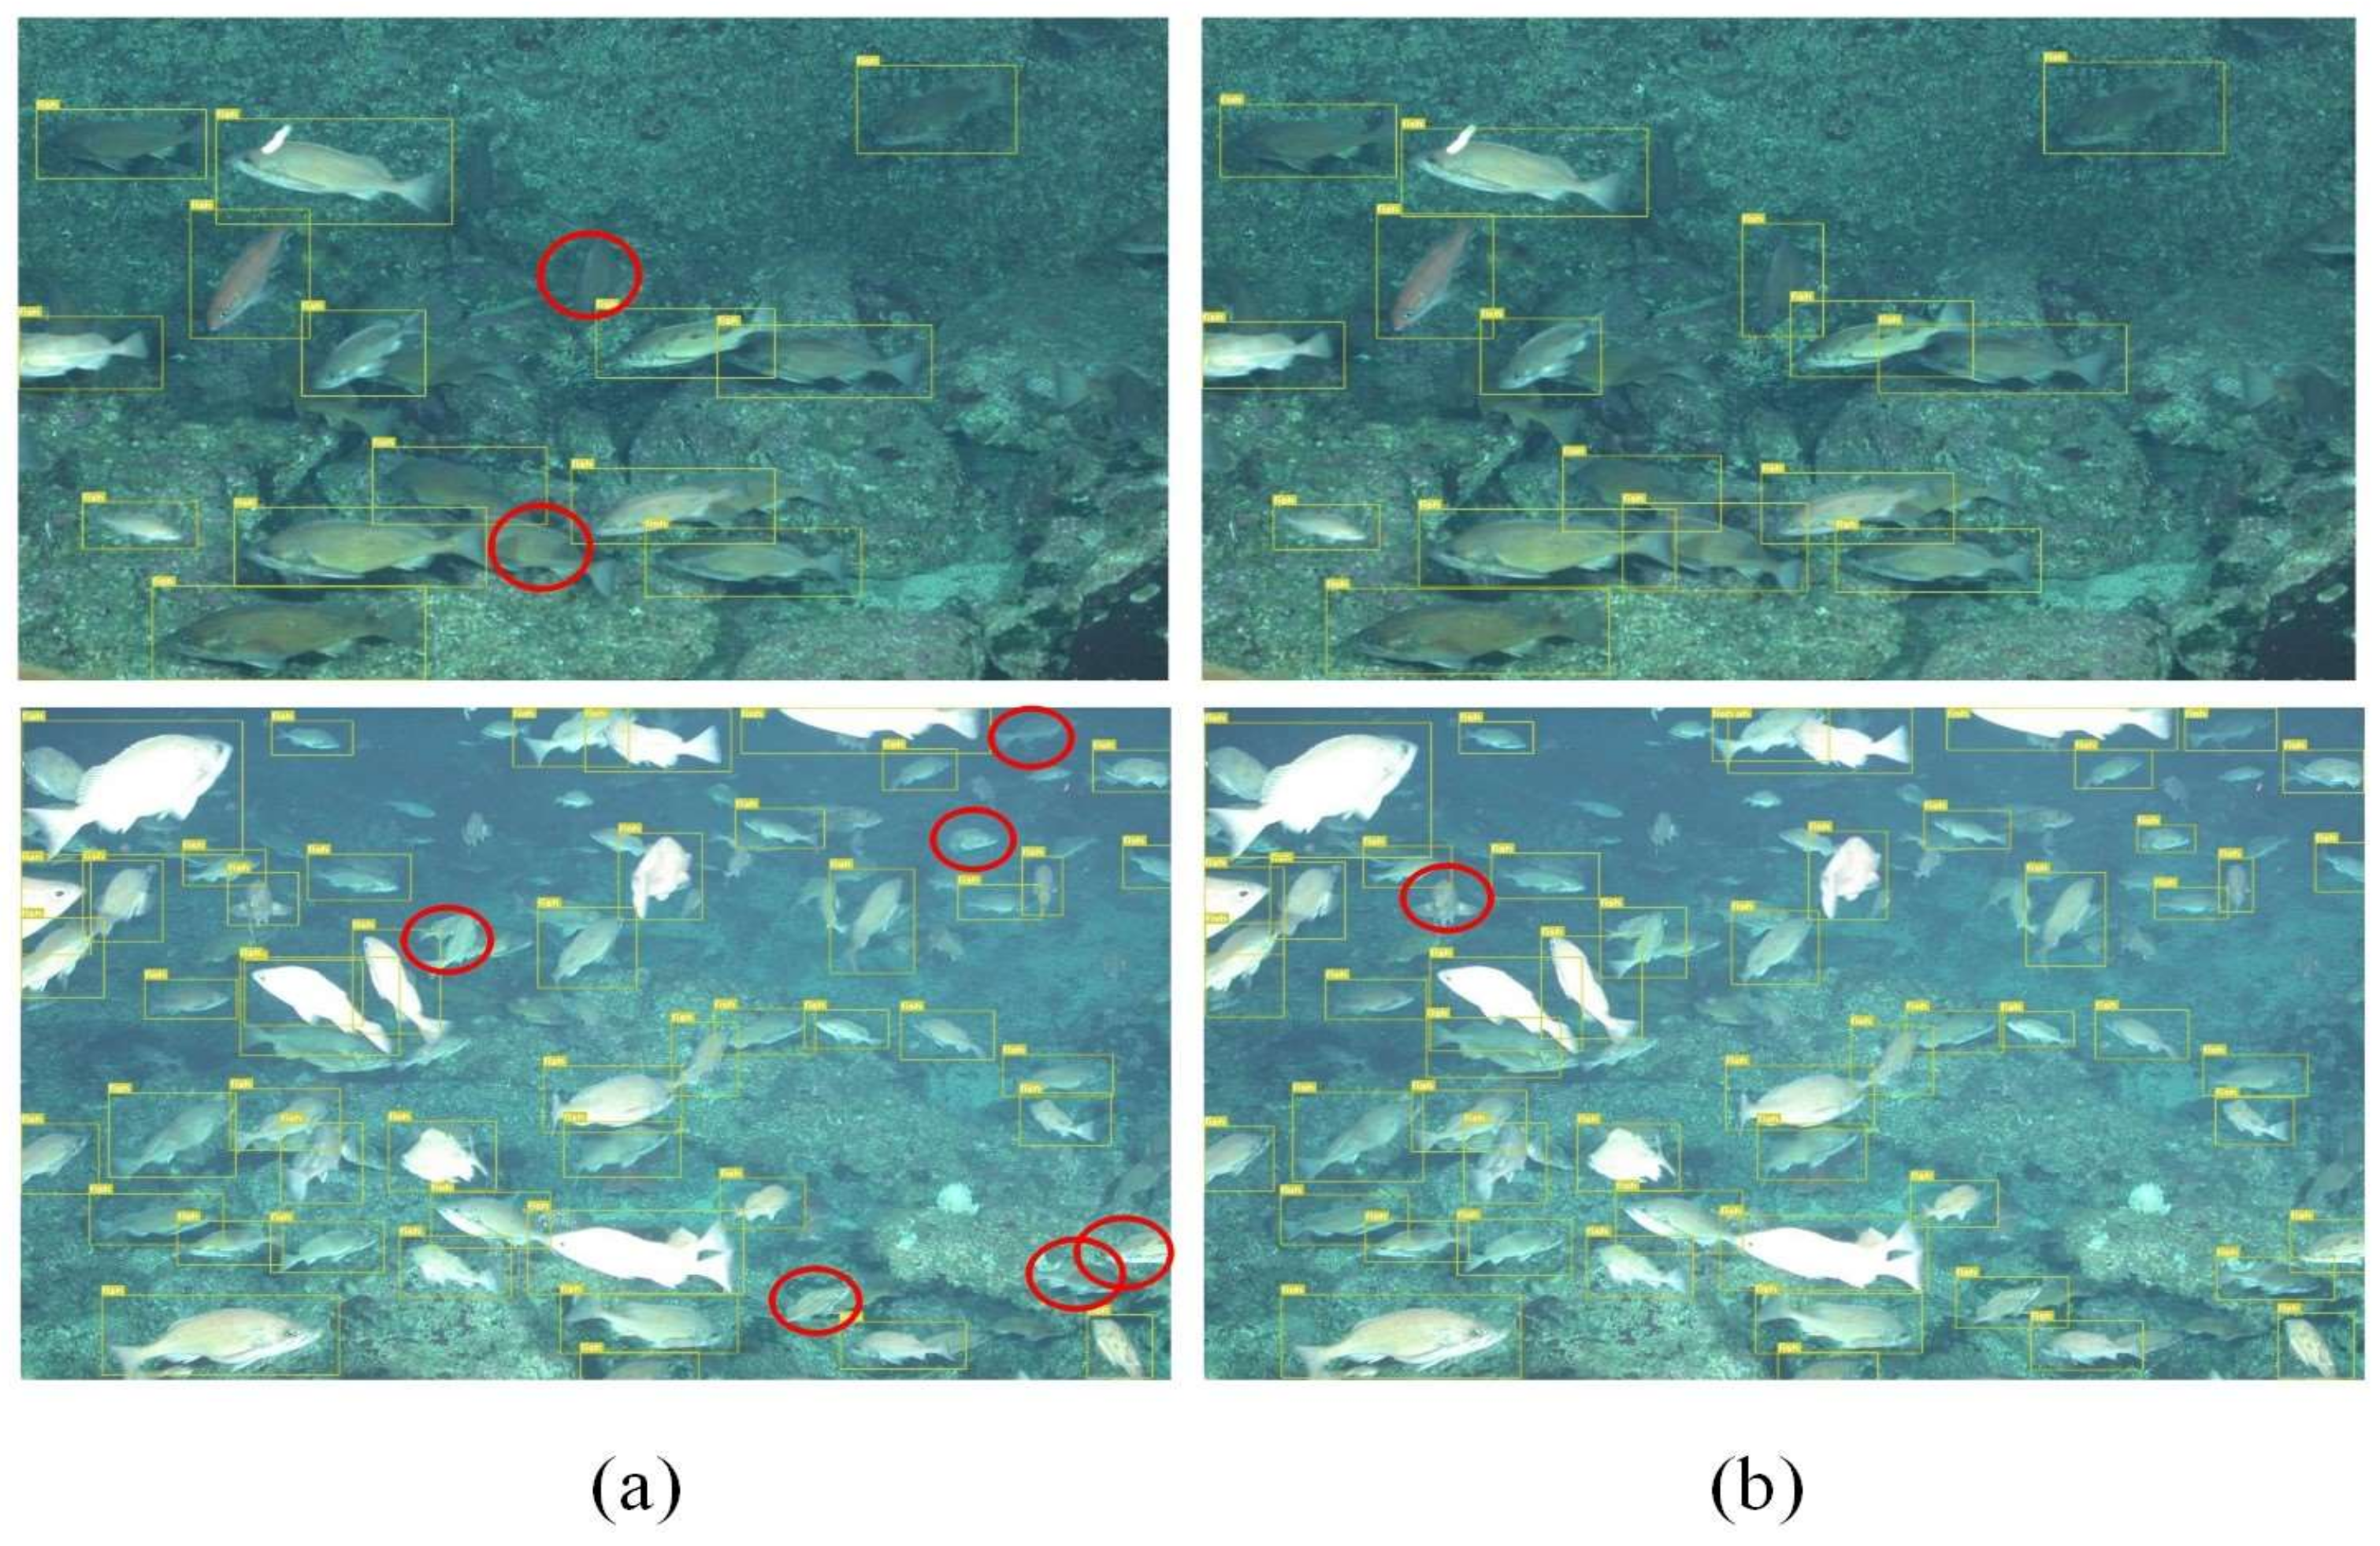
A comparison of the detection results of the latter two groups is shown in Figure 11. We have used red circles to mark the misdetections and omissions. The third and fourth groups of images mainly contained dense schools of fish. It could be seen that in the third group, the improved YOLOv8 detected sixteen fish, which was two more heavily obscured fish than the ordinary version of the detector found. In the fourth set of images, the improved YOLOv8 detected a total of 54 fish. Compared to the normal version, six more items were detected, and there was one missed item. This experiment proved that in the face of the small- and medium-sized targets and greater amount of overlap in marine ranch environment, the improved YOLOv8 performed better than the ordinary YOLOv8 and was more suitable for the detection of marine organisms under such conditions.
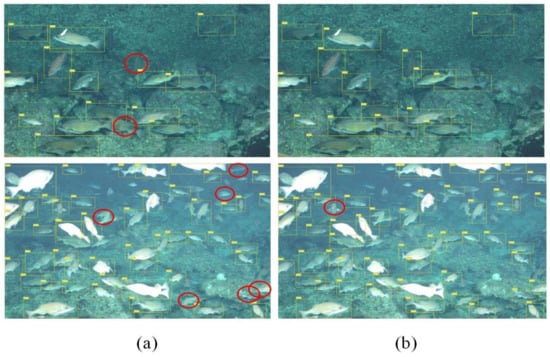
Figure 11.
Comparison of detections 2: (a) detection by YOLOv8; (b) detection by improved YOLOv8.
3.6. Ablation Study
In this section, we evaluate the impact of each part on the overall performance by separately conducting experiments on each improvement module. The whole process of improving the experiments is also shown.
3.6.1. InceptionNeXt Block
Here, we focused on replacing the C2F block at different positions in YOLOv8 with the InceptionNeXt block and experimentally comparing the model performance. From there, the most appropriate improvement was found. A comparison of the effects of replacing these positions is shown in Table 3. The experiment was divided into four groups: the original YOLOv8, the C2F block that replaced only the neck, the C2F block that replaced only the backbone, and all of them. The replacement positions are shown in parentheses. It is worth noting that, at first, we tried to replace all of the C2F blocks in the model with InceptionNeXt blocks, but the results were not good. This was likely because the changes were excessive and destabilized the model. So, we tried other programs separately. Ultimately, replacing only the backbone portion of the C2F block worked the best, and there was an mAP improvement of about 2.1%.
Table 3.
Comparison of replacing positions.
3.6.2. Attention Mechanisms
Undoubtedly, attention mechanisms have a significant impact on the performance of target detection models. They can improve a model’s ability to extract effective features for learning, thus improving the performance of the whole model. Therefore, we chose the classical attention mechanisms SE [40] and CBAM [41] for a comparison. The SEAM was the most effective. The corresponding losses of occluded marine organisms could be compensated by enhancing the response of nonoccluded marine organisms. The mAP was increased by about 1.7%. A comparison of the different attention mechanisms is shown in Table 4.
Table 4.
Comparison of different attention mechanisms.
3.6.3. Loss Function
Finally, by adding the NWD loss to the original CIoU loss to enhance the detection performance for small targets, the mAP was improved by about 2.0%. It is worth noting that, at the beginning of the experiment, we tried to use the NWD loss to completely replace the original CIoU loss. However, the effect was not ideal, and the detection performance was not increased but decreased. This was likely because the NWD loss reduced the detection performance for medium and large targets. Therefore, we chose to retain the original CIoU loss and adjust the proportions of the two loss functions to find the optimal combination. The experimental results are shown in Table 5.
Table 5.
Loss function comparison.
4. Conclusions
This study aimed to improve the efficiency of monitoring target marine organisms in marine ranches. At the same time, the workload of staff can be reduced, and a new way of thinking for the efficient management of relevant aquatic organisms in marine ranches is provided. To achieve this goal, we attempted to improve the YOLOv8 detector as the basis of the study. Firstly, the InceptionNeXt block was used in the backbone to replace the original C2F block, which improved the feature extraction capabilities of the network while keeping the number of parameters basically unchanged. Secondly, the SEAM was incorporated into the neck to enhance the detection of overlapping targets by increasing the attention to the detected object regions in images and weakening the background regions. Finally, the NWD loss was added to the original CIoU loss, and the proportion of the two functions was adjusted through experimentation. This resulted in improved detection of small targets without compromising the detection performance for medium and large targets. The traditional enhancement method of performing several types of random transformations on images and a data enhancement method combining mosaic and MixUp were used to improve the dataset during the training process, which enhanced the robustness of the network in an attempt to obtain good results with limited resources. Overall, the improved YOLOv8 in this study achieved a mAP of 84.5%, which was an increase of 6.2%. Meanwhile, there was no significant increase in the number of parameters and computations, so a balance between detection performance and model volume was achieved. With its fair performance, it can be applied in seafloor observation platforms in marine ranches to complete the task of the real-time detection of marine organisms. However, there are still some areas that can be improved, including the following.
First, the dataset can be further improved. The dataset used here still suffered from a small and uneven sample size. In the future, we can consider acquiring more videos and images for model training and testing. There was also a serious imbalance in the number of individual detection categories in the dataset, so we can consider balancing the number of samples. Second, underwater images are different from land images because of the presence of low-contrast, non-uniform illumination, blurring, bright spots, and high noise due to a variety of complicating factors. The images in the dataset can be enhanced with image enhancement algorithms to improve their clarity and facilitate subsequent work. Finally, further improvements and test models can be considered to make this system more lightweight and faster so that it can be better adapted to embedded devices on experimental platforms, thus opening it to a wider range of applications.
Author Contributions
Conceptualization, R.J.; Methodology, R.J. and L.C.; Formal analysis and investigation, M.L. and J.C.; Writing—original draft preparation, R.J.; Writing—review and editing, B.L. and H.L. All authors have read and agreed to the published version of the manuscript.
Funding
This study is supported in part by Qilu University of Technology (Shandong Academy of Sciences) Pilot Project of Science, Education, and Industry Integration Major Innovation Special Project “Project of Unveiling System”, Pivotal Technologies for Ocean Intelligent Sensing and Information Processing Based on End-to-End Cloud Architecture [No.2023JBZ02], the National Natural Science Foundation of China (42106172), Project Plan of Pilot Project of Integration of Science, Education and Industry of Qilu University of Technology (Shandong Academy of Sciences) (2022GH004, 2022PY041).
Institutional Review Board Statement
Not applicable.
Informed Consent Statement
Not applicable.
Data Availability Statement
The data presented in this study are available on request from the corresponding author.
Conflicts of Interest
The authors declare that they have no conflicts of interest or competing financial and/or nonfinancial interests in relation to this work.
References
- Agardy, T. Effects of fisheries on marine ecosystems: A conservationist’s perspective. ICES J. Mar. Sci. 2000, 57, 761–765. [Google Scholar] [CrossRef]
- Greenville, J.; MacAulay, T. Protected areas in fisheries: A two-patch, two-species model. Aust. J. Agric. Resour. Econ. 2006, 50, 207–226. [Google Scholar] [CrossRef]
- Hu, K.; Weng, C.; Zhang, Y.; Jin, J.; Xia, Q. An Overview of Underwater Vision Enhancement: From Traditional Methods to Recent Deep Learning. J. Mar. Sci. Eng. 2022, 10, 241. [Google Scholar] [CrossRef]
- Girshick, R.; Donahue, J.; Darrell, T.; Malik, J. Rich feature hierarchies for accurate object detection and semantic segmentation. In Proceedings of the IEEE Conference on Computer Vision and Pattern Recognition (CVPR), Columbus, OH, USA, 23–28 June 2014; pp. 580–587. [Google Scholar] [CrossRef]
- Girshick, R. Fast R-CNN. In Proceedings of the IEEE International Conference on Computer Vision, Santiago, Chile, 7–13 December 2015; pp. 1440–1448. [Google Scholar] [CrossRef]
- Ren, S.; He, K.; Girshick, R.; Sun, J. Faster R-CNN: Towards Real-Time Object Detection with Region Proposal Networks. IEEE Trans. Pattern Anal. Mach. Intell. 2017, 39, 1137–1149. [Google Scholar] [CrossRef] [PubMed]
- Lin, W.; Zhong, J.; Liu, S.; Li, T.; Li, G. ROIMIX: Proposal-Fusion Among Multiple Images for Underwater Object Detection. In Proceedings of the International Conference on Acoustics, Speech, and Signal Processing, Barcelona, Spain, 4–8 May 2020. [Google Scholar] [CrossRef]
- Redmon, J.; Divvala, S.; Girshick, R.; Farhad, A. You Only Look Once: Unified, Real-Time Object Detection. In Proceedings of the Computer Vision & Pattern Recognition, Las Vegas, NV, USA, 26 June–1 July 2016. [Google Scholar] [CrossRef]
- Redmon, J.; Farhadi, A. YOLOv3: An Incremental Improvement. arXiv 2018, arXiv:1804.02767. [Google Scholar] [CrossRef]
- Bochkovskiy, A.; Wang, C.; Liao, H. YOLOv4: Optimal Speed and Accuracy of Object Detection. arXiv 2020, arXiv:2004.10934. [Google Scholar] [CrossRef]
- Wang, C.; Bochkovskiy, A.; Liao, H. YOLOv7: Trainable bag-of-freebies sets new state-of-the-art for real-time object detectors. arXiv 2022, arXiv:2207.02696. [Google Scholar] [CrossRef]
- Han, F.; Yao, J.; Zhu, H.; Wang, C. Underwater Image Processing and Object Detection Based on Deep CNN Method. J. Sens. 2020, 2020, 6707328. [Google Scholar] [CrossRef]
- Chen, L.; Zheng, M.; Duan, S.; Luo, W.; Yao, L. Underwater Target Recognition Based on Improved YOLOv4 Neural Network. Electronics 2021, 10, 1634. [Google Scholar] [CrossRef]
- Zhao, S.; Zhang, S.; Lu, J.; Wang, H.; Feng, Y.; Shi, C.; Li, D.; Zhao, R. A lightweight dead fish detection method based on deformable convolution and YOLOV4. Comput. Electron. Agric. 2022, 198, 107098. [Google Scholar] [CrossRef]
- Sun, S.; Xu, Z. Large kernel convolution YOLO for ship detection in surveillance video. Math. Biosci. Eng. MBE 2023, 20, 15018–15043. [Google Scholar] [CrossRef] [PubMed]
- Zhang, Q.; Li, Y.; Zhang, Z.; Yin, S.; Ma, L. Marine target detection for PPI images based on YOLO-SWFormer. Alex. Eng. J. 2023, 82, 396–403. [Google Scholar] [CrossRef]
- Shen, X.; Wang, H.; Li, Y.; Gao, T.; Fu, X. Criss-cross global interaction-based selective attention in YOLO for underwater object detection. Multimed. Tools Appl. 2023. [Google Scholar] [CrossRef]
- Yu, G.; Su, J.; Luo, Y.; Chen, Z.; Chen, Q.; Chen, S. Efficient detection method of deep-sea netting breakage based on attention and focusing on receptive-field spatial feature. Signal Image Video Process. 2023. [Google Scholar] [CrossRef]
- Lv, C.; Cao, S.; Zhang, Y.; Xu, G.; Zhao, B. Methods studies for attached marine organisms detecting based on convolutional neural network. Energy Rep. 2022, 8, 1192–1201. [Google Scholar] [CrossRef]
- Li, Y.; Bai, X.; Xia, C. An Improved YOLOV5 Based on Triplet Attention and Prediction Head Optimization for Marine Organism Detection on Underwater Mobile Platforms. J. Mar. Sci. Eng. 2022, 10, 1230. [Google Scholar] [CrossRef]
- Li, L.; Shi, G.; Jiang, T. Fish detection method based on improved YOLOv5. Aquac. Int. 2023, 31, 2513–2530. [Google Scholar] [CrossRef]
- Favali, P.; Beranzoli, L. Seafloor observatory science: A review. Ann. Geophys. 2006, 49, 515–567. [Google Scholar] [CrossRef]
- Matabos, M.; Best, M.; Blandin, J.; Hoeberechts, M.; Juniper, K.; Pirenne, B.; Robert, K.; Ruhl, H.; Sarrazin, J.; Vardaro, M. Seafloor Observatories: Clark/Biological Sampling in the Deep Sea; John Wiley & Sons, Ltd.: Hoboken, NJ, USA, 2016. [Google Scholar]
- Chen, J.; Liu, H.; Lv, B.; Liu, C.; Zhang, X.; Li, H.; Cao, L.; Wan, J. Research on an Extensible Monitoring System of a Seafloor Observatory Network in Laizhou Bay. J. Mar. Sci. Eng. 2022, 10, 1051. [Google Scholar] [CrossRef]
- Lv, B.; Chen, J.; Liu, H.; Chao, L.; Zhang, Z.; Zhang, X.; Gao, H.; Cai, Y. Design of deep-sea chemical data collector for the seafloor observatory network. Mar. Georesour. Geotechnol. 2022, 40, 1359–1369. [Google Scholar] [CrossRef]
- Yu, W.; Zhou, P.; Yan, S.; Wang, X. InceptionNeXt: When Inception Meets ConvNeXt. In Proceedings of the IEEE Conference on Computer Vision and Pattern Recognition (CVPR), Vancouver, BC, Canada, 18–22 June 2023. [Google Scholar] [CrossRef]
- Wang, C.; Liao, H.; Wu, Y.; Chen, P.; Hsieh, J.; Yeh, I. CSPNet: A new backbone that can enhance learning capability of CNN. In Proceedings of the IEEE/CVF Conference on Computer Vision and Pattern Recognition Workshops (CVPRW), Seattle, WA, USA, 14–19 June 2020. [Google Scholar] [CrossRef]
- Liu, Z.; Mao, H.; Wu, C.; Feichtenhofer, C.; Darrell, T.; Xie, S. A ConvNet for the 2020s. In Proceedings of the IEEE Computer Vision and Pattern Recognition (CVPR), New Orleans, LA, USA, 18–24 June 2022. [Google Scholar] [CrossRef]
- Chollet, F. Xception: Deep Learning with Depthwise Separable Convolutions. In Proceedings of the IEEE Conference on Computer Vision and Pattern Recognition (CVPR), Honolulu, HI, USA, 21–26 July 2017. [Google Scholar] [CrossRef]
- Ioffe, S.; Szegedy, C. Batch Normalization: Accelerating Deep Network Training by Reducing Internal Covariate Shift. In Proceedings of the 32nd International Conference on Machine Learning, Lille, France, 6–11 July 2015. [Google Scholar] [CrossRef]
- Szegedy, C.; Vanhoucke, V.; Ioffe, S.; Shlens, J.; Wojna, Z. Rethinking the inception architecture for computer vision. In Proceedings of the IEEE Conference on Computer Vision and Pattern Recognition, Las Vegas, NV, USA, 27–30 June 2016; pp. 2818–2826. [Google Scholar] [CrossRef]
- Szegedy, C.; Ioffe, S.; Vanhoucke, V.; Alemi, A. Inception-v4, Inception-ResNet and the Impact of Residual Connections on Learning. arXiv 2016, arXiv:1602.07261. [Google Scholar] [CrossRef]
- Szegedy, C.; Liu, W.; Jia, Y.; Pierre, S.; Scott, R.; Dragomir, A.; Dumitrue, E.; Vincent, V.; Andrew, R. Going deeper with convolutions. In Proceedings of the IEEE Conference on Computer Vision and Pattern Recognition (CVPR), Boston, MA, USA, 7–12 June 2015. [Google Scholar] [CrossRef]
- Liu, S.; Qi, L.; Qin, H.; Shi, J.; Jia, J. Path aggregation network for instance segmentation. In Proceedings of the IEEE/CVF Conference on Computer Vision and Pattern Recognition, Salt Lake City, UT, USA, 18–23 June 2018. [Google Scholar] [CrossRef]
- Yu, Z.; Huang, H.; Chen, W.; Su, Y.; Liu, Y.; Wang, X. YOLO-FaceV2: A Scale and Occlusion Aware Face Detector. In Proceedings of the IEEE Conference on Computer Vision and Pattern Recognition (CVPR), New Orleans, LA, USA, 18–24 June 2022. [Google Scholar] [CrossRef]
- Wang, J.; Xu, C.; Yang, W.; Lei, Y. A Normalized Gaussian Wasserstein Distance for Tiny Object Detection. In Proceedings of the IEEE Conference on Computer Vision and Pattern Recognition, Nashville, TN, USA, 20–25 June 2021. [Google Scholar] [CrossRef]
- Cutter, G.; Stierhoff, K.; Zeng, J. Automated Detection of Rockfish in Unconstrained Underwater Videos Using Haar Cascades. In Proceedings of the Applications and Computer Vision Workshops (WACVW), Waikoloa Beach, HI, USA, 5–9 January 2015. [Google Scholar] [CrossRef]
- Ge, Z.; Liu, S.; Wang, F.; Li, Z.; Sun, J. YOLOX: Exceeding YOLO Series in 2021. arXiv 2021, arXiv:2107.08430. [Google Scholar] [CrossRef]
- He, K.; Zhang, X.; Ren, S.; Sun, J. Deep residual learning for image recognition. In Proceedings of the IEEE Conference on Computer Vision and Pattern Recognition, Las Vegas, NV, USA, 26 June–1 July 2016; pp. 770–778. [Google Scholar] [CrossRef]
- Hu, J.; Shen, L.; Sun, G. Squeeze-and-Excitation Networks. In Proceedings of the IEEE/CVF Conf Computer Vision Pattern Recognition, Salt Lake City, UT, USA, 18–23 June 2018; pp. 7132–7141. [Google Scholar] [CrossRef]
- Woo, S.; Park, J.; Lee, J.-Y.; Kweon, S.I. CBAM: Convolutional block attention module. In Proceedings of the European Conference on Computer Vision (ECCV), Munich, Germany, 8–14 September 2018; pp. 3–19. [Google Scholar] [CrossRef]


Disclaimer/Publisher’s Note: The statements, opinions and data contained in all publications are solely those of the individual author(s) and contributor(s) and not of MDPI and/or the editor(s). MDPI and/or the editor(s) disclaim responsibility for any injury to people or property resulting from any ideas, methods, instructions or products referred to in the content. |
© 2023 by the authors. Licensee MDPI, Basel, Switzerland. This article is an open access article distributed under the terms and conditions of the Creative Commons Attribution (CC BY) license (https://creativecommons.org/licenses/by/4.0/).