Article

Analysis of Saturated Impulse for Square Plates under Flat Slamming Impact: Experimental and Numerical Investigation

by
Zhikui Zhu
1,2,
Ling Zhu
1,2,3,
Kailing Guo
1,2,* and
Xueliang Wang
4,5
1
Key Laboratory of High Performance Ship Technology, Wuhan University of Technology, Ministry of Education, Wuhan 430063, China
2
School of Naval Architecture, Ocean and Energy Power Engineering, Wuhan University of Technology, Wuhan 430063, China
3
Weihai Research Institute of Wuhan University of Technology, Weihai 264309, China
4
China Ship Scientific Research Center, Wuxi 214082, China
5
National Key Laboratory of Ship Structural Safety, Wuxi 214082, China
*
Author to whom correspondence should be addressed.
J. Mar. Sci. Eng. 2024, 12(10), 1730; https://doi.org/10.3390/jmse12101730
Submission received: 15 August 2024 / Revised: 18 September 2024 / Accepted: 24 September 2024 / Published: 1 October 2024
(This article belongs to the Special Issue Advances in Ships and Marine Structures)

Abstract

:
The saturated impulse is a special phenomenon in the dynamic plastic behavior of engineering structures under intensive pulse loading, such as slamming loading. In this study, slamming experiments were performed on steel plates to investigate their slamming pressure and dynamic plastic responses, as well as the saturation phenomenon, and elucidate the effect of the plate thickness and material properties on the dimensionless saturated deflection and saturated impulse in combination with the published test data. The results show that the dimensionless saturated deflection and saturated impulse of the test plates gradually increased as the dimensionless stiffness decreased. After being validated against the experimental results, a numerical method that considered the fluid–structure interaction (FSI) effect was then employed to provide comprehensive insight into the transient plastic responses and saturated impulse of the flat plates under slamming impact. Numerical simulations revealed that the compressed air layer always existed during the effective process of the flat slamming impact. Through the numerical prediction of the dynamic plastic deflection and slamming pulse loading, it was observed that the saturated impulse phenomenon always took place after the time instant of the peak value of the pressure pulse. Furthermore, the analysis of the saturated impulse based on the numerical simulations indicated that the saturation phenomenon was more likely to be achieved as the water impact velocity increased.

1. Introduction

Ships and marine structures are commonly exposed to wave impacts during service, such as bottom and bow flare slamming, which may cause severe local structural damage [1] or global collapse of the ship hull girder [2]. Various types of ship structural damage, including plastic damage of the ship plate, web plate bulking, and web shearing, have been reported. Over the past years, the hydroelastic responses of the structures under slamming loads were widely studied and a lot of valuable experimental, analytical, and numerical results have been published [3,4,5,6,7].
To investigate the elastic–plastic responses of ship structures under slamming pressure, Chuang [8] experimentally studied the effects on flat-bottomed plates and found that the plate had undergone plastic deformation due to a large water impact velocity. Mori [9] experimentally studied the elastoplastic responses of the flat stiffened plates of an aluminum high-speed craft that suffered from slamming loading and employed the finite strip method to predict the dynamic responses of the stiffened plate. Shin et al. [10] investigated the cumulative plastic deformation of ship plates subjected to multiple slamming pressure pulses by conducting repeated drop tests. Abrahamsen et al. [11] investigated the dynamic plastic deformations of aluminum plates during slamming impacts based on experimental and theoretical methods. Recently, Zhu et al. [12] investigated the large plastic responses of square plates by carrying out drop tests and verified the saturated impulse phenomenon of the ship plates based on the test results for the first time, which indicated that considering the effect of saturated impulse would more accurately predict the plastic deformation of the ship plates under a slamming impact.
Due to the complexity and limitations of the slamming test, powerful numerical tools have been widely employed to simulate the slamming impacts of marine structures in recent years, for instance, FEM [13], the SPH method [14], CFD [15], and CEL [16]. In addition, many numerical studies on the slamming problem for marine structures using the arbitrary Lagrange–Eulerian (ALE) method have been reported. Luo et al. [17] numerically simulated the dynamic responses and slamming pressure of a stiffened plate. Stenius et al. [18] numerically investigated the slamming impact of ship plates based on the ALE method and confirmed the significance of hydroelasticity in predicting the structural responses. Wang and Guedes Soares [19] numerically studied the slamming impact of 3D bodies and revealed that the mesh density of the model and contact stiffness are essential to the numerical results. Yu et al. [20] employed the numerical method to validate the proposed analytical method for predicting the plastic response of stiffened beams under slamming loading. Wang et al. [21] numerically investigated the dynamic responses of the composite sandwich panels and validated the numerical simulations against the test results. Truong et al. [22,23] validated the numerical method in comparison with the existing test data, and then proposed a model for a water-hitting structure that can be used to study the slamming loads of offshore structures. After this, Truong et al. [24] carried out a benchmark study on the dynamic response of stiffened plates by considering the FSI.
In addition to the numerical method, the theoretical method is another essential tool for providing quick predictions on the plastic damage of ship structures under slamming loads. Jones [25] developed a theoretical method using the rigid–perfectly plastic (R-PP) model to estimate the plastic deflection of the ship plates under slamming impact and found that the plastic deflection of the plate would come to rest during the decaying phase or even rising phase of the slamming loads if the pulse loading had a relatively long duration. This special phenomenon was not explored until the 1990s when Zhao and Yu [26,27] first defined it as a saturated impulse phenomenon based on a study of the dynamic responses of rigid–perfectly plastic beams, plates, and cylindrical shells under a rectangular pressure pulse. After this, Zhu and Yu [28] defined two types of saturated impulse associated with the maximum deflection and permanent deflection, respectively, in the analysis of the elastoplastic dynamic response. In recent years, saturation analysis for R-PP beams and plates under various pulse loadings, such as a linearly decaying pulse and a linearly rising exponentially decaying (LRED) pulse, was conducted [29]. Furthermore, the saturated impulse of the ship plates during a slamming impact was verified and analyzed for the first time by using the experimental method [12].
Extensive research was conducted on the dynamic responses of marine structures against slamming loads. However, there were few experimental and numerical studies that considered the FSI on the larger plastic response and the special saturation phenomenon of the structures under a slamming impact. Therefore, the purpose of this work was to study the saturated impulse of the flat plates under slamming impact based on experimental and numerical methods. In this study, the drop tests of the flat steel plates were first conducted. The associated relationship between the pressure pulse and the plastic response of the steel plates with the drop height is discussed herein. The effects of the material properties and thickness of the flat plates on the dimensionless saturated deflection and saturated impulse were analyzed in combination with available test data. Then, a numerical method that considered the FSI, which was validated with the experimental results, was employed to simulate the flat slamming impact of the plates, in which the associated phenomenon of the compressed air layer during the process of slamming impact is discussed herein. Lastly, the saturated impulse was numerically analyzed by combining the plastic dynamic deflection with the predicted pressure pulse of the plates.

2. Experiments

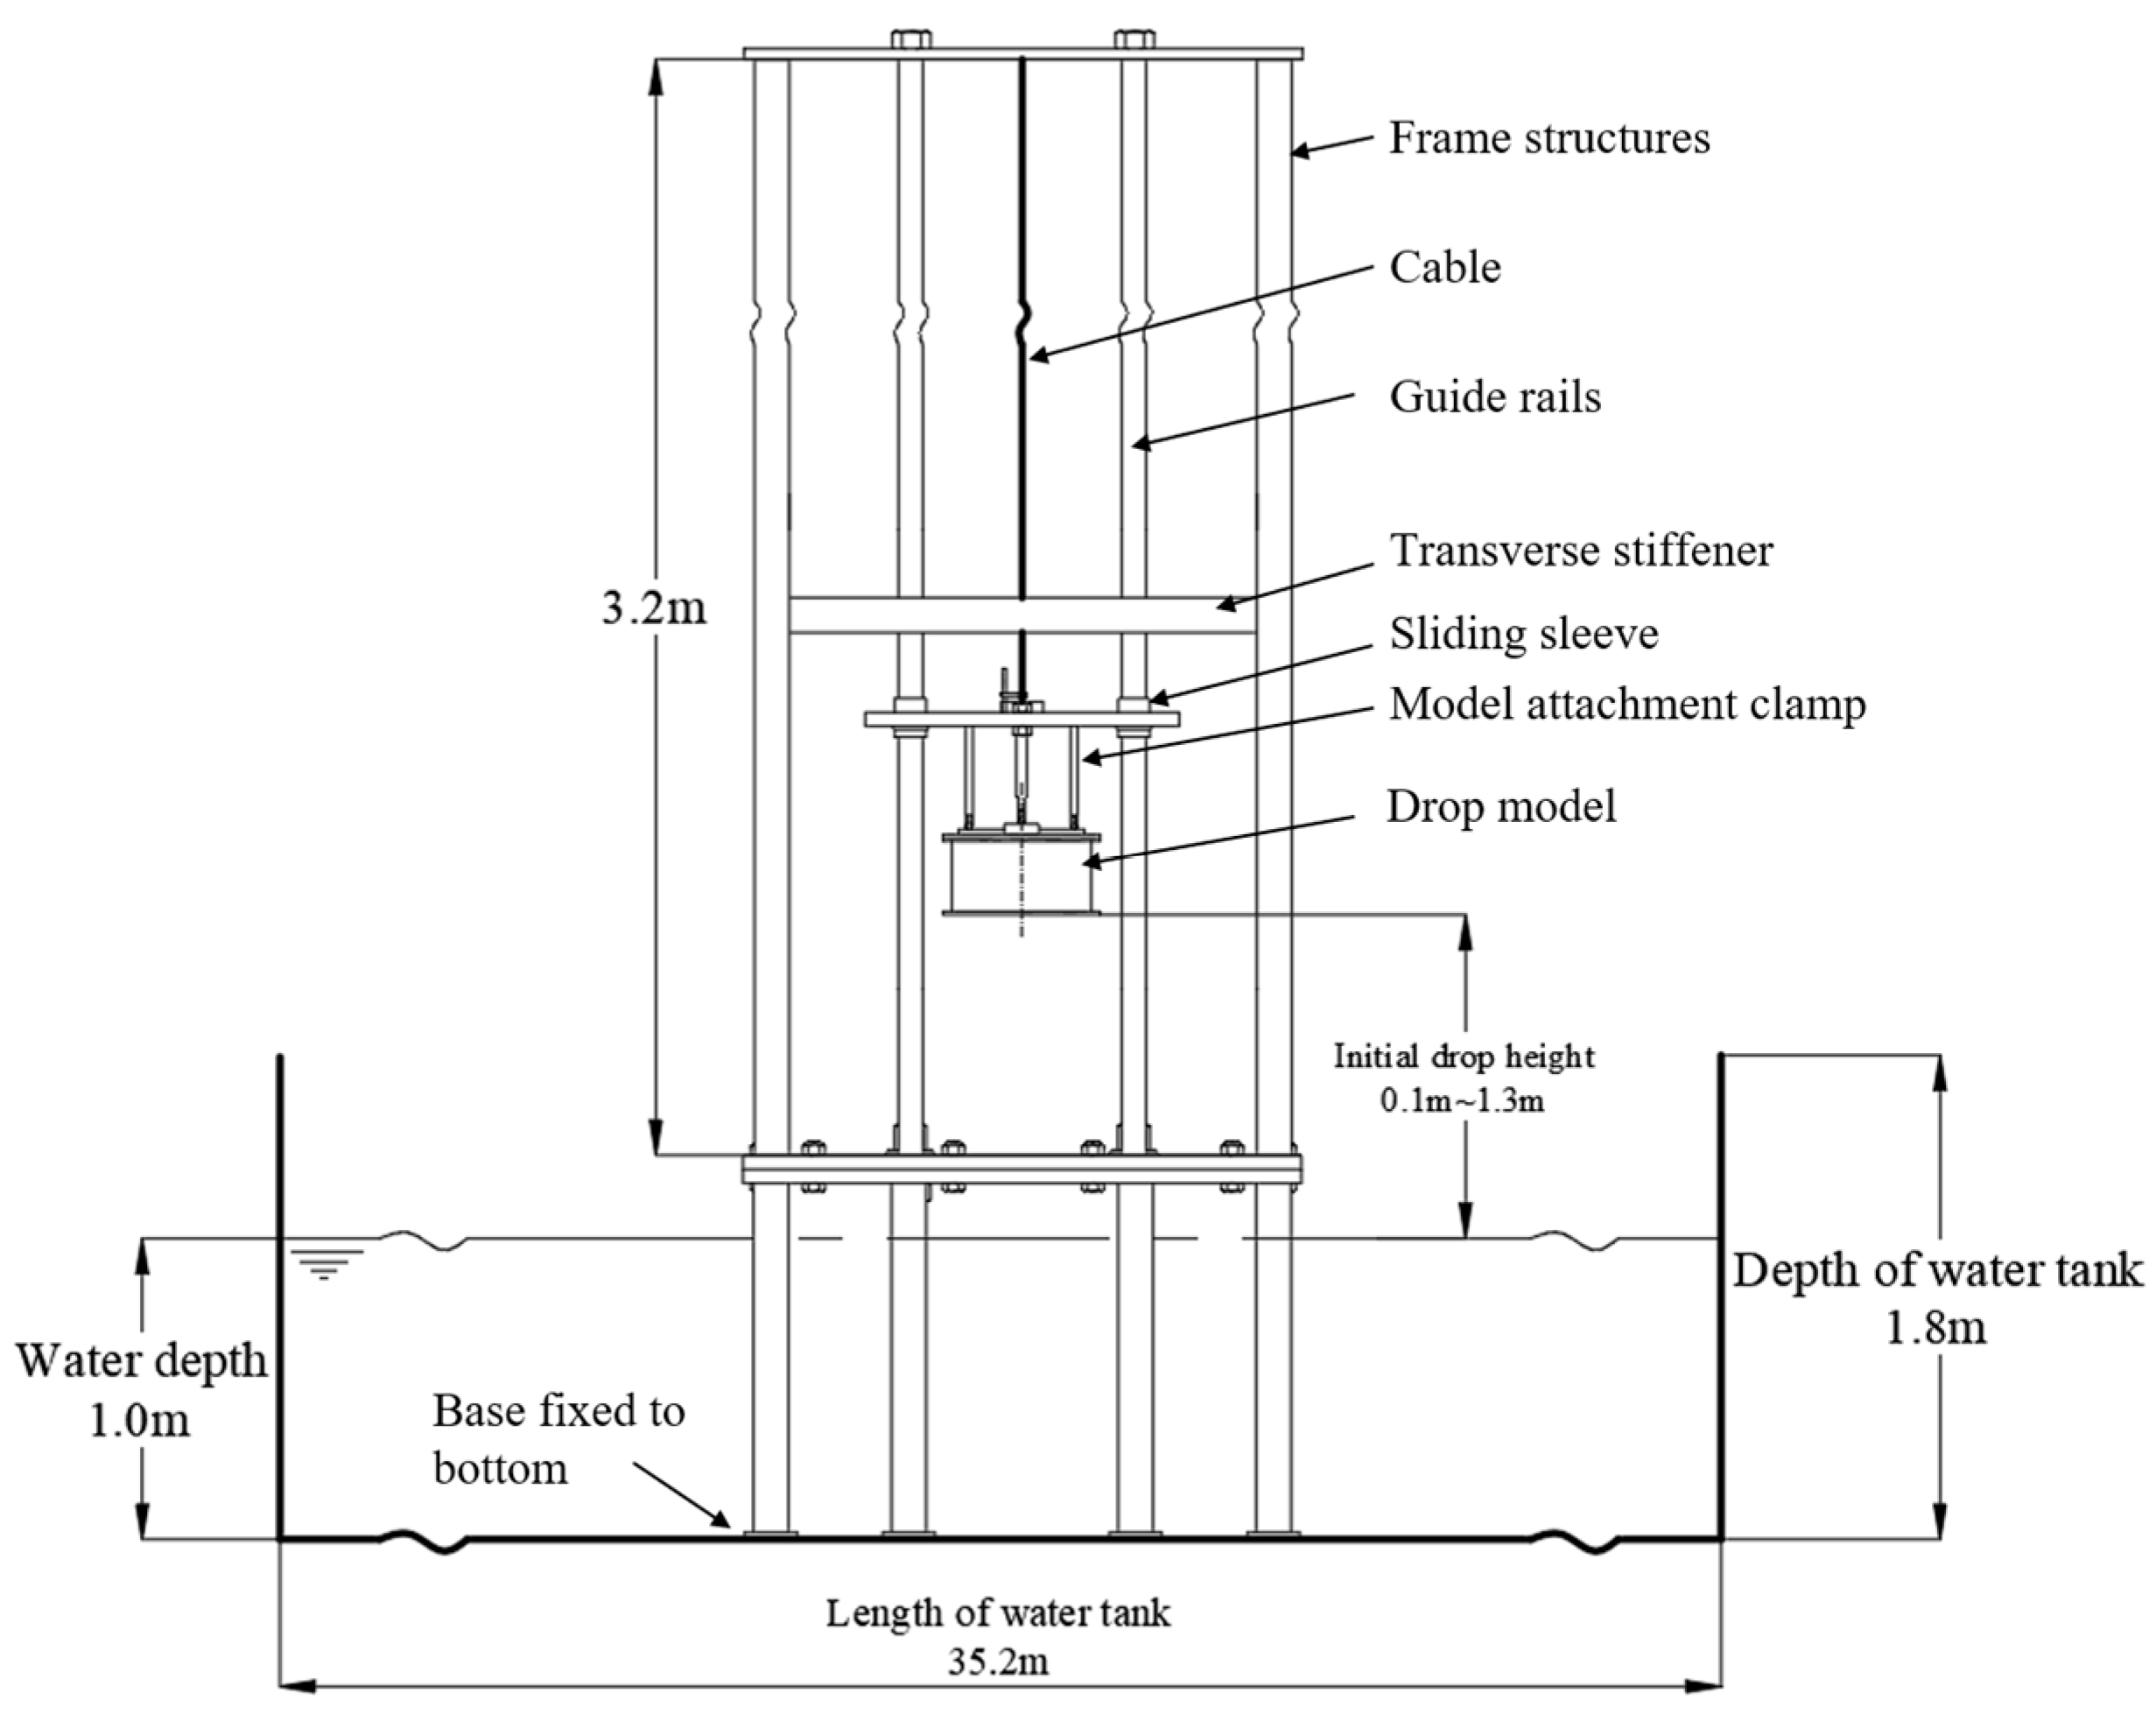
2.1. Experimental Setup

The experiments for investigating the saturated impulse of the square plates were conducted by using the drop tower at the Wuhan University of Technology [12], which is presented schematically in Figure 1. In this study, the drop tower was used to carry out the experimental study on the square plates under flat slamming impact.
As shown in Figure 2, two identical square steel plates with a length of 350 mm were mounted on each side of a rectangular fixture to prevent mutual interference [12], and a clamping plate with 24 bolts was applied to model the clamped boundary condition. During the test, the dynamic strain and slamming pressure were recorded by the strain gauge (S1) and pressure sensors (P1 and P2) installed on the two identical test plates. A synchronous acquisition instrument was used to make sure that the strain and slamming pressure were simultaneously measured. After each test, the 3D-scanning instrument was utilized to capture the lateral permanent deflection of the test plate. Furthermore, it is noted that the initial impact velocity of the test model has been reported in the published experimental study [12], and the measurements indicate that the drop model was approximately in free fall motion during the tests. More information about the experimental facilities and instrumentation can be found in ref. [12].

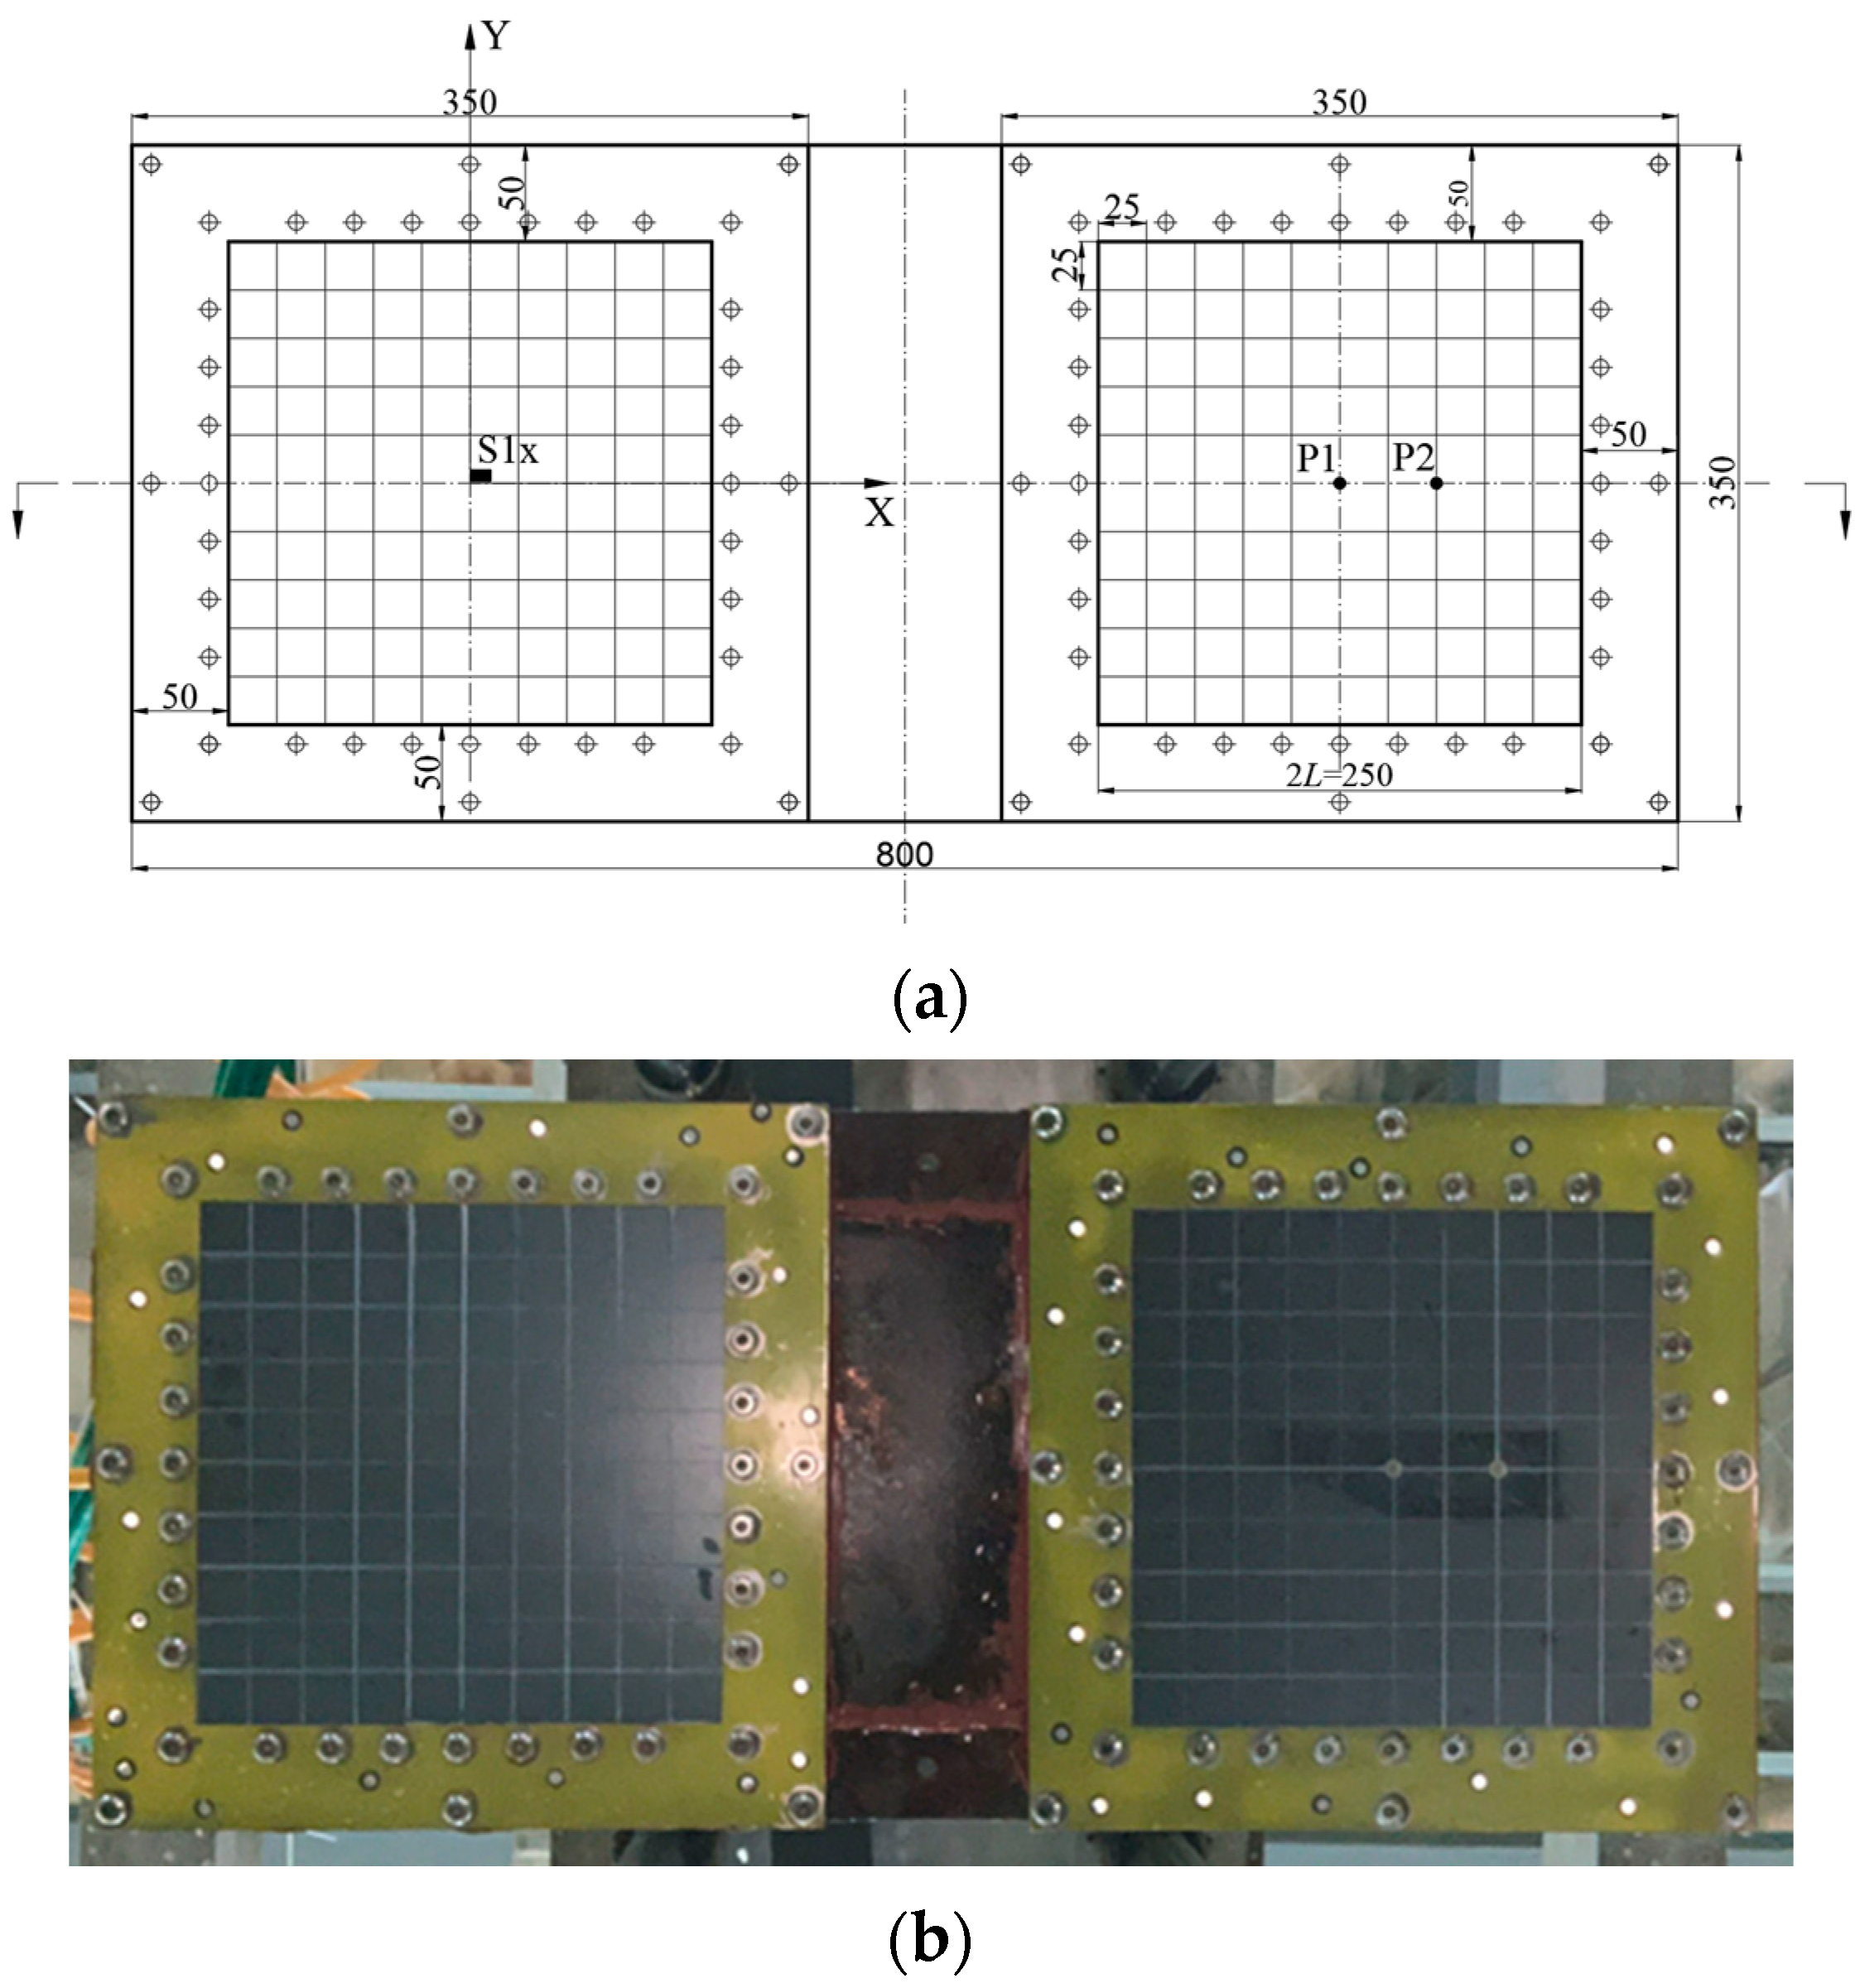
2.2. Specimens and Test Conditions

In this study, the test specimen was made of mild steel with dimensions of 0.35 × 0.35 × 0.001 m, where the effective dimensions were 0.25 × 0.25 × 0.001 m. Uniaxial tensile tests of the steel plates were carried out on a universal testing machine, and the tests were repeated three times to check the accuracy. The tensile stress–strain curves obtained in the three tests are shown by three colors in Figure 3. The nominal stress σ N was obtained by the tensile force divided by the original cross-sectional area of the tensile specimen, and the corresponding nominal strain ε N was the result of dividing the tensile elongation by the original length of the tensile specimen. The true stress σ T and true strain ε T were calculated by the following equations:
σ T = σ N 1 + ε N ,   ε T = ln 1 + ε N
Table 1 summarizes all drop test conditions for steel plates. It should be noted that since the reliability of the test results measured from the experimental system were confirmed in ref. [12], the test repeatability was not further examined.

2.3. Experimental Results

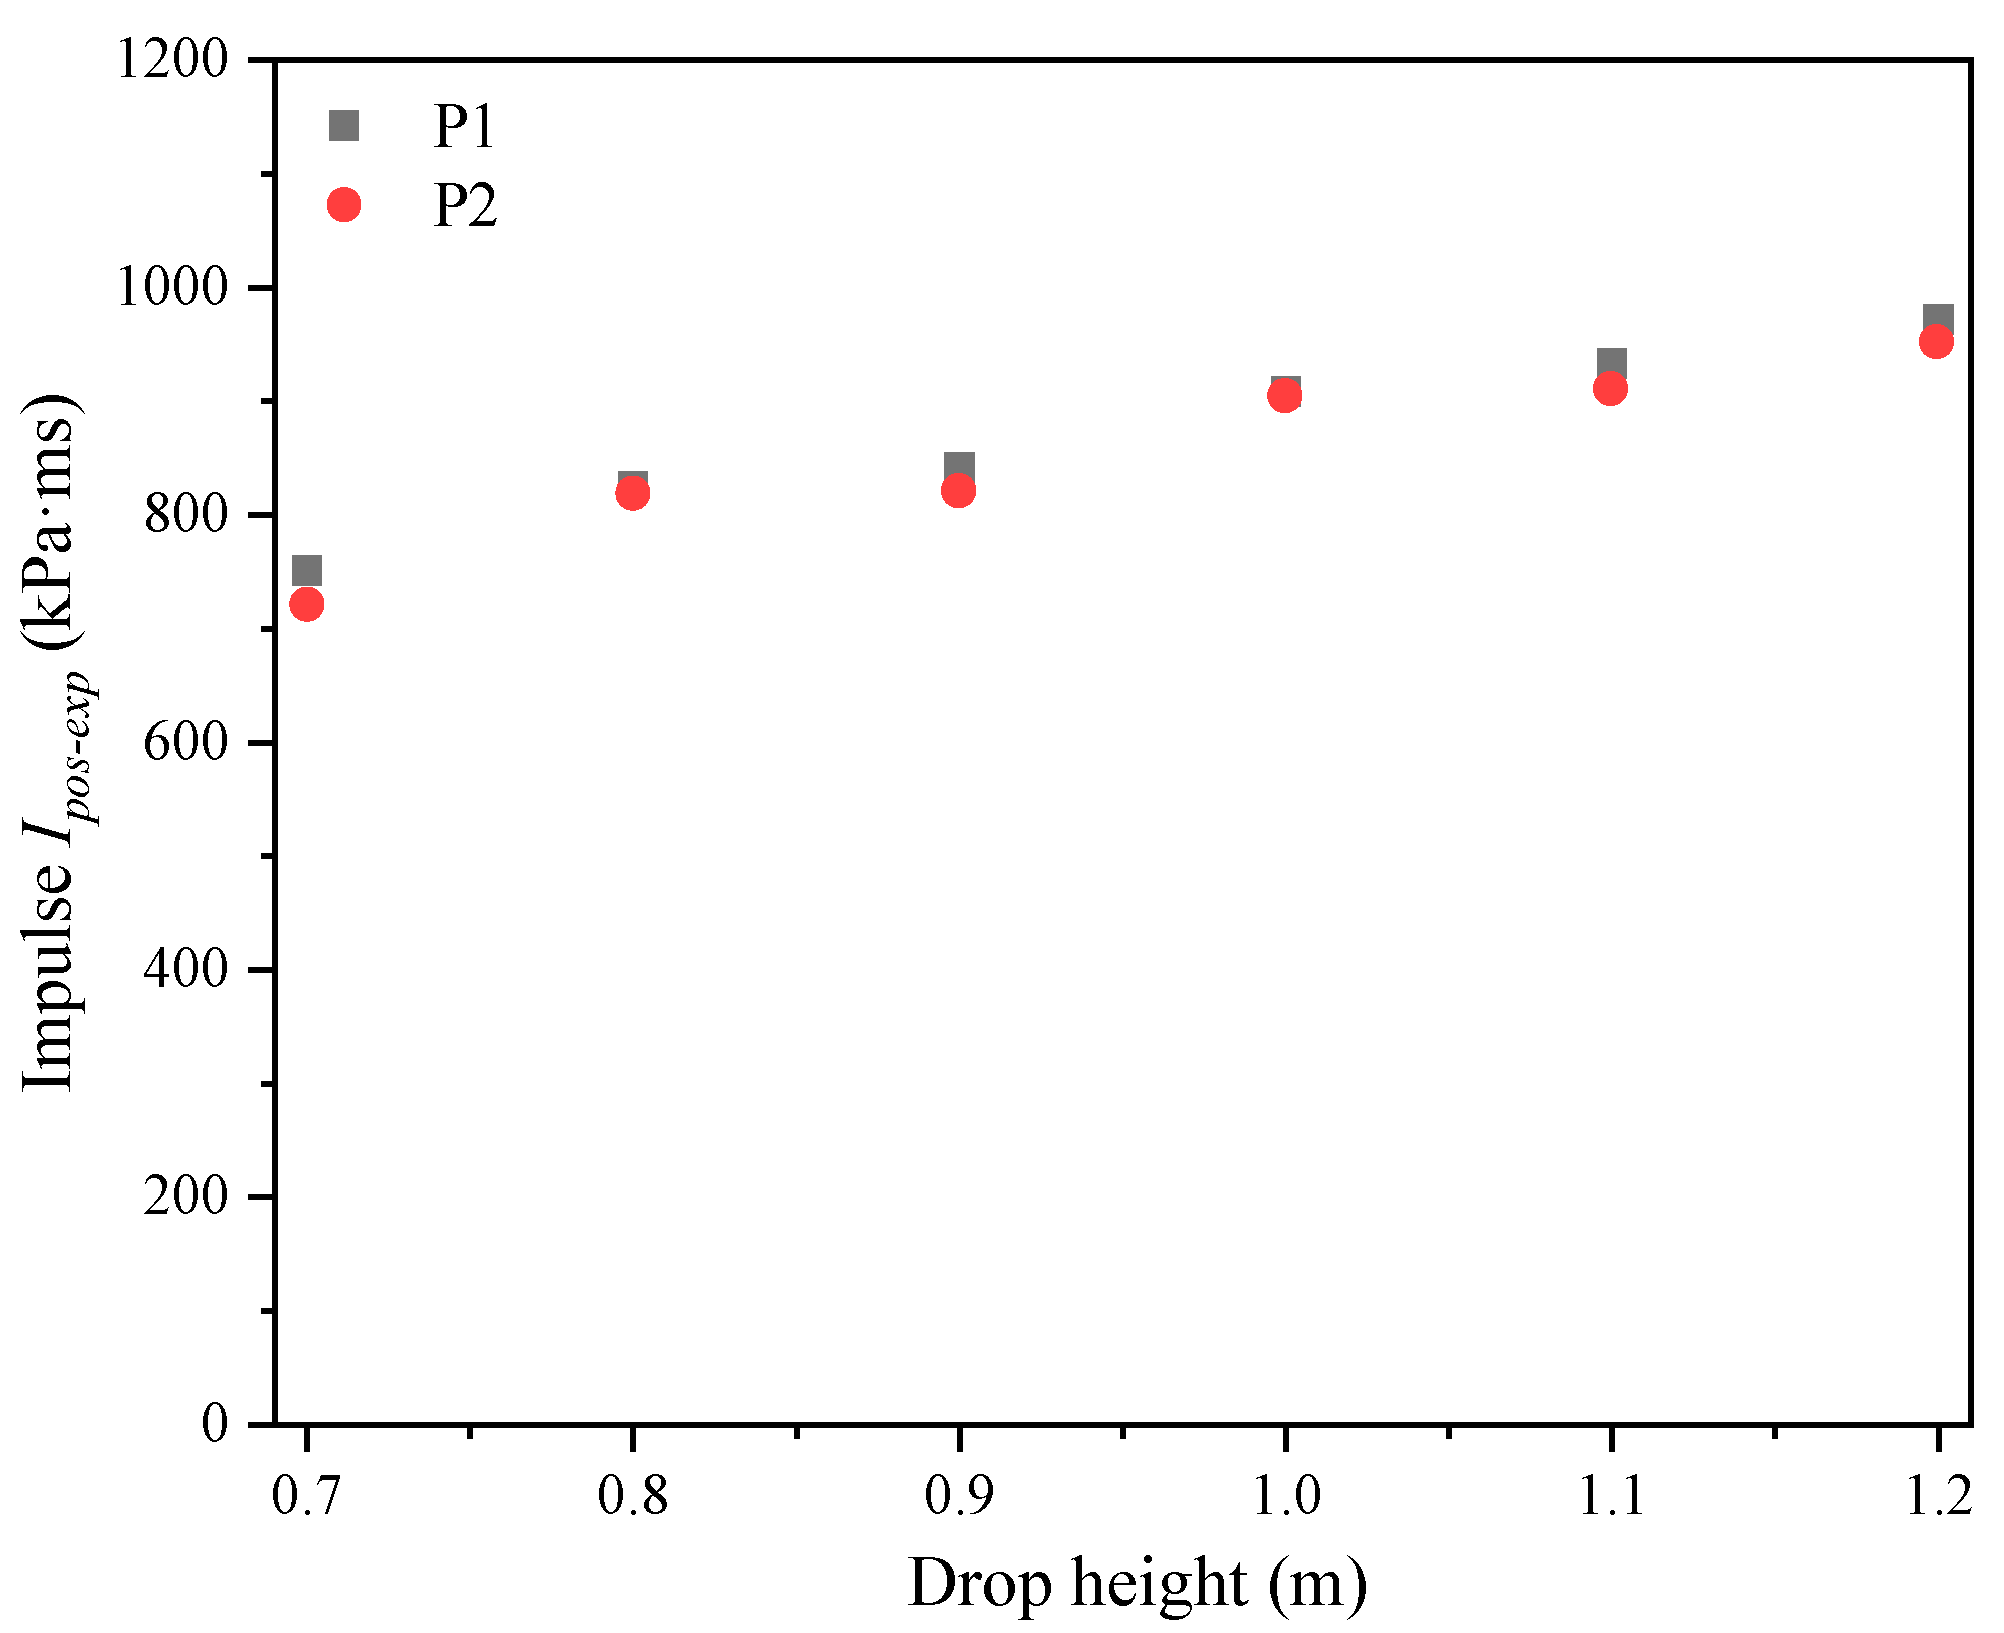
2.3.1. Slamming Pressure and Impulse

Figure 4 depicts the pressure–time histories, as well as the relevant integral impulse variations, at P1 and P2 for different drop heights. It should be noted that ti and tf in the figures represent the start and end time instants of the first positive pulse, respectively, where tf is the time at which the pressure first dropped to zero. As shown in Figure 4, the variations in the impulse integrated from the pressure curves at two measuring points were consistent at various drop heights. Figure 5 shows the variation in the first positive integral impulse Ipos-exp with the drop height. It can be seen that the maximum positive impulses of two measuring points (P1 and P2) increased with the drop height, and the pressure impulses at P1 and P2 were almost the same at various drop heights. Previous studies [12,30] indicated that studies on the slamming pressure pulse should focus on both the peak values and pulse duration. Figure 6, therefore, displays the variation in the first positive impulse Ipos-exp versus the peak pressure pm for various test conditions, in which the present and published test results are included. For different drop heights, only relatively small differences were observed in the peak pressure and impulse calculated from the present test data at P1 and P2. Some published experimental studies [3,8,10] indicated that the slamming pressure that acts on the flat structure is approximately uniformly distributed due to the air cushion effect. Therefore, it is reasonable to regard the pressure that acted on the flat steel plates as uniformly distributed in this study. Moreover, the comparison revealed that the calculated impulses for 1.0 mm steel plates were smaller than the test results for the 1.0 mm aluminum plates and 0.5 mm steel plates, which were possibly due to the stiffness of the test plate. In Figure 6, the symbol “S-1.0” refers to the 1.0 mm steel plate, and similarly, “S-0.5” and “A-1.0” refer to the 0.5 mm steel plate and the 1.0 mm aluminum plate, respectively.

2.3.2. Strain

Figure 7 plots the test results of the strain–time histories at the flat plate center (S1) under the drop heights of 800 mm and 1000 mm, and a time duration of 0.08 s was chosen to clearly show the strain curves. It is noted that the yield strain ey of the steel plate was approximately the ratio of the yield stress to Young’s modulus. It was found that the peak strains at the plate center with the drop height of 0.8 m and 1.0 m were 2580 and 3156 microstrains, respectively, which were 1.9 and 2.4 times the yield strain. As shown in the figures, a wide “valley” was found in the strain curves after the peak values, which may have been due to the effect of hydroelasticity. For the central strain response of the plate, only the values of the final strain ef and the peak strain em are typically considered, with the final strain being averaged over the fluctuating strains during the later phase of the response dominated by the structural elastic vibration. Figure 8 depicts the results of the final and peak strains under various drop heights, where the strain data for 0.5 mm steel plates in ref. [12] was also included for comparison. The results show that the final and peak strains increased almost linearly with the drop height. In addition, the final strain values of the 1.0 mm steel plates were obviously smaller than those of the 0.5 mm steel plates, but the peak strains of the 1.0 mm steel plates were slightly smaller than the results for the 0.5 mm steel plate, which may have been related to the deformation mode of the plate during slamming.

2.3.3. Permanent Deflection and Deformed Profile

The transverse deformation profiles, which were measured in situ by using the 3D-scanning instrument, along the X-axis for each deformed plate are presented in Figure 9a. It was found that the final deformed profiles of each plate were all approximately in cosine forms, and the maximum deflections occurred at the central point. Furthermore, the fitted curve using the cosine function for the final deformed profile of “S-1.0-1200” is also given in Figure 9a, with a small error from the test result. The final deflections at the steel plate center with respect to the drop height are plotted in Figure 9b, which shows that the final central deflection increased almost linearly with the drop height. In addition, in order to analyze the effect of the measurement of slamming pressure on the plastic response of the flat plate, the comparison of the deformation profiles of two equal plates installed on the left and right sides at different drop heights is shown in Figure 10. It is noted that “L” and “R” in the figure represent the strain-measuring plate on the left side and the pressure-measuring plate on the right side, respectively. As shown in the figure, the final deformations of the square plates on the left and right sides were in good agreement under various drop heights, which indicates that the pressure sensors had little effect on the plastic response of the flat plate under the given test conditions.

2.3.4. Analysis of Saturated Impulse

The saturated impulse is a special phenomenon in the dynamic plastic behavior of some structures, such as beams and plates. Previous studies indicated that the load-carrying capacity of a plate is greatly enhanced when subjected to intense lateral dynamic loading due to the membrane force generated by a large deflection. If the time duration of the pulse loading is relatively long, the permanent deflection of the plate will come to rest when the impulse reaches a critical value; namely, the saturated phenomenon occurs [28,29]. Recently, Zhu et al. [12] experimentally studied the saturated impulse of ship plates under a slamming impact, but the effects of plate thickness and materials on saturated deflection and saturated impulse remain to be clarified. Therefore, in this subsection, the saturated impulse of the 1.0 mm steel plates under slamming loading was first analyzed, and then the effects of plate thickness and materials on the saturation phenomenon were studied together with the published test results.
Figure 11a,b display the comparison of the measured plastic response and pressure pulse for drop heights of 800 mm and 1000 mm, in which the variations in the integral impulse are also drawn. It should be noted that the directly measured strain variations at the plate center were employed instead of the deflection–time histories for the saturated impulse analysis. In each figure, the curves of the slamming pressure, strain, and calculated impulse are marked in different colors. To clearly show the comparison, only a time period of 0.018 s of the test results is depicted in the figures. As shown in the figures, the plates gained their maximum central strain at a time instant later than the occurrence of the peak pressure, which implies that the saturation phenomenon also existed for the 1.0 mm steel plates under a slamming impact. The time point of peak strain is defined as the saturation point, and the corresponding impulse is defined as the saturated impulse Isat-exp.
Figure 12 shows the relationship of the saturated impulse Isat-exp and the total impulse to the drop height, in which the ratio of the saturated impulse Isat-exp to the total impulse Ipos-exp (defined as the first positive impulse) is also plotted. It is seen that both the total impulse and saturated impulse increased almost linearly with the drop height, while the ratio gradually decreased, which indicates that the saturation phenomenon of the steel plate was more likely to being achieved. In addition, since the saturated impulse Isat-exp was larger than the impulse Ir of the rising section for different test conditions, the saturation phenomenon always took place during the decaying section of the slamming pulse loading.
Figure 13a illustrates the relationship between the dimensionless saturated deflection and the drop heights for the three types of test plates (A-1.0, S-0.5, and S-1.0), where δ = w/h, w is the final deflection at the plate center, and h is the plate thickness. As shown in the figure, the dimensionless saturated deflections of the 0.5 mm steel plates were the largest, followed by those of the 1.0 mm aluminum plate, while the saturated deflections of the 1.0 mm steel plates were the smallest. Furthermore, Figure 13b depicts the dimensionless saturated impulses with the drop heights for various test plates, and the dimensionless saturated impulse can be expressed as
I ¯ s a t - exp = I s a t - exp L 2 M 0 μ h
where M0 = σyh2/4 refers to the fully plastic bending moment per unit area, with σy being the yield stress of the material, and μ is the mass per unit area of the plate. The comparison revealed that the dimensionless saturated impulse of the 0.5 mm steel plates was the largest, while the smallest results were obtained for the 1.0 mm steel plates. By combining Figure 13a,b, it can be concluded that when the thicknesses of the test plates were the same (i.e., S-1.0 and A-1.0), the dimensionless saturated deflection and dimensionless saturated impulse of the steel plates with a high material strength were obviously smaller than those of the aluminum plates. In addition, when the test plates were made of the same material (i.e., S-0.5 and S-1.0), the dimensionless saturated deflection and saturated impulse were greater for the plates with the smaller thickness. Based on the previous study [31], the dimensionless stiffness ζ, which takes into account the material and dimensions of the square plate, can be determined by
ζ = h L E σ y ( 1 ν )
where ν is Poisson’s ratio, and h is the thickness of the plate. Calculations found that the values of ζ were 0.13, 0.22, and 0.26 for the 0.5 mm steel plate, the 1.0 mm aluminum plate, and the 1.0 mm steel plate, respectively. Hence, it can be deduced that the dimensionless saturated deflection and the dimensionless saturated impulse of the test plates for the same water impact velocity gradually increased as the dimensionless stiffness ζ decreased under the given test conditions.

3. Numerical Simulations

In this study, numerical simulations that considered the FSI were employed to obtain the deflection–time history of the plate, which was not recorded in the tests. A numerical model using the ALE method in the commercial software LS-DYNA version 971 was developed for simulating the drop-on-water tests of the flat plates, which were validated against the test results reported in ref. [12].

3.1. FSI Model

The numerical model that considered the FSI consisted of two parts, as shown in Figure 14a: the structures, namely, the boundary supporting plates and test plate, as well as the fluid domains, namely, the air and water. The structures were modeled by the shell elements, which were described by the *Belytschko–Tsay element formula with five integration points through the thickness direction. The fluid was modeled by the solid element defined by a multi-material arbitrary Lagrangian–Eulerian. During the simulation, the structure experienced deformation under the action of hydrodynamic pressure, while the response of the structure simultaneously influenced the fluid pressure. Detailed information on the ALE method can be found in ref. [19].
In previous studies, it was demonstrated that the application of a symmetric model can greatly reduce the computation time without compromising the precision of the numerical results. A quarter model with symmetric boundaries on the XOZ and YOZ planes, as presented in Figure 14a, was therefore used for the FSI analysis based on the symmetry conditions. In the structural model, the steel boundary-supporting fixture was set to allow free motion in the z-direction only. It is noted that extra mass should be assigned to the boundary-supporting plates to achieve the actual one-quarter of the total weight measured in the test. In addition, the dimensions of the fluid domains were set to approximately three times the length and width of the structural model, which was consistent with the required specifications [32]. Since the overall size of the water tank in the test ensured no wave reflection at the boundary during the slamming process, all boundary surfaces of the fluid domains in the numerical model, except for the symmetry planes, were defined as non-deflection conditions to prevent boundary effects. Due to the large size of the fluid domain, mesh refinement for all fluid domains was not suitable in terms of computational time. Therefore, mesh refinement was performed on the local fluid domains, as shown in Figure 14b, and the detailed dimensions of the different fluid domains are given in Table 2. The mesh size of the structure and the locally refined fluid domains were set to be the same, as suggested by ref. [19]. A convergence study was conducted to analyze the sensitivity of the numerical simulations to the mesh size, as included in Appendix A. The penalty coupling mechanism between the fluids and structure was governed by the keyword *Constrained_Lagrange_In_Solid. The penalty factor, which is associated with the computed coupling force, was set to a default value of 0.1 based on previous studies [22,33].
As shown in Figure 14, an initial gap di that was much smaller than the drop height in the test was set between the water surface and flat structure to reduce the computation time. An initial gap value of 0.1 m was selected, which was large enough to consider the effect of the air cushion [22]. Thus, to attain the same water impact velocity measured in the tests, the structure should be assigned an initial falling velocity vi calculated from v i = v m 2 2 g d i , where v m is the measured impact velocity in the test after taking the friction of the guide rails into account and g is the gravitational acceleration. The computation time of 0.1 s with an output time interval of 0.001 s was selected, which was sufficient to simulate the entire water impact process.

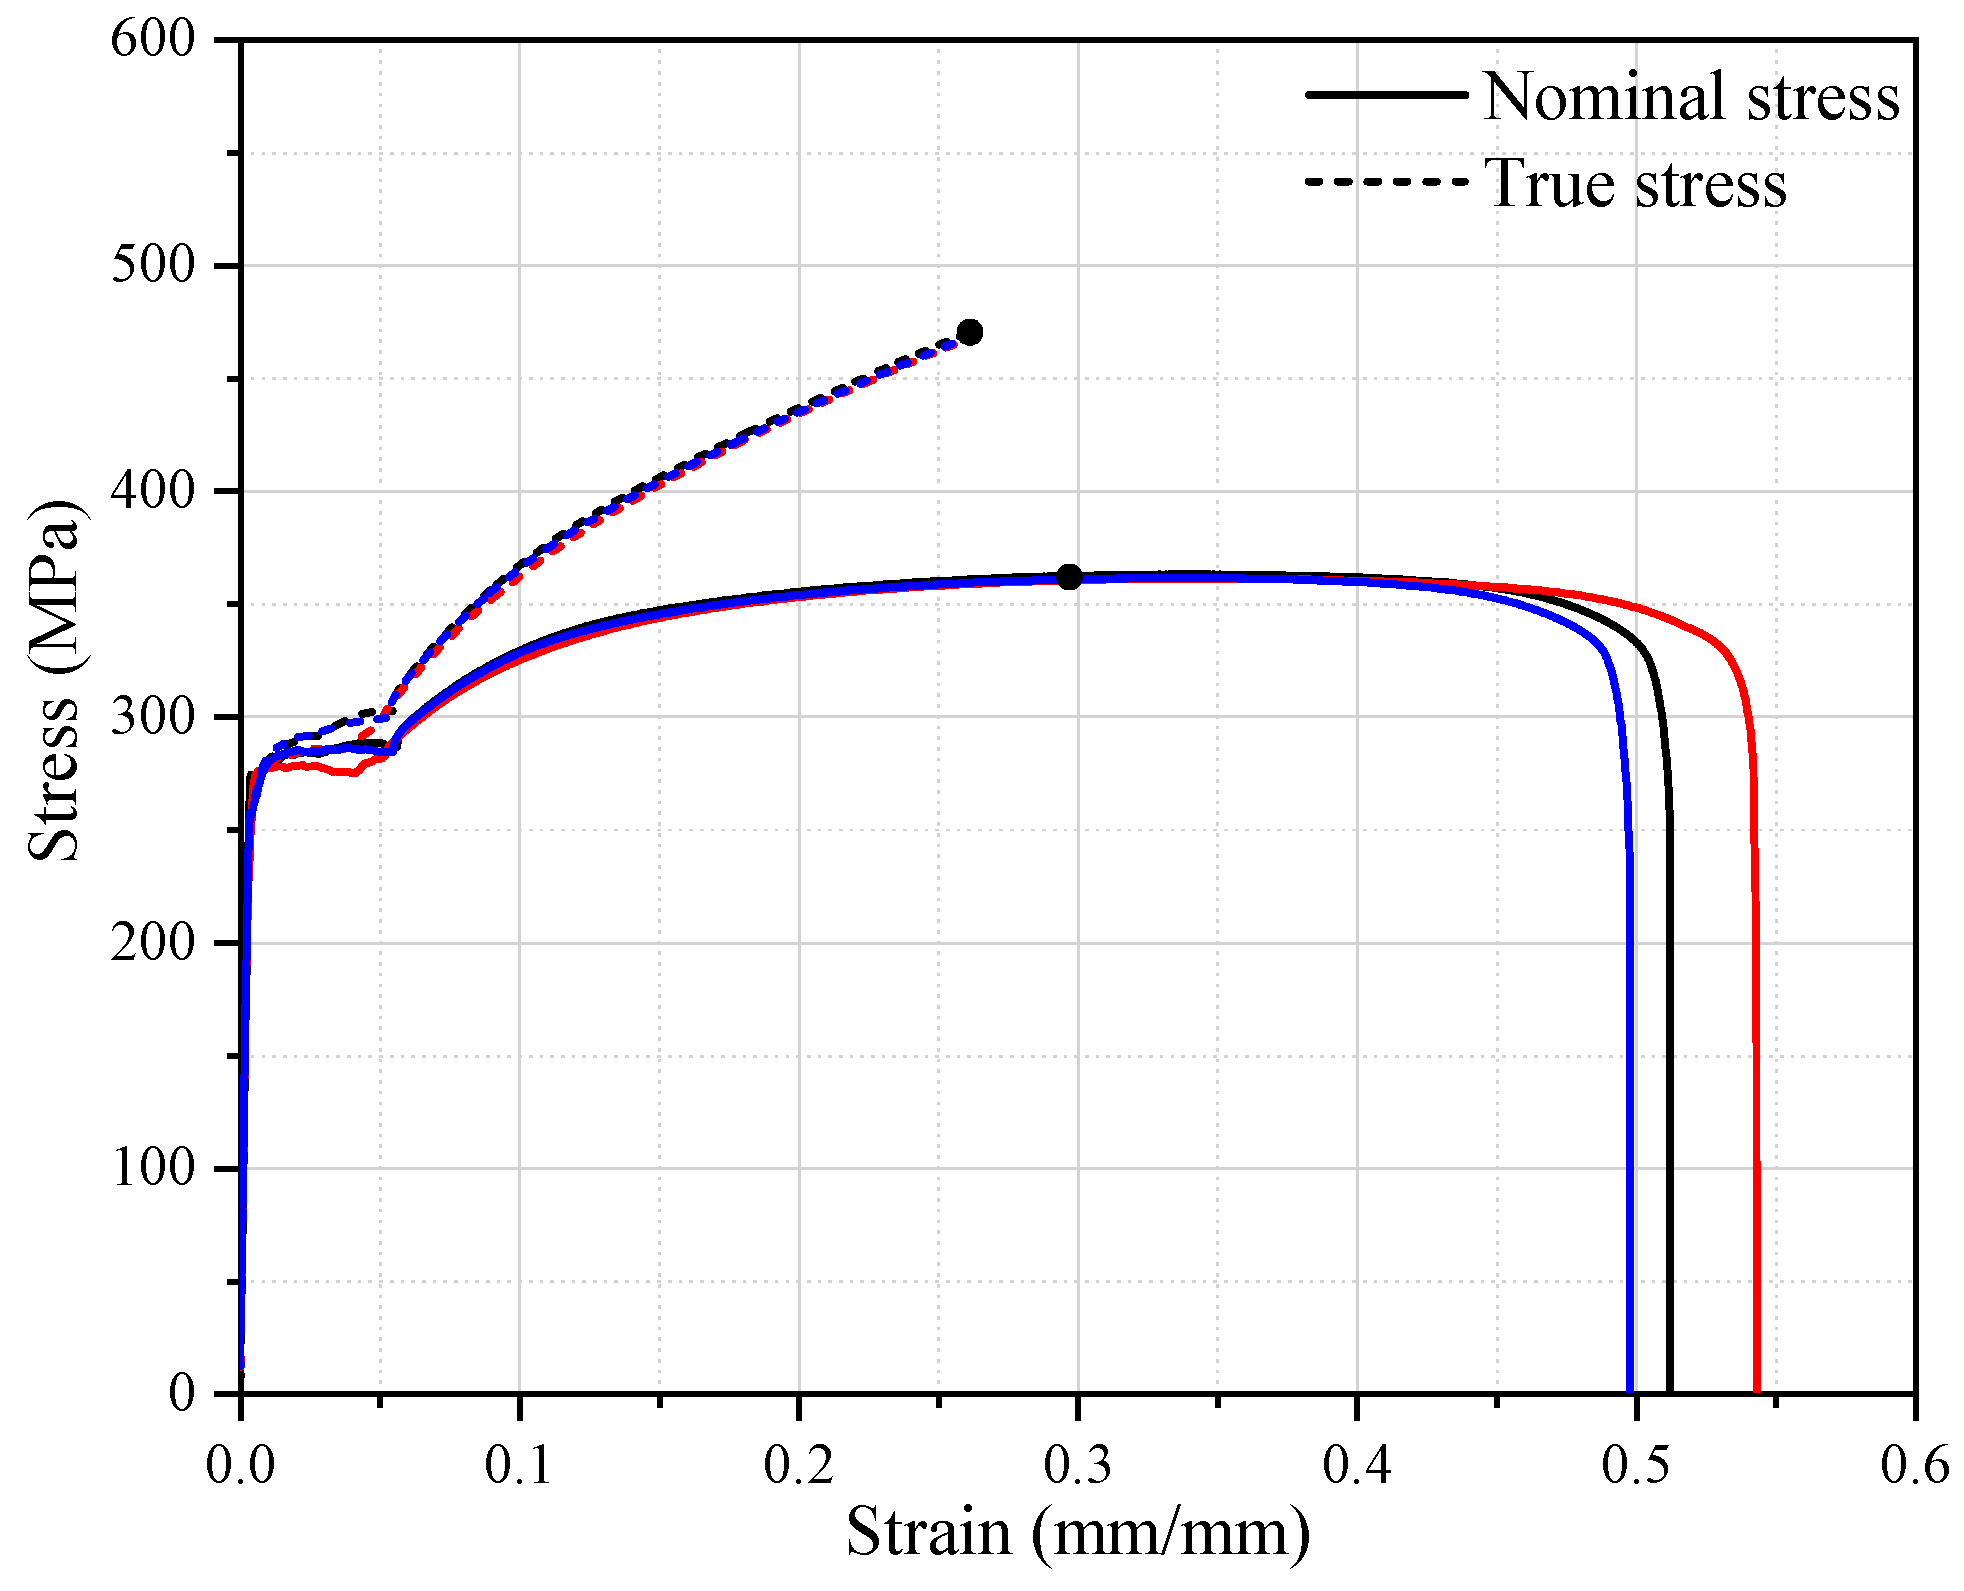
3.2. Materials for Structures and Fluids

In this study, the material model of *015-Mat_Johnson_Cook in the material library was used to simulate the plastic behavior of the flat plate during slamming, and its expression is given as follows:
σ e q = A + B ε ¯ p n 1 + c ln ε ˙ m
where A, B, n, and c are the constants; ε ¯ p is the effective plastic strain; and ε ˙ m denotes the mean effective plastic strain rate. The parameter c is related to the strain rate of the material, while the parameters A, B, and n were obtained by fitting the tensile test results. For example, the stress–strain curve for the mild steel of the plates with a thickness of 0.5 mm obtained from the tensile tests were fitted by the Johnson–Cook material model, as shown in Figure 15. Specific parameter values of the Johnson–Cook model for the materials aluminum alloy A1060 and mild steel are presented in Table 3, where the value of parameter c for the mild steel was selected as 0.0652 based on a previous study [34]. The strain rate effect of the aluminum A1060 was not considered in this study. In addition, to ensure that the response of the boundary support plates of the fixture was consistent with that in the actual drop tests, the *001-Mat_Elastic material model with a density of 7850 kg/m3, Young’s modulus of 206 GPa, and Poisson’s ratio of 0.3 was used to ensure that the response was always within the elastic range.
The fluids in the numerical model were assigned a *Mat_Null material model with no yield strength, which was therefore used to simulate the behavior of the fluids. In addition, the viscosity of the water was not considered. Furthermore, the equation of state (EOS) was adopted to define the pressure in the fluid material, with the EOS of water defined by the Gruneisen model as
p w a t e r = ρ 0 C 2 ν 1 + 1 γ 0 2 ν a 2 ν 2 1 S 1 1 ν S 2 ν 2 ν + 1 S 3 ν 3 ν + 1 2 + γ 0 + a ν E
where C, S1, S2, S3, γ0, and a are constants; E is the initial energy per unit reference volume; and ν = ρ / ρ 0 1 , where ρ0 is the density of water in the nominal state and ρ is the current density.
A perfect air model with zero shear strength was used to simulate the air state, and the corresponding polynomial equation of state was expressed by
p a i r = C 0 + C 1 υ + C 2 υ 2 + C 3 υ 3 + C 4 + C 5 υ + C 6 υ 2 E
where Ci (i = 1–6) are user-defined constants, and υ = 1 / V 0 1 , where V0 is the relative volume.
The values of the abovementioned related parameters of the EOS were obtained from ref. [22] and are shown in Table 4.

3.3. Validation of Numerical Model

The numerical method, which considered the FSI and was utilized to simulate the slamming experiments on the flat metal plates, was validated against the test results of the slamming pressures, strains, and final deflections of the plates. Figure 16a,b show the comparison of test data with the numerical simulations for the pressure–time histories of the aluminum and steel plates for the drop height of 1100 mm, respectively. It should be noted that the model series number “A-1.0-1100” in the figure denotes an aluminum plate of thickness 1.0 mm that was dropped from 1100 mm in the test [12]. As shown in the figures, the predicted time histories of slamming pressure were in good agreement with the test measurements for the first positive pulse. However, there were differences in the following fluctuating phases of the slamming pressure–time histories, which may have been due to the effects of structural elastic vibration. The experimental study conducted by Okada and Sumi [35] indicated that the first positive pulse is the most important. Similarly, studies on the saturation phenomenon also revealed that the saturated deflection of the impacted structure always occurs within the timeframe of the first positive pressure phase [12]. Therefore, the predicted slamming pressure pulse was generally in reasonable agreement with the test results.
Figure 17a,b present the comparison of the experimental data with the numerically predicted peak pressure and the integral impulse Ipos of the first positive pulse, respectively. The dashed line indicates an identical match. It is noted that only the pressure pulse at central point P1 was used for the analysis, as the slamming pressure was uniformly distributed on the plate. As shown in the figures, the peak pressures and impulses predicted by the numerical model were in reasonable agreement with the test results. In addition, it was observed that the numerical predictions slightly overpredicted the peak pressures while underestimating the positive impulses. This difference between the numerical predictions and the test results was possibly caused by the modeling of the effects of the air cushion and air–water–structure interaction, as well as the simplified boundary condition.
Figure 18 compares the test results with the numerical simulations for the strain–time histories at the flat plate center for the drop height of 1100 mm. It is seen that the numerically predicted strain–time histories generally agreed well with the test results. However, some differences were found in the peak strain and the subsequent rebound phase, which were possibly due to the utilization of ideally rigid boundary conditions in the numerical model that reduce the elastic vibration. Figure 19a,b compare the numerically predicted peak and final strains of different flat plates with the experimental data, respectively. As shown in Figure 19a, the peak strains measured in the tests were generally larger than the numerical predictions for both the aluminum and steel plates, which was probably due to the larger elastic strains of the metal plates in the tests. In addition, the numerically predicted final strains at the plate center were overall slightly larger than the test values.
Figure 20 plots the numerical predictions of the final central deflection of various flat plates against the experimental data. In general, reasonable agreements were achieved, with average errors of 12.1%, 8.8%, and 7.2% for the aluminum plates (A-1.0), steel plates of thickness 0.5 mm (S-0.5), and steel plates of thickness 1.0 mm (S-1.0), respectively. It was observed, however, that the numerical predictions for the aluminum plates were all larger than the test results, while the numerical predictions for the steel plates were all smaller than the test data, and this difference in the final deflections of the aluminum and steel plates may be improved if accurate boundary conditions and strain rate parameters are taken into account in the numerical model. In addition, a flat slamming impact is a complex problem, and it is difficult to use a numerical model to perfectly simulate the slamming process. Based on the current comparison results, the prediction accuracy of the numerical model was acceptable.
All in all, the above comparisons show that the developed numerical model could reasonably simulate the flat slamming impact of the plates in the tests. Therefore, the numerical model was valid for the subsequent analysis of the transient response and the saturation phenomenon of the metal plates during the process of slamming.

3.4. Numerical Prediction of the Transient Response and Saturated Impulse

Figure 21a depicts the central deflection–time history of the aluminum plate for the drop height of 1100 mm, with five particular instants being marked, while Figure 21b depicts the deformation profile across the center line of the plate (y = 0) at the same instants, in which the final deformation profile measured in the test is also included. In general, the numerically predicted final deformation profile was in reasonable agreement with the test measurements. As observed from Figure 21b, the deflection of the plate increased rapidly in the initial stage (t = 3.0–7.0 ms), then entered the stage of elastic rebound (t = 7.0–21.5 ms), after which the deflection gradually reached a relatively stable stage (t = 21.5–30.0 ms). At some time instants (t = 7.0 ms and 21.5 ms), it was found that the deformed shape of the plate was closer to the cosine mode, which is consistent with the plate’s profile evolution measured by using the DIC technique in the tests of Abrahamsen et al. [11]. In addition, it is worth noting that no obvious traveling plastic hinge lines were found in the profile evolution of the square plate under slamming loading, which is different from that of the typical blast-loaded plate, as presented in ref. [36].
To provide comprehensive insight into the slamming phenomenon, the interaction between water and structure simulated by the established numerical model at six selected time instants is plotted in Figure 22 for the case of the aluminum plate with a drop height of 1100 mm. The results were captured across the symmetrical plane (XOZ) to clearly display the location of the fluid and the structure variation during the slamming process. When combining Figure 21a and Figure 22b, it was observed that the plate had already deformed before it contacted the water surface (t = 5.0 ms) due to the compression of the air layer. As shown in Figure 22c, when the plates impinged on the water surface, the water rose at the edge of the plate and an air pocket formed between the plate and the free surface. The air pocket was formed because the air was trapped between the water and the plate and was gradually forced into the water. Thereafter, the volume of the air pocket decreased over time but still existed during the effective process of the water impact, as shown in Figure 22c–f, which agrees with the phenomena observed in the experiment described in ref. [11]. Moreover, it is seen that the slamming pressure and central deflection of the plate reached their maximum at the instant t = 7.0 ms, whilst the plate had just reached the position slightly before the initial calm water surface, as shown in Figure 22c.
The saturation phenomenon of the square plates during the flat slamming impact was experimentally studied. In this subsection, the numerical model is utilized to analyze the saturated impulse by combining the predicted plastic deflection and the slamming pressure at various water impact velocities. Figure 23a,b depicts the comparison of the plastic deflection with the predicted pressure pulse of the aluminum and steel plates for a drop height of 1100 mm, respectively, where the integral impulse variations are also plotted. The comparison shows that the metal plates gained the maximum deflection at a time instant later than the occurrence of the peak pressure, which indicates that the saturation phenomenon was also verified based on numerical simulations.
Figure 24a,c depict how the total impulse Ipos-num and saturated impulse Ipos-sat obtained by the numerical simulations varied with the drop heights, where the ratio γnum of the predicted saturated impulse Isat-num to the predicted total impulse Ipos-num was also drawn. As shown in the figures, the numerically predicted results of the total impulse Ipos-num and saturated impulse Isat-num for various plates increased linearly with the drop height. The numerical simulations also revealed that the saturated impulse phenomenon of the plate always took place during the decaying section of the pressure pulse, as the predicted saturated impulse Isat-num was larger than the impulse Ir-num. Furthermore, the variation in the ratio γnum in the figures indicates that the saturated impulse phenomenon of the flat plate was more likely to be achieved as the drop height increased.

4. Conclusions

A combined experimental and numerical investigation was conducted to explore the saturated impulse of the plates under a flat slamming impact. The large dynamic plastic responses and slamming pressure pulse of the steel plates of thickness 1.0 mm during the slamming impact were experimentally studied. The test results reveal that the pressure acting on the steel plates was uniformly distributed. The plastic responses of the steel plates, including the central strain and final deflection, increased linearly with the drop height.
The comparison of the measured plastic response with the pressure pulse indicates that the saturation phenomenon also existed for the 1.0 mm steel plates during slamming. The effects of plate thickness and material properties on dimensionless saturated deflection and dimensionless saturated impulse were studied by combining the published slamming test results reported in ref. [12]. The results demonstrate that the dimensionless saturated deflection and dimensionless saturated impulse were larger for the smaller plate thickness when the materials were the same, while they were smaller for the material of higher strength with the same plate thickness. In addition, it was found that the dimensionless saturated deflection and saturated impulse gradually increased as the dimensionless stiffness ζ of the plate decreased.
The numerical method considered the FSI effect, which was validated against the test results, was then employed to investigate the transient response and saturated impulse of the flat plates under a slamming impact. The numerical simulations showed that the compression of the air layer always existed during the process of the flat slamming impact, which was consistent with the phenomenon observed in the existing slamming test. Through the numerical predictions of the dynamic plastic deflection and slamming pulse loading, it was observed that the saturated impulse phenomenon always took place after the time instant of the peak value of the pressure pulse under various drop heights, and the saturated impulse phenomenon of the flat plate was more susceptible to being achieved as the water impact velocity increased.

Author Contributions

Investigation, methodology, data curation, and writing—original draft, Z.Z.; conceptualization, methodology, supervision, resources, funding acquisition, and writing—review and editing, L.Z.; conceptualization, investigation, and writing—review and editing, K.G.; investigation and writing—review and editing, X.W. All authors have read and agreed to the published version of the manuscript.

Funding

This work was supported by the general project of the National Natural Science Foundation of China (grant nos. 12172265 and 12202328) and the Wuhan University of Technology Start-Up Fund for Distinguished Professors (grant no. 471-40120163).

Institutional Review Board Statement

Not applicable.

Informed Consent Statement

Not applicable.

Data Availability Statement

Data are contained within the article.

Acknowledgments

The authors gratefully acknowledge the financial support from the general project of the National Natural Science Foundation of China (grant nos. 12172265 and 12202328) and the Wuhan University of Technology Start-Up Fund for Distinguished Professors (grant no. 471-40120163). The authors would like to thank D Liu and YB Chen for their assistance in the execution of the experimental work for this study.

Conflicts of Interest

The authors declare no conflicts of interest.

Appendix A

As is well known, the numerical simulations of the ALE method are very sensitive to the mesh density. Therefore, the mesh size of the water impact region needs to be fine enough to capture accurate slamming results, while using a coarser mesh for other fluid domains can greatly reduce the computational time. For the main impact region (L1 × L3 × (L5 × L7)) shown in Figure 14, three kinds of mesh sizes (4.2 mm, 5.0 mm, and 12.5 mm) were selected for the mesh convergence study, and a reasonable mesh size was determined by comparing the experimental results of the aluminum plate with the drop height of 1100 mm. A server workstation that comprised 24 CPUs was used to conduct the numerical simulations, and the main parameters of the mesh convergence study for the three cases are shown in Table A1.
Table A1. Parameters of mesh convergence study.
ParametersCase 1Case 2Case 3
Mesh size (mm)12.55.04.2
Number of shell elements (structure)44828004032
Number of solid elements (fluid)116,0581,394,2502,336,026
Total nodes124,3951,438,1522,397,991
CPU time1 h 2 min13 h 27 min25 h 11 min
Figure A1a–d show the numerical predictions of the pressure–time histories at P1 and P2, the strain time history at S1, and the central deflection time history for the numerical model with various mesh sizes compared with the experimental results, respectively. As shown in Figure A1a,b, the numerical predictions for the mesh sizes of 4.2 mm and 5.0 mm agreed well with the test results, while the prediction accuracy was poor for the mesh size of 12.5 mm, especially for predicting the slamming pressure at P2. Furthermore, the comparisons in Figure A1c,d revealed that the numerical predictions of the strain and deflection for mesh sizes of 4.2 mm and 5.0 mm were essentially the same and agreed well with the test measurements. In contrast, the numerical model with a mesh size of 12.5 mm greatly underestimated both the strain and deflection. Therefore, by combining the accuracy of the numerical simulations and the effect of the computational time, the mesh size of the main impact region was set to 5.0 mm.
Figure A1. Comparison of the test results and numerical predictions of slamming pressure time histories at (a) P1 and (b) P2, (c) strain time history at S1, and (d) deflection time history at plate center with various mesh sizes for the drop height of 1100 mm.
Jmse 12 01730 g0a1

References

  1. Cho, S.; Dessi, D.; Engle, A.; Kukkanen, T. Committee V7: Impulsive Pressure Loading and Response Assessment. In Proceedings of the 17th International Ship and Offshore Structures Congress, ISSC 2009, Seoul, Republic of Korea, 16–21 August 2009; Seoul National University: Seoul, Republic of Korea, 2009; pp. 367–432. [Google Scholar]
  2. Yamamoto, Y.; Iida, K.; Fukasawa, T.; Murakami, T.; Arai, M.; Ando, A. Structural damage analysis of a fast ship due to bow flare slamming. Int. Shipbuild. Prog. 1985, 32, 124–136. [Google Scholar] [CrossRef]
  3. Duan, L.L.; Zhu, L.; Chen, M.S.; Pedersen, P.T. Experimental study on the propagation characteristics of the slamming pressures. Ocean Eng. 2020, 217, 107868. [Google Scholar] [CrossRef]
  4. Sun, Z.; Sui, X.; Deng, Y.; Zou, L.; Korobkin, A.; Xu, L.; Jiang, Y. Characteristics of slamming pressure and force for trimaran hull. J. Mar. Sci. Eng. 2021, 9, 564. [Google Scholar] [CrossRef]
  5. Meziane, B.; Alaoui, A.E.M.; Nême, A.; Leble, B.; Bellanger, D. Experimental investigation of the influence of the panel stiffness on the behaviour of a wedge under slamming. J. Fluids Struct. 2022, 114, 103702. [Google Scholar] [CrossRef]
  6. Park, I.C.; Seo, B.C.; Lee, S.H.; Park, J.H.; Seo, H.S. A study on slamming impact load characteristics of energy storage system case for ships. J. Mar. Sci. Eng. 2022, 11, 44. [Google Scholar] [CrossRef]
  7. Hosseinzadeh, S.; Tabri, K.; Hirdaris, S.; Sahk, T. Slamming loads and responses on a non-prismatic stiffened aluminium wedge: Part I. Experimental study. Ocean Eng. 2023, 279, 114510. [Google Scholar] [CrossRef]
  8. Chuang, S.L. Investigation of Impact of Rigid and Elastic Bodies with Water; Report for Department of the Navy. Report No. 3248; United States Department of the Navy: Washington, DC, USA, 1970. [Google Scholar]
  9. Mori, K. Response of the bottom plate of high speed crafts under impulsive water pressure. J. Soc. Nav. Archit. Jpn. 1977, 1977, 297–305. [Google Scholar] [CrossRef]
  10. Shin, H.; Seo, B.; Cho, S.R. Experimental investigation of slamming impact acted on flat bottom bodies and cumulative damage. Int. J. Nav. Archit. Ocean Eng. 2018, 10, 294–306. [Google Scholar] [CrossRef]
  11. Abrahamsen, B.C.; Alsos, H.S.; Aune, V.; Fagerholt, E.; Faltinsen, O.M.; Hellan, Ø. Hydroplastic response of a square plate due to impact on calm water. Phys. Fluids 2020, 32, 082103. [Google Scholar] [CrossRef]
  12. Zhu, L.; Zhu, Z.K.; Yu, T.X.; Jones, N. An experimental study of the saturated impulse for metal plates under slamming. Int. J. Impact Eng. 2023, 178, 104601. [Google Scholar] [CrossRef]
  13. Truong, D.D.; Jang, B.S.; Quach, H.N.; Dang, X.P.; Duong, H.D.; Cho, S.R. Empirical formulations for prediction of permanent set evolution of steel plates due to repeated impulsive pressure loadings induced by slamming. Ocean Eng. 2023, 268, 113430. [Google Scholar] [CrossRef]
  14. Pavlović, A.; Minak, G. FEM-SPH Numerical Simulation of Impact Loading on Floating Laminates. J. Mar. Sci. Eng. 2023, 11, 1590. [Google Scholar] [CrossRef]
  15. Lu, T.; Wang, J.; Liu, K.; Zhao, X. Experimental and Numerical Prediction of Slamming Impact Loads Considering Fluid–Structure Interactions. J. Mar. Sci. Eng. 2024, 12, 733. [Google Scholar] [CrossRef]
  16. Park, Y.I.; Park, S.H.; Kim, J.H. Numerical Investigation of Plastic Deformation of Flat Plate for Slamming Impact by Coupled Eulerian–Lagrangian Method. Appl. Sci. 2022, 12, 7270. [Google Scholar] [CrossRef]
  17. Luo, H.; Hu, J.; Soares, C.G. Numerical simulation of hydroelastic responses of flat stiffened panels under slamming loads. In Proceedings of the International Conference on Offshore Mechanics and Arctic Engineering, Shanghai, China, 6–11 June 2010; pp. 373–381. [Google Scholar]
  18. Stenius, I.; Rosén, A.; Kuttenkeuler, J. Hydroelastic interaction in panel-water impacts of high-speed craft. Ocean Eng. 2011, 38, 371–381. [Google Scholar] [CrossRef]
  19. Wang, S.; Soares, C.G. Numerical study on the water impact of 3D bodies by an explicit finite element method. Ocean Eng. 2014, 78, 73–88. [Google Scholar] [CrossRef]
  20. Yu, Z.L.; Amdahl, J.; Greco, M.; Xu, H. Hydro-plastic response of beams and stiffened panels subjected to extreme water slamming at small impact angles, Part II: Numerical verification and analysis. Mar. Struct. 2019, 65, 114–133. [Google Scholar] [CrossRef]
  21. Wang, H.; Cheng, Y.S.; Liu, J.; Zhang, P. Hydroelastic behaviours of laser-welded lightweight corrugated sandwich panels subjected to water impact: Experiments and simulations. Thin-Walled Struct. 2020, 146, 106452. [Google Scholar] [CrossRef]
  22. Truong, D.D.; Jang, B.S.; Ju, H.B.; Han, S.W. Prediction of slamming pressure considering fluid-structure interaction. Part I: Numerical simulations. Ships Offshore Struct. 2020, 17, 7–8. [Google Scholar]
  23. Truong, D.D.; Jang, B.S.; Ju, H.B.; Han, S.W. Prediction of slamming pressure considering fluid-structure interaction. Part II: Derivation of empirical formulations. Mar. Struct. 2021, 75, 102700. [Google Scholar] [CrossRef]
  24. Truong, D.D.; Jang, B.S.; Janson, C.E.; Ringsberg, J.W.; Yamada, Y.; Takamoto, K.; Kawamura, Y.; Ju, H.B. Benchmark study on slamming response of flat-stiffened plates considering fluid-structure interaction. Mar. Struct. 2021, 79, 103040. [Google Scholar] [CrossRef]
  25. Jones, N. Slamming damage. J. Ship Res. 1973, 17, 80–86. [Google Scholar] [CrossRef]
  26. Zhao, Y.P.; Yu, T.X.; Fang, J. Large dynamic plastic deflection of a simply supported beam subjected to rectangular pressure pulse. Arch. Appl. Mech. 1994, 64, 223–232. [Google Scholar] [CrossRef]
  27. Zhao, Y.P.; Yu, T.X.; Fang, J. Saturation impulses for dynamically loaded structures with finite-deflections. Struct. Eng. Mech. 1995, 3, 583–592. [Google Scholar] [CrossRef]
  28. Zhu, L.; Yu, T.X. Saturated impulse for pulse-loaded elastic-plastic square plates. Int. J. Solids Struct. 1997, 34, 1709–1718. [Google Scholar] [CrossRef]
  29. Zhu, L.; Bai, X.Y.; Yu, T.X. The saturated impulse of fully clamped square plates subjected to linearly decaying pressure pulse. Int. J. Impact Eng. 2017, 110, 198–207. [Google Scholar] [CrossRef]
  30. Talioua, A.; Berkane, B.; Martin, M.B.; Perret, G.; Pinon, G. Flat plate pressure impact on a still water surface: The effect of surrounding ambient pressure and plate size. Ocean Eng. 2022, 263, 111926. [Google Scholar] [CrossRef]
  31. Hu, Q.J.; Zhu, L.; Yu, T.X. Elastic effect on the final deflection of rigid-plastic square plates under pulse loading. Thin-Walled Struct. 2023, 193, 111238. [Google Scholar] [CrossRef]
  32. ABS. Guide for Slamming Loads and Strength Assessment for Vessels; American Bureau of Shipping: Houston, TX, USA, 2023. [Google Scholar]
  33. Cheon, J.S.; Jang, B.S.; Yim, K.H.; Lee, H.D.; Koo, B.Y.; Ju, H. A study on slamming pressure on a flat stiffened plate considering fluid–structure interaction. J. Mar. Sci. Technol. 2016, 21, 309–324. [Google Scholar] [CrossRef]
  34. Guo, Z.T.; Gao, B.; Guo, Z.; Zhang, W. Dynamic constitutive relation based on JC model of Q235 steel. Explosion Shock Waves 2018, 38, 804–810. [Google Scholar]
  35. Okada, S.; Sumi, Y. Experimental study on the maximum pressure and the duration time of the horizontal water impact of flat plate. J. Soc. Nav. Archit. Jpn. 1995, 178, 381–389. [Google Scholar] [CrossRef] [PubMed]
  36. Yuan, Y.; Li, X.; Zhang, C.; Tan, P.; Chen, P. Impulse saturation in metal plates under confined blasts. Int. J. Impact Eng. 2022, 168, 104308. [Google Scholar] [CrossRef]
Figure 1. Sketch of the drop tower with drop model [12].
Jmse 12 01730 g001
Figure 2. (a) Sketch and (b) picture of the test plates mounted on the rectangular fixture.
Jmse 12 01730 g002
Figure 3. Stress–strain curves for the mild steel materials used in this study.
Jmse 12 01730 g003
Figure 4. Pressuretime histories and the relevant integral impulse variations at P1 and P2 with different drop heights.
Jmse 12 01730 g004
Figure 5. Variations in the positive impulses with the drop height.
Jmse 12 01730 g005
Figure 6. Variations in the positive impulse versus the peak pressure [12].
Jmse 12 01730 g006
Figure 7. The central strain-time history of the flat steel plates with the drop heights of (a) 800 mm and (b) 1000 mm.
Jmse 12 01730 g007
Figure 8. Variations in the final and peak strains with the drop height.
Jmse 12 01730 g008
Figure 9. (a) The transverse deformation profiles measured along the X-axis, and (b) the final central deflection of flat steel plates against the drop height.
Jmse 12 01730 g009
Figure 10. Comparison of the final deformation profiles of the two equal plates on the left and right sides at different drop heights.
Jmse 12 01730 g010
Figure 11. Representations of the saturation phenomena of the steel plates for the drop heights of (a) 800 mm and (b) 1000 mm.
Jmse 12 01730 g011
Figure 12. The total impulse and saturated impulse versus the drop height.
Jmse 12 01730 g012
Figure 13. (a) Dimensionless saturated deflection and (b) dimensionless saturated impulse versus drop height for various flat plates [12].
Jmse 12 01730 g013
Figure 14. (a) Boundary conditions and (b) schematic dimensions of the numerical model.
Jmse 12 01730 g014
Figure 15. Fitting of the Johnson–Cook model to the stress–strain curve of mild steel.
Jmse 12 01730 g015
Figure 16. Comparison of the numerical predictions with the test results for pressure–time histories of the (a) aluminum and (b) steel plates with a drop height of 1100 mm. Exp and FSI refer to the experiments and numerical simulations that considered the fluid–structure interaction, respectively.
Jmse 12 01730 g016
Figure 17. Comparison of the experimental data with the numerically predicted (a) peak pressure and (b) positive impulse of the slamming pulse loading.
Jmse 12 01730 g017
Figure 18. Comparison of numerical predictions with test results for the strain–time histories of the (a) aluminum and (b) steel plates (A-1.0-1100 and S-0.5-1100).
Jmse 12 01730 g018
Figure 19. Graphs of numerical predictions of (a) peak strain and (b) final strain versus experimental results.
Jmse 12 01730 g019
Figure 20. Graph of the numerical predictions of the final central deflection of the aluminum and steel plates versus the experimental data.
Jmse 12 01730 g020
Figure 21. Numerical simulations of the transient response of the aluminum plate (A-1.0-1100): (a) the central deflection–time history of the plate; (b) deformed profiles for y = 0 at selected instants indicated in (a).
Jmse 12 01730 g021
Figure 22. Interaction between the fluid and structure at the selected time instants (A-1.0-1100).
Jmse 12 01730 g022
Figure 23. Numerical predictions of the saturation phenomenon of the flat (a) aluminum and (b) steel plates with the drop height of 1100 mm.
Jmse 12 01730 g023
Figure 24. The total impulse and saturated impulse versus the drop height: (a) aluminum plates of thickness 1.0 mm, (b) steel plates of thickness 0.5 mm, and (c) steel plates of thickness 1.0 mm.
Jmse 12 01730 g024
Table 1. Drop model test conditions.
Test ObjectMaterialDrop Height (mm)Series Number *
Drop modelMild steel700S-1.0-700
800S-1.0-800
900S-1.0-900
1000S-1.0-1000
1100S-1.0-1100
1200S-1.0-1200
* Series number S-□□-□□□□ means steel-thickness-drop height.
Table 2. Dimensions of the fluid domains (unit: mm).
ModelWater DomainAir DomainInitial Gap
L1L2L3L4L5L6L7L8di
Aluminum/steel plate3006008001200300500300500100
Table 3. Parameter values of Johnson–Cook material model.
TypeDensity ρ [kg/m3]Young’s Modulus [GPa]A [MPa]B [MPa]n [-]c [-]
Aluminum A1060270070.0132.7454.130.32-
Mild steel
(S-0.5)
7850206.0263.56594.580.530.0652
Mild steel
(S-1.0)
7850206.0270.16553.400.760.0652
Table 4. EOS coefficients of fluid model.
*EOS_Linear_Polynomial*EOS_Gruneisen
ParameterUnitValueParameterUnitValue
ρ0kg/m31.225ρ0kg/m31000
C0MPa0.0Cm/s1480
C1MPa0.0S1-1.921
C2MPa0.0S2-−0.096
C3MPa0.0S3-0.0
C4-0.4γ0-0.35
C5-0.4a-0.0
C6-0.0EMPa0.2895
EMPa0.25V0-1.0
V0-1.0
Disclaimer/Publisher’s Note: The statements, opinions and data contained in all publications are solely those of the individual author(s) and contributor(s) and not of MDPI and/or the editor(s). MDPI and/or the editor(s) disclaim responsibility for any injury to people or property resulting from any ideas, methods, instructions or products referred to in the content.

