
Structural and Reservoir Characteristics of Potential Carbon Dioxide Storage Sites in the Northern South Yellow Sea Basin, Offshore Eastern China

 ,
, 
Abstract
1. Introduction
2. Geologic Setting and CO2 Storage Potential
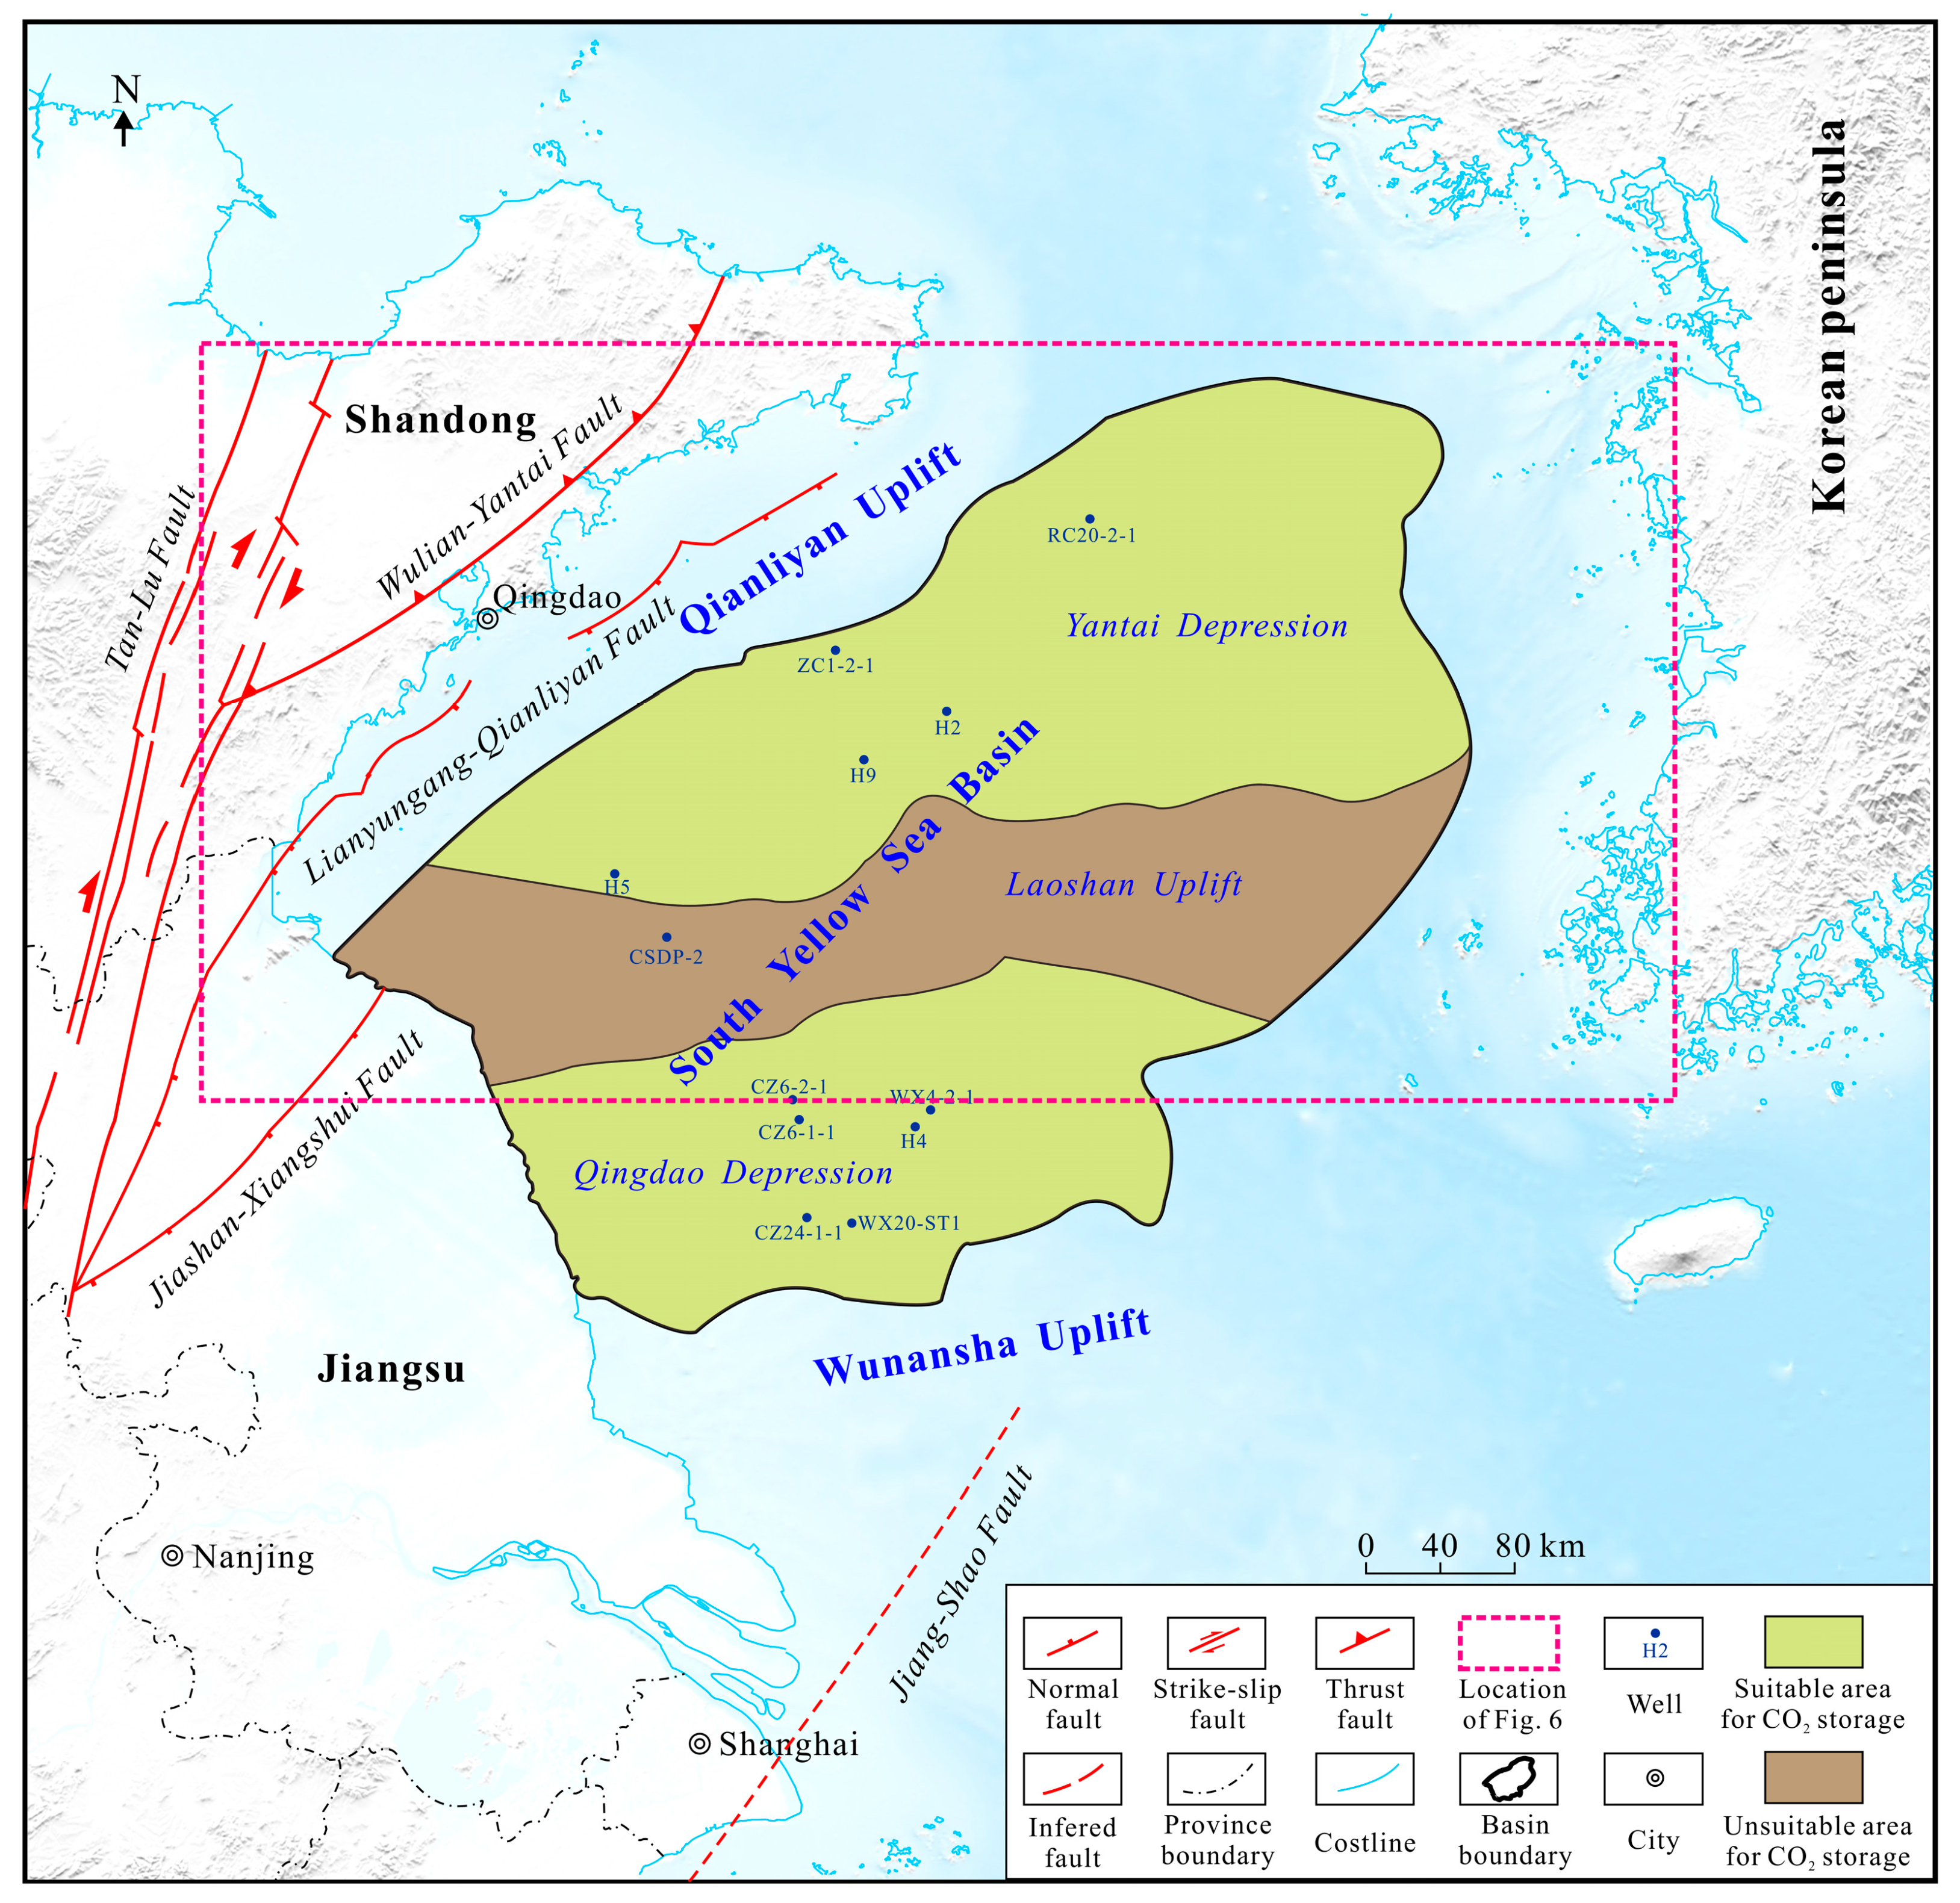
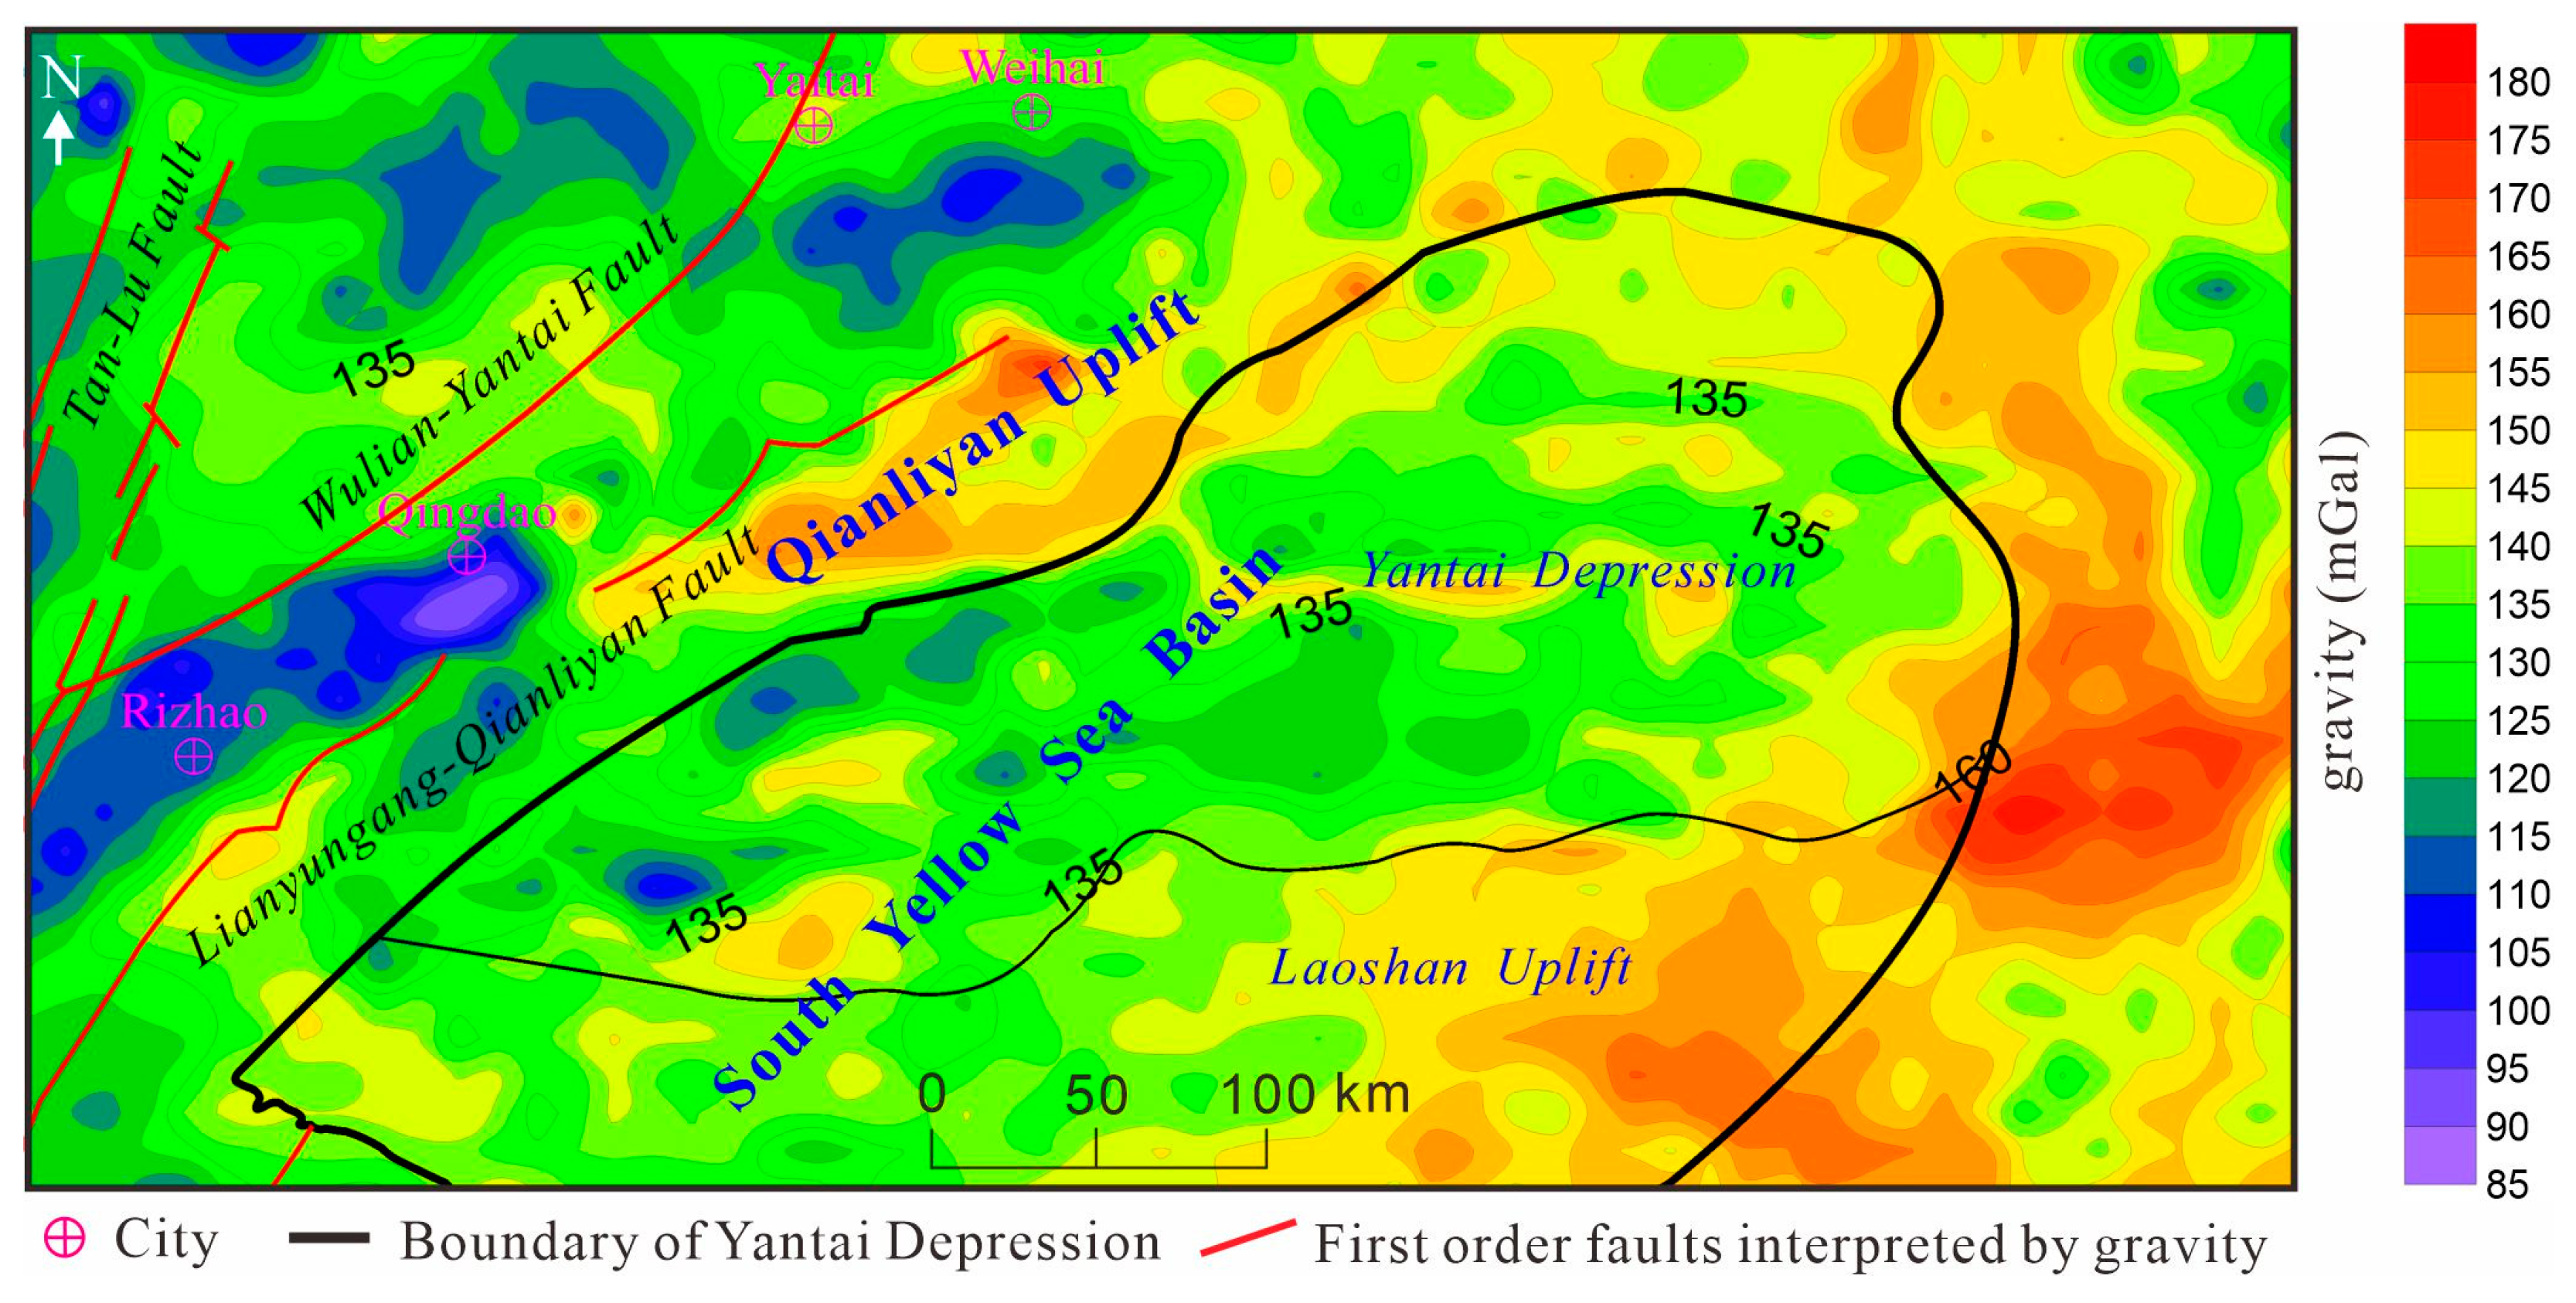
2.1. Geologic Background
2.2. CO2 Storage Potential
3. Dataset and Methodology
3.1. Dataset
3.2. Seismic Interpreation
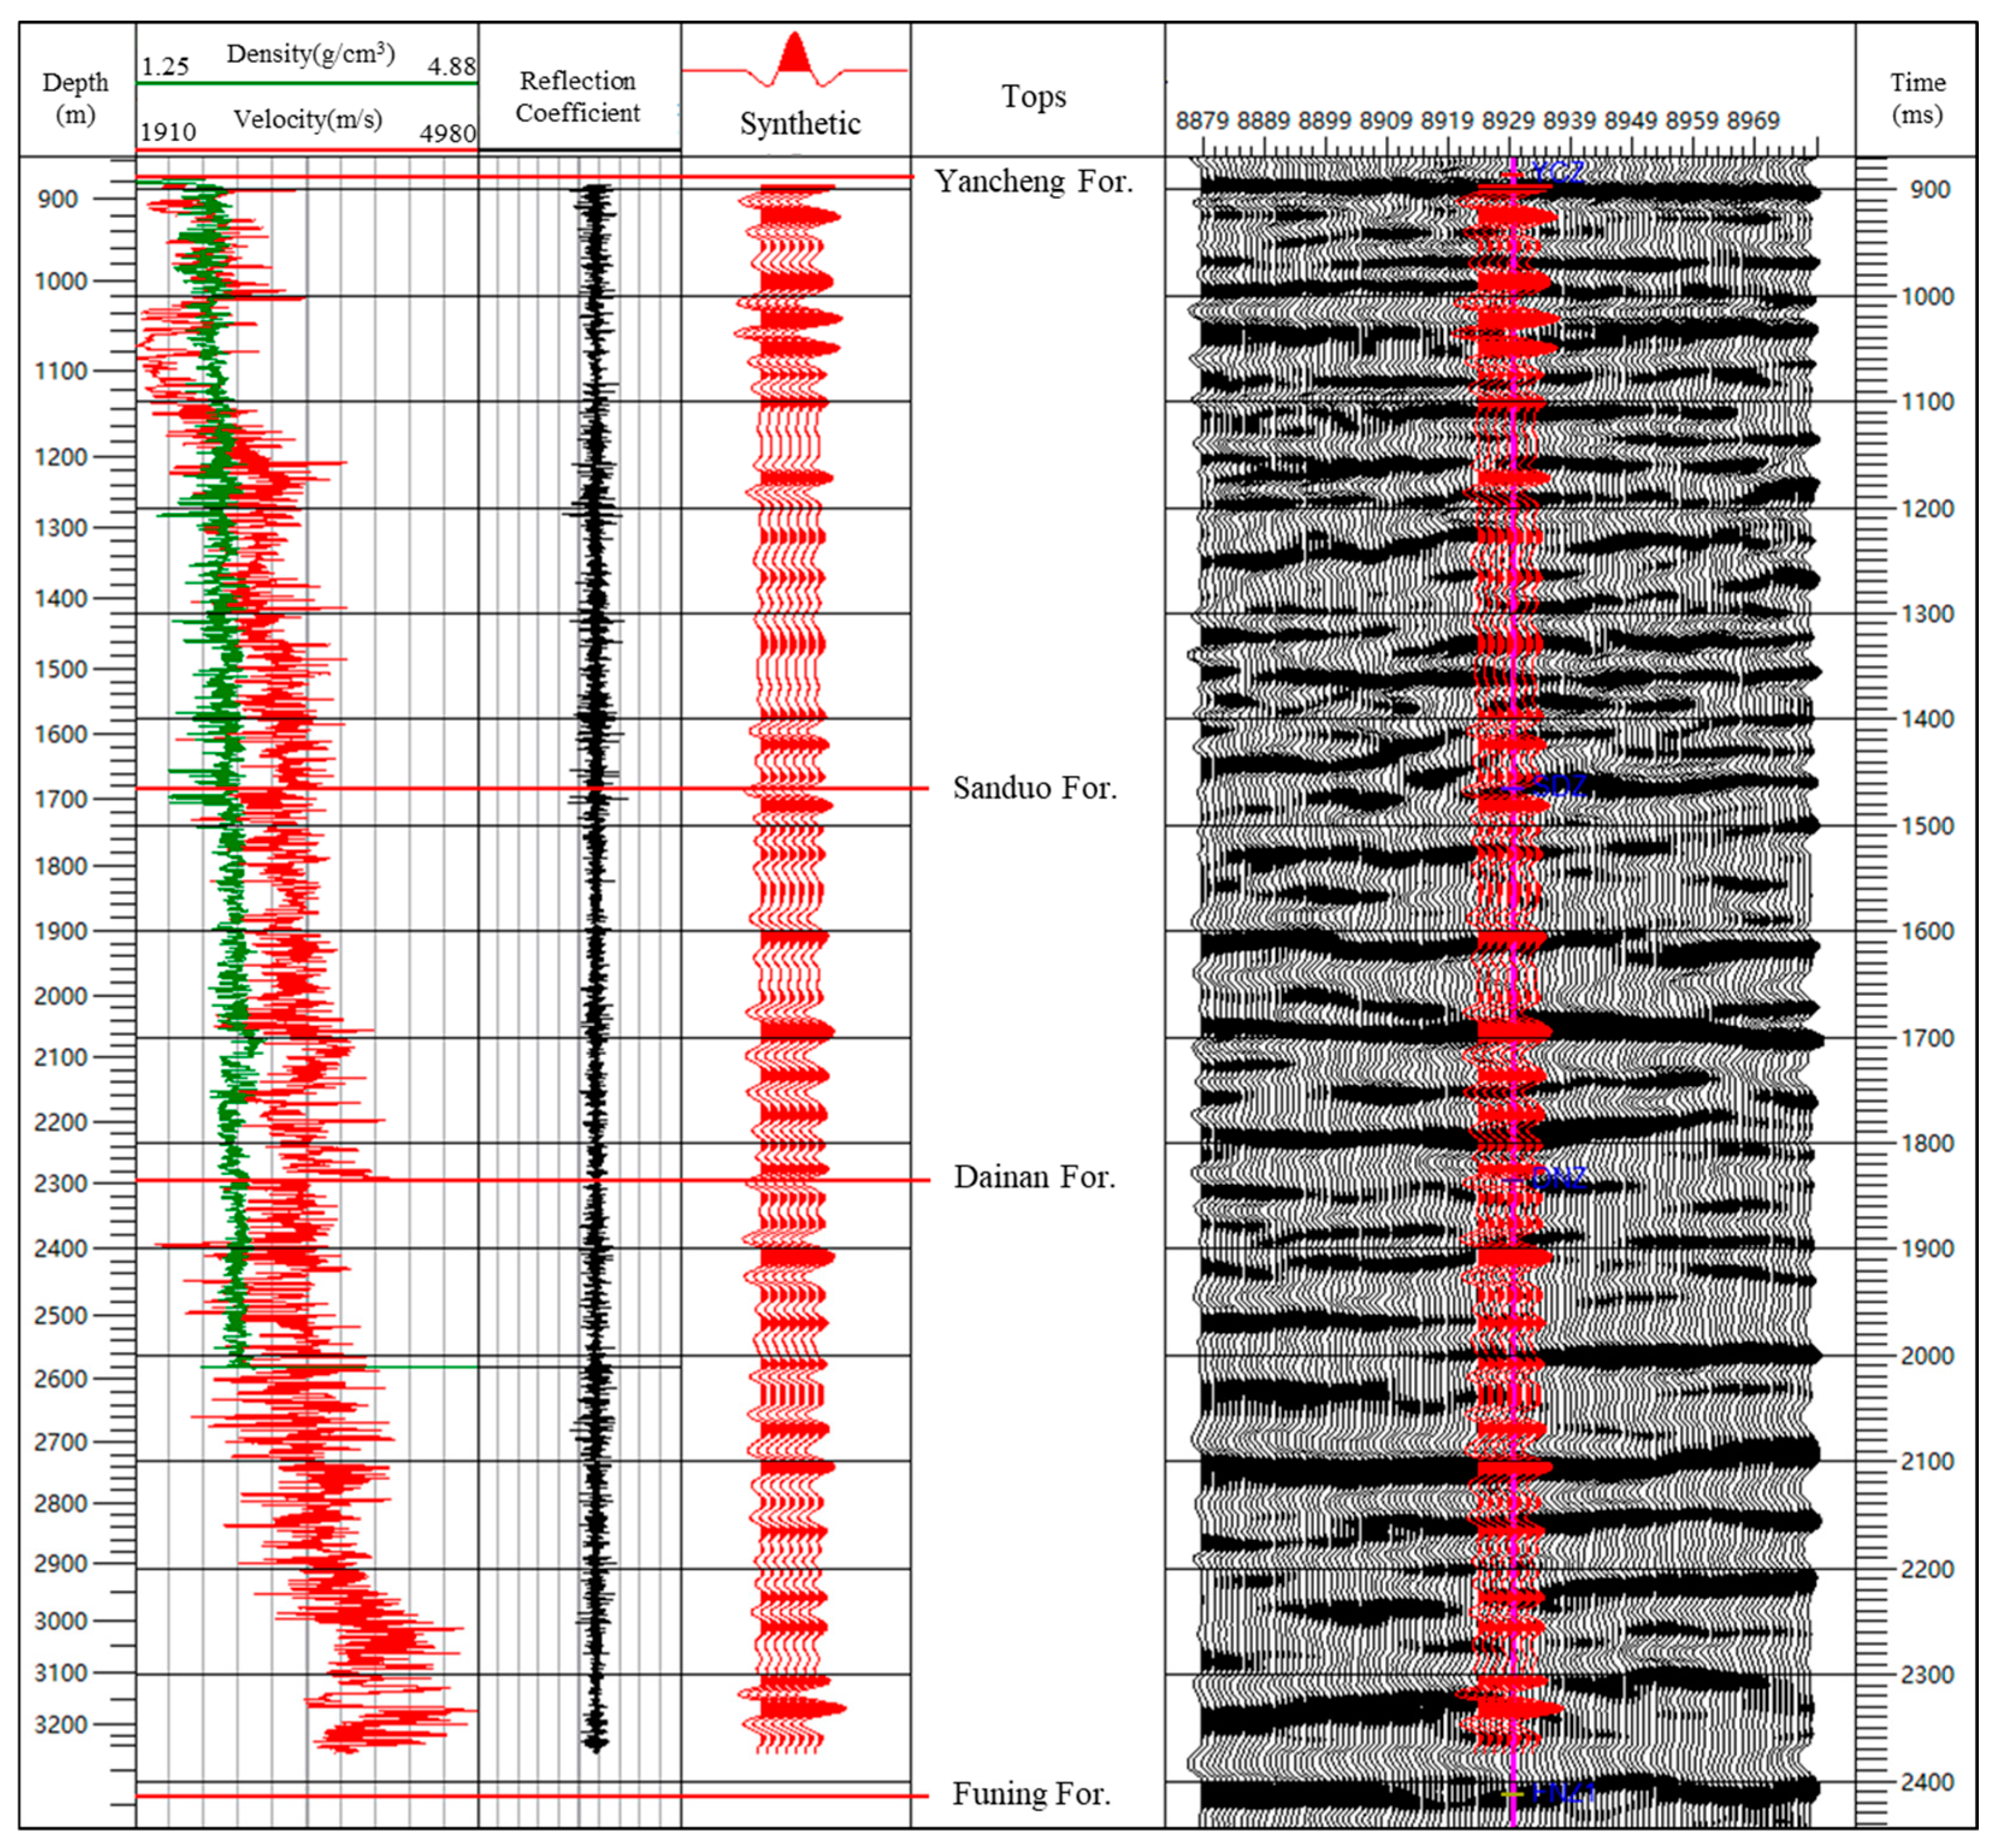
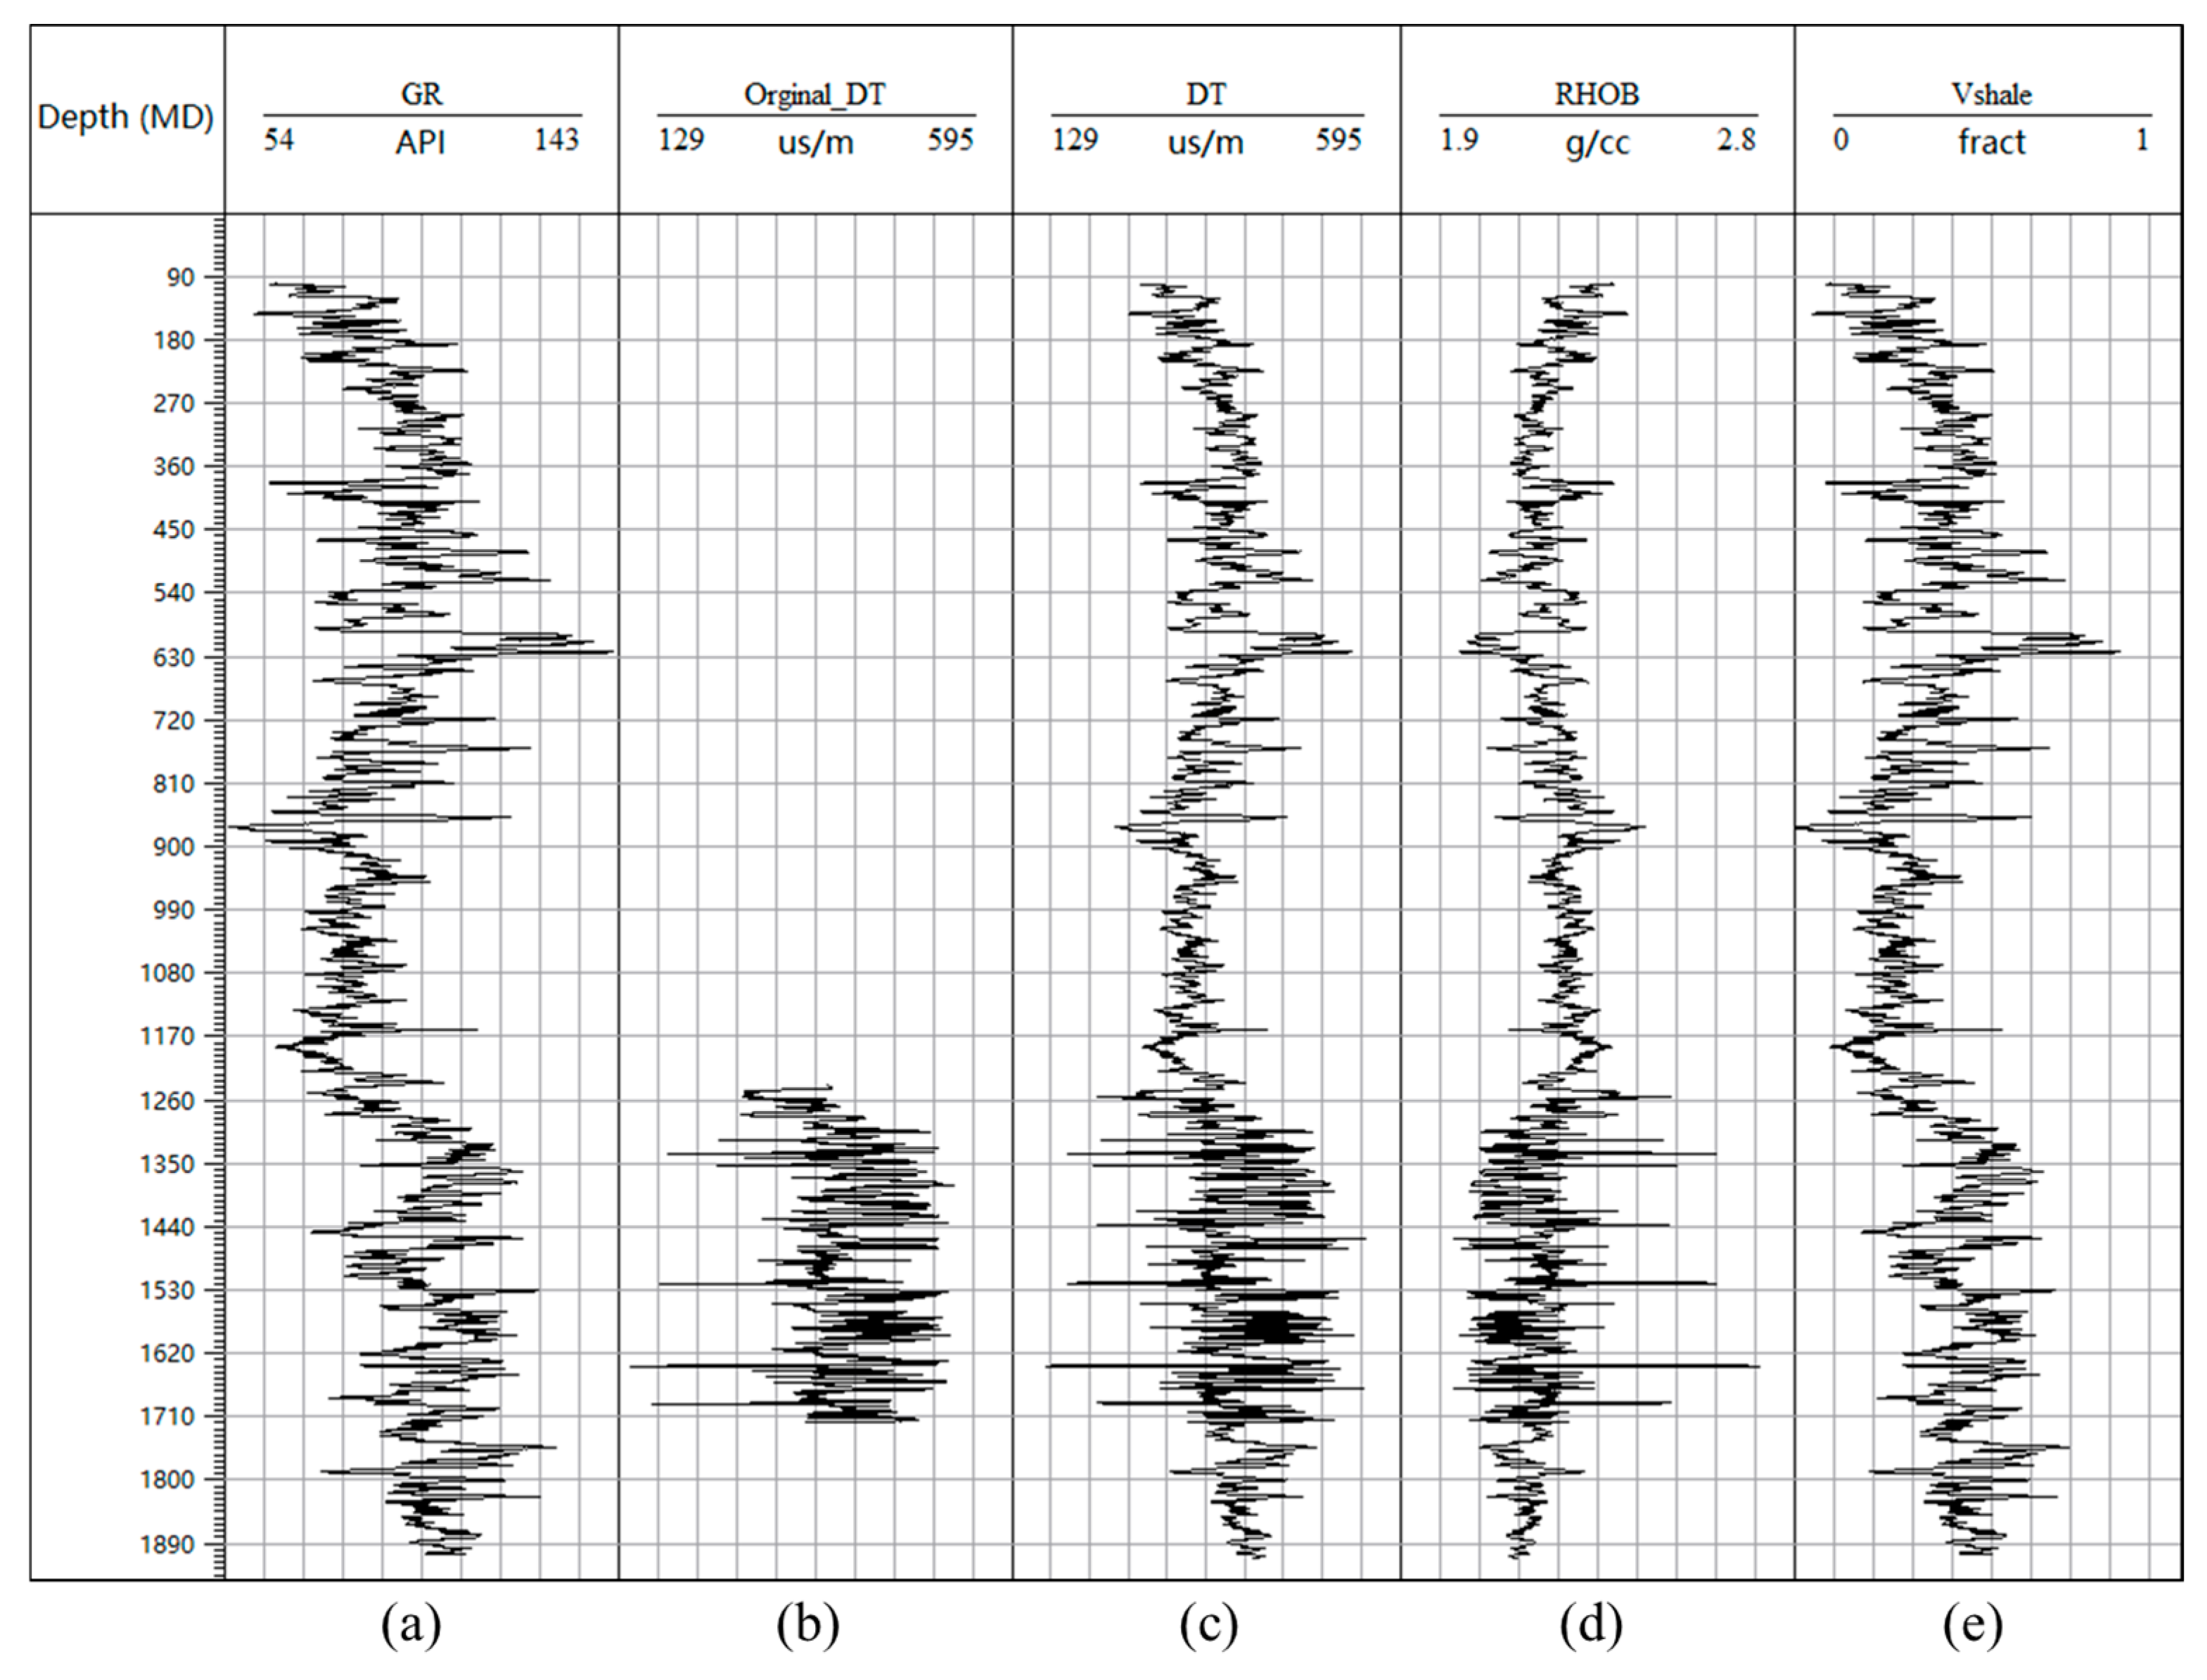
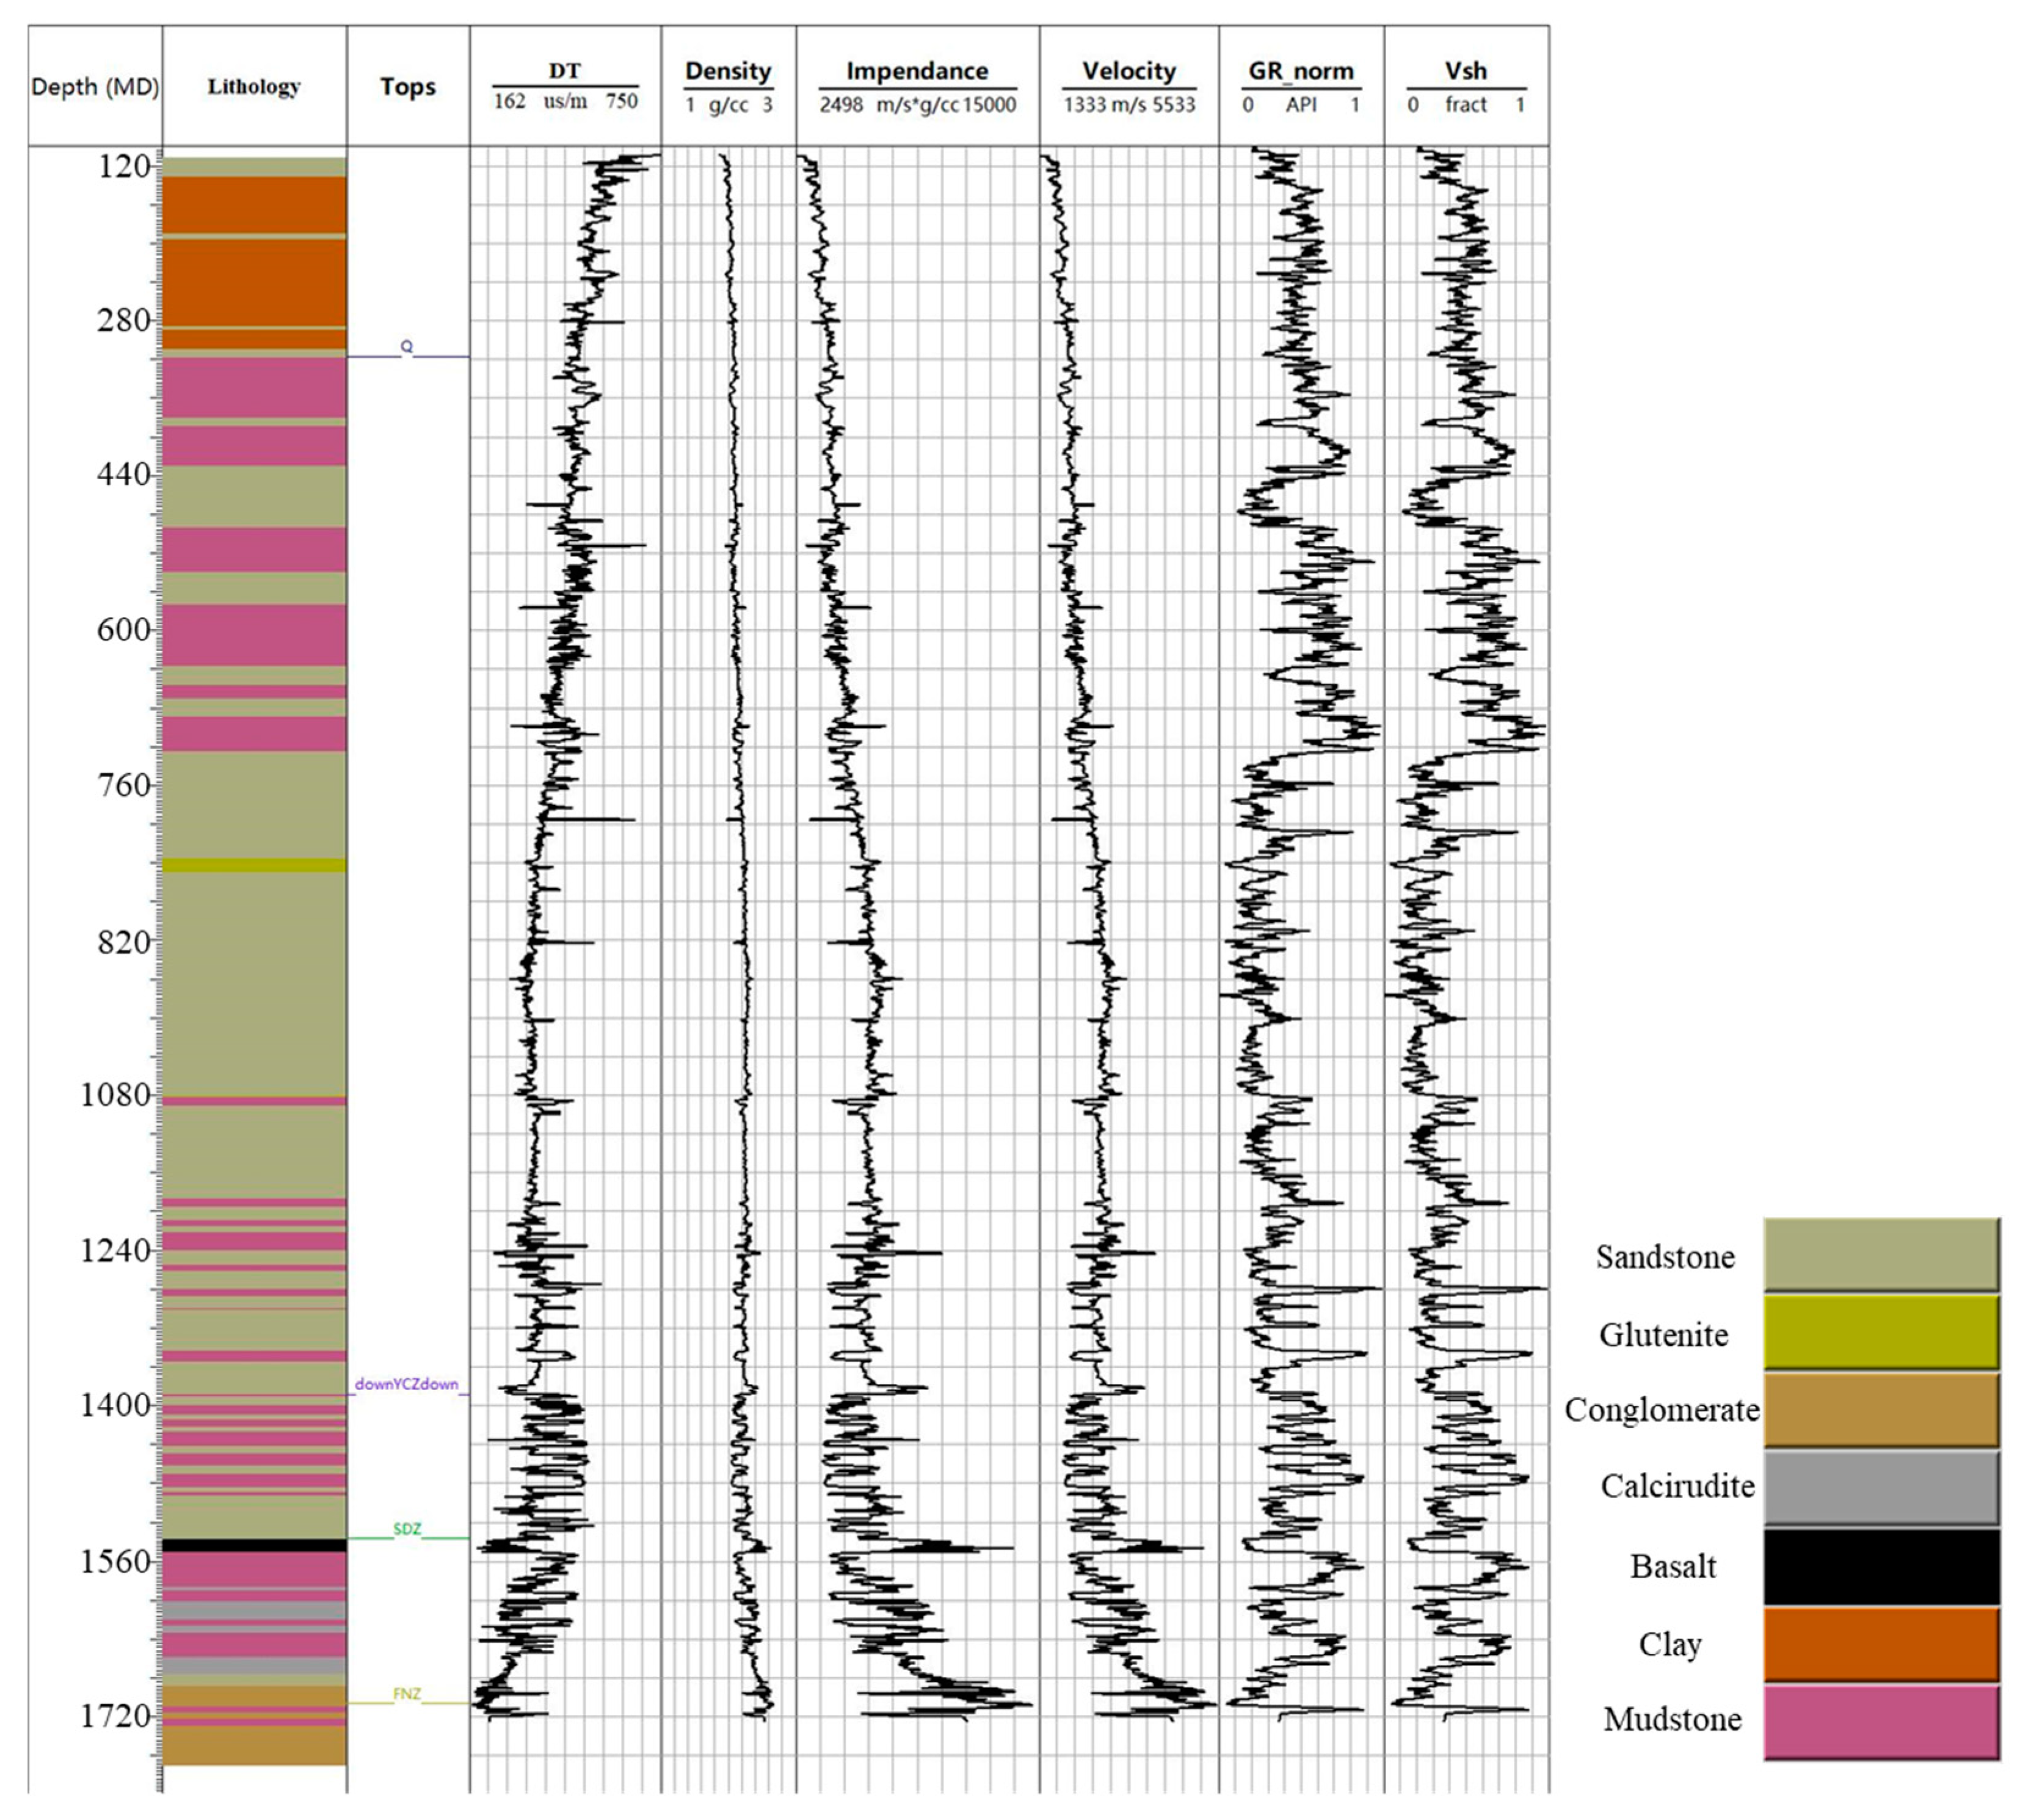
3.3. Wireline Logging Data Anylasis and the Petrophysical Model
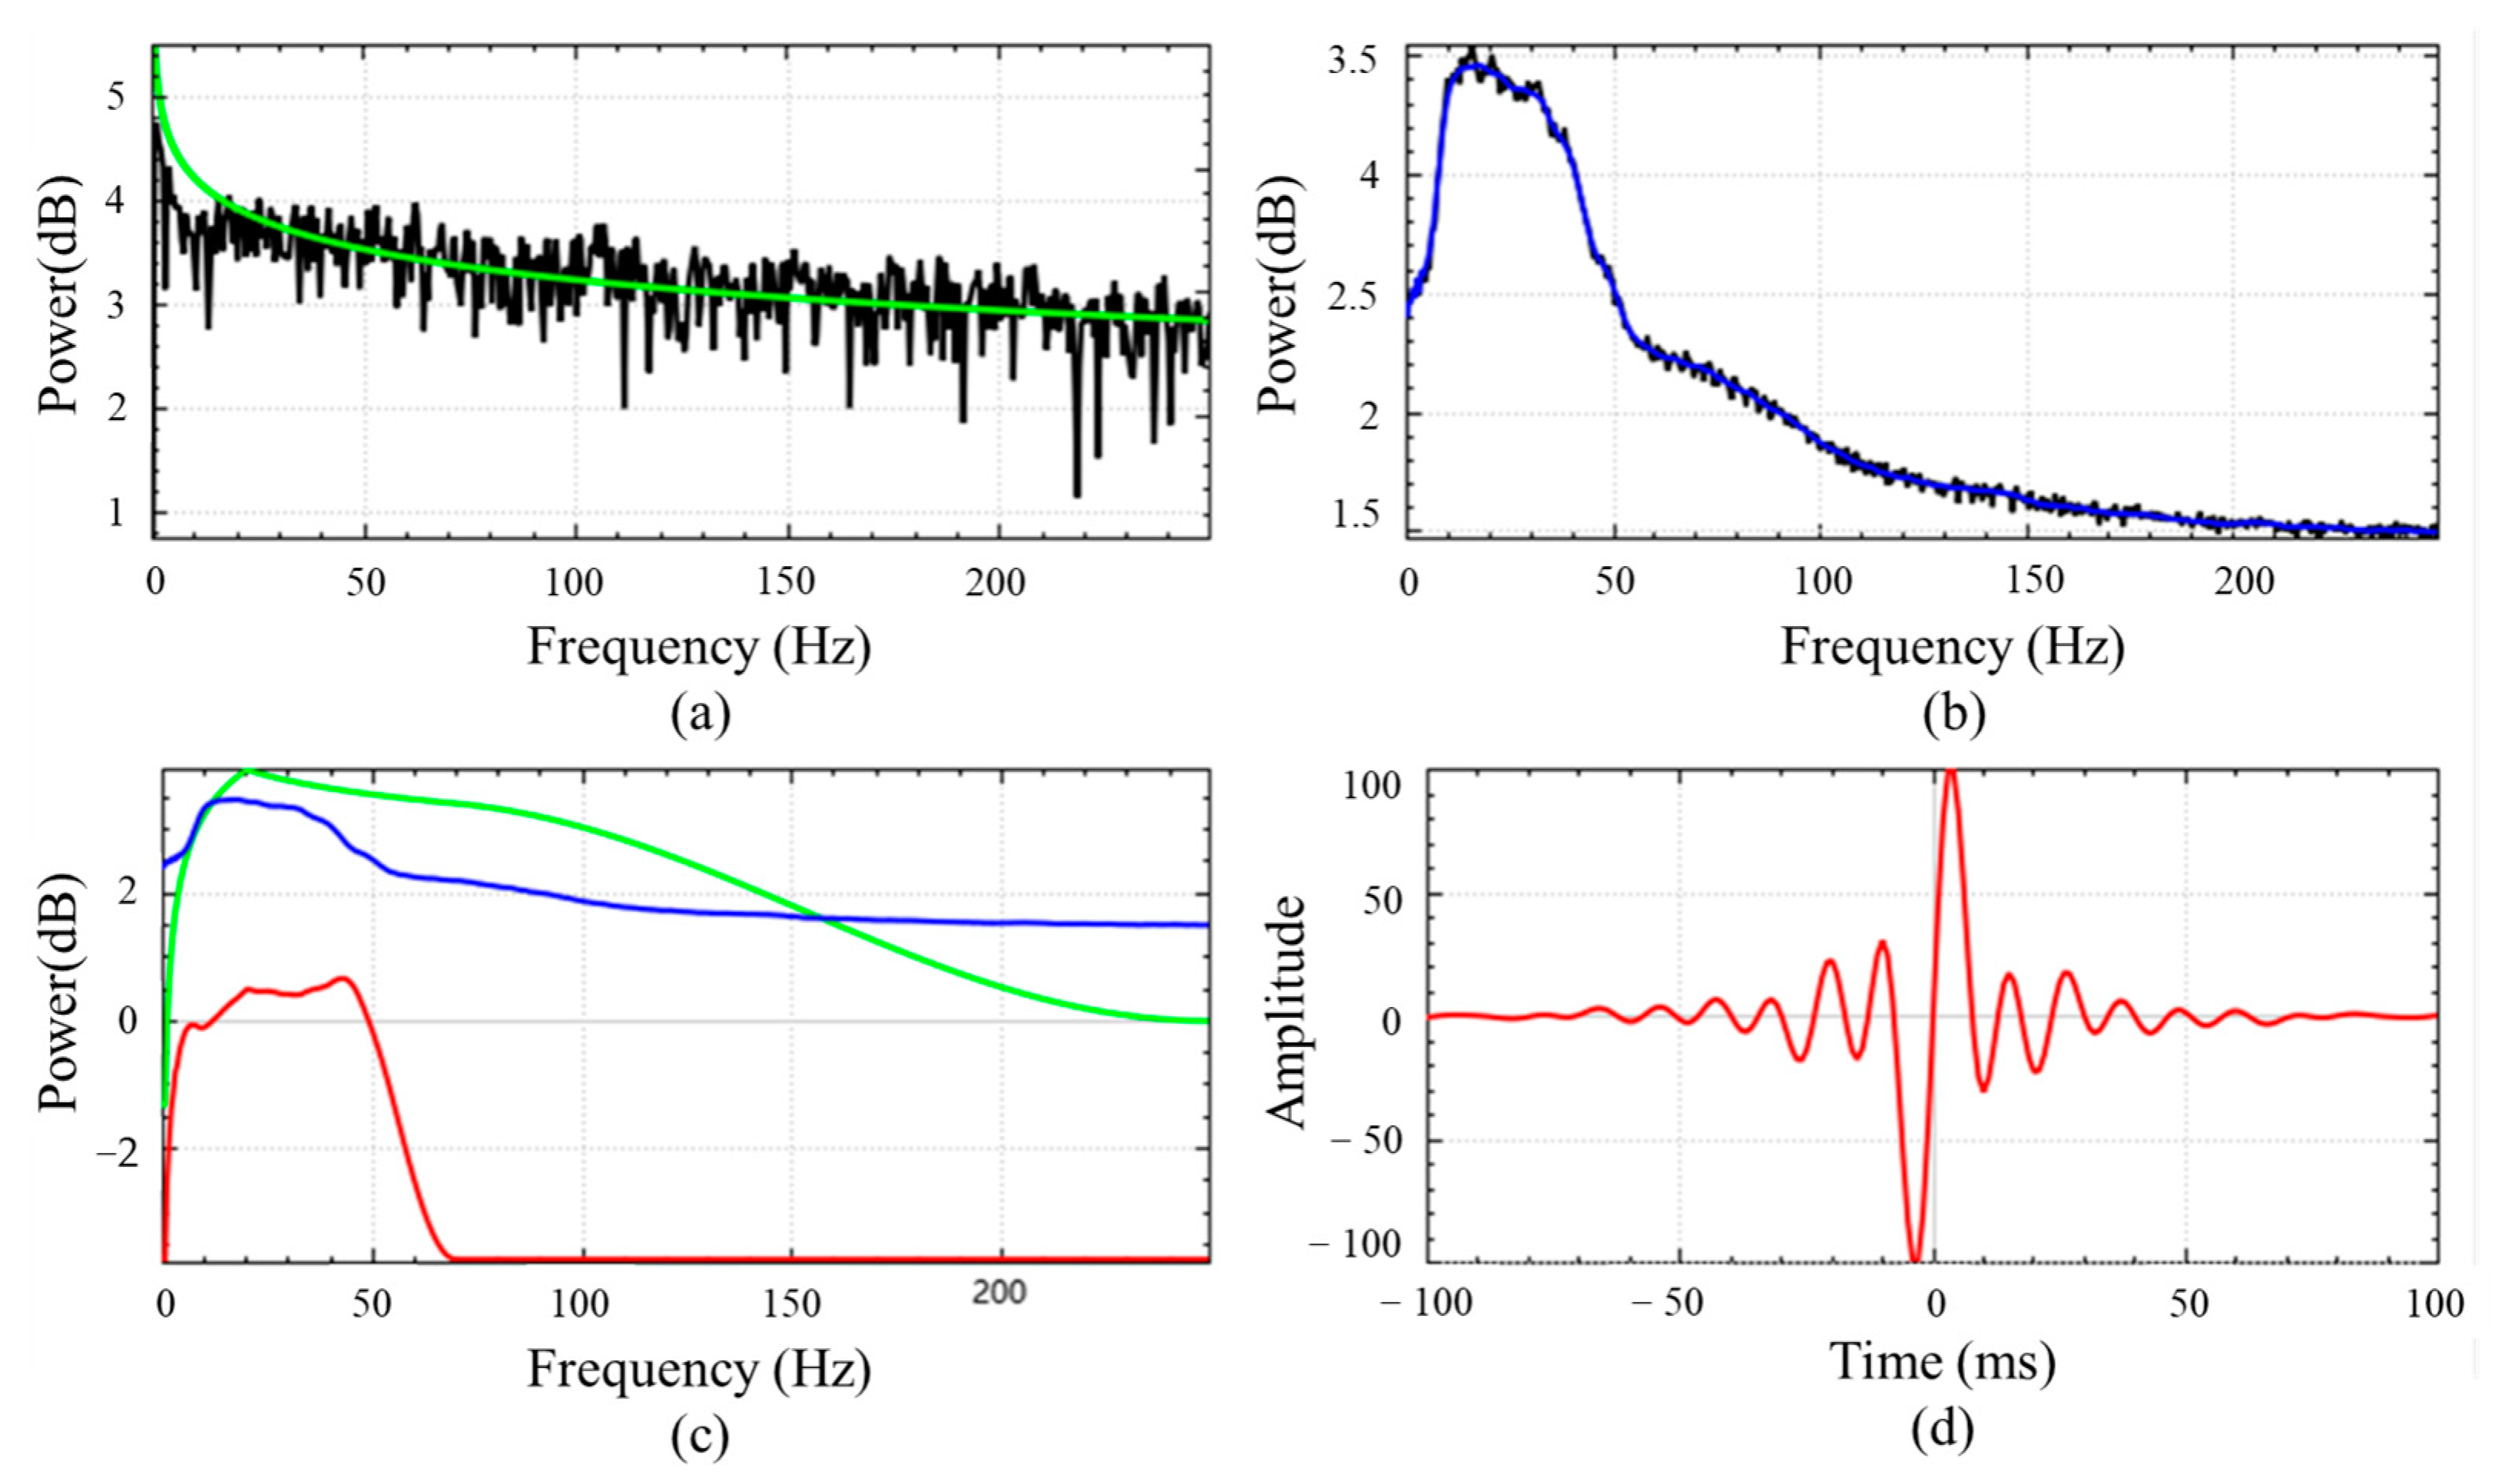
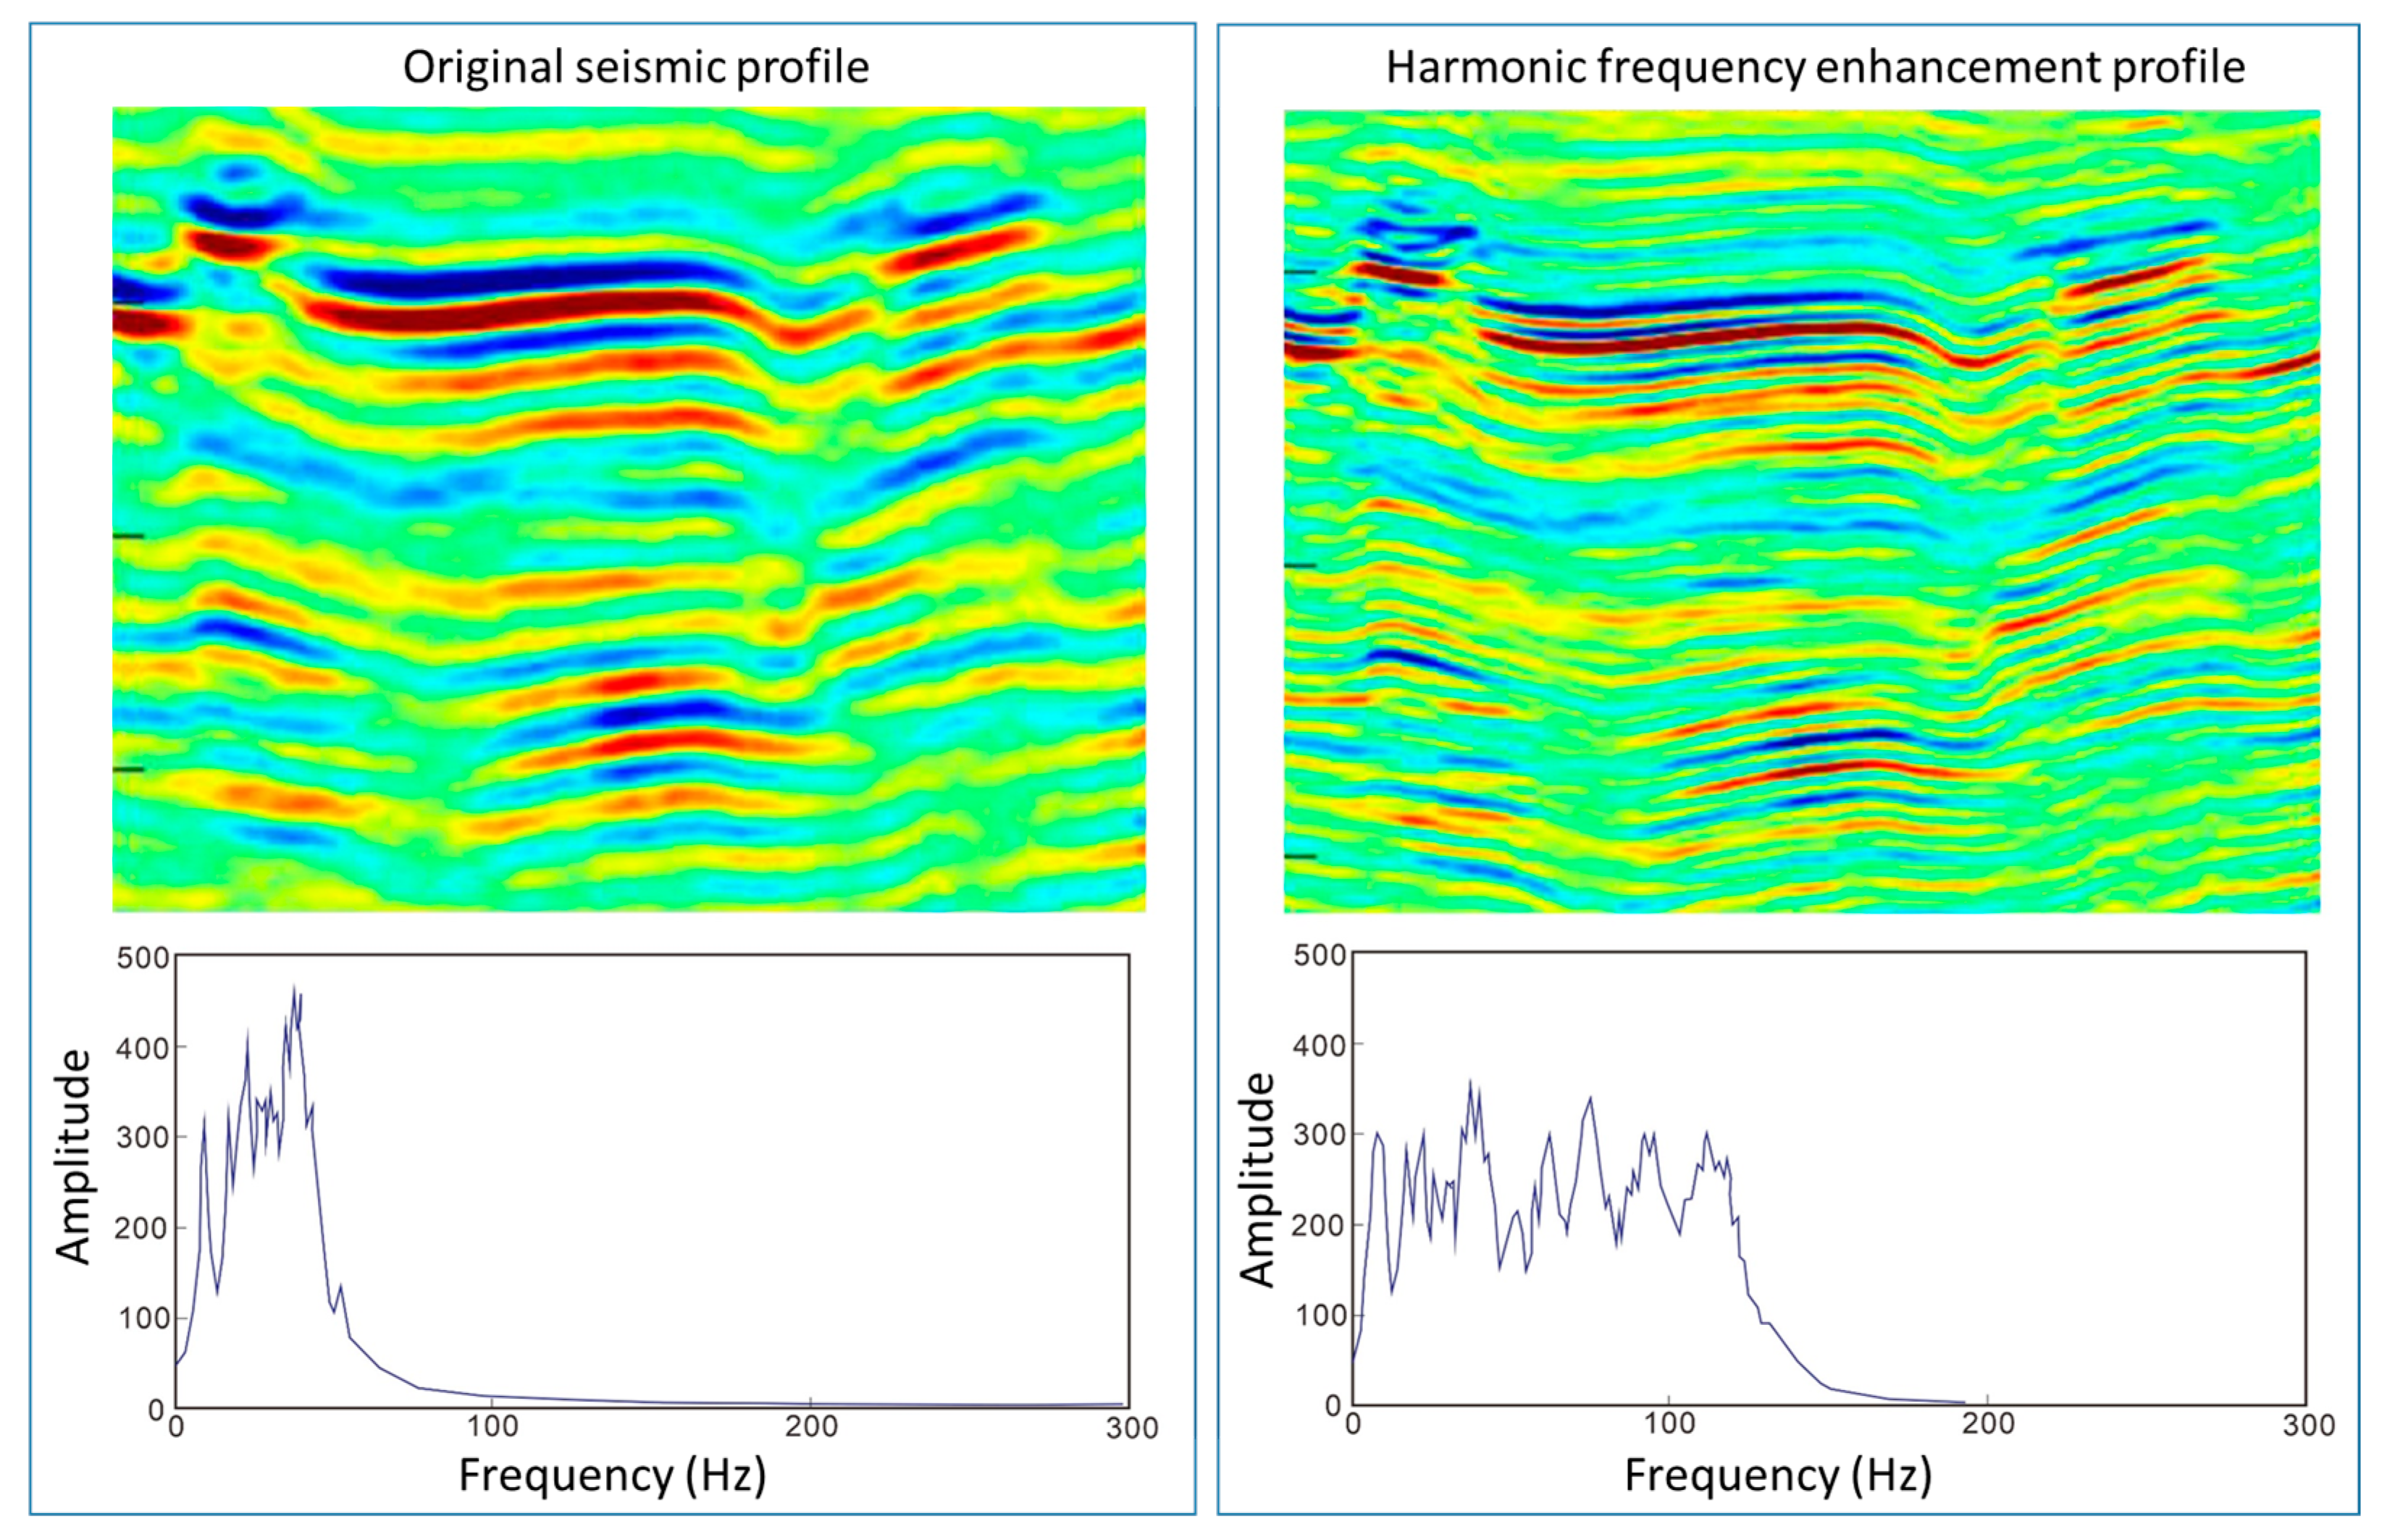
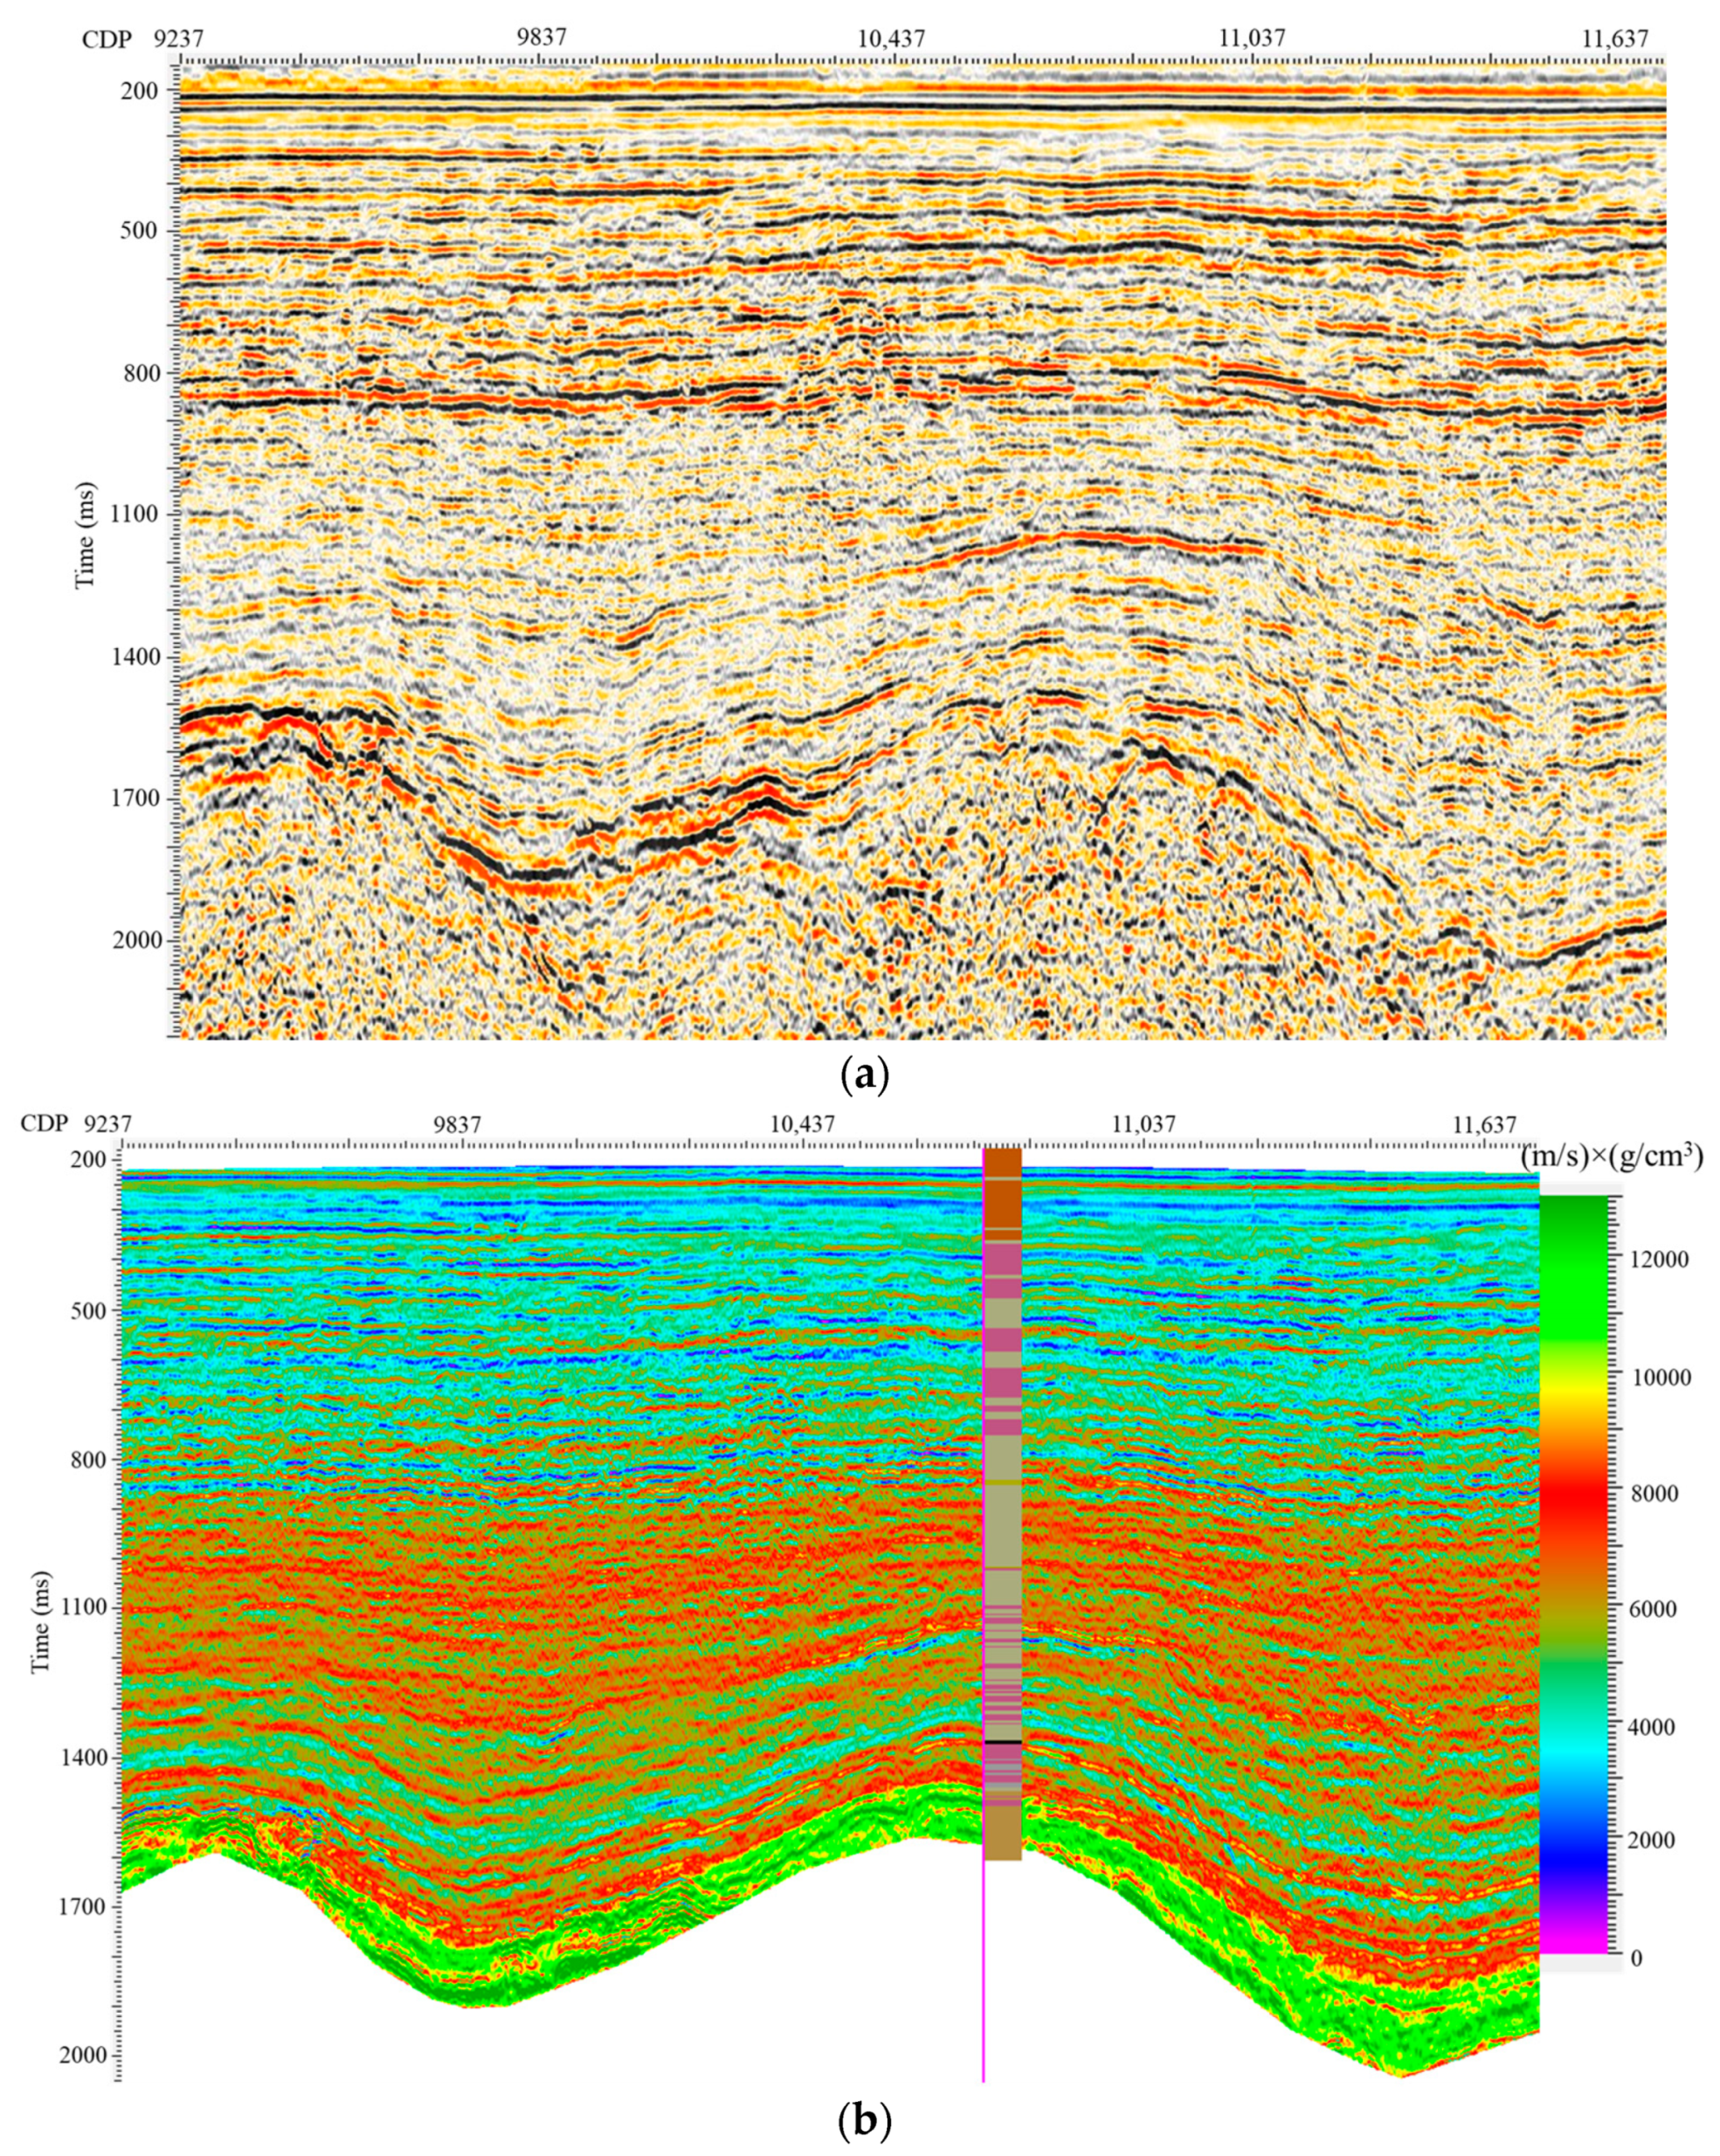
3.4. Post-Stack Seismic Inversion
4. Results
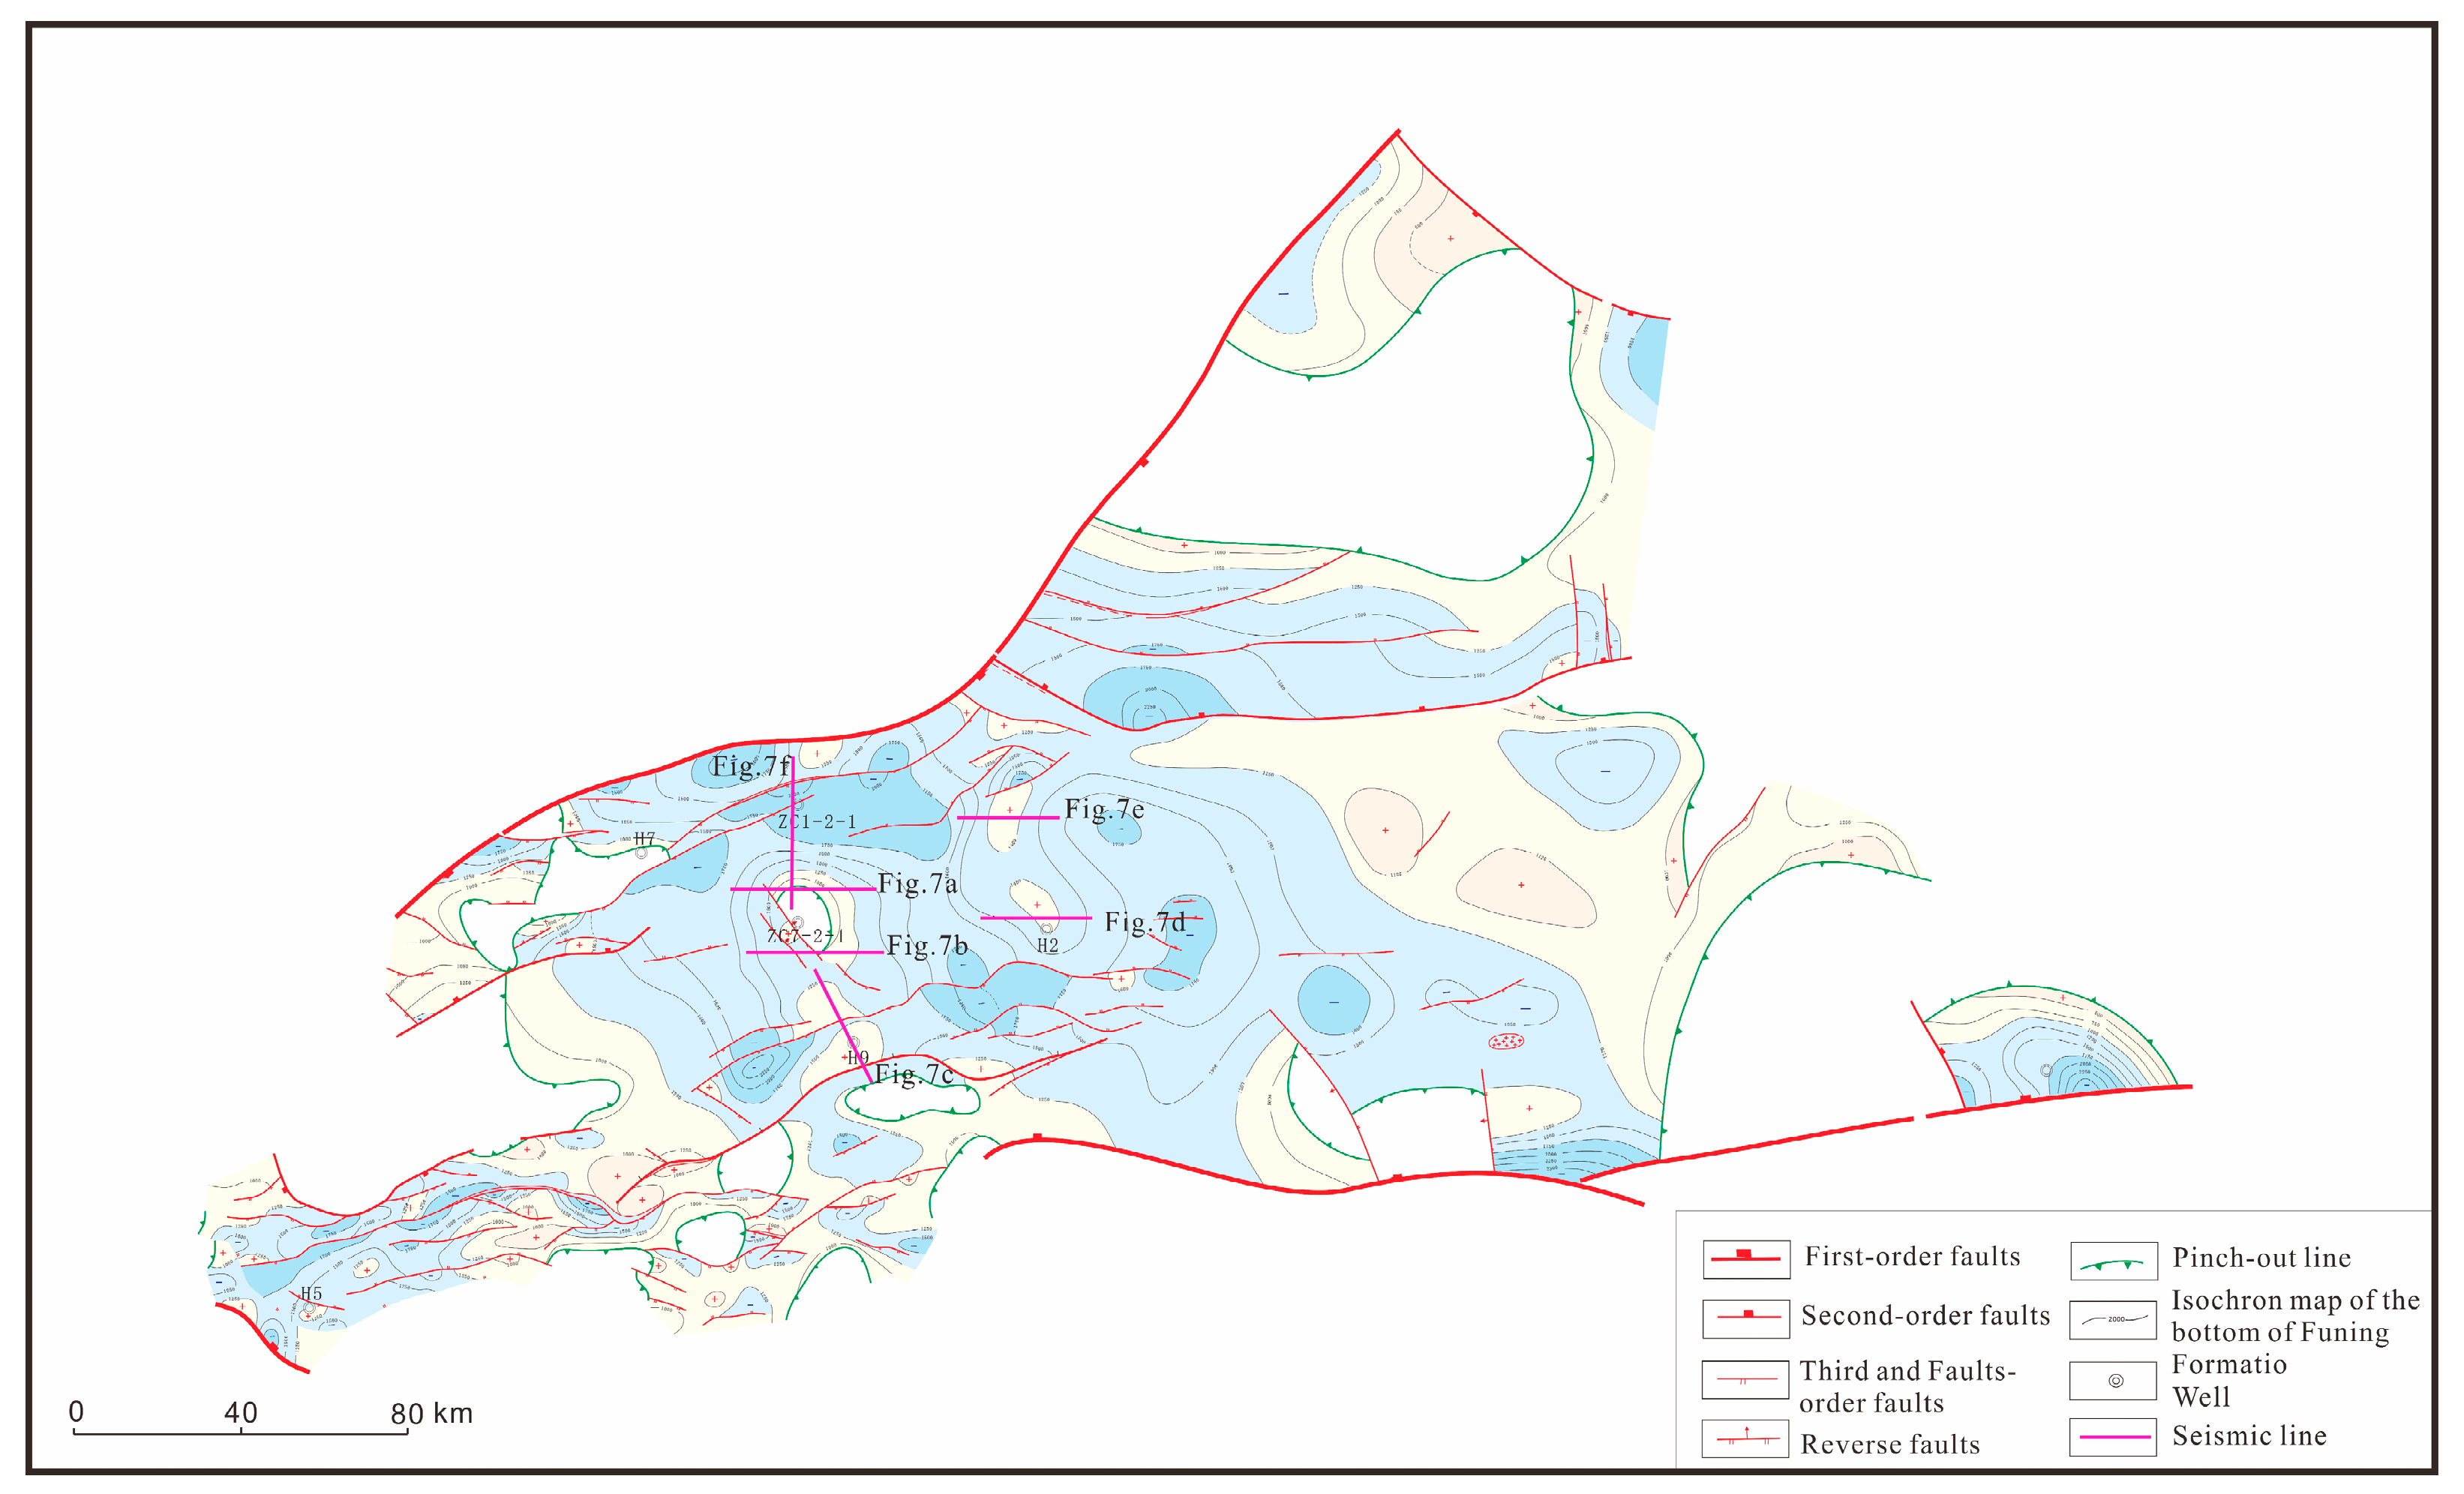
4.1. Structural Characteristics of the Yantai Depression
4.1.1. Regional Tectonic Characteristics and Cenozoic Tectonic Movement
4.1.2. Structural Trap Types
- Thrust anticline
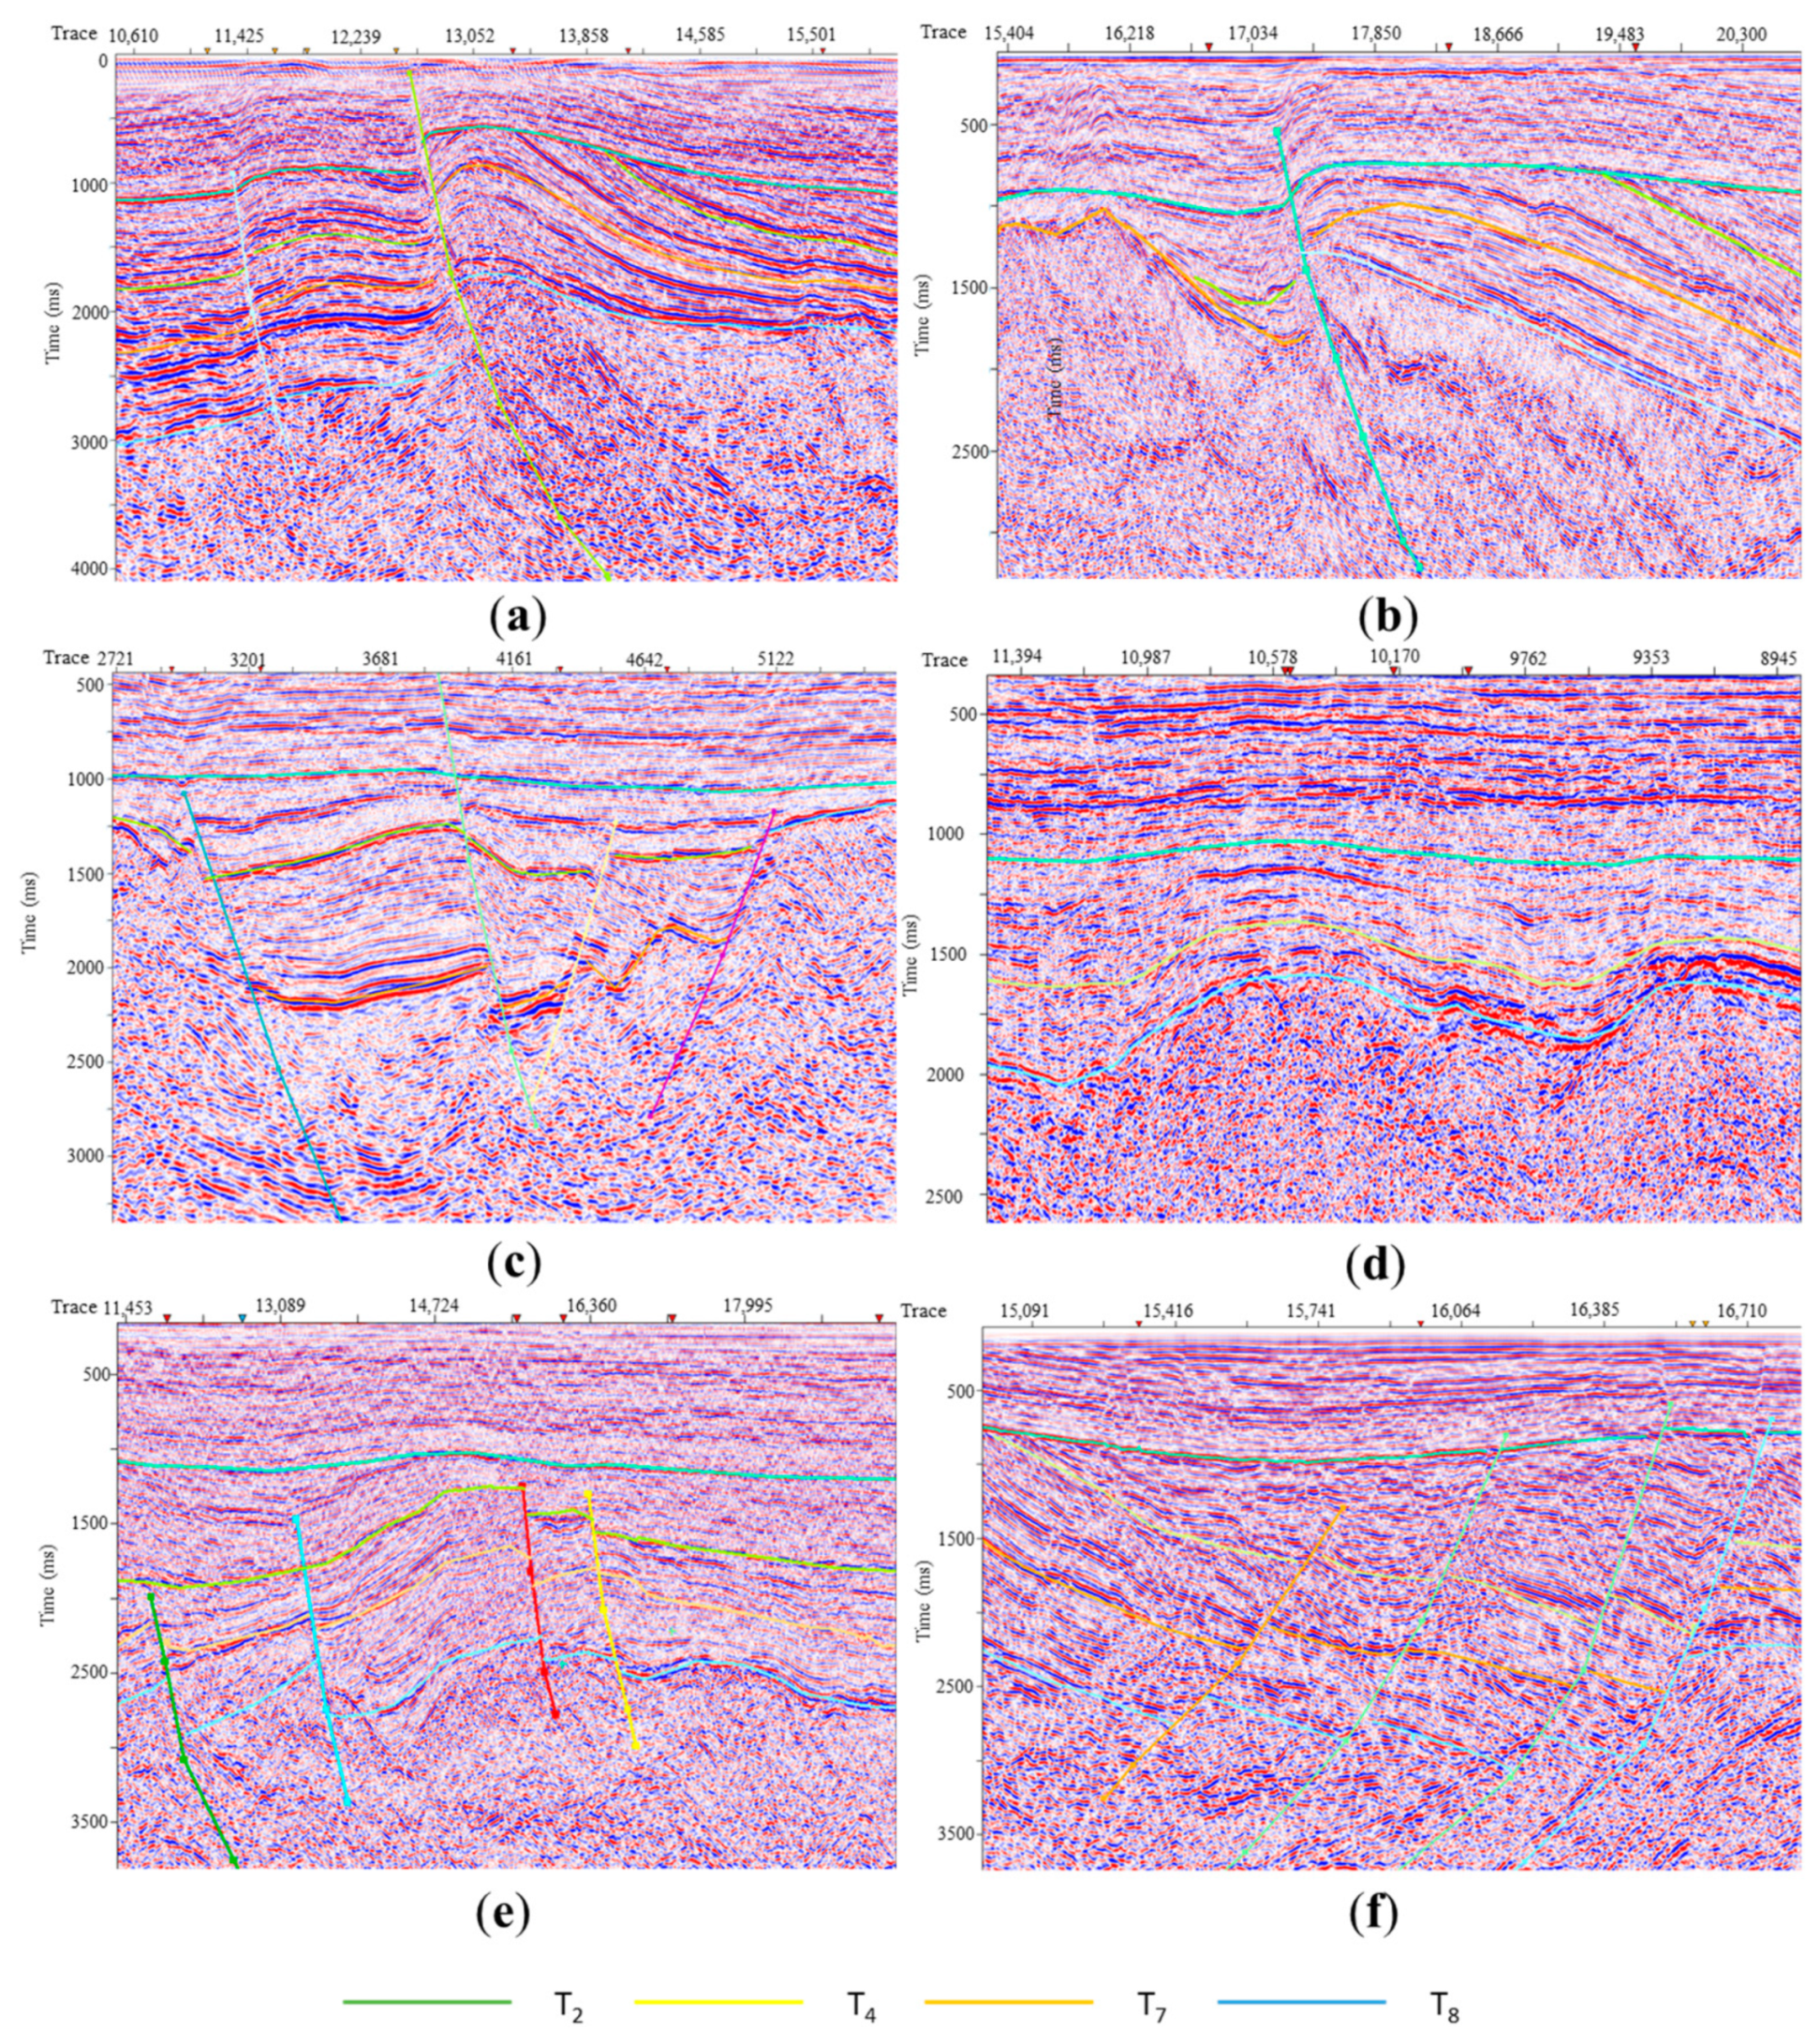
- Collapsed anticline
- Compressional anticline
- Faulted anticline
- Fault block structure
4.2. Reservoir Characteristics
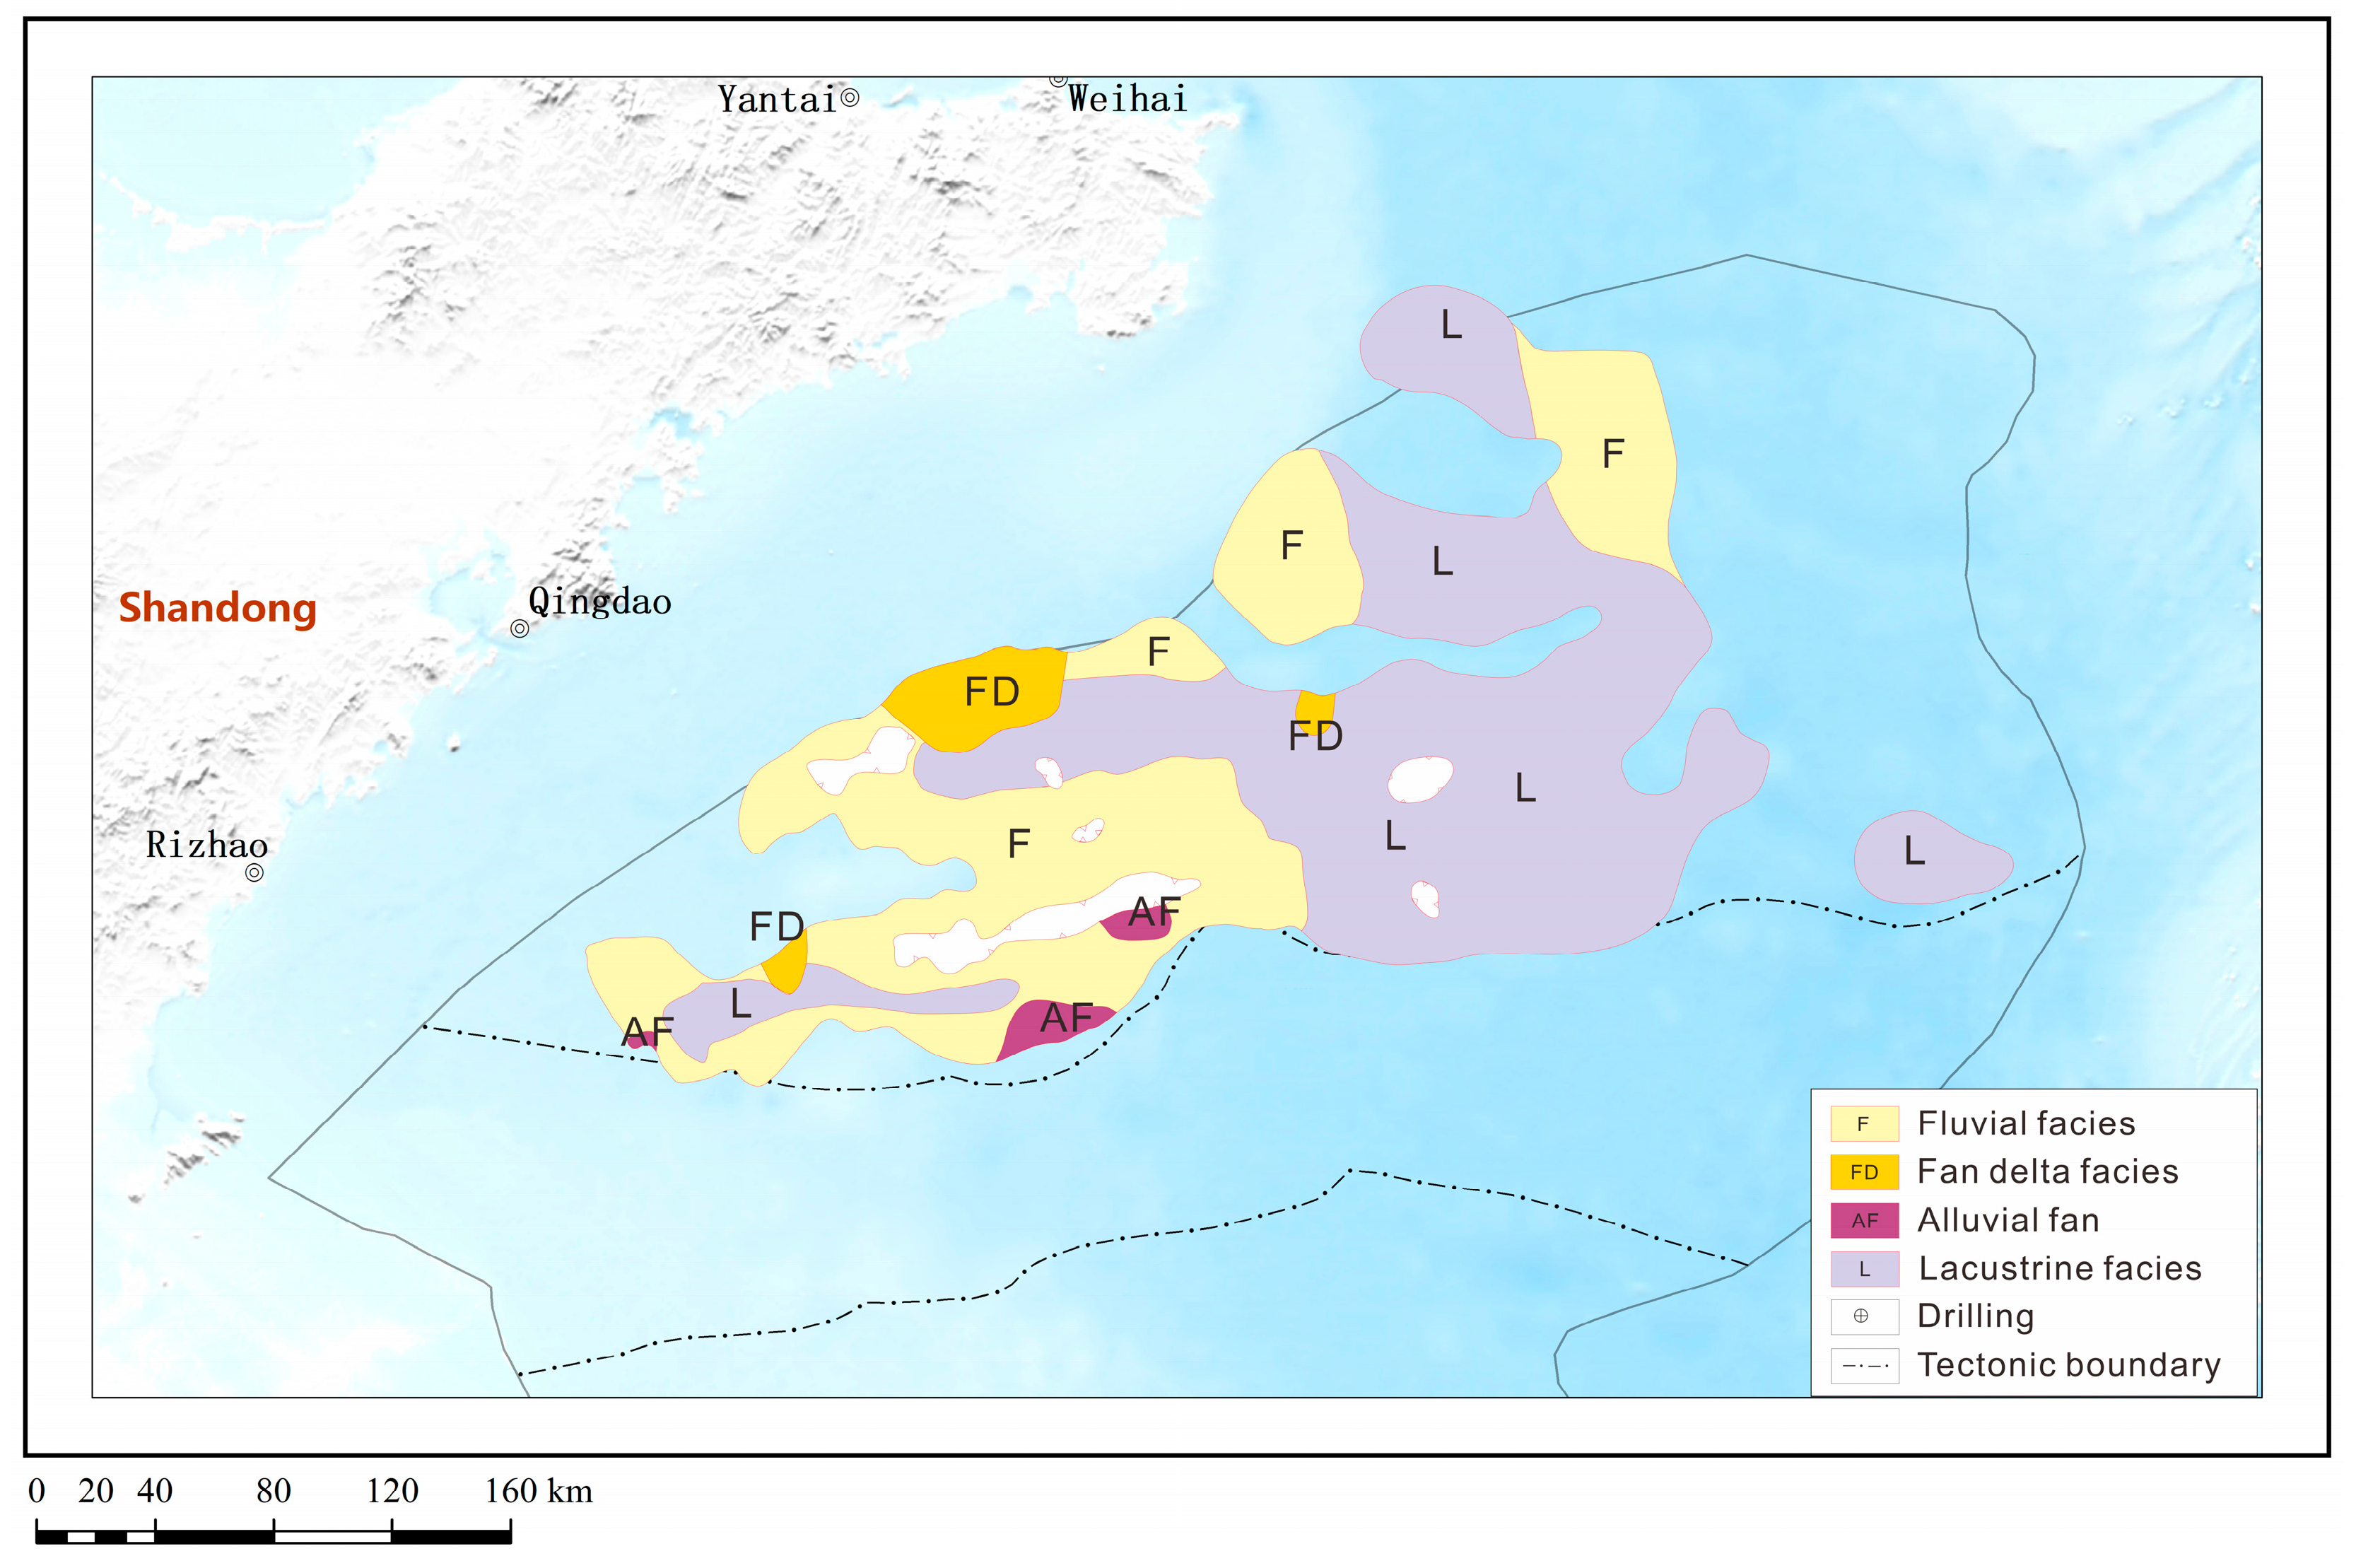
4.2.1. Stratigraphic Sequence and Sedimentary Characteristics of the Cenozoic
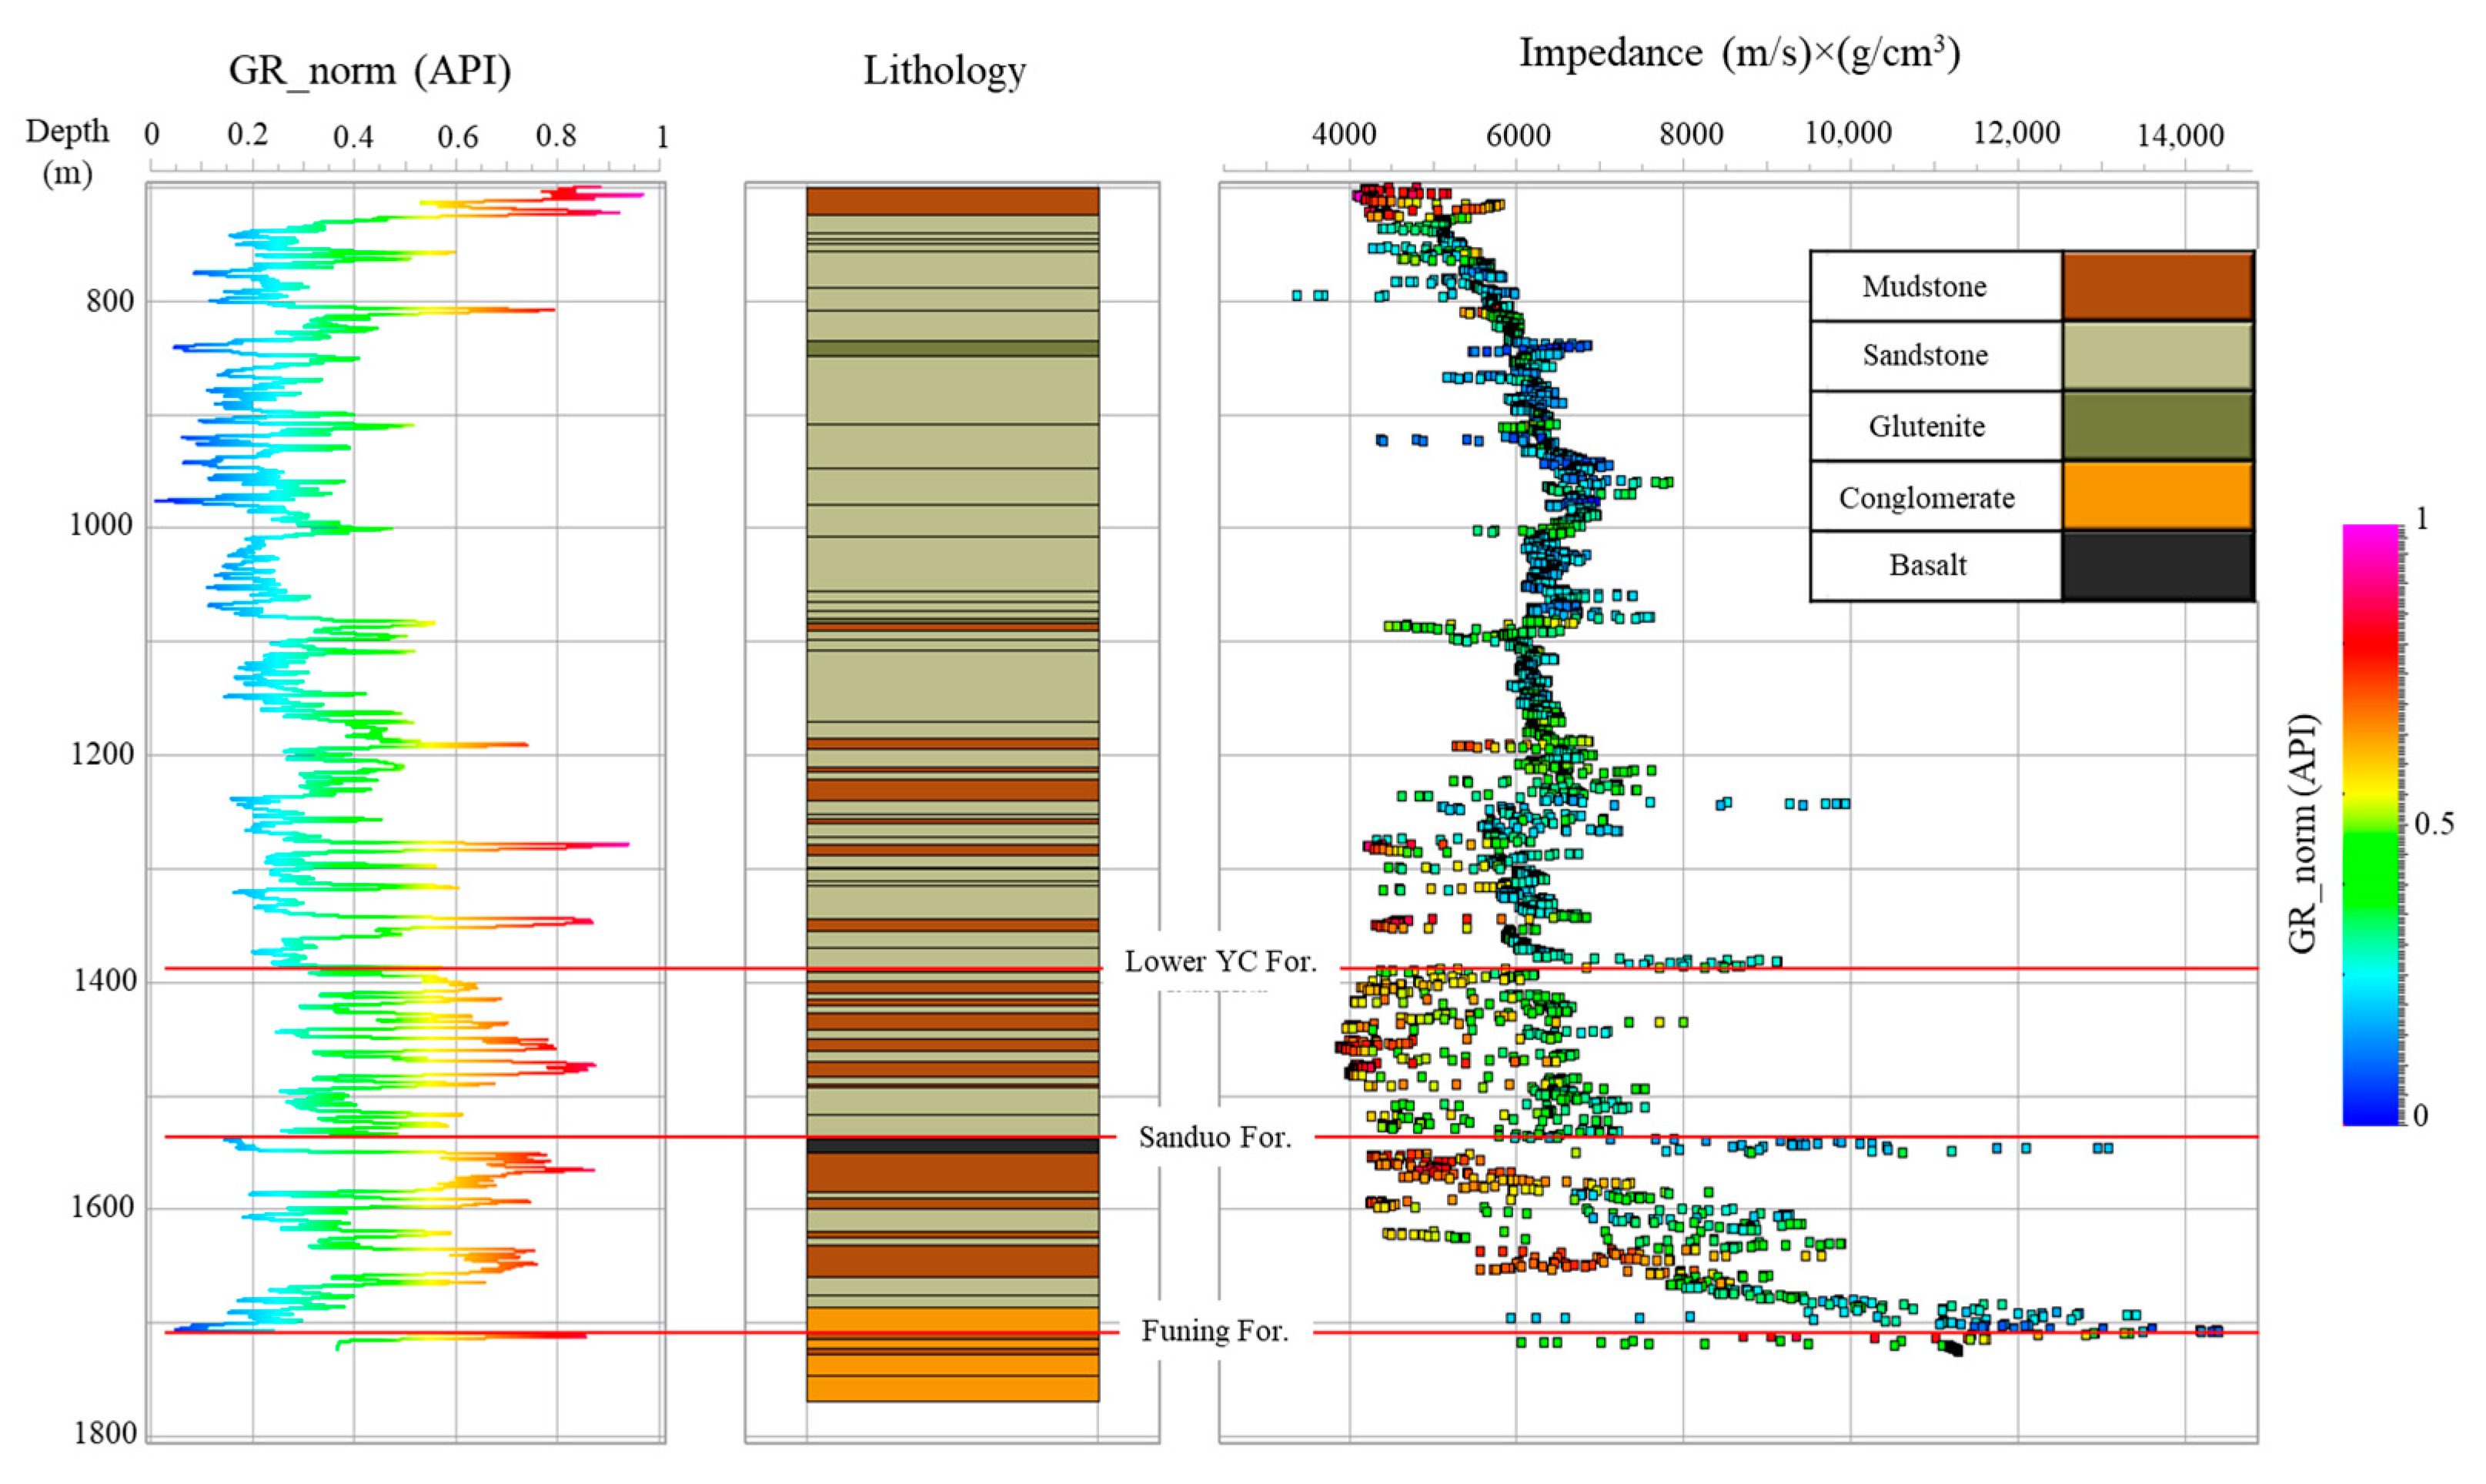
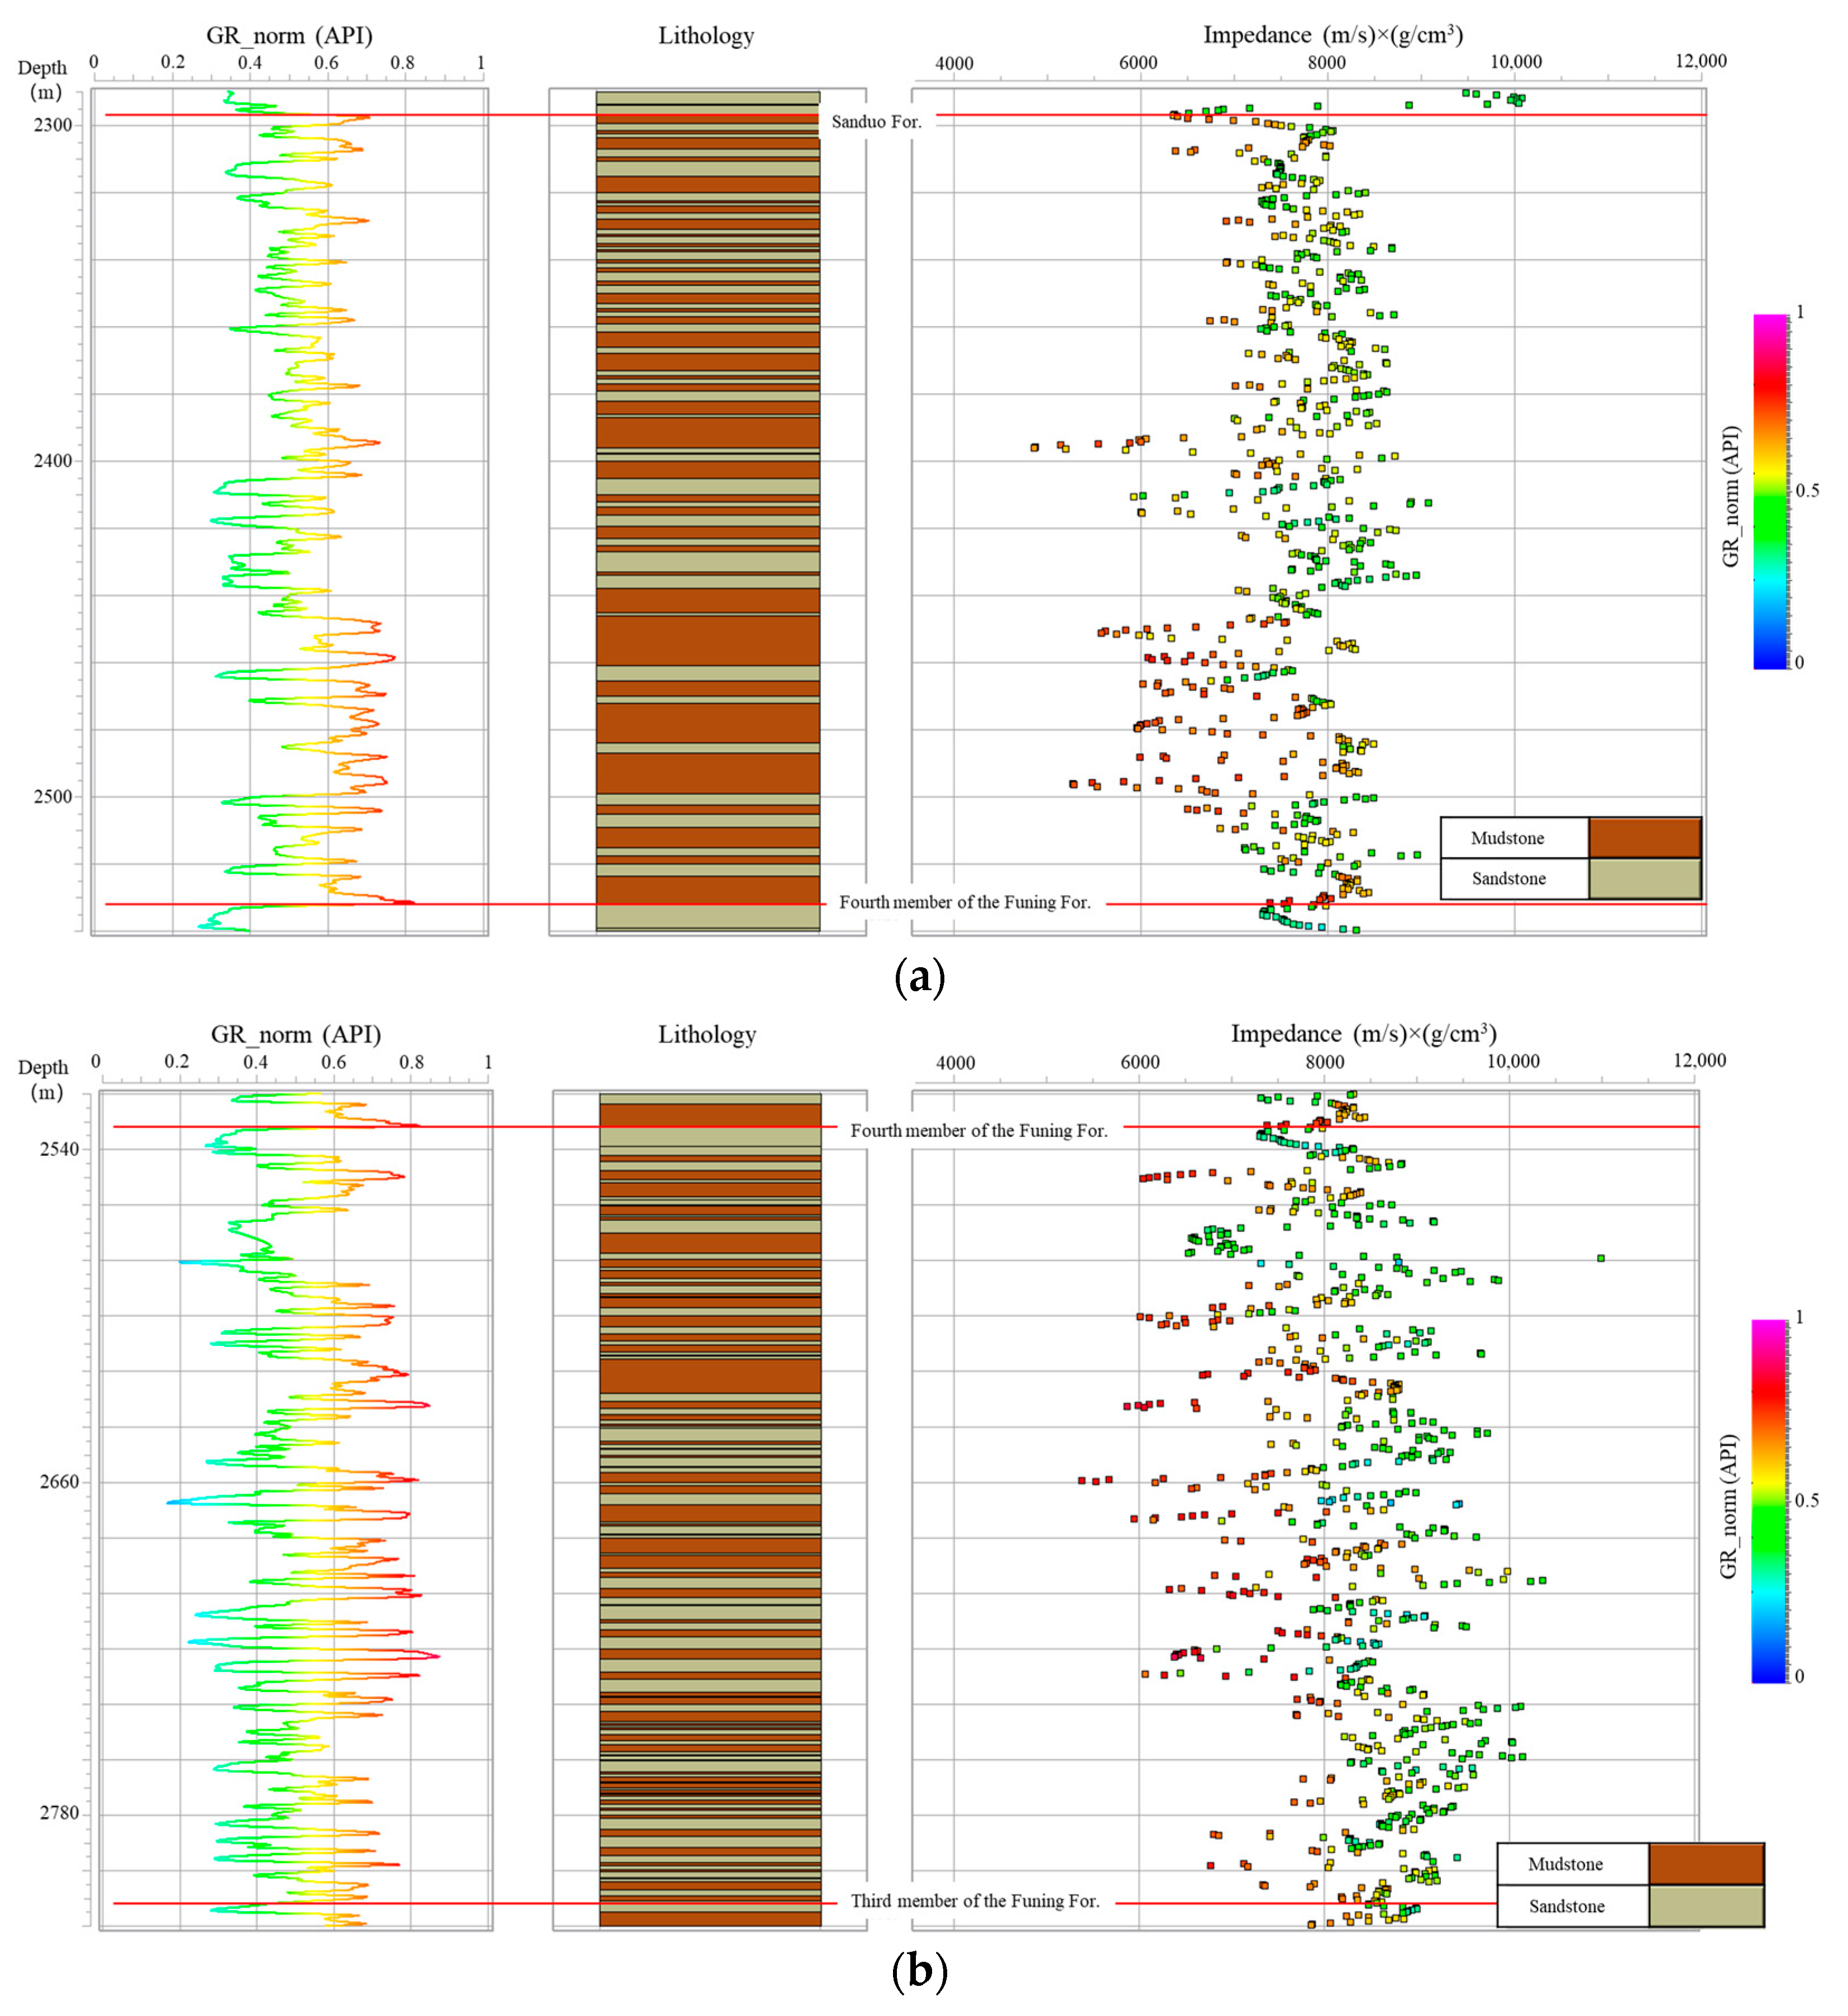
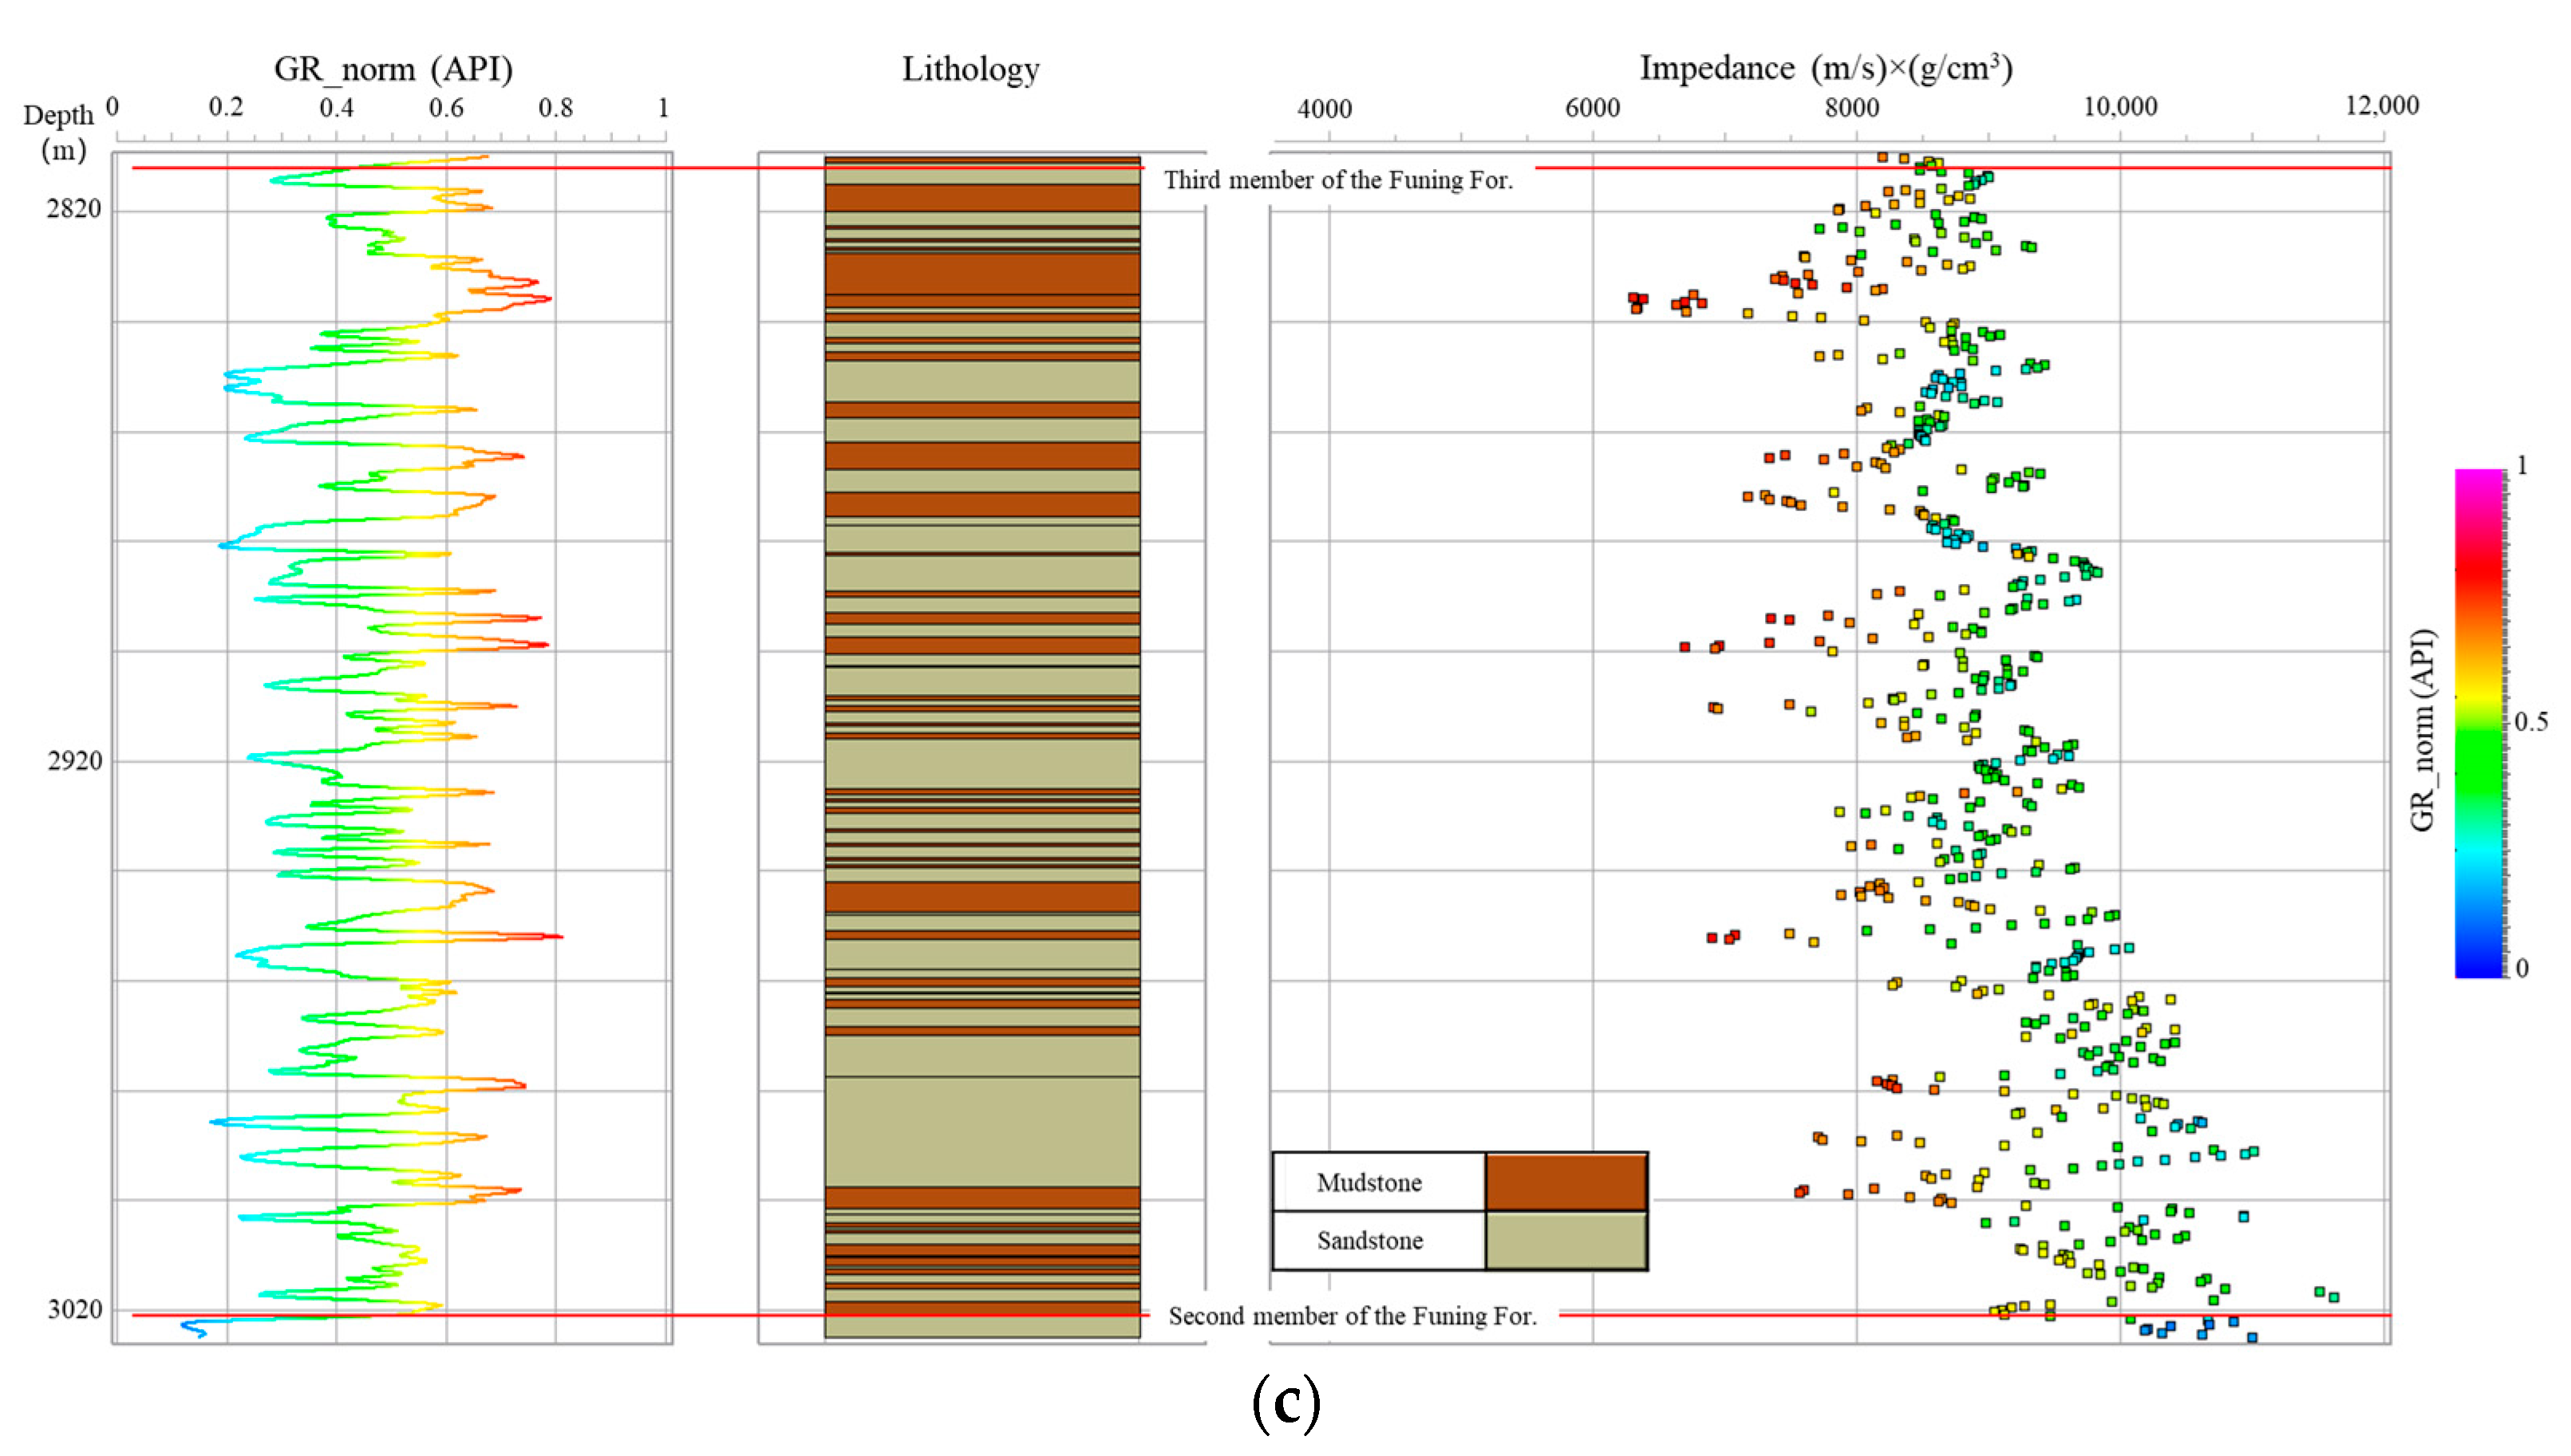
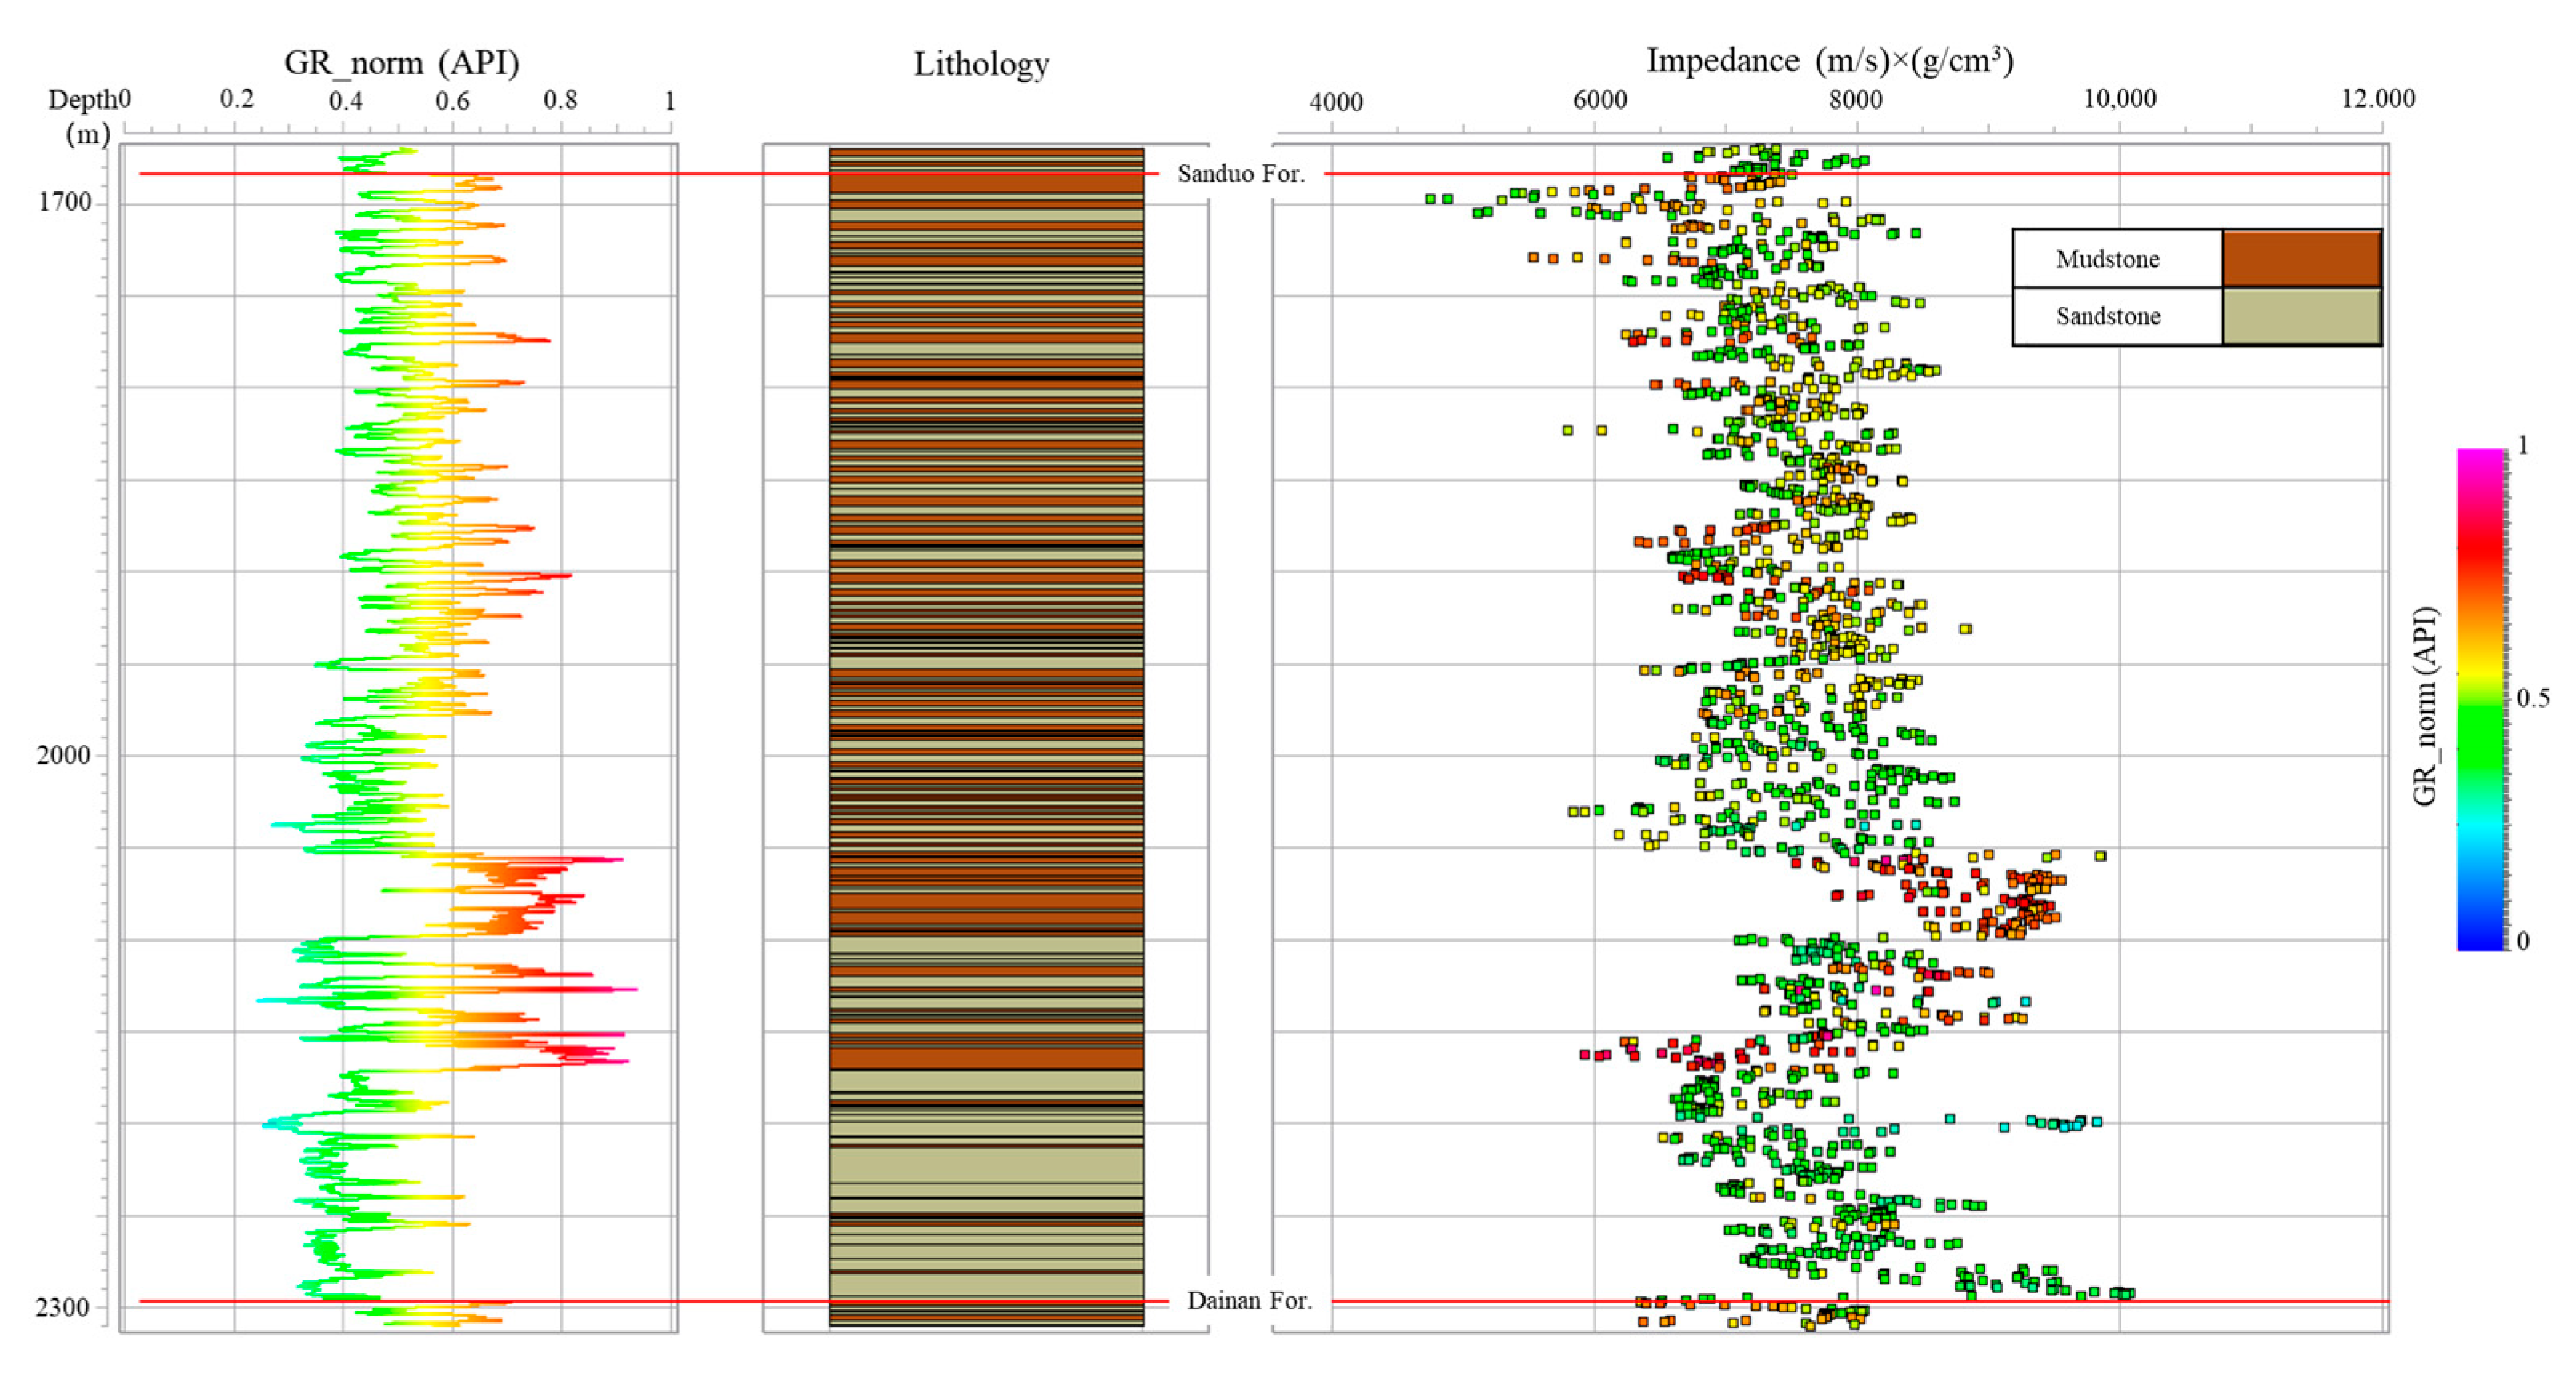
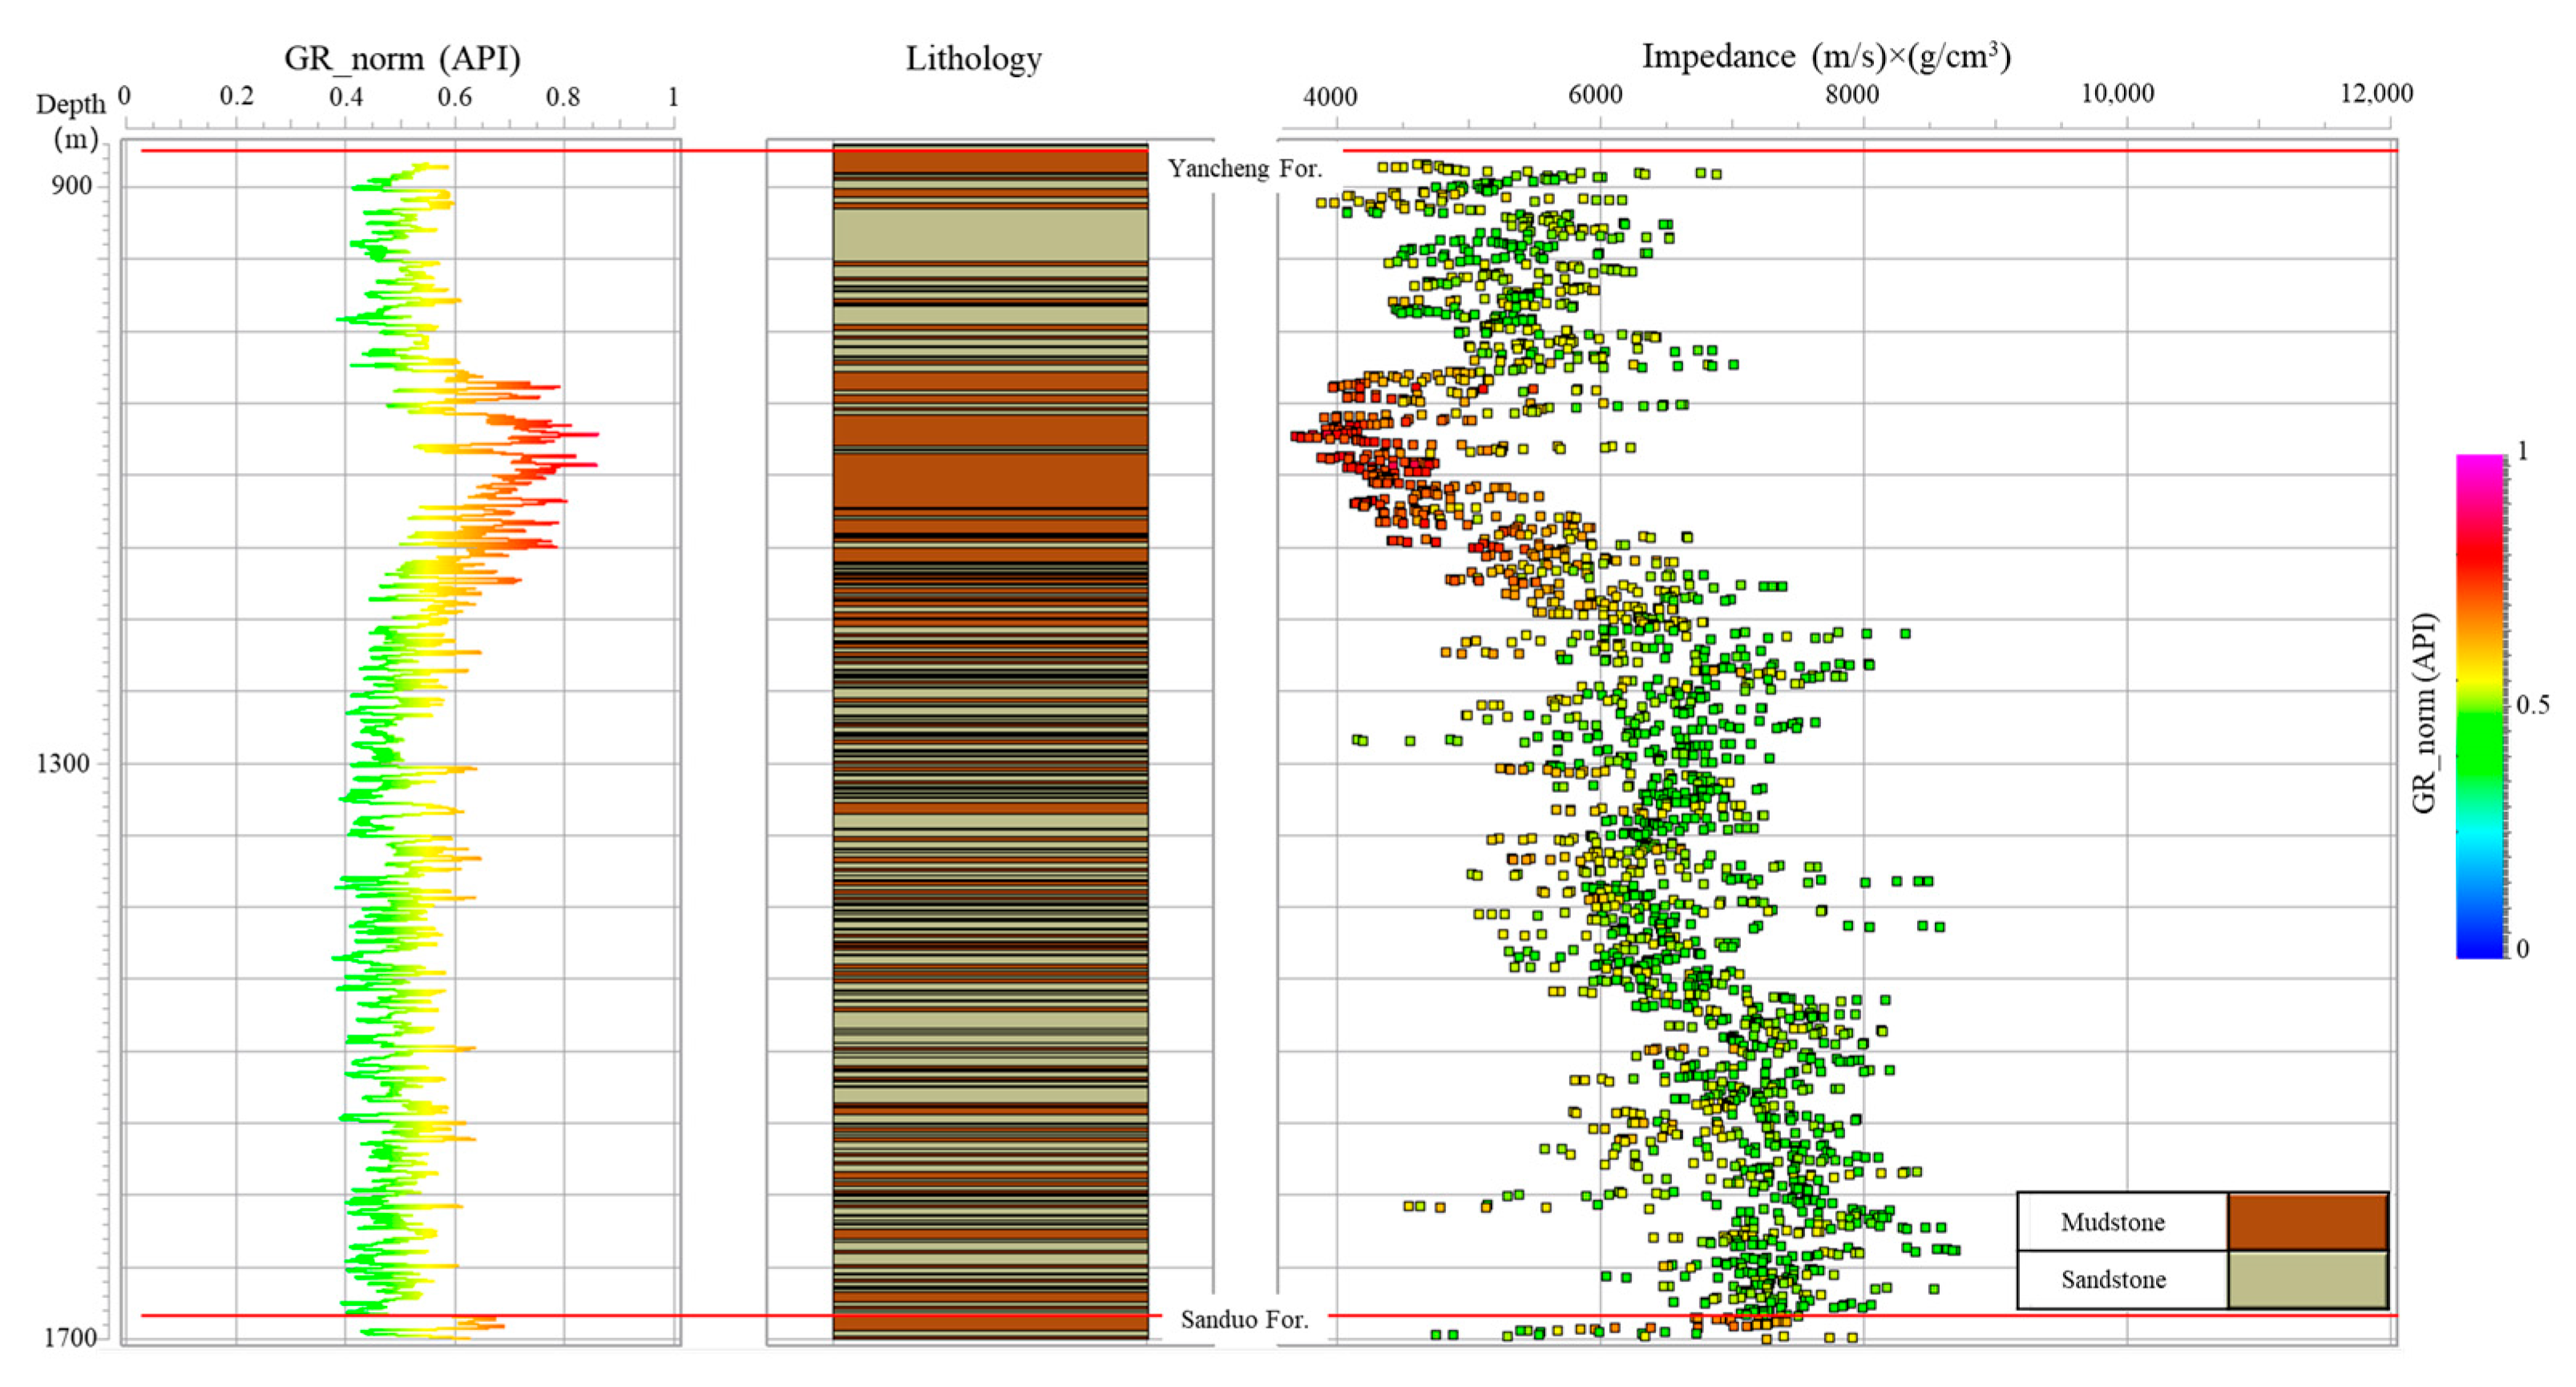
4.2.2. Petrophysical Characteristics of the Potential Sandstone Reservoirs
4.2.3. Sandstone as Potential CO2 Storage Reservoirs Derived from Seismic Inversion
4.2.4. Cenozoic Reservoir Characteristics
5. Discussion
5.1. Analysis of the Genesis of Multi-Type Structural Traps
5.2. Significance of Structural Traps for Geological Storage of CO2
5.3. Analysis of the Reservoir–Caprock Combination
6. Conclusions
Author Contributions
Funding
Institutional Review Board Statement
Informed Consent Statement
Data Availability Statement
Conflicts of Interest
References
- Bredesen, K. Assessing rock physics and seismic characteristics of the Gassum Formation in the Stenlille aquifer gas storage—A reservoir analog for the Havnsø CO2 storage prospect, Denmark. Int. J. Greenh. Gas Control. 2022, 114, 103583. [Google Scholar] [CrossRef]
- Delanoë, P.; Tchuente, D.; Colin, G. Method and evaluations of the effective gain of artificial intelligence models for reducing CO2 emissions. J. Environ. Manag. 2023, 331, 117261. [Google Scholar] [CrossRef] [PubMed]
- Saidi, K.; Omri, A. Reducing CO2 emissions in OECD countries: Do renewable and nuclear energy matter? Prog. Nucl. Energy 2020, 126, 103425. [Google Scholar] [CrossRef]
- Um, E.S.; Alumbaugh, D.; Commer, M.; Feng, S.; Gasperikova, E.; Li, Y.; Lin, Y.; Samarasinghe, S. Deep learning multiphysics network for imaging CO2 saturation and estimating uncertainty in geological carbon storage. Geophys. Prospect. 2024, 72, 183–198. [Google Scholar] [CrossRef]
- Lauk, C.; Kaufmann, L.; Theurl, M.C.; Wittmann, F.; Eder, M.; Hrtenhuber, S.; Freyer, B.; Krausmann, F. Demand side options to reduce greenhouse gas emissions and the land footprint of urban food systems: A scenario analysis for the City of Vienna. J. Clean. Prod. 2022, 359, 132064. [Google Scholar] [CrossRef]
- Zhang, Y.; Smith, S.J.; Bowden, J.H.; Adelman, Z.; West, J.J. Co-benefits of global, domestic, and sectoral greenhouse gas mitigation for US air quality and human health in 2050. Environ. Res. Lett. 2017, 12, 114033. [Google Scholar] [CrossRef]
- Chen, L.; Msigwa, G.; Yang, M.; Osman, A.I. Strategies to achieve a carbon neutral society: A review. Environ. Chem. Lett. 2022, 20, 2277–2310. [Google Scholar] [CrossRef]
- Zhao, X.; Ma, X.; Chen, B.; Shang, Y.; Song, M. Challenges toward carbon neutrality in China: Strategies and countermeasures. Resour. Conserv. Recycl. 2022, 176, 105959. [Google Scholar] [CrossRef]
- Liu, Z.; Gao, M.; Zhang, X.; Liang, Y.; Guo, Y.; Liu, W.; Bao, J. CCUS and CO2 injection field application in abroad and China: Status and progress. Geoenergy Sci. Eng. 2023, 229, 212011. [Google Scholar] [CrossRef]
- Nath, F.; Mahmood, M.N.; Yousuf, N. Recent advances in CCUS: A critical review on technologies, regulatory aspects and economics. Geoenergy Sci. Eng. 2024, 238, 212726. [Google Scholar] [CrossRef]
- Luo, J.; Xie, Y.; Hou, M.Z.; Xiong, Y.; Wu, X.; Lüddeke, C.T.; Huang, L. Advances in subsea carbon dioxide utilization and storage. Energy Rev. 2023, 2, 100016. [Google Scholar] [CrossRef]
- Durucan, S.; Shi, J.-Q.; Sinayuc, C.; Korre, A. In Salah CO2 storage JIP: Carbon dioxide plume extension around KB-502 well–New insights into reservoir behaviour at the In Salah storage site. Energy Procedia 2011, 4, 3379–3385. [Google Scholar] [CrossRef]
- Martens, S.; Kempka, T.; Liebscher, A.; Lüth, S.; Mller, F. Europe’s longest-operating on-shore CO2 storage site at Ketzin, Germany: A progress report after three years of injection. Environ. Earth Sci. 2012, 67, 323–334. [Google Scholar] [CrossRef]
- Furre, A.-K.; Eiken, O.; Alnes, H.; Vevatne, J.N.; Kiær, A.F. 20 Years of Monitoring CO2-injection at Sleipner. Energy Procedia 2017, 114, 3916–3926. [Google Scholar] [CrossRef]
- Sawada, Y.; Tanaka, J.; Suzuki, C.; Tanase, D.; Tanaka, Y. Tomakomai CCS Demonstration Project of Japan, CO2 Injection in Progress. Energy Procedia 2018, 154, 3–8. [Google Scholar] [CrossRef]
- Van der Meer, B.L.; Arts, R.J.; Geel, C.R.; Hofstee, C.; Winthaegen, P.; Hartman, J.; D’hoore, D. K12-B: Carbon Dioxide Injection in a Nearly Depleted Gas Field Offshore the Netherlands. In Proceedings of the 71st EAGE Conference & Exhibition, Amsterdam, The Netherlands, 8–11 June 2009. [Google Scholar]
- Stevens, S.H.; Kuuskraa, V.A.; Gale, J.; Beecy, D. CO2 Injection and Sequestration in Depleted Oil and Gas Fields and Deep Coal Seams: Worldwide Potential and Costs. Environ. Geosci. 2001, 8, 200–209. [Google Scholar] [CrossRef]
- Wang, Y.; Morozov, I.B. Time-lapse acoustic impedance variations during CO2 injection in Weyburn oilfield, Canada. Geophysics 2019, 85, M1–M13. [Google Scholar] [CrossRef]
- Guan, Y.; Shan, Y.; Huang, Q.; Chen, H.; Wang, D.; Hubacek, K. Assessment to China’s Recent Emission Pattern Shifts. Earth’s Future 2021, 9, e2021EF002241. [Google Scholar] [CrossRef]
- Shan, Y.; Huang, Q.; Guan, D.; Hubacek, K. China CO2 emission accounts 2016–2017. Sci. Data 2020, 7, 54. [Google Scholar] [CrossRef]
- Yuan, Y.; Wang, J.; Chen, J.; Cao, K.; Liang, J.; Lan, T.; Lu, D.; Guo, X. Carbon Dioxide Storage Potential of Cenozoic Saline Aquifers in the South Yellow Sea Basin. Energies 2023, 16, 1578. [Google Scholar] [CrossRef]
- Osmond, J.L.; Mulrooney, M.J.; Holden, N.; Skurtveit, E.; Faleide, J.I.; Braathen, A. Structural traps and seals for expanding CO2 storage in the northern Horda Platform, North Sea. AAPG Bull. 2021, 106, 1711–1752. [Google Scholar] [CrossRef]
- Chen, J.; Lei, B.; Liang, J.; Zhang, Y.; Wu, S.; Shi, J.; Wang, J.; Yuan, Y.; Zhang, Y.; Li, G. New progress of petroleum resources survey in South Yellow Sea basin. Mar. Geol. Quat. Geol. 2018, 38, 1–23. [Google Scholar] [CrossRef]
- Zhang, P.; Huang, H.-H.M.; Hong, Y.; Tian, S.Y.; Liu, J.; Lee, Y.I.; Chen, J.; Liang, J.; Wang, H.; Yasuhara, M. Southward Migration of Arctic Ocean Species During the Last Glacial Period. Geophys. Res. Lett. 2022, 49, e2022GL100818. [Google Scholar] [CrossRef]
- Fu, Y.; Yan, B.; Liang, J. Influence of basement high and detachment on the kinematics of a fold-and-thrust belt in the central South Yellow Sea Basin, China: Insights from analog modeling. Mar. Pet. Geol. 2024, 160, 106648. [Google Scholar] [CrossRef]
- Chen, J.; Liang, J.; Zhang, Y.; Yang, C.; Yuan, Y.; Ming, X.U.; Jianqiang, W.; Baohua, L.; Gan, L.I.; Yanqiu, Y. Regional evaluation of oil and gas resources in offshore China and exploration of marine Paleo-Mesozoic oil and gas in the Yellow Sea and East China Sea. Mar. Geol. Quat. Geol. 2019, 39, 1–29. [Google Scholar] [CrossRef]
- Yuan, Y.; Chen, J.; Liang, J.; Xu, M.; Lei, B.; Zhang, Y.; Cheng, Q.; Wang, J. Hydrocarbon Geological Conditions and Exploration Potential of Mesozoic–Paleozoic Marine Strata in the South Yellow Sea Basin. J. Ocean. Univ. China 2019, 18, 1329–1343. [Google Scholar] [CrossRef]
- Qu, X. Sedimentary Characteristics and Oil and Gas Prospect for the Mesozoic and Cenozoic in Northern South Yellow Sea Basin; Jilin University: Changchun, China, 2004. [Google Scholar]
- Wu, S. A Systematic Study of the Chinese Petroliferous Basins. Acta Pet. Sin. 1993, 14, 20–34. [Google Scholar] [CrossRef]
- Li, X.; Liu, S.; Wang, L. Spatiotemporal Pattern of Earthquake Activities and Seismotectonics in Jiangsu and Adjacent Southern Yellow Sea Area. Geol. J. China Univ. 2018, 24, 551. [Google Scholar]
- Li, X.; Wei, N.; Liu, Y.; Fang, Z.; Dahowski, R.T.; Davidson, C.L. CO2 Point Emission and Geological Storage Capacity in China. Energy Procedia 2009, 1, 2793–2800. [Google Scholar] [CrossRef]
- Huo, C. Study on the Potential Evaluation and the Storage Areas of the Carbon Dioxide Seabed Storage in Offshore China; Dalian Maritime University: Dalian, China, 2014. [Google Scholar]
- Gardner, G.H.F.; Gardner, L.W.; Gregory, A.R. Formation velocity and density; the diagnostic basics for stratigraphic traps. Geophysics 1974, 39, 770–780. [Google Scholar] [CrossRef]
- Asquith, G.B.; Krygowski, D. Basic Well Log Analysis; American Association of Petroleum Geologists: Tulsa, OK, USA, 2004; Volume 16. [Google Scholar]
- Lancaster, S.; Whitcombe, D. Fast-track ‘coloured’ inversion. In SEG Technical Program Expanded Abstracts 2000; SEG: Houston, TX, USA, 2020; pp. 1572–1575. [Google Scholar]
- Zweigel, P.; Hamborg, M.; Arts, A.E. Prediction of migration of CO2 injected into an underground depository: Reservoir geology and migration modelling in the Sleipner case (North Sea). In Greenhouse Gas Control Technologies: Proceedings of the 5th International Conference on Greenhouse Gas Control Technologies; CSIRO Publishing: Clayton, Australia, 2000. [Google Scholar]
- Audigane, P.; Lions, J.; Gaus, I.; Robelin, C.; Durst, P.; Van der Meer, B.; Geel, K.; Oldenburg, C.M.; Xu, T. Geochemical modeling of CO2 injection into a methane gas reservoir at the K12-B field, North Sea. In Carbon Dioxide Sequestration in Geological Media—State of the Science; American Association of Petroleum Geologists: Tulsa, OK, USA, 2009. [Google Scholar]


Disclaimer/Publisher’s Note: The statements, opinions and data contained in all publications are solely those of the individual author(s) and contributor(s) and not of MDPI and/or the editor(s). MDPI and/or the editor(s) disclaim responsibility for any injury to people or property resulting from any ideas, methods, instructions or products referred to in the content. |
© 2024 by the authors. Licensee MDPI, Basel, Switzerland. This article is an open access article distributed under the terms and conditions of the Creative Commons Attribution (CC BY) license (https://creativecommons.org/licenses/by/4.0/).
Share and Cite
Luo, D.; Yuan, Y.; Chen, J.; Li, Q.; Liang, J.; Zhao, H. Structural and Reservoir Characteristics of Potential Carbon Dioxide Storage Sites in the Northern South Yellow Sea Basin, Offshore Eastern China. J. Mar. Sci. Eng. 2024, 12, 1733. https://doi.org/10.3390/jmse12101733
Luo D, Yuan Y, Chen J, Li Q, Liang J, Zhao H. Structural and Reservoir Characteristics of Potential Carbon Dioxide Storage Sites in the Northern South Yellow Sea Basin, Offshore Eastern China. Journal of Marine Science and Engineering. 2024; 12(10):1733. https://doi.org/10.3390/jmse12101733
Chicago/Turabian StyleLuo, Di, Yong Yuan, Jianwen Chen, Qing Li, Jie Liang, and Hualin Zhao. 2024. "Structural and Reservoir Characteristics of Potential Carbon Dioxide Storage Sites in the Northern South Yellow Sea Basin, Offshore Eastern China" Journal of Marine Science and Engineering 12, no. 10: 1733. https://doi.org/10.3390/jmse12101733
APA StyleLuo, D., Yuan, Y., Chen, J., Li, Q., Liang, J., & Zhao, H. (2024). Structural and Reservoir Characteristics of Potential Carbon Dioxide Storage Sites in the Northern South Yellow Sea Basin, Offshore Eastern China. Journal of Marine Science and Engineering, 12(10), 1733. https://doi.org/10.3390/jmse12101733