Article

Numerical Evaluation of Wave Dissipation on a Breakwater Slope Covered by Precast Blocks with Different Geometrical Characteristics

1
Research Center for Coastal Structures, School of Ocean Engineering, Harbin Institute of Technology, Weihai 264209, China
2
Jiangxi Academy of Water Science and Engineering, Nanchang 330029, China
3
School of Civil Engineering, Yantai University, Yantai 264005, China
*
Author to whom correspondence should be addressed.
J. Mar. Sci. Eng. 2024, 12(10), 1735; https://doi.org/10.3390/jmse12101735
Submission received: 18 August 2024 / Revised: 23 September 2024 / Accepted: 29 September 2024 / Published: 2 October 2024
(This article belongs to the Special Issue Advanced Studies in Breakwaters and Coastal Protection)

Abstract

:
Slopes suffer damage from waves in coastal environments. Precast blocks with well-designed geometrical characteristics can benefit the construction of revetments by mitigating the issue of wave overtopping and dissipating wave energy. In this study, we numerically studied the effect of the geometrical characteristics of precast blocks on wave overtopping by carrying out a numerical simulation of wave overtopping on a slope covered with precast blocks. A total of three different types of blocks were considered in this study to determine the optimal geometric shape using a validated numerical model. Our numerical investigation demonstrated that the roughness of the precast block plays an important role in lessening the height of the wave run-up. Concave and embedded regular hexagons could reduce the wave run-up height by 44.6% compared with smooth slopes within a 2 s wave period. Herein, we evaluate and discuss the influence of the geometrical characteristics of a given precast block, such as thickness, aperture, and wave dissipation notch, on wave run-up. We also present an empirical formula for predicting wave run-up on a slope covered by a concave and embedded regular hexagon-type prefabricated block. This study provides valuable insights into the design of prefabricated revetment blocks.

1. Introduction

With rising sea levels, waterways and their neighboring infrastructure face a heightened risk of wave overtopping [1]. It is essential to protect the coast and the banks of inland waterways, such as rivers, canals, or lakes, from wave erosion [2,3]. Slope armoring is an economical and practical approach through which to defend the coast and banks from the damaging effects of wave action [4]. Relative to smooth slopes, precast block slopes effectively reduce wave overtopping due to their different geometrical characteristics, which act as rough elements. This roughness significantly enhances their ability to lessen the wave run-up height. The wave run-up height is an important parameter to consider within the engineering and design of bank protection facilities, as highlighted in [5]. Moreover, precast blocks can be manufactured on site, and their individual weights can be adjusted according to various design specifications [6]. These blocks also help to reduce costs, making them particularly suitable for special environments such as steep slopes [7,8]. Their modular nature further enables easier transportation and installation. It should be noted that the wave run-up on the slopes covered by prefabricated blocks is a complex fluid–structure interaction issue. Therefore, run-up on the exact shape of the block surface should be of concern in engineering practice [9].
When attempting to optimize existing designs, an in-depth physical and process-based understanding of how waves interact is highly beneficial [10]. The wave run-up process is crucial in designing the crest of seawalls, and the distribution of the wave run-up height is a valuable factor in planning elevated structures. The wave run-up height is also a useful metric through which we can assess how effectively waves are dissipated and is derived from numerical models simulating the interaction between waves and structures. This coefficient integrates the roughness of the precast blocks, reflecting the performance of different block shapes under the impact of waves. Roughness affects the fluid flow, while permeability describes the ability of a fluid to pass through the material. Therefore, the roughness permeability coefficient combines these two aspects to more accurately simulate the ability of precast blocks to protect land from waves.
Although some research has been conducted on the ability of slope structures to dissipate waves [11,12,13], there are few published articles on reducing the wave run-up through changing the shape of precast blocks [13]. Mainstream slope protection methods include vegetation and concrete precast blocks, with vegetation offering wave dissipation [14,15]. However, considering the local hydrological conditions and maintenance costs, precast concrete blocks present a more practical solution [16]. In this study, we used precast blocks due to their ease of construction and adaptability. Through physical experiments and numerical simulations of slopes made up of precast blocks, we were able to demonstrate that precast block slopes have a sufficient capacity to dissipate waves [17] while also being cost-effective in terms of production, transportation, installation, and maintenance [18,19]. Precast blocks are also suitable for various environments and offer longer lifespans with lower maintenance costs, partly due to their enhanced erosion resistance [18,20].
Precast blocks are usually designed with a regular rectangular shape to cover the banks of inland waterways—such as rivers, canals, and lakes—from erosional damage. [21,22,23]. Thanks to their cost-effectiveness and practicability, precast blocks are commonly used in China and other countries. However, the safety of various forms of bank protection built using precast blocks is significantly influenced by overtopping [24]. It is evident that the geometrical characteristics of precast blocks have a degree of influence on such overtopping [25]. To address this issue, we proposed three innovative slope protection structures and evaluated their ability to dissipate waves in regular conditions. These three types of precast blocks were concave and embedded regular hexagon-type prefabricated blocks, Z-type prefabricated concrete blocks, and embedded quadrangle-type prefabricated hollow blocks, referred to hereafter as B1, B2, and B3, respectively.
In this research, both physical experiments and numerical simulations were integrated to advance coastal engineering practices by evaluating the performance of three specially shaped precast block designs as sloping surfaces for embankments. The novelty of this study is reflected in two main aspects. First, the wave run-up reduction efficiency of these block shapes, which had previously been overlooked as they were traditionally applied for ornamental purposes in China’s inland lakes, was systematically assessed. Second, through the optimization of the precast block designs based on their wave dissipation effectiveness, adjustments were made to various shape parameters including aperture, thickness, and wave sill size to determine the most suitable configuration. This research contributes to identifying the most effective design and improving wave dissipation performance in embankment construction [26]. However, it is important to note that in shallow or intermediate waters, it is common practice to use spectral waves in the form of irregular wave trains. This represents a limitation of the current study, which primarily focused on regular waves. Future research should include spectral waves to provide a more comprehensive analysis of wave interactions and their effects on coastal structures.
The innovation of this study lies in its integration of numerical simulations and physical experiments to derive an empirical formula through which we can predict the wave run-up on different slope designs. This approach enhances the accuracy of such predictions and provides a reliable tool for coastal engineers. Furthermore, the derived formula can be applied in future projects to predict the wave run-up more accurately, thereby contributing to the safety and durability of coastal infrastructure. This combination of numerical and experimental methods also indicates potential opportunities for further research in coastal engineering, particularly as it relates to the interactions between different wave types and slope designs. The rest of this paper is organized as follows.
Section 2 presents our methodology, detailing the physical model testing and a comparison between numerical and experimental results. The numerical setup is also described including the mesh design, initial conditions, wave generation, and turbulence modeling. Section 3 focuses on the validation of the model, featuring discussions on mesh convergence and validation of the numerical model using free surface elevation and cross-sectional water surface profile data. Section 4 presents the model results, and finally, Section 5 concludes the paper with key findings and potential future research directions.

2. Numerical Methodology

2.1. Numerical Setup

ANSYS FLUENT 2021, a widely used CFD software, employs the finite volume method to solve fluid flow problems. In the process of analysis, variables are laid out on a structured or unstructured grid to effectively capture complex flow dynamics. The solver ensures the accurate conservation of mass, momentum, and energy across the control volumes, providing reliable simulation results. In this study, we employed numerical simulation to not only validate but also enhance the accuracy of the computational process by replicating real-world conditions. Specifically, the numerical result represented the performance of several prefabricated wave protection blocks in terms of their efficiency in both slope protection and wave energy dissipation in conditions similar to those encountered in real coastal environments. Navier–Stokes equations were solved for the two-phase flow in this study, and the interface of water and air was captured using the volume of fluid (VOF) method.
In this study, turbulence was modeled using the stabilized RNG k-ε turbulence model. The initial turbulent kinetic energy (k) was set to 0.4 m2/s2, and the turbulent dissipation rate (ε) was set to 0.04 m2/s3, ensuring an accurate representation of the turbulent flow. These values were based on experimental data and were carefully calibrated to align with the observed turbulence levels.
A sensitivity analysis was conducted on the k factor and the dissipation rate (ε). The results indicated that varying the k value from 0.35 m2/s2 to 0.45 m2/s2 did not significantly alter the wave overtopping discharge, thus confirming the reliability of the initially selected values. Similarly, the ε parameter was varied between 0.035 m2/s3 and 0.045 m2/s3, and the dissipation rates remained consistent with our experimental observations. This sensitivity analysis confirmed that the chosen values of k and ε were within a stable and accurate range for this model. Based on these findings, the model was adjusted to ensure realistic turbulence levels.
In this study, we employed finite volume discretization to handle complex geometries and interfaces in fluid dynamics, allowing for a detailed analysis of flow separation, recirculation zones, and pressure gradients, all of which are critical in predicting wave overtopping and energy dissipation. This approach effectively manages irregular meshes while maintaining geometric precision. To ensure the accuracy of our model, various mesh densities and refinement techniques were utilized during mesh generation to accurately capture the behavior of waves. Specifically, non-uniform mesh refinement was applied to the water’s surface area in order to enhance the resolution of wave details, particularly near the wave crest and trough regions wherein steep gradients occur. Additional mesh refinement around the block’s surface ensured accurate predictions of boundary layer development and localized turbulence.

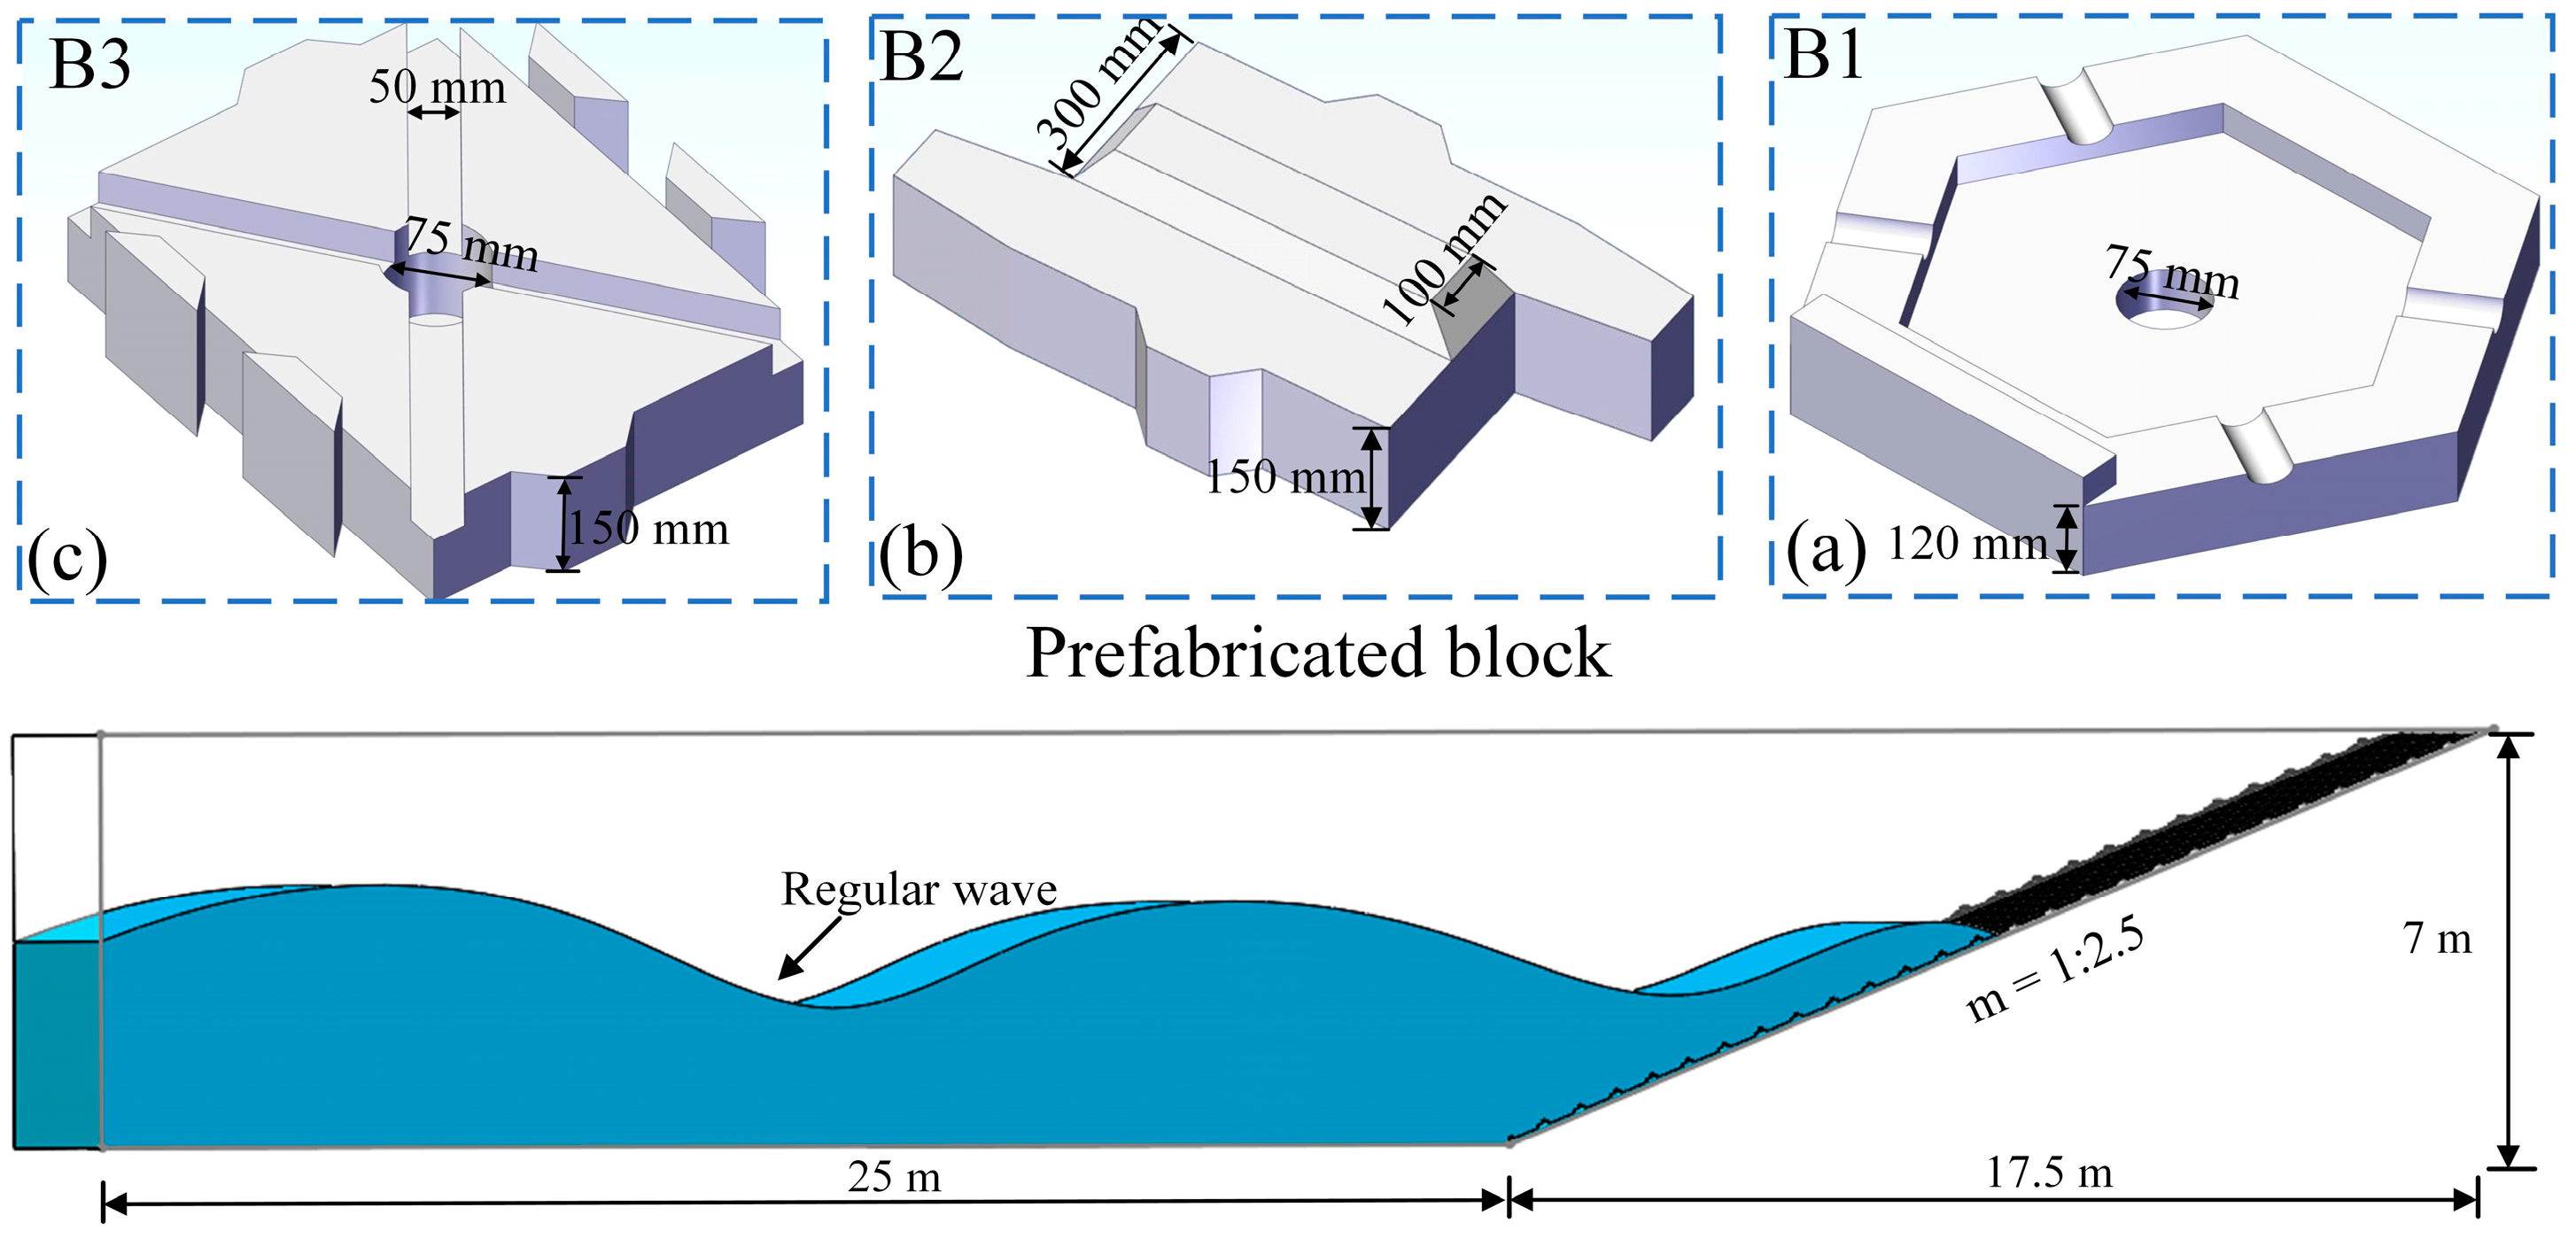
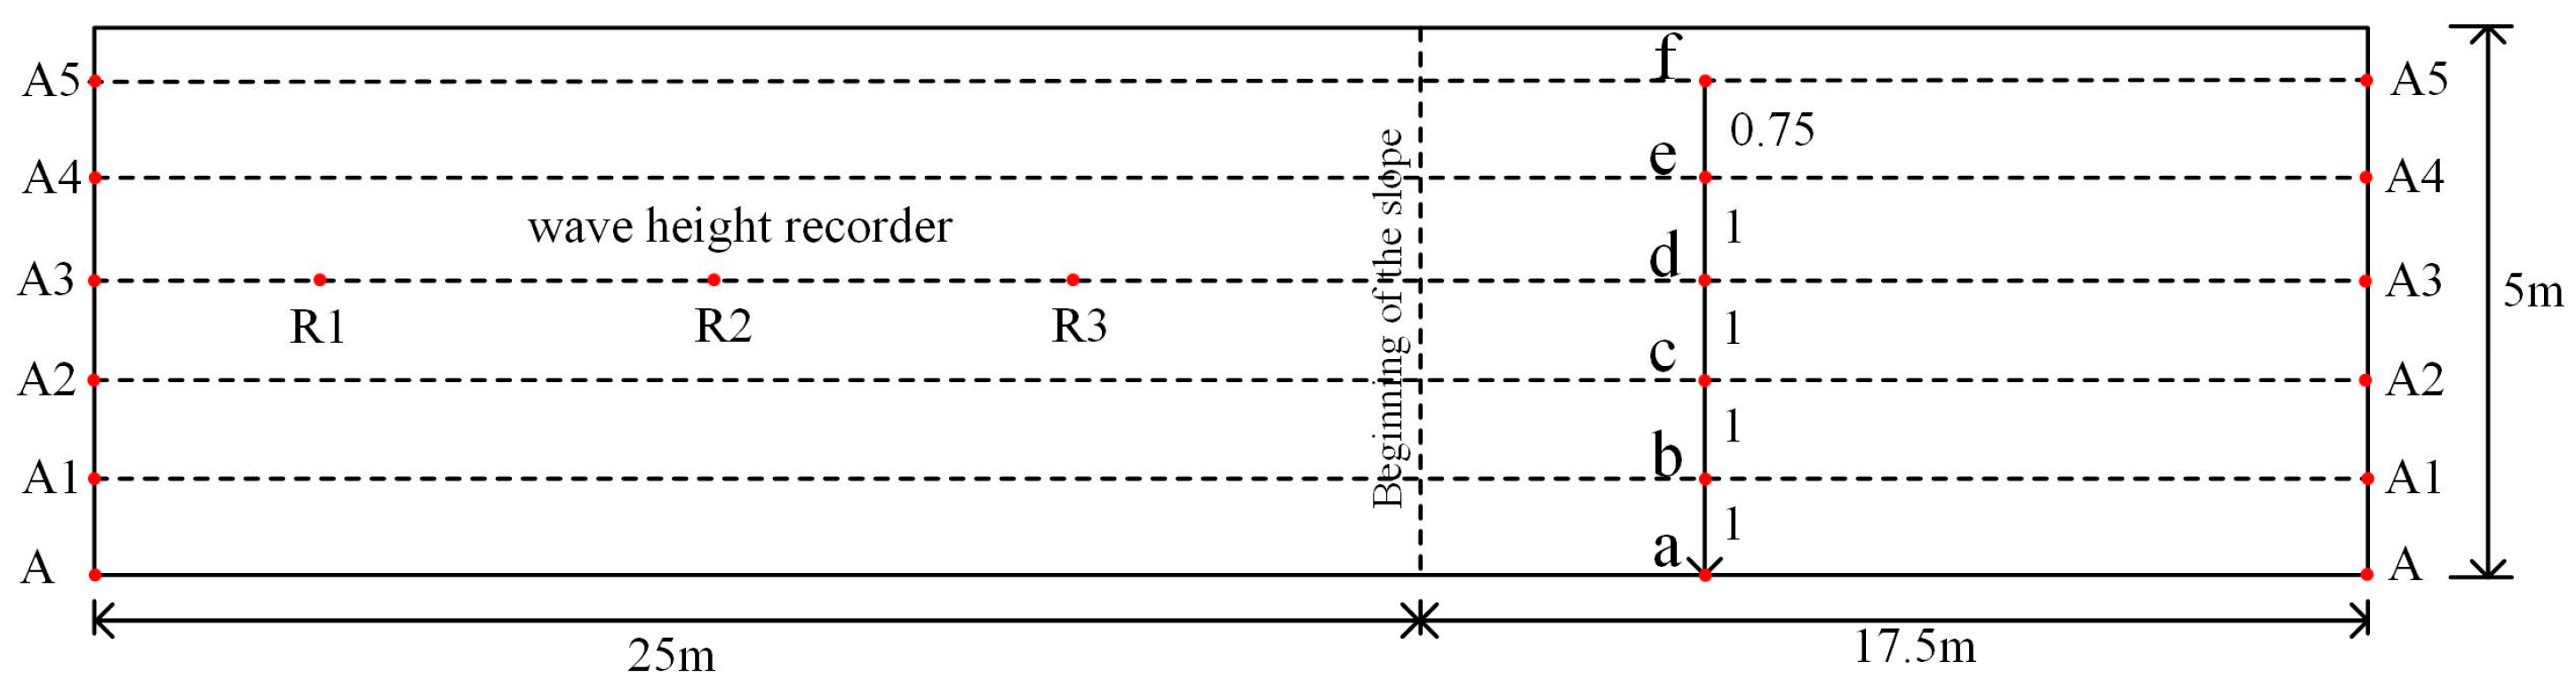
2.2. Numerical Wave Flume and Slope

Subsequently, four types of geometrically distinct precast blocks were imported into the software for analysis. The 3D numerical wave flume, as depicted in Figure 1, required boundary conditions that replicate realistic air–water interactions. In the numerical simulation, a total length of 42.5 m was established, of which the slope length was 17.5 m. Additionally, the wave height was 0.5 m at a water depth of 3 m. Constant pressure at the atmospheric boundary allowed for natural air inflow and outflow, while relaxation zones (sponge layers) were implemented at both the inlet and outlet boundaries to mitigate wave reflections and ensure an accurate representation of wave dissipation. A piston-type wave generator on the left side was used to create regular waves with specified heights and periods, thus mimicking typical inland or coastal conditions. Numerical damping within the sponge layers efficiently absorbed reflected waves, preventing interference in our downstream wave measurements. These configurations ensured accurate simulation of wave–block interactions, providing not only reliable but also realistic data for the analysis of prefabricated block performance under various wave conditions. It should be noted that the results of the wave run-up on the slope would be significantly influenced by the scale effect. Unfortunately, there is not a well-rounded method to analyze the scale effect quantitatively. A feasible method to avoid the effect of scale is using a large-scale model as much as possible [27]. In this study, a full-size prefabricated block was set up to investigate the wave run-up, which was influenced by scale effect limitedly.
For the four types of slopes, the numerical mesh was created with blockMesh and SnappyHexMesh in OpenFOAM 2021. The mesh from the inlet boundary to the toe of the dike was orthogonal and conformal, with a cell size of 0.02 m both in the X-direction (horizontal) and in the Z-direction (vertical). Overtopping discharge is closely related to wave run-up, and [28] suggested that quadrilateral grids parallel to the slope surface may improve the accuracy with which the wave run-up on a slope can be simulated. Thus, in this study, we utilized this type of mesh near the surface, as shown in Figure 2. The mesh around the protrusions was a refinement of the base mesh achieved using SnappyHexMesh with a refined grid cell size of 0.002 m in the direction perpendicular to the slope and 0.003 m in the direction parallel to the slope. The influence of the grid size around the protrusions was analyzed for the overtopping discharge, as presented in [29].
With a constant single refinement level, the grid around the free surface was refined using SnappyHexMesh. The aspect ratio of the computational cells in all simulations was kept close to 1, following the recommendation of [30] for simulating wave propagation and breaking.
The physical boundary conditions were configured as follows. Gravitational acceleration in the Z-direction was set to −9.81 m/s2. The horizontal boundary XMax was defined as a velocity inlet, and the boundary XMin was set as a wall boundary. The initial water level was set at 3 m, with a wave height of 0.5 m and a period of 2 s. The top boundary ZMax was configured with a pressure outlet boundary condition representing air, and the bottom boundary was set as a wall boundary. The vertical boundaries YMax and YMin were also set as wall boundaries.
Additionally, the wave characteristics in this setup were analyzed using several dimensionless parameters. The Ursell number was calculated to evaluate the nonlinearity of the waves, and the Irribaren number was used to assess the influence of the wave slope. For this configuration, the Ursell number was determined to be 2.16, indicating that the waves were linear in the present conditions. The Irribaren number was 1.49, which suggests a moderate probability of wave breaking.
As mentioned, a wave tank is needed for wave generation. Hence, the boundary conditions of the wave tank were as follows. The left-hand side of the tank was regarded as the velocity inlet. In the upper part, we applied atmospheric pressure. The right-hand side and bottom of the wave flume were considered wall boundaries, where no slip was enforced at the walls (i.e., the normal velocity component was set to zero). The river channel boundary conditions were set to open channel wave boundary conditions (open channel wave BC).
When scaling a real-life problem down to a numerical wave flume, the Froude number and Reynolds number are crucial parameters. In this study, the Froude number was found to equal 1.0, ensuring dynamic similarity between the model and real-life scenarios. The Reynolds number was 590,000, indicating turbulent flow. We validated the use of this configuration using these dimensionless numbers, proving that the model accurately represented the intended physical phenomena. In our simulations, the Courant number was kept below 0.5 to ensure the stability and accuracy of our numerical solution. This configuration allowed us to accurately capture the wave dynamics while preventing numerical instability.
The total simulation time was set to 20 s, with a time step size of 0.01 s, to ensure numerical stability and accuracy, resulting in a Courant number of 1.084. While this was slightly above the conventional threshold of 1, it was still acceptable in this context. However, the elevated Courant number indicates a potential limitation, which could affect the numerical stability and accuracy. Future work should consider refining the time step to enhance the simulation results. A wave generator was placed on the left side of the wave flume to match the target wave conditions, and a wave absorber was placed on the right side to prevent wave reflection from affecting the results. The standard k-ε turbulence model was selected for this study to accurately simulate the turbulent interactions between the waves and the prefabricated blocks. This model effectively captures the turbulent characteristics of fluid flow and is suitable for most engineering applications. The initial turbulent kinetic energy (k) was set to 0.4 m2/s2, and the turbulent dissipation rate (ε) was set to 0.04 m2/s3, ensuring accurate representation of the turbulent flow. To identify the height and extent of the wave run-up in the model, a wetting and drying algorithm was used within ANSYS FLUENT. This algorithm accurately tracked the movement of the water’s surface as it interacted with the structure. By monitoring changes in the free surface elevation over time, the maximum wave run-up height could be determined. The algorithm ensured that cells smoothly transitioned between wet and dry states, thereby indicating the dynamic interface between water and air and providing reliable data for subsequent analyses of wave run-up.

2.3. Wave Generation

ANSYS FLUENT, a widely used form of computational fluid dynamics (CFD) software for simulating fluid flow and wave dynamics, was employed to generate a consistent time series of regular waves in line with the experimental data. The accuracy of this software in modeling wave generation and propagation in coastal engineering applications has been validated [31]. In this study, we generated regular waves in the form of push plate waves in order to mirror the physical experiment. According to linear wave theory, also known as Airy wave theory, the free surface profile of the wave is given by Equation (1).
η = H 2 cos k x σ t
where H is the wave height from crest to trough [m], h is the average water depth [m], x is the distance along the longitudinal direction [m], and t is time [s]. Additionally, σ is the wave frequency [rad s−1], determined with Equation (2), and k is the wave number.
σ = g k tanh k h
In this study, we aimed to recreate a virtual environment that closely matched our experimental conditions. The generation of regular waves through linear wave theory can improve the utility of physical experiments. Moreover, FLUENT 2021 simulation operates in tandem with a structural analysis solver when evaluating the interaction between waves and any physical structures located within the domain. The results of the numerical simulations need to be verified by experimental results to ensure the accuracy of the former. It should be noted that the incident wave was simplified to a regular wave in this study to reduce the computing complexity, which means that studies with complex wave conditions are still lacking.

3. Convergence and Validation

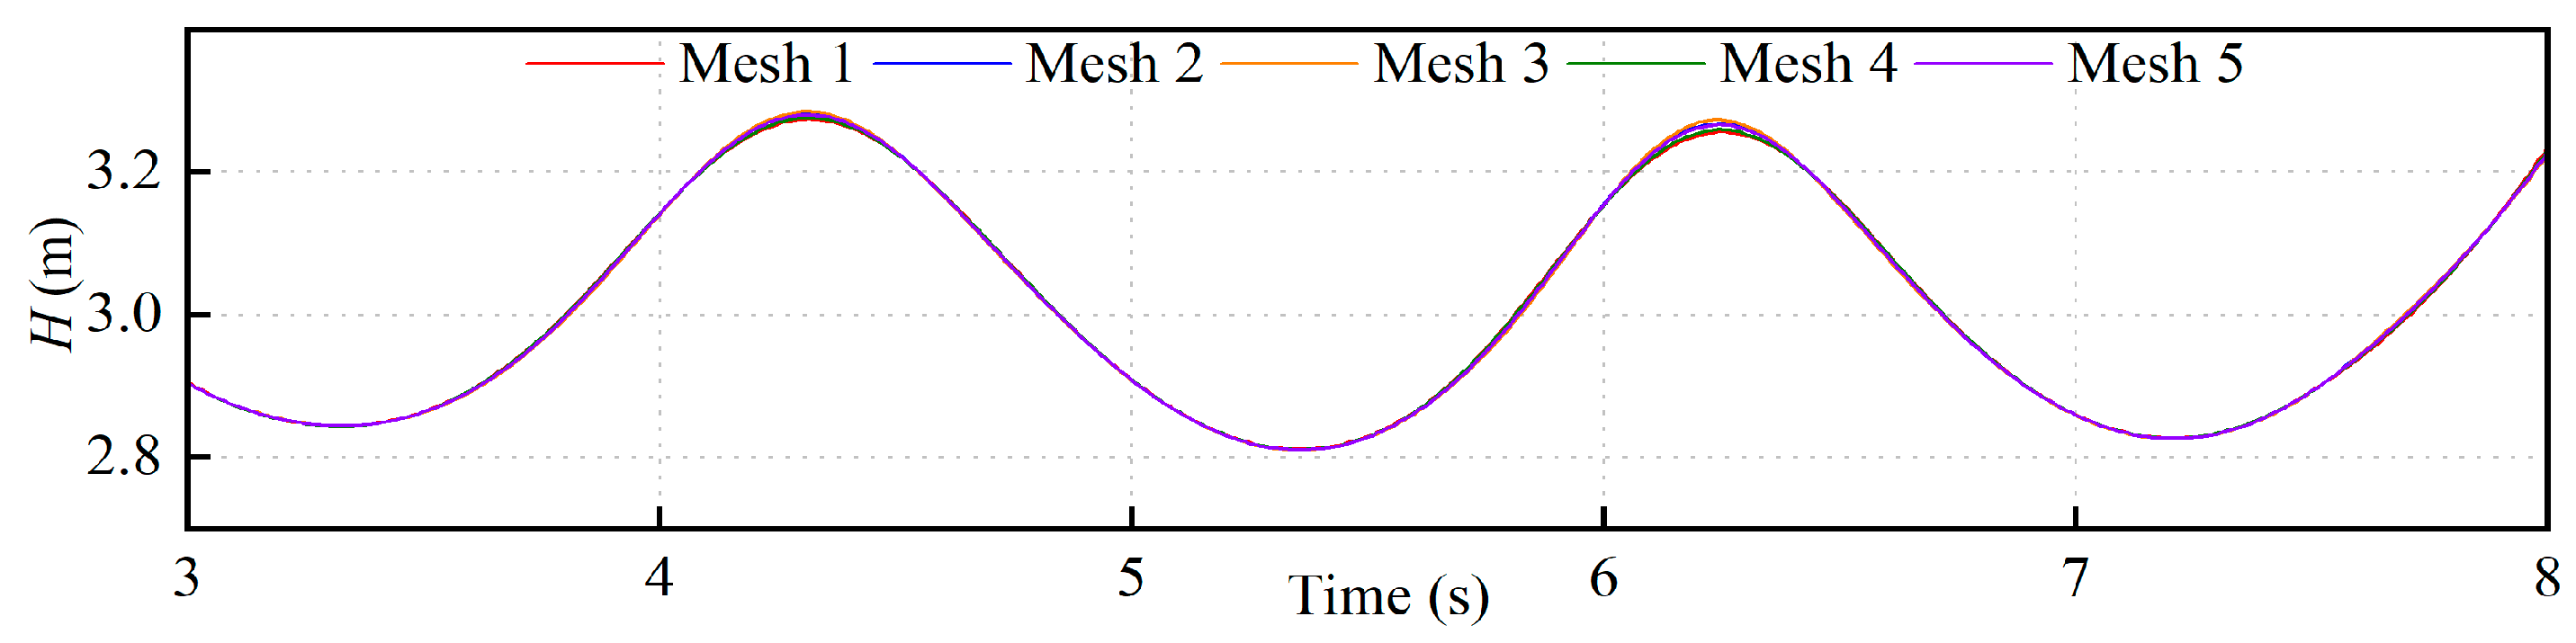
3.1. Convergence of Numerical Model

To simulate the effect of four types of wave protection precast blocks on wave run-up, our numerical simulation focused on B1 as a case study. Given the arbitrary fabrication of these physical models, B1 was simplified and designed as a three-dimensional geometric model. To simulate a realistic environment despite the limits imposed by physical conditions, we scaled up the model to fit a more realistic physical situation.
Mesh convergence tests for the prefabricated block slope B1 were performed with different mesh densities. The details of the mesh convergence test are presented in Table 1. Δx and Δz represent the minimum mesh size in the direction of wave propagation and the wave height, respectively [32].
The computational mesh was set up with a horizontal length of 42.5 m, ranging from XMin = 0 to XMax = 42.5 (a height of 7 m and a width of 4.75 m). To accurately capture the wave dynamics, a gradient mesh was employed within the water surface area. The mesh was scaled in four distinct zones: from the boundary at Z = 0 to Z = 2.5, the mesh height was 0.1 m; from Z = 2.5 to Z = 3.5, the mesh height remained at 0.05 m, with 100 divisions in the horizontal direction; and from Z = 3.5 to Z = 7, the mesh height was 0.2 m. Comparisons of the free surface elevation under the wavelength L are presented in Figure 3. The results showed that different mesh densities had a minimal effect on the wave height. To better present the details of the protection provided by prefabricated rough block slopes, we used the mesh number from Mesh 3 for the following numerical simulation.
Following the simulation, six horizontal points of contact between the water surface line and the embankment were selected at various moments: a (33.5, 0, 3), b (33.5, 1, 3), c (33.5, 2, 3), d (33.5, 3, 3), e (33.5, 4, 3), and f (33.5, 4.75, 3). The defined values in parentheses refer to x, y, and z in the spatial domain. We intend to study the variation over time in terms of hydrodynamic characteristics at these points. Additionally, we analyzed the hydrodynamic characteristics at different moments by selecting transverse sections A1-A1 and A2-A2 [33] alongside vertical section points. The wave height recorders R1, R2, and R3 were set for each wave segment to determine whether the waves dissipated in real-time. The specific distribution of the sections and points can be found in the accompanying Figure 4.

3.2. Validation

The results of an experimental wave were employed to validate the present numerical model. The experiment was conducted in the water flume located at Jiangxi Academy of Water Sciences, China, which measures 8 m in length, 0.4 m in width, and 0.5 m in height. Figure 5 shows a diagram of the experimental setup. Waves with two different wave periods and wave heights were generated in the wave flume using a flap-type wave generator. The wave generator was hinged with the bottom of the groove, and the rotation angle could be adjusted to generate waves of different heights. By adjusting the wavemaker, waves of different periods could be generated. The wave height was set to 0.05 m in the physical experiment.
The experiment involved two wave periods, 2.5 s and 1.875 s, at depths of 23.6 cm and 30.6 cm, respectively. To accurately evaluate the data, we designated three points on the cross-section. We observed the average maximum wave run-up height at these three points. Wave run-up on a given slope was determined via a combination of slope wave traces and photography. We extracted twenty cycles of wave run-up images from the captured video and then found concurrent wave run-up values on the cross-section of these three points.
Convergence analysis was carried out to show that numerical simulation could effectively reflect the results of the physical experiments. In this section, numerical simulations were carried out in the same conditions as the physical experiments. The wave generation and turbulence modeling methods were consistent with those in Section 2. During the numerical simulation, three points were set, and the wave run-up heights of B0, B1, B2, and B3 were selected. As mentioned earlier, the three chosen types of precast blocks were concave and embedded regular hexagon-type prefabricated blocks, Z-type prefabricated concrete blocks, and embedded quadrangle-type prefabricated hollow blocks, referred to as B1, B2, and B3, respectively. Table 2 shows an exact comparison of the numerical and experimental results. It is evident that at no point did the error exceed 5%. The boundary condition settings and turbulence model were therefore proven to be suitable for simulation. To address turbulence, the RNG k-ε model was selected for its ability to capture small-scale turbulence structures, which are critical in simulating the interactions between breaking waves and dike surfaces. This model accounts for microscale turbulence effects, providing a precise calculation of turbulent viscosity, particularly in high-shear regions.
Turbulence impacts flow velocity and the way in which we predict discharge from wave overtopping. Calibration of the model parameters, specifically the turbulent kinetic energy k and dissipation rate ε, thus ensured alignment with the experimental data, reducing potential errors in predictions of flow. The resulting error margin of less than 5% highlighted the model’s efficacy.
In addition to wave run-up heights, our analysis also included velocities and shear stresses, ensuring a comprehensive evaluation of the model’s performance. Comparison of the experimental and numerical velocity results indicated a high degree of correlation, with Pearson correlation coefficients exceeding 0.9 in different conditions. This suggests that the model accurately captures flow dynamics and the interactions of waves with structures. Similarly, the shear stress measurements indicated that the RNG k-ε model provides reliable predictions of the distribution of stress across the slopes’ surfaces. The discrepancies observed between the experimental and simulated shear stresses were minimal, with RMSE values remaining below the acceptable thresholds.
In this study, to facilitate the comparison between the numerical simulation results and experimental measurements, we normalized the RMSE and Error. The purpose of this normalization was to adjust the data to a common scale, enabling the relative comparison of errors across different magnitudes.
Specifically, the RMSE and Error were normalized based on the average experimental values:
N R M S E = 1 n i = 1 n ( x s i m , i x exp , i ) 2 x ¯ exp × 100 %
where x ¯ exp is the average of the experimental values.
N E r r o r = i = 1 n ( x s i m , i x exp , i ) n x ¯ exp × 100 %

4. Wave Run-Up on the Slope

4.1. Free Surface Elevation

The graph illustrates the variation in free surface elevation at points a, b, c, d, e, and f in Figure 6. The data extracted from the selected measurement points indicate that the water depth at the embankment increased as the waves climbed, reaching the maximum water level at the crest of the wave. Subsequently, as the water level on the embankment began to recede, the water surface line started to descend back to its initial position. Due to the interaction between incoming and retreating waves, there was a period in which the waves were unable to reach that location, resulting in a stable water level that remained at the height of the embankment surface [34]. After four to five wave cycles, the waves on the embankment began to climb again, with greater energy, and within the period of a given wavelength, they began to rise and reach their maximum elevation at the end of the cycle. As shown in the graph, all six points experienced the highest wave run-up during this period. The parameter measured here was the free surface elevation (η), which indicates the vertical height of the wave run-up relative to a fixed cross-section on the slope. The patterns illustrated in Figure 6 were highly intermittent and did not follow regular repetitions for each wave period. This irregularity can be attributed to several factors, the first of which is wave–solid boundary interactions. Water near the lateral boundaries slows down and dissipates due to drag from the lateral solid boundaries. This boundary-induced dissipation of wave energy leads to variations in the recorded run-up heights, preventing uniform wave behavior across the slope and causing fluctuations in the measured surface elevation. The second such factor is the measurement limitation; the setup of the free surface elevation (η) measurement does not capture the full wave cycle when the water level drops below set detection points, especially during the trough of the wave. As a result, there are moments when the water level is below the detection point, creating the impression of intermittent data. The last factor is localized flow dynamics; small changes in local flow conditions such as shear stresses, flow separation, and turbulence near the boundaries can introduce additional variability in the free surface elevation (η). This sensitivity to localized hydrodynamics contributes to the irregular patterns in the data.
As the water ascended to the embankment, it passed through various scattered points and moved higher up the slope. When the water level at these points remained unchanged, we confirmed that the water had reached surface height at that location. In analyzing the free liquid surface elevation (η) at these six scattered points over a total computational time of 20 s, we were able to discern whether the water level had risen to that height. The wave run-up on the embankment clearly exhibited a certain periodicity, with the water level remaining unchanged at the embankment surface even across several time intervals. This periodic behavior provided insights into the dynamics of the waves’ interactions with the embankment surface, offering valuable information on the influence that wave characteristics—such as frequency and amplitude—have on the wave run-up dynamics.
During the first wave cycle, from 0 s to 2 s, all scattered points indicated an increase in water level, briefly reaching a peak value before descending back to the surface, with rapid fluctuations in the water level. The variation in the water level at the 1.4 s position aligned with this pattern, suggesting that the water level quickly decreased after reaching this point, causing a swift decrease in the free liquid surface elevation. These fluctuations are indicative of the complex interactions between waves and slopes and the dissipation of energy that occurs during wave breaking. Variability in the wave-induced velocities and shear stresses also plays a crucial role in shaping these dynamics.
Due to the varying positions of the scattered points and the randomness of the surface morphology, the water level fluctuations at these points can also vary. Point f, for instance, experienced multiple changes in free liquid surface elevation within 20 s, with a frequency closely matching the wave frequency. The free surface elevation at point f correlated strongly with the local velocity field, which suggests that areas of high velocity correspond to an increased wave run-up height. Moreover, point c reached the highest elevation of 3.46 m among all of the scattered points, indicating that the water level at the center of the embankment was able to reach its maximum height during ascent. The water level at point c rose to this level within the first wave cycle and then decreased rapidly. Other scattered points also showed changes in elevation during this time, but their maximum elevations were relatively lower, failing to match the height reached at point c. This suggests that the center of the embankment receives significant impact from the wave, highlighting the importance of considering spatial variability when assessing the risk of overtopping.
After the first harmonic wave cycle, the water level at point c decreased, and due to the interaction between the waves and the embankment slope, the water level crossed the waterline again at 13 s and 15 s. The reoccurrence of these peaks emphasizes the role of slope geometry and wave reflection in dictating wave run-up patterns. Upon analyzing the wave–structure interactions at key points, we found that regions likely experiencing higher shear stresses aligned with the observed wave run-up peaks, providing insights into the mechanics of wave overtopping. The free liquid surface elevation remained unchanged for several cycles before returning to 3.40 m and then its initial position. The water level changes at points a, b, d, and e were also concentrated at approximately 1.4 s and 15 s, respectively. These observations underscore the need to consider both temporal and spatial variations in wave run-up studies, without which we cannot accurately predict overtopping scenarios and inform coastal defense strategies.
Figure 7a–d depicts three-dimensional free surface elevation maps for B1 at specific times: t = 1.4 s, 6.6 s, 12.8 s, and 17.2 s. At t = 1.4 s, the wave on the embankment surface rose, and due to the influence of the precast blocks, the liquid surface exhibited irregular patterns. The fluid experienced localized breaking as it climbed, and asymmetry in the embankment slope resulted in variation in the free liquid surface at different scattered points. At t = 6.6 s, the free liquid surface was more intensely affected by the precast blocks, leading to more pronounced wave breaking on the embankment surface. The unevenness of the slope surface also caused a small amount of water to linger on the embankment slope. At t = 12.8 s, during the wave run-up, the free liquid surface elevation on the left side of the embankment rose more sharply than that on the middle side, as there were no protrusions on the left side of the slope surface to obstruct the upward movement of the water. This further illustrates the impact of slope treatment on wave run-up. At t = 17.2 s, the liquid surface tended to level out as the waves receded.

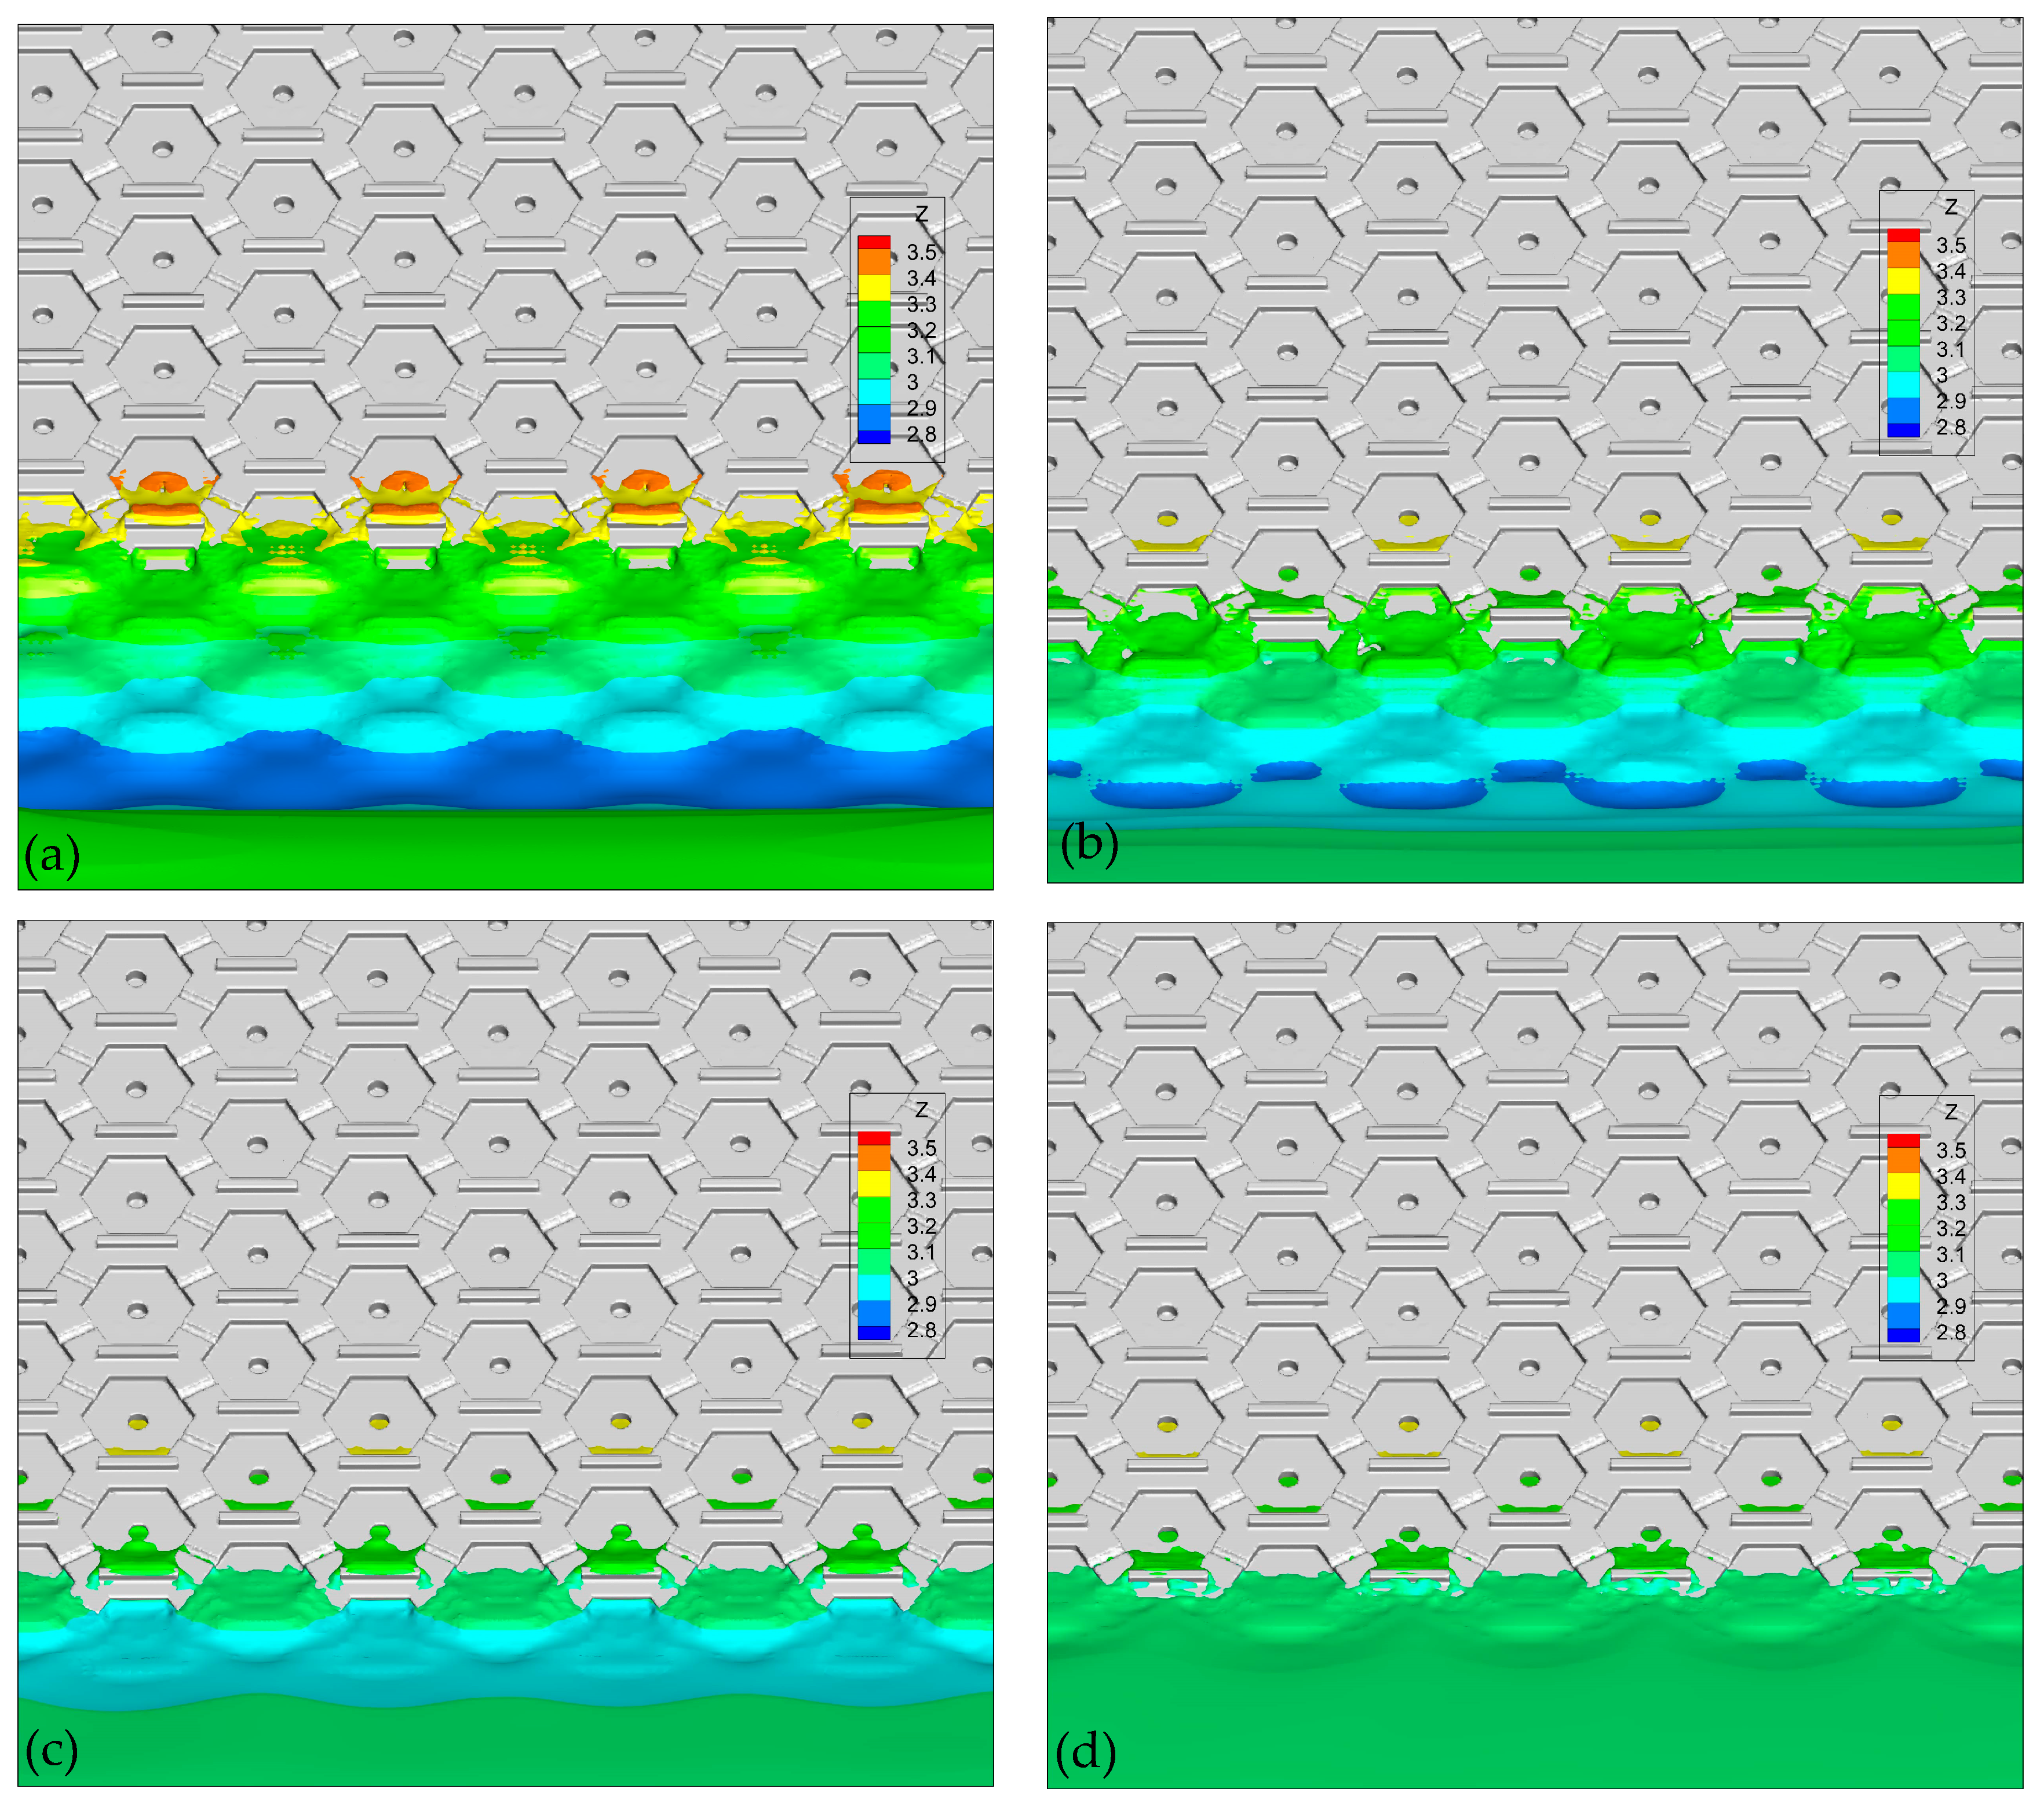
4.2. Distribution of the Cross-Sectional Water Surface Profile

In comparing the free surface elevation at scattered points, we could identify the sections in which the maximum wave run-up occurred, and the free surface and water depth distribution data could be gleaned in sections A-A, A1-A1, A2-A2, A3-A3, A4-A4, and A5-A5 during these time intervals. The water depth decreased as the wave run-up height increased, reaching zero at the point at which the wave reached its maximum height on the embankment surface. The water depth remained zero above this point, indicating an absence of liquid on the embankment surface. The water depth here refers to the depth starting from the slope. The maximum wave run-up height was defined as the vertical distance from the still water level to the highest point reached by the wave on the embankment surface, measured when the wave stopped advancing and began to recede. We statistically analyzed the maximum wave run-up conditions at these cross-sections by processing the maximum wave run-up values at each time.
Figure 8 shows the fluctuations in the wave run-up height for B1 in sections A-A, A1-A1, A2-A2, A3-A3, A4-A4, and A5-A5. The waves reached the surface of the embankment within 5 s. Initially, within the first 1.5 s, the liquid surface elevation in each section increased, peaking at approximately 3.43 m around the 1.7 s mark. Subsequently, troughs were observed in all profiles at 3.1 s, and the overall trend showed a continuous increase from 3.1 s to 3.8 s, indicating synchronization between the peak liquid level rise and the wave period. Notably, at section A-A, the liquid level bottomed out at 3.11 m at 3.1 s, followed by a swift ascent to 3.2 m, which then escalated rapidly to 3.40 m within 3 s. Across the six sections, the waves showed nonlinear progression marked by distinct steep slopes and flattened troughs, reflecting the complex interplay of wave dynamics. Such abrupt shoaling is the main reason for wave breaking.
The divergence from the general trend identified for section A4 can provide us with greater insight. Specifically, the wave run-up height at A4 showed a noticeable deviation from the other sections between 2 s and 4 s. This deviation is likely due to localized hydrodynamic effects. Complex flow dynamics including flow separation and reattachment around the embankment might have been more pronounced in section A4, contributing to the observed anomalies in wave run-up height.
The situation at the embankment corner was characterized by trailing waves pushing against the preceding waves, causing fluctuations in the water surface and creating several free liquid surface elevations of varying heights at that location. Additionally, after the waves on the embankment climbed and then receded to the corner, they collided with the following waves, resulting in breaking and further fluctuations. This interaction affected the subsequent ability of the wave to climb the embankment, preventing the free liquid surface elevation from consistently increasing with the arrival of each new wave. Consequently, the wave run-up on the embankment surface decreased for a period following this interaction.

5. Results and Discussion

5.1. Effect of Different Prefabricated Block Slopes on Wave Run-Up Height and Wave Dissipation

In the model tests, we observed that the maximum wave run-up on each prefabricated block slope occurred within the first few cycles. Consequently, we measured the wave run-up values for the first 20 s of testing each precast block; we also identified the maximum wave run-up for a comparison of wave dissipation. The maximum recorded water run-up heights for the four different conditions are presented in Table 3 and Figure 9. B0 refers to a smooth slope form of protection, which was used as the control group to demonstrate the wave-dissipating effects of the other block slopes.
We designated the wave run-up on smooth concrete prefabricated blocks as our control group and then calculated the degree to which the wave run-up was attenuated by the three newly engineered precast block designs relative to the baseline.
The metric of the wave run-up reduction efficiency was introduced to better illustrate the efficacy of slope protection structures in reducing the wave run-up height. The formula for its calculation is as follows:
D i = R i R g × 100 %
The above formula obtains the rate (Di) of the reduction in wave run-up for three novel prefabricated block designs in comparison to a conventional smooth concrete prefabricated block [35]. Ri is the wave run-up height for the new prefabricated block designs, and Rg is the corresponding wave run-up height for the smooth concrete prefabricated block.
Such calculations, as described in Table 4, assess the degree of wave dissipation achieved by the three precast block designs relative to smooth concrete blocks. For a wave period of 3.0 s, the embankment constructed with B1 demonstrated the most significant wave run-up attenuation at 50.7%. B2 showed 38.3% attenuation, and B3 showed a 37.8% reduction. These results indicate a consistent trend in wave dissipation performance across various wave periods.
After determining the optimal wave dissipation performance of the B1 prefabricated block slope, we carried out further investigation into B1’s effect on the wave run-up height when its geometrical characteristics changed. The roughness of B1 encompassed its thickness, aperture, and wave dissipation notch, as shown in Figure 10. A prefabricated B1 block with a thickness of 120 mm, aperture of 100 mm, and wave dissipation notch width of 50 mm was selected [35]. In the numerical simulation process, the wave run-up reduction efficiency Di was used to reflect the rate at which the wave run-up height was reduced when different geometrical characteristics were present. Although the EurOtop Manual provides comprehensive guidelines for analyzing roughness in coastal and hydraulic engineering contexts, it does not specifically address methods for observing concrete blocks with unique geometrical features such as those depicted in our study.
The complexity and uniqueness of the block designs, particularly the presence of apertures and wave dissipation notches, necessitated a tailored approach to evaluating their impact on roughness. To this end, a method of normalizing the roughness factor, γf, was proposed:
γ f = x - min x max x - min x
Here, x represents a set of key dimensional parameters of the blocks including aperture, thickness, and the dimensions of the wave dissipation notch. By normalizing these values, the varying sizes and configurations across different block designs can be standardized, facilitating a clear and consistent analysis of how these dimensions influence the waves’ interaction with block structures.
This normalization allowed us to quantify the specific effects of each dimensional parameter on the hydraulic performance and wave dissipation efficiency of the blocks. These findings are presented in Figure 11, which demonstrates the impact of varying sizes and shapes on the roughness factor, and consequently on the wave run-up and dissipation characteristics.
Our approach, while not explicitly outlined in the EurOtop Manual, aligns with the mission of rigorous empirical analysis advocated by the manual. It ensured that our findings were both scientifically sound and applicable to the practical design and implementation of coastal protection structures.
This method, therefore, not only adheres to established engineering practices but also contributes to the field by providing a detailed and adaptable framework for evaluating novel block designs, which are increasingly relevant in contemporary coastal engineering projects.
In this study, precast blocks with unique geometrical features (as shown in Figure 10) were utilized to study the dissipation of wave energy. To ensure that the geometrical characteristics of the blocks were appropriately scaled alongside the wave properties, the following dimensionless parameters were introduced for a comprehensive analysis and comparison. To compare the dimensions of the precast block with the wave properties, the following dimensionless geometric ratios were defined.
  • Block height ratio (Hr):
H r = h b l o c k H w a v e
where hblock is the thickness of the block, and Hwave is the wave height.
Aperture ratio (Ar):
A r = d a p e r t u r e L w a v e
where daperture is the diameter of the aperture, and Lwave is the wavelength.
Notch ratio (Nr):
N r = d n o t c h H w a v e
where dnotch is the depth of the wave dissipation notch, and Hwave is the wave height.
Using the defined dimensionless parameters, these ratios were calculated under various wave conditions, and an analysis was conducted using the following representative wave properties: wave height (Hwave), wavelength (Lwave), and wave speed (v) (or each wave’s condition). The Froude number, Reynolds number, and the geometric ratios (Hr, Ar and Nr) were also calculated. The results are summarized in Table 5.
As shown in the table, the geometric ratios between the precast block and wave properties varied significantly with increasing wave height and wavelength, reflecting the block design’s adaptability to different wave conditions. In conditions with higher wave heights and longer wavelengths, the block height ratio and notch ratio were relatively small, indicating that the block’s effectiveness in dissipating wave energy may have been limited under these conditions.
We conducted the numerical simulation with a maximum wave height of 0.5 m and a period of 2.0 s. From our research, we can conclude that the maximum wave run-up height occurred during the period between 1.5 s and 2.0 s. We were able to measure the wave run-up time within 10 s, and the specific data obtained were analyzed.
Figure 11 shows that the impact of the three different roughness levels on the wave run-up reduction efficiency did differ. An increase in roughness exerted a certain effect on the attenuation of waves, with the most significant effect being caused by an increase in the aperture and wave dissipation notch. The effect of the aperture was minimal. Thickness had a more pronounced effect on wave dissipation in the first half of the experiment and showed a clear downward trend in the second half. Upon analysis, when the wave moved upward, a layer of water formed when the previous wave moved downward. This residual layer of water reduced the roughness of the prefabricated block slope. Moreover, due to a single increase in thickness, the height of the wave dissipation notch decreased, resulting in a decrease in wave dissipation efficiency. However, relative to smooth slopes, prefabricated block slope protection nonetheless proved able to reduce wave run-up and dissipate more wave energy. That said, we can conclude that the most effective dissipation of wave run-up was achieved by altering the height of the wave dissipation notch.

5.2. Empirical Formula of the Wave-Absorbing Effect of Prefabricated Blocks

It is clear from the above conclusion that B1 had the best wave dissipation effect. To estimate the wave run-up height, the following formula [36] was used:
R u = K R 1 H
where Ru is the wave run-up height [m]. Starting from a calm water surface, the upward direction was positive. KΔ is the roughness permeability coefficient related to the type of slope protection structure. In this study, values ranging from 0.50 to 0.55 were used.
R 1 = K 1 tanh 0.432 M + R 1 m K 2 R M
R1 is the wave run-up height when KΔ = 1 and H = 1. H is the wave height.
M = 1 m L H 1 / 2 tanh 2 π d L 1 / 2
M is a function related to the slope m. m is the slope gradient coefficient, with a slope gradient of 1:m. L is the wavelength [m], and d (m) is the water depth in front of the embankment. To produce the wave run-up formula, we referred to empirical formulas provided in the EurOtop Manual. This manual offers detailed design methods and parameters for wave–structure interactions. Specifically, the roughness coefficient Ks, water depth d, and wavelength L were used in our calculations:
R 1 m = K 3 2 tanh 2 π d L 1 + 4 π d L sinh 4 π d L
where (R1)m is the maximum wave run-up value corresponding to d/L [m].
R M = 1.09 M 3.32 exp 1.25 M
where R(M) is the run-up function. Empirical data and design guidelines from the EurOtop Manual were integrated to ensure the scientific accuracy of our methodology. A dimensionless analysis, incorporating geometric and hydraulic characteristics, was also conducted to comprehensively analyze the wave behavior. Wave parameters such as the roughness coefficient (Ks), water depth (d), and wavelength (L) were directly taken from the EurOtop formulas. We made minor adjustments such as modifying the roughness coefficient by a factor of 2 and introducing a new term to better capture the wave–structure interactions, thereby most accurately reflecting the specific hydrodynamic and structural characteristics of our prefabricated block design. K1, K2, and K3 can be obtained by combining Equations (9)–(12) with the maximum wave run-up from the numerical simulation, meaning that in engineering projects, the wave run-up on prefabricated blocks such as B1 can be predicted in advance.
The coefficient K3 was calculated from the wave run-up height with a wave period of 2 s using Formula (13). The error observed in predictions of wave height for other periods using K3 did not exceed 5%, indicating strong prediction ability. K1 and K2 were calculated from the wave run-up height using Formulas (10)–(12). K1, K2, and K3 were found to be 1.448, −0.86, and 1.313, respectively. The error observed in predictions of wave height for other periods using K3 did not exceed 10%. There was a notable discrepancy in the initial prediction for a wave period of 3.0 s. A comprehensive fluid dynamics analysis identified several factors contributing to the larger error in calculating coefficient K3 for a wave period of 3.0 s. Its longer wave period led to increased wavelength, enhancing wave–slope interactions, resonance effects, and the concentration of energy. Nonlinear effects like wave breaking and higher harmonics further affected the wave run-up height, meaning that deviation from linear predictions may have occurred. These discrepancies, likely due to detection errors resulting from wave splashing, suggest the need for model refinement. By incorporating roughness permeability and slope gradient coefficients (m), our empirical formula may improve the accuracy with which wave run-up is predicted for structures like precast blocks (allowing for a better integration of numerical simulations and theoretical models) and can enhance reliability through mutual verification and the correction of errors.

6. Conclusions

In this study, we utilized numerical simulations to measure the wave run-up (and the extent to which it could be attenuated) on three different types of prefabricated blocks. The major conclusions drawn from this study can be summarized as follows.
(1)
Prefabricated block slopes provide effective protection for inland waters in China, particularly along lakes and riverbanks. These structures are designed to dissipate wave run-up, making them ideal for environments with mild and regular wave activity. Their cost-effectiveness and aesthetic appeal make them suitable for urban and recreational slope protection, offering both economic and visual benefits. The paper used a numerical method to evaluate these blocks, demonstrating their practical value for inland water protection.
(2)
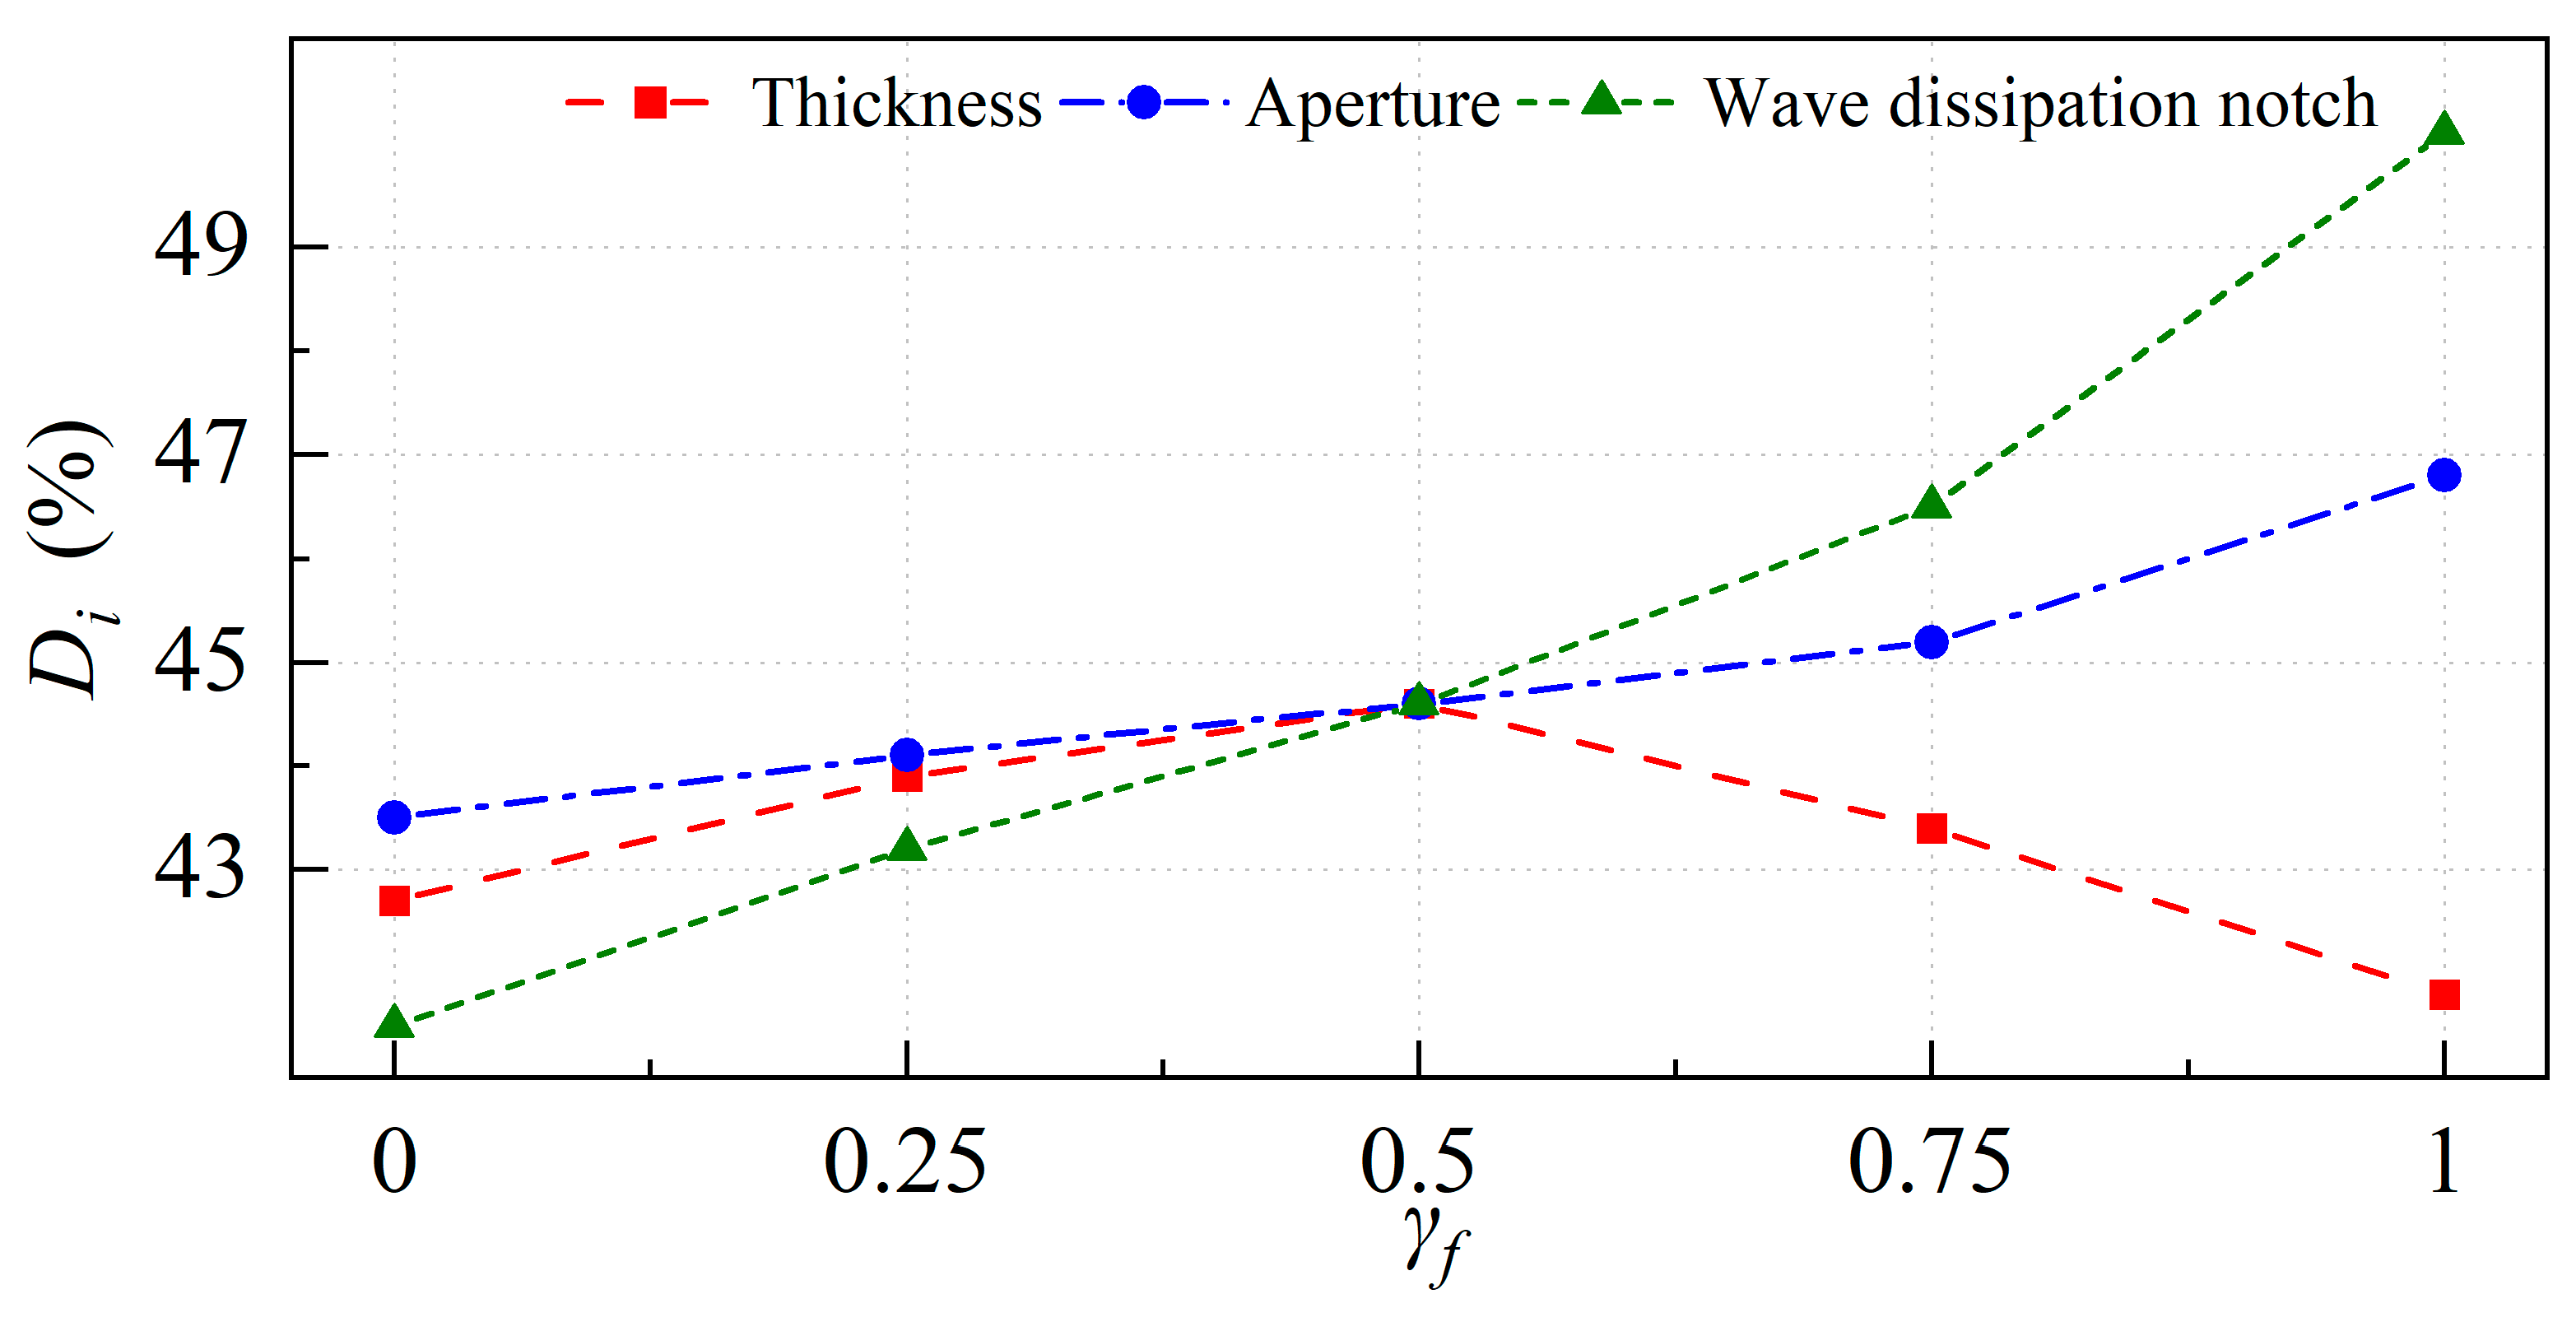
Among the three prefabricated block types tested, block B1 exhibited superior performance, with a wave run-up reduction efficiency of 44.6% at T = 2.0 s and 50.7% at T = 3.0 s. The optimized aperture, thickness, and wave dissipation notch of B1 were key to its higher performance. The wave dissipation notch was crucial in disrupting wave energy, making B1 more effective. This study highlights the innovative role of this notch in reducing wave run-up, offering design insights for artificial blocks. Adjusting its size impacts the run-up height, providing a novel approach to optimizing wave attenuation structures.
(3)
Empirical formulas were used to predict the wave run-up height when using B1 in specific engineering scenarios. These formulas were based on a limited dataset and primarily validated through numerical simulations, demonstrating an error margin of no more than 10% within the scope of the study. It is important to note that these formulas are intended for preliminary analysis and should not be used to draw definitive conclusions about real-world dike performance or actual wave conditions. Further validation through broader experimental data and physical testing is necessary if we are to improve the accuracy and applicability of these formulas. As such, this study serves as an initial step in exploring the behavior of prefabricated blocks in controlled-wave conditions rather than offering conclusive predictions for use within large-scale coastal infrastructure. With additional refinement and testing, these formulas could enhance the reliability of wave run-up forecasts, contributing to more effective design and implementation of coastal protection in the future.
In this study, we numerically investigated the influence of the geometry of prefabricated blocks on wave run-up. However, a general run-up model is still lacking; such a model could be developed in further studies and physical tests. Regular waves are employed as incident waves in this study to ensure the efficiency and stability of the present numerical model. It should be noted that real-world waves, either in oceans or inland waters, cannot be represented by regular waves. Further studies on irregular waves should be carried out in future.
This study highlights the significance of the roughness in wave run-up reduction, particularly for small-amplitude wave conditions. It should be noted that the impact of roughness should be considered for small-amplitude wave run-up on the slope. However, for larger-amplitude wave run-up, one should refer to EurOtop, as the stability of blocks under wave attack and on the permeability of the top layer of the placed blocks are more important topics.

Author Contributions

B.J.: Methodology, Data curation, Writing—original draft, Visualization. Data curation, Writing—review and editing. Q.Z.: Writing—original draft, Visualization. C.L.: Methodology. F.C.: Writing—review and editing. Q.F.: Project administration, Supervision. All authors have read and agreed to the published version of the manuscript.

Funding

This research was funded by the National Key R&D Program of China (2023YFB2604400), the National Natural Science Foundation of China (52178128), the Shandong Provincial Higher Education Institutions Youth Plan Team (2022KJ081), Jiangxi Provincial Project of Key Discipline Leaders (20232BCJ23105), and the Open Research Fund Projects of Jiangxi Academy of Water Science and Engineering (2020GCZX05, 2021SKSG07).

Institutional Review Board Statement

Not applicable.

Informed Consent Statement

Not applicable.

Data Availability Statement

The data presented in this study are available from the corresponding author upon request.

Conflicts of Interest

The authors declare no conflicts of interest.

References

  1. Samaras, A.G.; Karambas, T.V. Modelling the impact of climate change on coastal flooding: Implications for coastal structures design. J. Mar. Sci. Eng. 2021, 9, 1008. [Google Scholar] [CrossRef]
  2. Galiatsatou, P.; Makris, C.; Prinos, P. Optimized Reliability Based Upgrading of Rubble Mound Breakwaters in a Changing Climate. J. Mar. Sci. 2018, 6, 92. [Google Scholar] [CrossRef]
  3. De-León, D.; Loza, L. Reliability-based analysis of Lázaro Cárdenas breakwater including the economical impact of the port activity. Int. J. Disaster Risk Reduct. 2019, 40, 101276. [Google Scholar] [CrossRef]
  4. Koutrouveli, T.I.; Dimas, A.A. Wave and hydrodynamic processes in the vicinity of a rubble-mound, permeable, zero-freeboard breakwater. J. Mar. Sci. Eng. 2020, 8, 206. [Google Scholar] [CrossRef]
  5. Magdalena, I.; Erwina, N. An efficient two-layer non-hydrostatic model for investigating wave run-up phenomena. Computation 2019, 8, 1. [Google Scholar] [CrossRef]
  6. Baker, R.J.W. Precast Concrete Blocks for High-Velocity Flow Applications. Water Environ. J. 1990, 4, 552–558. [Google Scholar] [CrossRef]
  7. Safari, I.; Mouazé, D.; Aliasgary, S.; Carpentier, G.; Ropert, F. Hydraulic Response and Overtopping Performance of Single-Layer Double Cube Unit Armored Mound Breakwater. J. Mar. Sci. Eng. 2023, 11, 1382. [Google Scholar] [CrossRef]
  8. Zhao, H.; Ding, F.; Ye, J.; Jiang, H.; Chen, W.; Gu, W.; Yu, G.; Li, Q. Physical Experimental Study on the Wave Reflection and Run-Up of a New Ecological Hollow Cube. J. Mar. Sci. Eng. 2024, 12, 664. [Google Scholar] [CrossRef]
  9. Breteler, M.K.; Pilarczyk, K. Stability of artificial roughness elements and run-up reduction. In Coastal Engineering 1996; ASCE Library: Reston, VA, USA, 1996; pp. 1556–1568. [Google Scholar] [CrossRef]
  10. Stagnitti, M.; Lara, J.L.; Musumeci, R.E.; Foti, E. Assessment of the variation of failure probability of upgraded rubble-mound breakwaters due to climate change. Front. Mar. Sci. 2022, 9, 986993. [Google Scholar] [CrossRef]
  11. Kreyenschulte, M.; Schürenkamp, D.; Bratz, B.; Schüttrumpf, H.; Goseberg, N. Wave Run-Up on Mortar-Grouted Riprap Revetments. Water 2020, 12, 3396. [Google Scholar] [CrossRef]
  12. Zhao, E.; Mu, L.; Hu, Z.; Wang, X.; Sun, J.; Zhang, Z. Physical and Numerical Investigations on Wave Run-Up and Dissipation under Breakwater with Fence Revetment. J. Mar. Sci. Eng. 2021, 9, 1355. [Google Scholar] [CrossRef]
  13. De Waal, J.; Van der Meer, J. Wave runup and overtopping on coastal structures. In Coastal Engineering 1992; ASCE Library: Reston, VA, USA, 1993; pp. 1758–1771. [Google Scholar] [CrossRef]
  14. Tang, W.; Mohseni, E.; Wang, Z. Development of vegetation concrete technology for slope protection and greening. Constr. Build. Mater. 2018, 179, 605–613. [Google Scholar] [CrossRef]
  15. Cao, W.; Omran, B.A.; Lei, Y.; Zhao, X.; Yang, X.; Chen, Q.; Tian, G. Studying early stage slope protection effects of vegetation communities for Xinnan Highway in China. Ecol. Eng. 2018, 110, 87–98. [Google Scholar] [CrossRef]
  16. Dang, B.-L.; Nguyen-Ngoc, H.; Hoang, T.D.; Nguyen-Xuan, H.; Abdel Wahab, M. Numerical investigation of novel prefabricated hollow concrete blocks for stepped-type seawall structures. Eng. Struct. 2019, 198, 109558. [Google Scholar] [CrossRef]
  17. Hashim, A.M.; Noor, N. Performance evaluation of innovative concrete armor unit for coastal protection structure. In Proceedings of the 2013 IEEE Business Engineering and Industrial Applications Colloquium (BEIAC), Langkawi, Malaysia, 7–9 April 2013; pp. 673–678. [Google Scholar]
  18. Asamoah, R.O.; Ankrah, J.S.; Offei-Nyako, K.; Tutu, E.O. Cost analysis of precast and cast-in-place concrete construction for selected public buildings in Ghana. J. Constr. Eng. 2016, 2016, 8785129. [Google Scholar] [CrossRef]
  19. Denagama, T.; Jayasooriya, J. Comparative analysis of precast construction and conventional construction of small-scale concrete building in terms of cost. Int. J. Res. Appl. Sci. Eng. Technol. 2023, 11, 573–578. [Google Scholar] [CrossRef]
  20. Chan, T.K. Comparison of precast construction costs–case studies in Australia and Malaysia. In Proceedings of the 27th Annual ARCOM Conference, Bristol, UK, 5–7 September 2011; pp. 5–7. [Google Scholar]
  21. Attri, G.K.; Gupta, R.C.; Shrivastava, S. Sustainable precast concrete blocks incorporating recycled concrete aggregate, stone crusher, and silica dust. J. Clean. Prod. 2022, 362, 132354. [Google Scholar] [CrossRef]
  22. Zhao, Z.; Courard, L.; Groslambert, S.; Jehin, T.; LÉOnard, A.; Xiao, J. Use of recycled concrete aggregates from precast block for the production of new building blocks: An industrial scale study. Resour. Conserv. Recycl. 2020, 157, 104786. [Google Scholar] [CrossRef]
  23. Lima, P.R.; Barros, J.A.; Roque, A.B.; Fontes, C.M.; Lima, J.M. Short sisal fiber reinforced recycled concrete block for one-way precast concrete slabs. Constr. Build. Mater. 2018, 187, 620–634. [Google Scholar] [CrossRef]
  24. Stagnitti, M.; Lara, J.; Musumeci, R.; Foti, E. Numerical modeling of wave overtopping of damaged and upgraded rubble-mound breakwaters. Ocean Eng. 2023, 280, 114798. [Google Scholar] [CrossRef]
  25. Shounda, J.; Barman, K.; Debnath, K. Effect of wave-current flow on double-averaged turbulence properties over rough bed of hemispherical obstacles. Coast. Eng. J. 2023, 65, 572–596. [Google Scholar] [CrossRef]
  26. Magdalena, I.; La’lang, R.; Mendoza, R. Quantification of wave attenuation in mangroves in manila bay using nonlinear shallow water equations. J. Results Appl. Math. 2021, 12, 100191. [Google Scholar] [CrossRef]
  27. Andersen, T.L.; Burcharth, H.F.; Gironella, X. Comparison of new large and small scale overtopping tests for rubble mound breakwaters. Coast. Eng. 2011, 58, 351–373. [Google Scholar] [CrossRef]
  28. Wroniszewski, P.A.; Verschaeve, J.C.; Pedersen, G.K. Benchmarking of Navier–Stokes codes for free surface simulations by means of a solitary wave. Coast. Eng. 2014, 91, 1–17. [Google Scholar] [CrossRef]
  29. Chen, W.; Warmink, J.; Van Gent, M.; Hulscher, S. Numerical modelling of wave overtopping at dikes using OpenFOAM®. Coast. Eng. 2021, 166, 103890. [Google Scholar] [CrossRef]
  30. Jacobsen, N.G.; Fuhrman, D.R.; Fredsøe, J. A wave generation toolbox for the open-source CFD library: OpenFoam®. J. Numer. Methods Fluids 2012, 70, 1073–1088. [Google Scholar] [CrossRef]
  31. Ferziger, J.H.; Perić, M. Computational Methods for Fluid Dynamics; Springer: Berlin/Heidelberg, Germany, 2002. [Google Scholar]
  32. Gao, Y.; Zhu, J.; Qu, X.; Wang, L.; Wang, B. Numerical simulation of wave run-up on three cylinders in an equilateral-triangular arrangement. Ocean Eng. 2021, 233, 109176. [Google Scholar] [CrossRef]
  33. Molin, B.; Kimmoun, O.; Liu, Y.; Remy, F.; Bingham, H.B. Experimental and numerical study of the wave run-up along a vertical plate. J. Fluid Mech. 2010, 654, 363–386. [Google Scholar] [CrossRef]
  34. Craik, A.D. Wave Interactions and Fluid Flows; Cambridge University Press: Cambridge, UK, 1988. [Google Scholar]
  35. Clavero, M.; Díaz-Carrasco, P.; Losada, M.Á. Bulk wave dissipation in the armor layer of slope rock and cube armored breakwaters. J. Mar. Sci. Eng. 2020, 8, 152. [Google Scholar] [CrossRef]
  36. EurOtop Manual. Manual on Wave Overtopping of Sea Defences and Related Structures: An Overtopping Manual Largely Based on European Research, Home—Overtopping Manual. 2018. Available online: http://www.overtopping-manual.com (accessed on 5 March 2024).
Figure 1. Three-dimensional panorama and details of the individual model. (a) B1: concave and embedded regular hexagon-type prefabricated blocks; (b) B2: Z-type prefabricated concrete blocks; (c) B3: embedded quadrangle-type prefabricated hollow blocks.
Jmse 12 01735 g001
Figure 2. Global and local view of the mesh.
Jmse 12 01735 g002
Figure 3. Comparison of the numerical results of free surface elevation.
Jmse 12 01735 g003
Figure 4. The sections and points in the model floor plan.
Jmse 12 01735 g004
Figure 5. Layout diagram of the sink and model.
Jmse 12 01735 g005
Figure 6. Free surface elevation (η) over time for the B1 prefabricated block during regular wave interaction. (af) The free surface elevation of points a, b, c, d, e and f from Figure 4.
Jmse 12 01735 g006
Figure 7. Three-dimensional map depicting the local water surface profile of the embedded hexagonal model. (a) t = 1.4 s; (b) t = 6.6 s; (c) t = 12.8 s; (d) t = 17.2 s.
Jmse 12 01735 g007
Figure 8. Cross-sectional wave run-up height (Ru typically refers to the vertical distance from the still water level (or mean sea level) to the highest point reached by the waves on a slope.).
Jmse 12 01735 g008
Figure 9. Maximum water height on the prefabricated block slopes. (a) T = 1.5 s; (b) T = 2.0 s; (c) T = 2.5 s; (d) T = 3.0 s.
Jmse 12 01735 g009
Figure 10. Different geometrical characteristic conditions of B1.
Jmse 12 01735 g010
Figure 11. The impact of the three roughness changes on the wave run-up reduction efficiency.
Jmse 12 01735 g011
Table 1. Details of the mesh convergence test.
CaseMeshTotal Cell CountL (Wavelength)/ΔxH (Wave Height)/Δz
B1Mesh 11.06 × 1062010
Mesh 22.65 × 1064010
Mesh 34.96 × 1066010
Mesh 42.79 × 1064015
Mesh 52.79 × 1064020
L/Δx refers to refinement of the grid size in the wavelength direction. H/Δz refers to refinement of the grid size in the wave height direction.
Table 2. Comparison of the wave run-up heights between the numerical simulations and experimental measurements.
Time/Horizontal DistanceB1 (cm)B2 (cm)B3 (cm)Pearson CorrelationNRMSE (%)NError (%)
ExpNumExpNumExpNum
1.875 s/23.6 cm5.075.235.555.556.506.810.952.973.15
1.875 s/30.6 cm14.7215.2614.7615.3214.9915.710.963.443.67
2.5 s/30.6 cm7.177.347.297.647.437.790.922.852.37
Note: The table shows a comparison of wave run-up heights and experimental measurements under different conditions. The Pearson correlation coefficient was calculated based on 20 data points. Due to space constraints and for clarity, only a subset of the data points is shown in the table. The NRMSE and NError values are expressed as percentages (%) relative to the experimental measurements.
Table 3. Maximum wave run-up heights of the prefabricated block slopes.
Period (s)B0 (m)B1 (m)B2 (m)B3 (m)
1.50.6600.3620.3970.432
2.00.6720.4320.4430.453
2.50.7250.4780.5300.546
3.01.0440.5240.6440.649
Table 4. Wave dissipation effect of three precast blocks compared with that of the smooth concrete prefabricated blocks (as shown in the calculation of the wave run-up reduction efficiency in Section 5.1.).
Period (s)B1 (%)B2 (%)B3 (%)
1.545.239.834.5
2.044.641.037.6
2.534.126.924.7
3.050.738.337.8
Table 5. Dimensionless analysis of the geometrical characteristics of the precast block and wave.
Wave ConditionFrReHrArNr
H= 0.5 m, L = 10 m, v = 0.5 m/s0.505 × 1050.240.010.10
H = 1 m, L = 15 m, v = 0.5 m/s0.417.5 × 1050.120.0070.05
H = 1.5 m, L = 20 m, v = 0.5 m/s0.351 × 1060.080.0050.03
Disclaimer/Publisher’s Note: The statements, opinions and data contained in all publications are solely those of the individual author(s) and contributor(s) and not of MDPI and/or the editor(s). MDPI and/or the editor(s) disclaim responsibility for any injury to people or property resulting from any ideas, methods, instructions or products referred to in the content.

