
Impact of the Longitudinal Center of Buoyancy on the Total Resistance of a Passenger Ship

 ,
,  ,
,  ,
, 
Abstract
1. Introduction
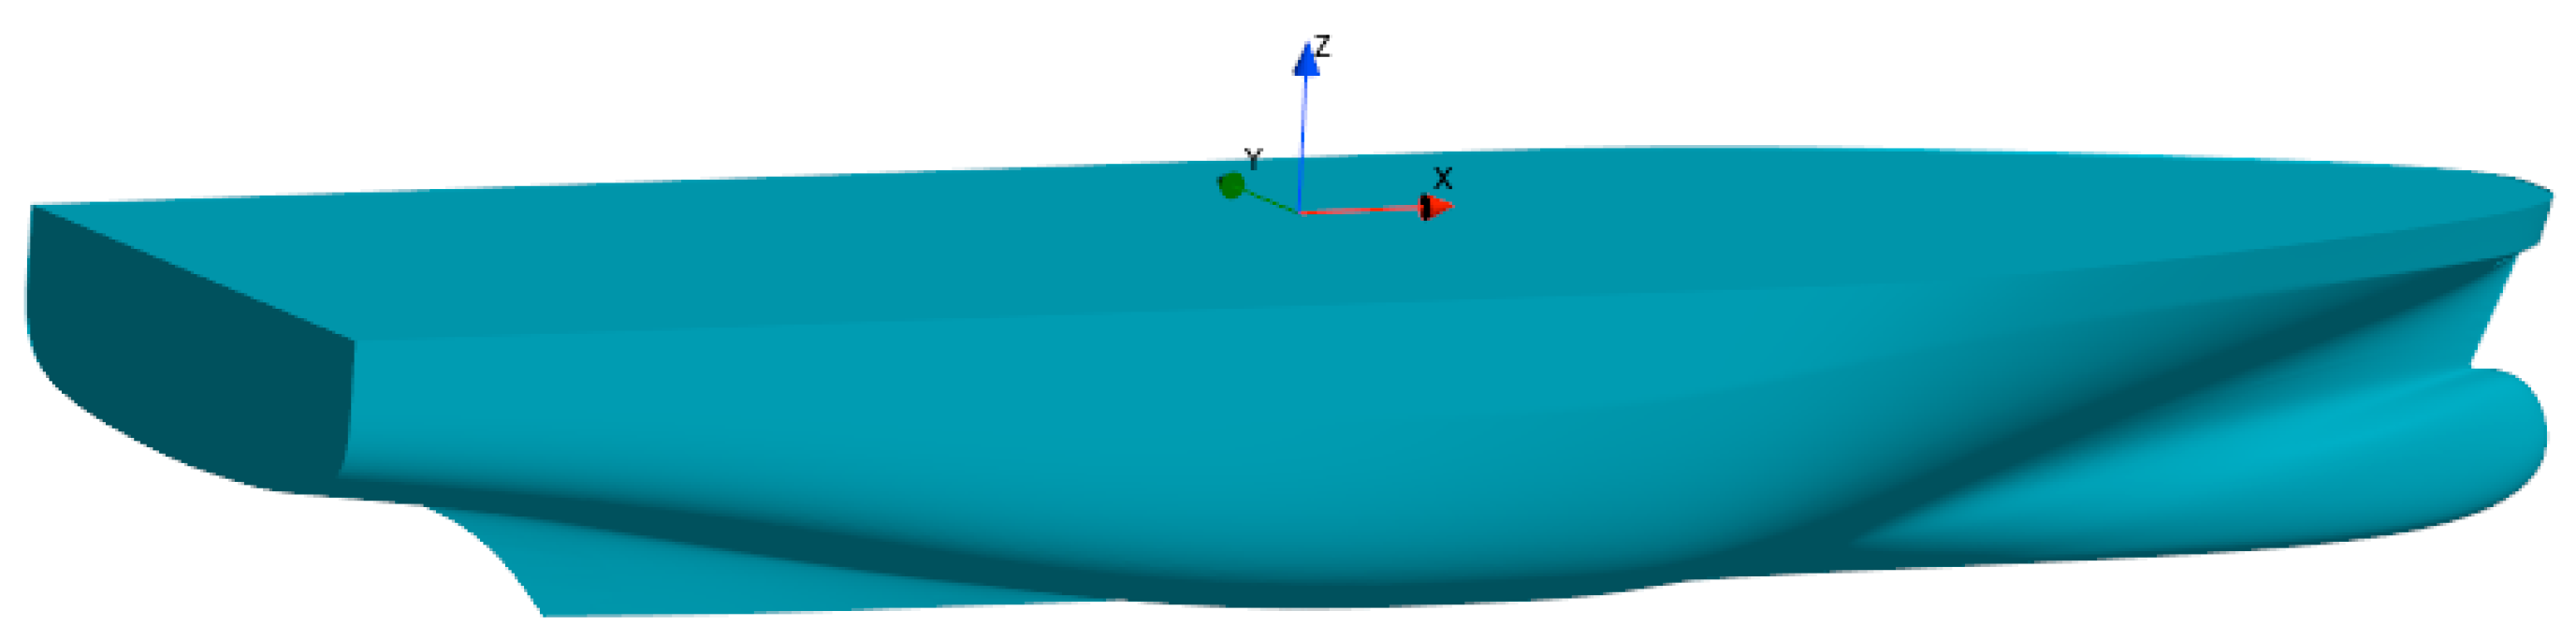
2. Case Study
3. Hull Form Modification
4. Mathematical Model
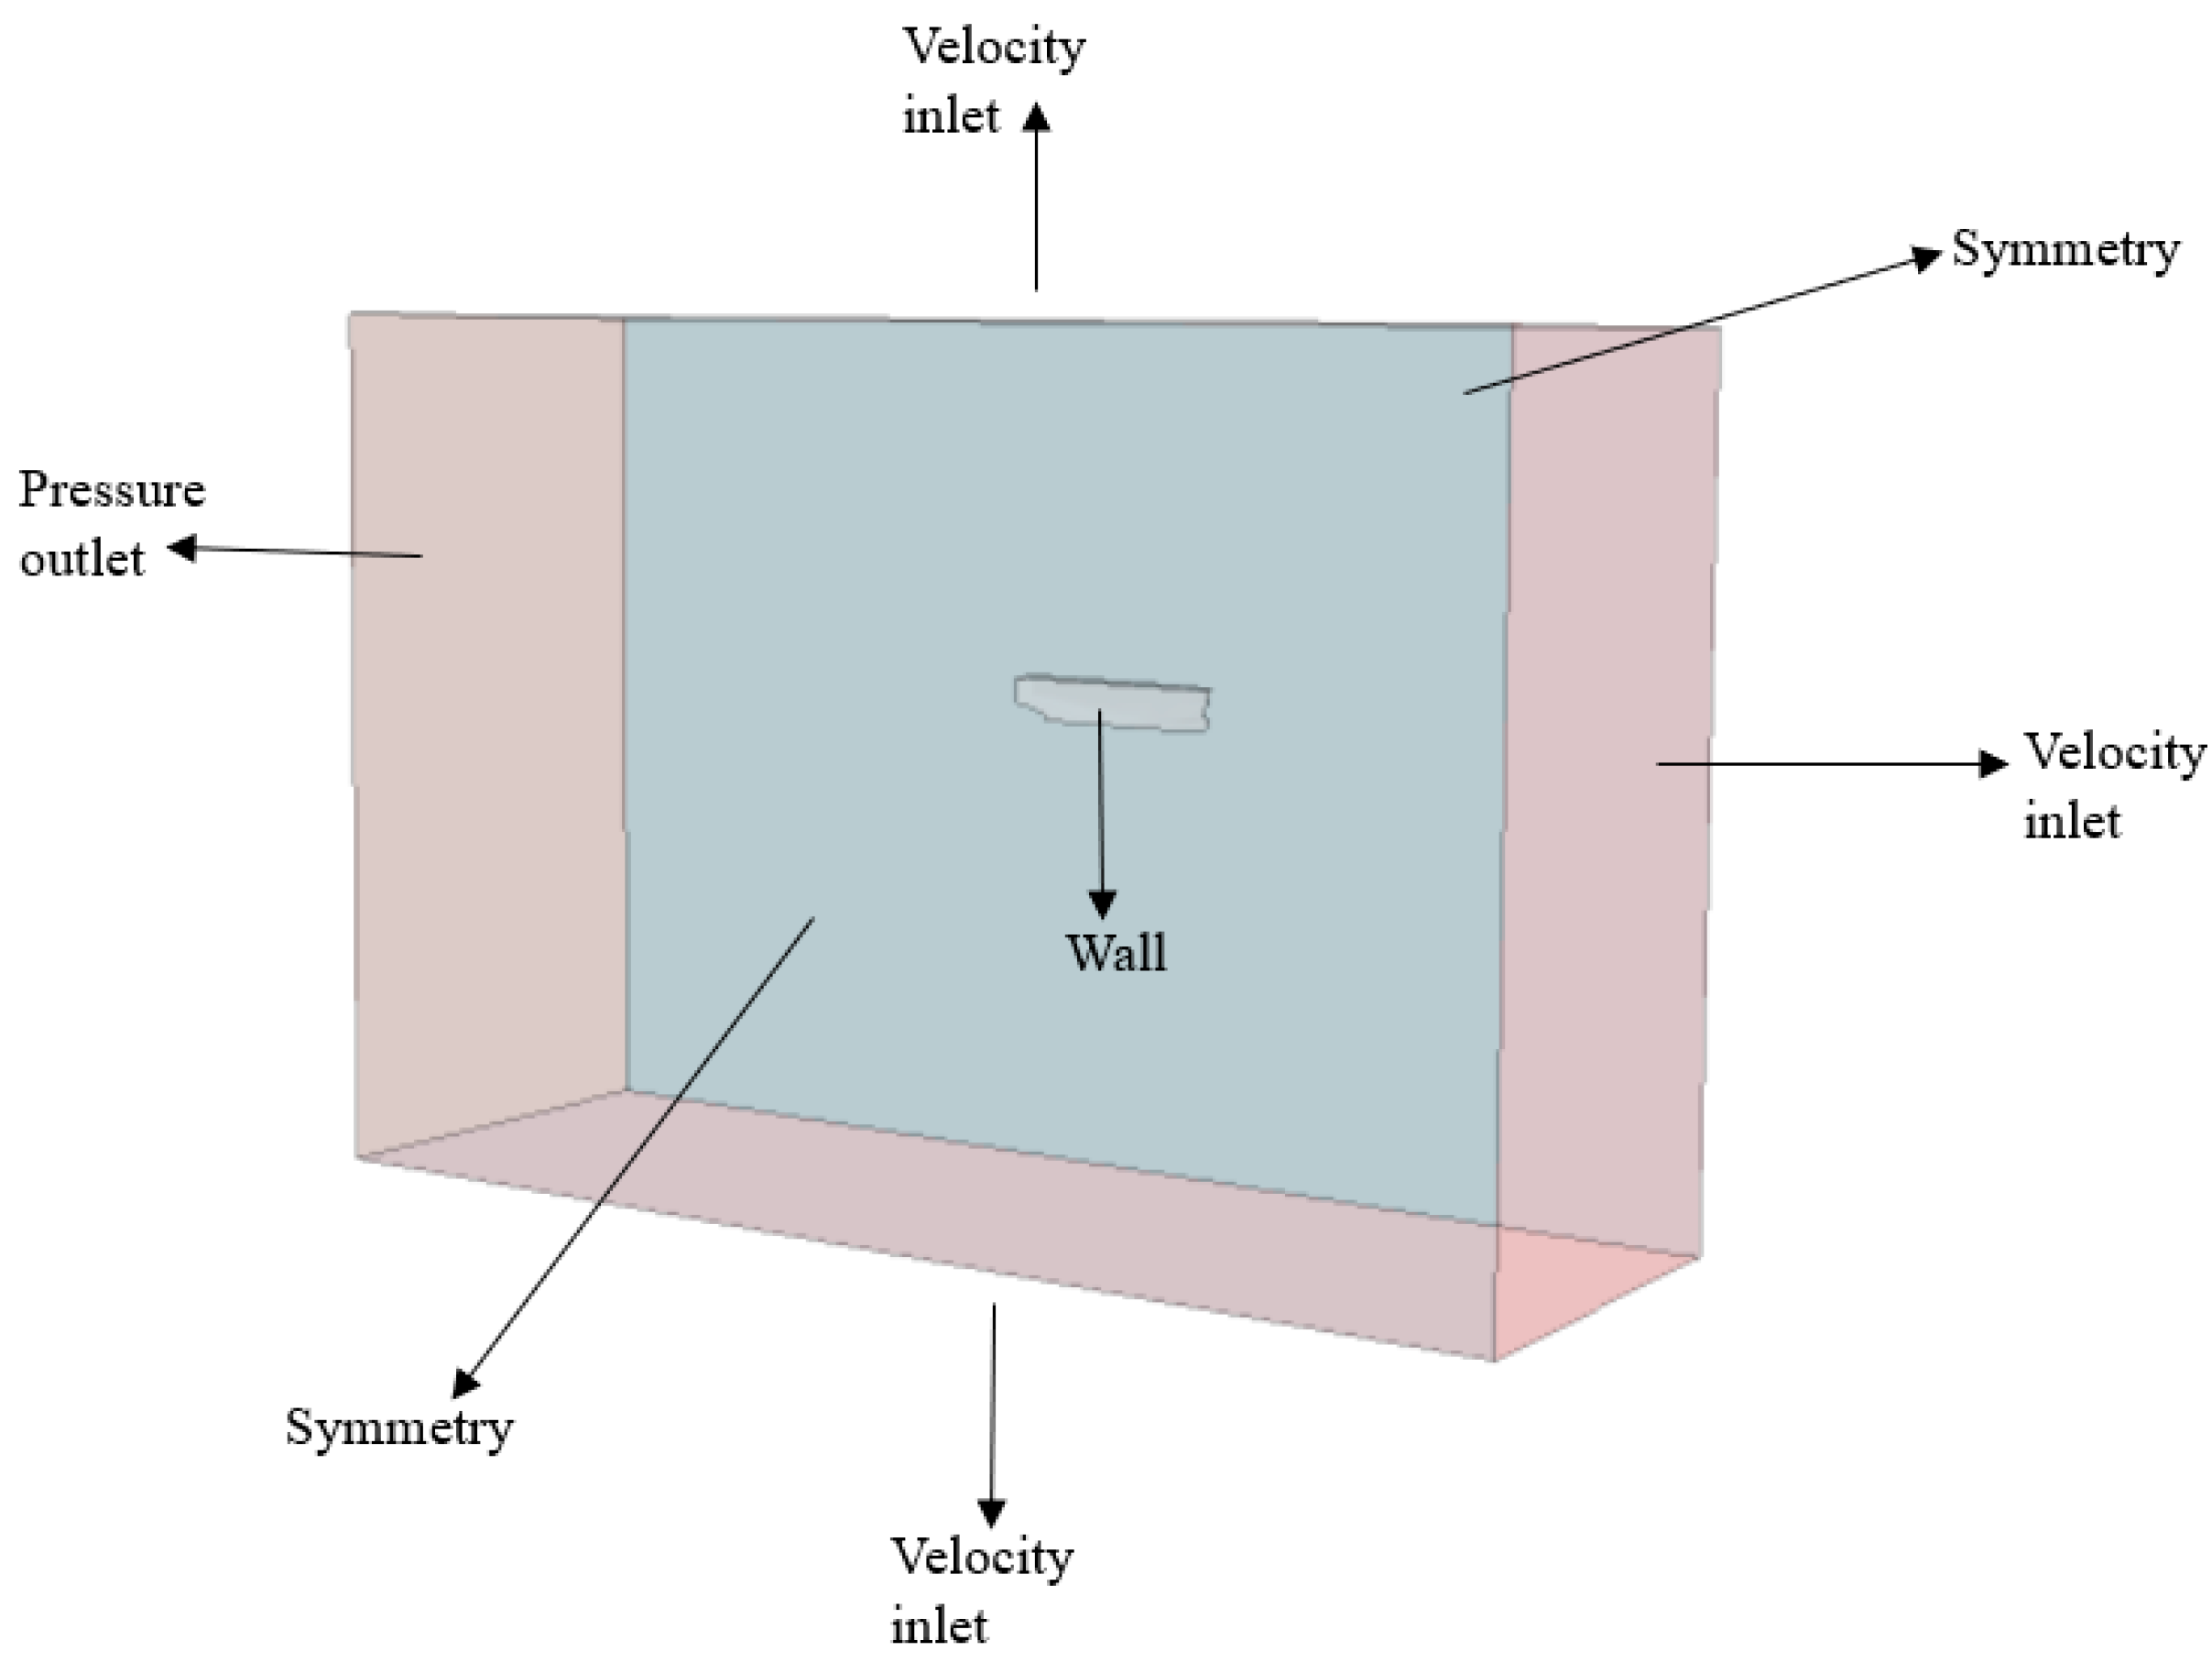
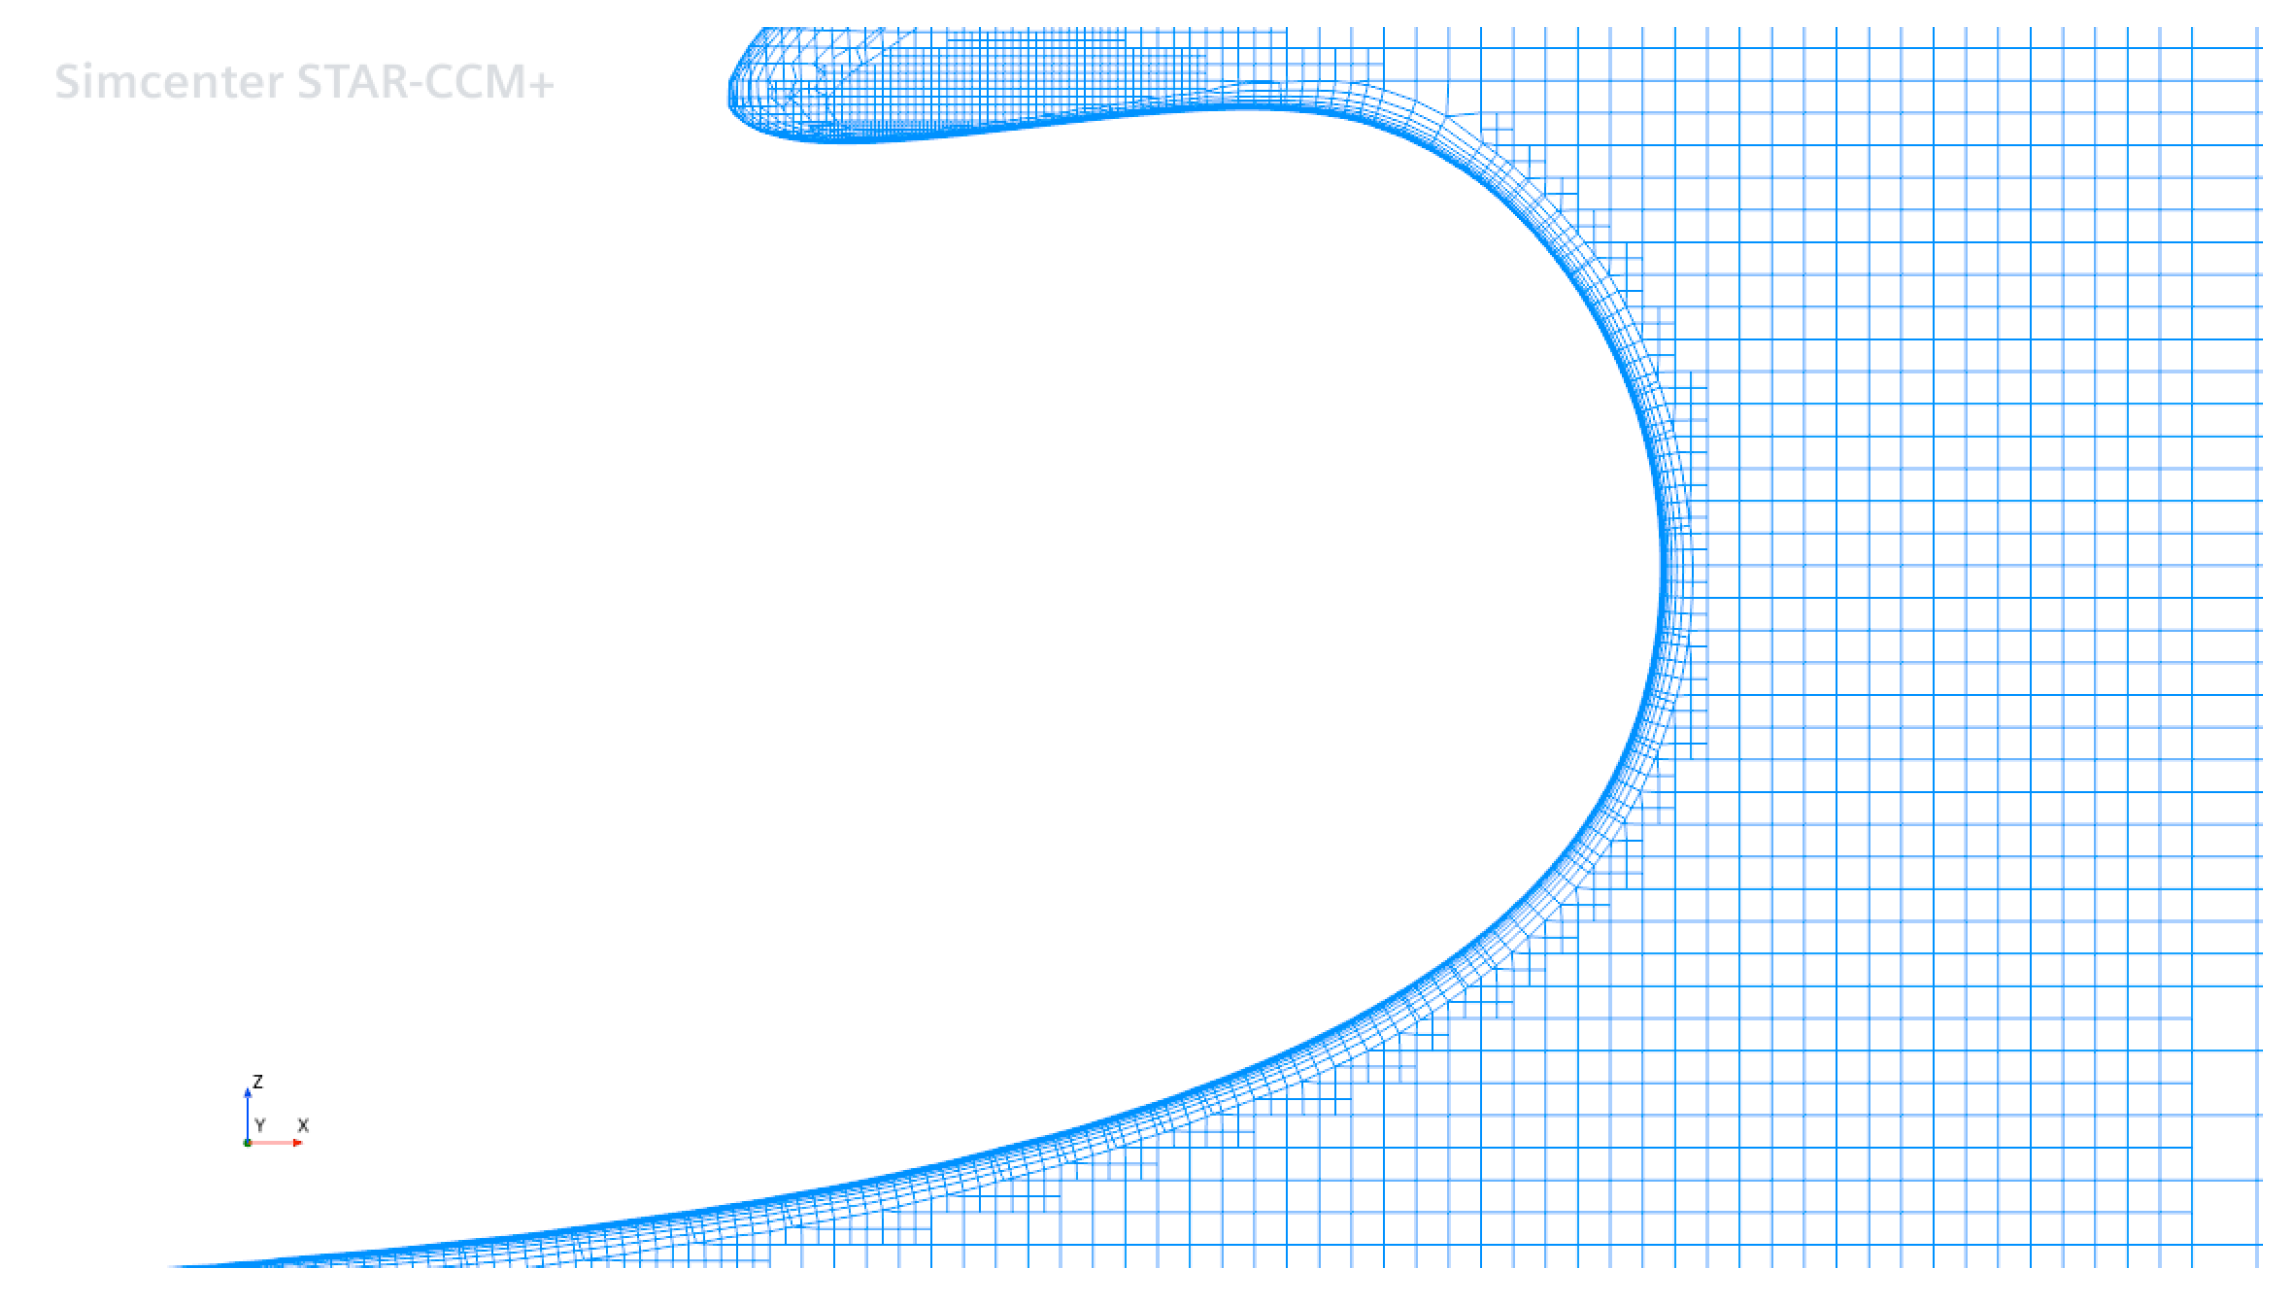
5. Numerical Setup
6. Verification Study
7. Results and Discussion
7.1. Verification Study Results
7.2. Impact of LCB Position on Total Resistance, Sinkage, and Trim
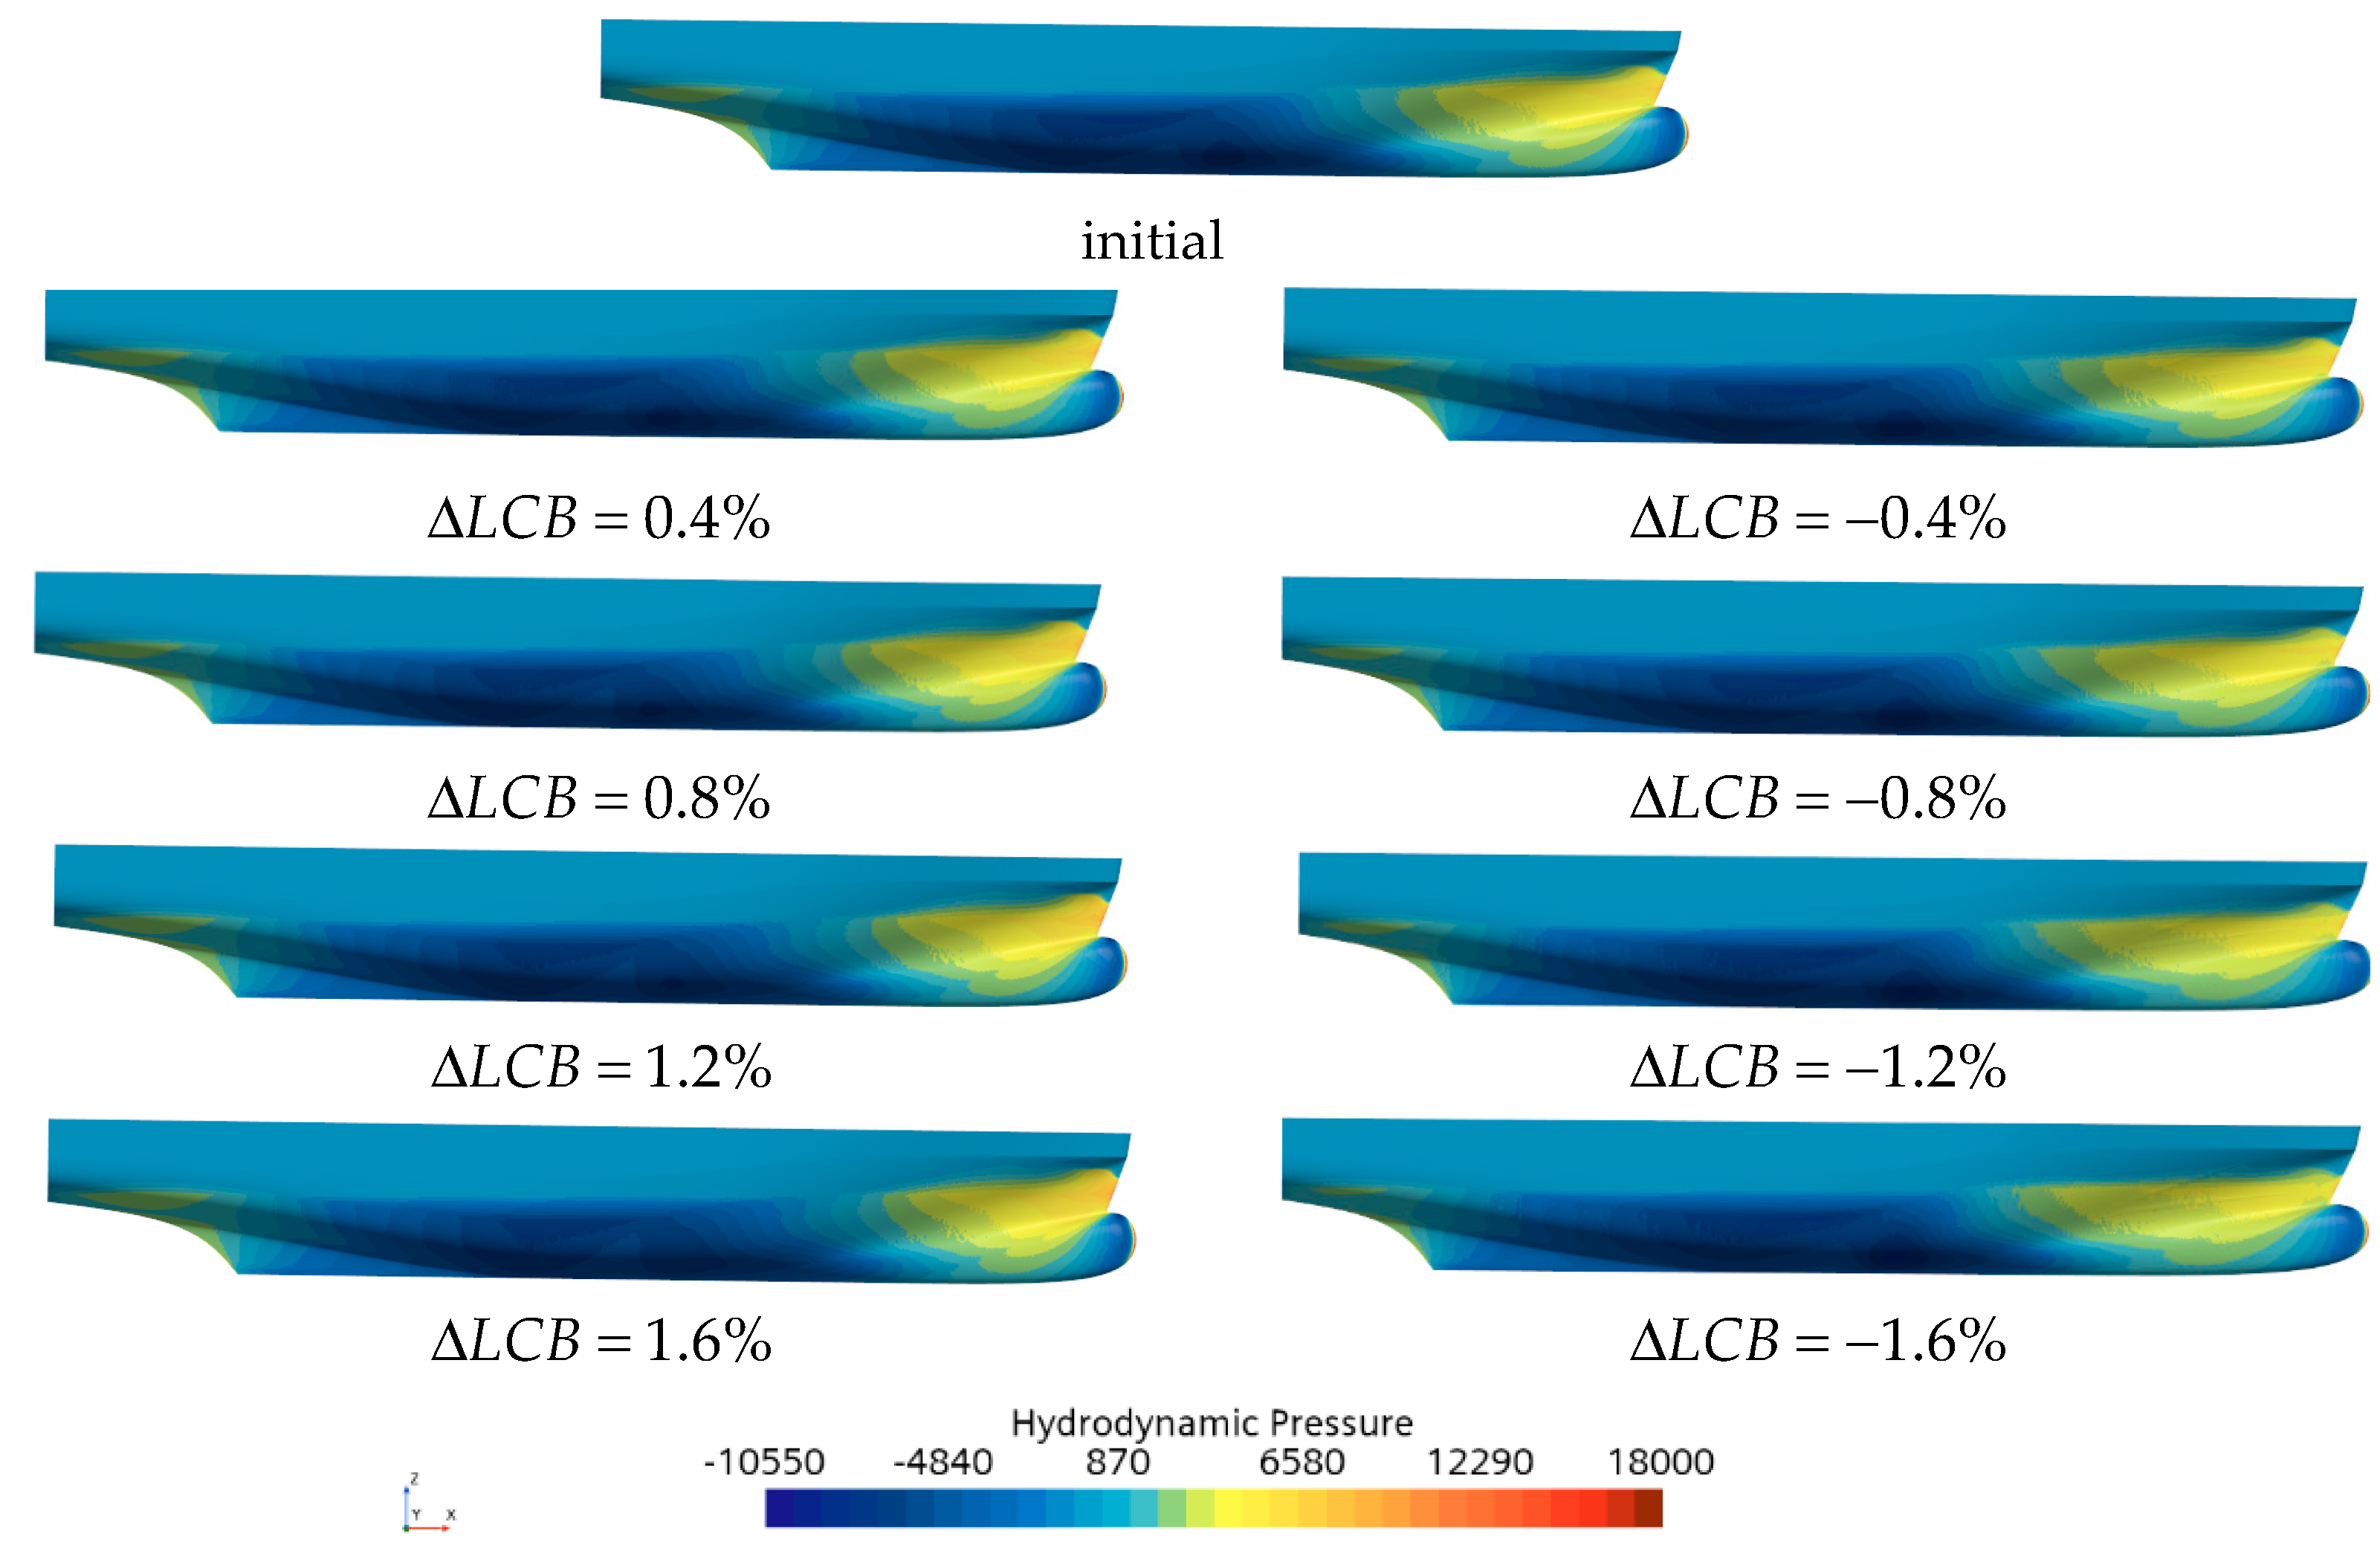
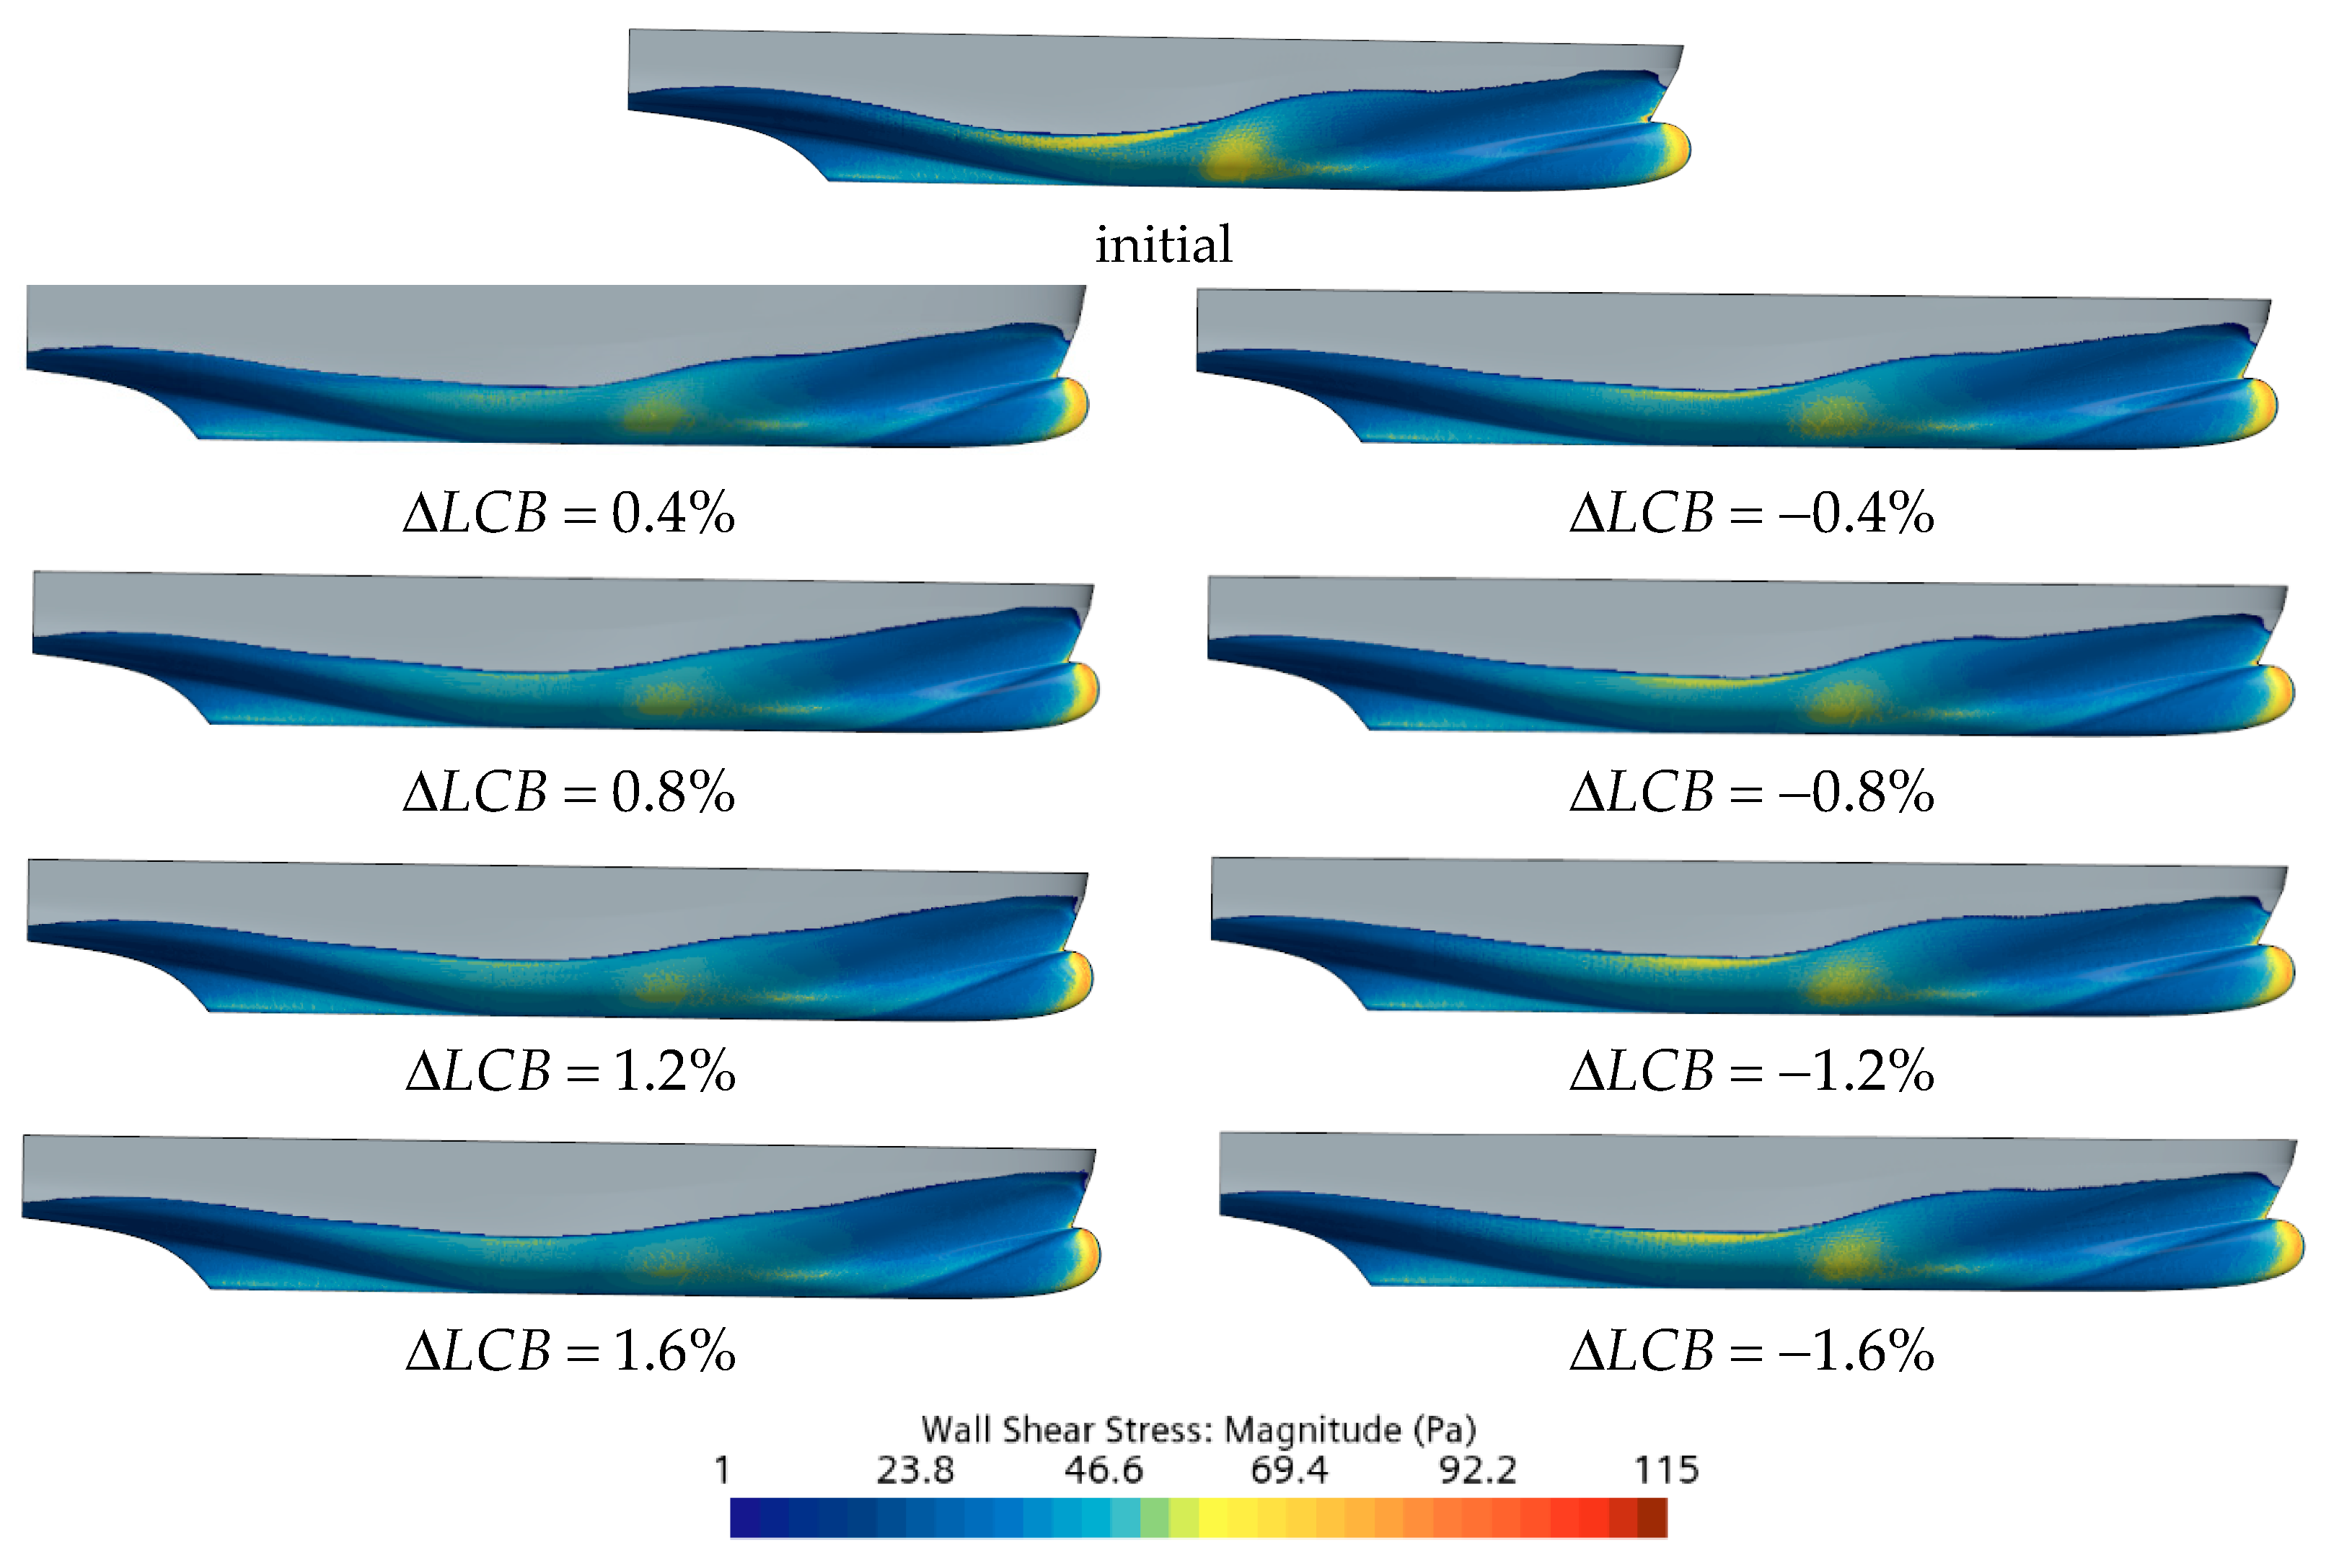
7.3. Wave Patterns, Hydrodynamic Pressure, and Tangential Stress Distributions
8. Conclusions
Author Contributions
Funding
Institutional Review Board Statement
Informed Consent Statement
Data Availability Statement
Acknowledgments
Conflicts of Interest
References
- International Maritime Organization. MEPC.203(62), Inclusion of Regulations on Energy Efficiency for Ships in MARPOL Annex VI. 2011. Available online: https://wwwcdn.imo.org/localresources/en/KnowledgeCentre/IndexofIMOResolutions/MEPCDocuments/MEPC.203(62).pdf (accessed on 2 October 2024).
- Xing, H.; Spence, S.; Chen, H. A comprehensive review on countermeasures for CO2 emissions from ships. Renew. Sustain. Energy Rev. 2020, 134, 110222. [Google Scholar] [CrossRef]
- Cheng, X.; Feng, B.; Liu, Z.; Chang, H. Hull surface modification for ship resistance performance optimization based on Delaunay triangulation. Ocean Eng. 2018, 153, 333–344. [Google Scholar] [CrossRef]
- Feng, Y.; Moctar, O.; Schellin, T.E. Parametric Hull Form Optimization of Containerships for Minimum Resistance in Calm Water and in Waves. J. Mar. Sci. Appl. 2021, 20, 670–693. [Google Scholar] [CrossRef]
- Degiuli, N.; Farkas, A.; Martić, I.; Zeman, I.; Ruggiero, V.; Vasiljević, V. Numerical and experimental assessment of the total resistance of a yacht. Brodogradnja 2021, 72, 61–80. [Google Scholar] [CrossRef]
- Nazemian, A.; Ghadimi, P. CFD-based optimization of a displacement trimaran hull for improving its calm water and wavy condition resistance. Appl. Ocean Res. 2021, 113, 102729. [Google Scholar] [CrossRef]
- Miao, A.; Zhao, M.; Wan, D. CFD-based multi-objective optimisation of S60 Catamaran considering Demihull shape and separation. Appl. Ocean Res. 2020, 97, 102071. [Google Scholar] [CrossRef]
- Zhao, C.; Wang, W.; Jia, P.; Xie, Y. Optimisation of hull form of ocean-going trawler. Brodogradnja 2021, 72, 33–46. [Google Scholar] [CrossRef]
- Zhang, S.; Zhang, B.; Tezdogan, T.; Xu, L.; Lai, Y. Computational fluid dynamics-based hull form optimization using approximation method. Eng. Appl. Comput. Fluid Mech. 2018, 12, 74–88. [Google Scholar] [CrossRef]
- Hou, S.; Zhang, Z.; Lian, H.; Xing, X.; Gong, H.; Xu, X. Hull shape optimization of small underwater vehicle based on kriging-based response surface method and multi-objective optimization algorithm. Brodogradnja 2022, 73, 111–134. [Google Scholar] [CrossRef]
- Chang, H.; Liu, Z.; Zhan, C.; Baiwei, F.; Cheng, X.; Zheng, Q. Sampling method for hull form optimization based on the morphing method and its application. Ocean Eng. 2023, 281, 114715. [Google Scholar] [CrossRef]
- Jambak, A.I.; Bayezit, I. Robust optimal control of a nonlinear surface vessel model with parametric uncertainties. Brodogradnja 2023, 74, 131–143. [Google Scholar] [CrossRef]
- Liu, X.; Zhao, W.; Wan, D. Hull form optimization based on calm-water wave drag with or without generating bulbous bow. Appl. Ocean Res. 2021, 116, 102861. [Google Scholar] [CrossRef]
- Tran, T.G.; Huynh Van, Q.; Kim, H.C. Optimization strategy for planing hull design. Int. J. Nav. Archit. 2022, 14, 100471. [Google Scholar] [CrossRef]
- Zha, L.; Zhu, R.; Hong, L.; Huang, S. Hull form optimization for reduced calm-water resistance and improved vertical motion performance in irregular head waves. Ocean Eng. 2021, 233, 109208. [Google Scholar] [CrossRef]
- Alvarado, D.R.; Paternina, L.A.; Paipa, E.G. Synthesis model for the conceptual design of inland cargo vessels to operate on the Magdalena river. Brodogradnja 2022, 73, 13–37. [Google Scholar] [CrossRef]
- Yu, Y.; Zhang, H.; Mu, Z.; Li, Y.; Sun, Y.; Liu, J. Trim and Engine Power Joint Optimization of a Ship Based on Minimum Energy Consumption over a Whole Voyage. J. Mar. Sci. Eng. 2024, 12, 475. [Google Scholar] [CrossRef]
- Pak, K.R.; Song, G.S.; Kim, H.J.; Son, H.J.; Park, H.G. Hull form design for resistance minimization of small-scale LNG bunkering vessels using numerical simulation. Int. J. Nav. Archit. 2020, 12, 856–867. [Google Scholar] [CrossRef]
- Xhaferaj, B. A Computer-Based Analysis to Study the Effect of LCB Position on Ship Resistance in the Early Design Stage: A Case Study with a Fishing Vessel Hull. Eur. J. Eng. Technol. Res. 2023, 8, 43–48. [Google Scholar] [CrossRef]
- Yu, L.; Ma, N.; Gu, X. On the mitigation of surf-riding by adjusting center of buoyancy in design stage. Int. J. Nav. Arch. Ocean Eng. 2017, 9, 292–304. [Google Scholar] [CrossRef]
- Ngoc, V.M.; Ha NT, H.; Ngoc, P.M.; Van Tung, D.; Hao, N.H.; Tu, T.N. Numerical Investigation on the Influence of Ship Hull Form Modification on Resistance of the 4600DWT Cargo Ship Using RANSE Method. IOP Conf. Series: Earth Environ. Sci. 2023, 1278, 012023. [Google Scholar] [CrossRef]
- Flow Ship Design d.o.o. Available online: https://www.flowship.eu/ (accessed on 6 September 2024).
- CAESES v.5.2. Available online: https://www.caeses.com/ (accessed on 6 September 2024).
- Grlj, C.G.; Degiuli, N.; Martić, I. Experimental and numerical assessment of the effect of speed and loading conditions on the nominal wake of a containership. Brodogradnja 2024, 75, 75405. [Google Scholar] [CrossRef]
- Grlj, C.G.; Degiuli, N.; Martić, I. The Impact of Numerical Parameters on the Resistance Characteristics of a Container Ship at the Model and Full Scale. J. Mar. Sci. Eng. 2023, 11, 1672. [Google Scholar] [CrossRef]
- Farkas, A.; Degiuli, N.; Martić, I. Assessment of hydrodynamic characteristics of a full-scale ship at different draughts. Ocean Eng. 2018, 156, 135–152. [Google Scholar] [CrossRef]
- ITTC Specialist Committee. Recommended procedures and Guidelines—Practical Guidelines for Ship CFD Applications. In Proceedings of the 26th International Towing Tank Conference, Rio de Janeiro, Brazil, 28 August–3 September 2011.
- ITTC Recommended Procedures and Guidelines. In Quality System Manual Recommended Procedures and Guidelines Procedure Uncertainty Analysis in CFD Verification and Validation; ITTC: Wuxi, China, 2017.


| Parameters | Symbol | Value |
|---|---|---|
| Length between perpendiculars | 23.73 m | |
| Breadth | 7.072 m | |
| Draught (summer load line) | 1.9 m | |
| Displacement mass | 168 t | |
| Longitudinal center of gravity | 10.111 m | |
| Vertical center of gravity | 3.69 m | |
| Longitudinal center of buoyancy | 10.111 m | |
| Vertical center of buoyancy | 1.174 m | |
| Prismatic coefficient | 0.57 | |
| Froude number | 0.388 |
| , N | 24,739 | 24,736 | 24,736 | −2.66 | 436.30 | −0.0061 | 0.8818 |
| Sinkage, m | −0.1990 | −0.1989 | −0.1995 | 0.0001 | −0.0006 | −0.1771 | −0.1539 |
| Trim, ° | 0.6267 | 0.6305 | 0.6238 | 0.0038 | −0.0066 | −0.5733 | 0.5284 |
| , N | 24,739 | 24,575 | 24,995 | −163.67 | 419.83 | −0.3899 | 0.8485 |
| Sinkage, m | −0.1990 | −0.1991 | −0.2074 | −0.0002 | −0.0082 | 0.0197 | −0.0020 |
| Trim, ° | 0.6267 | 0.6328 | 0.6017 | 0.0061 | −0.0311 | −0.1975 | 2.4824 |
| , N | 0.8818 | 0.8485 | 1.2238 |
| Sinkage, m | −0.1539 | −0.0020 | 0.1539 |
| Trim, ° | 0.5284 | 2.4824 | 2.5380 |
| 1.6 | 10.487 | 24,879 | 0.57 |
| 1.2 | 10.393 | 24,227 | −2.07 |
| 0.8 | 10.299 | 24,441 | −1.20 |
| 0.4 | 10.205 | 24,216 | −2.11 |
| 0 (initial) | 10.111 | 24,739 | / |
| −0.4 | 10.017 | 24,787 | 0.20 |
| −0.8 | 9.923 | 25,301 | 2.27 |
| −1.2 | 9.829 | 25,523 | 3.17 |
| −1.6 | 9.735 | 25,847 | 4.48 |
| 1.6 | 17,463 | 1.12 | 7418 | −0.60 |
| 1.2 | 16,776 | −2.86 | 7451 | −0.17 |
| 0.8 | 16,974 | −1.71 | 7467 | 0.04 |
| 0.4 | 16,762 | −2.94 | 7456 | −0.10 |
| 0 (initial) | 17,270 | / | 7463 | / |
| −0.4 | 17,306 | 0.20 | 7483 | 0.26 |
| −0.8 | 17,819 | 3.18 | 7484 | 0.27 |
| −1.2 | 18,032 | 4.41 | 7489 | 0.34 |
| −1.6 | 18,396 | 6.52 | 7452 | −0.16 |
| 1.6 | −0.1937 | −2.65 | 0.77 | 22.71 |
| 1.2 | −0.1955 | −1.73 | 0.75 | 20.42 |
| 0.8 | −0.1965 | −1.24 | 0.70 | 11.86 |
| 0.4 | −0.1958 | −1.61 | 0.67 | 7.68 |
| 0 (initial) | −0.1990 | / | 0.63 | / |
| −0.4 | −0.2004 | 0.72 | 0.59 | −6.45 |
| −0.8 | −0.2014 | 1.23 | 0.53 | −15.04 |
| −1.2 | −0.2036 | 2.31 | 0.50 | −20.98 |
| −1.6 | −0.2053 | 3.17 | 0.44 | −30.36 |
| 10 | 11,425 | −0.1416 | 0.6093 |
| 11.5 | 24,216 | −0.1958 | 0.6748 |
| 12 | 32,765 | −0.2173 | 0.5465 |
Disclaimer/Publisher’s Note: The statements, opinions and data contained in all publications are solely those of the individual author(s) and contributor(s) and not of MDPI and/or the editor(s). MDPI and/or the editor(s) disclaim responsibility for any injury to people or property resulting from any ideas, methods, instructions or products referred to in the content. |
© 2024 by the authors. Licensee MDPI, Basel, Switzerland. This article is an open access article distributed under the terms and conditions of the Creative Commons Attribution (CC BY) license (https://creativecommons.org/licenses/by/4.0/).
Share and Cite
Martić, I.; Degiuli, N.; Grlj, C.G.; Borčić, K.; Andrišić, J.; Lalović, I. Impact of the Longitudinal Center of Buoyancy on the Total Resistance of a Passenger Ship. J. Mar. Sci. Eng. 2024, 12, 1749. https://doi.org/10.3390/jmse12101749
Martić I, Degiuli N, Grlj CG, Borčić K, Andrišić J, Lalović I. Impact of the Longitudinal Center of Buoyancy on the Total Resistance of a Passenger Ship. Journal of Marine Science and Engineering. 2024; 12(10):1749. https://doi.org/10.3390/jmse12101749
Chicago/Turabian StyleMartić, Ivana, Nastia Degiuli, Carlo Giorgio Grlj, Kornelija Borčić, Josip Andrišić, and Igor Lalović. 2024. "Impact of the Longitudinal Center of Buoyancy on the Total Resistance of a Passenger Ship" Journal of Marine Science and Engineering 12, no. 10: 1749. https://doi.org/10.3390/jmse12101749
APA StyleMartić, I., Degiuli, N., Grlj, C. G., Borčić, K., Andrišić, J., & Lalović, I. (2024). Impact of the Longitudinal Center of Buoyancy on the Total Resistance of a Passenger Ship. Journal of Marine Science and Engineering, 12(10), 1749. https://doi.org/10.3390/jmse12101749