Article

Multi-Objective Optimization Design of a Mooring System Based on the Surrogate Model

1
CCCC First Harbour Consultants Co., Ltd., Tianjin 300220, China
2
State Key Laboratory of Coastal and Offshore Engineering, Dalian University of Technology, Dalian 116024, China
*
Author to whom correspondence should be addressed.
J. Mar. Sci. Eng. 2024, 12(10), 1853; https://doi.org/10.3390/jmse12101853
Submission received: 1 September 2024 / Revised: 6 October 2024 / Accepted: 15 October 2024 / Published: 17 October 2024

Abstract

:
As the development of floating offshore wind turbines (FOWTs) progresses from offshore to deeper sea, the demands on mooring systems to ensure the safety of the structure have become increasingly stringent, leading to a concomitant rise in costs. A parameter optimization method for the mooring system of FOWTs is proposed, with the mooring line length and anchor radial spacing as the optimization variables, and the minimization of surge, yaw, and nacelle acceleration as the objectives. A series of mooring system configuration samples are generated by the fully analytical factorial design method, and the open source program OpenFAST is employed to simulate the global responses in the time domain. To enhance the efficiency of the optimization process, a multi-objective evolutionary algorithm, Non-dominated Sorting Genetic Algorithm II (NSGA-II), is utilized to find the Pareto-optimal solutions, alongside a Kriging model, which serves as a surrogate model for the FOWTs. This approach was applied to an IEC 15MW FOWT to demonstrate the optimization procedure. The results indicate that the integration of the genetic algorithm and the surrogate model achieved rapid convergence and high accuracy. Through this optimization process, the longitudinal motion response of FOWTs is reduced by a maximum of 6.46%, the yaw motion by 2.87%, and the nacelle acceleration by 11.55%.

1. Introduction

With the increasing emphasis on offshore wind power, the scale of offshore wind farms continues to expand, and the development of wind power is gradually transitioning from shallow to deep waters to harness more wind energy resources. As a critical subsystem of FOWTs, an unsuccessful design of mooring systems could result in the redundancy of materials, excessive drift motion of the floater, or even accidental collisions with adjacent offshore structures. Therefore, it is imperative to identify a solution that ensures the safe and reliable operation of the entire system, thereby promoting offshore wind power generation [1].
Mooring system design entails the consideration of various factors, including the composition of mooring lines, the type of platform, and environmental conditions. The system’s capacity to maintain the platform’s position is critical, as it significantly impacts the integrity of the risers and the overall stability of the floating platform [2]. There are several parameters that should be taken into consideration for the design of a mooring system. For example, anchor types, the mooring line strength, anchor positions, the seabed pattern, environmental conditions, and the platform life [3]. The selection of parameter values determines the capability of the mooring system. Meanwhile, the choice of methods for mooring system design and optimization dictates the effectiveness and efficiency of the related research.
Sclavounos et al. [4] conducted a pioneering parametric design study of the FOWT and its mooring system using a coupled frequency domain (FD) model. This model is a six-degrees-of-freedom (DoF) platform model, where the contributions of the mooring lines and the wind turbine are modeled as additional inertia, damping, and stiffness matrices. Philippe et al. [5] and Karimi et al. [6] also proposed similar models. Karimi et al. [7] conducted FD-based multi-objective optimization on a 5 MW FOWT, identifying the Pareto front that minimized platform cost while maximizing wind turbine performance. Brommundt et al. [8] used a FD model to optimize the mooring system by minimizing the line length and the cost. Bruschi et al. [9] and Barbanti et al. [10] investigated the optimal mooring weight mass and position with the objective of minimizing the platform response. The above researchers all utilized frequency-domain analysis methods to design efficient and reliable mooring systems, which improved the overall performance of floating wind turbines. However, FD models are limited in their ability to account for nonlinear effects, leading to optimization results that do not satisfy the requirements [11].
Additionally, some scholars have also conducted mooring optimization based on time-domain models. Mahdi et al. [12] developed a genetic algorithm for mooring system optimization using a time-domain analysis tool to capture the nonlinear characteristics. Bruno et al. [13] optimized mooring systems using a PSO algorithm based on a fully coupled nonlinear time-domain model of the FPSO–mooring–riser, providing valuable references for engineering practice. In this optimization process, fully nonlinear time-domain simulations are computationally expensive, significantly increasing CPU costs.
Surrogate models can effectively approximate numerical analysis results and address the challenge of balancing accuracy and efficiency. They capture the relationships between the objective or constraint functions and the design variables using simplified equations. Surrogate models typically require only a limited number of costly numerical analyses, which can greatly reduce the computational effort needed to find the optimal design. Consequently, this approximation method has been extensively utilized in engineering design and optimization to reduce the computational burden [14,15]. In recent years, some scholars have begun to use surrogate models to optimize the design of FOWTs. Zhang et al. [16] and Zhang et al. [17] employed a radial basis neural network algorithm to construct a surrogate model as an alternative to the fully coupled computational model, based on three-dimensional potential flow theory using AQWA and OpenFAST. Sun et al. [18] developed a Kriging surrogate model for the rapid geometric design of friction ring dampers (FRDs) with complex geometries. Thapa et al. [19] and Mao et al. [20] used a support vector machine with a grid-search-optimized mixed kernel method (SVM-GSM) to develop a surrogate model, which significantly reduces the computational time required for optimization analysis.
In addition, the accuracy and cost of multi-objective optimization for mooring systems also depend on the optimization algorithm used. Optimization techniques are generally divided into two main categories: gradient-based algorithms and metaheuristic algorithms. Gradient-based algorithms are classical approaches that effectively solve problems represented by differentiable objective functions. However, they tend to struggle with real-world scenarios that are non-differentiable, discontinuous, nonlinear, or multimodal. One way to apply gradient-based algorithms is by simplifying numerical models or analytical methods, though this can lead to discrepancies from actual outcomes [21,22]. Metaheuristic algorithms, in contrast, do not depend on the structural information of the objective function and are highly effective in solving complex engineering optimization problems. The core concept of metaheuristic algorithms is designing intelligent, iterative search processes that mimic behaviors observed in biology, nature, or society, which is why they are often referred to as intelligent optimization algorithms [23]. Examples of metaheuristic algorithms include genetic algorithms, differential evolution algorithms, and particle swarm optimization algorithms, all of which have been successfully applied to address engineering optimization challenges. For a detailed review of the specific applications of these optimization algorithms, please refer to references [24,25,26].
Non-dominated Sorting Genetic Algorithm II (NSGA-II), a major subset of metaheuristic algorithms, is one of the most widely used intelligent optimization algorithms worldwide. It is based on genetic algorithms and achieves multi-objective optimization through non-dominated sorting, crowding distance calculation, and an elitism mechanism. NSGA-II is highly effective in handling complex optimization problems, particularly in situations where there are conflicting objective functions. It is commonly applied in fields such as engineering design, resource allocation, and other areas where balancing multiple optimization objectives is critical.
Currently, research on the mooring systems of FOWTs lacks a simple and effective optimization method. Considering the accuracy and cost of optimization, this paper proposes a method that combines a Kriging-based surrogate model with a genetic algorithm for parameter optimization of mooring systems. In this study, we conducted optimization of the mooring system for the IEA 15MW semi-submersible FOWT. Multi-objective optimization was conducted with the mooring line length and anchor radial spacing as the optimization variables and the minimization of surge, yaw, and nacelle acceleration of FOWTs as the optimization objectives. Global responses calculations were performed using OpenFAST 11.0 software, and a surrogate model was constructed using the Kriging algorithm. The genetic algorithm was then used to optimize the mooring line parameters, yielding optimal values for each parameter.
The present paper is structured as follows. In Section 2, the relevant theories are introduced. Section 3 introduces the parameters of FOWTs and the optimization functions. Section 4 describes the construction of the surrogate model and the optimization results. Section 5 offers concluding remarks.

2. Surrogate Models for the Optimization of FOWTs

In the fully coupled time-domain model, the dynamic response of FOWTs needs to be solved iteratively by the power equation. In contrast, a surrogate model bypasses this iterative process by capturing the nonlinear mapping relationship between the structural parameters of FOWTs and their power response. By leveraging surrogate models, continuous optimization of FOWTs within the design space becomes both feasible and efficient.

2.1. Kriging Surrogate Modeling

2.1.1. Kriging Algorithm

The surrogate model uses the approximation function y ^ = f ^   x , ω to replace the complex mapping relationship f x , y between the variable x and the outcome y , where ω is a parameter that determines the exact state of the model. Using N sample points to build the approximation function can be written as follows:
y ^ = f ^   x , ω = ω T Ψ = i = 1 N w i ψ x x i
where ψ x x i is the basis function describing the correlation between any point x in the design space and the first i sample point x i .
The Kriging model is employed to build the surrogate model [27]. The Kriging neural network algorithm uses the basis function ψ = e j = 1 n θ j * x j i x j P j . The correlation between any two of the N sample points, x p and x q , is expressed using Equation (2):
c o r Y x p , Y x q = e j = 1 n θ j * x j p x j q P j
where n is the dimension of the random variable, and θ and P are parameters that adjust the smoothness of the basis functions [28]. P 1 , 2 . The value of θ can be obtained by searching for the maximum value of the likelihood function of y when the dimensionality of the variable is low.
  L = e y 1 μ T Ψ 1 y 1 μ 2 σ 2 2 π σ 2 n 2 Ψ 1 2
Ψ = c o r Y x 1 , Y x 1 c o r Y x 1 , Y x N c o r Y x N , Y x 1 c o r Y x N , Y x N
where μ and σ are the variances and means of the sample points. Ψ is the correlation matrix between the N sample points at ω = Ψ 1 y . The covariance matrix of the sample point response values can be written as follows:
c o v Y , Y = σ Y 2 Ψ
where σ Y 2 is the variance of the response value at the sample point. Based on the correlation matrix, the response value y ^ at unknown point x can be obtained using the Kriging surrogate model with known values of θ and P , and the correlation vector between the predicted and sample points is the following:
ψ = c o r Y x 1 , Y x c o r Y x n , Y x = ψ 1 ψ n
Based on this, the correlation matrix of the augmentation can be written as follows:
Ψ ˜ = Ψ ψ ψ T 1
When replacing the original correlation matrix with the augmented correlation matrix, the likelihood function of the augmented data can be obtained through a series of calculations:
l n L = 1 2 σ ^ 2 1 ψ T Ψ 1 ψ y ^ μ ^ 2 + ψ T Ψ 1 y 1 μ ^ σ ^ 1 ψ T Ψ 1 ψ y ^ μ ^
This is a quadratic function on y ^ whose maximum value is easily obtained. The maximum likelihood estimate (MLE) of y ^ is as follows:
y ^ = μ ^ + ψ T Ψ 1 y I μ ^
where μ ^ and σ ^ 2 are maximum likelihood estimates of the mean and variance μ and σ 2 of the sample points.
μ ^ = l T Ψ 1 y 1 T Ψ 1 1
σ ^ 2 = y 1 μ T Ψ 1 y 1 μ n

2.1.2. Surrogate Modeling

(1) After determining the design variables in the optimization problem, full analytic factor sampling is used in the experimental design. The objective is to generate a certain number of sample points distributed in the design space to obtain a comprehensive characterization of the model response.
(2) Basis for Numerical Modeling
The numerical model is then constructed based on the mooring configurations obtained from the design variables at each sampling point. A series of time-domain simulations of the FOWT are performed to calculate target values, such as platform offsets.
(3) Kriging Surrogate Model
A Kriging surrogate model is developed using the sample points from step (1) as inputs and the corresponding target values from step (2) as outputs. This model establishes the functional relationship between the input and output data, thereby facilitating a more efficient search for the optimal solution in subsequent steps.

2.2. Global Response Calculation of FOWTs

A floating wind turbine system is a complex multi-body system including blades, a nacelle, tower, floating platform, and mooring system. The fully coupled motion equation for the FOWT in the time domain is as follows [29]:
M k j   x j .. = F j ( x j , x j . , t )
F j ( x j , x j . , t ) = F j rw + F j tw + F j w + F j s + F j c
where x j , x j . , and x j .. represent the displacement, velocity, and acceleration; M k j is the mass matrix; and F j is the force matrix, which includes the aerodynamic force on wind turbine F j rw , aerodynamic force on tower F j tw , wave force on the platform F j w , hydrostatic restoring force F j s , and current force F j c .
(1)
Aerodynamic Load
The aerodynamic loads on wind turbine F j w are calculated using the Blade Element Momentum (BEM) theory. This involves defining the axial induction factor a and the tangential induction factor a , and iteratively computing the aerodynamic loads at each radial position until the values of a and a converge. From this, the overall thrust T and torque of the wind turbine P are determined.
T = 0 R d T ( r ) = 4 π ρ air B u 0 2 0 R a ( 1 a ) r d r
P = 0 R d M ( r ) · ω = 4 π ρ air B u 0 ω 2 0 R a · ( 1 a ) r 3 d r
where B represents the number of blades, and ρ air represents the air density.
(2)
Fluid Loads
The load of fluid on the floating wind turbine platform can be divided into F j w , F j s , and F j c .
Using the three-dimensional potential flow theory, the wave force F j w can be separated into the wave excitation force F j exc that arises from the incident potential Φ I and diffraction potential Φ D , and the radiation force F j R that is generated by the radiation potential Φ R in the frequency domain.
F j w ( ω ) = ρ water ( Φ I + Φ D + Φ R ) t n j d S
In the time domain, the wave excitation force is decomposed into the first-order wave force F j exc ( 1 ) and second-order wave force F j exc ( 2 ) . These forces are obtained by convolving the impulse response function h with the wave elevation ζ .
F j exc ( 1 ) = 1 2 π + h j ( 1 ) ( t τ 1 ) ζ ( τ 1 ) d τ 1
F j exc ( 2 ) ( t ) = 1 4 π 2 + h j ( 2 ) ( t τ 1 , t τ 2 ) ζ ( τ 1 ) ζ ( τ 2 ) d τ 1 d τ 2
The hydrostatic restoring force F j s can be calculated from the hydrostatic stiffness.
(3)
Mooring Line Tension
The lumped mass method is generally used for modeling the mooring line [30,31]. The motion equation of each mooring line node is as follows:
M i a i = F T i F T i 1 + F D i + F A i W i
F D i = 1 2 ρ water l C D D u N | u N |
F A i = ρ water C M V ( a i )
where a i is the node acceleration vector, M i is the mass of the node, W i represents the gravity acting on the node, F T i and F T i 1 are the tensions in the mooring line elements i and i 1 , respectively, F A i and F D i correspond to the fluid inertial force and drag force at the node, D is diameter of the mooring line, C D is the drag coefficient of the mooring line, and C M is added mass coefficient of the mooring line.

2.3. NSGA-II Algorithm

The NSGA-I algorithm is a computational model established by simulating the mechanism of evolution theory and genetics, with good convergence and diverse operation results, solving multi-objective optimization problems in many fields. It has also been used for algorithmic improvement and comparative experiments many times, and it has now become one of the most classical algorithms of MOEAs.
This study used the NSGA-II algorithm developed by Deb [32]. The method uses a genetic algorithm to perform the search, using mutual dominance relationships and spacing between design alternatives to drive the genetic process. The entire population is collated and sorted by dominance, and a penalty function is used to give the search a wider range. Building an optimization model based on the NSGA-II algorithm consists of the following steps:
(1) Define the objective function and decision variables: first specify the objective function that the optimization problem requires to be maximized or minimized, as well as the range and constraints of the decision variables.
(2) Initialization population: randomly generate a certain number of initial solutions as the initial population.
(3) Genetic operations: populations are iteratively updated through genetic operations such as selection, crossover, and mutation; selection operations are performed based on non-dominated ordering and crowding distances to ensure that the selected parents are of good quality and diversity.
(4) Non-dominated sorting and crowding distance calculation: in each generation iteration, non-dominated sorting and crowding distance calculation are performed on the population to select the best individuals for the next generation.
(5) Termination condition: repeat the above iterative process until the termination condition is satisfied, e.g., a preset number of iterations is reached or the quality of the solution meets the requirements.
The multi-objective optimization problem consists of design variables, an objective function, and constraints, the expression of which is shown in Equation (22):
min f x = f 1 , f 2 , f 3 , , f m x = x 1 , x 2 , x 3 , , x n s.t. g i x 0   i = 1 , , k h i x = 0   i = 1 , , h
where the function f x is an m dimensional multi-objective function. x denotes a design variable with an n dimensional array. g i and h j denote the i th inequality constraint and the j th equality constraint, respectively.

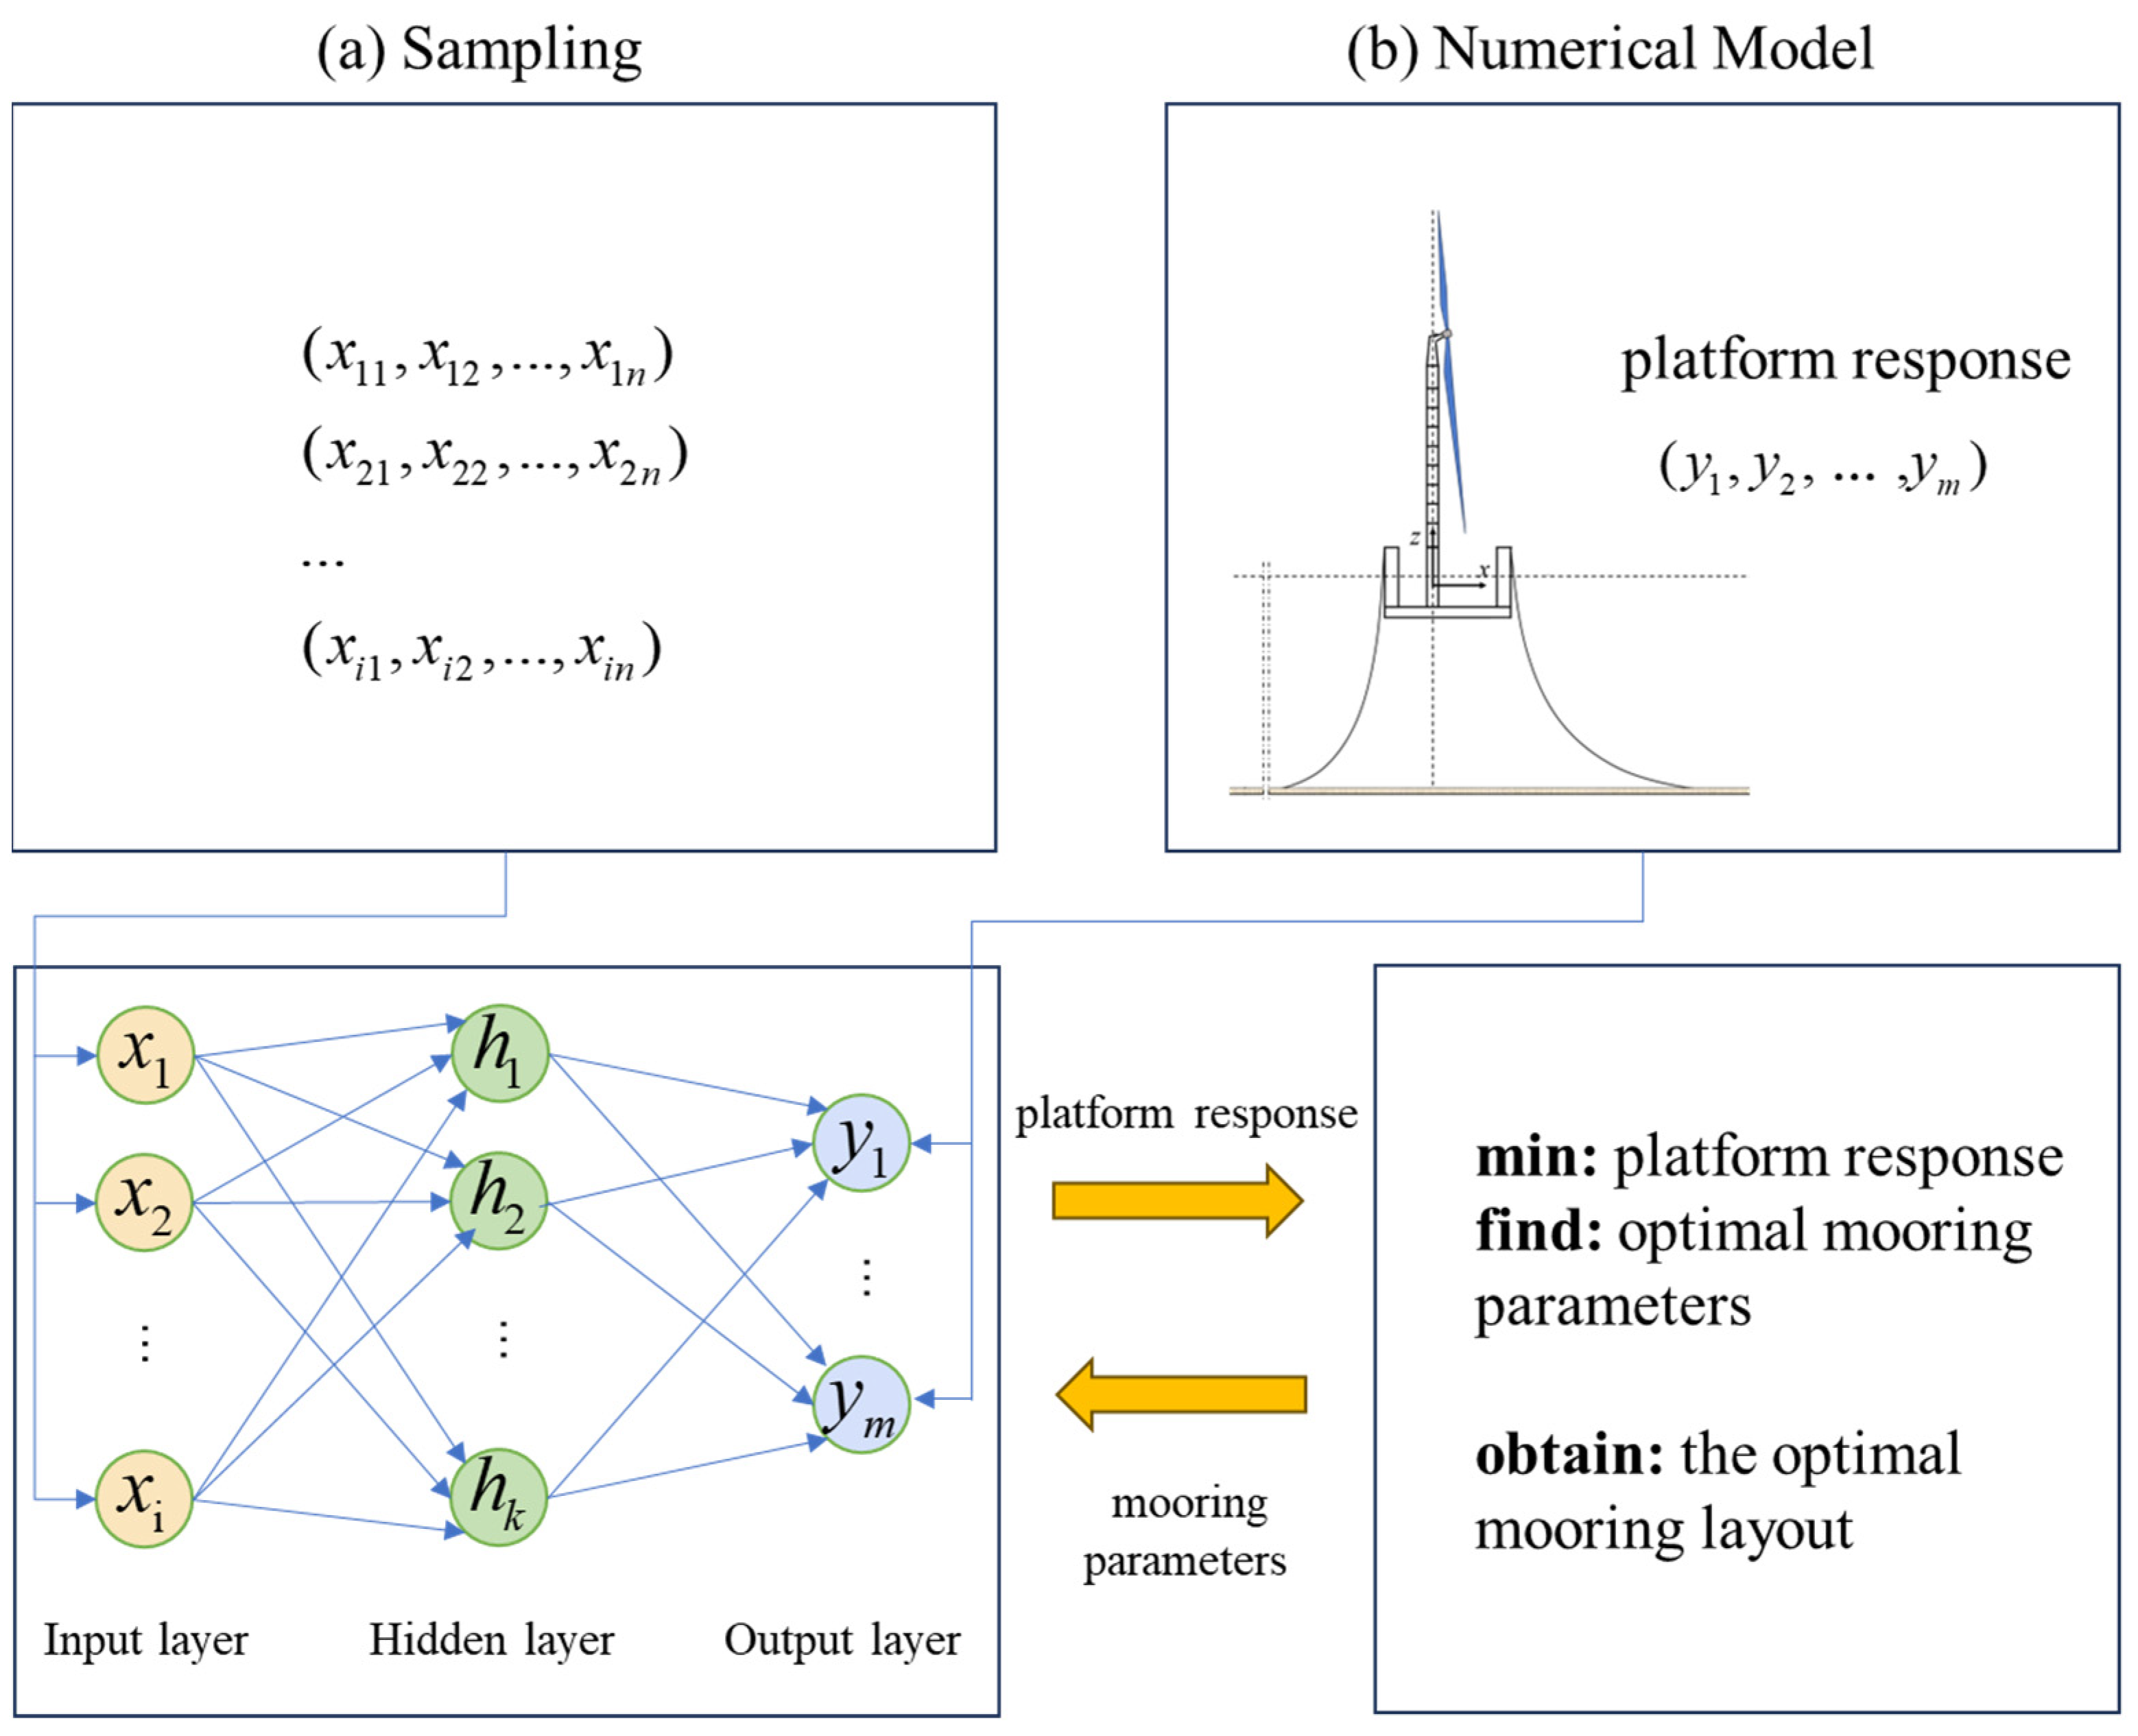
2.4. Optimization Process Based on the Surrogate Model

As shown in Figure 1, the surrogate model optimization process is as follows.
(a)
Sampling
After determining the design variables in the optimization problem, full analytic factor sampling is used in the experimental design. The objective is to generate a certain number of sample points distributed in the design space, to obtain a comprehensive characterization of the model response.
(b)
Numerical Modeling
The numerical model performs a series of numerical modeling steps of the moored floating platform in the time domain to compute the target values based on the mooring configurations obtained from the design variables at the sample points.
(c)
Kriging Surrogate Modeling
Taking the sample points in step (a) as inputs and the target values in step (B) as outputs, the Kriging surrogate model is established, and the smoothing parameter of the modified model basis function in the Kriging surrogate model is adjusted to determine the functional relationship between the input and output data, thereby accelerating the subsequent search for the optimal solution.
(d)
Mooring System Optimization
A Pareto solution for multi-objective optimization of mooring systems is obtained by combining the Kriging surrogate model with the NSGA-II algorithm.

3. Case Study

3.1. The Parameters of the FOWT Model

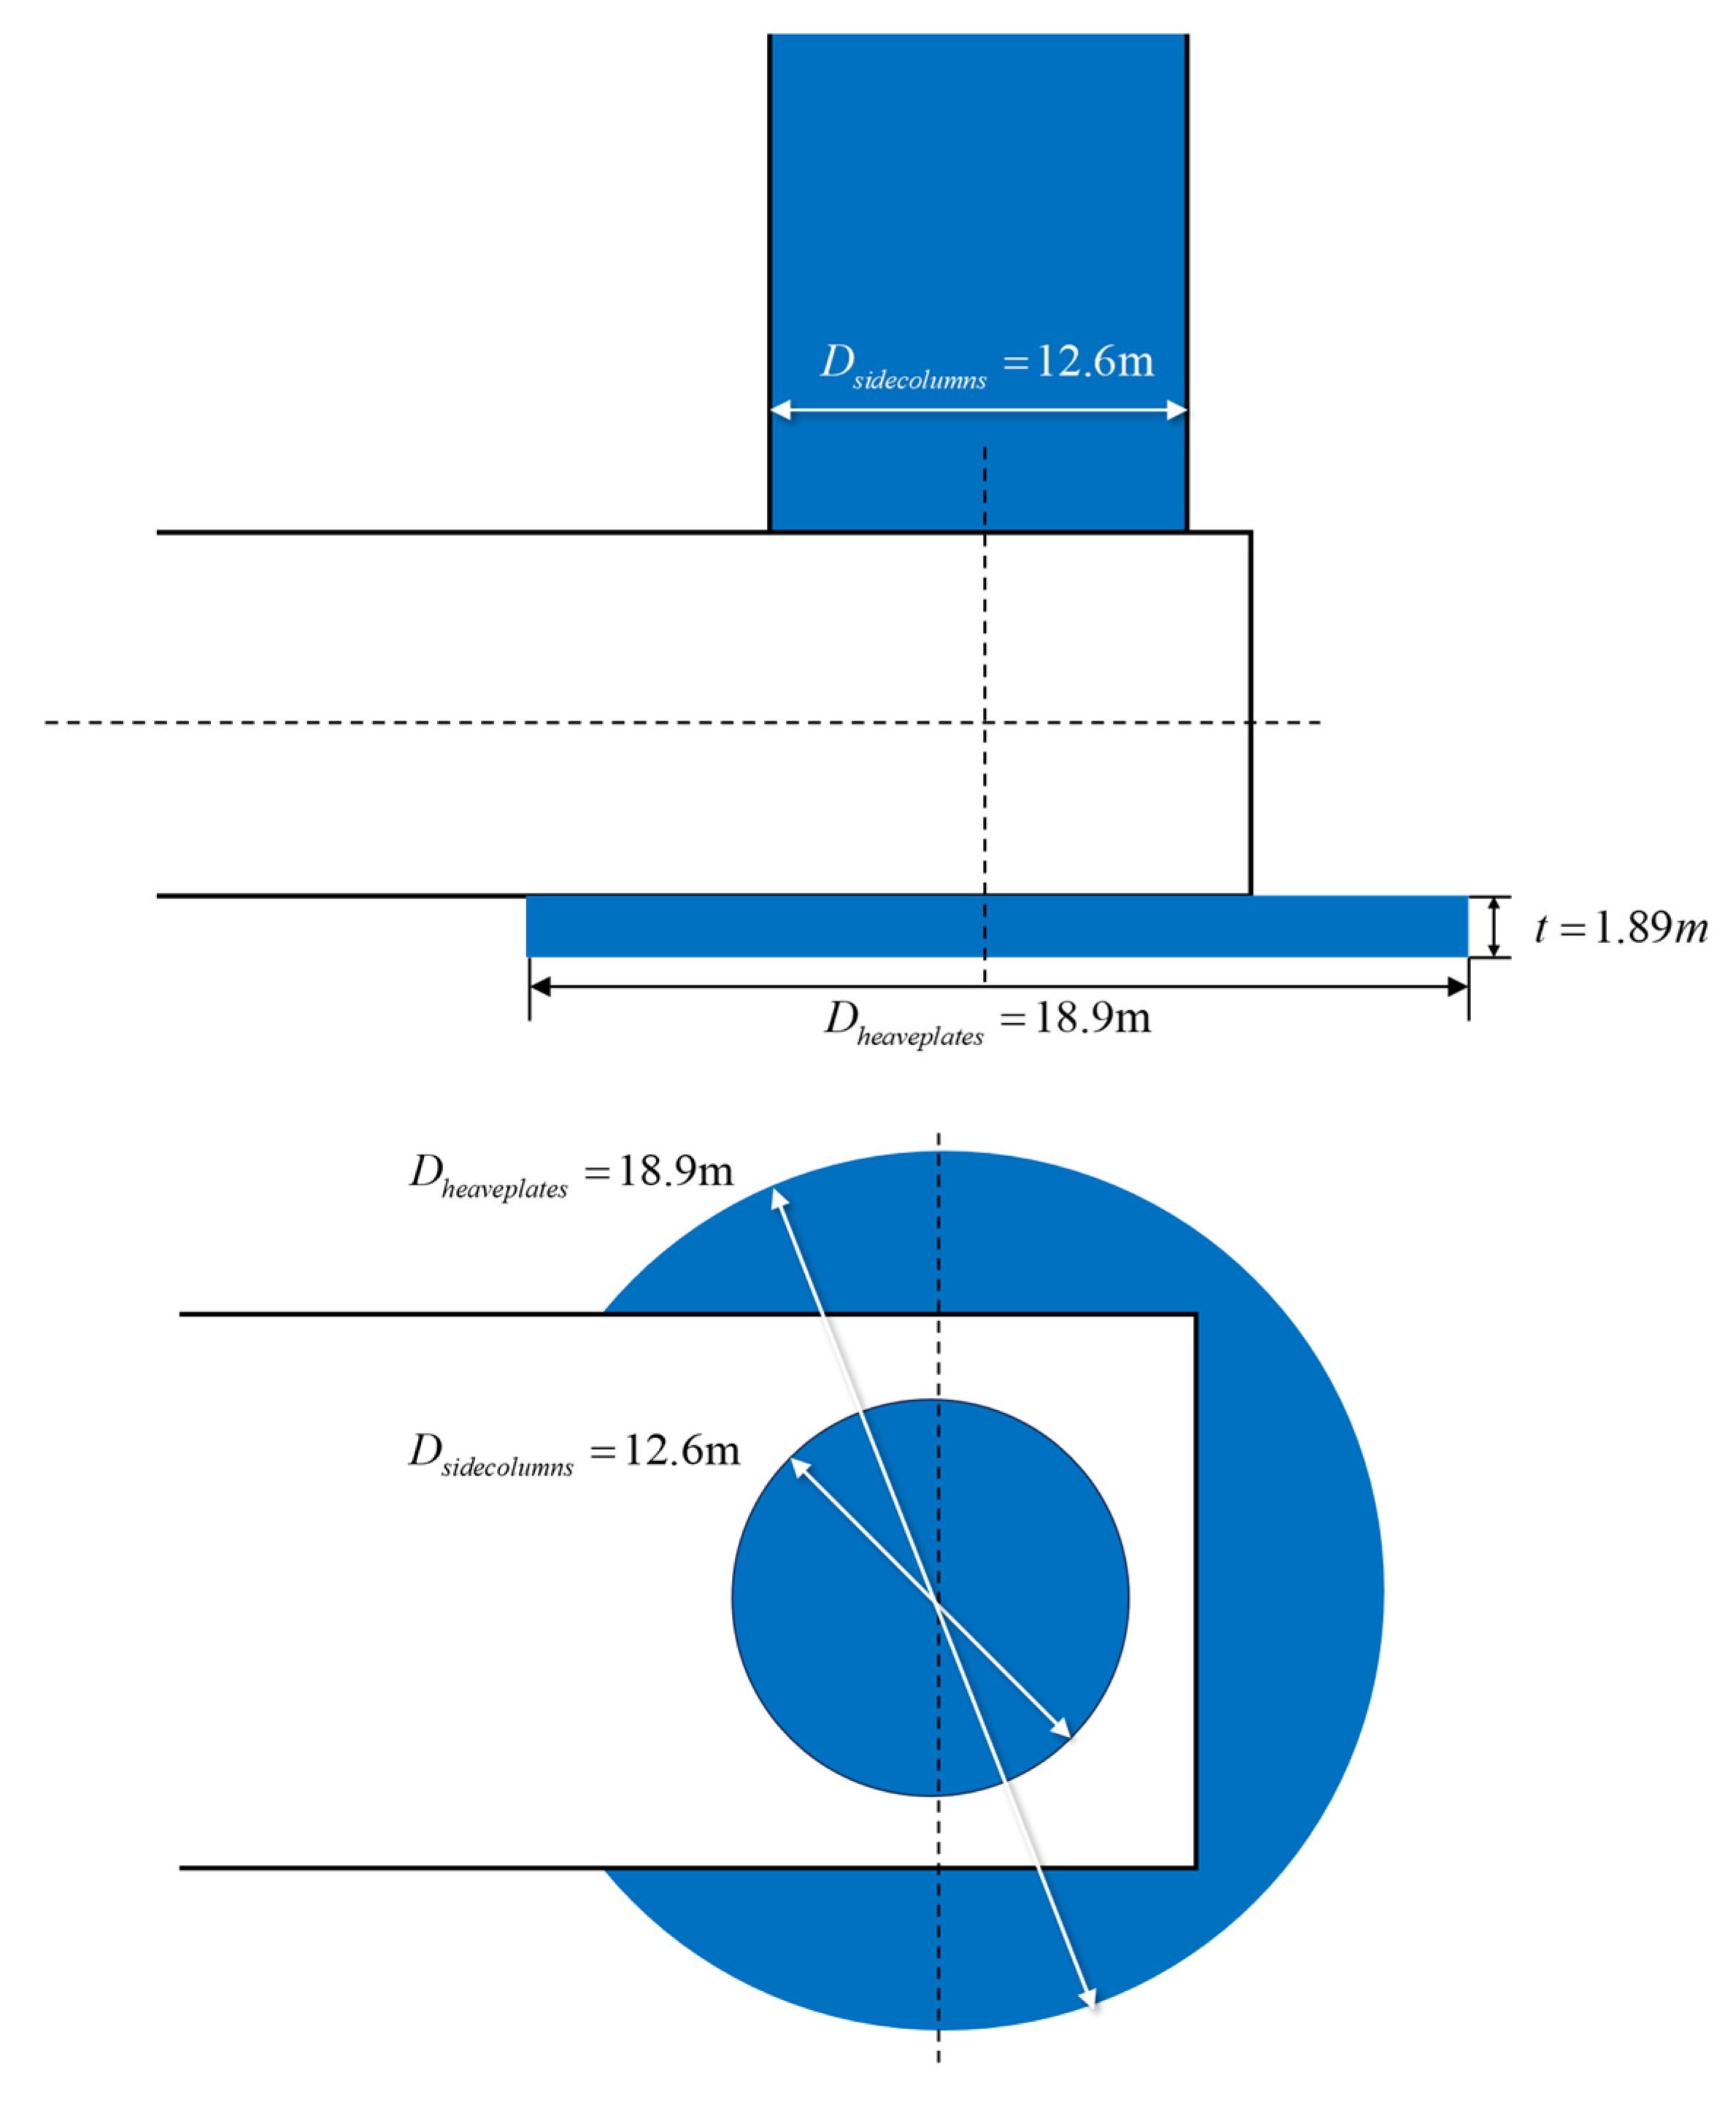
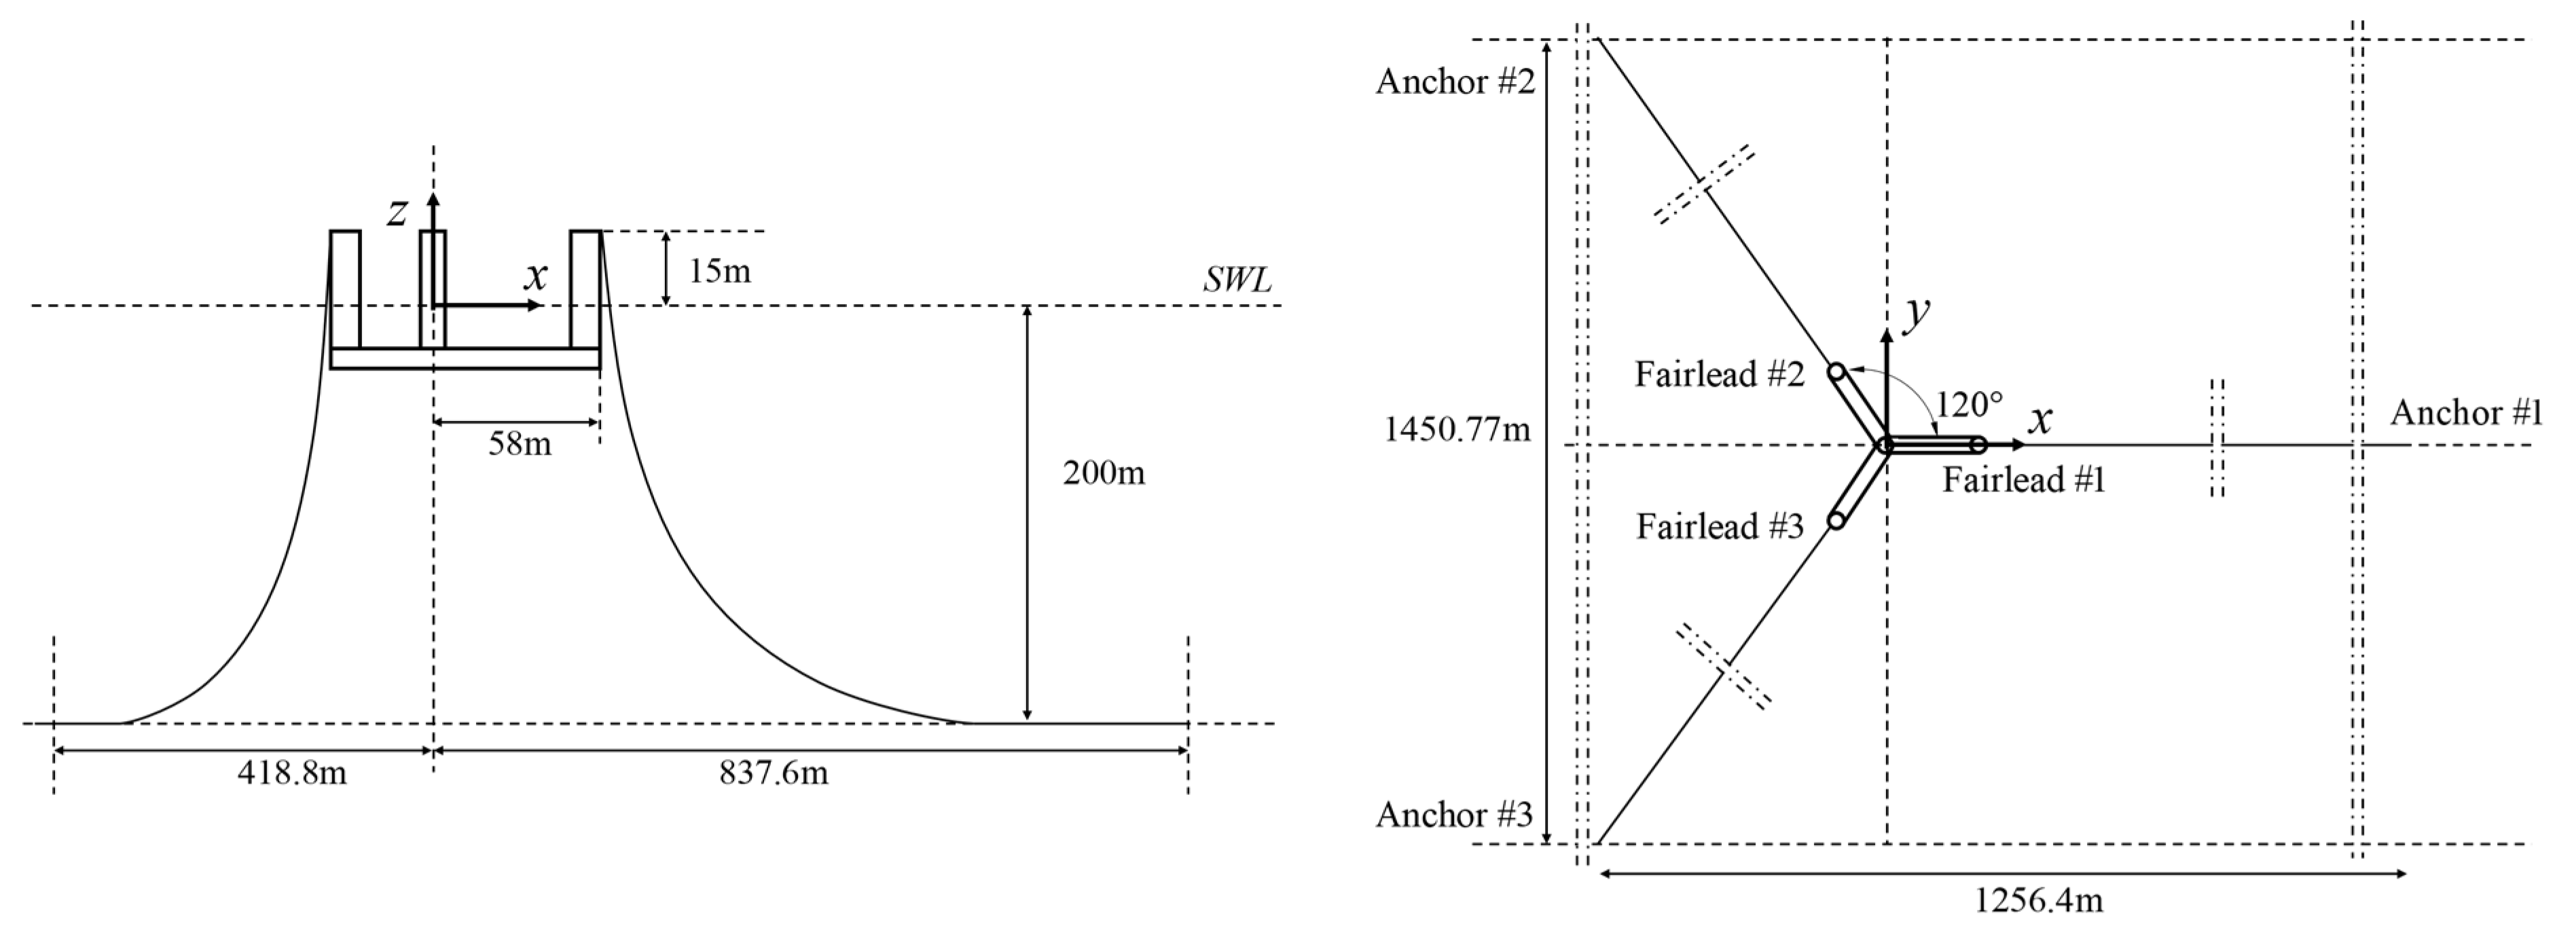
3.1.1. Semi-Submersible Platform

As shown in Figure 2, the semi-submersible floating platform comprises a central column and three peripheral columns, with the wind turbine mounted on the central column. The specific structural parameters are listed in Table 1.
The heave plates are installed at the bottom of the outer columns to reduce the motion of the FOWT, as shown in Figure 3. The location and structural parameters of the heave plates are provided in Table 2.

3.1.2. Wind Turbine and Tower

This paper focuses on the IEA Wind 15 MW wind turbine as the research subject [33]. The wind turbine has a rotor diameter of 240 m, a cut-in wind speed of 3 m/s, a cut-out wind speed of 25 m/s, and a rated wind speed of 10.59 m/s. The specific parameters of the IEA Wind 15 MW wind turbine are detailed in Table 3.
The diameter of the tower varies linearly from bottom to top, with specific parameters listed in Table 4.

3.1.3. Initial Mooring System

A catenary mooring system with nine mooring lines is designed, arranged as shown in Figure 4. The mooring system consists of three 900 m long chain mooring lines. Each mooring line connects at the fairlead to one of the three side columns of a platform located 15 m above SWL, which are distributed at 120-degree intervals. The radial distance from the centerline of the tower to the anchor points is 837.60 m (Table 5).

3.2. Design Load Condition

Rated environmental conditions are selected in the optimization model. These environmental conditions are listed in Table 6, where the JONSWAP wave spectrum and Kaimal wind spectrum are used. The center of the wind field is at the hub.

3.3. Design Variables

For the overall performance design of the floating wind turbine, we selected optimization design variables, as shown in Table 7.

3.4. Objective Function and Constraints

During the optimization process, the surge motion response of the FOWT and the geometric configuration of the mooring lines need to be constrained. For the platform surge motion response, a permissible offset-to-water-depth ratio of 0.15 is used as a constraint [33]. For the mooring line geometric configuration, it is necessary to ensure that the triangle side-length criteria and the required length of the catenary section of the mooring lines are met. The specific details of the constraints are provided in Table 8.
Here, M P M surge represents the statistical maximum value of the surge motion response, x a n c h and x F a i r are the horizontal coordinates of the anchor point and fairlead of mooring line #1, and z a n c h and z F a i r are their respective vertical coordinates. V F a i r denotes the maximum tension at the fairlead, and ω m o o r is the wet weight per unit length of the mooring line. The optimization function is given by Equation (23).
The goal of the case study is to minimize the maximum platform displacement, nacelle acceleration, and yaw under environmental loads as much as possible. The objective function can be expressed as follows:
min f 1 = M P M s u r g e f 2 = A C C E n a c e l l e f 3 = M P M y a w x = x 1 , x 2 s.t. g 1 x = Δ x o f f s e t Z d e p t h 0.15 < 0 g 2 x = x a n c h x F a i r 2 + z a n c h z F a i r 2 L < 0 g 3 x = L 10 L V F a i r ω m o o r < 0

4. Results and Discussion

4.1. Surrogate Modeling and Validation

4.1.1. Sample Point Selection

To build the surrogate model, it is essential to base it on specific discrete sample points that represent the entire function space as accurately as possible. In this study, the full-factorial design method was used in conjunction with the constraints to determine the sample set of design variables, comprising 58 design variable values. The response values for these sample points were obtained through time-domain calculation models. The design variable values are shown in Table 9.

4.1.2. Global Responses of the Sample Set

Table 9 includes each sample point of the design variable combinations considered candidate solutions for the optimization problem. Therefore, a total of 58 time-domain simulations were required to build the sample database. The design load conditions were applied to the numerical model to obtain the responses. The statistical values of these responses are shown in Table 10.

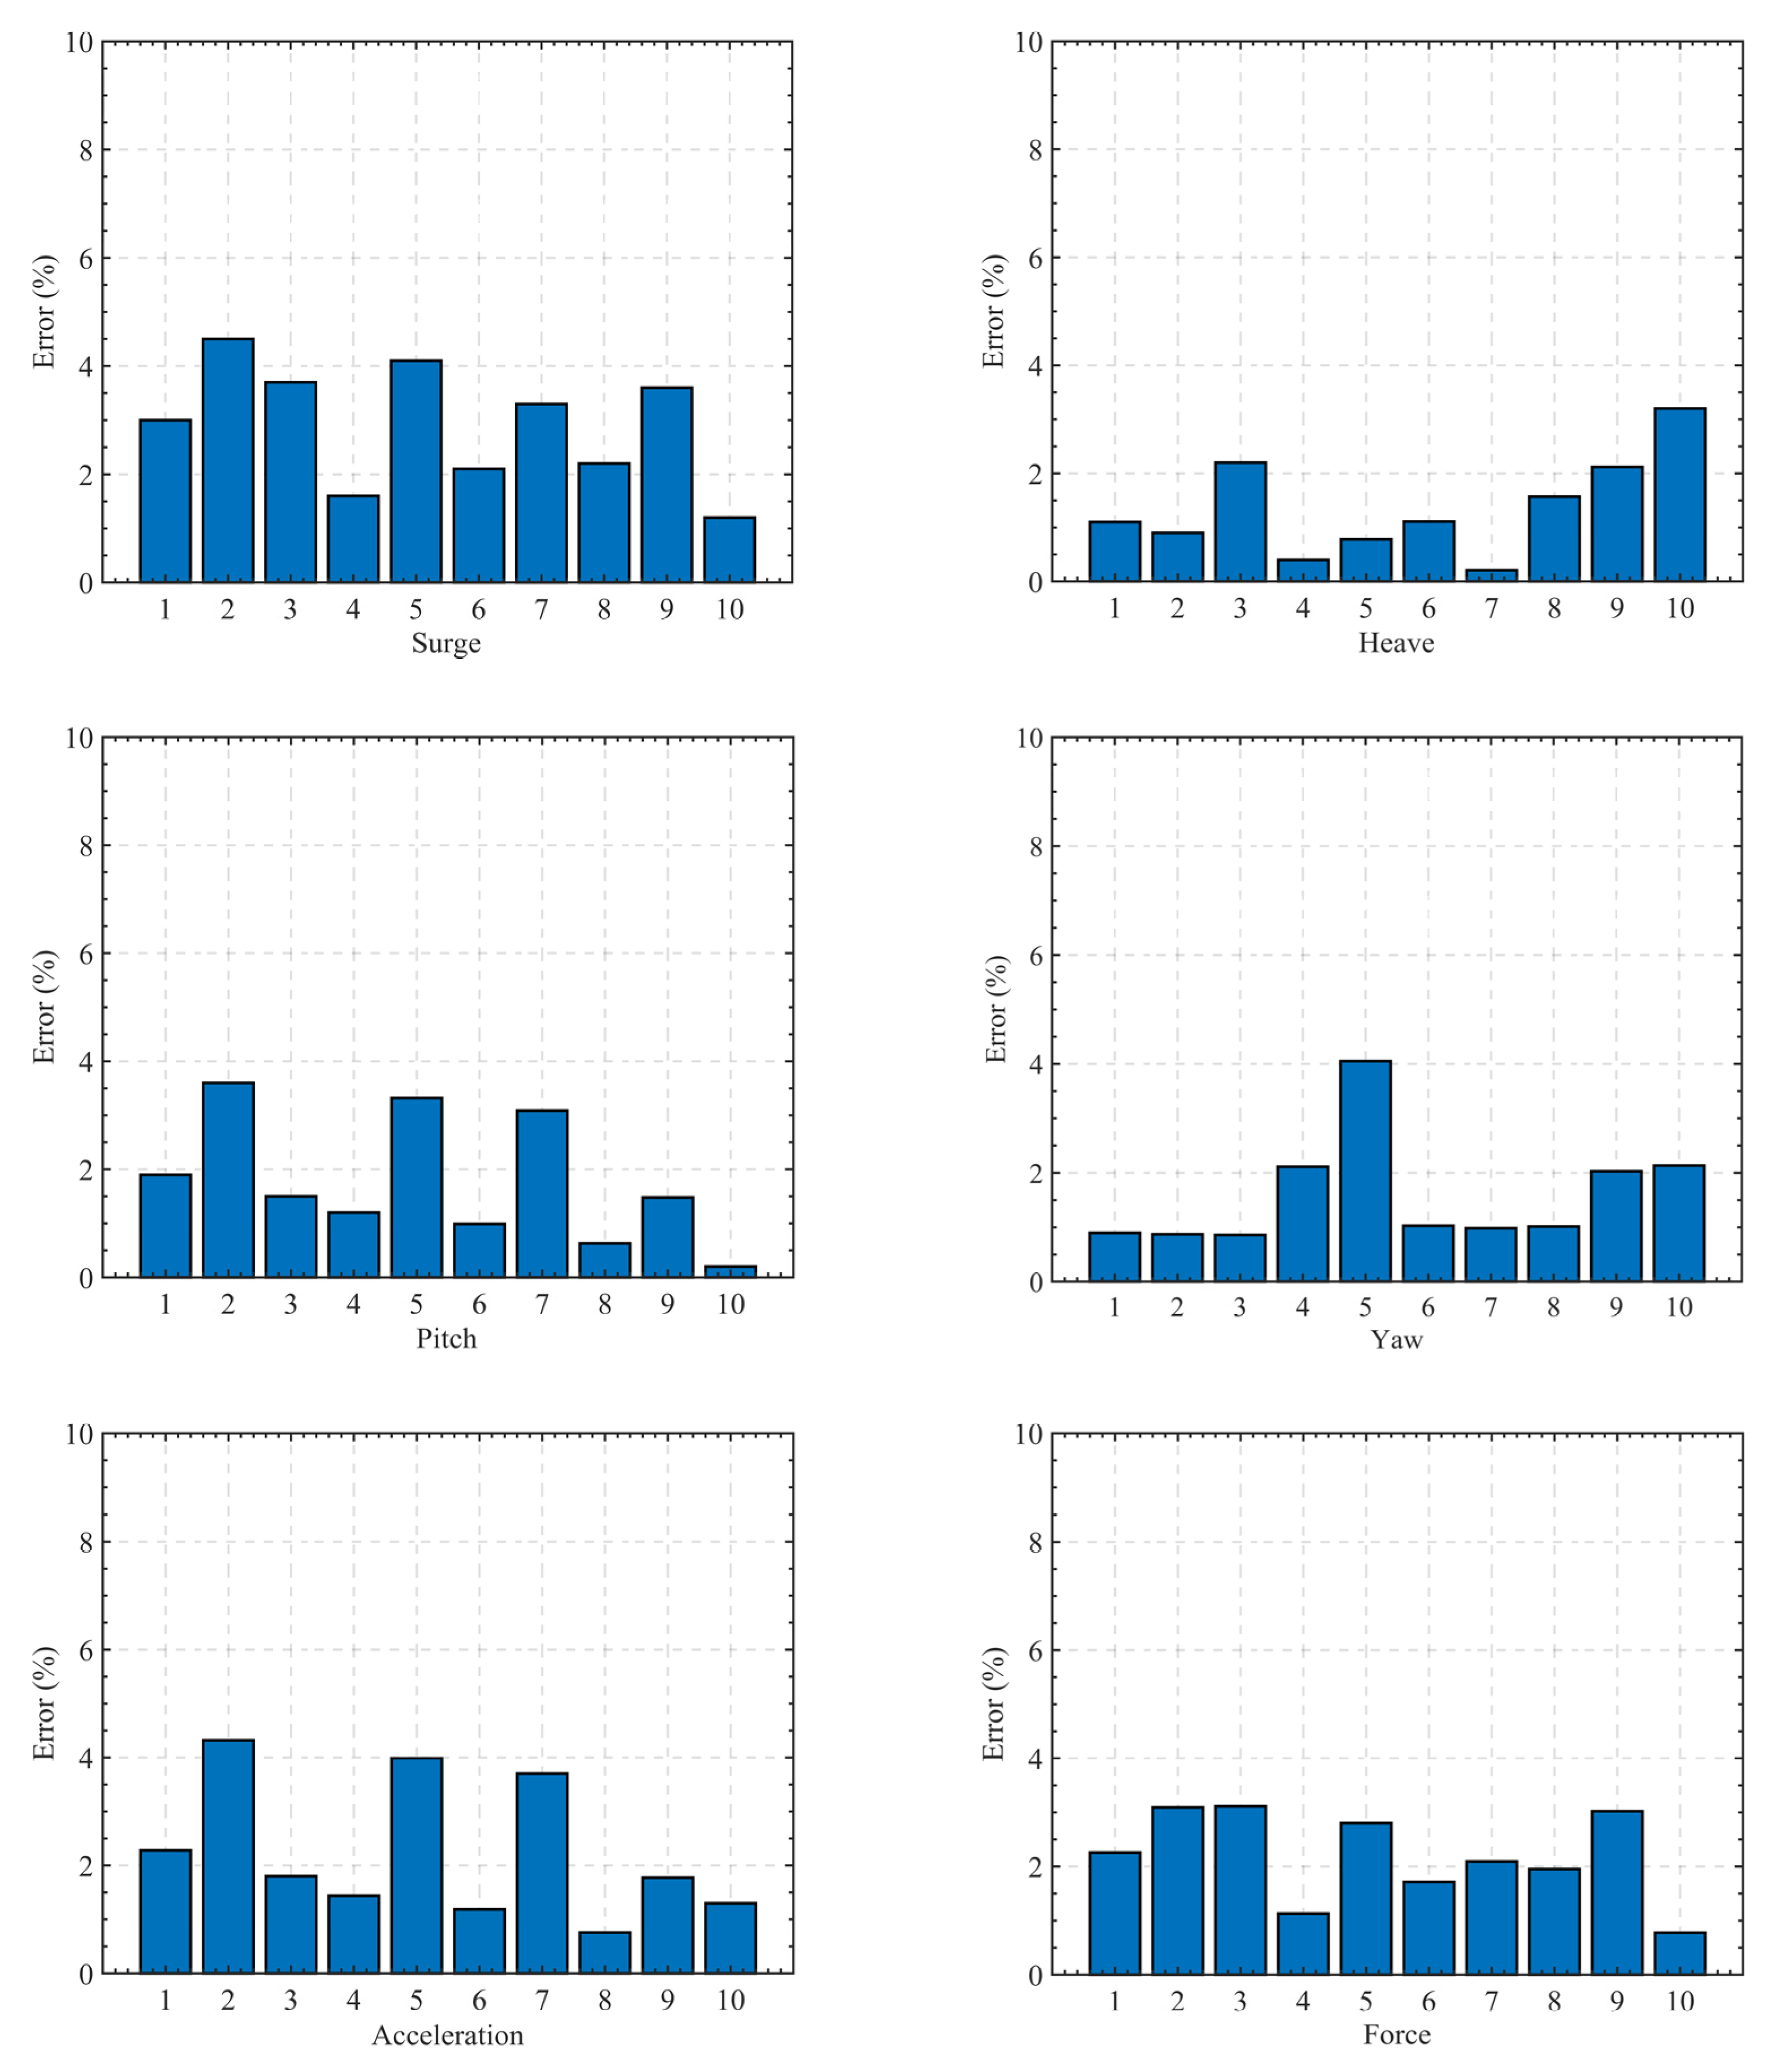
4.1.3. Reliability Analysis of Surrogate Model

The establishment of the Kriging surrogate model requires constant correction of the model basis function smoothing parameters to ensure the accuracy of the mapping between input and output parameters, and the values of the corrected model basis function smoothing parameters are shown in Table 11.
To verify the accuracy of the surrogate model and prevent overfitting, the model needs to be tested. The testing involves selecting design parameters not included in the sample points to form a test set. The results from the time-domain simulations are compared with those from the surrogate model to validate its accuracy. In this case, a total of 10 test set sample points were selected, and their design parameters are shown in Table 12.
Table 13 and Table 14 present the results of time-domain simulations and surrogate model predictions for the test sample. Figure 5 illustrates the error for each group of surrogate model results. The errors in surge, heave, pitch, yaw, nacelle acceleration, and mooring tension are all below 5%, indicating the high accuracy of the surrogate model.

4.2. Mooring System Optimization

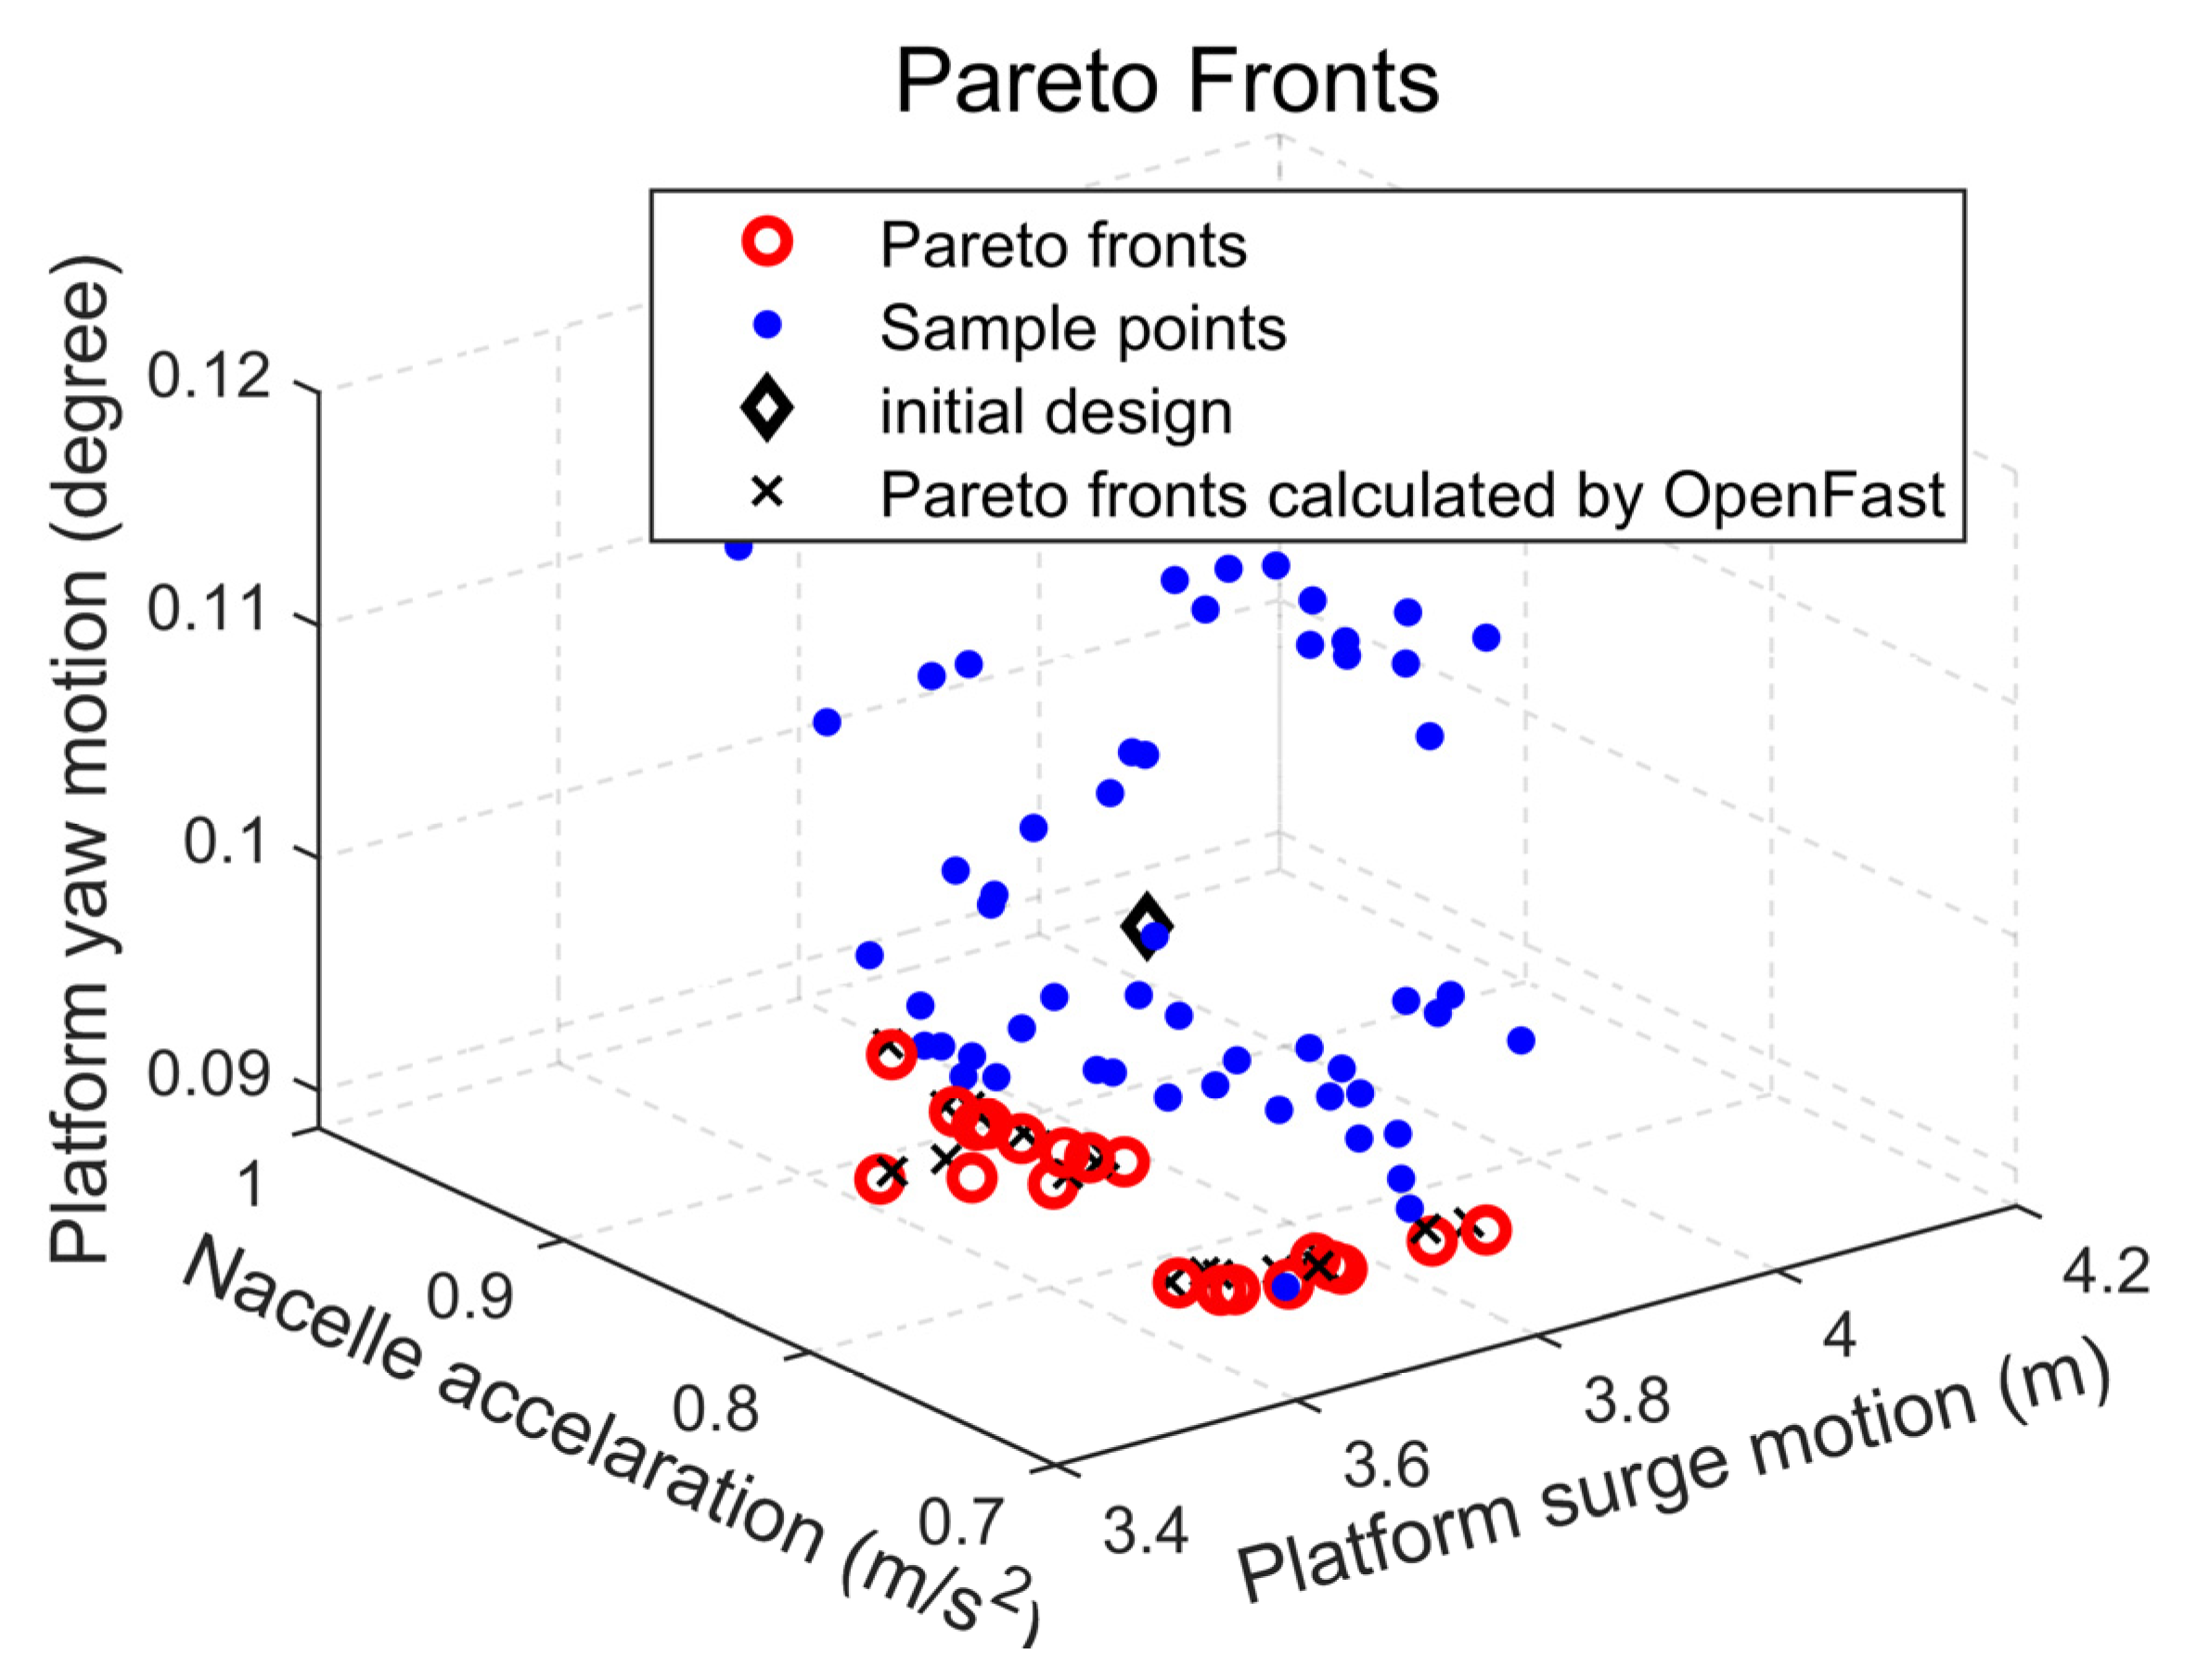
4.2.1. Pareto Solution

In applying the Kriging surrogate model to replace the costly finite element simulations, the initial values of the design variables were based on the initial mooring design mentioned in Section 3.1.3. After optimizing the mooring system using the NSGA-II algorithm, the Pareto solutions listed in Table 15 were obtained. As shown in Figure 6, the Pareto solutions are concentrated in the regions of smaller surge, yaw, and nacelle acceleration in the spatial domain. Considering the various optimization objectives, Pareto optimal solution No. 8 was selected as the final design scheme.

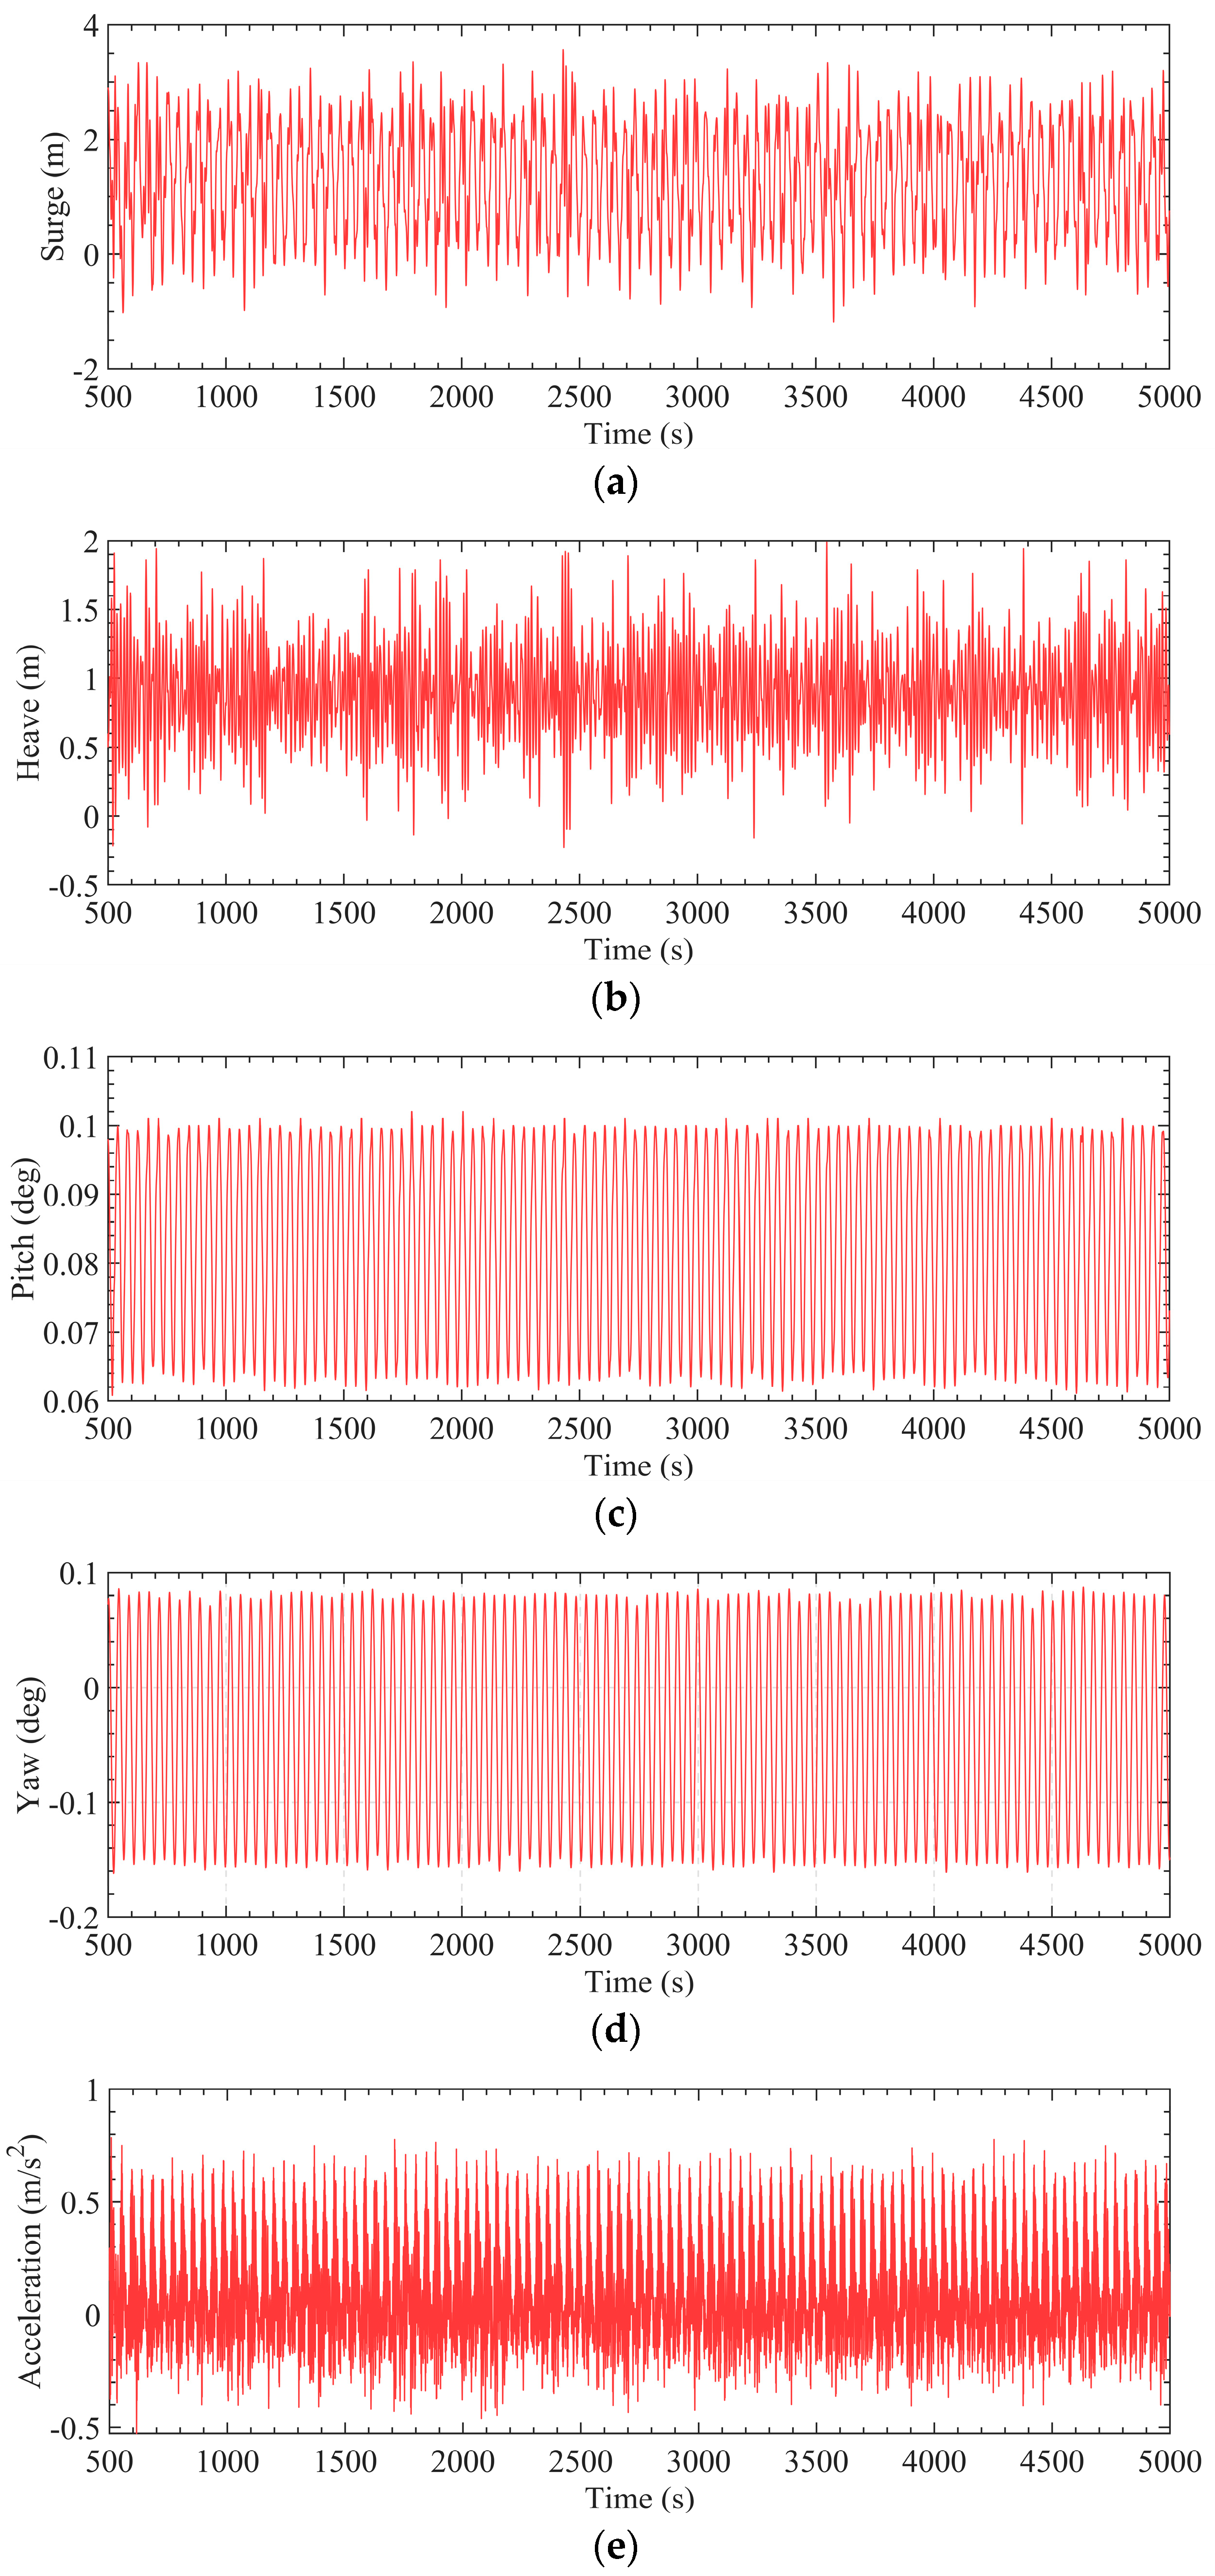
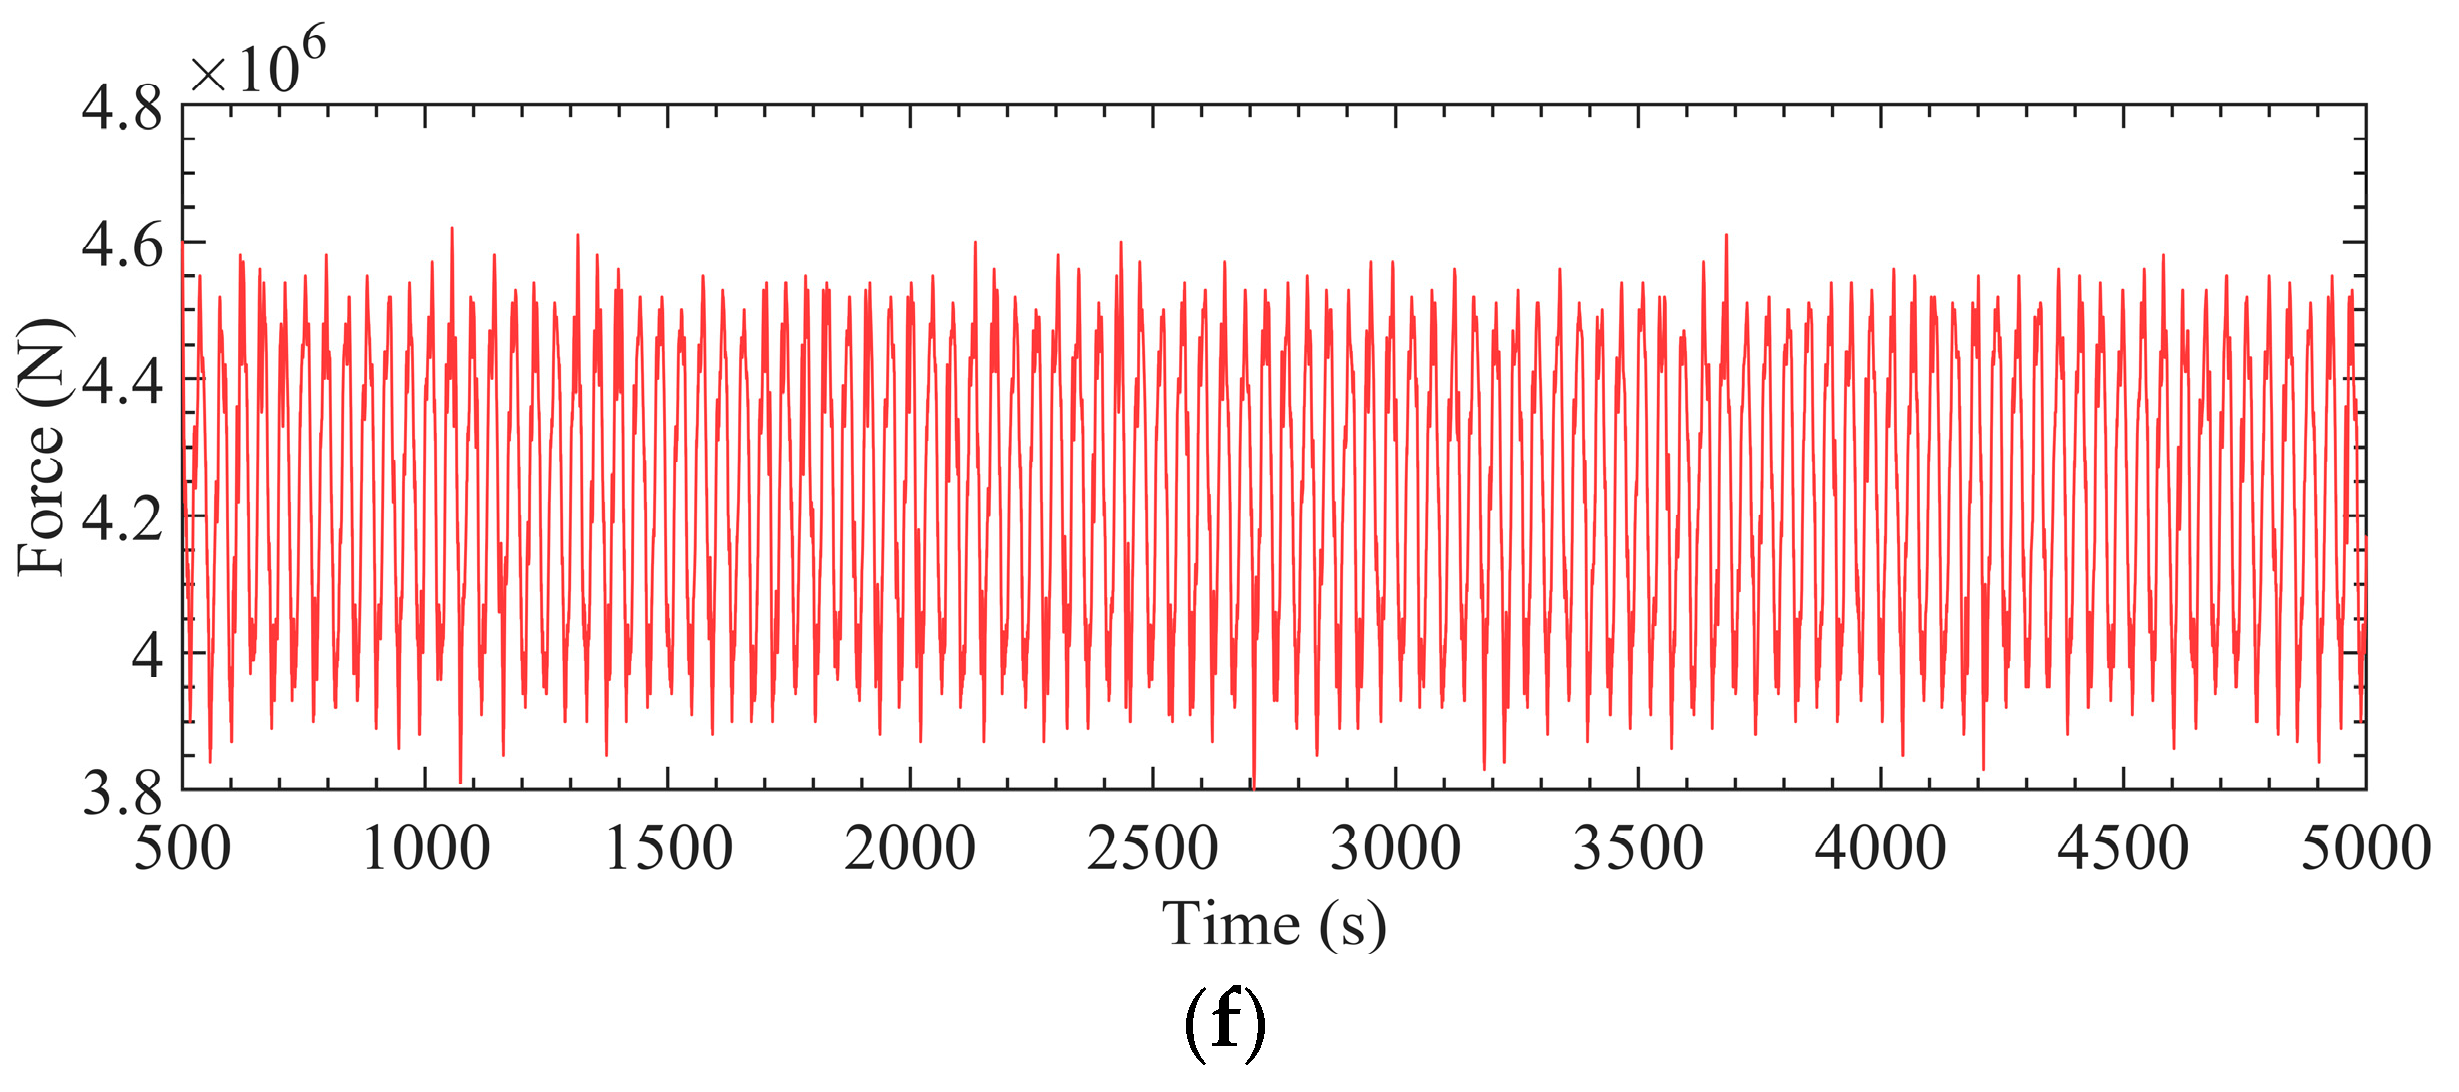
4.2.2. Results for Optimized Configurations Based on Time-Domain Model

Based on the design variables in the optimized Pareto optimal solution No. 8, the time-domain model was built and simulated, and the time-domain curve is shown in Figure 7.
Table 16 shows that the error between the optimization results from the surrogate model and the time-domain optimization results does not exceed 5%, confirming the accuracy of the surrogate model.
Compared to the initial design, the optimized design achieved a 2.8% reduction in mooring line length and a 3.14% reduction in anchor radial spacing. While ensuring that the mooring line tension at the fairlead and the touchdown segment length meet regulatory requirements, the maximum reduction in the surge motion response of the FOWT is 6.46%, the pitch motion response is reduced by up to 2.87%, and the nacelle acceleration is reduced by a maximum of 11.55%.

5. Conclusions

In this paper, we have proposed an optimized design method for the mooring system of an FOWT. To minimize the surge, yaw motion response, and nacelle acceleration, the mooring line length and anchor radial spacing were defined as design variables. The optimization procedure integrates the Kriging surrogate model with the NSGA-II method to evaluate the candidate solution. The primary conclusions of this study are summarized as follows.
(1) The Kriging function was used to develop a surrogate model FOWT, which built a functional relationship between the design variables and objective. The results produced by the surrogate model were within a 5% error margin compared to time-domain model results, indicating the high accuracy of the surrogate model.
(2) The traditional, time-consuming time-domain finite element calculations are discarded in this optimization framework. During the optimization process, both time and computational costs are significantly reduced, with the majority of the time spent on building the sample database. Additionally, the optimization framework demonstrates a rapid convergence rate.
(3) Since the optimization is multi-objective, the results are not unique. The optimization results need to be selected based on their impact on the safety of the wind turbine system. Compared to the initial design, the optimized mooring line length is reduced by 2.8%, and the anchor radial spacing is reduced by 3.14%. Under the condition that the fairlead tension and catenary section length meet the regulatory requirements, the maximum reduction in surge motion response is 6.46%, the maximum reduction in roll motion response is 2.87%, and the maximum reduction in nacelle acceleration is 11.55%.
There were some limitations in the present study. This study adopted only one sea state for the calculations. Future studies will focus on more complex environmental conditions, with additional sea states and incidence directions. Further improvements will include adding more optimization objectives and design variables, such as considering the economic benefits of the floating wind power system (LCOE), and the layout of pontoons and sinkers, for more comprehensive and detailed optimization work.

Author Contributions

Conceptualization, X.Y. and D.Q.; Methodology, X.Y.; Software, P.Z.; Validation, X.Y. and P.Z.; Formal analysis, D.Q.; Investigation, X.Z.; Data curation, X.Z. and Y.Z.; Writing—original draft, P.Z.; Writing—review & editing, X.Y.; Visualization, Y.Z.; Supervision, D.Q. and L.W.; Project administration, L.W. All authors have read and agreed to the published version of the manuscript.

Funding

This work was supported by the National Key R&D Program of China [Grant No. 2022YFB2602800], National Natural Science Foundation of China [Grant No. 52371261], and Science and Technology Projects of Liaoning Province [Grant No. 2023011352-JH1/110].

Institutional Review Board Statement

Not applicable.

Informed Consent Statement

Not applicable.

Data Availability Statement

Data is contained within the article.

Conflicts of Interest

Authors Ye, X., Zhao, X. and Wang, L. are employed by the company CCCC First Harbour Consultants Co., Ltd., Tianjin 300220, China. The remaining authors declare that the research was conducted in the absence of any commercial or financial relationships that could be construed as a potential conflict of interest.

References

  1. Jiang, Y.; Duan, Y.; Li, J.; Chen, M.; Zhang, X. Optimization of mooring systems for a 10 MW semisubmersible offshore wind turbines based on neural network. Ocean Eng. 2024, 296, 117020. [Google Scholar] [CrossRef]
  2. Ja’e, I.A.; Ali, M.O.A.; Yenduri, A.; Amaechi, C.V.; Nizamani, Z.; Nakayama, A. Optimization of mooring line design parameters using Mooring Optimization Tool for FPSO (MooOpT4FPSO) with the consideration of integrated design methodology. Ocean Eng. 2022, 264, 112499. [Google Scholar]
  3. Shafieefar, M.; Rezvani, A. Mooring optimization of floating platforms using a genetic algorithm. Ocean Eng. 2007, 34, 1413–1421. [Google Scholar] [CrossRef]
  4. Sclavounos, P.; Tracy, C.; Lee, S. Floating offshore wind turbines: Responses in a seastate pareto optimal designs and economic assessment. In Proceedings of the International Conference on Offshore Mechanics and Arctic Engineering, Estoril, Portugal, 15–20 June 2008; pp. 31–41. [Google Scholar]
  5. Philippe, M.; Babarit, A.l.; Ferrant, P. Comparison of time and frequency domain simulations of an offshore floating wind turbine. In Proceedings of the International Conference on Offshore Mechanics and Arctic Engineering, Rotterdam, The Netherlands, 19–24 June 2011; pp. 589–598. [Google Scholar]
  6. Karimi, M.; Buckham, B.; Crawford, C. A fully coupled frequency domain model for floating offshore wind turbines. J. Ocean Eng. 2019, 5, 135–158. [Google Scholar] [CrossRef]
  7. Karimi, M.; Hall, M.; Buckham, B.; Crawford, C. A multi-objective design optimization approach for floating offshore wind turbine support structures. J. Ocean Eng. 2017, 3, 69–87. [Google Scholar] [CrossRef]
  8. Brommundt, M.; Krause, L.; Merz, K.; Muskulus, M. Mooring system optimization for floating wind turbines using frequency domain analysis. Energy Procedia 2012, 24, 289–296. [Google Scholar] [CrossRef]
  9. Bruschi, N.; Ferri, G.; Marino, E.; Borri, C. Influence of clumps-weighted moorings on a spar buoy offshore wind turbine. Energies 2020, 13, 6407. [Google Scholar] [CrossRef]
  10. Barbanti, G.; Marino, E.; Borri, C. Mooring system optimization for a spar-buoy wind turbine in rough wind and sea conditions. In Proceedings of the XV Conference of the Italian Association for Wind Engineering: IN-VENTO 2018 25; Springer: Cham, Switzerland, 2019; pp. 87–98. [Google Scholar]
  11. Mockutė, A.; Marino, E.; Lugni, C.; Borri, C. Comparison of nonlinear wave-loading models on rigid cylinders in regular waves. Energies 2019, 12, 4022. [Google Scholar] [CrossRef]
  12. Mirzaei, M.; Maimun, A.; Priyanto, A.; Fitriadhy, A. Mooring pattern optimization using a genetic algorithm. J. Teknol. 2014, 66, 189–193. [Google Scholar] [CrossRef]
  13. da Fonseca Monteiro, B.; Baioco, J.S.; Albrecht, C.H.; de Lima, B.S.L.P.; Jacob, B.P. Optimization of mooring systems in the context of an integrated design methodology. Mar. Struct. 2021, 75, 102874. [Google Scholar] [CrossRef]
  14. Koziel, S.; Bekasiewicz, A.; Couckuyt, I.; Dhaene, T. Efficient Multi-Objective Simulation-Driven Antenna Design Using Co-Kriging. IEEE Trans. Antennas Propag. 2014, 62, 5900–5905. [Google Scholar] [CrossRef]
  15. Chatterjee, T.; Chakraborty, S.; Chowdhury, R. A Critical Review of Surrogate Assisted Robust Design Optimization. Arch. Comput. Methods Eng. 2019, 26, 245–274. [Google Scholar] [CrossRef]
  16. Zhang, X.; Song, X.; Qiu, W.; Yuan, Z.; You, Y.; Deng, N. Multi-objective optimization of Tension Leg Platform using evolutionary algorithm based on surrogate model. Ocean Eng. 2018, 148, 612–631. [Google Scholar] [CrossRef]
  17. Zhang, H.; Wang, H.; Cai, X.; Xie, J.; Wang, Y.; Zhang, N. Novel method for designing and optimising the floating platforms of offshore wind turbines. Ocean Eng. 2022, 266, 112781. [Google Scholar] [CrossRef]
  18. Sun, Y.; Denimal, E.; Yuan, J.; Salles, L.J.S.; Optimization, M. Geometric design of friction ring dampers in blisks using nonlinear modal analysis and Kriging surrogate model. Struct. Multidiscipl. Optim. 2022, 65, 98. [Google Scholar] [CrossRef]
  19. Thapa, M.; Missoum, S.J.S.; Optimization, M. Surrogate-based stochastic optimization of horizontal-axis wind turbine composite blades. Struct. Multidiscipl. Optim. 2022, 65, 41. [Google Scholar] [CrossRef]
  20. Mao, Y.; Wang, T.; Duan, M.; Men, H. Multi-objective optimization of semi-submersible platforms based on a support vector machine with grid search optimized mixed kernels surrogate model. Ocean Eng. 2022, 260, 112077. [Google Scholar] [CrossRef]
  21. Augusto, O.B.; Dias, C.A.N.; Rossi, R. Practical method for mooring systems optimum design. Dev. Mar. Technol. 1998, 11, 1013–1021. [Google Scholar]
  22. Schmidt, H.; Thierauf, G. A combined heuristic optimization technique. Adv. Eng. Softw. 2005, 36, 11–19. [Google Scholar] [CrossRef]
  23. Jiang, Z.; Gu, M. Optimization of a fender structure for the crashworthiness design. Mater. Des. 2010, 31, 1085–1095. [Google Scholar] [CrossRef]
  24. Saka, M.P. Optimum design of steel frames using stochastic search techniques based on natural phenomena: A review. In Civil Engineering Computations: Tools and Techniques; Saxe-Coburg Publications: Stirlingshire, UK, 2007; Chapter 6; pp. 105–147. [Google Scholar]
  25. Sahab, M.G.; Toropov, V.V.; Gandomi, A.H. A review on traditional and modern structural optimization: Problems and techniques. In Metaheuristic Applications in Structures and Infrastructures; Elsevier Science: Amsterdam, The Netherlands, 2013; pp. 25–47. [Google Scholar]
  26. Rao, S.S. Engineering Optimization: Theory and Practice; John Wiley & Sons: Hoboken, NJ, USA, 2019. [Google Scholar]
  27. Krige, D.G. A Statistical Approach to Some Basic Mine Valuation Problems on the Witwatersrand. J. S. Afr. Inst. Min. Metall. 1951, 52, 201–203. [Google Scholar]
  28. Forrester, A.I.J.; Sóbester, A.; Keane, A.J. Multi-fidelity optimization via surrogate modelling. Proc. R. Soc. A 2007, 463, 3251–3269. [Google Scholar] [CrossRef]
  29. Qiao, D.; Zhou, Y.; Xu, B.; Qin, J.; Tang, G.; Lu, L.; Ou, J. Dynamic response analysis of a fully coupled aerodynamic-hydrodynamic-mooring-anchor floating offshore wind turbine. Ocean Eng. 2024, 312 Pt 1, 119085. [Google Scholar] [CrossRef]
  30. Low, Y.M.; Langley, R.S. Time and frequency domain coupled analysis of deepwater floating production systems. Appl. Ocean Res. 2006, 28, 371–385. [Google Scholar] [CrossRef]
  31. Xiong, L.; Yang, J.; Zhao, W. Dynamics of a taut mooring line accounting for the embedded anchor chains. Ocean Eng. 2016, 121, 403–413. [Google Scholar] [CrossRef]
  32. Deb, K.; Pratap, A.; Agarwal, S.; Meyarivan, T. A fast and elitist multiobjective genetic algorithm: NSGA-II. IEEE Trans. Evol. Comput. 2002, 6, 182–197. [Google Scholar] [CrossRef]
  33. Benassai, G.; Campanile, A.; Piscopo, V.; Scamardella, A. Optimization of mooring systems for floating offshore wind turbines. Coast Eng. J. 2015, 57, 1550021. [Google Scholar] [CrossRef]
Figure 1. Flowchart of the optimization methodology.
Jmse 12 01853 g001
Figure 2. Schematic of 15 MW semi-submersible platform.
Jmse 12 01853 g002aJmse 12 01853 g002b
Figure 3. Schematic of the heave plate.
Jmse 12 01853 g003
Figure 4. Schematic of the mooring line layout.
Jmse 12 01853 g004
Figure 5. The error of the surrogate model when compared with the time-domain model.
Jmse 12 01853 g005
Figure 6. Pareto fronts based on the Kriging surrogate model.
Jmse 12 01853 g006
Figure 7. Time history of global responses for optimized configurations: (a) surge; (b) heave; (c) pitch; (d) yaw; (e) nacelle acceleration; (f) tension.
Jmse 12 01853 g007aJmse 12 01853 g007b
Table 1. Principal particulars of platform.
ParameterUnitValue
Water depthm200
Displacementm320,206
Draftm25.474
Center of massm−18.162
Center of buoyancym−16.757
Platform masskg
Moment of inertia about
the x-axis
kg·m25.873 × 1010
Moment of inertia about
the y-axis
kg·m25.873 × 1010
Moment of inertia about
the z-axis
kg·m22.367 × 1010
Table 2. Principal particulars of heave plate.
ParameterUnit#1#2#3
xm−45.1410−30.161
ym22.57139.092−30.161
zm26.306−45.561−30.161
Diameterm18.900
Thicknessm1.890
A33kg2.679× 107
B33N/(m/s)1.02 × 106
Cd-6.203
Cm-6.437
Table 3. Principal particulars of the IEA 15 MW wind turbine.
ParameterUnitValue
Number of blades-3
Cut-in wind speedm/s3
Rated wind speedm/s10.59
Cut-out wind speedm/s25
Rotor diameterm240
Hub heightm150
Minimum rotor speedrpm5
Maximum rotor speedrpm7.56
Table 4. Principal particulars of tower.
ParameterUnitValue
Tower masskg1.26 × 106
Tower lengthm129.49
Base diameter of the towerm10.00
Top diameter of the towerM6.50
Table 5. Mooring line configuration.
ParameterUnitValue
Number-3
Radius of anchor points from centerlinem837.6
Radius of fairlead holes from centerlinem58
Diametermm185
Dry weightkg/m685
StiffnessMN3270
Lengthm900
Table 6. Environmental conditions.
ConditionTp
(s)
Hs
(m)
Peak Enhancement FactorWind
Speed
(m/s)
Turbulence
Intensity
(%)
-12.515.51.010.595.5
Table 7. Optimization design variables.
Design
Variables
Variable
Name
Initial
Value
Lower
Bound
Upper
Bound
x 1 anchor point location Xanch9005001500
x 2 mooring line length−837.6−500−1500
Table 8. Constraints in the optimization process.
No.ParameterConstraint
1surge motion M P M surge z d e p t h 0.15
2mooring line length L > x a n c h x F a i r 2 + z a n c h z F a i r 2
3catenary section length L B = L 2 V F a i r ω m o o r L 10
Table 9. Summary of training set.
No.Length
[m]
Coordinates
[m]
1550−500
2600−550
3600−500
4650−600
5650−550
6650−500
7700−650
8700−600
9700−550
10750−700
11750−650
12750−600
13800−750
14800−700
15800−650
16850−800
17850−750
18850−700
19900−850
20900−837.5
21900−800
22900−750
23950−900
24950−850
25950−800
261000−950
271000−900
281000−850
291050−1000
301050−950
311050−900
321100−1050
331100−1000
341100−950
351150−1100
361150−1050
371150−1000
381200−1150
391200−1100
401200−1050
411250−1200
421250−1150
431250−1100
441300−1250
451300−1200
461300−1150
471350−1300
481350−1250
491350−1200
501400−1350
511400−1300
521400−1250
531450−1400
541450−1350
551450−1300
561500−1450
571500−1400
581500−1350
Table 10. Global responses of the training set.
No.Surge
[m]
Heave
[m]
Pitch
[°]
Yaw
[°]
ACCE
[m/s2]
VFair
[N]
13.7202.0600.1090.0950.8574.752 × 106
23.6402.0110.1110.0980.8644.757 × 106
34.0602.0730.1310.0990.8804.405 × 106
43.6202.0040.1100.0930.8454.771 × 106
54.0302.0920.1240.0940.9604.438 × 106
64.1002.1050.1380.0970.9184.362 × 106
73.6402.0300.1110.0980.8514.787 × 106
84.0002.1410.1260.0960.9324.429 × 106
93.9002.1530.1380.0970.9564.349 × 106
103.6902.0380.1100.0920.8254.795 × 106
114.0902.1310.1280.0950.8944.442 × 106
123.6002.1330.1350.0890.9274.383 × 106
133.7402.0390.1090.0910.8014.804 × 106
143.7701.9480.1260.0890.9314.429 × 106
153.9002.0920.1330.0910.8744.415 × 106
163.7002.0390.1090.0900.8014.809 × 106
173.6902.0570.1230.0910.8684.490 × 106
184.0002.1850.1310.0890.9044.365 × 106
193.7802.0250.1080.0910.7954.805 × 106
203.8101.9210.1200.0890.8634.533 × 106
213.5502.0130.1190.0900.8494.450 × 106
224.0002.1490.1320.0950.8894.357 × 106
233.8501.9900.1090.0940.8174.812 × 106
243.8502.1640.1230.0900.8844.534 × 106
254.0002.0820.1340.0900.9454.410 × 106
263.8102.0270.1080.0940.7774.810 × 106
273.9102.0460.1180.0930.7894.480 × 106
283.7001.9460.1290.0930.9404.388 × 106
293.8101.9450.1060.0920.8504.825 × 106
303.7502.0870.1210.0890.8804.538 × 106
314.0002.0680.1270.0910.8754.396 × 106
323.8601.9880.1080.0870.8094.816 × 106
333.8802.0860.1180.0870.7794.481 × 106
343.8001.9790.1280.0860.9314.394 × 106
353.7401.8730.1080.0870.8434.825 × 106
363.6802.0110.1220.0870.8784.537 × 106
374.0002.1590.1310.0870.8904.423 × 106
383.8202.0260.1080.0870.7654.812 × 106
393.7202.0360.1210.0870.8814.538 × 106
404.0002.2110.1280.0870.8754.402 × 106
413.8302.0770.1070.0880.7664.833 × 106
423.6402.0320.1180.0920.8424.526 × 106
433.6001.8620.1250.0910.8124.447 × 106
443.8501.9670.1070.0870.7964.825 × 106
453.7602.0060.1200.0870.8364.526 × 106
464.1002.1210.1320.0910.8674.428 × 106
473.8401.9490.1070.0900.8044.837 × 106
483.5501.9340.1200.0900.8284.554 × 106
494.0002.1190.1290.0890.8414.454 × 106
503.7002.1020.1090.08710.7534.894 × 106
513.7102.0880.1190.08860.8184.554 × 106
523.8002.1410.1290.0840.8654.439 × 106
533.8301.9380.1070.0840.8374.822 × 106
543.9801.9690.1140.0840.7944.570 × 106
553.6001.9540.1210.0840.8514.442 × 106
563.8401.9890.1080.0850.7764.835 × 106
573.8702.1770.1170.0840.7874.541 × 106
583.8002.0500.1270.0840.8734.444 × 106
Table 11. Smoothing parameters in Kriging surrogate model.
θ d 1 θ d 2
K-f123.78450.000
K-f223.78447.880
K-f36.4845.221
Table 12. Summary of test set.
No.Length
[m]
Coordinates
[m]
1702.4−624.3
2758.5−625.5
3882.0−796.0
4951.3−837.6
51037.8−963.5
61106.9−994.0
71204.3−1100.8
81257.9−1123.8
91356.8−1220.3
101450.6−1358.7
Table 13. Global responses of test set based on time-domain model.
No.Surge
[m]
Heave
[m]
Pitch
[°]
Yaw
[°]
ACCE
[m/s2]
VFair
/[N]
13.7202.0600.1090.0980.8574.75 × 106
23.6402.0110.1110.0960.8644.76 × 106
34.0602.0730.1310.0970.8804.41 × 106
43.6202.0040.1100.0920.8454.77 × 106
54.0302.0920.1240.0950.964.44 × 106
64.1002.1050.1380.0890.9184.36 × 106
73.6402.0300.1110.0910.8514.79 × 106
84.0012.1410.1260.0890.9324.43 × 106
93.9012.1530.1380.0910.9564.35 × 106
103.6902.0380.1100.0900.8254.80 × 106
Table 14. Global responses of test set based on surrogate model.
No.Surge
[m]
Heave
[m]
Pitch
[°]
Yaw
[°]
ACCE
[m/s2]
VFair
/[N]
13.8312.0820.1110.0990.8764.85 × 106
23.8032.0290.1140.0970.9014.90 × 106
34.2102.1180.1320.0980.8954.54 × 106
43.6772.0120.1110.0940.8574.82 × 106
54.1952.1080.1280.0990.9984.56 × 106
64.1862.1280.1390.0900.9284.43 × 106
73.7602.0340.1140.0920.8824.88 × 106
84.0882.1740.1260.090.9394.51 × 106
94.0402.1980.1400.0930.9724.48 × 106
103.7342.1030.1100.0920.8354.83 × 106
Table 15. Pareto solutions optimized using surrogate model.
No.Length
[m]
Coordinates
[m]
Surge
[m]
Heave
[m]
Pitch
[°]
Yaw
[°]
ACCE
[m/s2]
VFair
[N]
1626.6−604.63.5101.9980.1050.09280.8214.998 × 106
2884.0−803.23.5232.0080.1140.09760.8184.556 × 106
3882.8−809.63.5372.0030.1120.09640.8104.605 × 106
4606.5−583.63.5522.0060.1040.09230.8374.995 × 106
5606.5−583.63.5532.0060.1040.09230.8374.995 × 106
6875.8−806.83.5542.0120.1110.09600.8064.639 × 106
7881.9−815.33.5622.0020.1100.09540.8034.652 × 106
8874.6−811.23.5722.0120.1100.09120.7984.679 × 106
9875.5−816.03.5882.0090.1090.09030.7864.706 × 106
10678.9−676.43.6042.0180.0990.09170.8015.202 × 106
11873.2−826.03.6522.0130.1070.09330.7924.800 × 106
121381.2−1351.53.6562.0930.1060.08900.7685.035 × 106
131377.3−1356.33.6582.0860.1050.08890.7765.096 × 106
141389.9−1359.13.6732.0990.1070.08870.7675.033 × 106
151394.3−1350.83.6782.1040.1080.08910.7564.941 × 106
161400.8−1347.53.7022.1020.1090.08960.7524.870 × 106
171401.8−1357.93.7162.0940.1080.08890.7594.939 × 106
181219.7−1183.33.8392.0640.1040.08890.7634.921 × 106
191222.1−1190.13.8602.0690.1040.08880.7624.957 × 106
201225.8−1198.13.8792.0720.1030.08880.7614.994 × 106
Table 16. Global response statistics for optimized configurations based on time-domain model.
Surge
[m]
Heave
[m]
Pitch
[°]
Yaw
[°]
ACCE
[m/s2]
VFair
[N]
3.5641.9910.1020.0870.7844.61 × 106
Error2.05%0.22%1.03%4.64%1.78%1.41%
Disclaimer/Publisher’s Note: The statements, opinions and data contained in all publications are solely those of the individual author(s) and contributor(s) and not of MDPI and/or the editor(s). MDPI and/or the editor(s) disclaim responsibility for any injury to people or property resulting from any ideas, methods, instructions or products referred to in the content.

