Article

Research on the Effect of a Heave Plate on the Dynamics of the Floating Wind Turbine Using Model Tests

1
Northeast Electric Power Design Institute Co., Ltd. of China Power Engineering Consulting Group, Changchun 130021, China
2
State Key Laboratory of Hydraulic Engineering Intelligent Construction and Operation, Tianjin University, Tianjin 300072, China
*
Author to whom correspondence should be addressed.
J. Mar. Sci. Eng. 2024, 12(10), 1808; https://doi.org/10.3390/jmse12101808
Submission received: 11 September 2024 / Revised: 2 October 2024 / Accepted: 9 October 2024 / Published: 10 October 2024

Abstract

:
The increasing demand to harness offshore wind resources has pushed offshore wind turbines into deeper waters, making floating platforms more economically feasible than bottom-fixed ones. When the incident wind and wave forces act on the floating wind turbine, the floating platform will experience oscillations around its equilibrium position in six degrees of freedom (DOFs). Significant floater motions can affect the aerodynamic power output, increase the failure risk, and even shorten the operational lifetime, especially under a harsh offshore environment. To improve the dynamic behavior of the floating platform, this research designed a heave plate for an OC4-Deepcwind wind turbine. The dynamic performance of the wind turbine was specifically investigated based on a series of wave-basin model tests, including free decay tests, regular wave tests, and irregular wave with steady wind tests. The results show that the heave plate increases damping in heave and pitch motions. The weakening effect on the heave and pitch motion is obvious in the wave period of 15–20 s and 20–27 s, respectively. However, the arrangement of the heave plate may exacerbate the fluctuation of the force and moment at the bottom of the tower.

1. Introduction

As the demand for clean energy grows and land-based wind farms face limitations, offshore wind power has become crucial [1]. For water depths exceeding 50 m, the cost of fixed platforms increases significantly. As a result, floating offshore wind turbines are a more economically viable option [2]. Researchers have focused on studying floating offshore wind turbines to promote the development of clean energy in deep waters.
Musial et al. (2004) [3] evaluated the feasibility of floating platform systems in wind-power generation and presented different types of floating platforms, including floater design, mooring systems, anchors, and dynamics characteristics. The study suggested that the possibility of cost reduction is possible through system optimization. Jonkman (2007) [4] subsequently compared various analysis methods and proposed an integrated simulation framework to enhance the dynamics modeling and load analysis of offshore floating wind turbines. This framework aimed to improve the accuracy of earlier analysis methods and models by considering the interactions between the turbine, floating platform, and environmental factors. Robertson and Jonkman (2011) [5] used fully coupled simulation tools (FAST, Aero Dyn, Hydro Dyn) to analyze the dynamic response of 5 MW floating wind turbines with different floating platforms, such as the barge-type, semi-submersible, the TLP-type, and the spar-type. The findings indicate that the loads are the highest in the turbine supported by the barge. In addition, Luxcey et al. (2011) [6] developed the aero–hydro–elastic program to calculate the kinematic response of turbines.
The computational theories and procedures for analyzing floating wind turbines have seen significant advancements. However, there is a need to optimize the kinematic response of floating wind turbines because they experience various environmental loads that cause them to undergo large motions, which affect their power generation efficiency [7] and stability.
Two main approaches have been taken to enhance the motion performance of the platform. The first was to design a new type of platform for floating wind turbines. Boo et al. (2017) [8] designed and developed the Y-Wind, a novel semi-submersible wind turbine. Hegde and Nallayarasu (2023) [9] introduced a concept involving the integration of a floater structure and a heave plate near the free surface of a spar-type platform, a platform that is specifically designed to support NREL 5MW wind turbines. The comprehensive design process of the Y-Wind platform considered construction costs and industry standard requirements, demonstrating an innovative approach to semi-submersible floating wind turbines. Li (2019) [10] proposed a concept of a semi-spar-type offshore floating wind turbine platform specifically designed to support NREL 5MW wind turbines. The hydrodynamic performance of this new type of floating wind turbine platform is excellent, and it demonstrates a reduced pitch amplitude response compared to conventional floating platforms. Caixin (2022) [11] designed a floating wind turbine platform with inclined side columns for the NREL 5MW wind turbine and compared it with OC4-Deepcwind and OC3-spar-type platforms in terms of hydrodynamics. The results showed that the new type of platform can effectively enhance the hydrodynamic coefficient and obtain better stability. The second is the adding of the heave plate to the existing platform to optimize the floating platform motion response. Subbulakshmi and Sundaravadivelu (2016) [12] investigated the impact of single and double heave plates on the damping characteristics of a spar-type offshore wind turbine. The heave damping was determined by conducting model tests. The results indicate that the ideal ratio of the heave plate to spar diameter falls within the range of 1.2–1.4. The optimal ratio between the position of the heave plate above the keel of the spar and the draft of the spar is about 0.4. Zheng et al. (2022) [13] conducted a study aimed at enhancing the OC3-Hywind spar platform through the integration of a heave plate. This modified design was integrated with the NREL 5MW wind turbine. The experimental results showed a significant improvement in the motion characteristics of the turbine. The utilization of the heave plate effectively reduced the amplitudes of both the surge and heave motions, thereby contributing to an overall improvement in stability. Through a combination of experimental investigations and numerical simulations, the study demonstrated the effectiveness of this device in reducing the motion response of heave and pitch.
This paper focuses on the dynamic response of the OC4-Deepcwind floating wind turbine. Based on the floating wind turbine, a novel heave plate was developed to mitigate the motion response of the turbine. Model tests are conducted to evaluate the performance of floating wind turbines, both with and without a heave plate. The findings of this study support the development of the heave plate in floating wind turbine design.
The paper is constructed as follows: Section 2 focuses on the setup of the model test, and the test cases are also introduced. Section 3 provides the test results and discusses them. The impact of the heave plate on the damping, natural period, and dynamic response of the floating wind turbine are also analyzed. The paper is summarized in Section 4.

2. Experiment Setup

This experiment was carried out in the towing tank at Tianjin University. The dimensions of the tank are as follows: a length of 135 m, a width of 7 m, and a depth of 3.6 m. According to the general practice of the international offshore engineering community, the standard scaling ratio for the model testing of offshore engineering platforms is 40~80. Based on the configuration of the mooring system employed by the OC4-Deepcwind, along with the dimensions of the tank, the model used in this experiment is scaled at a ratio of 1:50 to the actual wind turbine.
Regarding the similarity criteria, considering that the primary objective of this study is to analyze the overall dynamic response of the wind turbine system, we ensure the geometric similarity of the wind turbine blades and maintain a consistent Froude number, and the thrust similarity method was employed for correction. As for the thrust similarity method, the specific approach is to increase the wind speed of the model to ensure the accurate simulation of the axial thrust on the rotor, which is important to ensure an accurate aerodynamic force for the floating wind turbine. This is a common method used internationally to address the low Reynolds number issue under Froude number similarity conditions [14].

2.1. Floating Wind Turbine Model

Figure 1 presents a comprehensive depiction of the fundamental elements comprising the floating wind turbine. These components encompass the nacelle, hub, tower column, blades, and platform, in addition to the heave plate and mooring system.
The semi-submersible floating platform comprises a middle column, three side columns, and a truss support structure. For the model, these components were replicated by using organic glass. The heave plate model was designed in the shape of an annular structure, as shown in Figure 2; the outer circle radius is 320 mm and an inner circle radius is 160 mm. Eight evenly distributed holes with radii of 25 mm were designed to improve the hydrodynamic performance of the heave plate by sensitivity analysis using CFD software (ANSYS Fluent 2021 R1) based on the available research. We can see that each side column has its own heave plate in Figure 1.
Table 1 shows the principal dimensions of the floating platform. In the tests, after adding heave plates to the floating wind turbine, a secondary load adjustment was conducted to ensure that the main dynamic parameters, such as the center of gravity, moment of inertia, and displacement of the wind turbine with heave plates, remained consistent with those of the original floating wind turbine without heave plates.
The blade model was fabricated utilizing carbon fiber composite material to ensure similarity in terms of quality and geometric configuration to the actual blades while simultaneously satisfying the necessary structural strength. The use of organic glass and carbon fiber composite materials demonstrates innovation in lightweight design and structural strength in the model test, which closely resembles the actual object and is crucial for enhancing the performance of the floating wind turbine model. Additionally, to mitigate blade vibrations during the experiment, a sturdy linkage, as seen in Figure 3, was established between the hub and the blade, which was designed by our team to be a novel structure maintaining the stability of blades. The nacelle and tower models employed in the experiment are constructed using aluminum material, ensuring their durability and structural integrity. The rotation speed of the blade was adjusted by a motor installing in the nacelle.
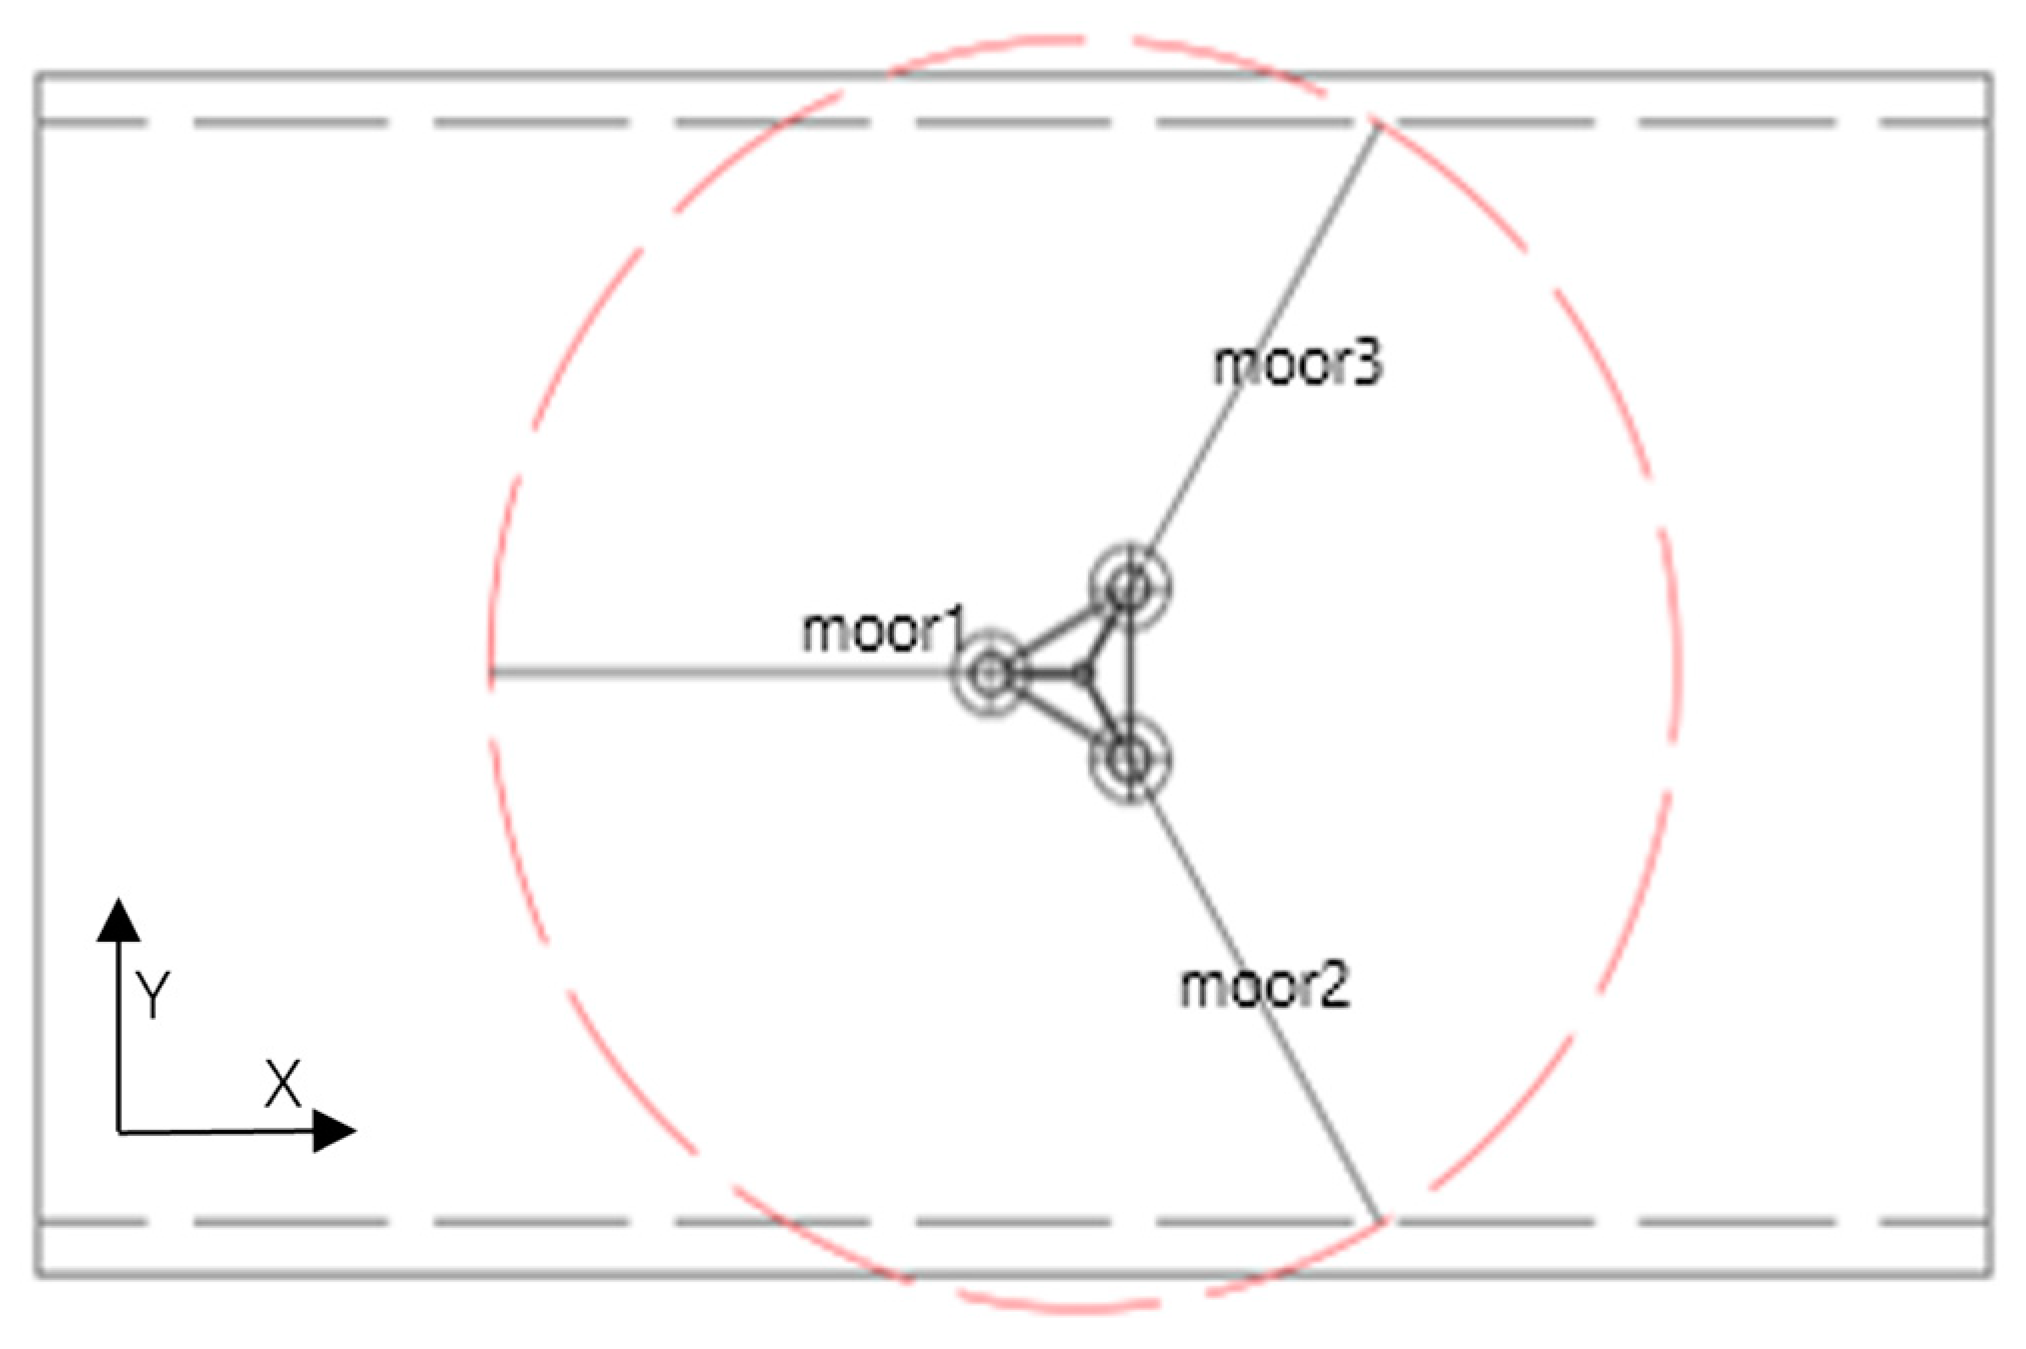
The mooring system adhered to the design of OC4, which consists of three mooring lines that are uniformly spaced 120° apart, as illustrated in Figure 4 [15,16]. The truncated mooring lines were designed as the constraints of the tank.

2.2. The Test Equipment

The environmental conditions in this study mainly involve wind and waves. The wave maker has a maximum wave height capability of 0.35 m. The wave dissipation beach is placed on the opposite side of the wave generator to effectively mitigate the reflected waves. The wind field is simulated by using an array of 10 axial fans with a maximum outlet wind speed of 10 m/s. The motion of the floater is tested by the optical motion test equipment, and tension sensor is used to test the mooring force. In addition, a six-dimensional force transducer is arranged at the bottom of the tower column where it connects to the floating platform, to measure the six-degree-of-freedom forces at the bottom of the tower.

2.3. Test Cases

The experiment comprises three phases. These are the decay tests, regular wave (RC1-6), and irregular wave (LCx-y, where x = 1, 2, 3, 4; y = 1, 2), with and without the heave plate, as shown in Table 2.
The experiments are carried out in mooring conditions, with and without the heave plate. The wave direction is aligned with the No.1 mooring line in the 0° direction. A statistical analysis is conducted on the response data to analyze the performance of the system. In the irregular wave tests (LC), the combined effect of wind and waves is considered. The directions of the wind and waves are all 0°, including four states that are cut-in (the lowest wind speed at which the turbine starts to generate power), rated (the wind speed at which the turbine generates its full rated power), cut-out (the maximum wind speed at which the turbine operates), and survival (the maximum wind speed that the turbine structure is designed to withstand when not operating, once in a hundred years) conditions. During the operating conditions, the rotational speed of the wind turbine is adjusted to match the prevailing wind velocity. In survival conditions, the rotation of the wind turbine is stopped.
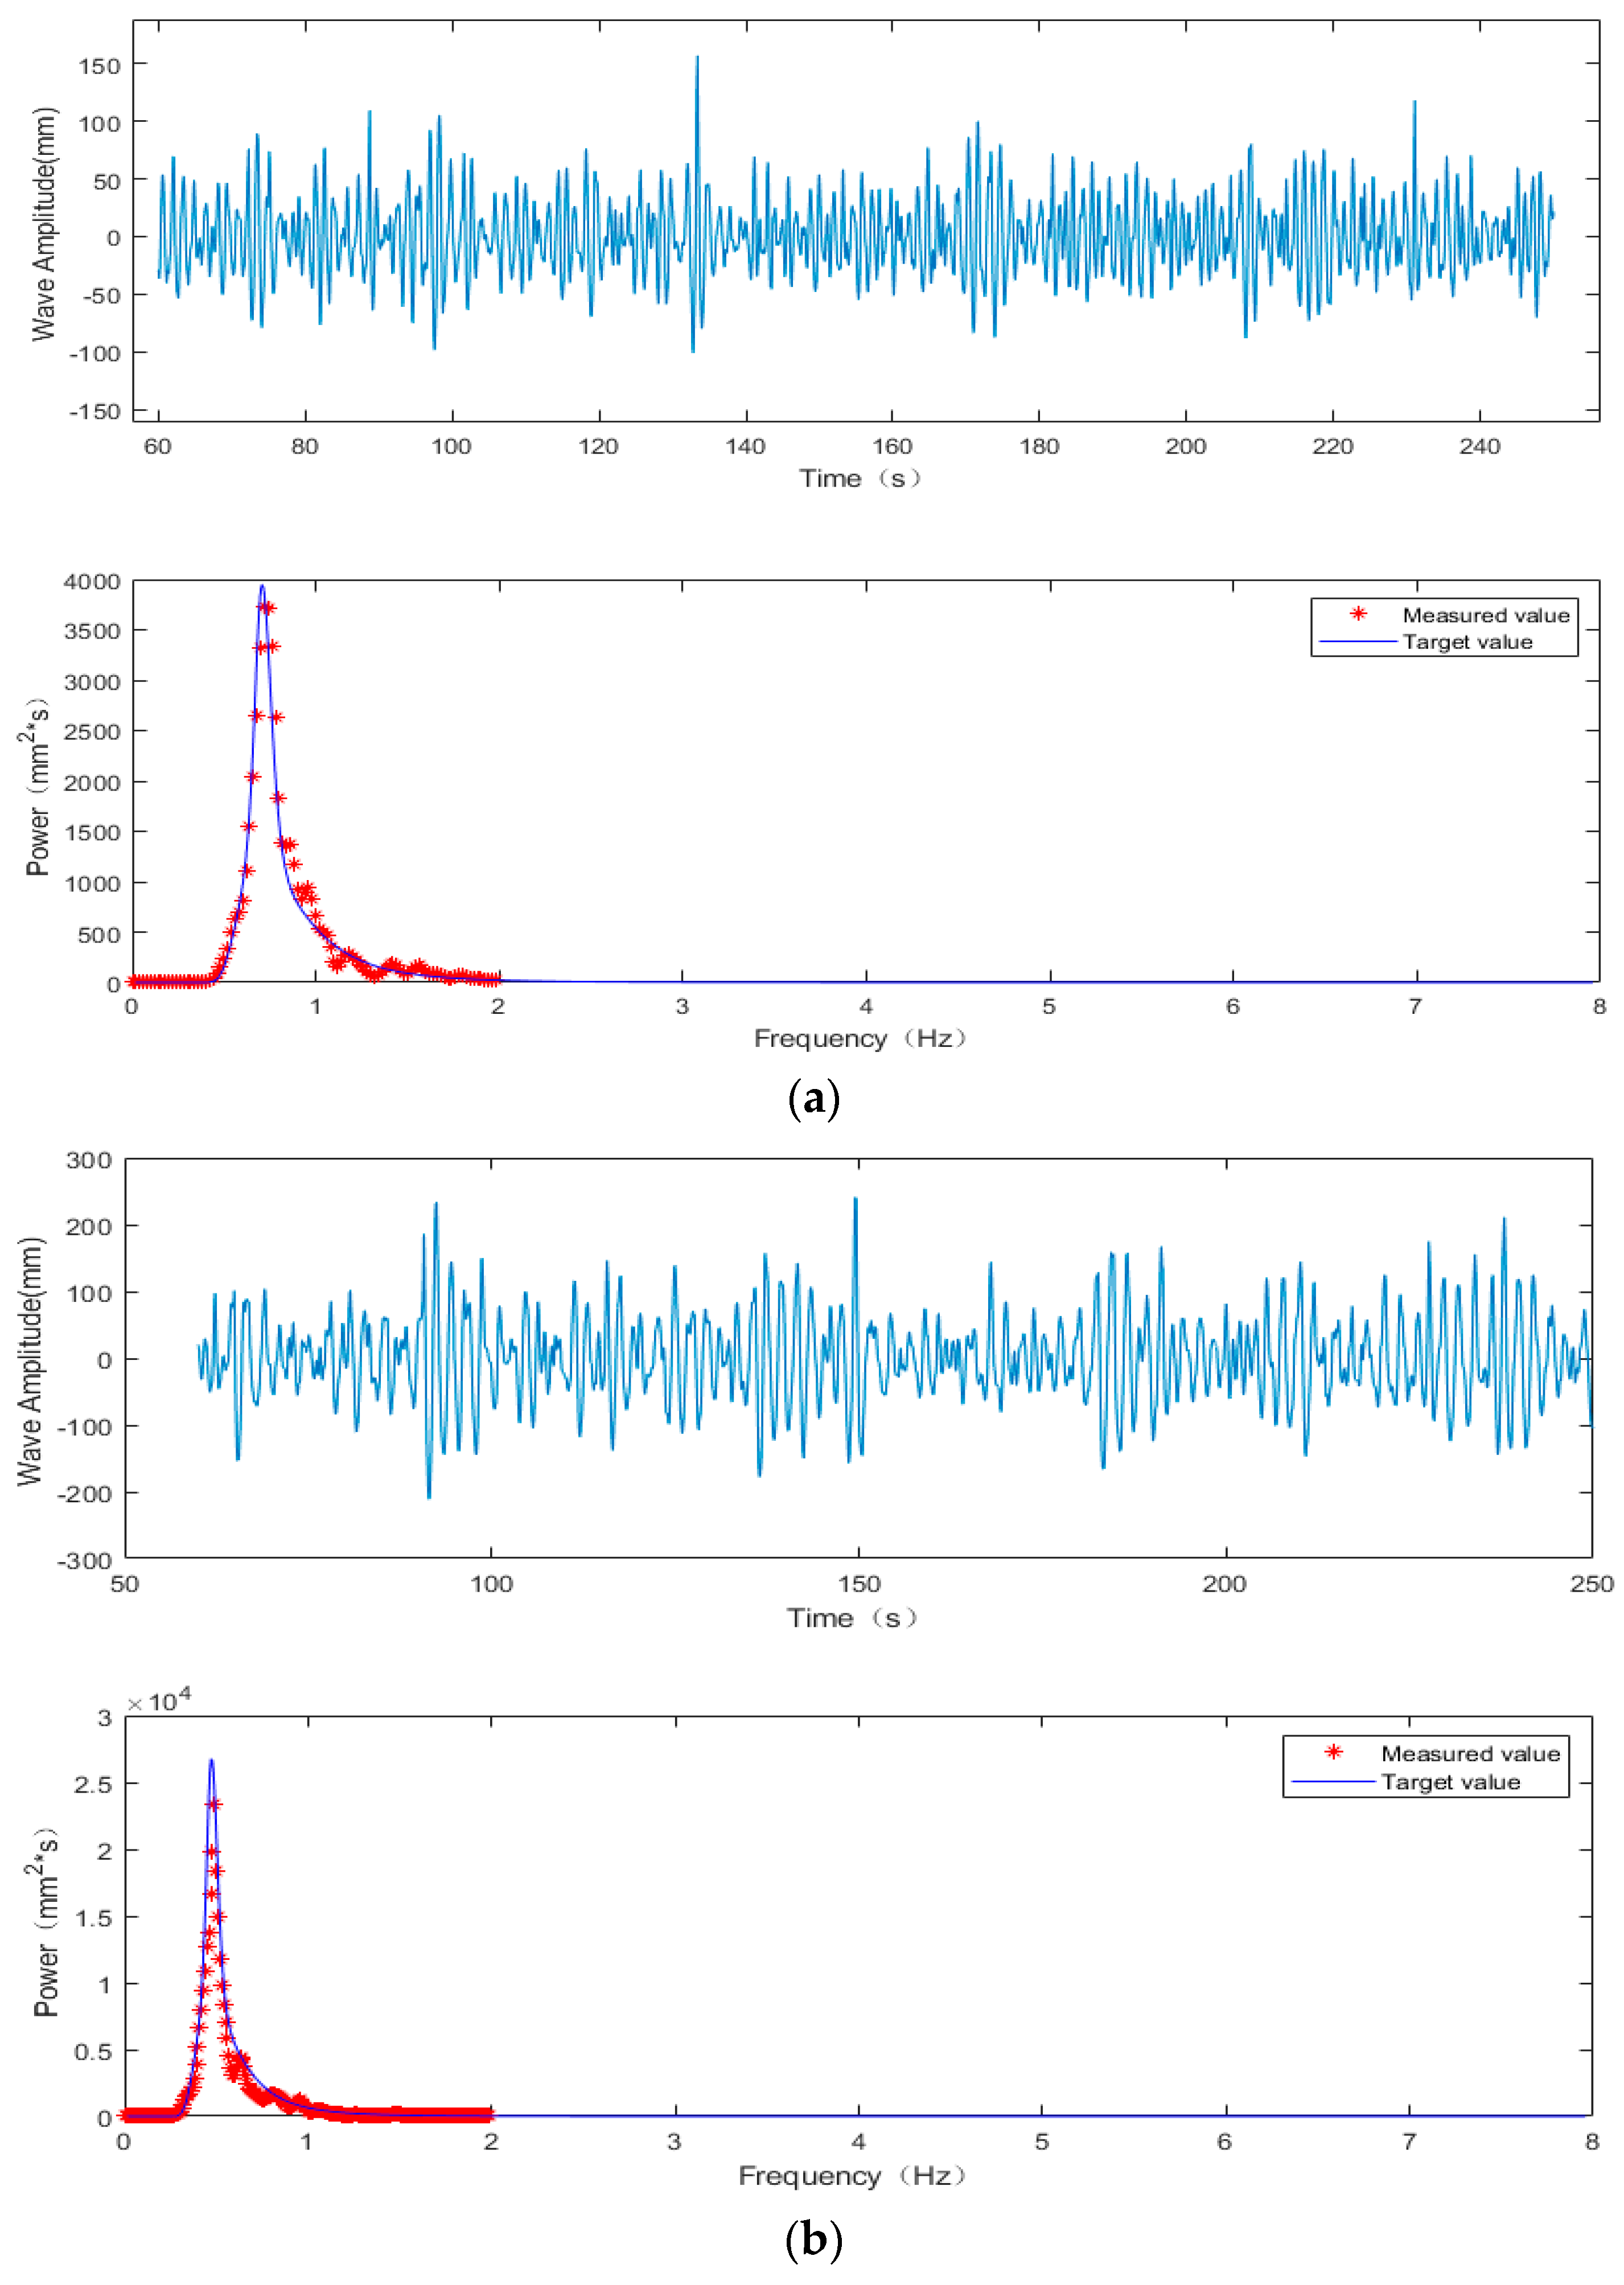
Before the tests, it is necessary to make corrections of the waves, which is an important series of procedures to make the waves generated by the facilities match the predefined criteria for testing. The time-domain curves and spectral shapes of the irregular waves of the experiment are compared with the target values, as shown in Figure 5. The results show that the measured wave spectrum agrees well with the target spectrum.
To assess the efficiency of the wind generation system, the turbulence intensity is analyzed. It is found that the measured wind speed exhibits a generally uniform distribution. In fact, in most regions on the swept plane, the turbulence intensity of the wind fan system is less than 13%.

3. Results and Discussion

3.1. The Decay Tests

This section explores the impact of the heave plate on dynamical property of a floater, with a specific focus on its influence on the natural period and damping.
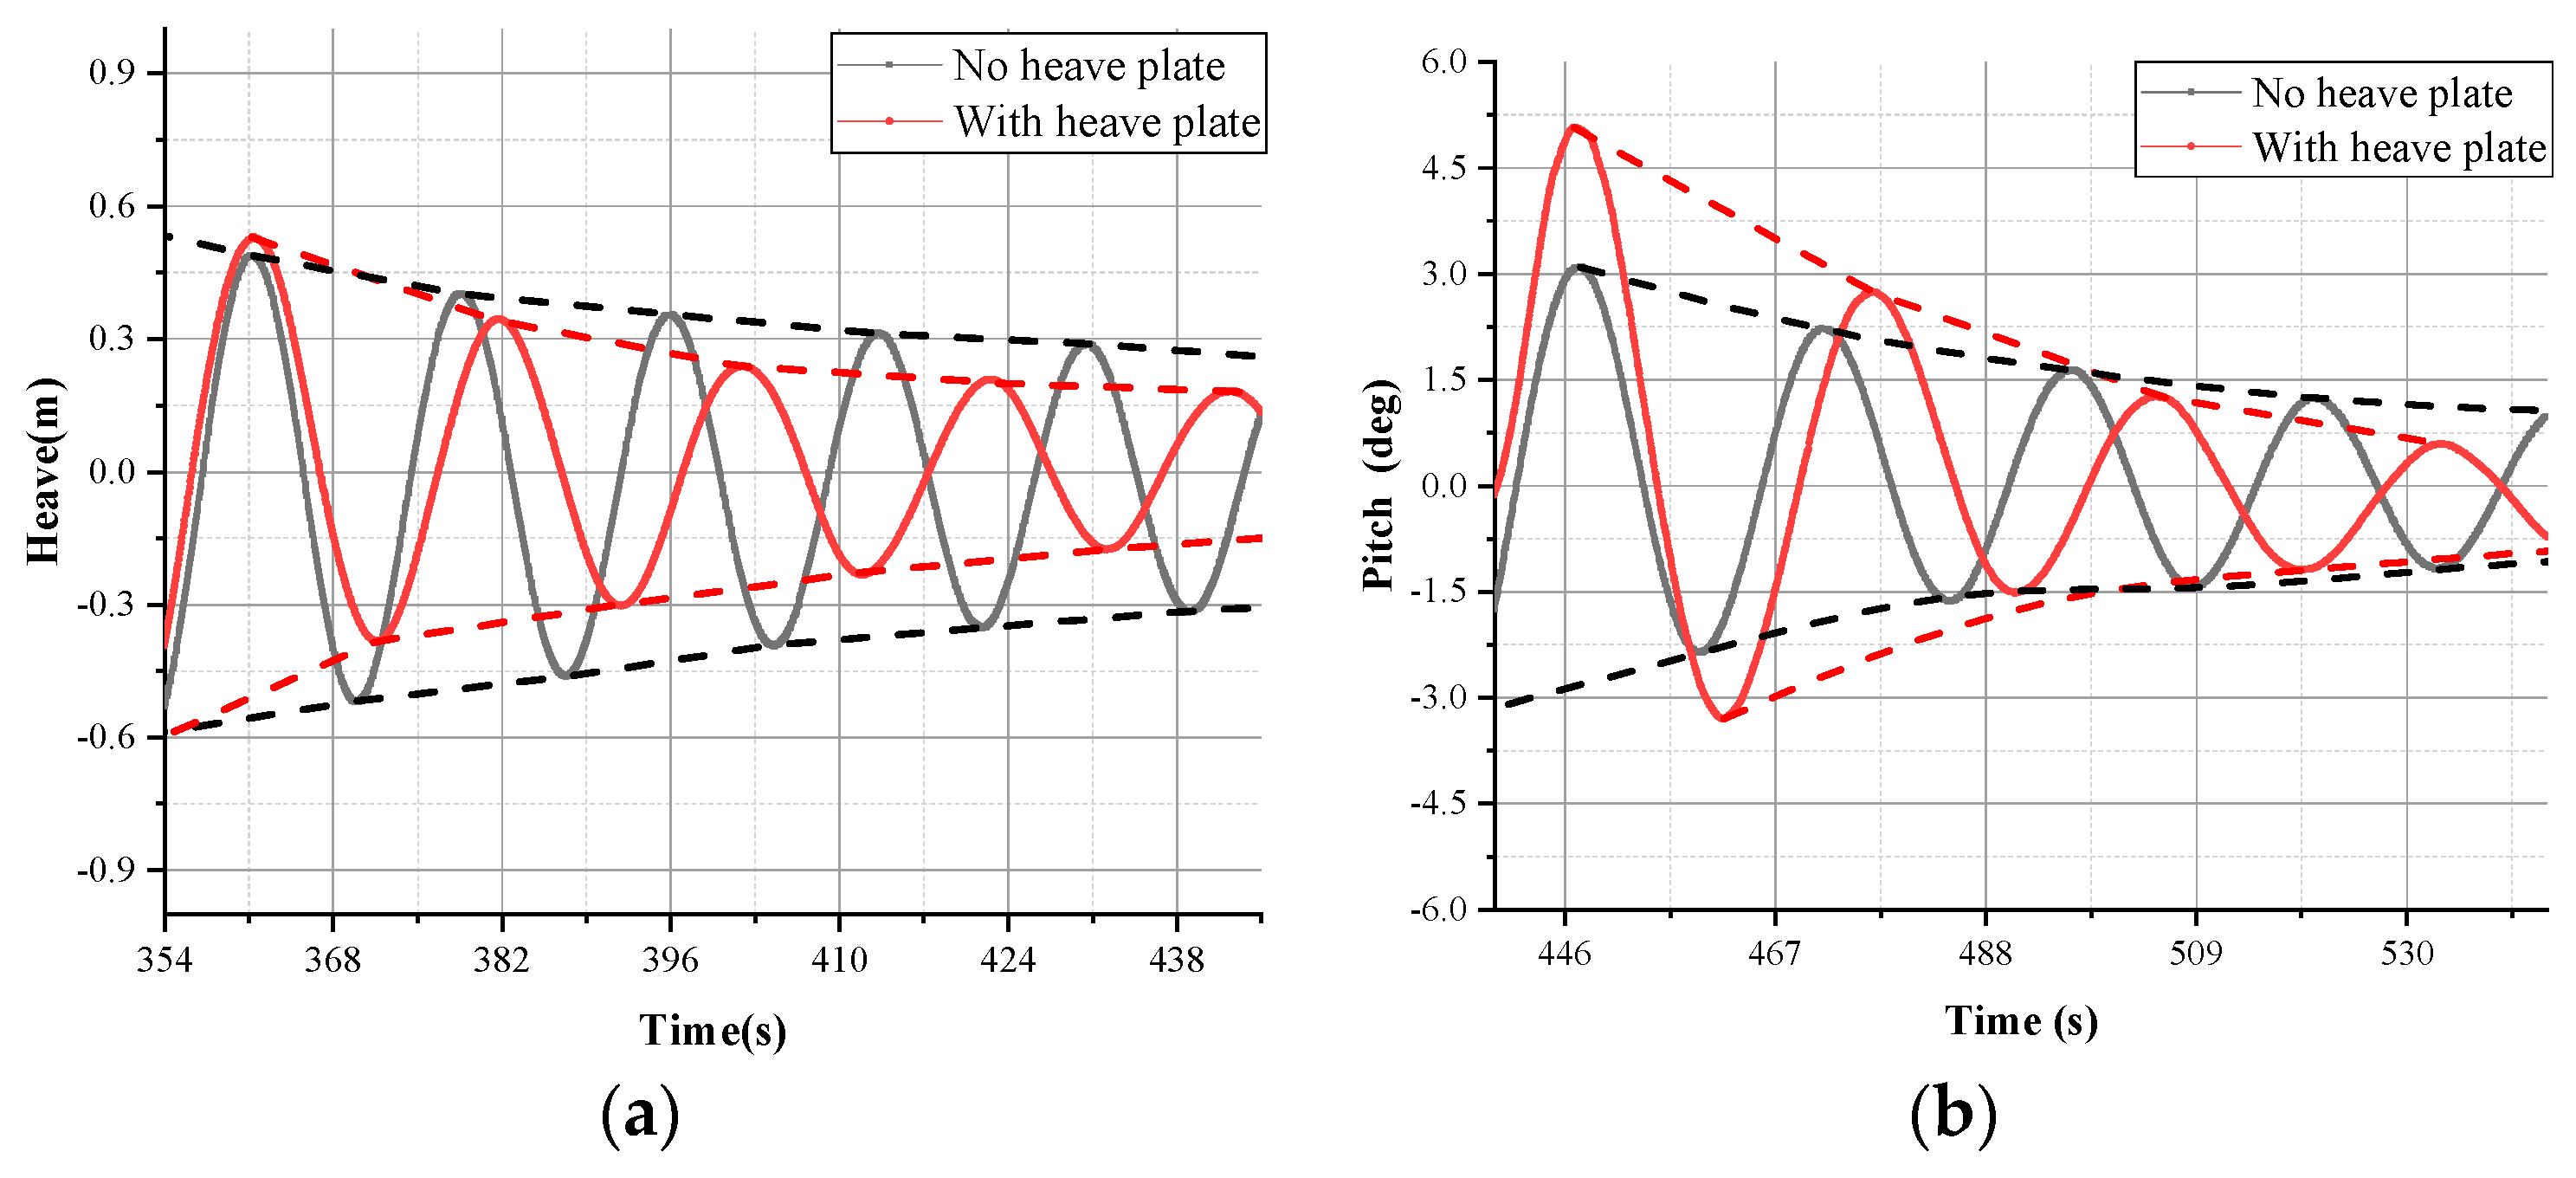
The attenuation curves for heave and pitch were obtained as shown in Figure 6. The natural period and damping of the floater with and without heave plate were calculated as shown in Table 3. The installation of the heave plate results in a significant increase in both the natural period and the damping of the floating platform by altering the hydrodynamic interaction and increasing the added mass and damping properties of the system.

3.2. Regular Wave without Wind Tests

The regular wave tests were carried out for the RC1–RC6 cases, both with and without heave plates. The aim of these tests was to analyze the variations in the pitch and heave of the floating wind turbine.
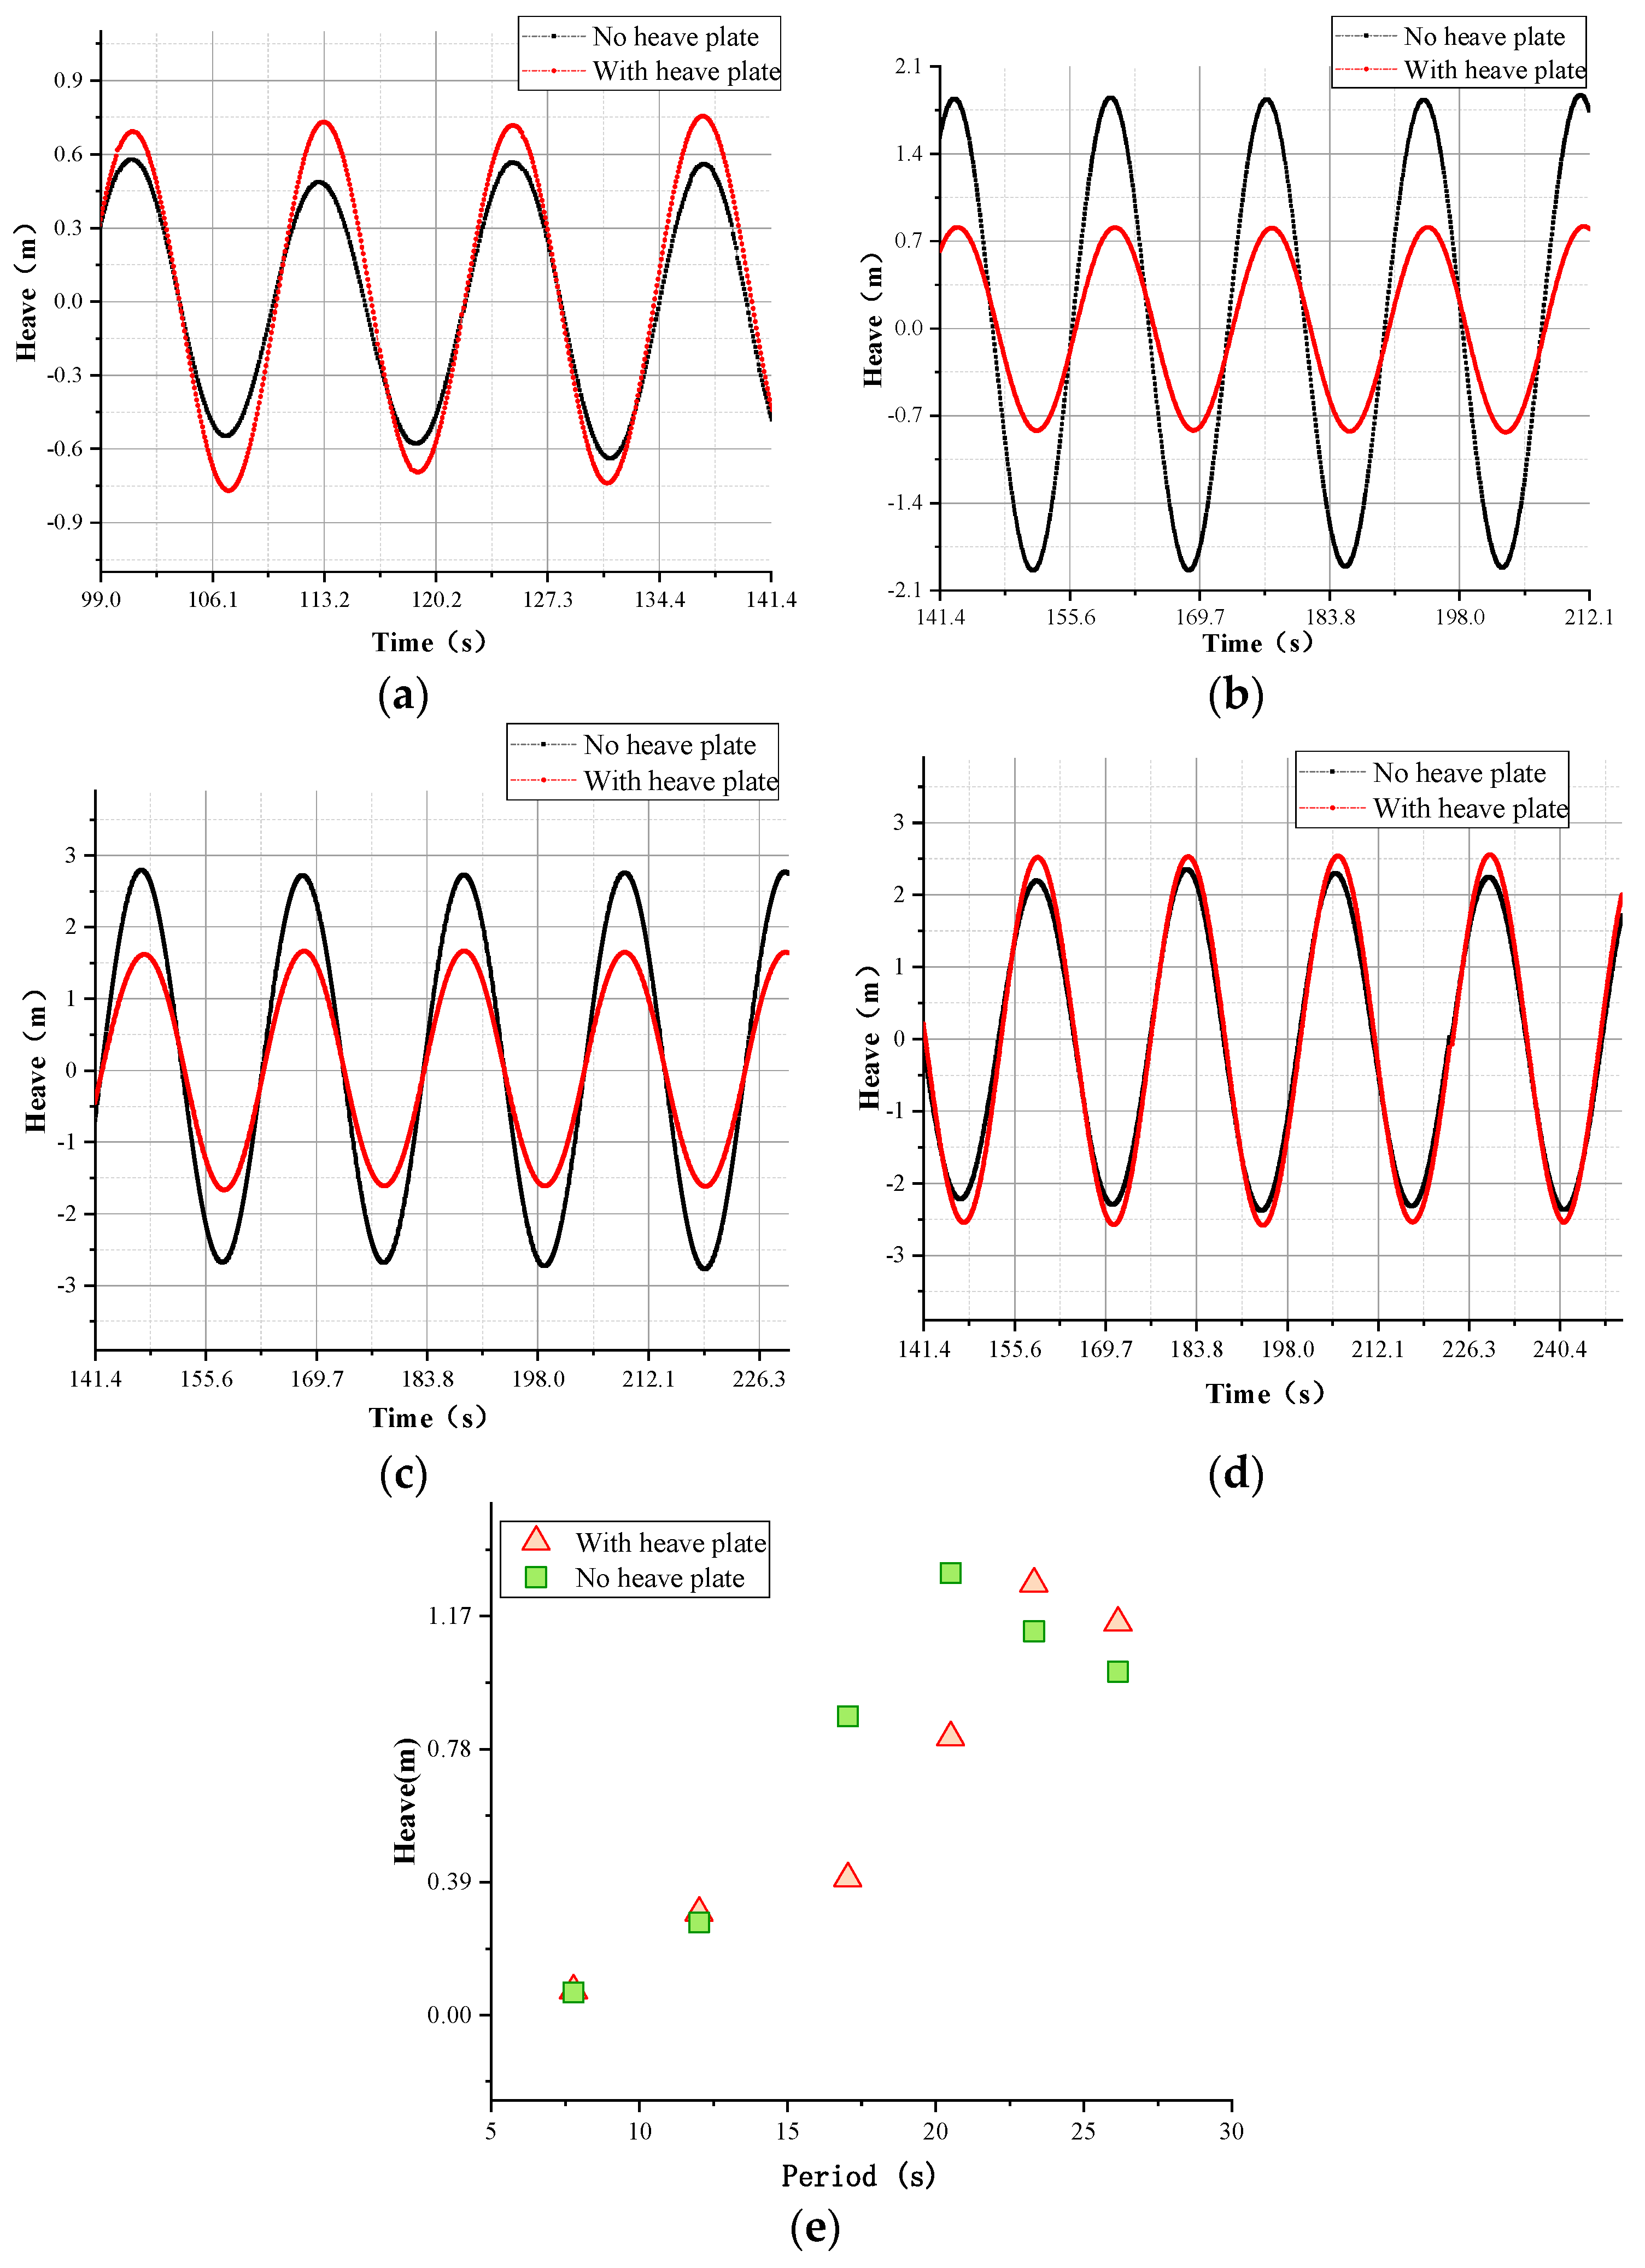
Figure 7a–d shows the comparison of heave responses for regular wave cases, and Figure 7e compares the response amplitude of the heave of the RC1–RC6 cases. When the wave period is close to the natural period of the heave, the heave plate significantly influences the heave response of the floating wind turbine. For the wave periods 17.04 s and 20.51 s, the heave amplitude decreased by 54.21% and 37.11%, respectively, after installing the heave plate. Meanwhile, for the wave periods 23.33 s and 26.16 s, the heave plate increased the heave amplitude by 13.04% and 11.1%, respectively.
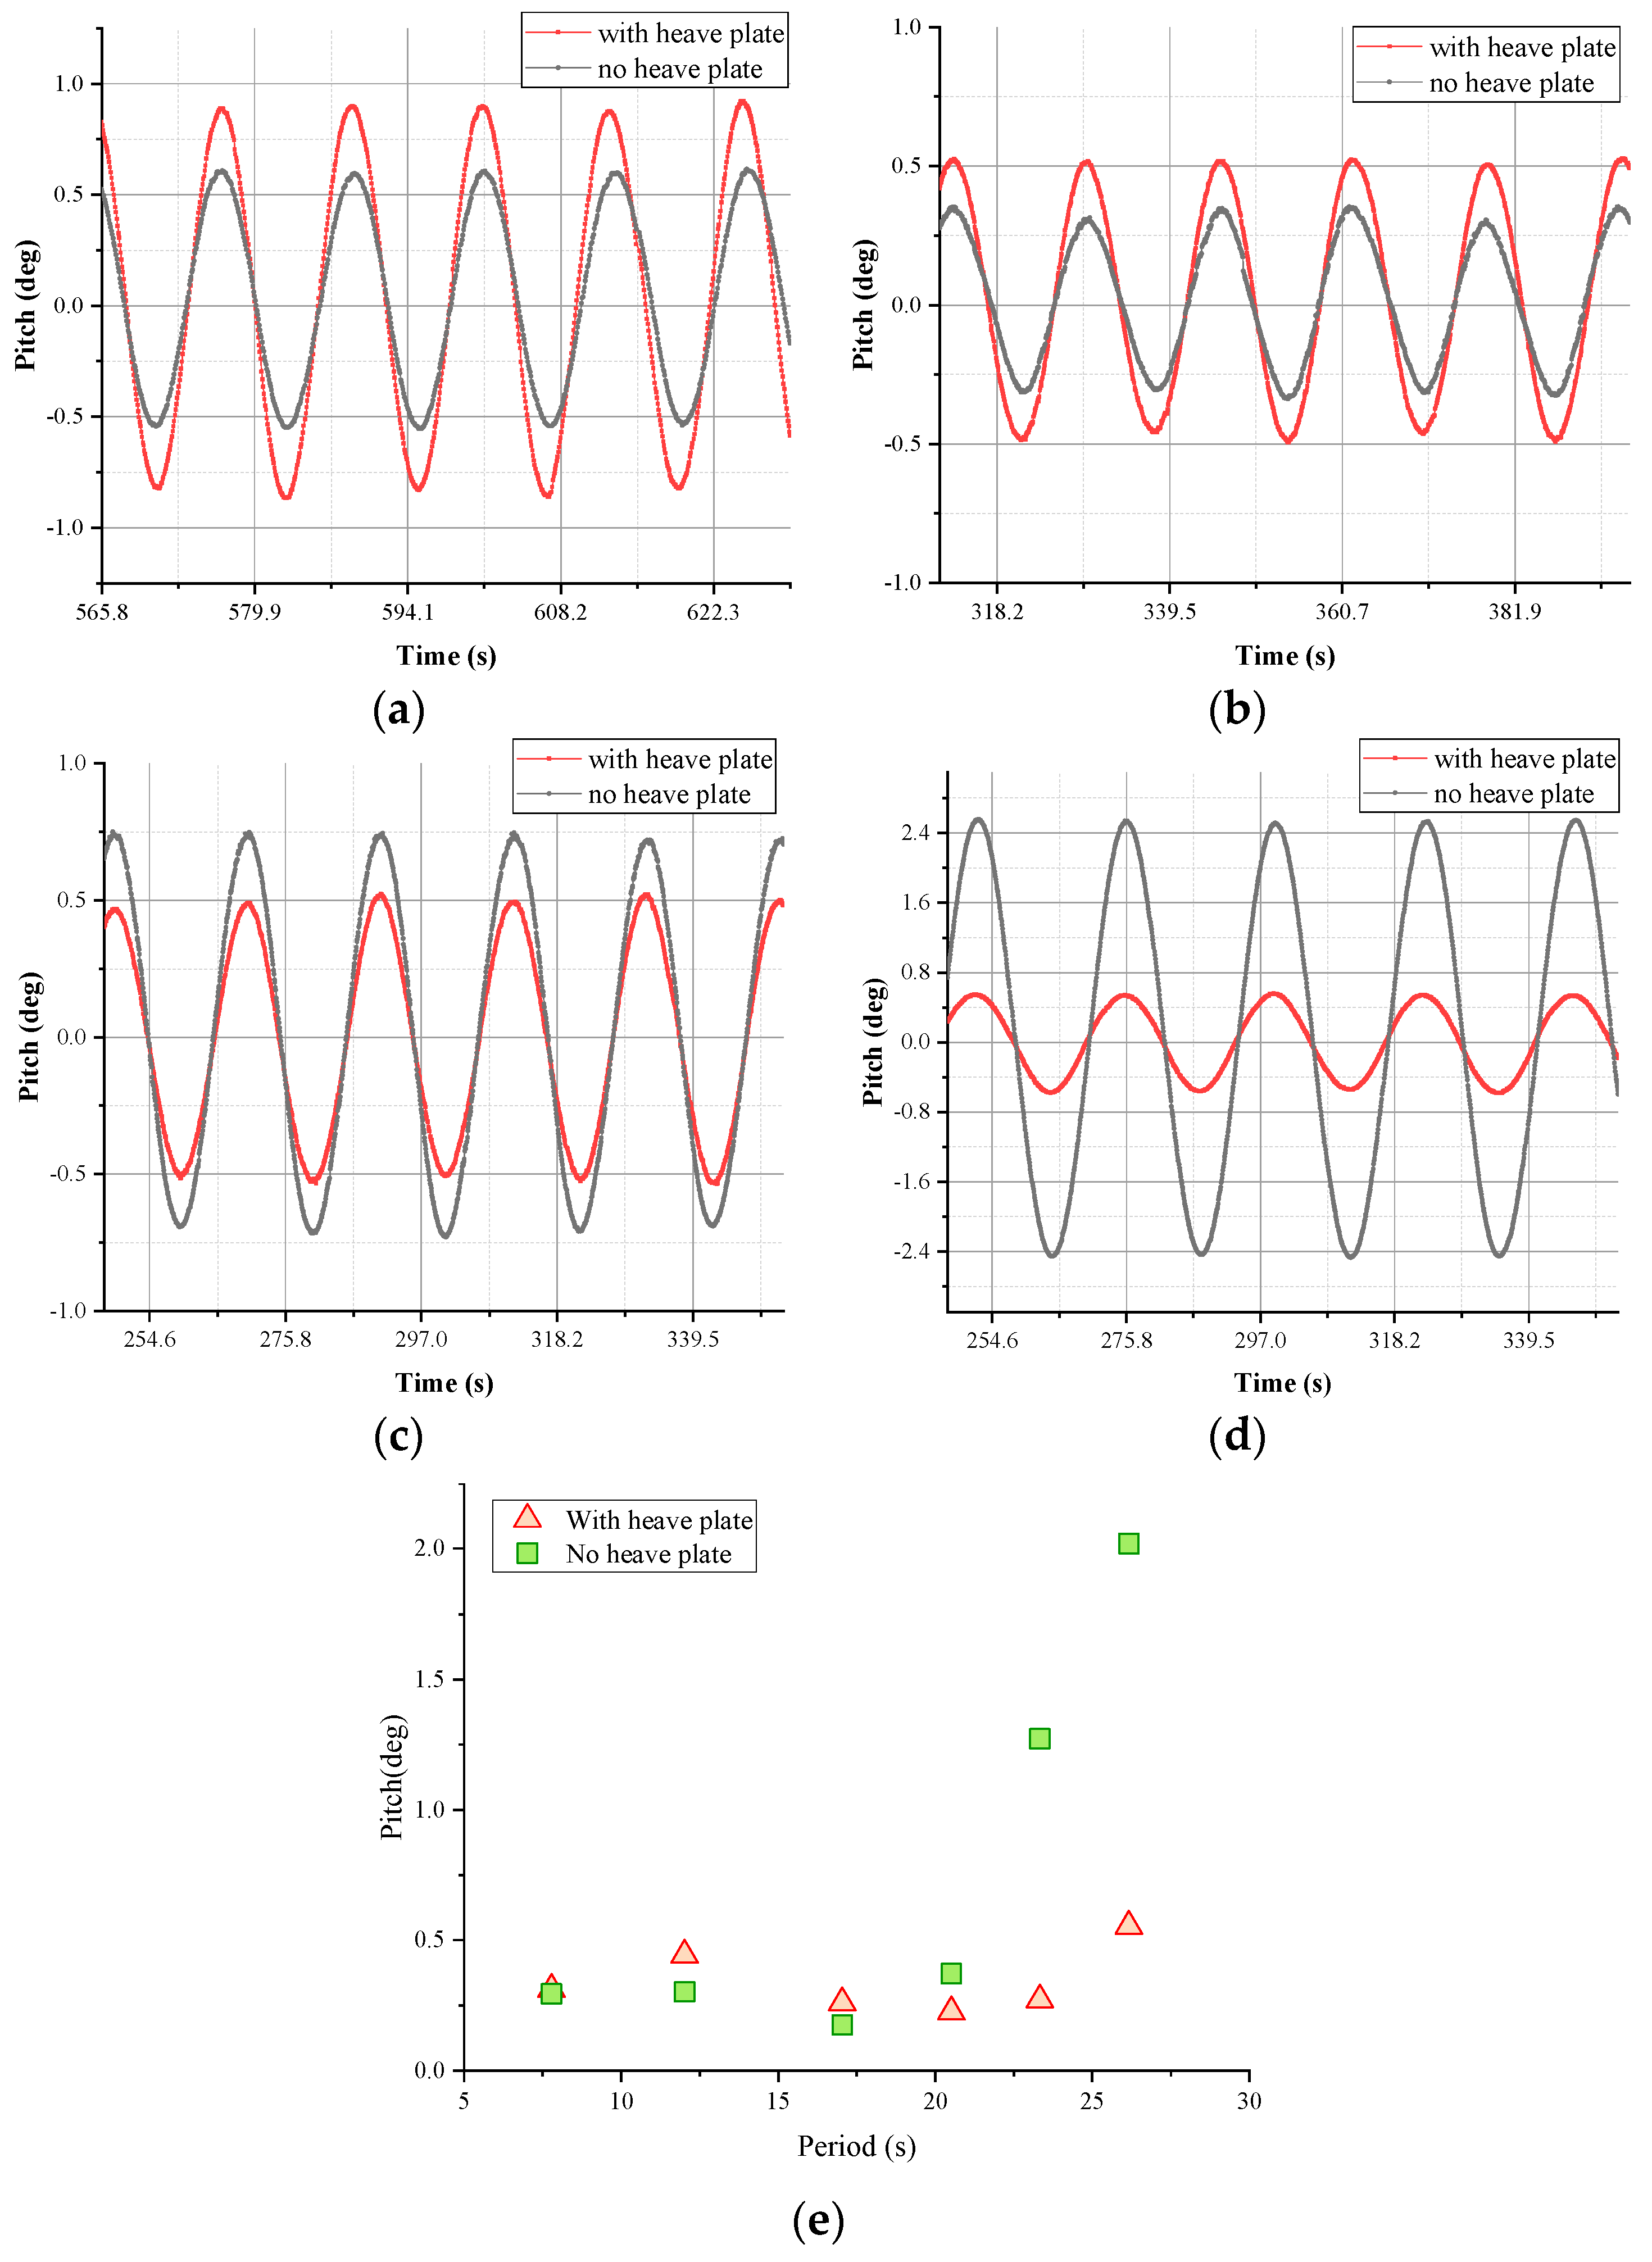
Figure 8 shows the comparison results of the pitch response observed in the regular wave experiment. When the wave period is lower than 20 s, installing the heave plate results in a slight increase in the pitch response, but the increased magnitude is below 0.5 degrees. However, for the wave period higher than 20 s, the presence of the heave plate significantly reduces the pitch response. For the wave periods 23.33 s and 26.16 s, the pitch amplitude decreased by 78.69% and 72.57%, respectively, after installing the heave plate.
To sum up, these variations in response can be attributed to the heave plate altering the hydrodynamic properties of the system. The heave plate increases the system’s added mass and damping, which enhances damping at near-resonant frequencies, reducing motion amplitude. However, at wave periods far from the natural frequency, the increased inertia due to the heave plate can lead to greater amplitudes due to the system’s delayed response to wave forces.

3.3. Irregular Wave with Steady Wind Tests

The tests of irregular wave and steady wind were carried out, with and without a heave plate. The statistical analysis of the experimental results focuses on the motion of the floater, the forces of mooring system, and the forces acting on the tower top. The analysis of floater motion specifically focuses on the surge, heave, and pitch responses with significant magnitudes, as the experimental conditions involve wind and waves in the same direction (0°). The response results of mooring lines 1 and 2 are presented, because of the symmetrical arrangement of mooring lines 2 and 3.
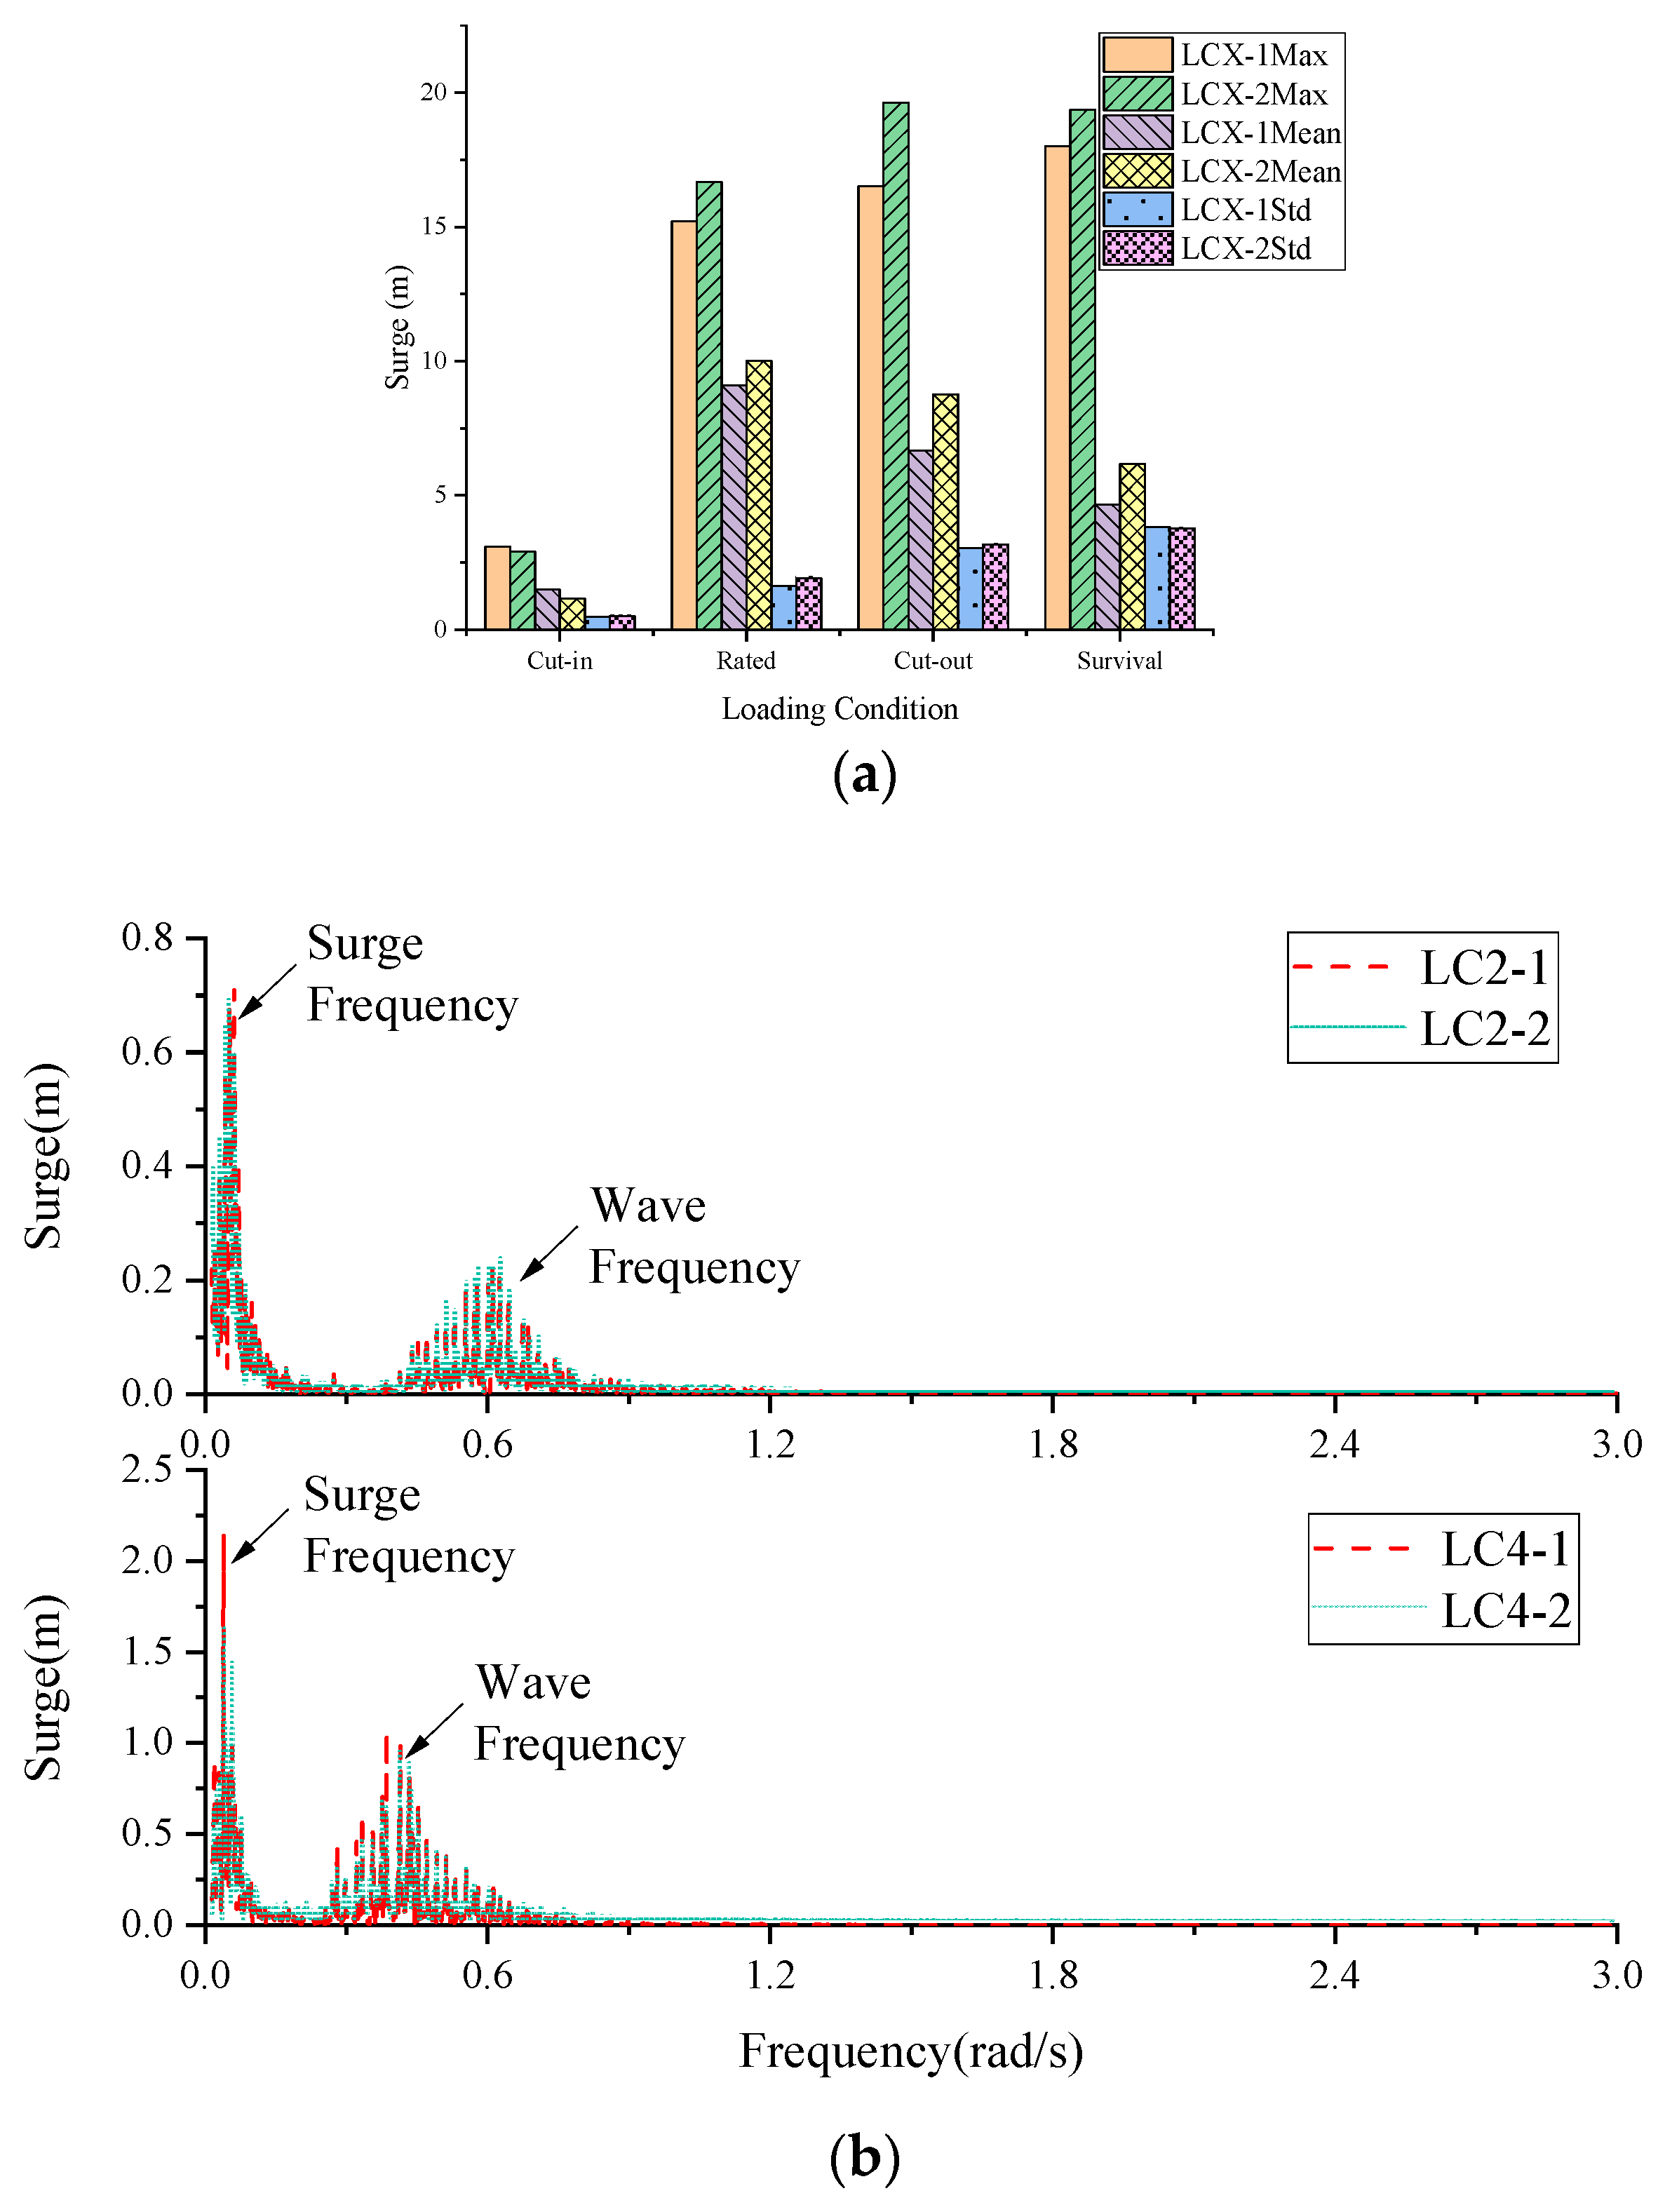
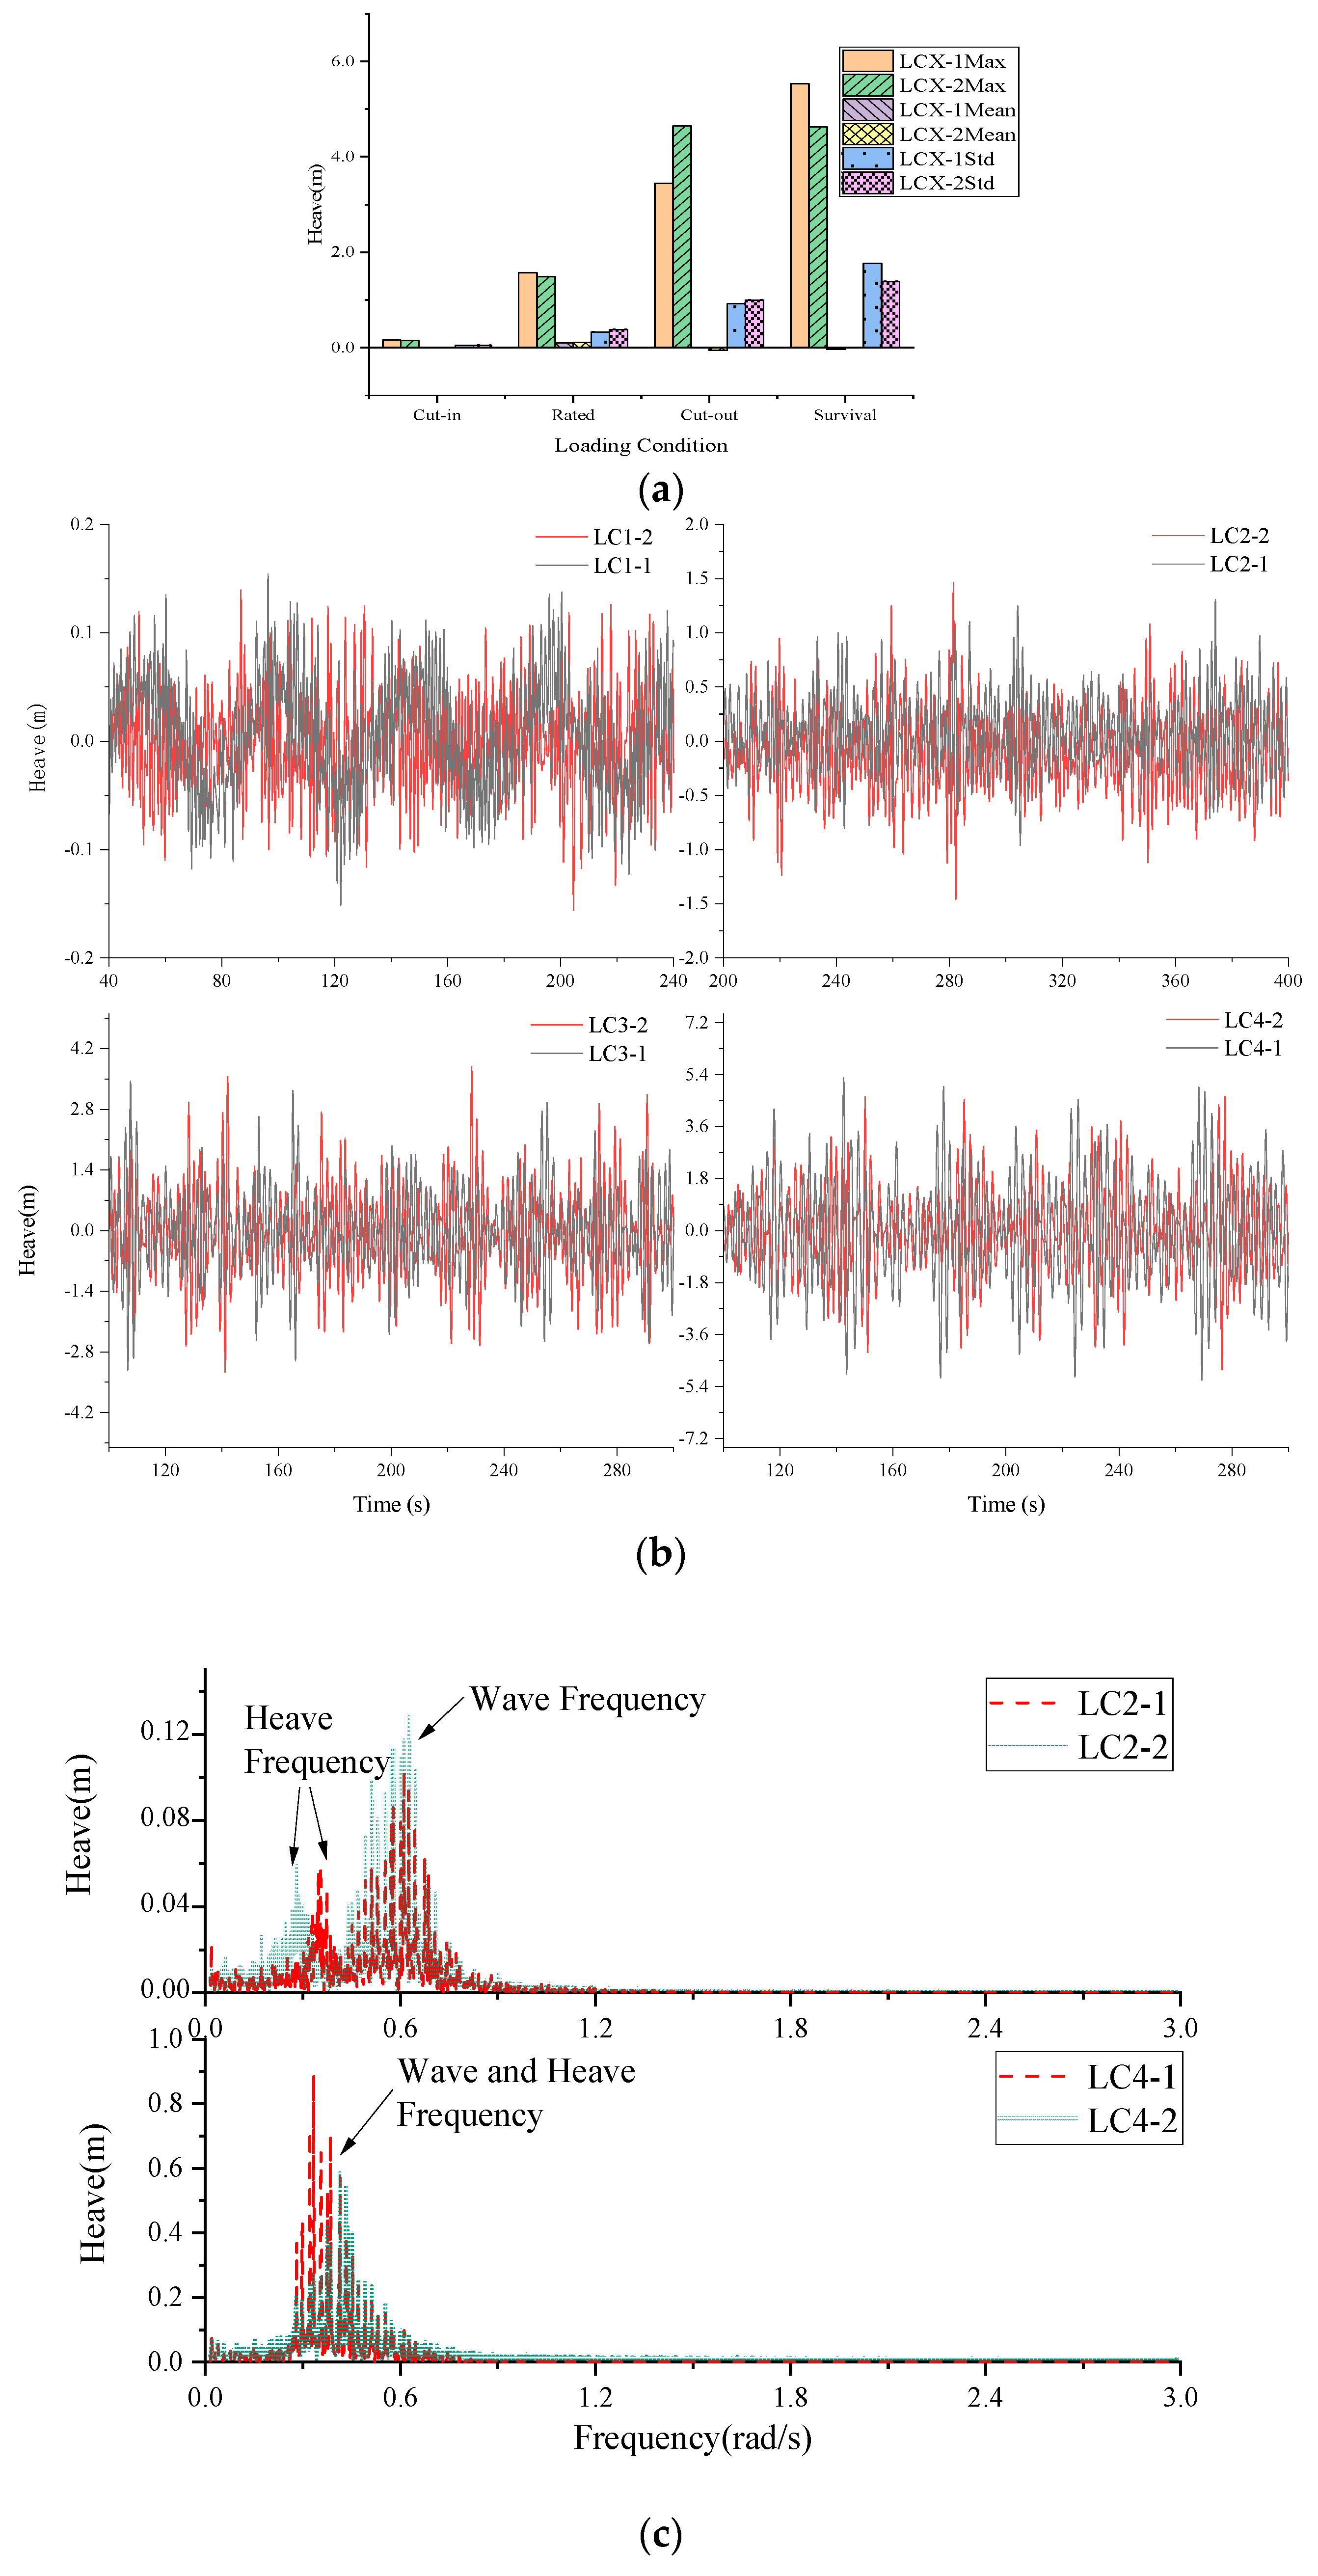
The surge, pitch and heave responses of the floater are compared in Figure 9, Figure 10 and Figure 11, where “Max” represents the maximum value, “Mean” represents the mean value, “Std” represents the standard deviation, “LCX-1” represents the cases without the heave plate, and “LCX-2” represents the cases with the heave plate.
Figure 9a shows that for the cut-in cases, the heave plate decreases both the maximum and mean values of the surge response of the floater. However, for the rated, cut-out, and survival cases, the heave plate leads to an increase in both the maximum and mean values of the surge response. No significant variance is observed in the standard deviation with and without the heave plate. The surge spectrums have two main peaks both with and without the heave plate, as shown in Figure 9b. At the natural frequency of surge, the surge amplitude of the floater without the heave plate is larger than that with the heave plate.
Figure 10 shows the comparison of the heave response of the floater, with and without the heave plate. The effects of the heave plate on the heave response of the floater are negligible for the cut-in and rated cases. However, for the cut-out case, the heave plate increases the maximum value of the heave response. For the survival cases, the heave plate leads to a significant decrease in both the maximum value and standard deviation of the heave response. The heave spectrum of the floater for the rated case has two distinct peaks, as shown in Figure 12c. The first peak, observed at around 0.3 rad/s, corresponds to the natural frequency of the heave motion of the floater. The second peak, observed at around 0.6 rad/s, corresponds to the frequency of the wave. Installing the heave plate leads to a shift of the first peak of the heave spectrum towards a lower frequency. For the survival case, the installing of a heave plate results in a notable decrease in the heave spectrum at a frequency of 0.3 rad/s, and the heave plate effectively reduces the heave response of the floater.
Figure 11 illustrates the comparison of the pitch response of the floater with and without the installation of a heave plate. It is evident that the inclusion of a heave plate leads to an increase in the maximum pitch response of the floating body under all four working conditions. Under the survival conditions, where the operational demands are intense, the average pitch motion response exhibited a negative value. Under the rated conditions, the heave plate exhibits a significant reduction in the pitch response near the natural frequency of 0.27 rad/s. This reduction suggests that the heave plate effectively dampens pitch motions. Under survival conditions, the heave plate exhibits a reduction in the pitch motion response within the frequency range of 0.2 to 0.4 rad/s, whereas it demonstrates an increase in the pitch motion response within the frequency range of 0.4 to 0.6 rad/s.
In terms of the structural motion response under the conditions with wind, waves and currents, although the heave plate may exhibit varying effects under different operational conditions and degrees of freedom, overall, its presence significantly alters the hydrodynamic characteristics of the structure. By increasing the added mass and damping, it effectively suppresses motion amplitudes at specific frequencies, thereby enhancing the structure’s stability. However, at certain frequencies, the increased structural inertia may also lead to an amplified response.
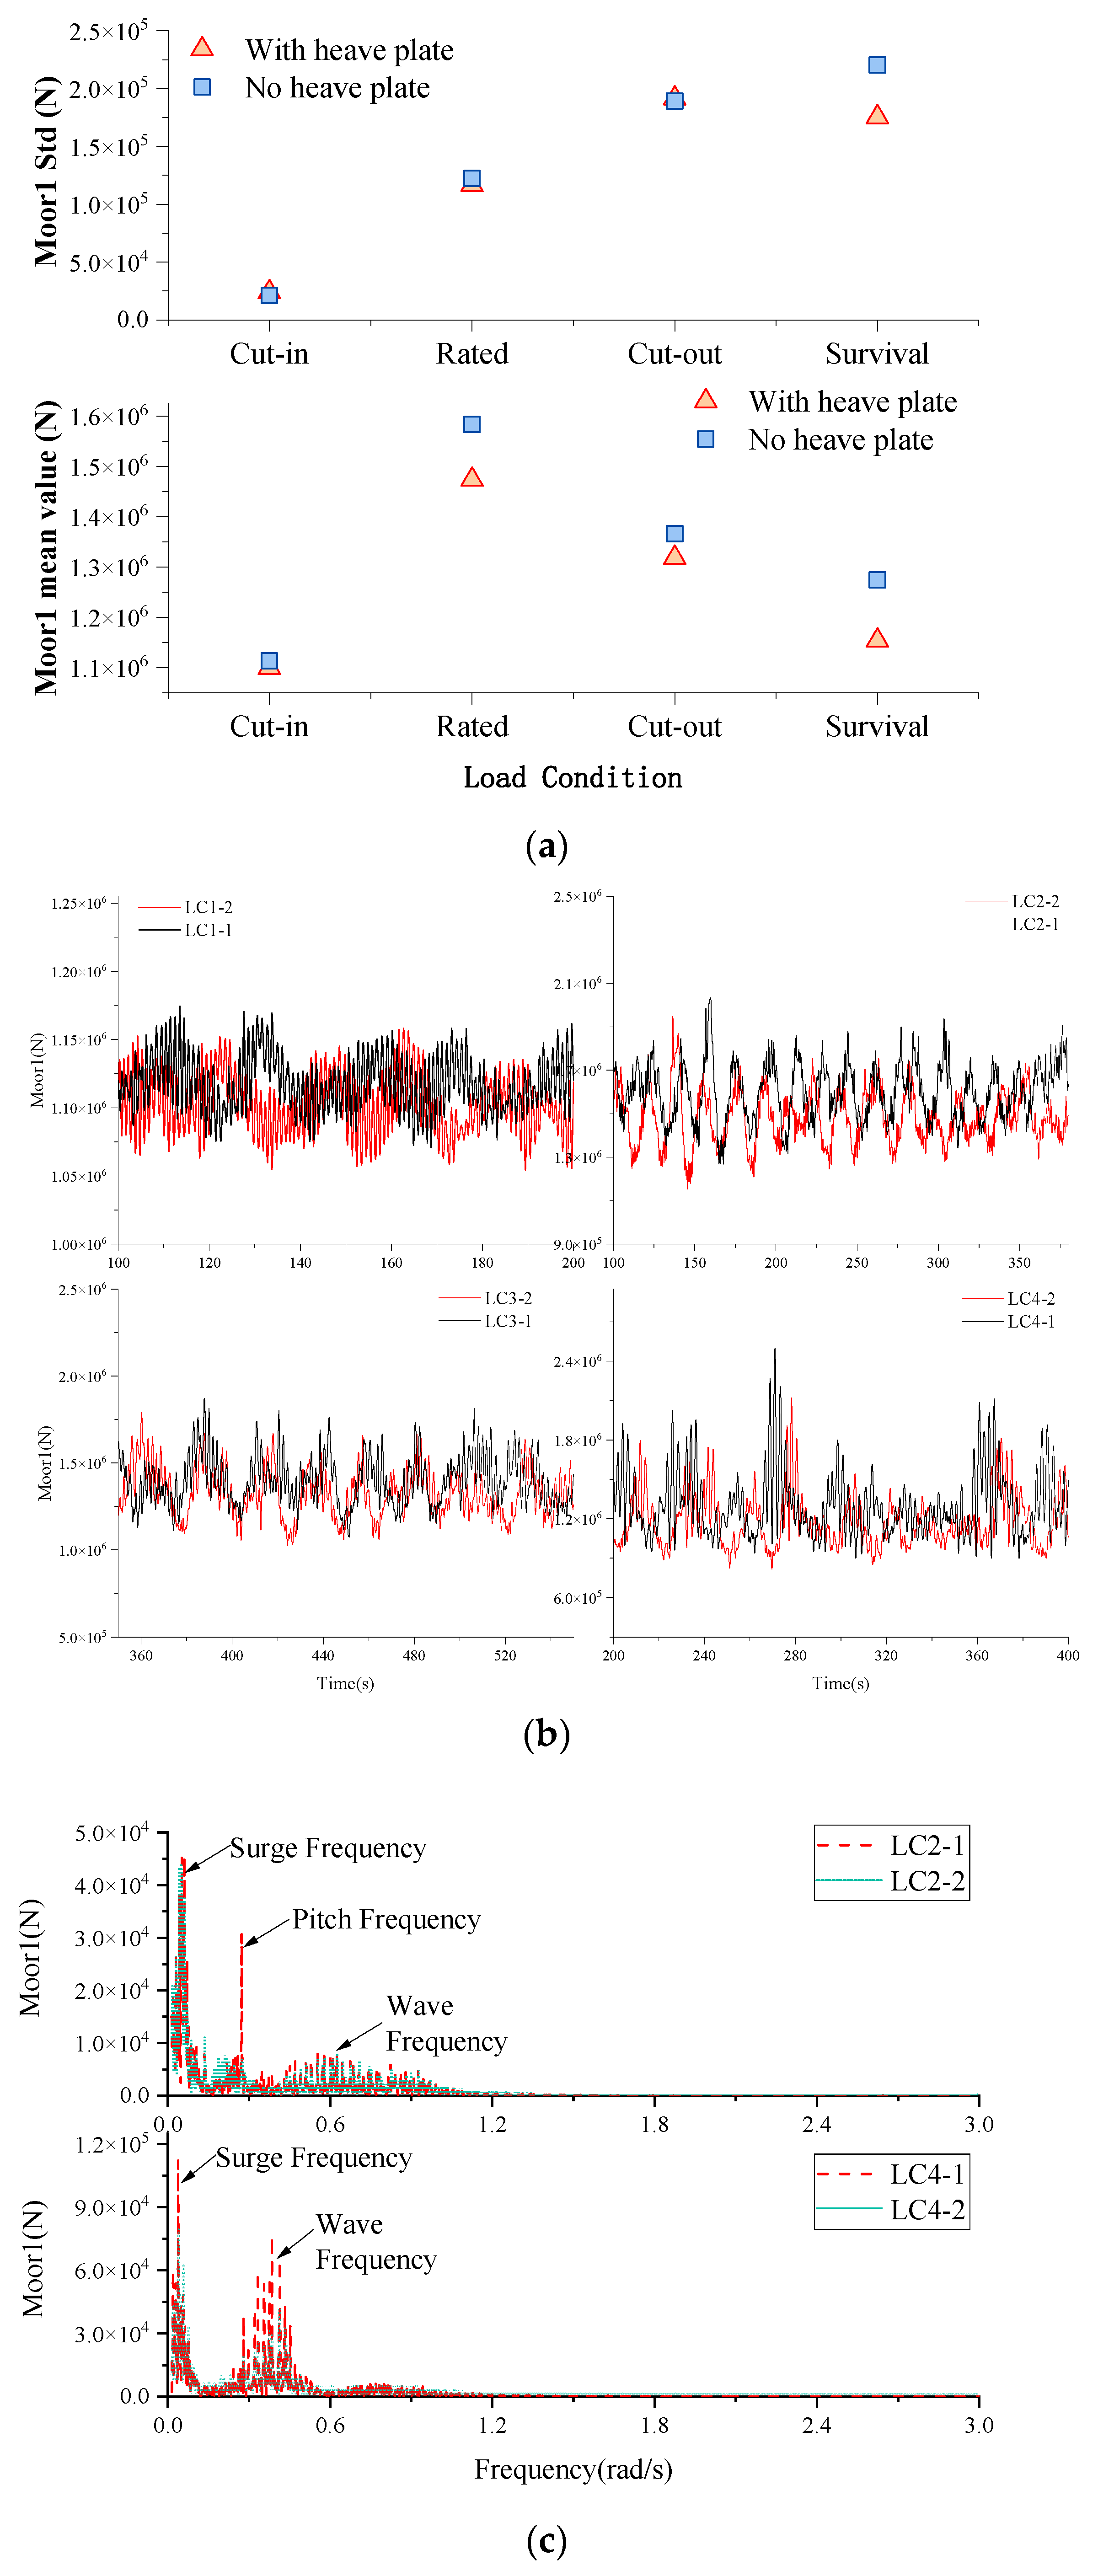
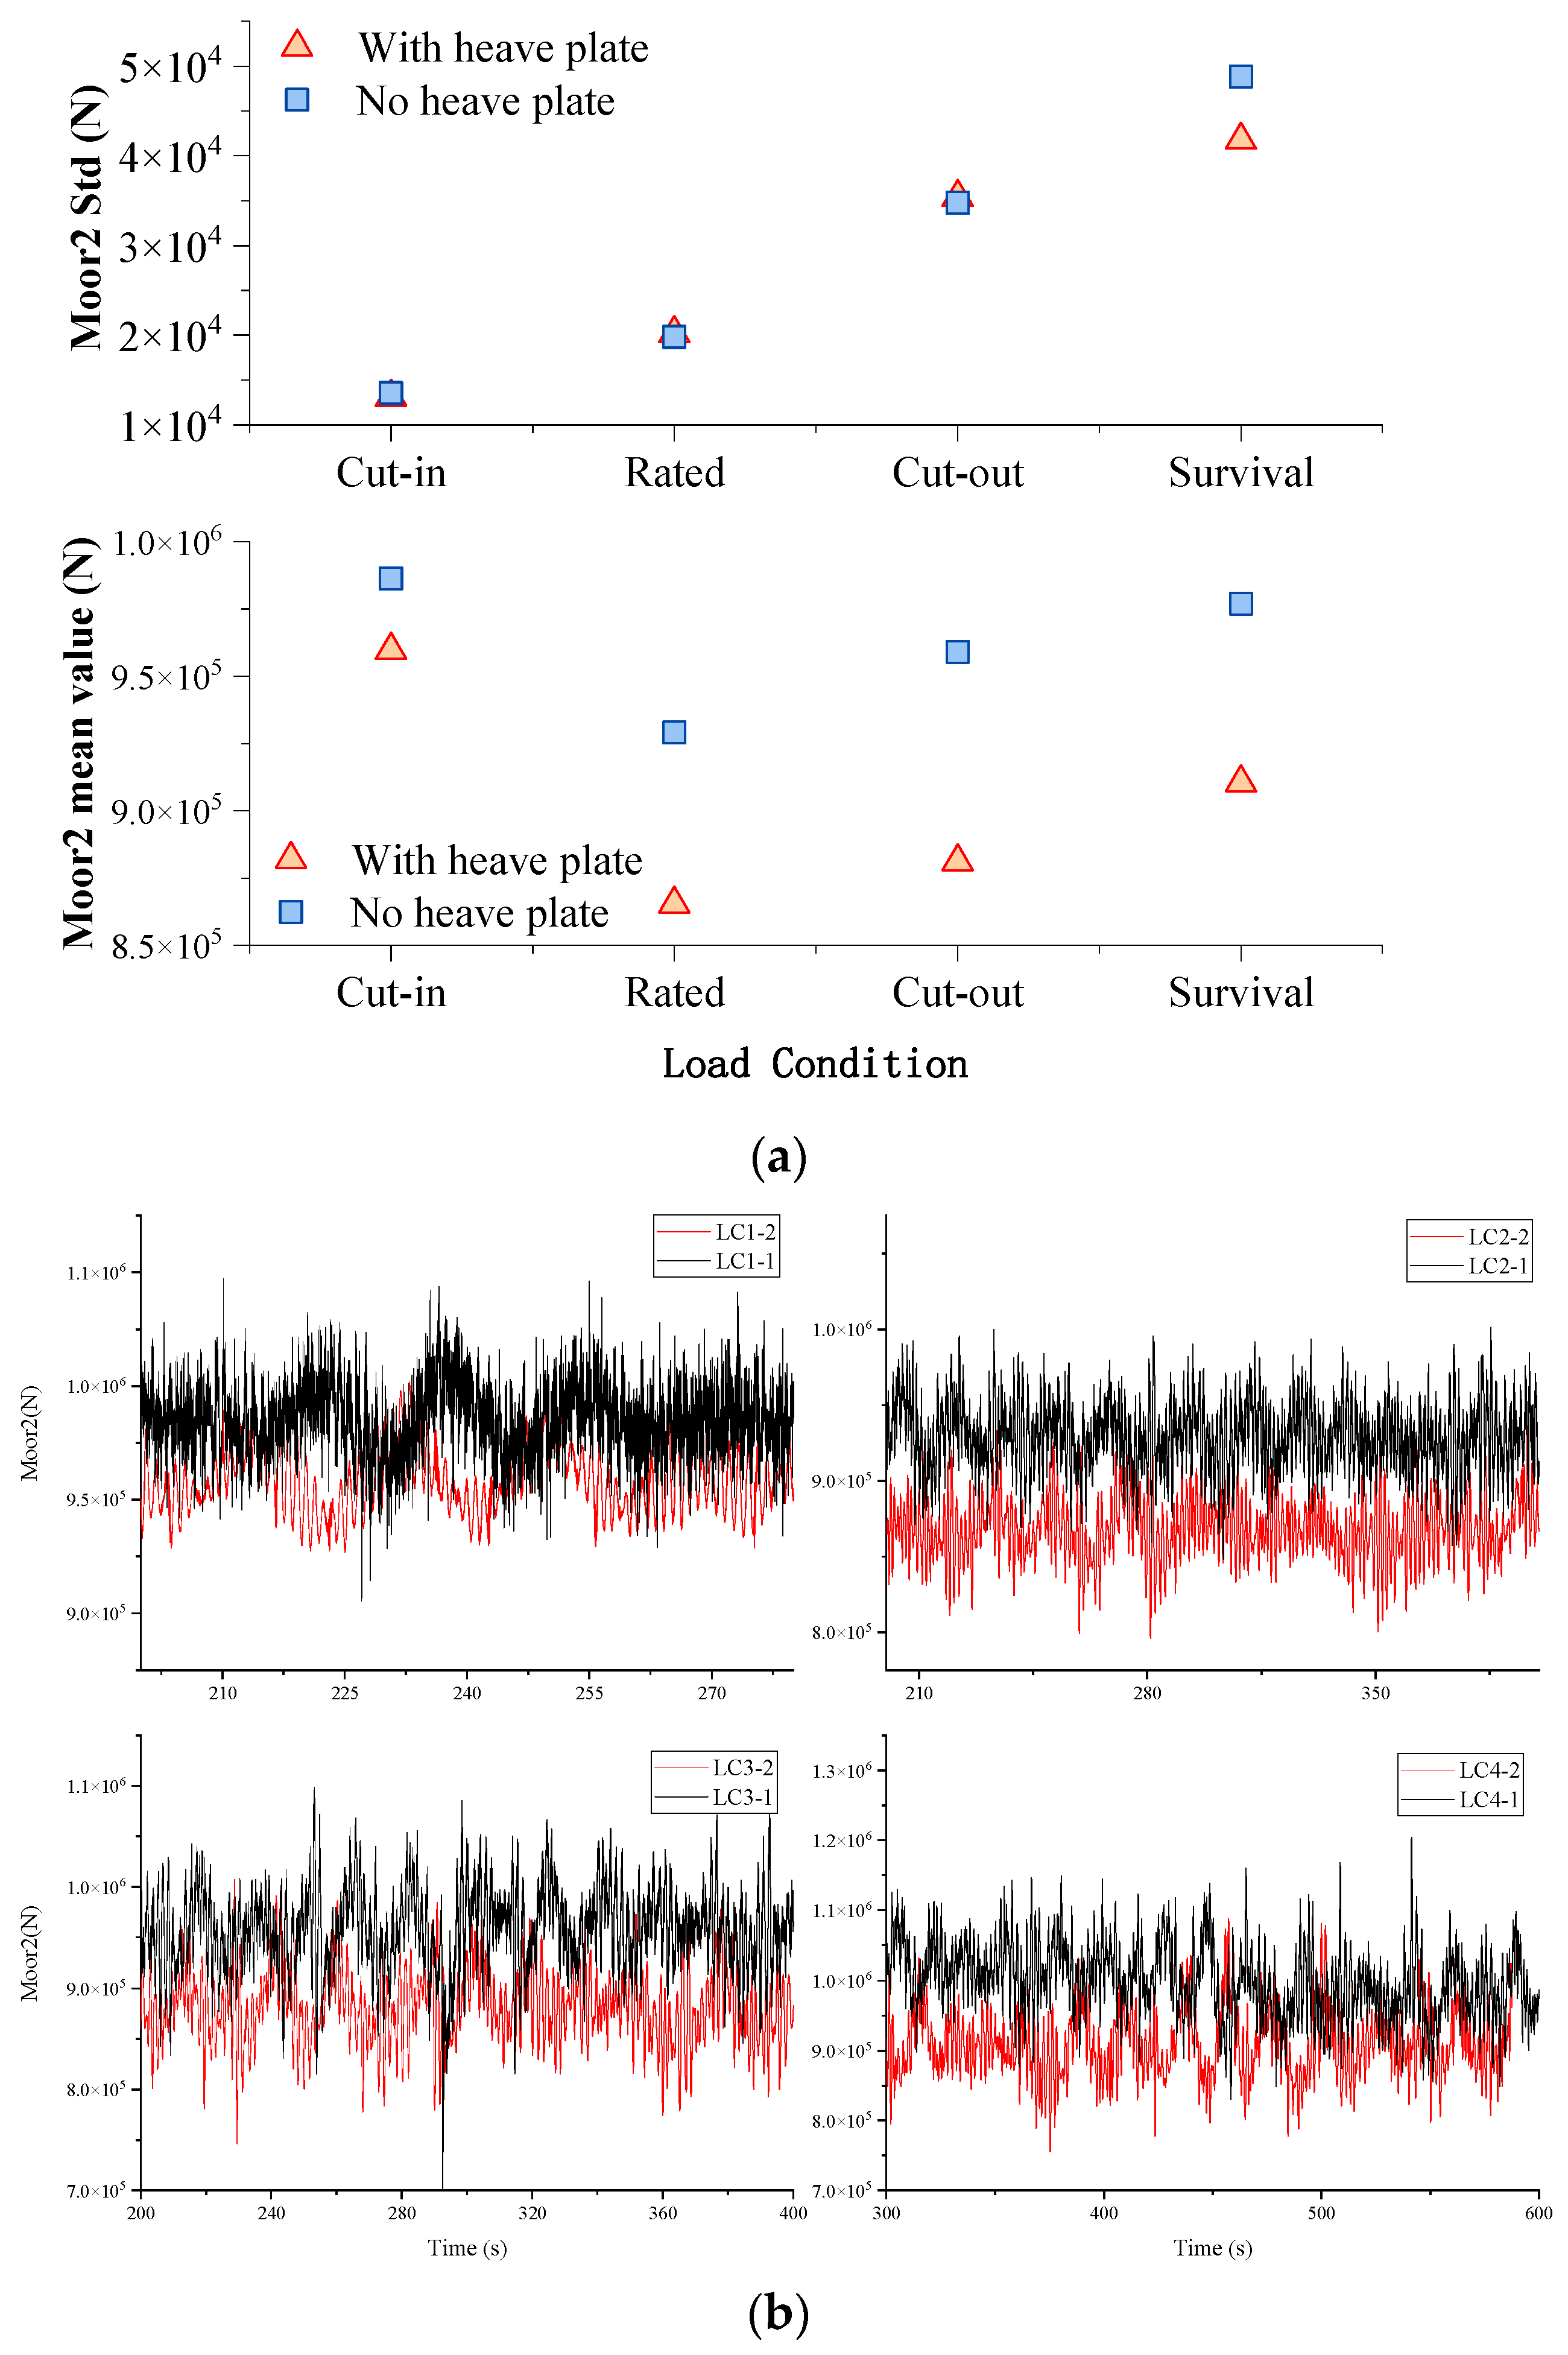
Figure 12 shows the forces of the No.1 mooring line. The heave plate results in a decrease in the mean value of the No.1 mooring line force, and this difference is obvious for the rated and survival cases, with a decrease of nearly 10%. The heave plate also significantly reduced the standard deviation of the No.1 mooring line force, responsible for a reduction of nearly 20% in the survival case. The spectrum of the No.1 mooring line force shows that its frequency components are mainly surge and wave frequency. For the rated case, the heave plate results in a significant reduction in the No.1 mooring line force near the pitch natural frequency. For the survival case, the heave plate results in a significant decrease in the No.1 mooring line force around the wave frequency.
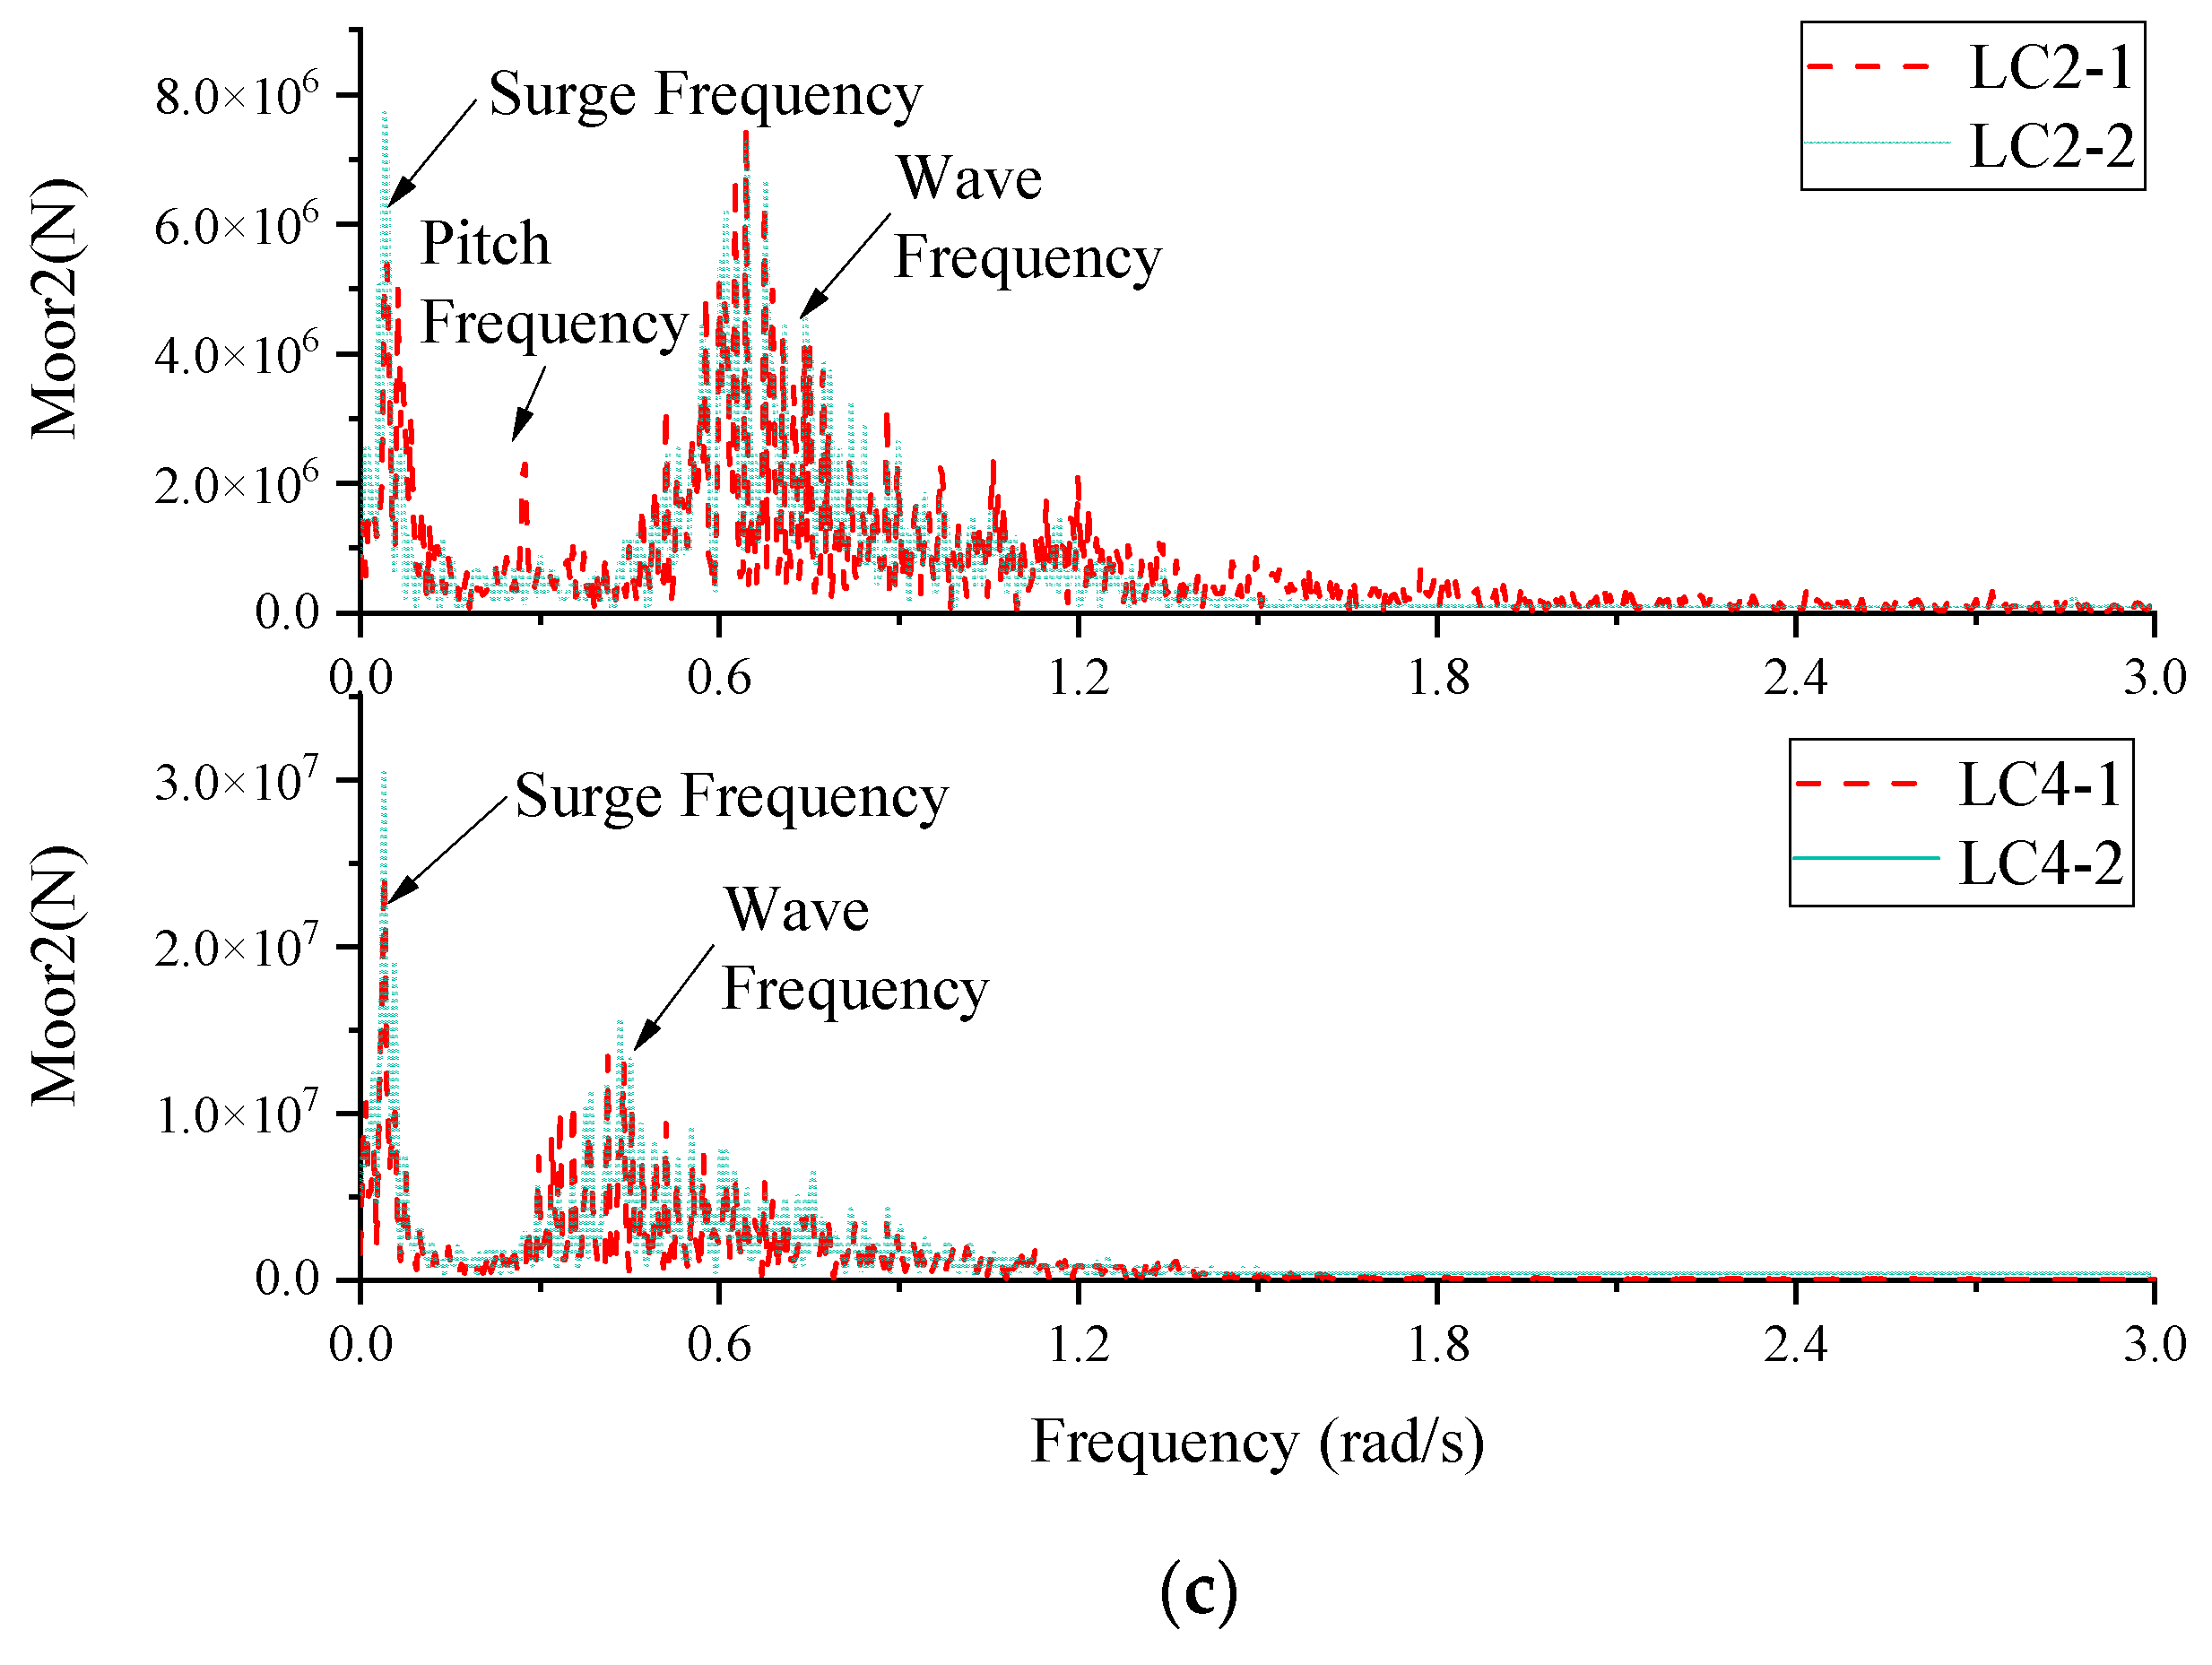
Figure 13 shows the results of the No.2 mooring line forces. The heave plate reduces the average force of No.2 mooring line by about 10%, while having little effect on its standard deviation. There is little difference in the spectral components of the No.2 mooring force with or without heave plate. There are two peaks in the spectrum of the survival case; the first peak is the surge natural frequency, and the second peak is the wave frequency. In the rate case, in addition to the peaks at surge natural frequency and wave frequency, there is also a peak at pitch natural frequency without the heave plate, which was not observed with the heave plate.
Table 4 illustrates the comparison of force at the base of the tower. The data include the standard deviation of forces in the X direction and the moments in the X and Z directions. VN means the value without the heave plate, VW means the value with the heave plate, and Df = (VW − WN)/WN × 100% is the difference in the results with and without the heave plate. It is shown that for the cut-in and survival cases, the difference in the tower bottom force and moment is small. For the rated and cut-out cases, the difference in the tower bottom force is significant, especially in the X direction, where the force difference is more than 37%.
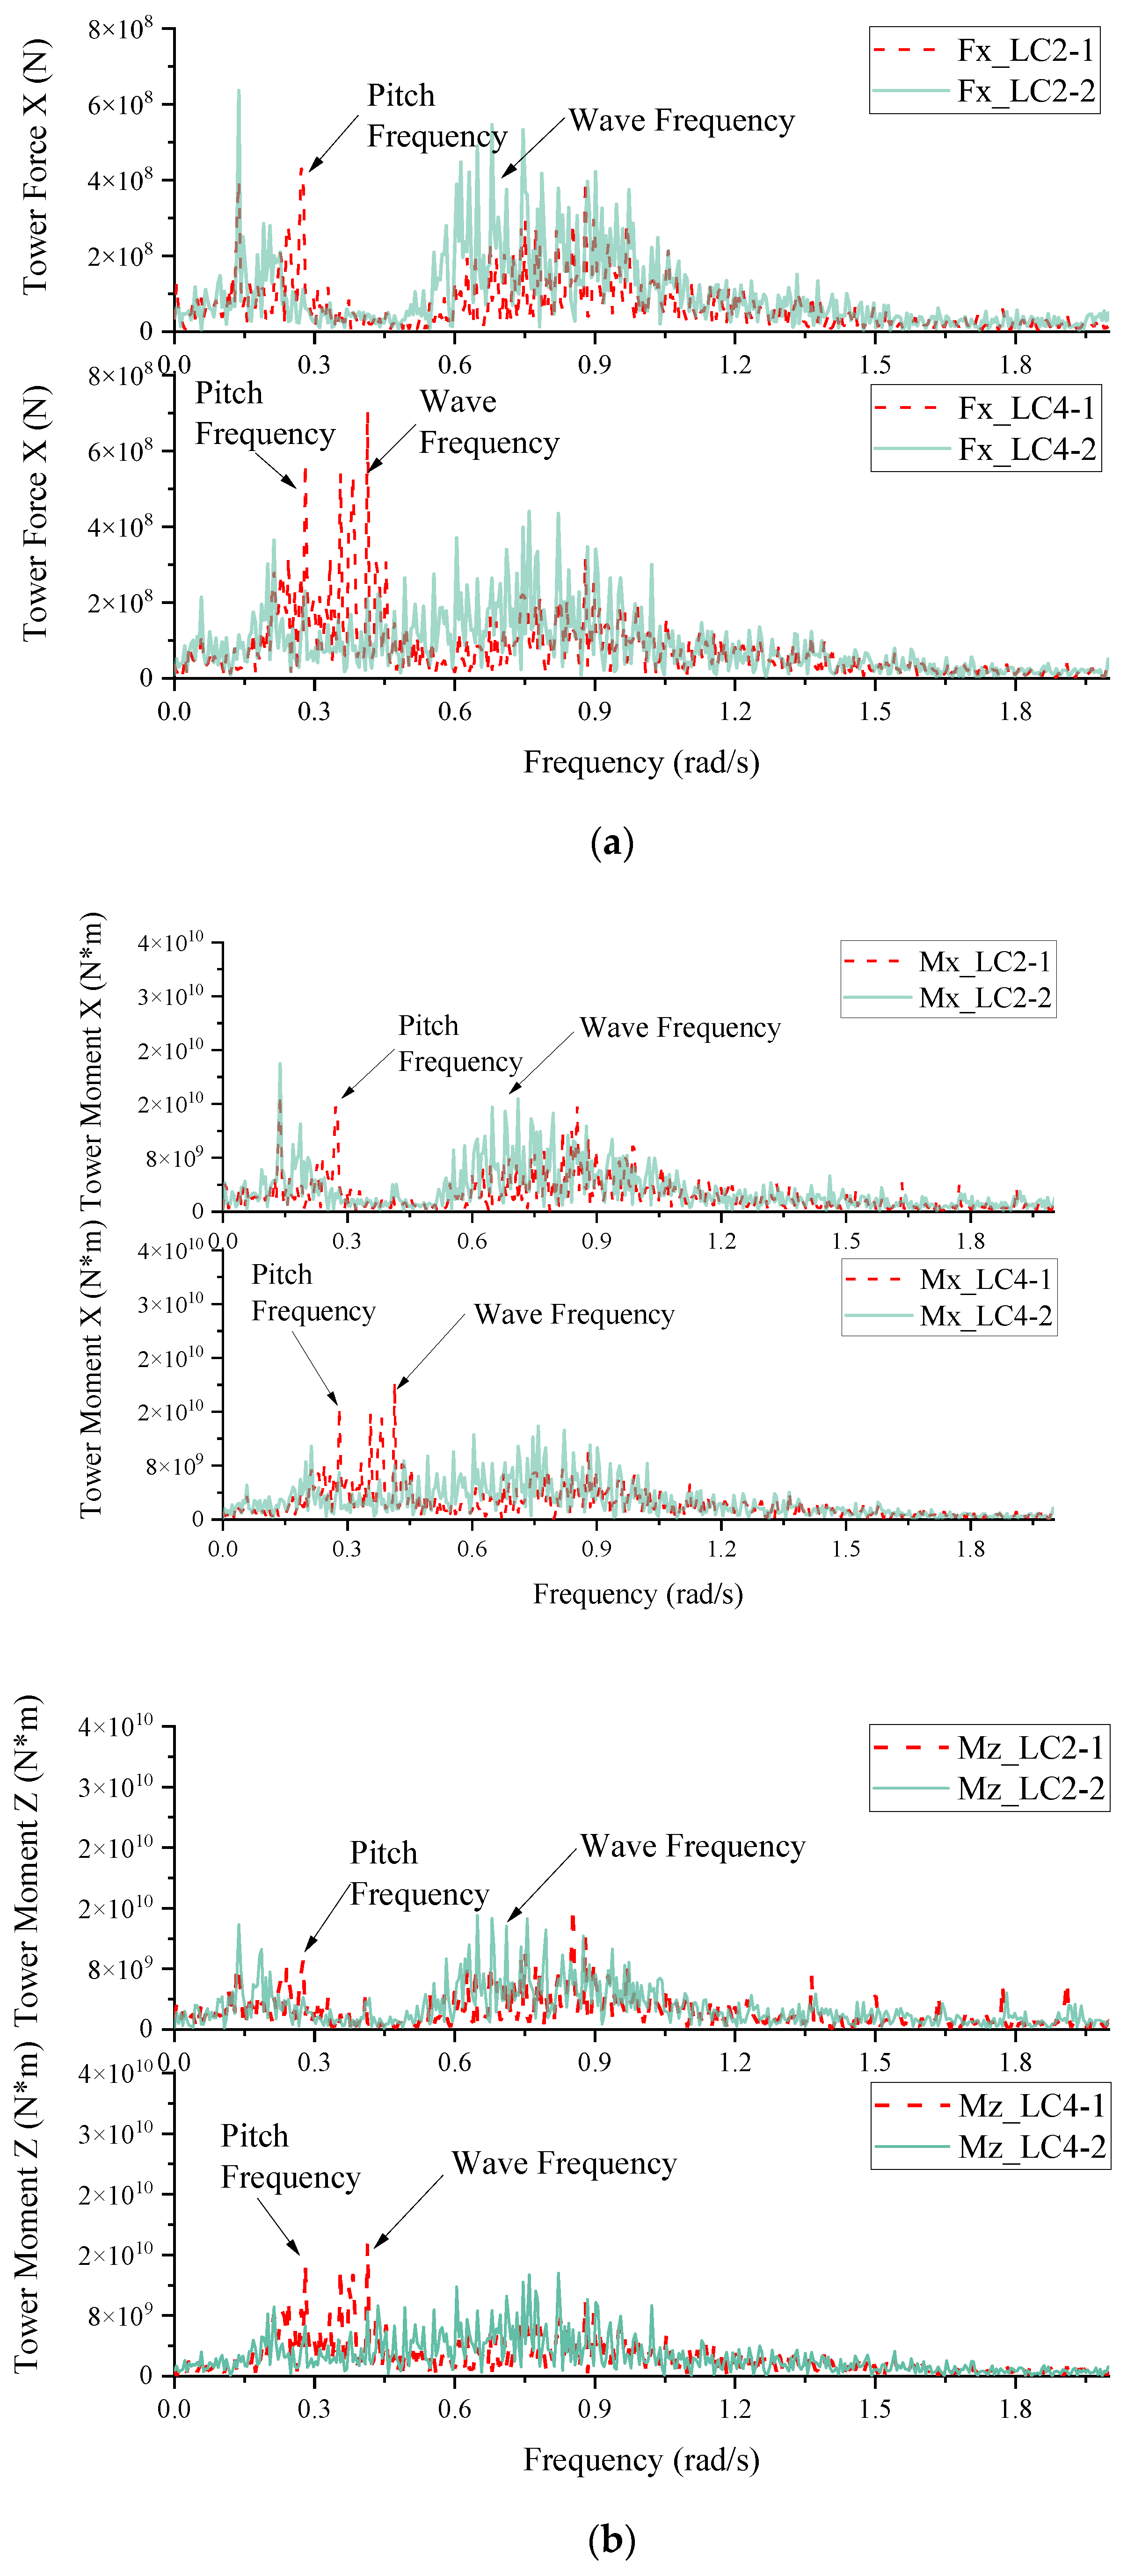
Figure 14 shows the response spectrum of tower forces and moment for the rated and survival cases. It is found that the main frequency components of the force and moments at the bottom of the tower without the heave plate are the pitch natural frequency and the wave frequency. The response amplitude of the floater at both the pitch frequency and wave frequency decreases significantly after installing the heave plate.

4. Conclusions

This study investigates the dynamical performance of the floating wind turbine using model tests, with and without the heave plate. The results obtained in the time domain are compared and analyzed, and the following conclusions are obtained:
(1)
The heave plate significantly enhances the damping of both the heave and pitch motions of the floater. For the heave damping, especially, it is three times greater than that of the original floater without the heave plate. The natural period of the floater surge, heave, and pitch are also increased by altering the hydrodynamic interaction and increasing the added mass and damping properties of the system.
(2)
The RC cases show that when the wave period is in the range of 15–20 s, the weakening effect of the heave plate on the heave motion is obvious; when the wave period is in the range of 20–27 s, the weakening effect of the heave plate on the pitch motion is obvious.
(3)
For the irregular cases, the heave plate failed to reduce the surge and pitch of the floater. However, the heave response of the floater with the heave plate is significantly reduced for the survival case, with the maximum and standard deviation decreasing by 16% and 21%, respectively. The surge response of the floater with the heave plate becomes larger, and the mean value of the No.2 mooring line force decreases accordingly. In addition, the heave plate increases the fluctuations of force and moment at the bottom of the tower.
The heave plate can effectively minimize the heave motion of the floating wind turbine. However, it may increase the amplitude on some motions, forces and moments of the floater. Additionally, the limitations are obvious. Improvements can be made to the experimental equipment based on the current theory of thrust similarity for blades. Although the experiment investigated the function of the heave plate, it only utilized one structure and did not explore the effects of factors such as the position, geometric shape, and open area ratio of the heave plate. It is necessary to take comprehensive design steps in the future.

Author Contributions

Methodology, W.D.; Resources, L.Y. and Y.J.; Writing—original draft, S.G.; Writing—review & editing, Z.L.; Visualization, L.L. All authors have read and agreed to the published version of the manuscript.

Funding

This research received no external funding.

Institutional Review Board Statement

Not applicable.

Informed Consent Statement

Not applicable.

Data Availability Statement

Data is contained within the article.

Conflicts of Interest

Lidong Yang and Yuting Jiang were employed by Northeast Electric Power Design Institute Co., Ltd. of China Power Engineering Consulting Group. The remaining authors declare that the research was conducted in the absence of any commercial or financial relationships that could be construed as a potential conflict of interest.

References

  1. Blanco, H.; Nijs, W.; Ruf, J.; Faaij, A. Potential of Power-to-Methane in the EU energy transition to a low carbon system using cost optimization. Energy 2018, 232, 323–340. [Google Scholar] [CrossRef]
  2. Musial, W.; Butterfield, S.; Ram, B. Energy from offshore wind. In Proceedings of the Offshore Technology Conference, Houston, TX, USA, 1–4 May 2006. [Google Scholar]
  3. Musial, W.; Butterfield, S. Future for Offshore Wind Energy in the United States; National Renewable Energy Laboratory: Golden, CO, USA, 2004. [Google Scholar]
  4. Jonkman, J.M. Loads Analysis of A Floating Offshore Wind Turbine Using Fully Coupled Simulation; National Renewable Energy Laboratory: Golden, CO, USA, 2007. [Google Scholar]
  5. Robertson, A.N.; Jonkman, J.M. Loads analysis of several offshore floating wind turbine concepts. In Proceedings of the ISOPE International Ocean and Polar Engineering Conference, Maui, HI, USA, 19–24 June 2011. [Google Scholar]
  6. Luxcey, N.; Ormberg, H.; Passano, E. Global analysis of a floating wind turbine using an aero-hydro-elastic numerical model: Part 2—Benchmark study. In Proceedings of the International Conference on Offshore Mechanics and Arctic Engineering, Rotterdam, The Netherlands, 19–24 June 2011. [Google Scholar]
  7. Liu, Y.; Xiao, Q.; Incecik, A.; Wan, D.-C. Investigation of the effects of platform motion on the aerodynamics of a floating offshore wind turbine. J. Hydrodyn. 2016, 28, 95–101. [Google Scholar] [CrossRef]
  8. Boo, S.Y.; Shelly, S.A.; Kim, D. Design and dynamic performances of Y-wind floating offshore wind turbine platform. In Proceedings of the ISOPE International Ocean and Polar Engineering Conference, San Francisco, CA, USA, 25−30 June 2017. [Google Scholar]
  9. Hegde, P.; Nallayarasu, S. Hydrodynamic response of buoy form spar with heave plate near the free surface validated with experiments. Ocean Eng. 2023, 269, 113580. [Google Scholar] [CrossRef]
  10. Li, Q. Hydrodynamic Performance of A New Semi-Spar Offshore Wind Turbine Platform and Its Mooring System. Master’s Thesis, Dalian University of Technology, Dalian, China, 2019. [Google Scholar]
  11. Cai, X.; Zhang, H.; Wang, H.; Xie, J.; Wang, Y. Research on the Hydrodynamic Performance of a Novel Floating Platform of the Offshore Wind Turbine in Deep Water. Proc. CSEE 2022, 42, 4339–4352. [Google Scholar] [CrossRef]
  12. Subbulakshmi, A.; Sundaravadivelu, R. Heave damping of spar platform for offshore wind turbine with heave plate. Ocean Eng. 2016, 121, 24–36. [Google Scholar] [CrossRef]
  13. Zheng, J.; Zhao, W.; Wan, D. Effects of heave plate on coupling aero-hydrodynamic performances of floating offshore wind turbine. Ocean Eng. 2022, 40, 65–73. [Google Scholar]
  14. Martin, H.R. Development of a Scale Model Wind Turbine for Testing of Offshore Floating Wind Turbine Systems. Master’s Thesis, The University of Maine, Orono, ME, USA, 2011. [Google Scholar]
  15. Jonkman, J. Definition of A 5-MW Reference Wind Turbine for Offshore System Development; National Renewable Energy Laboratory: Golden, CO, USA, 2009. [Google Scholar]
  16. Jonkman, J.; Robertson, A.; Masciola, A.; Song, H.; Goupee, A.; Coulling, A.; Luan, C. Definition of the Semisubmersible Floating System for Phase II of OC4; National Renewable Energy Laboratory: Golden, CO, USA, 2014. [Google Scholar]
Figure 1. The wind turbine model.
Jmse 12 01808 g001
Figure 2. The heave plate.
Jmse 12 01808 g002
Figure 3. Hub model.
Jmse 12 01808 g003
Figure 4. Mooring line layout diagram.
Jmse 12 01808 g004
Figure 5. Time-domain curves and spectral shapes of random waves. (a) LC2-X (b) LC4-X.
Jmse 12 01808 g005
Figure 6. The free attenuation curves. (a) Heave; (b) pitch.
Jmse 12 01808 g006
Figure 7. Results of heave response for RC1–RC6. (a) Time history of RC2; (b) time history of RC3; (c) time history of RC4; (d) time history of RC5; (e) statistical results.
Jmse 12 01808 g007
Figure 8. Results of pitch response for RC1–RC6. (a) Time history of RC2; (b) time history of RC3; (c) time history of RC4; (d) time history of RC5; (e) statistical results.
Jmse 12 01808 g008
Figure 9. Surge response results. (a) Surge statistics results; (b) surge spectrum for rated and survival cases.
Jmse 12 01808 g009
Figure 10. Heave response results. (a) Heave statistics results; (b) heave time history; (c) heave spectrum for rated and survival cases.
Jmse 12 01808 g010
Figure 11. Pitch response results. (a) Pitch statistics results; (b) pitch time-domain curve; (c) pitch spectrum diagram under rated and survival conditions.
Jmse 12 01808 g011
Figure 12. Response of No.1 mooring line force. (a) Statistical results of No.1 mooring line force; (b) time history of No.1 mooring line force; (c) spectrum for rated and survival cases.
Jmse 12 01808 g012
Figure 13. Response of No.2 mooring line force. (a) Statistical results of No.2 mooring line force; (b) time history of No.2 mooring line force; (c) spectrum for rated and survival cases.
Jmse 12 01808 g013aJmse 12 01808 g013b
Figure 14. Spectrum of tower forces for rated and survival cases. (a) Rated case; (b) survival case.
Jmse 12 01808 g014
Table 1. The principal dimensions of the floating platform.
Full Scale/mScale Value/mm
Column spacing501000
Middle column diameter6.5130
Total height of side column32640
Diameter of side upper column12240
Diameter of side lower column24480
Draft20 m40 cm
Total mass13,917 t109.4 kg
Height of center of gravity10.12 m20.24 cm
Ryy28.369 m56.74 cm
Table 2. Test cases.
ConditionsWind SpeedWave Height/Significant Wave HeightWave Period/Peak PeriodSpectral Peak FactorHeave
Plate
The Decay test////Yes/No
RC1-3/4.0 m7.78/12.02/17.04 s/Yes/No
RC4-6/4.0 m20.51/23.33/26.16 s/Yes/No
LC1-1Cut-in3 m/s2.0 m7.5 s2.2No
LC1-2Yes
LC2-1Rated11.4 m/s6.0 m10 s3No
LC2-2Yes
LC3-1Cut-out25 m/s10.5 m13 s3.3No
LC3-2Yes
LC4-1Survival50 m/s
once in a hundred years
13.1 m14.9 s3.3No
LC4-2Yes
Table 3. Natural period and damping.
DOFNatural Period (s)Damping
Without Heave PlateWith Heave PlateWithout Heave PlateWith Heave Plate
Surge123.2132.80.1430.17
Pitch23.928.50.0380.1113
Heave17.420.50.01/0.084
(linear/nonlinear)
0.0318/0.241
(linear/nonlinear)
Note: Except for heave, the damping of motion in all other degrees of freedom is linear, and the nonlinear damping is small. The linear and nonlinear damping are determined by the equations below:
C 1 = 2 w i = 1 n Z m 2 i = 1 n Δ z Z m i = 1 n Z m i = 1 n Δ z π n i = 1 n Z m 2 i = 1 n Z m 2
C 2 = 3 n i = 1 n Δ z i = 1 n Z m i = 1 n Δ z Z m 4 n i = 1 n Z m 2 i = 1 n Z m 2
The “w” is the natural period, C1 is linear damping, C2 is nonlinear damping, Zm is the average height between each adjacent peak and trough of every decay curve, and ΔZ is the reduction in double amplitude within a half-cycle of motion.
Table 4. Statistical results of force and moment of base of tower.
CasesHeave PlateForce XMoment XMoment Z
LC1
(Cut-in)
VN8.43 × 104 N4.44 × 106 N·m7.51 × 106 N·m
VW1.00 × 105 N4.43 × 106 N·m7.49 × 106 N·m
Df 18.62%−0.23%−0.27%
LC2
(Rated)
VN1.70 × 105 N7.22 × 106 N·m1.02 × 107 N·m
VW2.35 × 105 N7.98 × 106 N·m1.13 × 107 N·m
Df38.24%10.53%10.78%
LC3
(Cut-out)
VN1.64 × 105 N6.98 × 106 N·m1.01 × 107 N·m
VW2.26 × 105 N8.11 × 106 N·m1.20 × 107 N·m
Df37.80%16.19%18.81%
LC4
(Survival)
VN1.65 × 105 N5.02 × 106 N·m4.78 × 106 N·m
VW1.67 × 105 N5.37 × 106 N·m5.16 × 106 N·m
Df1.21%6.97%7.95%
Disclaimer/Publisher’s Note: The statements, opinions and data contained in all publications are solely those of the individual author(s) and contributor(s) and not of MDPI and/or the editor(s). MDPI and/or the editor(s) disclaim responsibility for any injury to people or property resulting from any ideas, methods, instructions or products referred to in the content.