Article

Numerical Simulation and Experimental Validation of the Acoustical Target Strength of Bluefin Tuna Swimbladders Derived from 3D Computed Tomographic Images

1
Institut d’Investigació per a la Gestió Integrada de Zones Costaneres (IGIC), Universitat Politècnica de València (UPV), Camí de Vera (s/n), 46022 València, Spain
2
Instituto Español de Oceanografía (IEO), C/Varadero, 1, 30740 San Pedro del Pinatar, Spain
3
Departamento de Engenharia Civil, Universidade de Coimbra, 3030-788 Coimbra, Portugal
*
Author to whom correspondence should be addressed.
J. Mar. Sci. Eng. 2024, 12(11), 2014; https://doi.org/10.3390/jmse12112014
Submission received: 28 September 2024 / Revised: 31 October 2024 / Accepted: 5 November 2024 / Published: 8 November 2024
(This article belongs to the Special Issue New Challenges in Marine Aquaculture Research—2nd Edition)

Abstract

:
The swimbladder, when present, is the main contributor to the acoustical target strength (TS) of fish. Numerical modeling of target strength must include swimbladder dimensions, orientation, and shape for the proper estimation of target strength and its directivity. Several Atlantic Bluefin tuna (Thunnus thynnus, ABFT) specimens between 90 and 100 cm of fork length were studied by performing computed tomographic (CT) post-mortems in both fresh and frozen states. ABFT swimbladder 3D models were derived for the first time to be compared with experimental TS measurements through numerical simulation methods, using the Method of Fundamental Solutions (MFS). The numerical estimation (−23.3 dB) agreed with the experimental measurement of TS (−22.1 dB) performed in a tank with tuna with a mean fork length of 100 cm, showing the importance of considering realistic swimbladder shapes and swimming behavior in the numerical simulation of TS.

1. Introduction

The Atlantic Bluefin tuna (ABFT), Thunnus thynnus (Linnaeus, 1758), is a teleost fish belonging to the Scombridae family [1]. It is the largest species among tuna, with it being able to reach more than 3 m in length and 600 kg in weight [2]. It is a highly migratory species capable of traveling thousands of kilometers. The ABFT is a highly valued species both economically and ecologically that has been caught in the Mediterranean Sea since ancient times [3]. Its economic value and increasing demand on the market led to the species being threatened due to overfishing some years ago [4]. The International Commission for the Conservation of Atlantic Tunas (ICCAT) implemented a recovery plan, based on three rules, establishing a fishing quota, imposing closed fishing seasons, and setting a minimum catch size of 30 Kg, which have served to achieve the recovery of the species. Therefore, there is great interest in establishing a proper and sustainable ABFT aquaculture industry, including not only capture-based aquaculture in cages but also the development of specific technologies for tuna aquaculture that will not rely on captured individuals from the wild and advances in controlling reproduction in captivity [3].
ABFT capture-based aquaculture calls for sizing and biomass estimation techniques, addressing both catch estimation and control and monitoring the fattening process in cages, which will help to improve management production. Recent successes in ABFT closed-loop aquaculture [5] have also shown the future need for monitoring their growth, not only in cages but also in tanks, where tuna dwell in captivity. Rearing, growth, and fattening control monitoring in tuna production cages or tanks can be carried out by manual sampling, which can cause damage to fish and increase economic costs. Those processes can also be monitored by using a stereoscopic camera system [6], which, even being a non-intrusive method, can be affected by the turbidity of the water and is limited by the camera’s field of view. On the other hand, acoustic techniques have been widely used for fish biomass assessment [7]. They represent one of the most effective and non-intrusive methods to obtain estimates of fish biomass. A key parameter in such acoustic techniques is the acoustic response of an individual fish, known as the fish target strength (TS). The target strength is determined as the ratio of the incident and backscattered acoustic intensities, and its value depends on the size of the fish, its behavior, its internal physiology, its morphology, the relative orientation between the fish’s body and the transmitted acoustic beam, and the presence of the swimbladder [8,9,10].
In a previous study [11], we addressed the estimation of ABFT mean length swimming, in a fattening cage, by acoustic means. A scientific echosounder and a synchronized stereo camera were placed at the bottom of the cage, successfully providing a conversion relationship between ventral TS and fish fork length, which has been a common clue for acoustic biomass estimation [12]. Recently, other efforts aimed at providing biomass estimation in the wild have provided such a conversion relationship for dorsal measurements at 38 kHz [13]. Also, there is growing interest in the application of multibeam or omnidirectional sonar [14], which would require the extension of those relationships to other frequencies and angles of observation of the ABFT.
An approach for estimating TS is to use numerical models. Theoretical acoustic backscattering models are used to predict the backscattered field of species of economic or ecological importance [15]. TS values can be obtained from models that estimate only the backscattering of the swimbladder and/or the fish body, as an air-filled swimbladder is responsible for 90% of the echo energy [16]. For this purpose, it is fundamental to consider the variations in the physical dimensions, shape, and orientation of the swimbladder under different circumstances [17].
Published studies on modeling backscattering at high testing frequencies [18] established that they can be grouped according to the representation of the swimbladder and its body shapes. The first group deals with shapes of simple geometries, finite cylinders [19], deformed cylinders [20], and ellipsoids [10,21,22], for which there are analytical solutions. The second group considers sets of finite cylinders with dimensions obtained from X-ray images, for which there is an available numerical solution to the wave equation [23,24]. The third group addresses the reconstruction of realistic swimbladder geometries using computed tomography (CT) [25,26] and magnetic resonance imaging (MRI) [18]. These diagnostic imaging techniques are a valuable tool for optimizing acoustic simulation models. A comprehensive summary of the different numerical methods for calculating acoustic backscattering and TS, their features, advantages, disadvantages, and limitations can be found in [15].
The motivation for this research is based on the need for an acoustic characterization of the ABFT to provide tools for more sustainable and efficient fishing and aquaculture of this species. The specific objective of this work is to validate the derivation of an acoustic backscattering model of the ABFT swimbladder, as it is the organ responsible for the greatest amount of dispersed energy [16]. In order to obtain realistic geometries describing the internal structures of the fish, computed tomography of ABFT specimens was performed, extracting swimbladder models and calculating the TS directivity at the working distances between the fish and the echosounder. With this aim and considering the short distances available in cages and tanks, we took advantage of the potential of the Method of Fundamental Solutions (MFS) as a numerical simulation method. The MFS is an efficient method [27,28] when the size of the target and/or the short working range results in the violation of the far-field assumption and other numerical methods fail, either because they are restricted to the far-field region or because of extremely high computational requirements [15]. The numerical acoustic backscattering results will be finally compared with the experimental TS measured in ABFT tanks and could be the basis for further studies including different observation angles.

2. Materials and Methods

2.1. Tuna Samples and Computed Tomography Imagery

It should be noted that the ABFT is a commercial and high-value species, which has been considered threatened over the last decade. Its fishery has managed to impose a strict fishing quota and this resource has a high economic cost. Those factors limit the availability of ABFT specimens to be tomographed. In the present case, the ABFT specimens were extracted from a tank, maintained in salt water at constant temperature (20 °C) and salinity (37 ppt), belonging to the Infrastructure for Atlantic Bluefin Tuna Aquaculture (ICAR) that the Spanish Oceanographical Institute (IEO) has at Cartagena (Murcia, Spain). The ICAR is a scientific–technical infrastructure (ICTS) dedicated to the study of the complete aquaculture of the ABFT and devoted to ABFT reproduction in captivity. The use of captivity-born tuna is a unique opportunity to access the specimens, but, since they are part of an experiment devoted to their reproduction, we have only opportunistic access to accidentally deceased fish.
The equipment used was a TOSHIBA Astelion with high-energy-radiation beam emission voltage values between 120 and 135 kVp (power between 14 and 21 kW). The slice thickness was performed with a 1 mm resolution and the revolution time was 1 s per revolution. The morphology of this specimen presents a fusiform and robust body (Figure 1a), showing a swimbladder (Figure 1b,c).
Preliminary CT studies were performed to guarantee that the swimbladders were not damaged during the process. We performed CT scans on fresh, frozen, and defrosted individuals. Under visual inspection, we did not find noticeable differences in the shape of the swimbladder between fresh tuna and tuna frozen immediately post-mortem. Nevertheless, defrosted specimens were not suitable for CT because the defrosting process caused the guts to move downward, deforming the swimbladder. With respect to CT techniques, injecting liquid contrast into the swimbladder seemed to provide clearer images but with fuzzy boundaries, which hindered the extraction of the structure. In conclusion, we decided to select swimbladder images of fresh and frozen individuals, frozen in a freezer chamber at −20 °C or scanned up to 12 h post-mortem and without contrast injection, in agreement with previously published results [29]. It was not possible to select either the size or the number of specimens; there was a large dispersion in the fork lengths of the initially scanned tuna. We limited the set of CT images to three samples, with a mean fork length FL = (100 ± 3.0) cm for comparison with the experimental TS data from the tank from which those tuna were extracted, with a mean fork length measured in the tank of 100 cm.
Image processing was performed using RadiAnt DICOM Viewer and Aliza Medical Imaging 1.9.10 software. For the reconstruction of the geometry, a process of segmentation, thresholding, and quantification of the swimbladder contour was developed. Using Autodesk Fusion 360 software, mesh reduction was performed to smooth the models and eliminate the deformities generated in the segmentation process. The geometries were exported in three-dimensional stereolithography (STL) files, and our own script developed with Matlab R2021a software was used for acoustic simulation with the Method of Fundamental Solutions.

2.2. Numerical Simulation: Method of Fundamental Solutions

The Method of Fundamental Solutions (MFS) is a non-mesh simulation method. It is based on reproducing the field through a linear combination of a set of virtual sources located outside the domain of interest [30]. The absence of a mesh avoids the high computational costs associated with the use of numerical methods with a mesh, which, at the working frequencies of TS measurements, implies the need for very fine meshes and therefore long calculation times. The propagation of sound within a homogeneous acoustic space can be described mathematically in the frequency domain by using the Helmholtz differential equation:
2 p + k 2 p = 0
where 2 = 2 / x 2 + 2 / y 2 + 2 / z 2 in the case of a 3D problem, p   [Pa] is the acoustic pressure, k = w / c is the wave number, w = 2 π f is the angular frequency, f   [Hz] is the frequency, and c [m/s] is the sound propagation velocity within the acoustic medium. For the 3D case, assuming a point source placed within the propagation domain, at point x 0 with coordinates ( x 0 , y 0 , z 0 ) [m], it is possible to establish a fundamental solution, G , for the sound pressure, and H , for the particle velocity [m/s], at point x with coordinates [m], which can be written respectively as:
G 3 D x , x 0 , k = e i k r r
H 3 D x , x 0 , k , n = 1 i ρ w i k r 1 e i k r r 2   r n
In these equations, r [m] corresponds to the distance between the source point and the domain point given; n represents the direction along which the particle velocity is calculated; and ρ [kg/m3] the medium density.
TS was calculated as TS = 10 log10(R2Ibs/Iinc) [dB], where Ibs [W m−2] corresponds to the backscattering intensity from the target calculated on the ultrasonic source; R [m] is the distance between the target and the source; and Iinc [W m−2] is the incident intensity on the target. In terms of the pressure field, the target strength can be expressed as TS = 10 log10(R2pbs2/pinc2) [dB], with pbs [Pa] being the backscattering pressure amplitude from the target calculated on the ultrasonic source and pinc [Pa] being the incident pressure amplitude on the target.
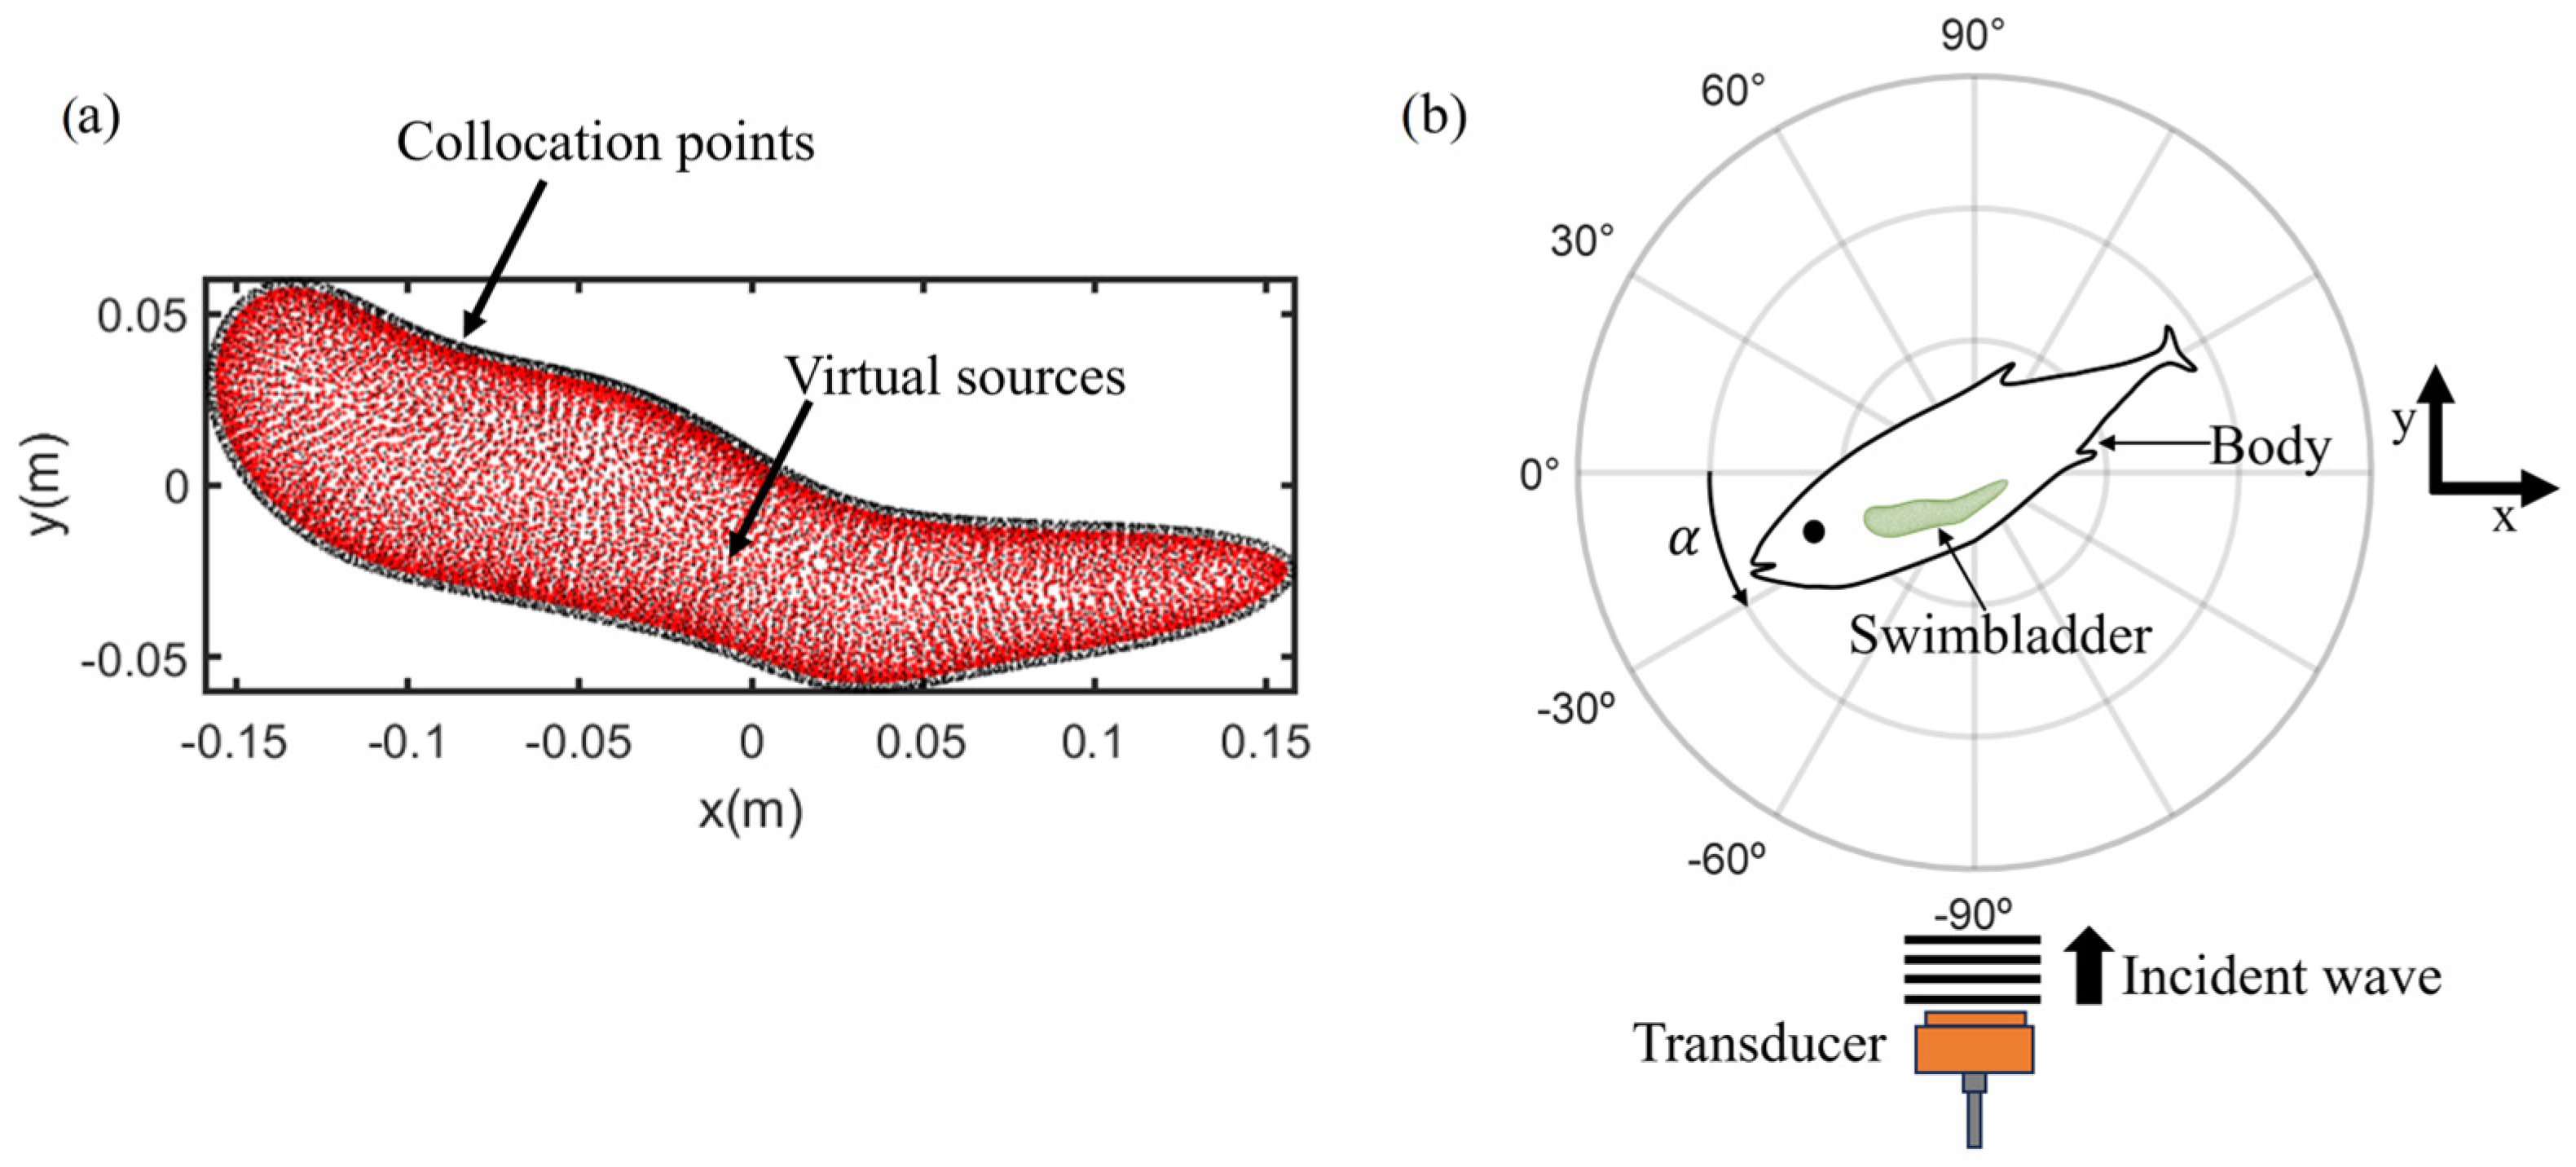
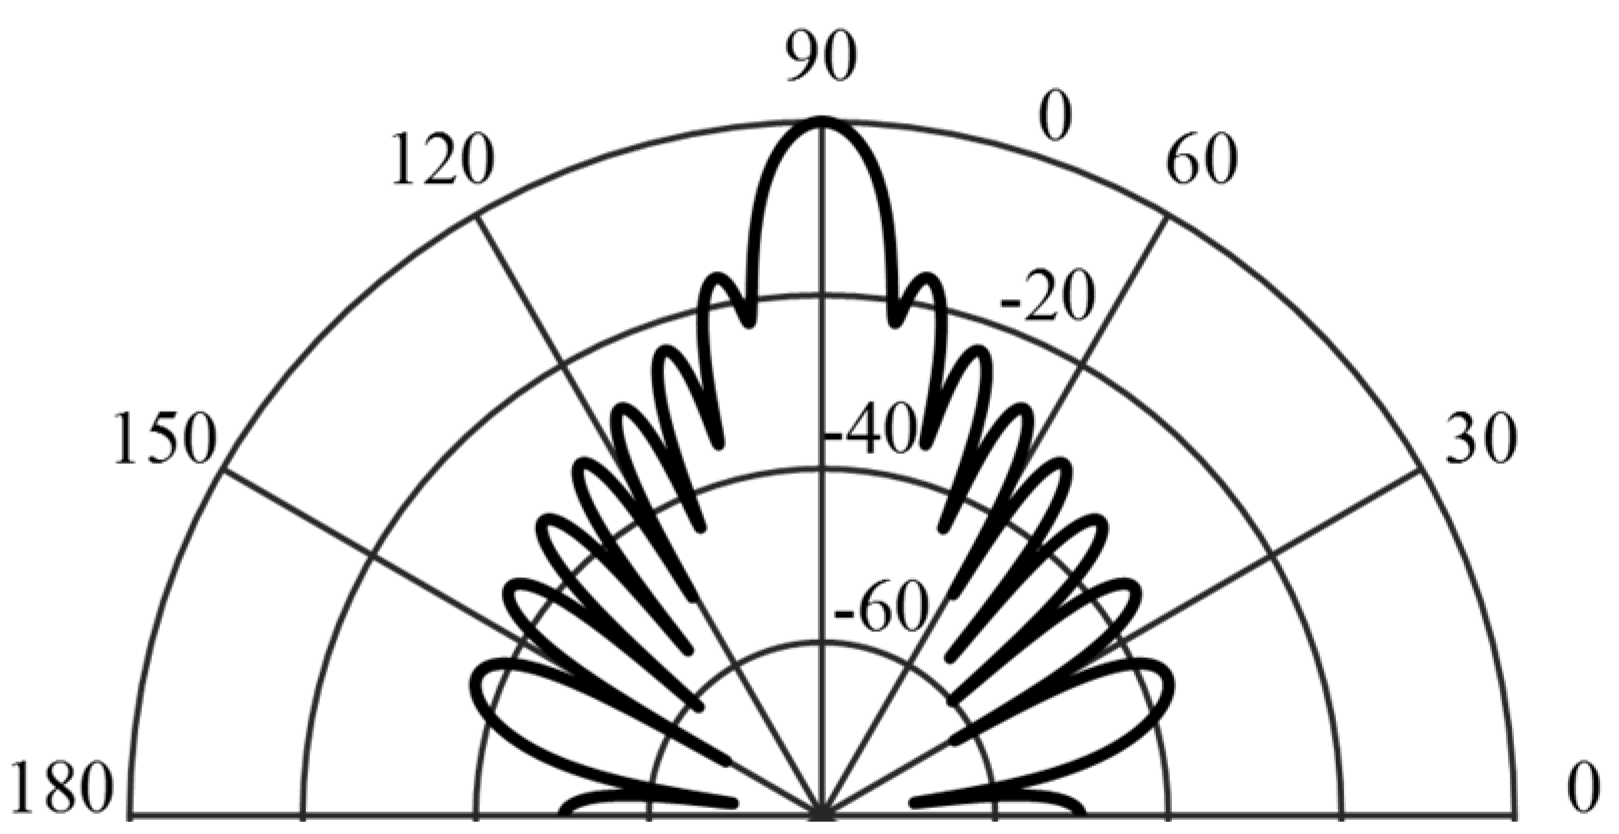
Fish have a number of anatomical features that affect TS, with the swimbladder, when present, being responsible for the most significant contribution to acoustic dispersion [9]. In the present study, acoustic backscattering was evaluated considering the swimbladder as in [16]. Figure 2a shows the distribution of the boundary points and the virtual sources used in the MFS calculation. In this calculation, the following apply:   c w a t e r = 1524 [m/s], ρ w a t e r = 1027 [kg/m3], c a i r = 343 [m/s], and ρ a i r = 1.2 [kg/m3]. The directivity of TS was calculated at a distance of 6 m, consistent with the experimental measurements. In the experimental setup, the acoustic transducer was stationary and anchored to the bottom of the tank. However, the observed orientation of the fish relative to the echosounder varied depending on the tilt angle between the acoustic beam and the fish axis, which in turn depended on the swimming pattern of the tuna within the tank. To account for the role of the tuna’s swimming direction in the numerical calculations, the fish’s directivity was evaluated by incrementally rotating the angle between the fish axis and the beam incidence direction, degree by degree (Figure 2b). TS directivity was estimated for each specimen, and to assess the natural variability observed within the population in the tank, the averaged TS directivity was considered. The influence of swimming direction was incorporated using the probability density function (PDF) of the tilt angle distribution obtained from the experimental measurements by weighting the averaged TS function according to the tilt angle PDF. To replicate the experimental conditions realistically, the emitter transducer was modeled as a flat piston operating at a frequency of 120 kHz, with a beam angle of 3.5° at −3 dB (see Figure 3 for transducer directivity).

2.3. Acoustic Data Acquisition

The experimental measurements were recorded in the tank of the ICAR. Measurements were made using a Simrad EK80 (Kongsberg Maritime, Kirkegårdsveien, Norway) scientific echo sounder with a split-beam transducer operating in narrow-band mode at 120 kHz [31,32]. The pulse duration was set to 64 μs, following the setup used for the mean fork length estimation of ABFT in [11]. In the cited work, the TS measurements considered the swimmbladder total insonification and it was estimated that the insonified volume would allow a non-biased TS to be obtained for bluefin tuna under 1.8 m of fork length, which largely exceeds the size of the studied specimens. The on-axis and off-axis calibrations were performed using the standard calibration method, with a 38.1 mm diameter tungsten carbide sphere to calibrate the 120 kHz echosounder. Table 1 shows the calibration data of the echosounder and the parameters selected for the analysis of ventral TS measurements at 120 kHz. The transducer was placed on a platform on the bottom of the tank towards the surface to record the ventral view of the tuna (Figure 4). The tanks are circular, and tuna tend to swim to cover the maximum possible length, as observed previously in cages [33]. Considering this swimming behavior, the equipment was placed at the center of one of the tank radii to increase the number of tuna detections. Analysis of the ventral measurements was performed using our own Matlab R2023b® script which automatically isolated the traces that corresponded to tuna backscattering. A synchronized stereoscopic camera (AM100, AQ1Systems, Glenorchy, Australia) consisting of two Gigabit Ethernet cameras, with an image resolution of 1360 × 120 pixels and a frame rate of 12 fps, was deployed to relate the target strength (TS) and the exact fork length (FL) [6,11]. In addition, the optical system provided the swimming tilt angle of each acoustically detected tuna, defined as the angle between the fish body axis and acoustic beam propagation direction. The tank was 8.5 m in depth and 22 m in diameter.

3. Results

3.1. Computed Axial Tomography (CT)

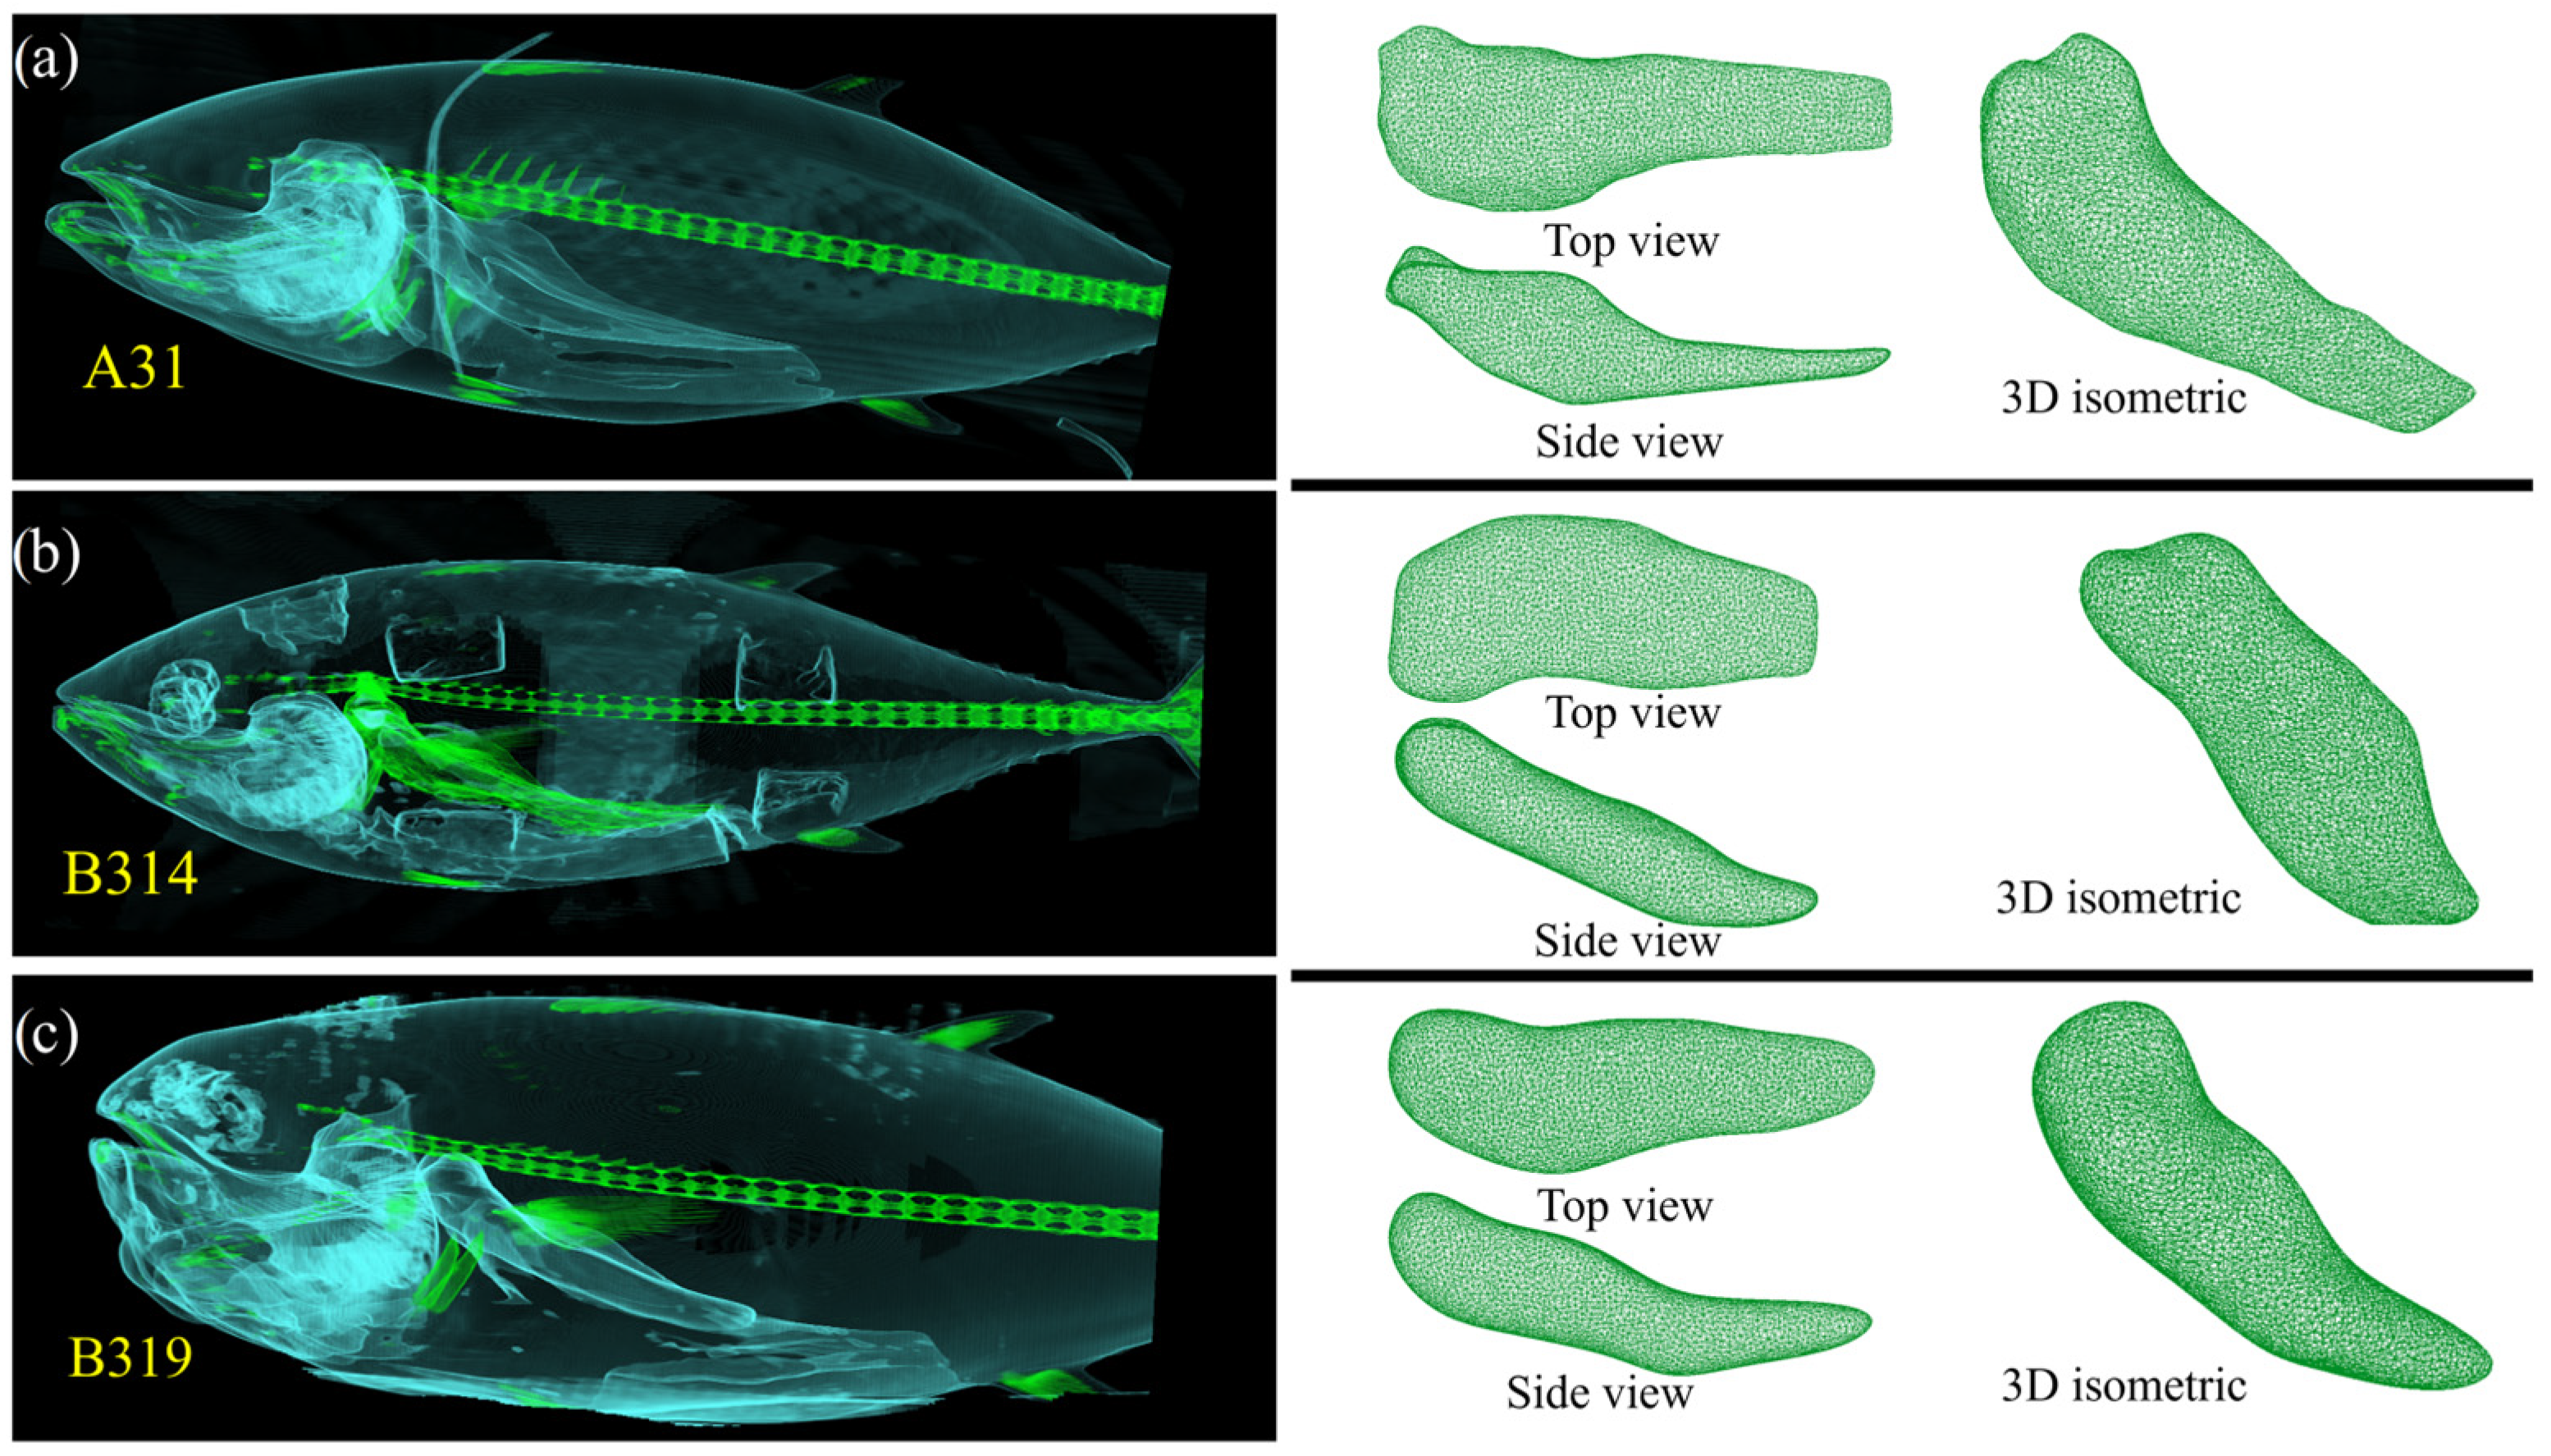
CT is an effective technique for acquiring three-dimensional images of the internal parts of fish with high resolution, including the internal muscles, skeletal structure, and swimbladder organ. Three fish were scanned along the longitudinal axis (Figure 5, left), giving a series of cross-sections of the body that produced detailed images of the internal structure of each individual, which could be quantified through image processing. Three-dimensional models of the swimbladders of each individual were obtained (Figure 5, right), allowing us to examine the morphological variation of each individual and parametrize the geometrical models. For each individual, the fork length (FL-cm), total length (TL-cm), fish height (H-cm), circumference (C-cm), fish width (W-cm), and weight (w-kg) were measured. For the swimbladder, the length (SL-cm), width (SW-cm), height (SH-cm), and ratio (SR-%) between thr fish fork length and swimbladder length were considered. On the other hand, with the help of CT scans, the angle (αS) between the swimbladder and the horizontal axis of the fish body was also measured, obtaining αS = 22° for samples B314 and B319 and αS = 29° for A31. The fish sampled were found to have a fork length between 96 and 104 cm, with A31 being the largest, followed by B319 and B314 with the smallest size. However, the SL of B319 was the smallest among all of the samples. The swimbladder-to-fork length ratio ranged from 33.8% to 22.7%. Table 2 shows the dimensions obtained from each specimen, as well as the dimensions of the swimbladder.

3.2. Backscattering Simulation

This section shows the directivity corresponding to the swimbladder of each of the specimens (Figure 6). The far-field directivities were calculated at a test frequency of 120 kHz. The main effect of the orientation of the swimbladder, in relation to the axis of the body of the fish, is to govern the direction of the main lobe of the backscatter pattern. In all, cases the highest value of TS was for an inclination close to ±30°, that is, when the ultrasonic beam propagated in the direction orthogonal to the swimbladder longitudinal axis. As TS is defined as the ratio in dB of the backscattered intensity to the incident intensity, the values of the backscattered intensity for each angle and for the three available samples were determined according to I b s = 10 T S / 10 . The linear average of the intensities was calculated to determine the average TS directivity according to TS = 10 l o g I b s _ T o t , where I b s _ T o t   is the total average backscattered acoustic intensity average over the three samples.

3.3. Comparison of Numerical Simulation and Experimental Measurements

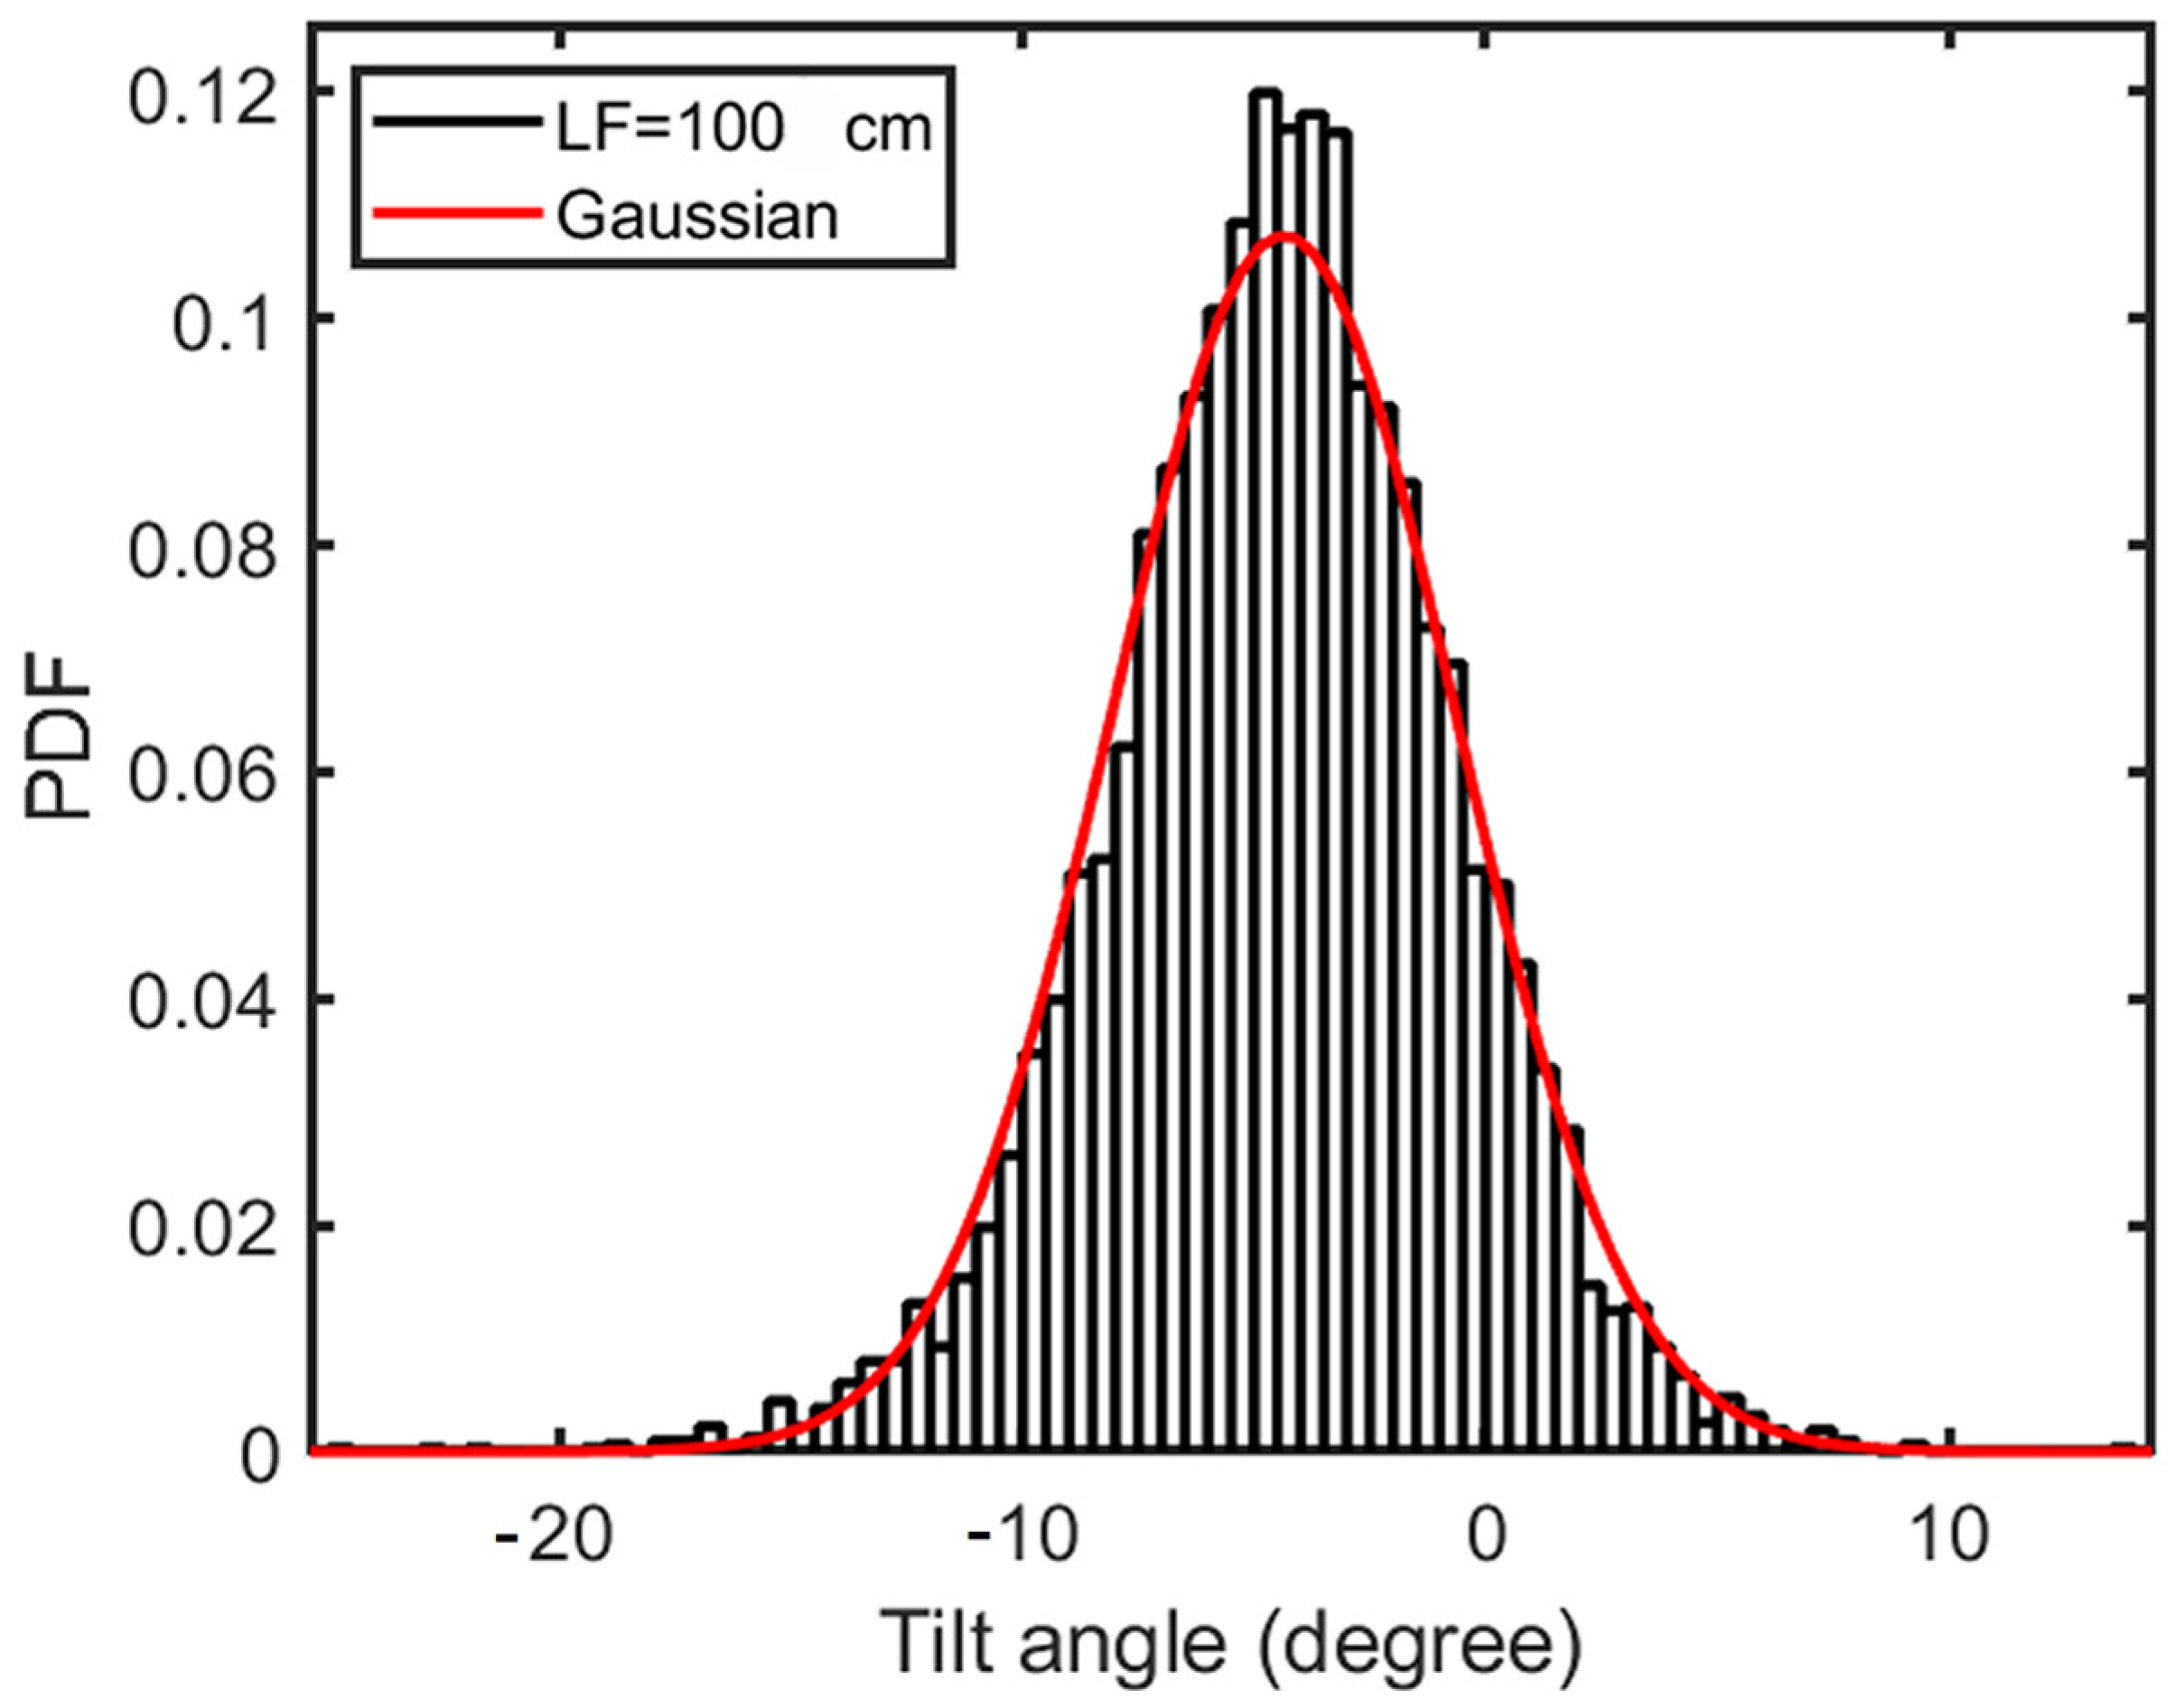
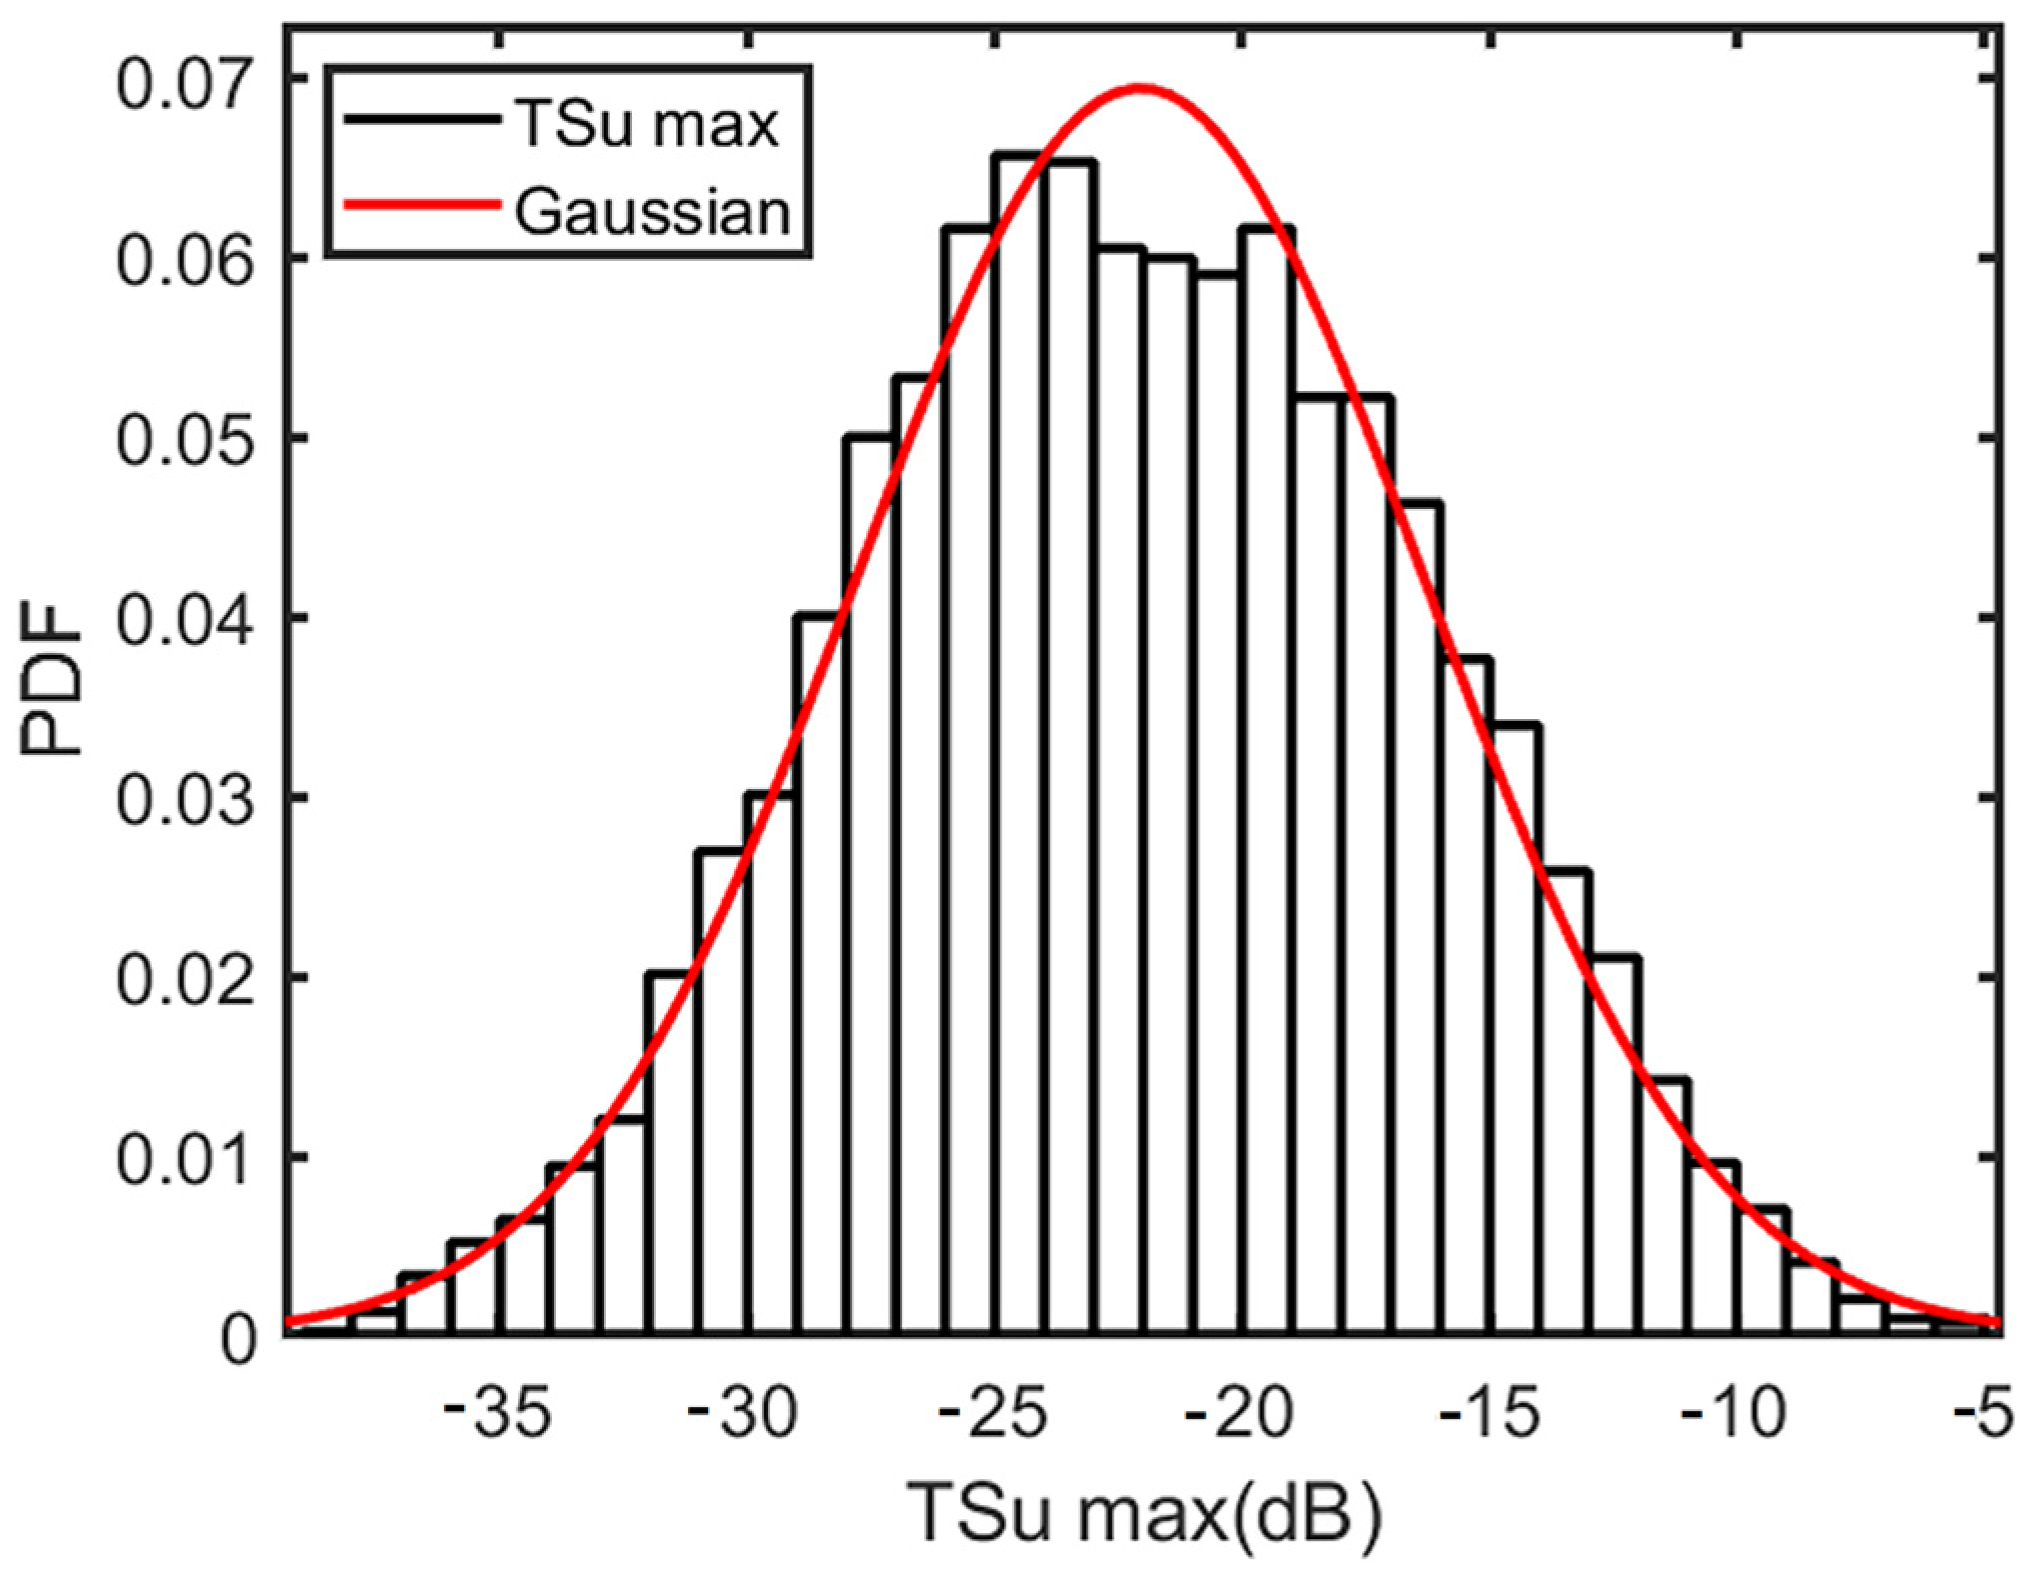
Ventral TS measurements were carried out on Bluefin tuna dwelling in the same tanks from which the tomographed specimens were extracted. TS was calculated considering the swimming inclination distribution, obtained from the synchronized stereoscopic video recordings. The probability density function (PDF) of swimming orientation registered in a tank with a mean FL of 100 cm was adjusted to the best-fitted Gaussian distribution, with a mean angle α ¯ 0 = 4.4 ° and a standard deviation (SD) of α S D = 3.7 ° (Figure 7). The individual directivities for each specimen were individually weighted with the swimming orientation’s PDF, obtaining the following TS values: −19.7 dB (Fish A31), −25.9 dB (Fish B319), and −28.8 dB (Fish B314). The ventral results for the uncompensated TS (Figure 8) were compared with the numerical estimation of TS, with very good agreement, showing a difference of 0.9 dB (Table 3).

4. Discussion

We observed good agreement between the numerical estimation of TS and ventral experimental TS measurements on the ABFT. The numerical model was developed to reproduce the particular experimental configuration and to be representative of the sampled ABFT school. It should be noted that the tuna in the tanks grew up in captivity, and they may show some anatomical differences from wild ABFT. In this sense, it should be mentioned that specimen B319, could be affected by a slight malformation reported in other reared species [34,35,36,37]. The mouth shape of the B319 specimen (Figure 5) was rounded, not fitting the characteristic fusiform shape in the ABFT. Through visual inspection, it could be confirmed that tuna with that deformation were present in the tank and therefore present in the experimental data. Therefore, this sample was included as contributing to the average TS. Nevertheless, the exact fraction of deformed individuals in the tank cannot be provided: the tuna in the tanks were being used for other experiments (reproduction studies) and could not be manipulated.
To consider the intrinsic variability in the swimbladder dimensions and shapes shown by the population in the tank, TS directivity was calculated for every specimen, and the averaged TS directivity was considered. For comparison with the experimental results, TS was estimated at the mean working distance in tanks at a depth of 6 m.
TS directivity revealed the role of the swimbladder tilt axis, with maximum TS for α~25°, corresponding to the direction of the maximum swimbladder cross-section against the acoustic beam (Figure 5). It must be noted that the individual variability of the lower shapes of the swimmbladder produced different numerical main lobes of backscattering, in angle and amplitude, highlighting the importance of the swimming pattern in the observed TS: the final TS value is highly dependent on the fish tilt with respect to the acoustic beam. To consider fish tilting, TS directivity was weighted by applying the PDF of the swimming orientation recorded in the tank under study using stereoscopic cameras. The individual TS values considering the swimming orientation’s PDF showed a large dispersion as expected from the calculated directivity patterns (Figure 6) and were also reported in the experimental measurements (Figure 8). When the swimming pattern of the school was considered, the numerical averaged TS was found to be −23.3 dB. The numerical estimation was in good agreement with the experimental ventral TS data, −22.1 ± 5.7 dB.
The relevance of having good knowledge of swimming behavior was evaluated considering a general Gaussian swimming pattern distribution N(0,10) with a mean angle α ¯ 0 = 0 ° and a standard deviation (SD) of α S D = 10 ° , resulting in a difference in the weighted TS of −4 dB.
These values are in good agreement with previously reported data for ventral TS measurements in tuna offshore cages at 120 kHz. In [11], the relationship TS vs. fork length (FL) length for a tilt angle between −20° and +20° was provided as TS = 25.56log10(FL) − 73.72, with TS = −22.6 dB for a tuna fork length FL = 100 cm. To the best of our knowledge, there are no other published studies on ABFT TS for the same frequency and configuration.

5. Conclusions

It is necessary to increase our knowledge of the internal anatomical structures of the targets to establish realistic models, advancing the interpretation of acoustic data in fisheries and aquaculture. In this study, realistic models of ABFT swimbladders were developed using CT data. The MFS method was used to calculate the backscattered field. Because the MFS is a meshless simulation method, it allows us to obtain the TS directivity of three-dimensional models of the swimbladder at different working distances between the target and fish, with significant savings in computational calculation. The results of the experimental TS measurements were in very good agreement with the values obtained from the numerical simulations.
Therefore, we conclude that the proposed methodology is an efficient tool for calculating and understanding the properties of acoustic backscattering from detailed models of ABFT’s internal structures from the ABFT obtained from CT imaging. In future work, we intend to vary the distance and orientation of the transducers.
Owing to the limitations in the access to ABFT specimens, only a reduced number of individuals could be studied using CT. Increasing the number of scanned individuals, corresponding to different sizes and evolution stages of the fish is needed to study the dependence of TS values on different specimen sizes. In the same sense, to compare the results with TS of ABFT in the wild, the different conditions between wild and captive tuna should be considered. Despite the difficulties in obtaining CT data from wild Bluefin tuna, efforts should be made to deepen the application of this methodology to ABFT fisheries. To reproduce the experimental results in other configurations, for example, for dorsal or lateral measurements or different working frequencies, the contribution of the flesh and backbone should be evaluated in the MFS algorithm.

Author Contributions

A.L., CT acquisition, processing of CT images, numerical modeling, and writing. I.P.-A., coordination, writing, supervision, and numerical and experimental processing. V.E., writing and supervision of experimental measurements. V.P.-P., experimental measurements. F.d.l.G., supervisor of aquaculture tanks and writing. A.O., CT acquisition and writing. E.B., CT acquisition. L.G., numerical modeling. All authors have read and agreed to the published version of the manuscript.

Funding

This work was supported by funding from ACTHHUN project grant ref. PID2021-127426OB-C21 was funded by MICIU/AEI/10.13039/501100011033 and the Valencian Government through project ref AICO/2020/064. The authors are grateful to ICTS-ICAR (www.icar.ieo.es (accessed on 20 February 2024)) for the technical assistance. A. Ladino give thanks for the support provided by a research program of Universitat Politècnica de València (PAID) that granted financial support through the scholarship programme FPI subprograma 2 ref. (FPI_UPV_SUB. 2-2018-19-9651), and V. Puig-Pons acknowledges the support of the research program of Universitat Politècnica de València “Access Contracts for Post-Doctoral Researchers (PAID-10-22).

Institutional Review Board Statement

Not applicable.

Informed Consent Statement

Not applicable.

Data Availability Statement

The original contributions presented in this study are included in the article; further inquiries can be directed to the corresponding author.

Conflicts of Interest

The authors declare no conflicts of interest.

References

  1. FAO. Pesca y Acuicultura—Especies Acuáticas—Thunnus Thynnus Linnaeus, 1758. Available online: https://www.fao.org/fishery/es/aqspecies/3296/en (accessed on 18 February 2023).
  2. Cort, J.L. El Enigma Del Atún Rojo Reproductor Del Atlántico Nororiental; Bedia Artes Gráficas: Santander, Spain, 2007. (In Spanish) [Google Scholar]
  3. de la Gándara, F.; Ortega, A.; Buentello, A. Tuna Aquaculture in Europe. In Advances in Tuna Aquaculture: From Hatchery to Market; Academic Press: Cambridge, MA, USA, 2016; pp. 115–157. [Google Scholar] [CrossRef]
  4. Fromentin, J.; Powers, J.E. Atlantic bluefin tuna: Population dynamics, ecology, fisheries and management. Fish Fish. 2005, 6, 281–306. [Google Scholar] [CrossRef]
  5. Ortega, A.; de la Gándara, F. Closing the life cycle of the Atlantic Bluefin tuna Thunnus thynnus in captivity. In Proceedings of the Aquaculture Europe 17, Dubrovnik, Croatia, 17–20 October 2017; pp. 857–858. [Google Scholar]
  6. Muñoz-Benavent, P.; Andreu-García, G.; Valiente-González, J.M.; Atienza-Vanacloig, V.; Puig-Pons, V.; Espinosa, V. Automatic Bluefin Tuna sizing using a stereoscopic vision system. ICES J. Mar. Sci. 2018, 75, 390–401. [Google Scholar] [CrossRef]
  7. Simmonds, J.; MacLennan, D. Fisheries Acoustics: Theory and Practice, 2nd ed.; John Wiley & Sons: Hoboken, NJ, USA, 2005; Volume 1. [Google Scholar]
  8. Kang, D.; Sadayasu, K.; Mukai, T.; Iida, K.; Hwang, D.; Sawada, K.; Miyashita, K. Target strength estimation of black porgy Acanthopagrus schlegeli using acoustic measurements and a scattering model. Fish. Sci. 2004, 70, 819–828. [Google Scholar] [CrossRef]
  9. Foote, K.G. Summary of methods for determining fish target strength at ultrasonic frequencies. ICES J. Mar. Sci. 1991, 48, 211–217. [Google Scholar] [CrossRef]
  10. Furusawa, M. Prolate spheroidal models for predicting general trends of fish target strength. J. Acoust. Soc. Jpn. 1988, 9, 13–24. [Google Scholar] [CrossRef]
  11. Puig-Pons, V.; Muñoz-Benavent, P.; Pérez-Arjona, I.; Ladino, A.; Llorens-Escrich, S.; Andreu-García, G.; Valiente-González, J.M.; Atienza-Vanacloig, V.; Ordóñez-Cebrián, P.; Pastor-Gimeno, J.I.; et al. Estimation of Bluefin Tuna (Thunnus thynnus) mean length in sea cages by acoustical means. Appl. Acoust. 2022, 197, 108960. [Google Scholar] [CrossRef]
  12. Love, R.H. Dorsal-Aspect Target Strength of an Individual Fish. J. Acoust. Soc. Am. 1971, 49, 816–823. [Google Scholar] [CrossRef]
  13. Boyra, G.; Uranga, J.; Goñi, N.; Godard, I.; Sobradillo, B. Target strength measurements of Atlantic bluefin tuna (Thunnus thynnus) from a live-bait fishing vessel in the Bay of Biscay. Fish. Res. 2024, 280, 107150. [Google Scholar] [CrossRef]
  14. Peña, H.; Macaulay, G.J.; Ona, E.; Vatnehol, S.; Holmin, A.J. Estimating individual fish school biomass using digital omnidirectional sonars, applied to mackerel and herring. ICES J. Mar. Sci. 2021, 78, 940–951. [Google Scholar] [CrossRef]
  15. Jech, J.M.; Horne, J.K.; Chu, D.; Demer, D.A.; Francis, D.T.; Gorska, N.; Jones, B.; Lavery, A.C.; Stanton, T.K.; Macaulay, G.J.; et al. Comparisons among ten models of acoustic backscattering used in aquatic ecosystem research. J. Acoust. Soc. Am. 2015, 138, 3742–3764. [Google Scholar] [CrossRef]
  16. Foote, K.G. Importance of the swimbladder in acoustic scattering by fish: A comparison of gadoid and mackerel target strengths. J. Acoust. Soc. Am. 1980, 67, 2084–2089. [Google Scholar] [CrossRef]
  17. Macaulay, G.J.; Peña, H.; Fässler, S.M.M.; Pedersen, G.; Ona, E. Accuracy of the Kirchhoff-Approximation and Kirchhoff-Ray-Mode Fish Swimbladder Acoustic Scattering Models. PLoS ONE 2013, 8, 2–8. [Google Scholar] [CrossRef] [PubMed]
  18. Peña, H.; Foote, K.G. Modelling the target strength of Trachurus symmetricus murphyi based on high-resolution swimbladder morphometry using an MRI scanner. ICES J. Mar. Sci. 2008, 65, 1751–1761. [Google Scholar] [CrossRef]
  19. Do, M.A.; Surti, A.M. Estimation of dorsal aspect target strength of deep-water fish using a simple model of swimbladder backscattering. J. Acoust. Soc. Am. 1990, 87, 1588–1596. [Google Scholar] [CrossRef]
  20. Gorska, N.; Ona, E.; Korneliussen, R. Acoustic backscattering by Atlantic mackerel as being representative of fish that lack a swimbladder. Backscattering by individual fish. ICES J. Mar. Sci. 2005, 62, 984–995. [Google Scholar] [CrossRef]
  21. Chu, D.; Stanton, T.K.; Jech, J.M.; Reeder, D.B. Modeling of the backscattering by swimbladder-bearing fish. J. Acoust. Soc. Am. 2006, 120, 3105. [Google Scholar] [CrossRef]
  22. Stanton, K. Simple approximate formulas for backscattering of sound by spherical and elongated objects. J. Acoust. Soc. Am. 1989, 86, 1499–1510. [Google Scholar] [CrossRef]
  23. Clay, C.S.; Home, J.K. Acoustic models of fish: The Atlantic cod (Gadus morhua). J. Acoust. Soc. Am. 1994, 96, 1661–1668. [Google Scholar] [CrossRef]
  24. Gauthier, S.; Horne, J.K. Acoustic characteristics of forage fish species in the Gulf of Alaska and Bering Sea based on Kirchhoff-approximation models. Can. J. Fish. Aquat. Sci. 2004, 61, 1839–1850. [Google Scholar] [CrossRef]
  25. Macaulay, G.J. Anatomically detailed acoustic scattering models of fish. Bioacoustics 2002, 12, 275–277. [Google Scholar] [CrossRef]
  26. Reeder, D.B.; Jech, J.M.; Stanton, T.K. Broadband acoustic backscatter and high-resolution morphology of fish: Measurement and modeling. J. Acoust. Soc. Am. 2004, 116, 747–761. [Google Scholar] [CrossRef] [PubMed]
  27. Pérez-Arjona, I.; Godinho, L.M.C.; Espinosa, V. Numerical simulation of target strength measurements from near to far field of fish using the method of fundamental solutions. Acta Acust. United Acust. 2018, 104, 25–38. [Google Scholar] [CrossRef]
  28. Pérez-Arjona, I.; Godinho, L.; Espinosa, V. Influence of fish backbone model geometrical features on the numerical target strength of swimbladdered fish. ICES J. Mar. Sci. 2020, 77, 2870–2881. [Google Scholar] [CrossRef]
  29. Zhu, Z.; Tong, J.; Xue, M.; Qiu, C.; Lyu, S.; Liu, B. Investigations on Target Strength Estimation Methods: A Case Study of Chub Mackerel (Scomber japonicus) in the Northwest Pacific Ocean. Fishes 2024, 9, 307. [Google Scholar] [CrossRef]
  30. Godinho, L.; Tadeu, A.; Mendes, P.A. Wave propagation around thin structures using the MFS. Comput. Mater. Contin. 2007, 5, 117–127. [Google Scholar] [CrossRef]
  31. Simrad ES120-7C Split Beam Echo Sounder Transducer. Technical Specifications. Available online: https://www.simrad.online/td_120/es120_7c/es120_7c_ds_en_a4.pdf (accessed on 18 October 2024).
  32. Simrad. Simrad EK80, Wide Band Scientific Echo Sounder. Reference Manual 2008. Volume 1. Available online: https://www.simrad.online/ek80/ins/ek80_ins_en_us.pdf (accessed on 18 October 2024).
  33. Sarà, G.; Dean, J.M.; d’Amato, D.; Buscaino, G.; Oliveri, A.; Genovese, S.; Ferro, S.; Buffa, G.; Martire, M.L.; Mazzola, S. Effect of boat noise on the behaviour of bluefin Tuna Thunnus thynnus in the Mediterranean Sea. Mar. Ecol. Prog. Ser. 2007, 331, 243–253. [Google Scholar] [CrossRef]
  34. Voorhees, T.M. Epidemiology of Puffy Snout Syndrome in Tuna. University of Rhode Island. 2015. Available online: http://digitalcommons.uri.edu/theses/820 (accessed on 18 October 2024).
  35. Partridge, G. Hatchery Production of Yellowfin Tuna. Melbourne, Australia. 2009. Available online: www.issinstitute.org.au (accessed on 18 October 2024).
  36. Miller, E.A.; Leidholt, S.; Galvin, T.; Norton, A.; Van Houtan, K.S.; Thurber, R.V.; Boustany, A. Electron microscopy reveals viral-like particles and mitochondrial degradation in scombrid puffy snout syndrome. Dis. Aquat. Organ. 2021, 147, 25–31. [Google Scholar] [CrossRef]
  37. Nakamura, I. A Pugheaded Specimen Found among a School of Bluefin Tuna, Thunnus thynnus. Jpn. J. Ichthyol. 1977, 23, 237–238. [Google Scholar] [CrossRef]
Figure 1. (a) Example in situ computed tomography in the specimens; (b) identification of swimbladder on the frontal view CT scan; (c) presence of swimbladder in situ.
Jmse 12 02014 g001
Figure 2. (a) Swimbladder boundary discretization (black—collocations points) and virtual sources (red: virtual sources) used in the numerical MFS model; (b) TS directivity angle ( α ) definition in the x-y plane, with α being the swimming direction angle, that is, the tilt angle of the fish body axis with respect to the horizontal axis. The echosounder’s emitted beam is orthogonal to the fish axis for α = 0 ° .
Jmse 12 02014 g002
Figure 3. Acoustic radiation pattern emitted by the 120 kHz transducer. The beam axis corresponds to 90°.
Jmse 12 02014 g003
Figure 4. Experimental setup: (a) setup diagram, 120 kHz transducer mounted on a platform anchored at the bottom of the tank facing the surface; (b) face-up transducer and stereoscopic video system used in the experiments.
Jmse 12 02014 g004
Figure 5. ABFT model processing: (left) internal morphological structure from CT images and (right) 3D model of the swimbladder: (a) A31; (b) B314; (c) B319.
Jmse 12 02014 g005
Figure 6. Directivity of the swimbladder ABFT specimens: the graya solid line (A31), red solid line (B314), black dotted line (B319), and black solid line represent TS directivity averaged over the three samples. The angle corresponds to the tilt angle of the fish body axis with respect to the horizontal axis, α in Figure 2b. Horizontal swimming corresponds to α = 0 ° , whist α < 0 ° corresponds to swimming diving down and α > 0 ° corresponds to diving up. The testing frequency is 120 kHz and the distance to the transducer is 6 m.
Jmse 12 02014 g006
Figure 7. Histogram of the tilt angle PDF for the ABFT with a mean fork length FL = 100 cm measured in the tank.
Jmse 12 02014 g007
Figure 8. Histogram of the ventral TS measurements at 120 kHz corresponding to the ABFT with a mean fork length FL = 100 cm.
Jmse 12 02014 g008
Table 1. Echosounder calibrations data obtained prior to measurement (left). Selected parameters used in the analysis of ventral experimental data at 120 kHz (right).
Calibration Data of the EchosounderParameters Selected
f (kHz)120Segmentation threshold (dB)−50
TransducerES120-7CArea (pixels)>200 and <2000
Serial number1636Selection threshold 1 (dB)−50
Gain (dB)26.22Selection threshold 2 (dB)>−40 and <−5
Sa corr (dB)−0.0462Range (m)>2 and <7.5
BeamWidthAlongship (°)6.57Minimum pings4
BeamWidthAthwartship (°)6.6Minumum strength0.7
AngleOffsetAlongship (°)−0.02
AngleOffsetAthwatship (°)−0.06
TsRmsError (dB)0.0366
Table 2. Summary of ABFT sampled fish body and swimbladder metrics derived from individual CT images.
ABFTA31B314B319
Fork Length—FL (cm)10496.598
Total Length—TL (cm)116108.5105
Height—H (cm)272533
Circumference—C (cm)7770.581
Width—W (cm)2118.520
Weight—w (Kg)21.918.1221.55
Swimbladder
Length—SL (cm) 35.1530.5122.29
Width—SW (cm)8.68.268.32
Height—SH (cm)3.464.963
Ratio—SR (%)33.831.622.7
Angle— α s   (°)29.02221.8
Table 3. Numerical estimation and experimental results for the ABFT’s TS at 120 kHz. Numerical results considering the influence of swimming behavior. Experimental data include the median and standard deviation (SD) of the TS and the number of individual traces.
Numerical MFSExperimental Measurements
FL (cm)TS Weighted (dB)FL (cm)TS (dB) MedianSD (dB)Traces
100 ±   3 −23.3100 ±   13 −22.15.75419
Disclaimer/Publisher’s Note: The statements, opinions and data contained in all publications are solely those of the individual author(s) and contributor(s) and not of MDPI and/or the editor(s). MDPI and/or the editor(s) disclaim responsibility for any injury to people or property resulting from any ideas, methods, instructions or products referred to in the content.