


A New Plastic Design Approach for the Vertical-Side-Plating Thickness of Ice-Strengthened Ships Suffering from Ice Floe Impacts

Abstract
:1. Introduction
2. Theoretical Analysis Model for the Dynamic Response of a Ship Plate under Ice Floe Impact
2.1. Introduction to the Proposed Theoretical Model
- -
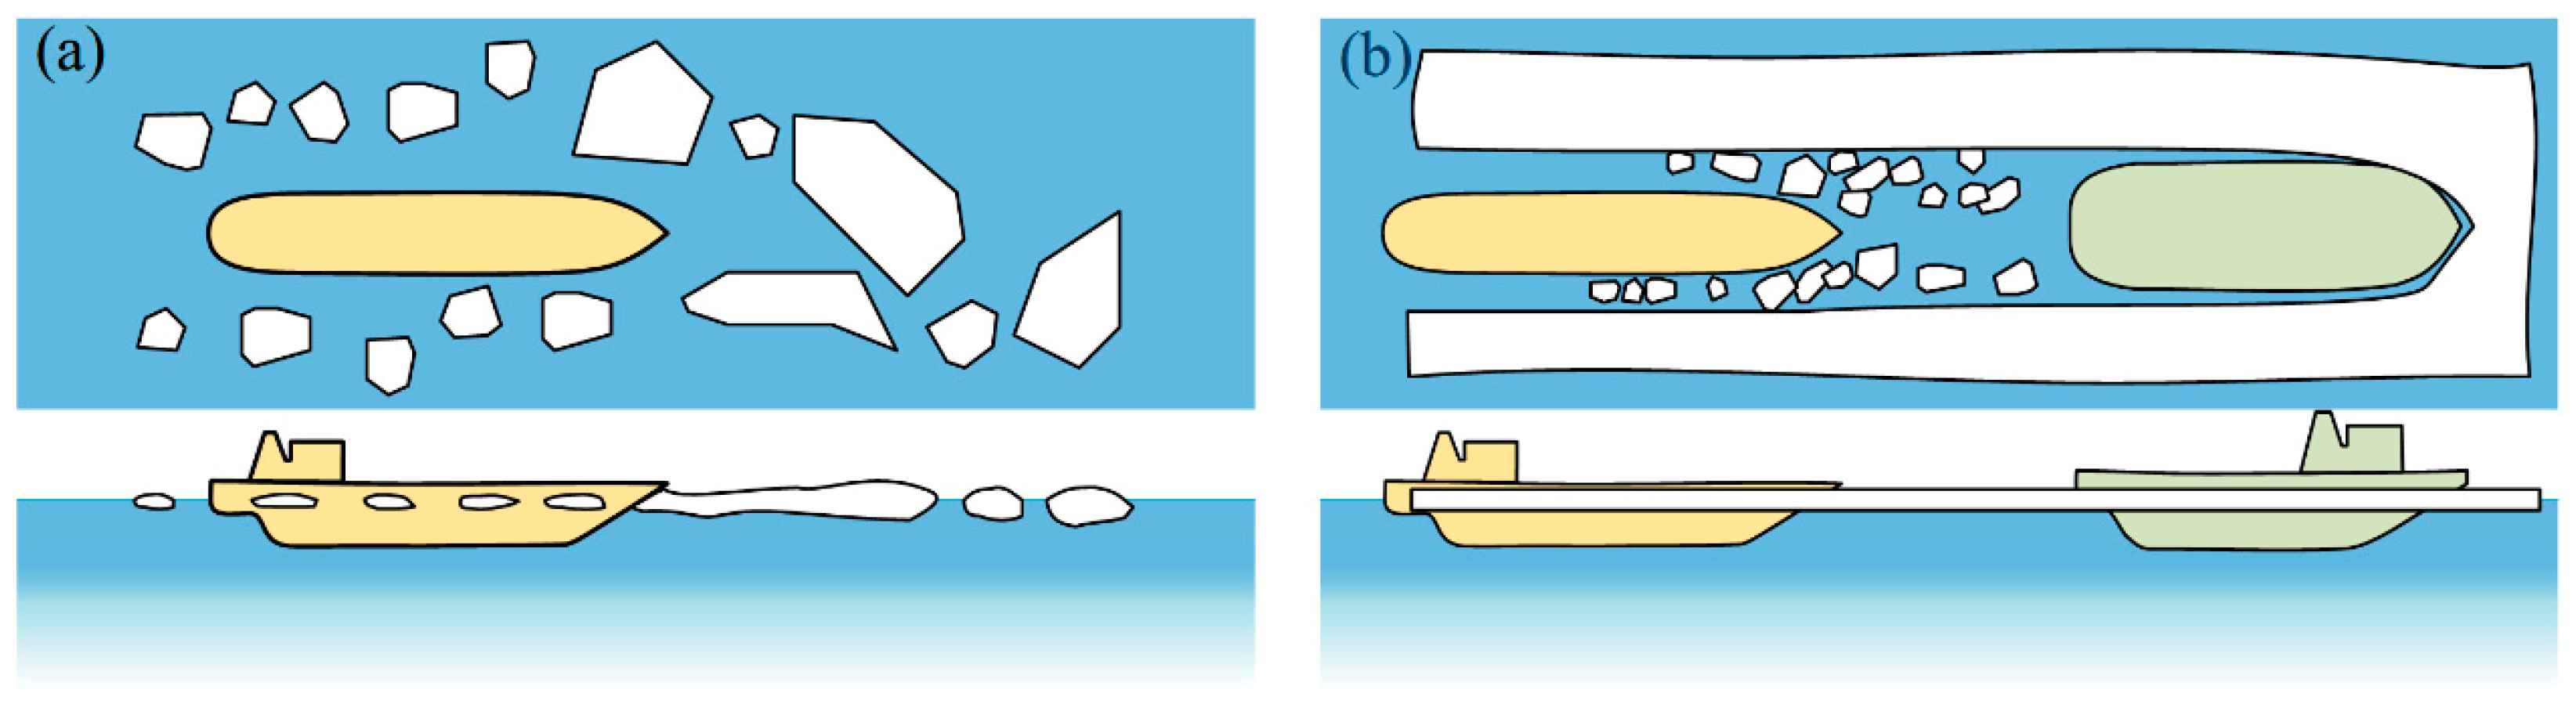
- Head-on impacts of an ice floe with a vertical plate structure;
- -
- Ignoring the effects of ship motion and ice rotation during impact;
- -
- The assumed boundary condition of plate structure is fully clamped.
2.2. Theoretical Model Verification
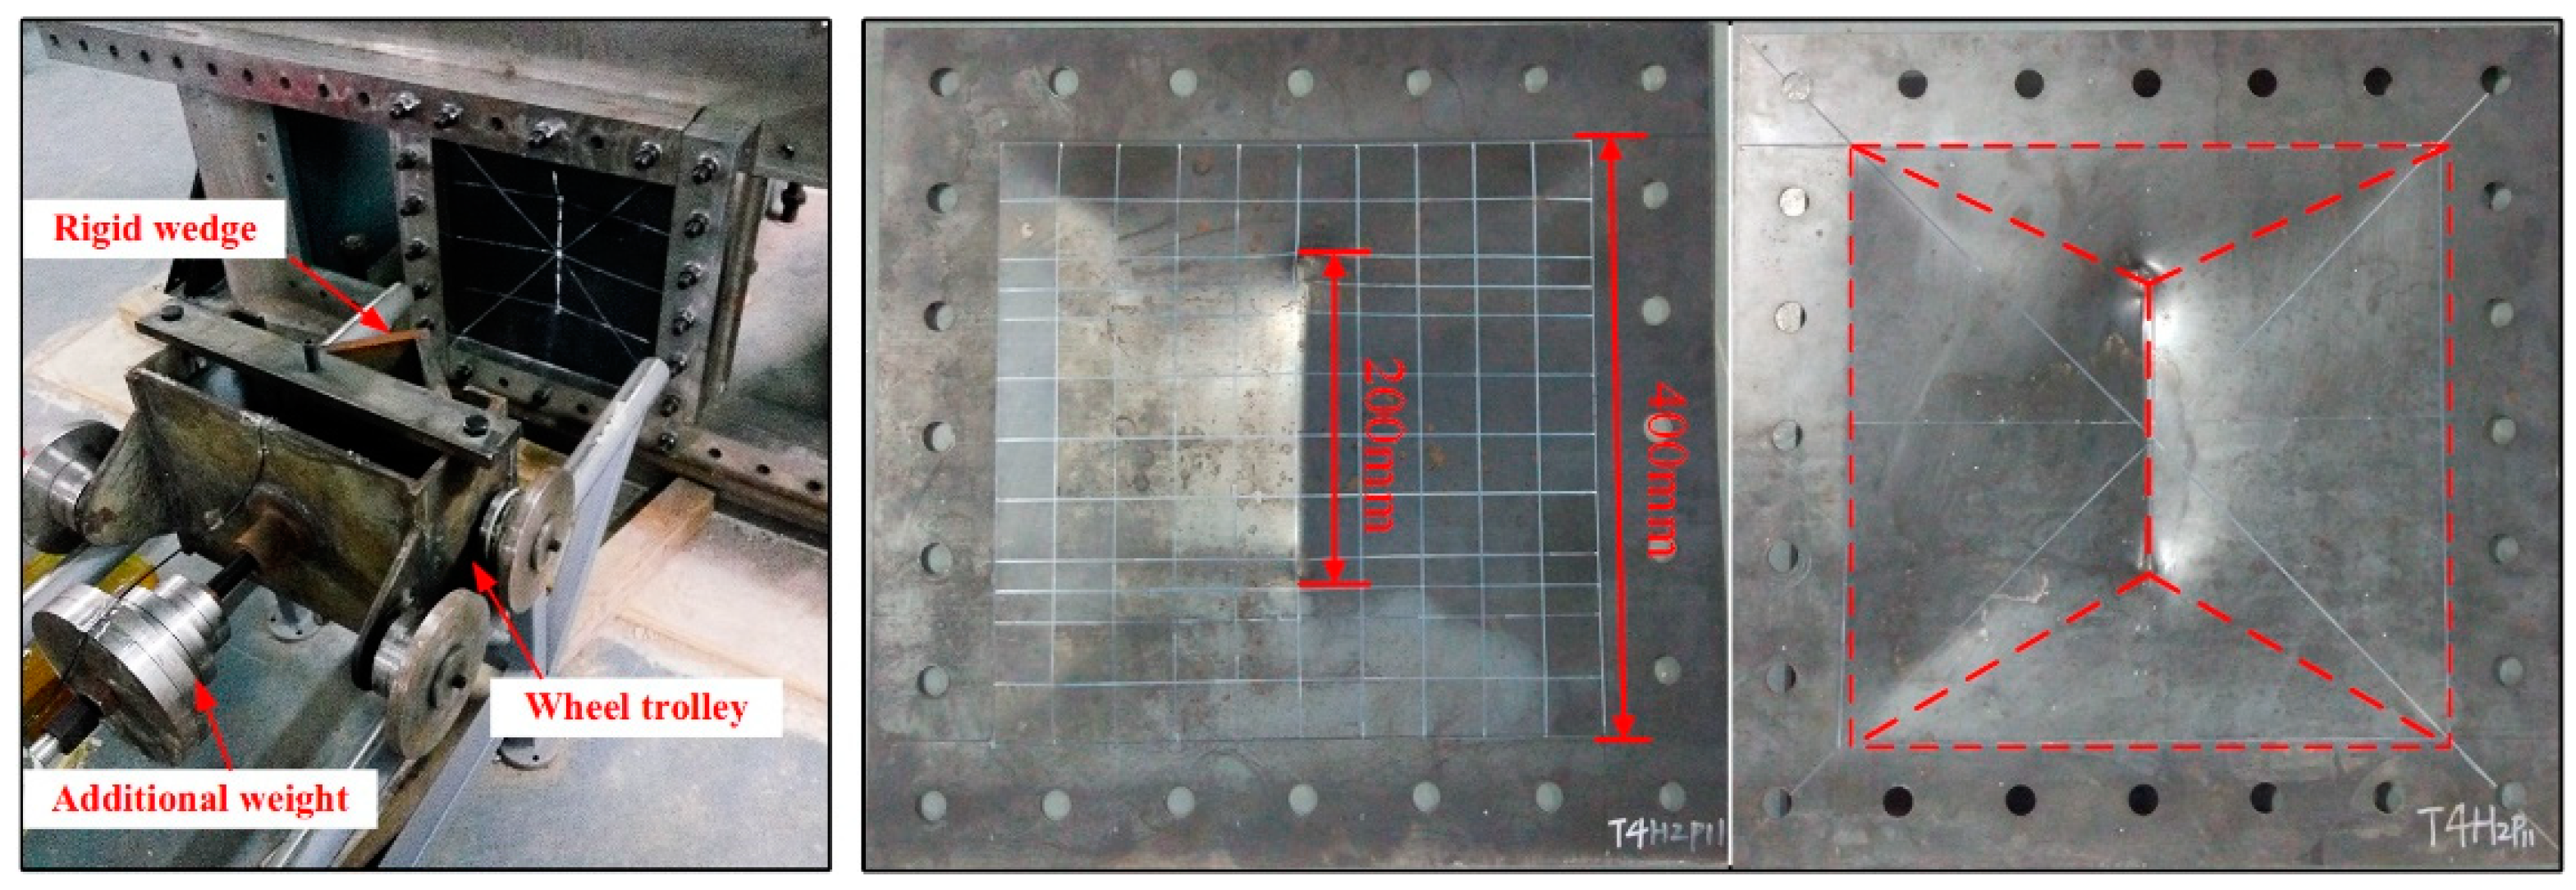
- Rigid-mass impact
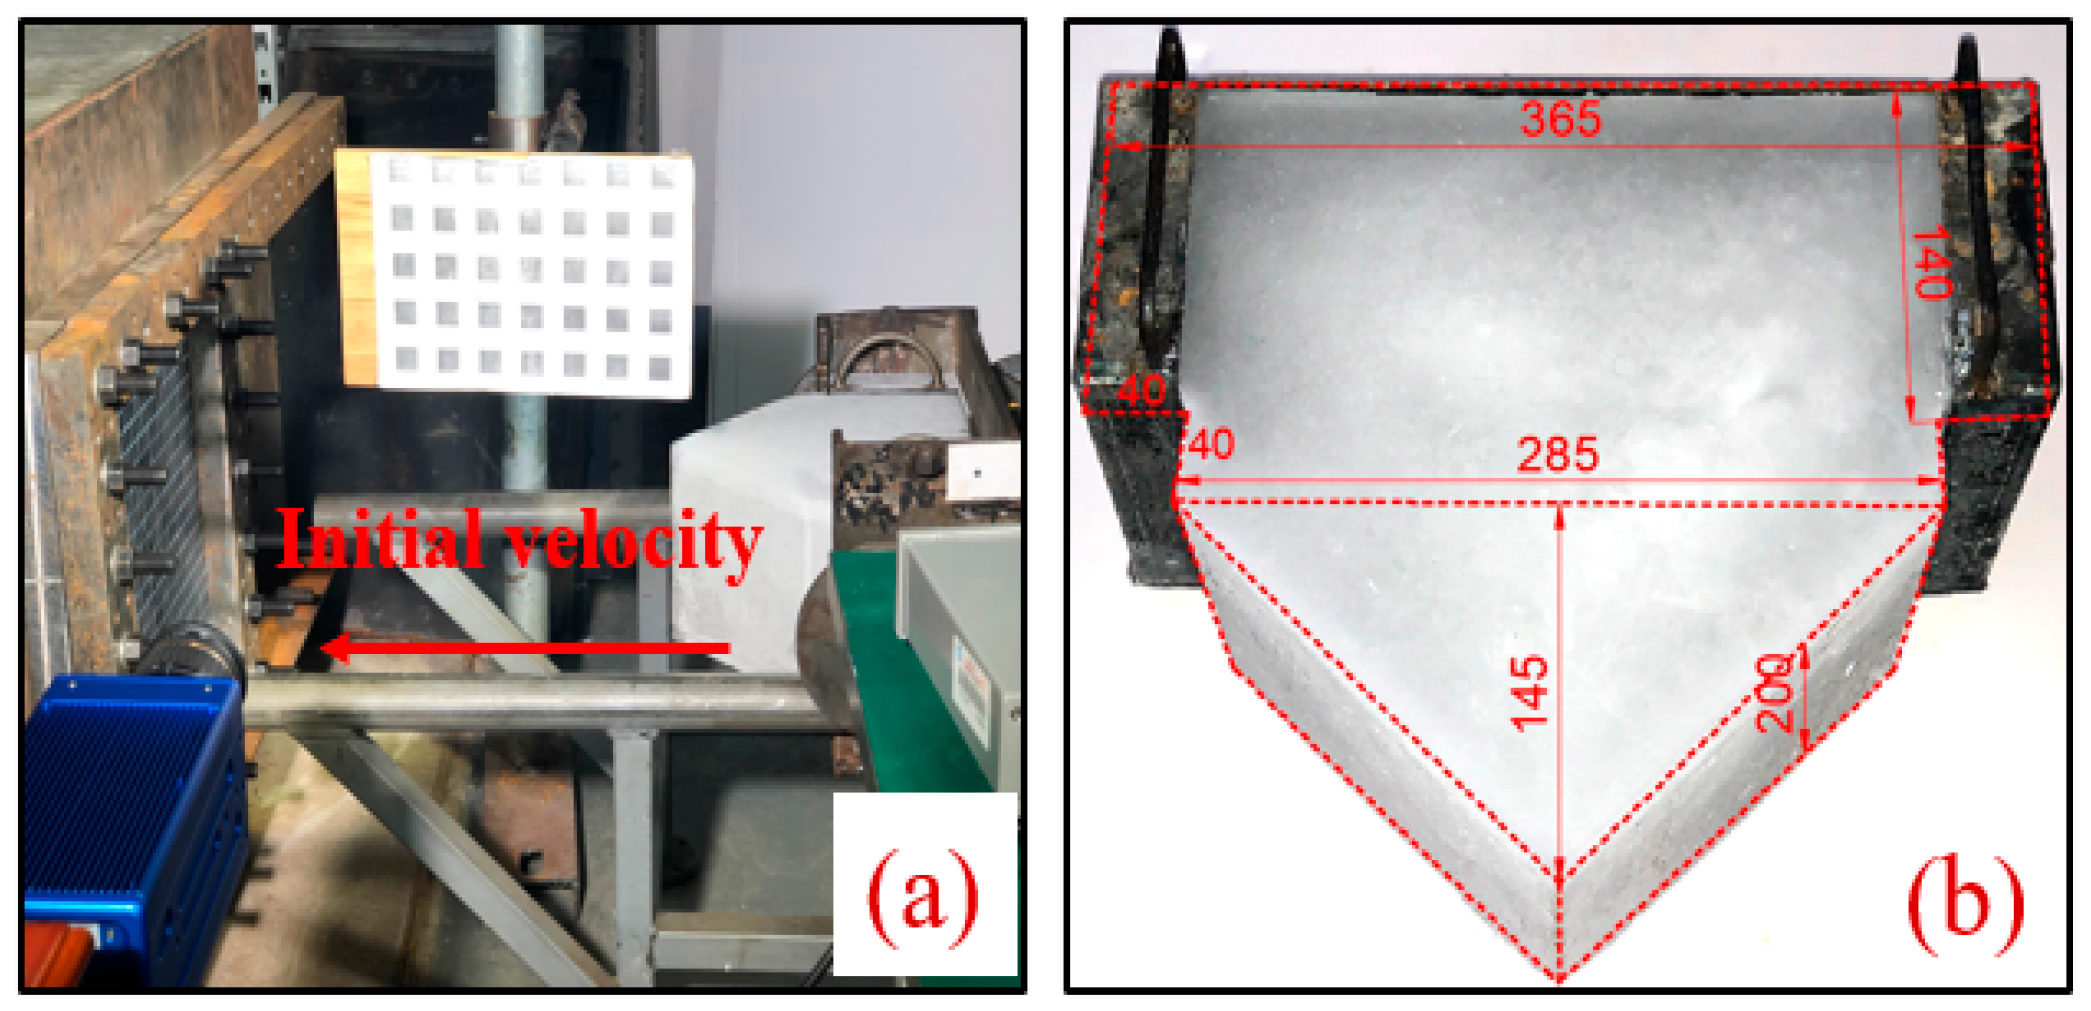
- Ice impact
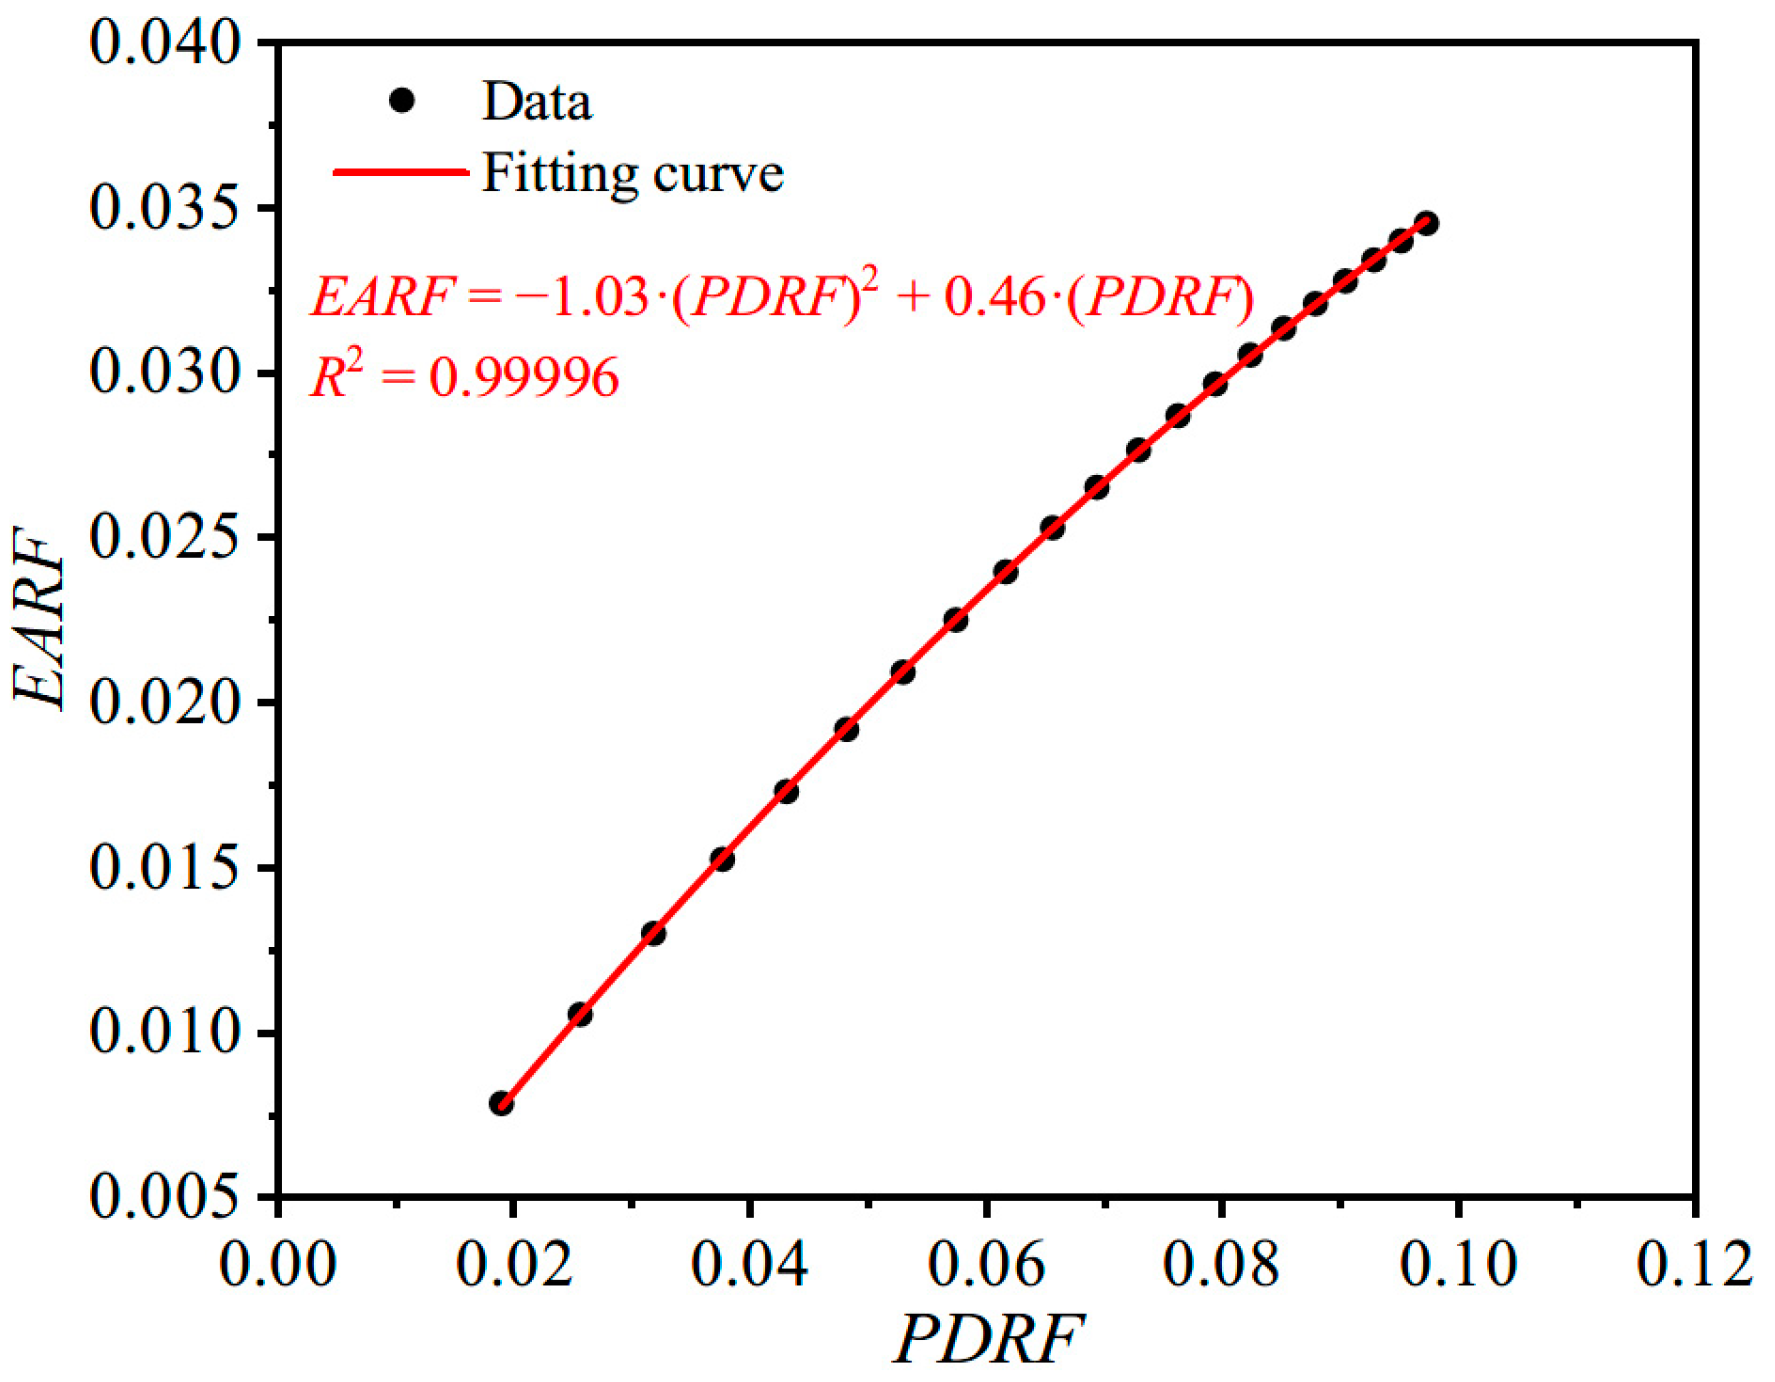
2.3. Comparative Analysis of Theoretical Results of Ice Impact and Rigid-Mass Impact
3. Design Formula for Plating Thickness under Ice-Impact Load
4. Plating-Thickness Design Cases
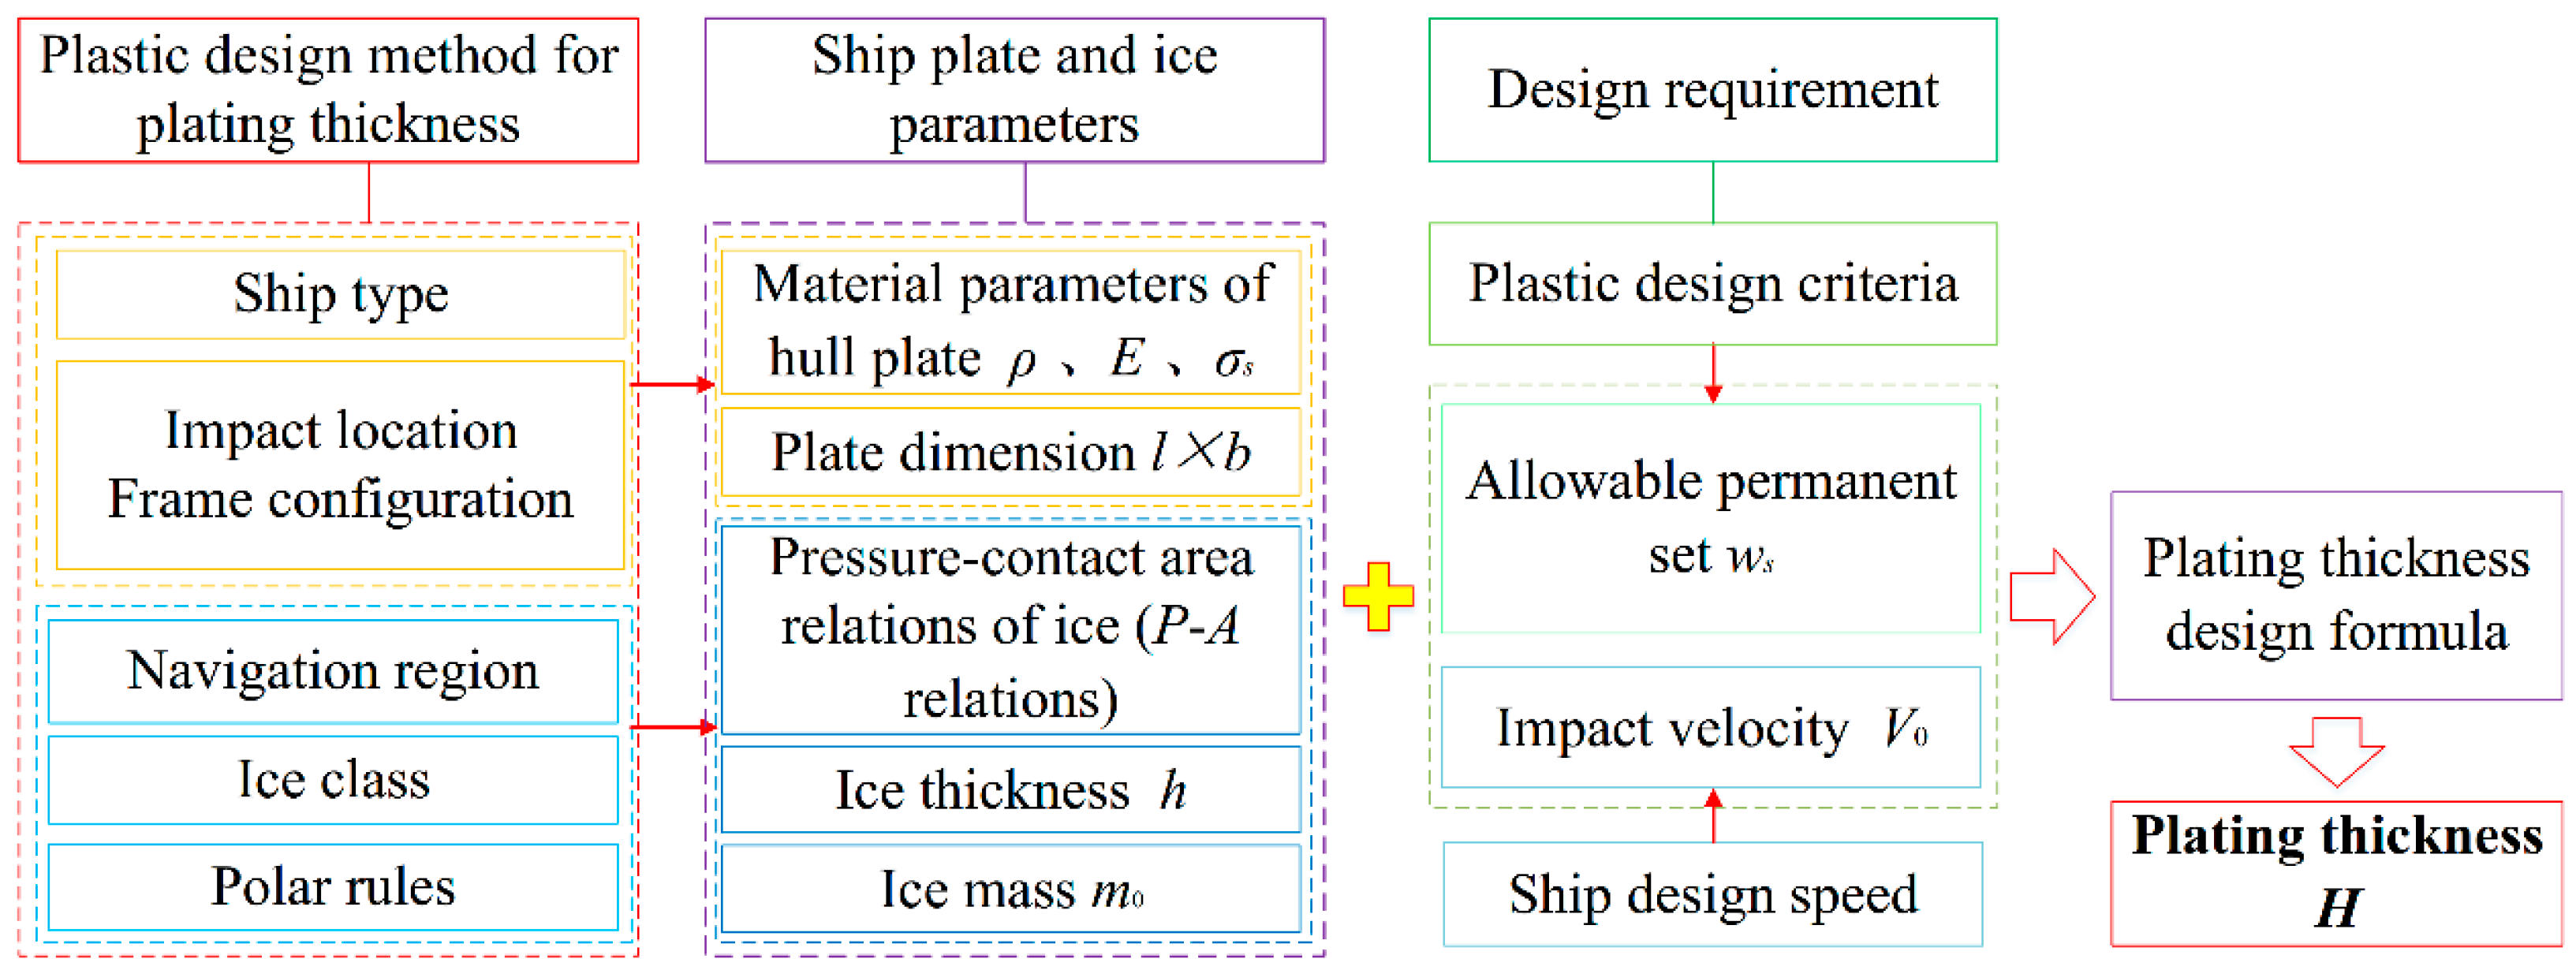
4.1. Plating-Thickness Design Procedure
4.2. Design Curves under Different Design Parameters and Cases
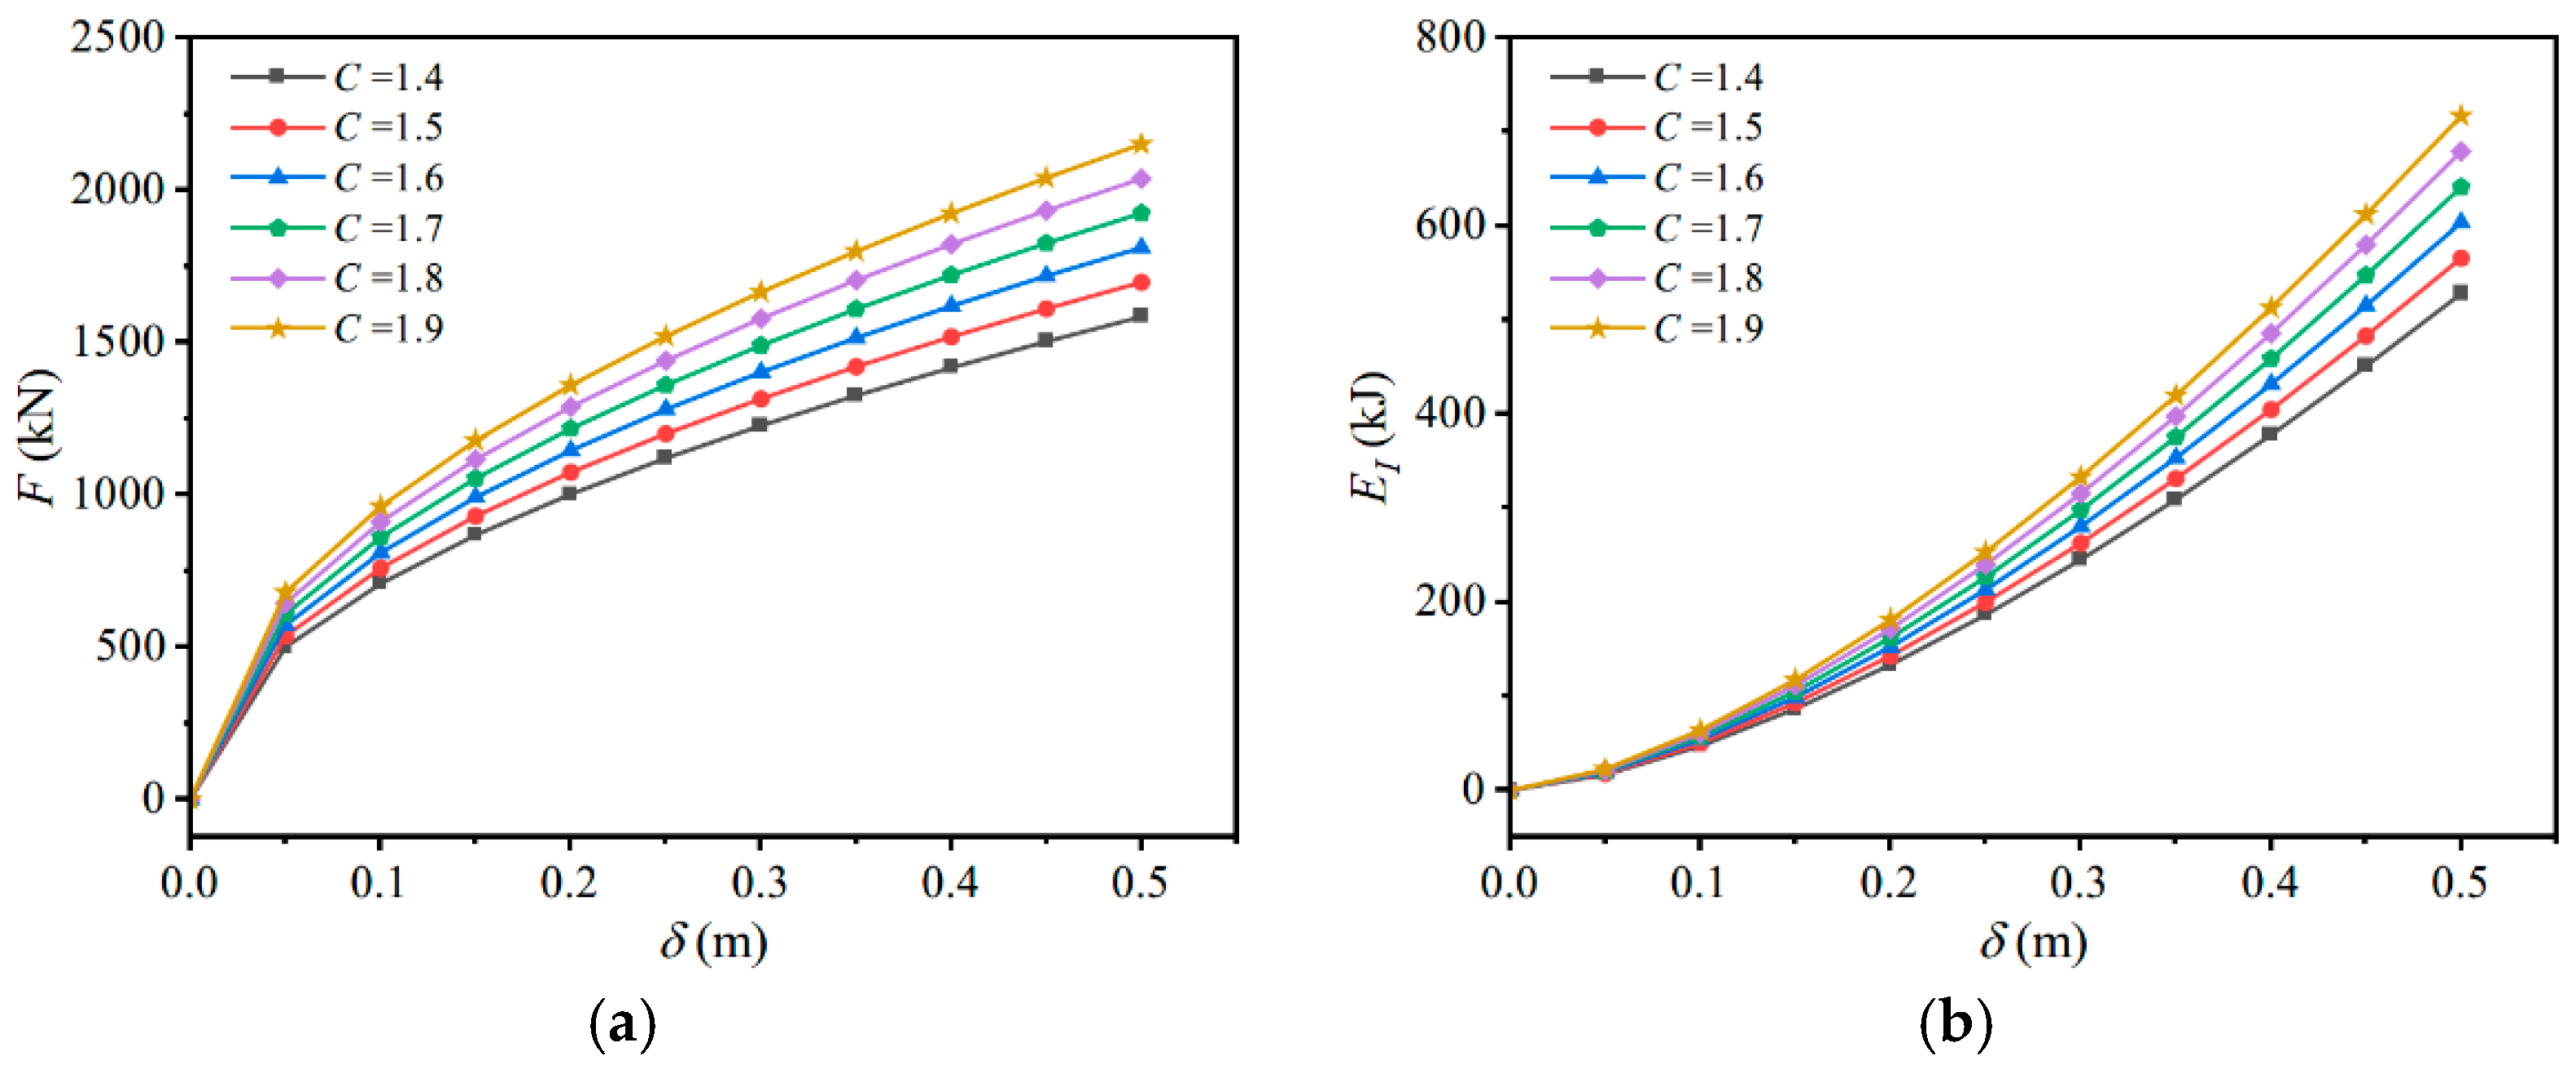
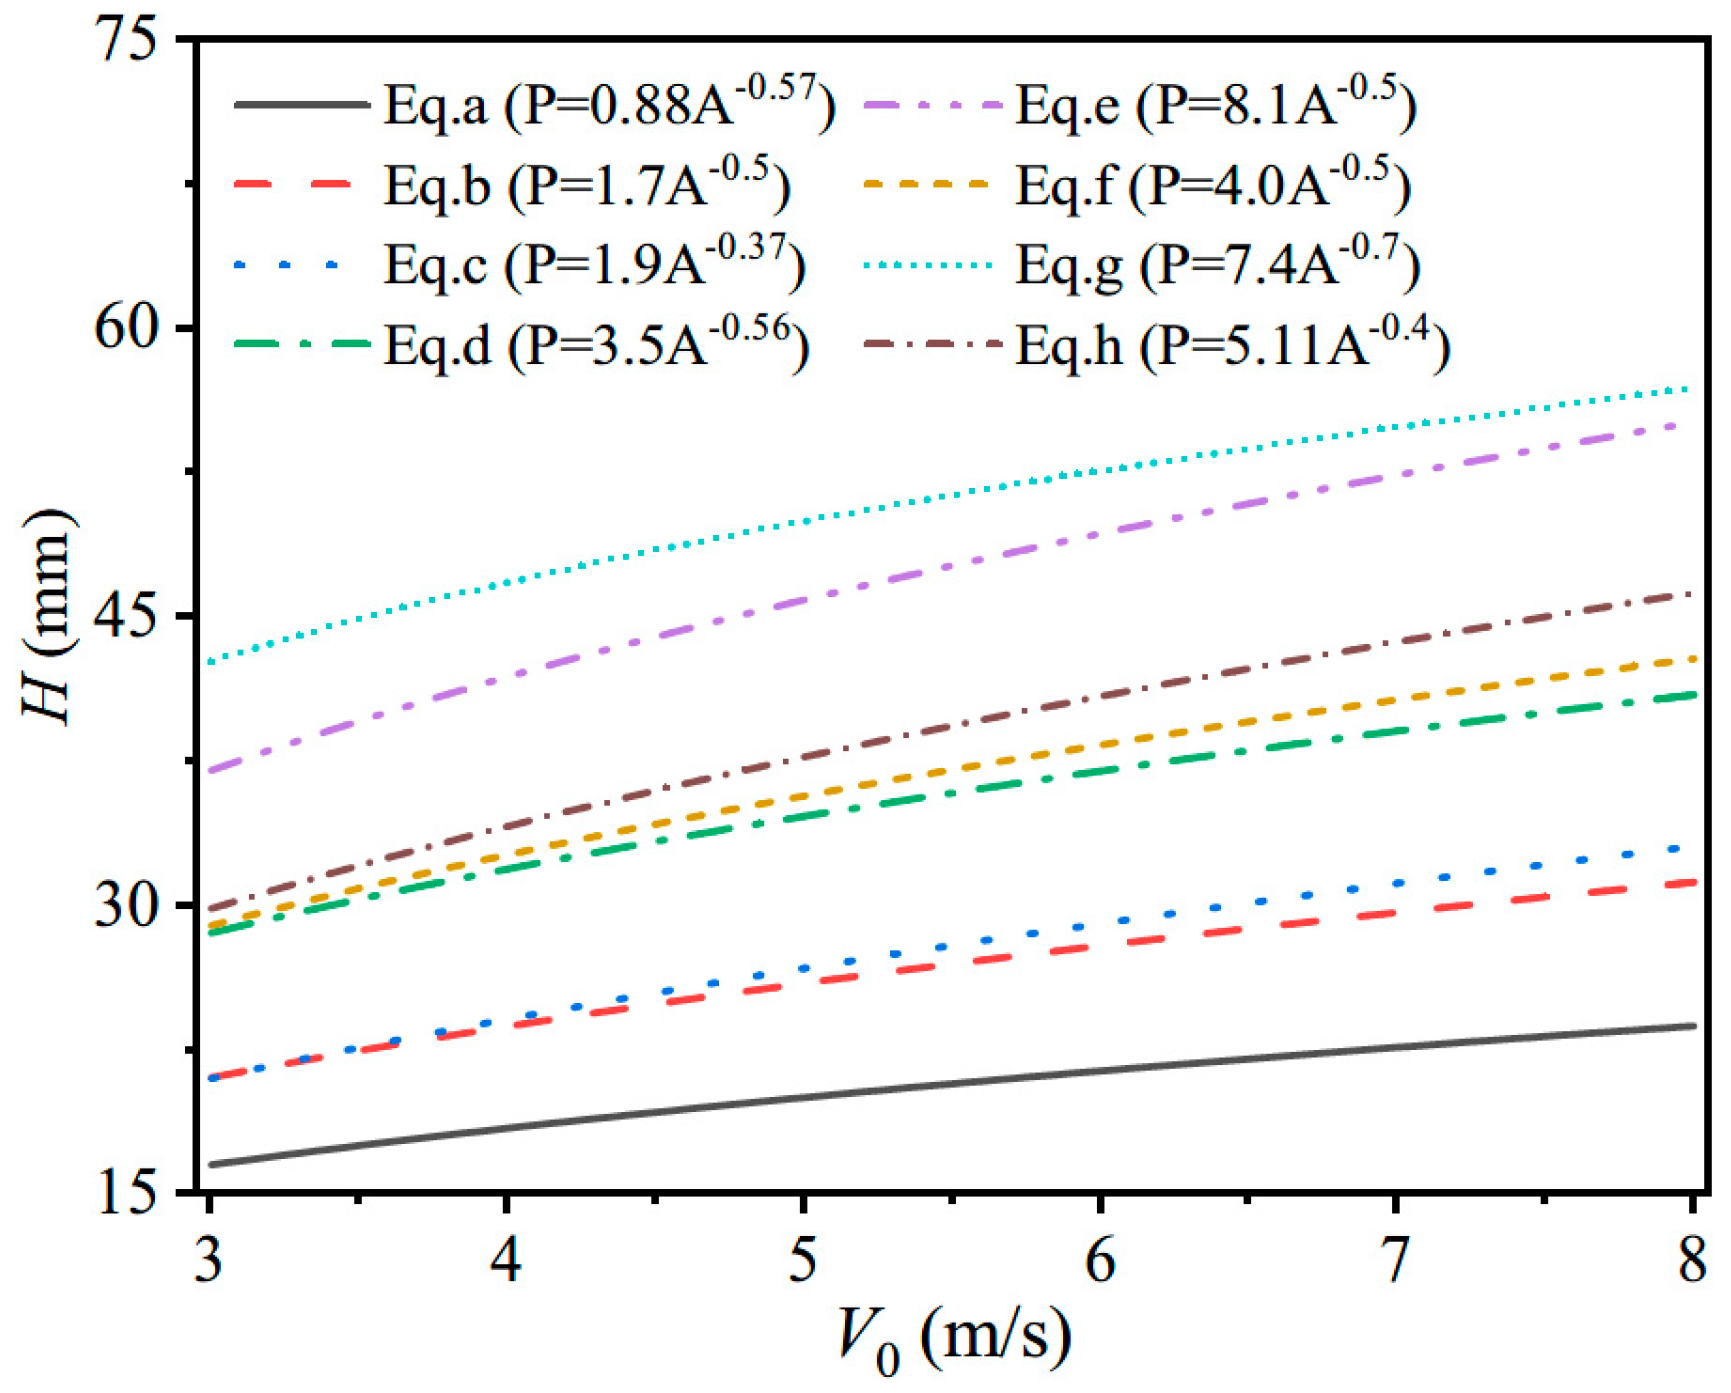
4.2.1. Case 1. Different Ice Strengths (P–A Curves)
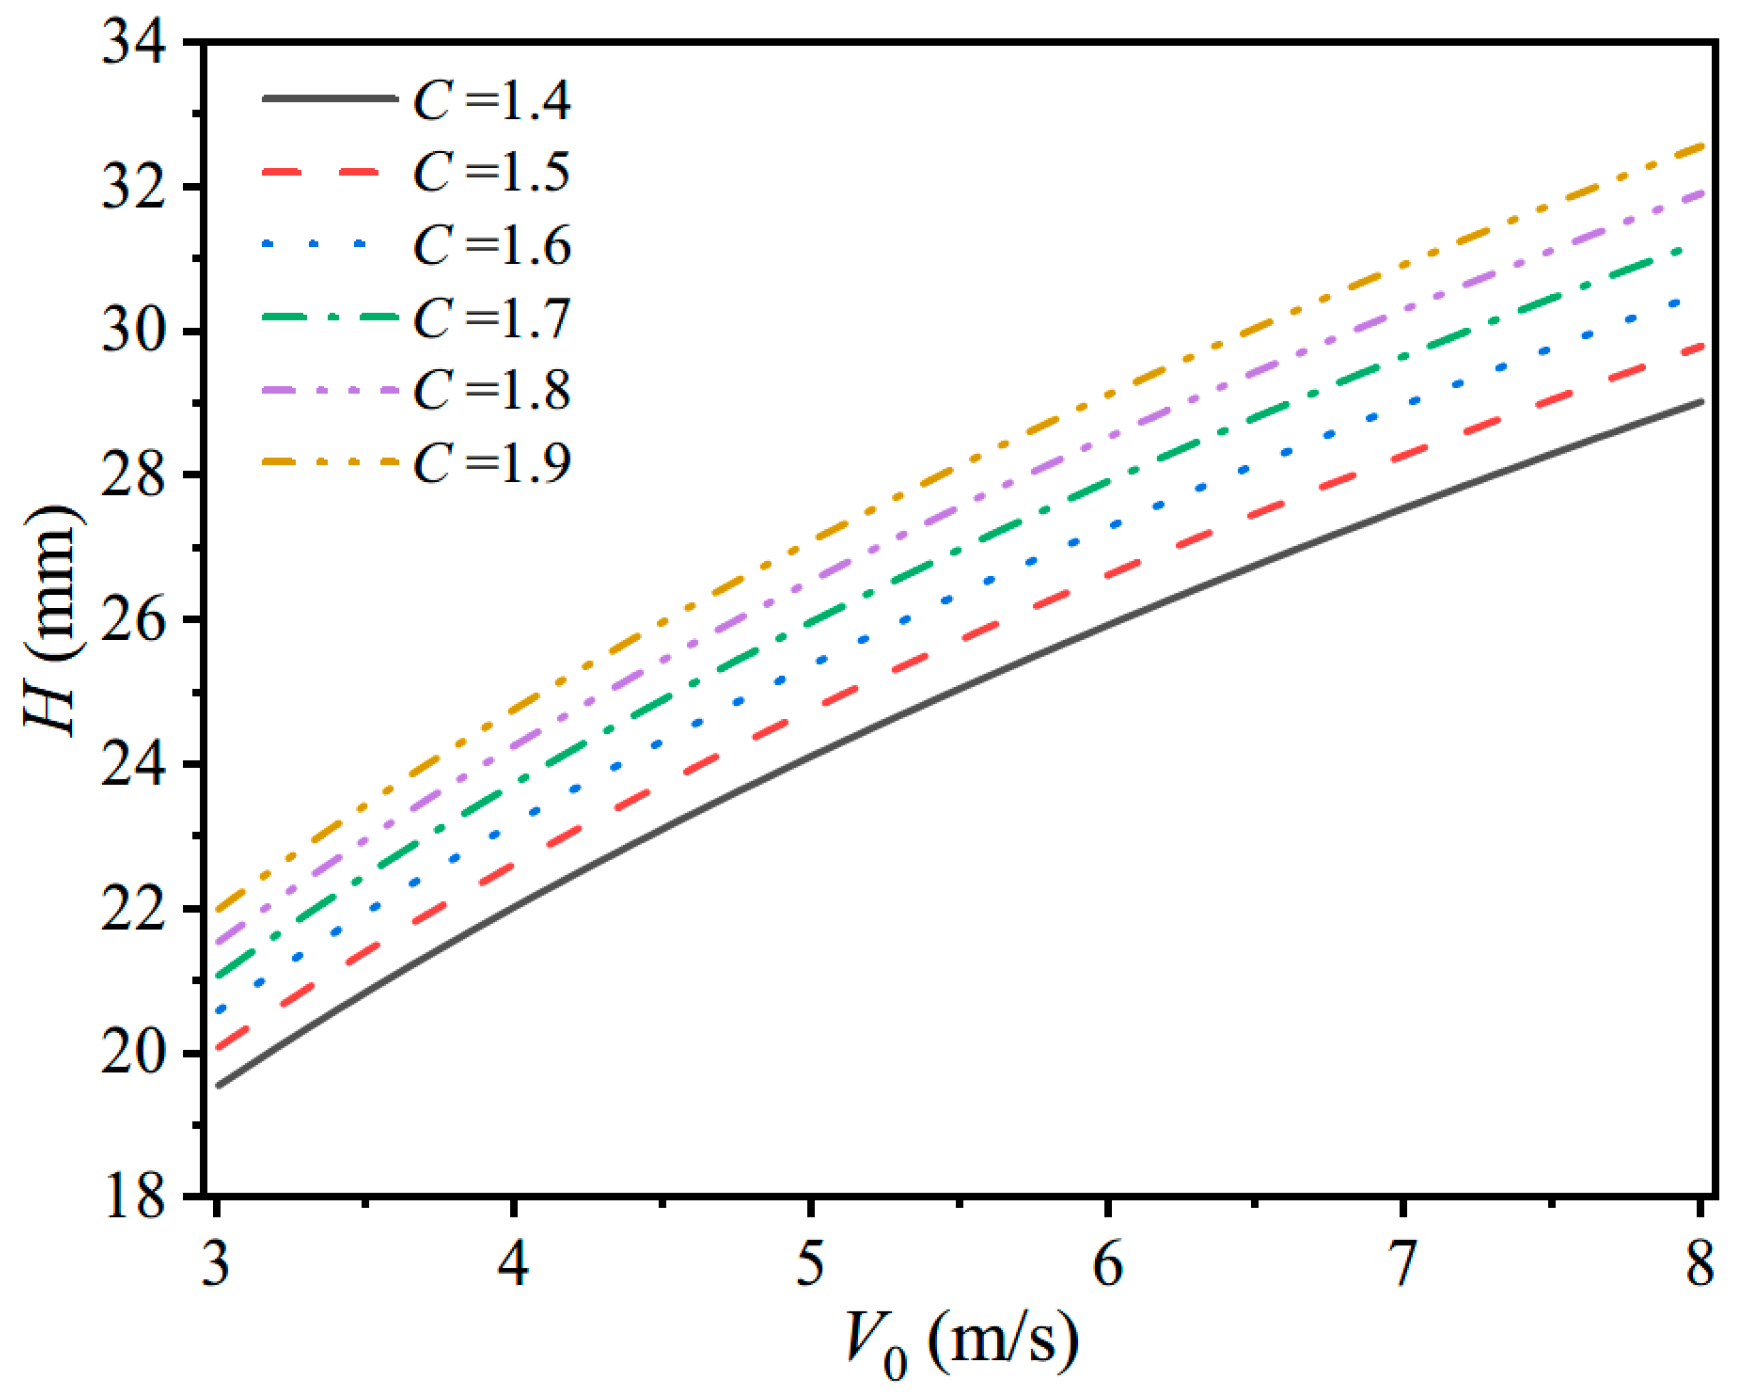
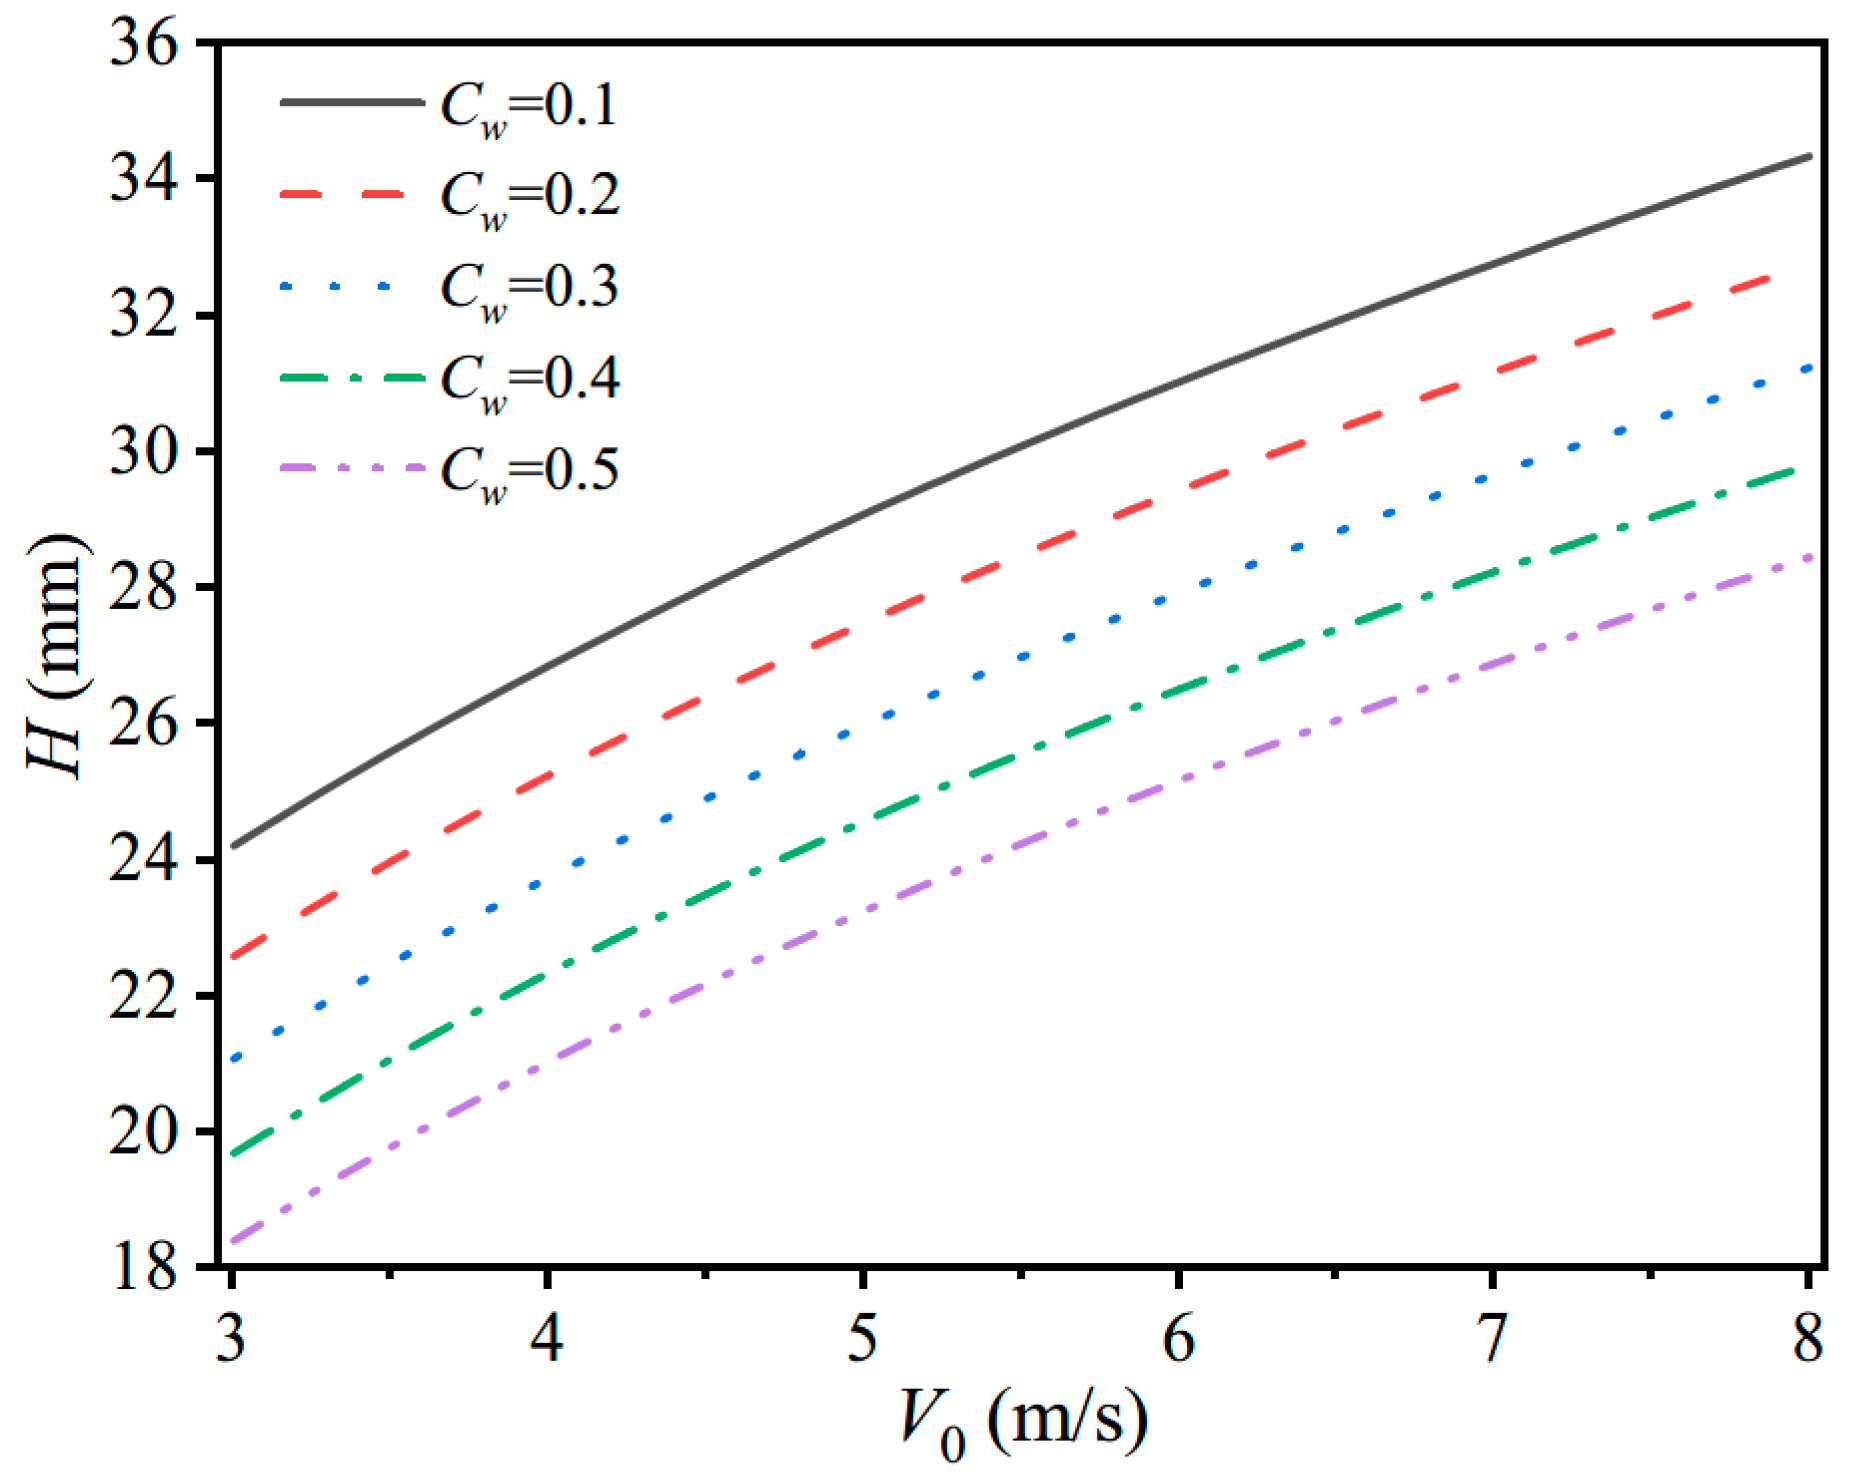
4.2.2. Case 2. Different Allowable-Permanent Set Parameters Cw
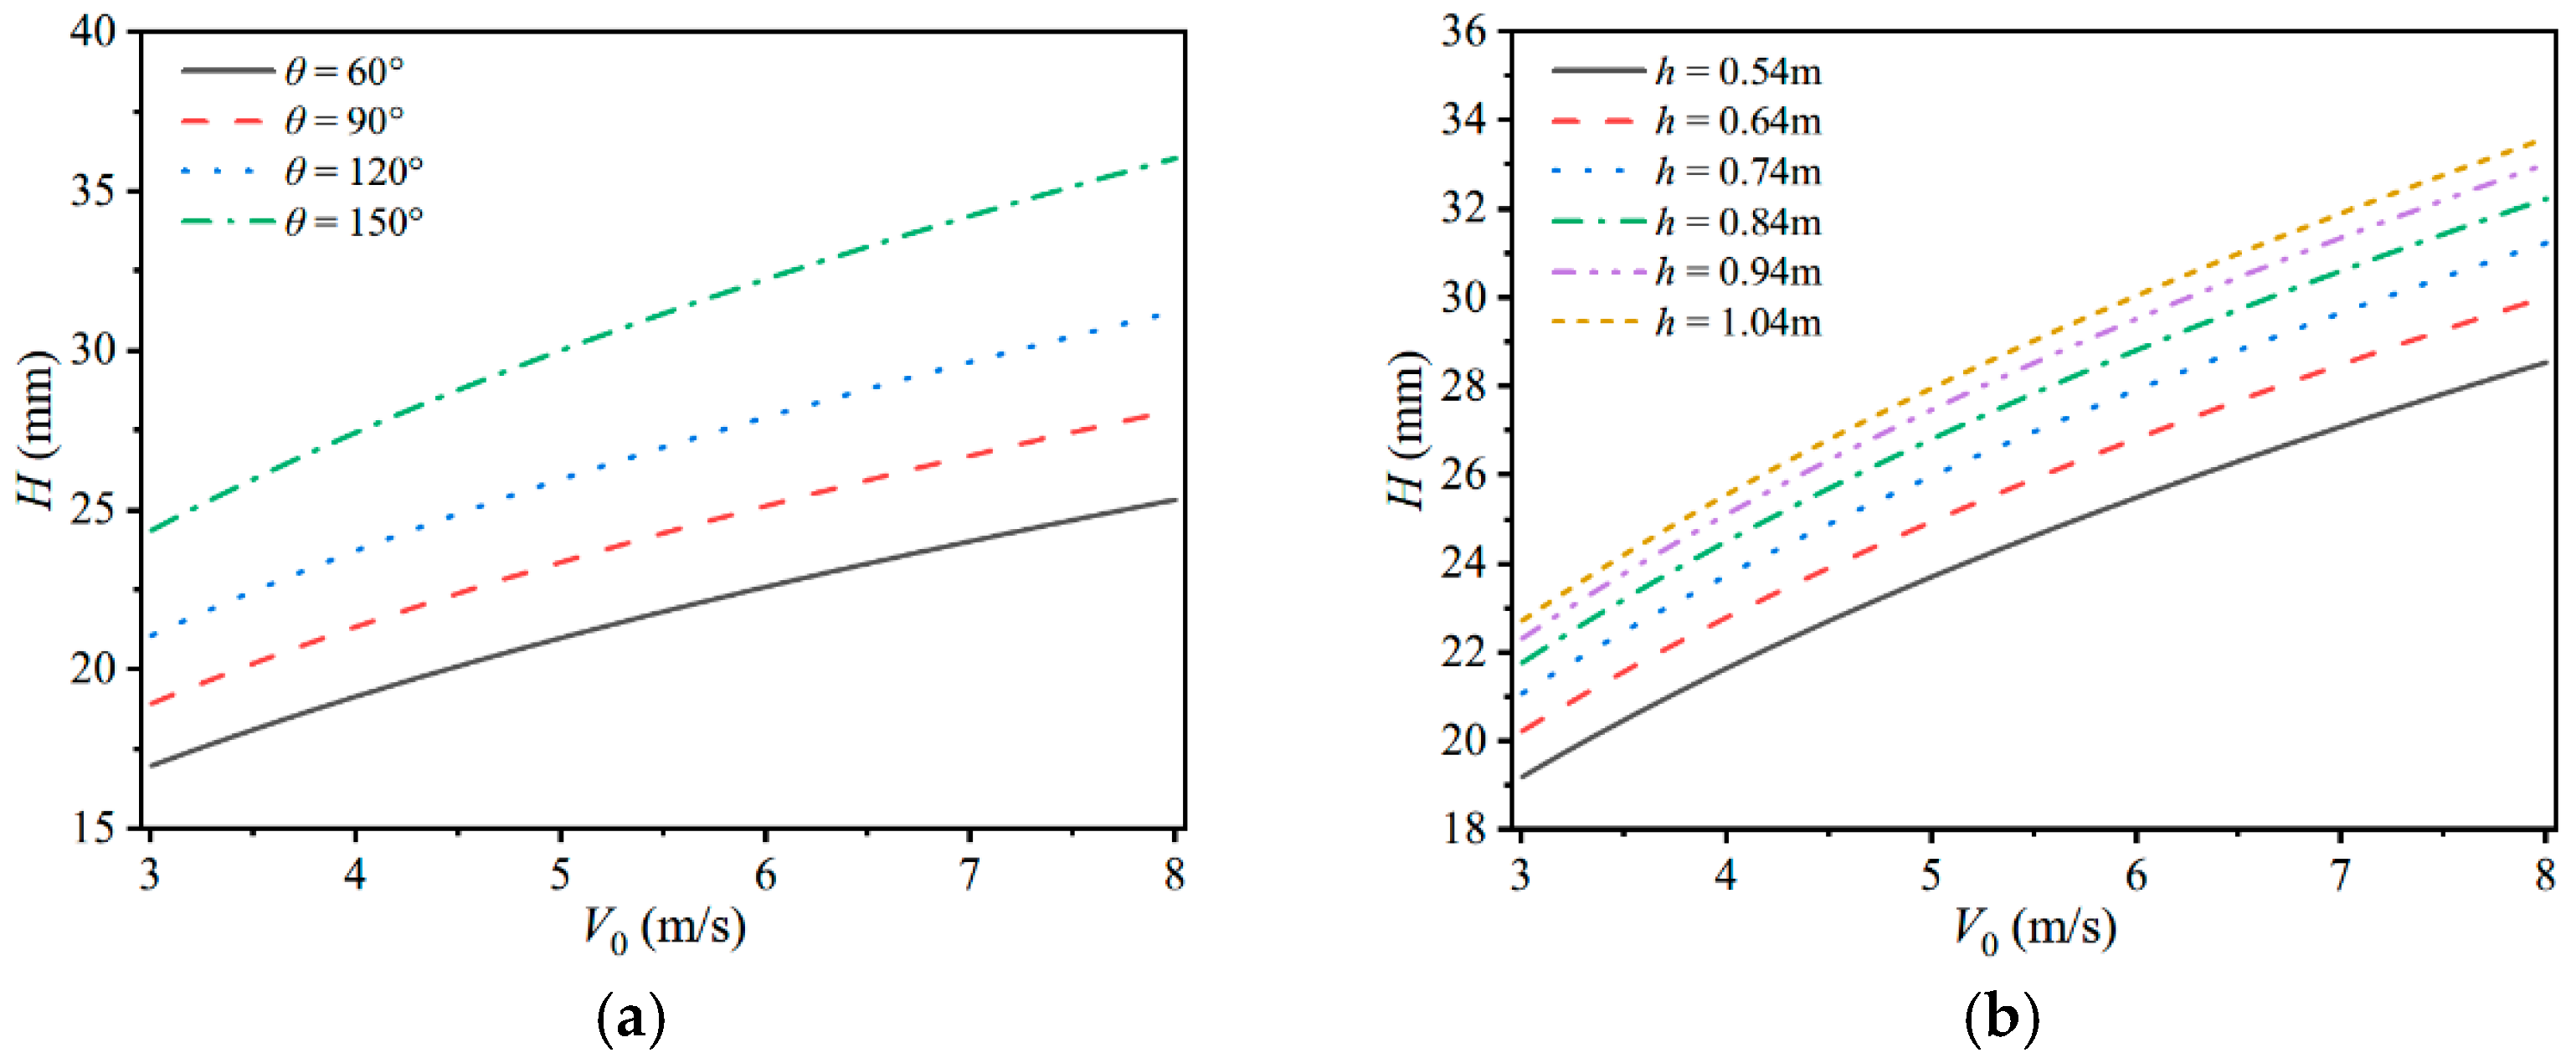
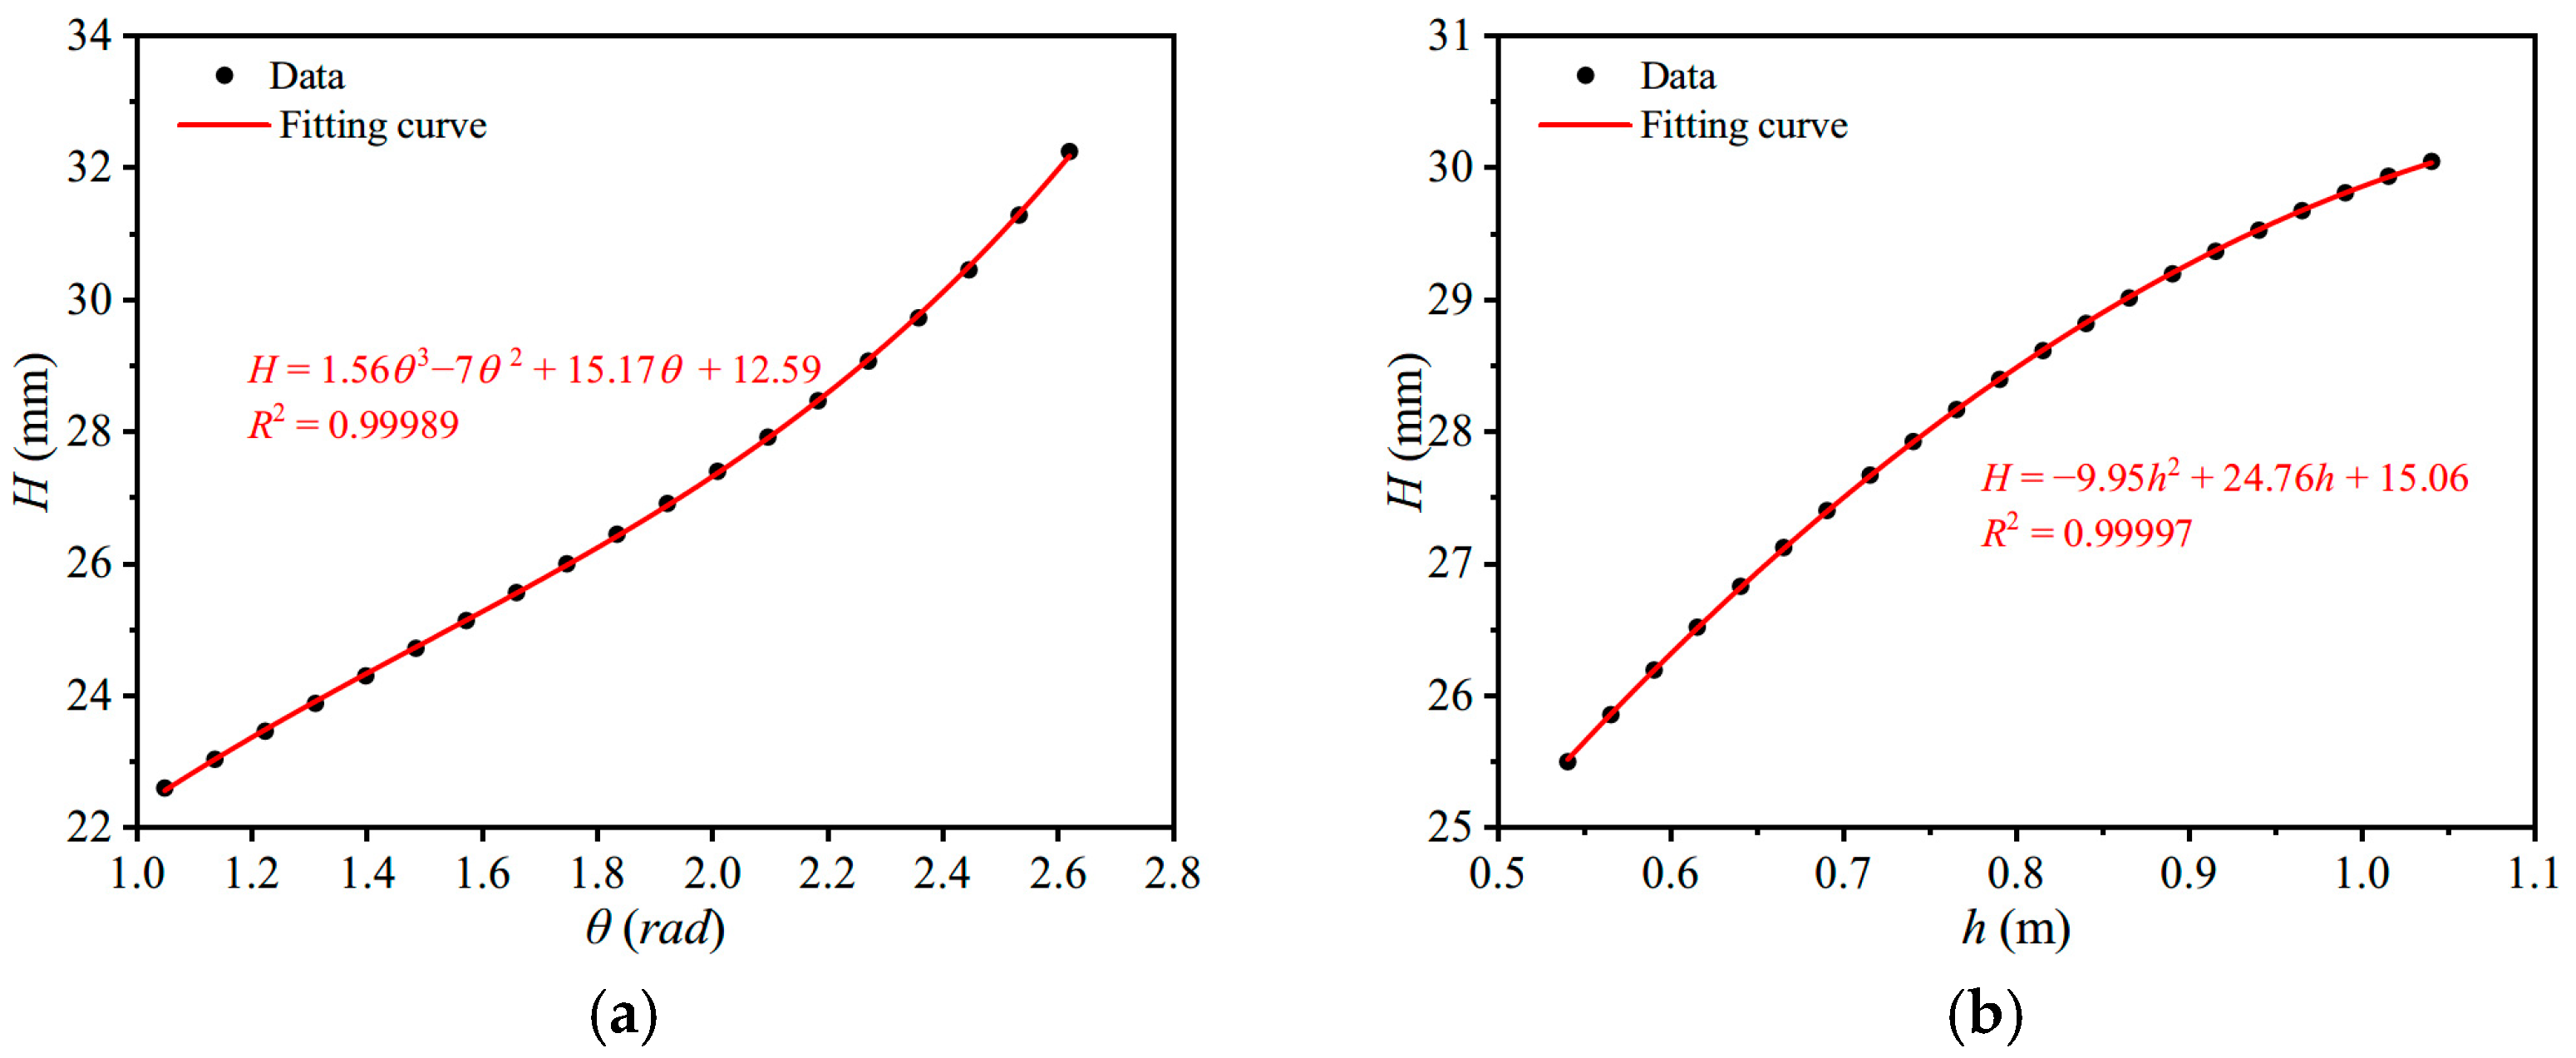
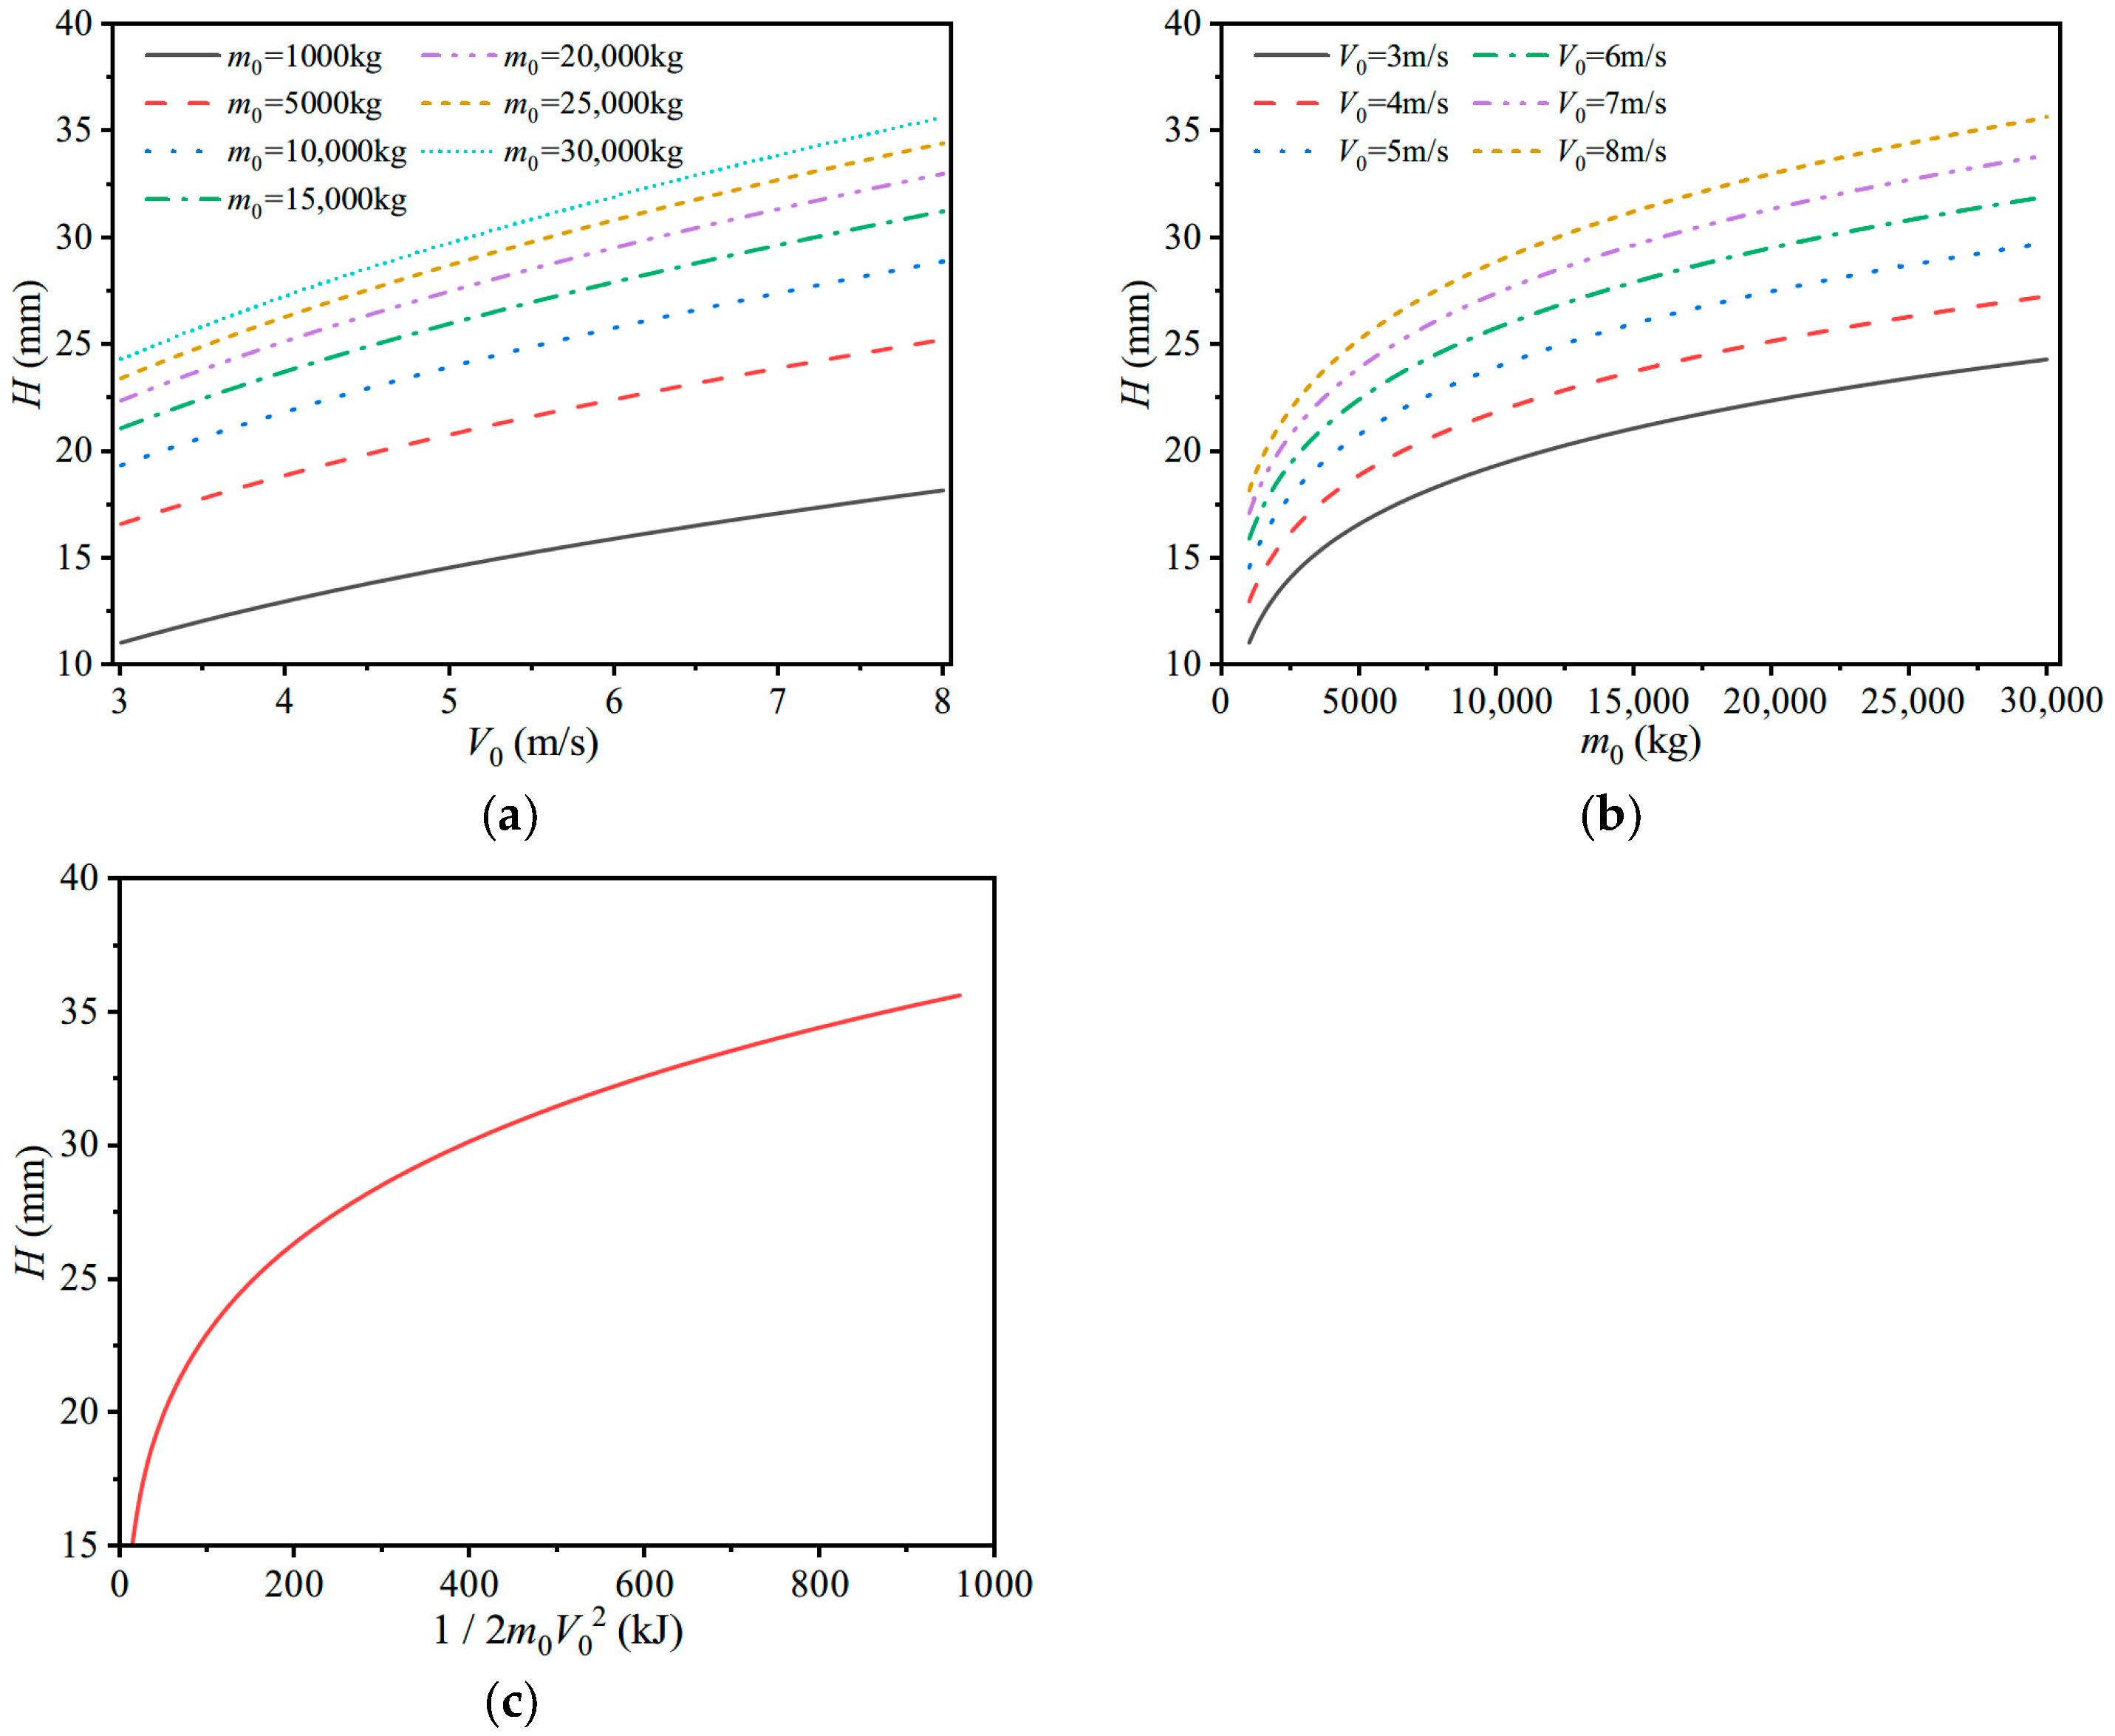
4.2.3. Case 3. Influences of Ice Shapes (θ, h) and Impact Energy
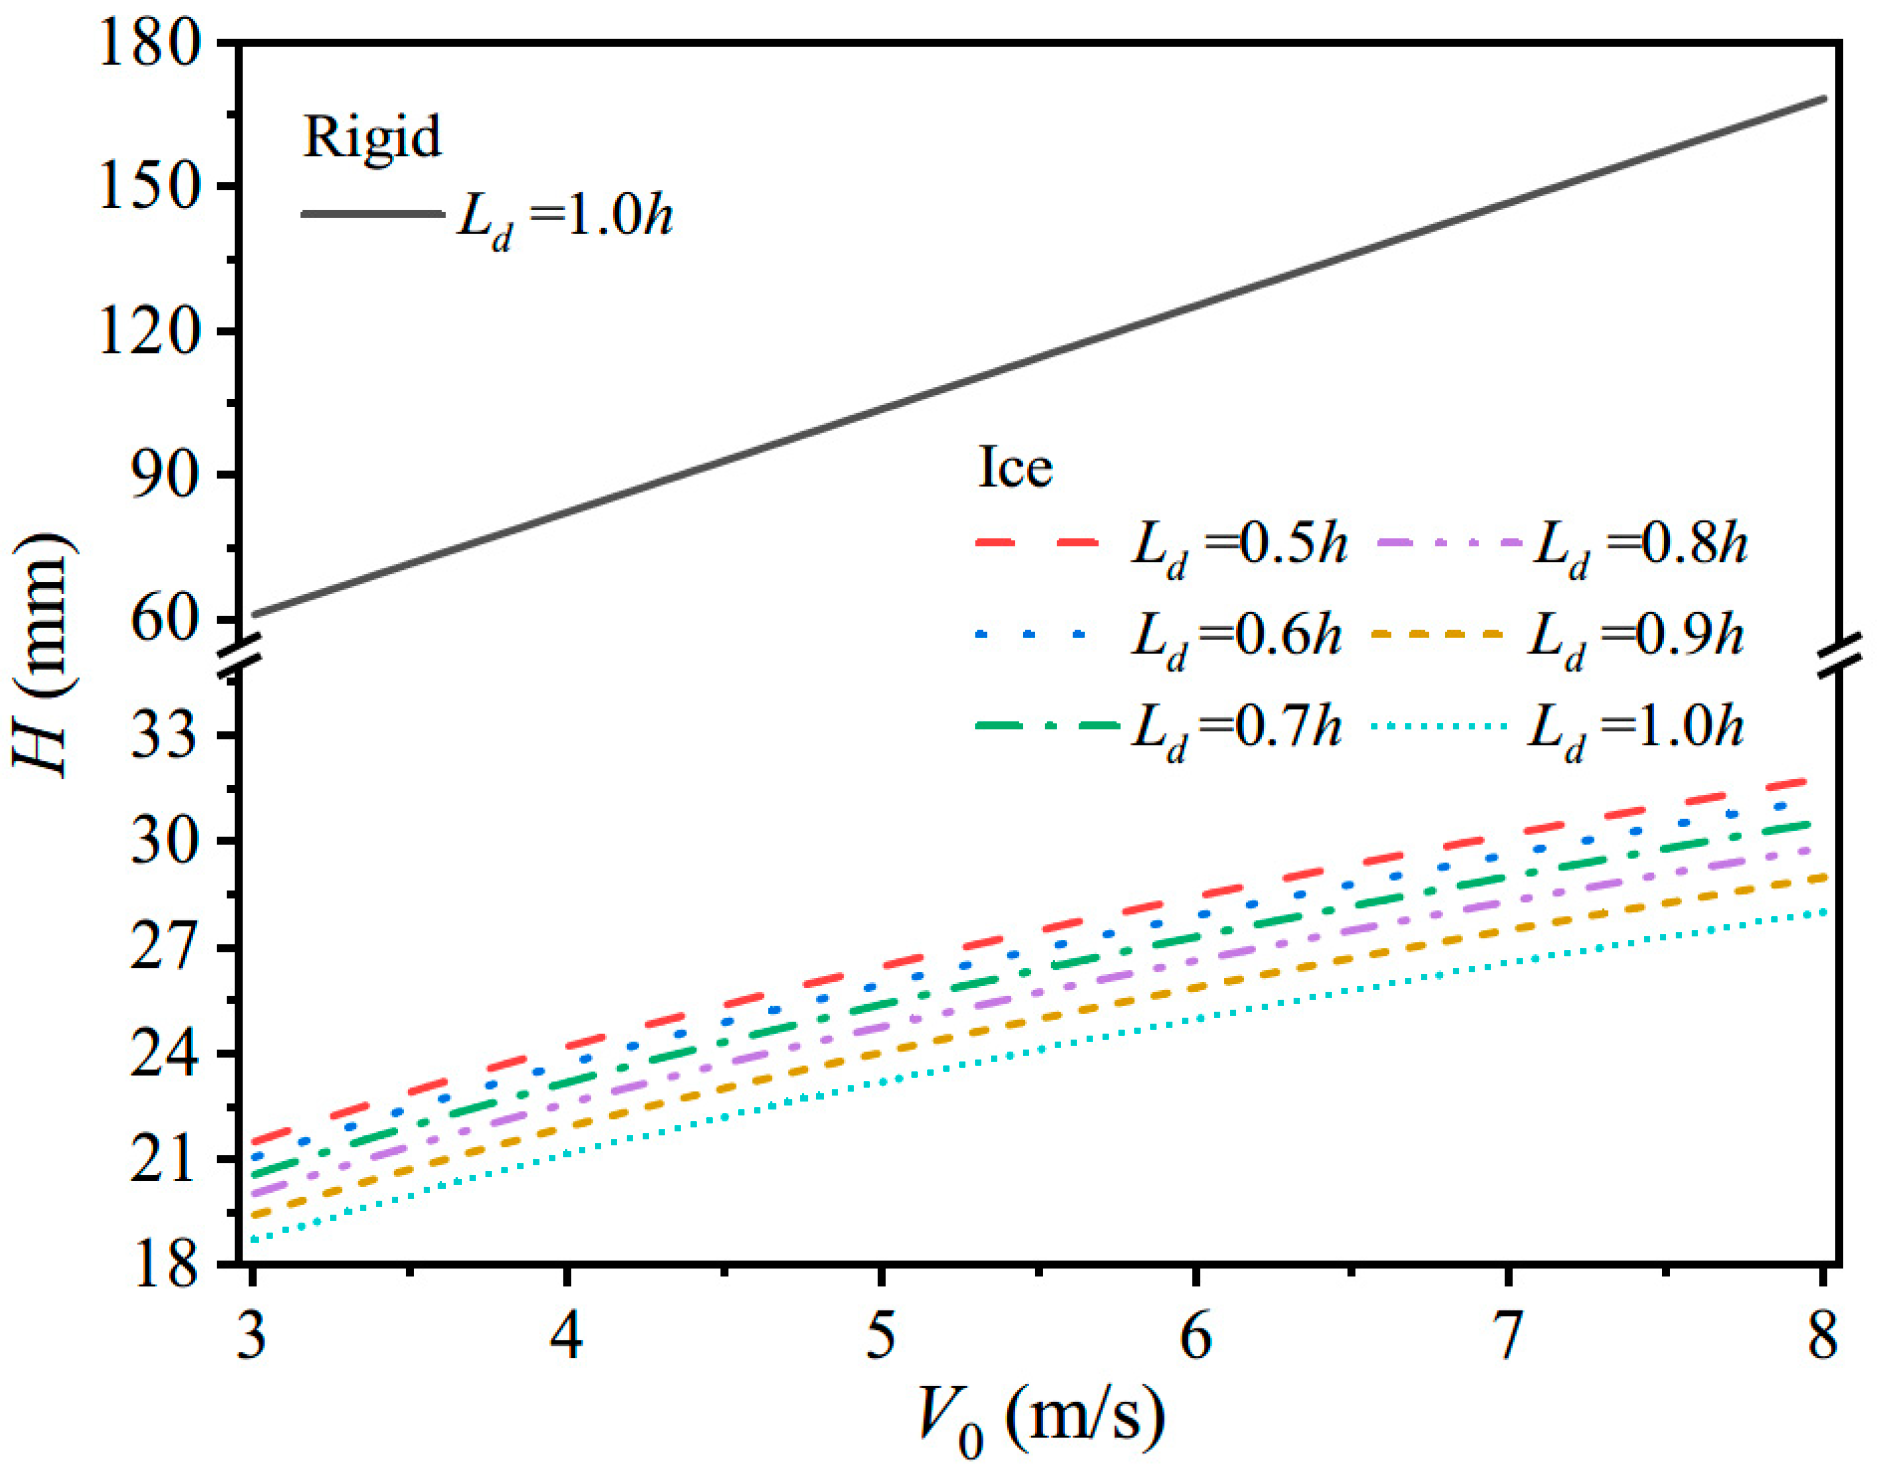
4.2.4. Case 4. Comparison of Plating-Thickness Designs for Ice Impact and Rigid-Mass Impact
5. Conclusions
Author Contributions
Funding
Institutional Review Board Statement
Informed Consent Statement
Data Availability Statement
Acknowledgments
Conflicts of Interest
Nomenclature
| An, A | Contact area and integral of the ship-plate-deformation area, respectively |
| a1, a2, a3, b1, b2 | Constants related to plate size, ice height, and ice damage parameters |
| B | Width of the ship plate |
| b | Length of short side of the panel |
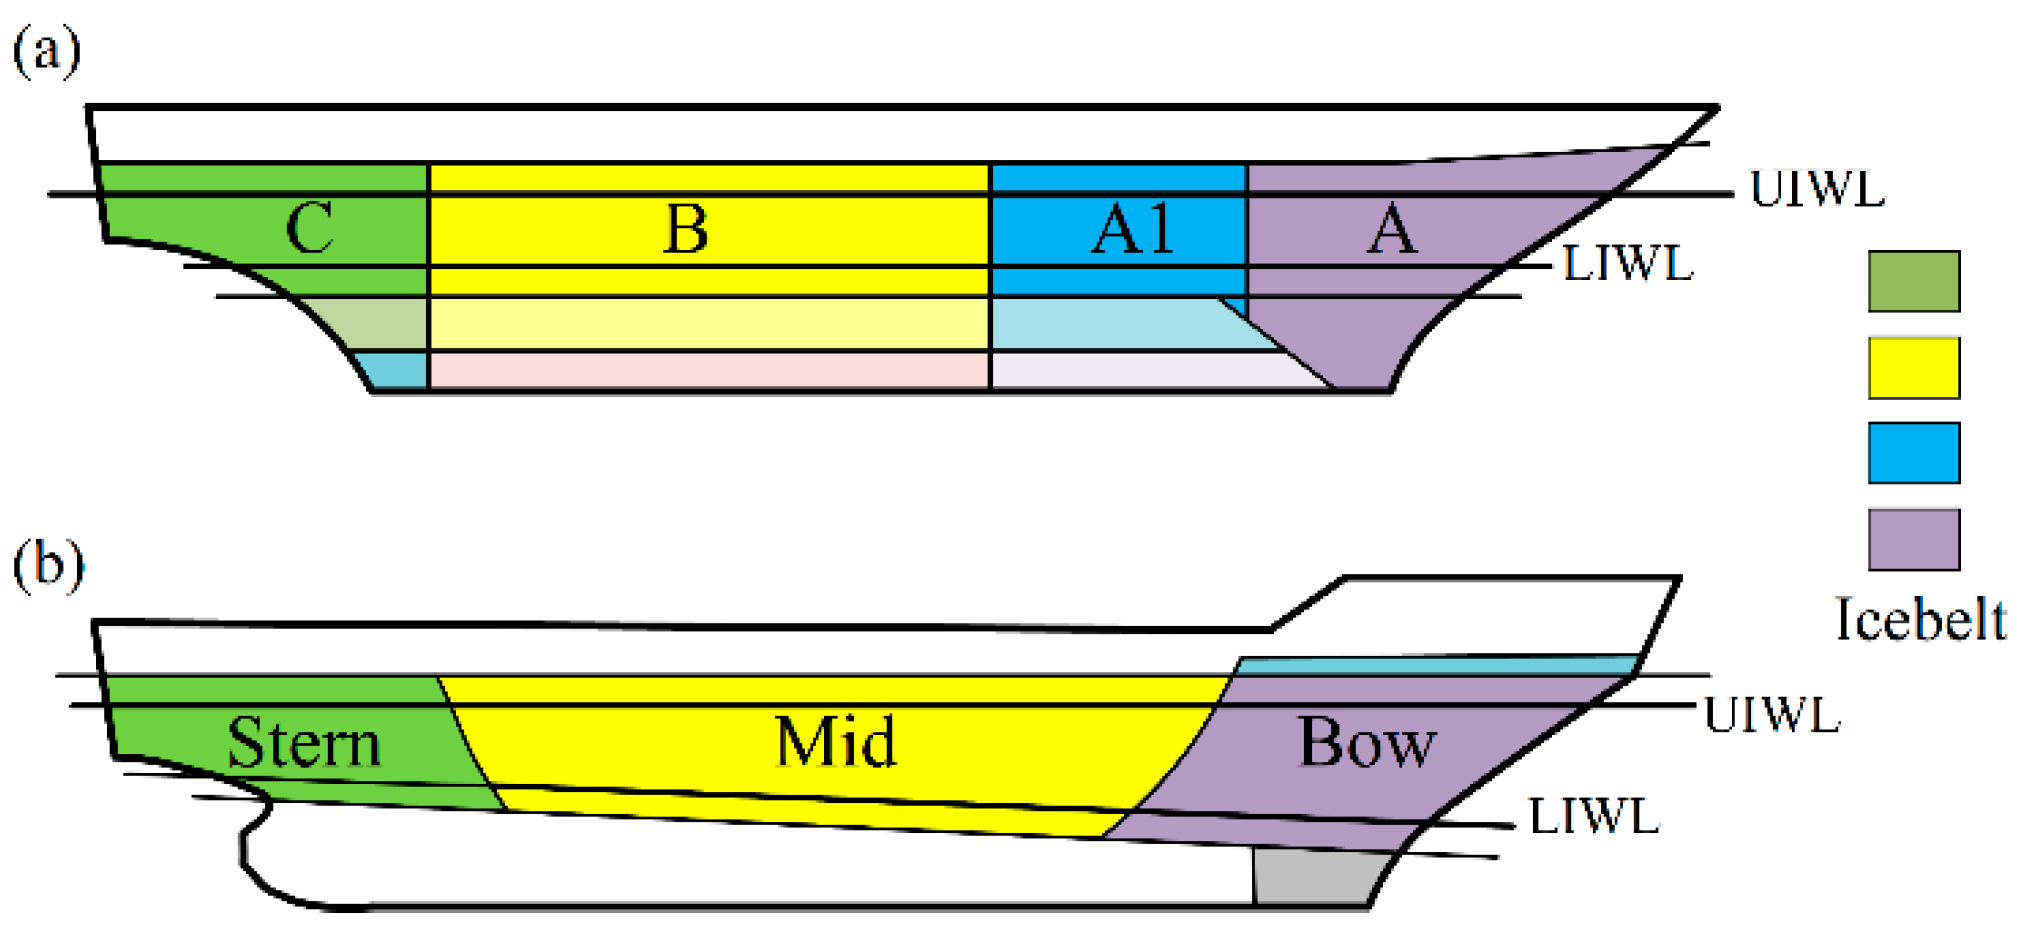
| C | Parameter related to the ice strength and the ice belt region |
| Cw | Allowable-permanent set parameter |
| E | Young’s modulus of the plate material |
| EARF | Energy-absorption reduction factor |
| E0 | Initial total impact energy |
| EI | Dissipated energy of the ice damage |
| Ep | Plastic-strain energy or absorbed energy of the ship plate |
| Epi, Eps | Plastic-strain energy of the ship plate under ice impact and rigid-mass impact, respectively |
| Er | Rebound-kinetic energy in the rebound process |
| ex | Constant |
| FA | Coefficient related to the ice belt |
| Fm | Maximum impact force |
| H | Plating thickness |
| h | Ice thickness |
| L | Length of the ship plate |
| Ld | Length of middle plastic hinge line |
| l | Length of long side of the panel |
| lm | Length of plastic hinge line |
| M0, N0 | Ultimate plastic bending moment and ultimate plastic membrane force per unit length, respectively |
| Mp, Np | Bending moment and membrane force of the plastic hinge line per unit length, respectively |
| m0, mr | Initial ice mass and residual mass after ice impact, respectively |
| P | Average pressure of ice in the process of impact extrusion |
| P0 | Pressure with a contact area of 1 m2 |
| PDRF | Plastic deformation reduction factor |
| s | The number of plastic hinge lines |
| V0 | Initial impact velocity of the ice floe and structure |
| V0′ | Initial net impact velocity |
| V0i′, V0s′ | Initial net impact velocities under ice impact and rigid-mass impact, respectively |
| Vi | Loss velocity parameter caused by ice damage |
| Vr | Rebound velocity in the rebound process |
| w | Plastic deformation of the plate |
| wc | Plastic deformation at the center of the plate |
| wm | Maximum plastic deformation |
| wpi,wps | Plastic deformation of ice impact and rigid-mass impact, respectively |
| ws | Allowable-permanent set |
| α | Coefficient of restitution |
| αi, αs | Coefficients of restitution of ice impact and rigid-mass impact, respectively |
| β | Parameter related to linear density |
| δ, δm | Ice-crushing length and final ice-crushing length, respectively |
| φ1, φ2 | Dimensionless coefficients related to the dimensions of the ship plate and the length of the middle hinge line |
| η2, γ | Intermediate values |
| μ | Unit area density of the plate |
| θ | Front-end angle of the wedge-shaped ice |
| Relative angular velocity between adjacent rigid plates | |
| ρ | Density of the plate |
| σice | Nominal ice strength |
| σs | Yield strength of the plate material |
| ω | Coefficient of ice damage along the height direction |
| ξ | Coefficient related to P0, m0, h, θ and ex |
| ζ | Value of square yield surface |
Appendix A
Appenidx A.1. Case1. Infuences of the Ice Strengths (P–A Curves)

| V0 (m/s) | 3.0 | 3.5 | 4.0 | 4.5 | 5.0 | 5.5 | 6.0 | 6.5 | 7.0 | 7.5 | 8.0 |
|---|---|---|---|---|---|---|---|---|---|---|---|
| 16.5 | 17.6 | 18.5 | 19.3 | 20.1 | 20.8 | 21.4 | 22.1 | 22.7 | 23.2 | 23.8 | |
| 21.1 | 22.5 | 23.8 | 24.9 | 26.0 | 27.0 | 27.9 | 28.8 | 29.7 | 30.5 | 31.2 | |
| 21.0 | 22.6 | 24.1 | 25.5 | 26.8 | 28.0 | 29.1 | 30.2 | 31.2 | 32.2 | 33.1 | |
| 28.6 | 30.4 | 31.9 | 33.4 | 34.7 | 35.9 | 37.0 | 38.1 | 39.1 | 40.1 | 41.0 | |
| 37.0 | 39.6 | 41.9 | 44.0 | 45.9 | 47.7 | 49.4 | 50.9 | 52.4 | 53.8 | 55.1 | |
| 29.0 | 30.9 | 32.7 | 34.3 | 35.7 | 37.1 | 38.4 | 39.6 | 40.7 | 41.8 | 42.9 | |
| 42.7 | 44.9 | 46.8 | 48.5 | 50.0 | 51.4 | 52.6 | 53.8 | 54.9 | 55.9 | 56.9 | |
| 29.9 | 32.1 | 34.1 | 36.0 | 37.7 | 39.4 | 40.9 | 42.3 | 43.7 | 45.0 | 46.3 |
Appenidx A.2. Case2. Influence of the Allowable-Permanent-Set Parameter Cw
| V0 (m/s) | 3.0 | 3.5 | 4.0 | 4.5 | 5.0 | 5.5 | 6.0 | 6.5 | 7.0 | 7.5 | 8.0 |
|---|---|---|---|---|---|---|---|---|---|---|---|
| Cw = 0.1 | 24.2 | 25.6 | 26.9 | 28.0 | 29.1 | 30. 1 | 31.0 | 31.9 | 32.8 | 33.6 | 34.3 |
| Cw = 0.2 | 22.6 | 24.0 | 25.3 | 26.4 | 27.5 | 28.5 | 29.4 | 30.3 | 31.2 | 32.0 | 32.8 |
| Cw = 0.3 | 21.1 | 22.5 | 23.8 | 24.9 | 26.0 | 27.0 | 27.9 | 28.8 | 29.7 | 30.5 | 31.2 |
| Cw = 0.4 | 19.7 | 21.1 | 22.4 | 23.5 | 24.6 | 25.6 | 26.5 | 27.4 | 28.2 | 29.0 | 29.8 |
| Cw = 0.5 | 18.4 | 19.8 | 21.0 | 22.2 | 23.3 | 24.2 | 25.2 | 26.1 | 26.9 | 27.7 | 28.5 |
Appenidx A.3. Case3. Influences of Ice Shapes (θ, h) and Impact Energy
| V0 (m/s) | 3.0 | 3.5 | 4.0 | 4.5 | 5.0 | 5.5 | 6.0 | 6.5 | 7.0 | 7.5 | 8.0 |
|---|---|---|---|---|---|---|---|---|---|---|---|
| θ = 60° | 17.0 | 18.1 | 19.2 | 20.1 | 21.0 | 21.8 | 22.6 | 23.3 | 24.0 | 24.7 | 25.3 |
| θ = 90° | 18.4 | 19.8 | 21.0 | 22.2 | 23.3 | 24.2 | 25.2 | 26.1 | 26.9 | 27.7 | 28.5 |
| θ = 120° | 21.1 | 22.5 | 23.8 | 24.9 | 26.0 | 27.0 | 27.9 | 28.8 | 29.7 | 30.5 | 31.2 |
| θ = 150° | 24.4 | 26.0 | 27. 5 | 28.8 | 30.0 | 31.2 | 32.3 | 33.3 | 34.3 | 35.2 | 36.1 |
| V0 (m/s) | 3.0 | 3.5 | 4.0 | 4.5 | 5.0 | 5.5 | 6.0 | 6.5 | 7.0 | 7.5 | 8.0 |
|---|---|---|---|---|---|---|---|---|---|---|---|
| h = 0.54 m | 19.2 | 20.5 | 21.7 | 22.7 | 23.7 | 24.6 | 25.5 | 26.3 | 27.1 | 27.8 | 28.6 |
| h = 0.64 m | 20.2 | 21.6 | 22.8 | 23.9 | 25.0 | 25.9 | 26.8 | 27.7 | 28.5 | 29.3 | 30.0 |
| h = 0.74 m | 21.1 | 22.5 | 23.8 | 24.9 | 26.0 | 27.0 | 27.9 | 28.8 | 29.7 | 30.5 | 31.2 |
| h = 0.84 m | 21.8 | 23.2 | 24.5 | 25.7 | 26.8 | 27.9 | 28.8 | 29.7 | 30.6 | 31.4 | 32.2 |
| h = 0.94 m | 22.3 | 23.8 | 25.1 | 26.4 | 27.5 | 28.5 | 29.5 | 30.5 | 31.4 | 32.2 | 33.0 |
| h = 1.04 m | 22.7 | 24.2 | 25.6 | 26.8 | 28.0 | 29.0 | 30.1 | 31.0 | 31.9 | 32.8 | 33.6 |
| V0 (m/s) | 3.0 | 3.5 | 4.0 | 4.5 | 5.0 | 5.5 | 6.0 | 6.5 | 7.0 | 7.5 | 8.0 |
|---|---|---|---|---|---|---|---|---|---|---|---|
| m0 = 1000 kg | 11.1 | 12.1 | 13.0 | 13.8 | 14.6 | 15.3 | 15.9 | 16.5 | 17.1 | 17.7 | 18.2 |
| m0 = 5000 kg | 16.6 | 17.8 | 18.9 | 19.9 | 20.8 | 21.6 | 22.4 | 23.2 | 23.9 | 24.6 | 25.2 |
| m0 = 10,000 kg | 19.4 | 20.7 | 21.9 | 23.0 | 24.0 | 24.9 | 25.8 | 26.6 | 27.4 | 28.2 | 28.9 |
| m0 = 15,000 kg | 21.1 | 22.5 | 23.8 | 24.9 | 26.0 | 27.0 | 27.9 | 28.8 | 29.7 | 30.5 | 31.2 |
| m0 = 20,000 kg | 22.4 | 23.8 | 25.2 | 26.4 | 27.5 | 28.6 | 29.5 | 30.5 | 31.4 | 32.2 | 33.0 |
| m0 = 25,000 kg | 23.4 | 24.9 | 26.3 | 27.6 | 28.7 | 29.8 | 30.8 | 31.8 | 32.7 | 33.6 | 34.4 |
| m0 = 30,000 kg | 24.3 | 25.9 | 27.3 | 28.6 | 29.8 | 30.9 | 32.0 | 32.9 | 33.9 | 34.8 | 35.6 |
References
- IACS. Unified Requirement Polar Class; International Association Classification of Societies: London, UK, 2016. [Google Scholar]
- DNV. Rules for Classification of Ships. In Ships for Navigation in Ice; Det Norske Veritas: Oslo, Norway, 2013. [Google Scholar]
- RMRS. Rules for the Classification and Construction of Sea-Going Ships; Russian Maritime Register of Shipping: Saint-Petersburg, Russia, 2016. [Google Scholar]
- LR. Rules and Regulations for the Classification of Ships; Lloyd’s Register: London, UK, 2017. [Google Scholar]
- FSICR. Ice Class Regulations and the Application Thereof (Finnish-Swedish Ice Class Regulations); Finnish Transport Safety Agency: Helsinki, Finland, 2017. [Google Scholar]
- CCS. Guidelines for Polar Ship; China Classification Society: Beijing, China, 2023. [Google Scholar]
- Ritch, R.; Frederking, R.; Johnston, M.; Browne, R.; Ralph, F. Local ice pressures measured on a strain gauge panel during the CCGS Terry Fox bergy bit impact study. Cold Reg. Sci. Technol. 2008, 52, 29–49. [Google Scholar] [CrossRef]
- Gagnon, R.E.; Derradji-Aouat, A. First results of numerical simulations of bergy bit collisions with the CCGS Terry Fox icebreaker. In Proceedings of the 18th IAHR International Symposium on Ice, Sapporo, Japan, 28 August–1 September 2006. [Google Scholar]
- Gagnon, R.; Andrade, S.L.; Quinton, B.; Colbourne, B. Pressure distribution data from large double-pendulum ice impact tests. Cold Reg. Sci. Technol. 2020, 175, 103033. [Google Scholar] [CrossRef]
- Ince, S.T.; Kumar, A.; Park, D.K.; Paik, J.K. An advanced technology for structural crashworthiness analysis of a ship colliding with an ice-ridge: Numerical modelling and experiments. Int. J. Impact Eng. 2017, 110, 112–122. [Google Scholar] [CrossRef]
- Kim, H.; Daley, C.; Kim, H. Evaluation of large structural grillages subjected to ice loads in experimental and numerical analysis. Mar. Struct. 2018, 61, 467–502. [Google Scholar] [CrossRef]
- Zhu, L.; Cai, W.; Chen, M.; Tian, Y.; Bi, L. Experimental and numerical analyses of elastic-plastic responses of ship plates under ice floe impacts. Ocean Eng. 2020, 218, 108174. [Google Scholar] [CrossRef]
- Cai, W.; Zhu, L.; Qian, X. Dynamic responses of steel plates under repeated ice impacts. Int. J. Impact Eng. 2022, 162, 104129. [Google Scholar] [CrossRef]
- Jang, H.-S.; Hwang, S.-Y.; Lee, J.H. Experimental Evaluation and Validation of Pressure Distributions in Ice–Structure Collisions Using a Pendulum Apparatus. J. Mar. Sci. Eng. 2023, 11, 1761. [Google Scholar] [CrossRef]
- Kim, E.; Storheim, M.; Amdahl, J.; Løset, S.; Bock und Polach, R.U.F. Laboratory experiments on shared-energy collisions between freshwater ice blocks and a floating steel structure. Ships Offshore Struct. 2017, 12, 530–544. [Google Scholar] [CrossRef]
- Liu, Z.; Amdahl, J.; Løset, S. Plasticity based material modelling of ice and its application to ship–iceberg impacts. Cold Reg. Sci. Technol. 2011, 65, 326–334. [Google Scholar] [CrossRef]
- Shi, C.; Hu, Z.; Ringsberg, J.; Luo, Y. Validation of a temperature-gradient-dependent elastic-plastic material model of ice with finite element simulations. Cold Reg. Sci. Technol. 2017, 133, 15–25. [Google Scholar] [CrossRef]
- Yu, T.; Liu, K.; Wang, J.; Wang, Z. Establishment and verification of a constitutive model of ice material considering the effect of temperature. J. Mar. Sci. Eng. 2020, 8, 193. [Google Scholar] [CrossRef]
- Mokhtari, M.; Kim, E.; Amdahl, J. Pressure-dependent plasticity models with convex yield loci for explicit ice crushing simulations. Mar. Struct. 2022, 84, 103233. [Google Scholar] [CrossRef]
- Yu, T.; Liu, K.; Wang, G.G.; Liu, J.; Wang, Z. A tri-axial ice model for simulating ice-stiffened panel impact: Experiments and numerical modeling. Mar. Struct. 2023, 88, 103358. [Google Scholar] [CrossRef]
- Cai, W.; Zhu, L.; Yu, T.X.; Li, Y. Numerical simulations for plates under ice impact based on a concrete constitutive ice model. Int. J. Impact Eng. 2020, 143, 103594. [Google Scholar] [CrossRef]
- Yu, Z.; Lu, W.; van den Berg, M.; Amdahl, J.; Løset, S. Glacial ice impacts: Part II: Damage assessment and ice-structure interactions in accidental limit states (ALS). Mar. Struct. 2021, 75, 102889. [Google Scholar] [CrossRef]
- Chen, Z.; Zhao, W.; Chen, Z.; Feng, G.; Ren, H.; Gui, H. Dynamic Response Analysis of Submarines Based on FEM-ALE Coupling Method in Floating Ice Conditions. J. Mar. Sci. Eng. 2023, 11, 1560. [Google Scholar] [CrossRef]
- Zhou, L.; Wang, F.; Diao, F.; Ding, S.; Yu, H.; Zhou, Y. Simulation of ice-propeller collision with cohesive element method. J. Mar. Sci. Eng. 2019, 7, 349. [Google Scholar] [CrossRef]
- Zhu, L.; Faulkner, D. Damage estimate for plating of ships and platforms under repeated impacts. Mar. Struct. 1996, 9, 697–720. [Google Scholar] [CrossRef]
- Zhu, L.; Shi, S.; Jones, N. Dynamic response of stiffened plates under repeated impacts. Int. J. Impact Eng. 2018, 117, 113–122. [Google Scholar] [CrossRef]
- Guo, K.; Mu, M.; Cai, W.; Xu, B.; Zhu, L. Theoretical Analysis of Plastic Behavior of Sandwich Beam with Metal Foam under Repeated Impacts. J. Mar. Sci. Eng. 2023, 11, 1974. [Google Scholar] [CrossRef]
- Cai, W.; Zhu, L.; Gudmestad, O.T.; Guo, K. Application of rigid-plastic theory method in ship-ice collision. Ocean Eng. 2022, 253, 111237. [Google Scholar] [CrossRef]
- Jackson, R.I.; Frieze, P.A. Design of deck structures under wheel loads. Nav. Archit. 1981, 3, 119–144. [Google Scholar]
- Hughes, O.F. Design of laterally loaded plating-uniform pressure loads. J. Ship Res. 1981, 25, 77–89. [Google Scholar] [CrossRef]
- Konieczny, L.; Bogdaniuk, M. Design of transversely loaded plating based on allowable permanent set. Mar. Struct. 1999, 12, 497–519. [Google Scholar] [CrossRef]
- Daley, C.G. Derivation of plastic framing requirements in polar ships. Mar. Struct. 2002, 15, 543–559. [Google Scholar] [CrossRef]
- Daley, C.G. Application of plastic framing requirements for polar ships. Mar. Struct. 2002, 15, 533–542. [Google Scholar] [CrossRef]
- Daley, C.G.; Daley, K.H.; Dolny, J.; Quinton, B.W.T. Overload response of flatbar frames to ice loads. Ships Offshore Struct. 2017, 12, 68–81. [Google Scholar] [CrossRef]
- Hong, L.; Amdahl, J. Plastic design of laterally patch loaded plates for ships. Mar. Struct. 2007, 20, 124–142. [Google Scholar] [CrossRef]
- Zhu, L.; Shi, S.; Yu, T.X. A New Ice Load Response Model for Structural Design of Ice Classed Ships. In Proceedings of the International Ocean and Polar Engineering Conference, Kona, HI, USA, 21–26 June 2015. [Google Scholar]
- Zhu, L.; Cai, W.; Frieze, P.A.; Shi, S. Design Method for Steel Deck Plates under Quasi-static Patch Loads with Allowable Plastic Deformations. Mar. Struct. 2020, 71, 102702. [Google Scholar] [CrossRef]
- Kim, H.; Quinton, B. Evaluation of moving ice loads on an elastic plate. Mar. Struct. 2016, 50, 127–142. [Google Scholar] [CrossRef]
- Quinton, B.W.T.; Daley, C.G.; Gagnon, R.E. Response of IACS URI ship structures to real-time full-scale operational ice loads. Transactions. Soc. Nav. Archit. Mar. Eng. 2012, 120, 203–209. [Google Scholar]
- Masterson, D.M.; Frederking, R.M.W. Local contact pressures in ship/ice and structure/ice interactions. Cold Reg. Sci. Technol. 1993, 21, 169–185. [Google Scholar] [CrossRef]
- Masterson, D.M.; Frederking, R.M.W.; Wright, B.; Karna, T.; Maddock, W.P. A revised ice pressure-area curve. In Proceedings of the 19th International Conference on Port and Ocean Engineering under Arctic Conditions, Dalian, China, 27–30 June 2007; Volume 1, pp. 305–314. [Google Scholar]
- Palmer, A.C.; Dempsey, J.P.; Masterson, D.M. A revised ice pressure-area curve and a fracture mechanics explanation. Cold Reg. Sci. Technol. 2009, 56, 73–76. [Google Scholar] [CrossRef]
- Timco, G.W.; Sudom, D. Revisiting the Sanderson pressure–area curve: Defining parameters that influence ice pressure. Cold Reg. Sci. Technol. 2013, 95, 53–66. [Google Scholar] [CrossRef]
- Zhu, L.; Qiu, X.; Chen, M.; Yu, T.X. Simplified Ship-ice Collision Numerical Simulations. In Proceedings of the 26th International Ocean and Polar Engineering Conference, Rhodes, Greece, 26 June–1 July 2016. [Google Scholar]
- API RP 2N; Planning, Designing and Constructing Structures and Pipelines for Arctic Conditions. 2nd ed. American Petroleum Institute: Washington, DC, USA, 1995.
- ISO/CD 19906; Petroleum and Natural Gas Industries-Arctic Offshore Structures, ISOTC67/SC7/WG 8, Final Draft International Standard. International Standardizations Organization: Geneva, Switzerland, 2010.


| Ice Descriptions | Polar Class | |||||
|---|---|---|---|---|---|---|
| IACS [1] | DNV [2] | RMRS [3] | LR [4] | FSICR [5] | CCS [6] | |
| Summer/autumn operation in medium first-year ice that may include old ice inclusions | PC5,6 | ICE-10 | Arc5 | 1AS | IA Super | B1* |
| Summer/autumn operation in thin first-year ice that may include old ice inclusions | PC7 | ICE-05 | Arc4 | 1A | IA | B1 |
| Test | Material | Plate Thickness H [mm] | Density [kg/m3] | Young’s Modulus E [GPa] | Poisson’s Ratio | Yield Strength [MPa] |
|---|---|---|---|---|---|---|
| Rigid-mass impact | steel | 6 | 7800 | 206 | 0.3 | 253 |
| Ice impact | Steel | 2 | 7850 | 206 | 0.3 | 253 |
| Test Number | Plate Specimen L × B × H [mm] | Impact Mass m0 [kg] | Initial Impact Velocity V0 [m/s] | Rebound Velocity Vr [m/s] | Vr/V0 | wcExp. [mm] | wcAna. [mm] | Relative Error (wcAna. − wcExp.)/wcExp. × 100% |
|---|---|---|---|---|---|---|---|---|
| 1 | 400 × 400 × 2 | 93 | 1.73 | 0.89 | 0.51 | 7.00 | 8.14 | 16.26% |
| 2 | 800 × 400 × 4 | 90 | 3.19 | 1.56 | 0.49 | 7.06 | 7.83 | 10.90% |
| Test Number | Plate Specimen L × B × H [mm] | Impact Mass m0 [kg] | Initial Impact Velocity V0 [m/s] | Vr/V0 | wcExp. [mm] | wcAna. [mm] | Relative Error (wcAna. − wcExp.)/wcExp. × 100% |
|---|---|---|---|---|---|---|---|
| 1 | 800 × 400 × 2 | 99.21 | 3.42 | 0.20 | 11.53 | 12.70 | 10.14% |
| 2 | 800 × 400 × 2 | 98.99 | 3.69 | 0.15 | 12.20 | 13.35 | 9.42% |
| Material | Density [kg/m3] | Young’s Modulus E [GPa] | Poisson’s Ratio | Yield Strength [MPa] |
|---|---|---|---|---|
| Q390D steel | 7800 | 206 | 0.3 | 390 |
| Source | Equation Number | P–A Relationship | Descriptions |
|---|---|---|---|
| Timco and Sudom (2013) [43] | Eq. a | The data are derived from the measurement data of the Norströmsgrund lighthouse colliding with the ice floe. The lighthouse is a cylindrical concrete structure with a diameter of 7.58 m at the water line. The ice average thickness is 0.42 m. | |
| DNV rules [2] | Eq. b | It is suitable for the mid-side structure of a ship with ice class of ICE-05 and ICE-10 when the value range of C is 1.4~1.95. | |
| Timco and Sudom (2013) [43] | Eq. c | The majority of the data points were obtained from the Molikpaq caisson structure from interactions with first-year sea ice. Molikpaq consists of a continuous steel annulus on which sits a self-contained deck structure. The core of the annulus was filled with sand. | |
| Ritch et al. (2008) [7] | Eq. d | The data were derived from the collision of the Terry Fox icebreaker with the B14 and B17 icebergs. The B 14 mass is 1900 t and the B 17 mass is 8500 t. | |
| API RP 2N [45] | Eq. e | The data were derived from a combination of medium scale impact tests, dedicated ship ramming tests and measurements taken from ice load panels on the Molikpaq. Most of the ice is multi-year ice. | |
| Masterson and Frederking (2007) [41] | Eq. f | First-year ice and more temperature areas. | |
| ISO 19906 [46] | Eq. g | On the basis of Eq. e, the data from ship-ramming tests were deleted, and the Molikpaq data 1985 to 1986 were added. Multi-year ice was used. | |
| Masterson and Frederking (2007) [41] | Eq. h | The original ice pressures were used for the design of the Molikpaq platform. Multi-year ice was used. |
Disclaimer/Publisher’s Note: The statements, opinions and data contained in all publications are solely those of the individual author(s) and contributor(s) and not of MDPI and/or the editor(s). MDPI and/or the editor(s) disclaim responsibility for any injury to people or property resulting from any ideas, methods, instructions or products referred to in the content. |
© 2024 by the authors. Licensee MDPI, Basel, Switzerland. This article is an open access article distributed under the terms and conditions of the Creative Commons Attribution (CC BY) license (https://creativecommons.org/licenses/by/4.0/).
Share and Cite
Mu, M.; Guo, K.; Cai, W.; Zhu, L.; Pi, Z.; Zhou, S. A New Plastic Design Approach for the Vertical-Side-Plating Thickness of Ice-Strengthened Ships Suffering from Ice Floe Impacts. J. Mar. Sci. Eng. 2024, 12, 233. https://doi.org/10.3390/jmse12020233
Mu M, Guo K, Cai W, Zhu L, Pi Z, Zhou S. A New Plastic Design Approach for the Vertical-Side-Plating Thickness of Ice-Strengthened Ships Suffering from Ice Floe Impacts. Journal of Marine Science and Engineering. 2024; 12(2):233. https://doi.org/10.3390/jmse12020233
Chicago/Turabian StyleMu, Mengying, Kailing Guo, Wei Cai, Ling Zhu, Zhenyu Pi, and Shuo Zhou. 2024. "A New Plastic Design Approach for the Vertical-Side-Plating Thickness of Ice-Strengthened Ships Suffering from Ice Floe Impacts" Journal of Marine Science and Engineering 12, no. 2: 233. https://doi.org/10.3390/jmse12020233