Article

Impact of Oxygen Content on Flame Dynamics in a Non-Premixed Gas Turbine Model Combustor

1
College of Power and Energy Engineering, Harbin Engineering University, Harbin 150001, China
2
Department of Mechanical Engineering, The Hong Kong Polytechnic University, Hong Kong SAR 999077, China
*
Author to whom correspondence should be addressed.
J. Mar. Sci. Eng. 2024, 12(4), 621; https://doi.org/10.3390/jmse12040621
Submission received: 4 March 2024 / Revised: 27 March 2024 / Accepted: 2 April 2024 / Published: 4 April 2024
(This article belongs to the Topic Marine Renewable Energy, 2nd Volume)

Abstract

:
In this study, large eddy simulation (LES) was used to investigate the dynamic characteristics of diffusion flames in a swirl combustion chamber at an oxygen content of 11–23 wt% and temperature of 770 K. The proper orthogonal decomposition (POD) method was employed to obtain flame dynamic modes. The results indicate that oxygen content has a significant impact on the downstream flow and flame combustion characteristics of the swirl combustion chamber. With oxygen content increasing, the size of the recirculation zone is reduced, and the flame field fluctuations are intensified. The pressure and heat release fluctuations under different oxygen contents were analyzed using frequency spectrum analysis. Finally, the flame modes were analyzed using the POD method, and it was found that the coherent structures are asymmetric relative to the local coordinate system. At an oxygen content of 11 wt%, they exhibit larger coherent structures, while at an oxygen content of 23 wt%, they exhibit numerous turbulent structures.

1. Introduction

With the increasing performance requirements of combustion chambers and increasingly stringent emission regulations [1,2,3,4], gas turbine combustion chambers are required to operate at high temperature and high pressure [5,6,7,8,9], which usually leads to the occurrence of combustion instability [10,11,12,13,14,15,16,17]. The combustion instability phenomenon will be accompanied by pressure pulsation and exothermic pulsation in the flow field inside the combustion chamber [18,19,20,21], which leads to vibration of the combustion chamber components and affects the safe operation of the engine [22,23,24]. In order to solve the adverse effects of combustion instability on the combustion chamber, it is necessary to study the combustion instability phenomenon to prevent the combustion instability phenomenon from leading to a decrease in the combustion chamber’s stable operation time. Yilmaza et al. [25] experimentally investigated flame stability and emission characteristics during combustion of CH4 and CO2 mixtures with different oxygen contents, and the experimental results showed that the flame stability was highest when the oxygen content was 24 wt%, and decreased when the oxygen content was increased to 28 wt%. When the oxygen content increased from 21 wt% to 28 wt%, the CO emission decreased and the NOx emission decreased and then increased. As the oxygen content increases, the flame temperature increases. Habib et al. [26] conducted an experimental study on oxygen-methane diffusion flames and found that the flame is very stable at an equivalence ratio of 0.65, the flame temperature decreases as the equivalence ratio increases, and the change in the mass flow rate of the fuel does not significantly change the combustion instability. The flame was significantly affected at an oxygen content below 25 wt%. Rao et al. [27] investigated the stability of cyclonic premixed flames using the equivalence ratio experimentally, and analyzed spatial CH* chemiluminescence images through the POD method. The combustion states were classified into five in the range of equivalence ratio from 0.55 to 1.35. In the different combustion states, the POD patterns were characterized by different features. Devi et al. [28] experimentally investigated the emission performance of combusted biogas at equivalence ratios ranging from 0.75 to 0.97. It was found that CO and NOx emissions increased with increasing equivalence ratio, and the maximum values were 165 ppm and 8.2 ppm, respectively. Kutne et al. [29] investigated the combustion instability of a model combustion chamber at oxygen levels ranging from 20 wt% to 40 wt% and equivalence ratios ranging from 0.5 to 1. It was found that the combustion was unstable at oxygen levels below 22 wt%. When the oxygen content increased from 30 wt% to 40 wt%, the laminar flame velocity increased by a factor of 2.4.
In summary, most of the studies have focused on the effect of equivalence ratio or oxygen enrichment on combustion instability, and there are few studies on the law of influence of lower oxygen content on the combustion instability phenomenon. Due to the improvement of emission requirements for gas turbine combustion chambers, flue gas recirculation technology can reduce pollutant emissions from combustion [30,31,32,33], but because the flue gas recirculation technology reduces the oxygen content at the combustion chamber inlet [34,35,36], which leads to a more pronounced combustion instability phenomenon [37,38,39], a study on combustion instability at lower oxygen content is needed. Therefore, it is necessary to study the velocity, temperature, OH, pressure pulsation, and exothermic pulsation of the flow field in the combustion chamber at different oxygen contents to determine the effect of low oxygen content on combustion instability.

2. Numerical Calculations

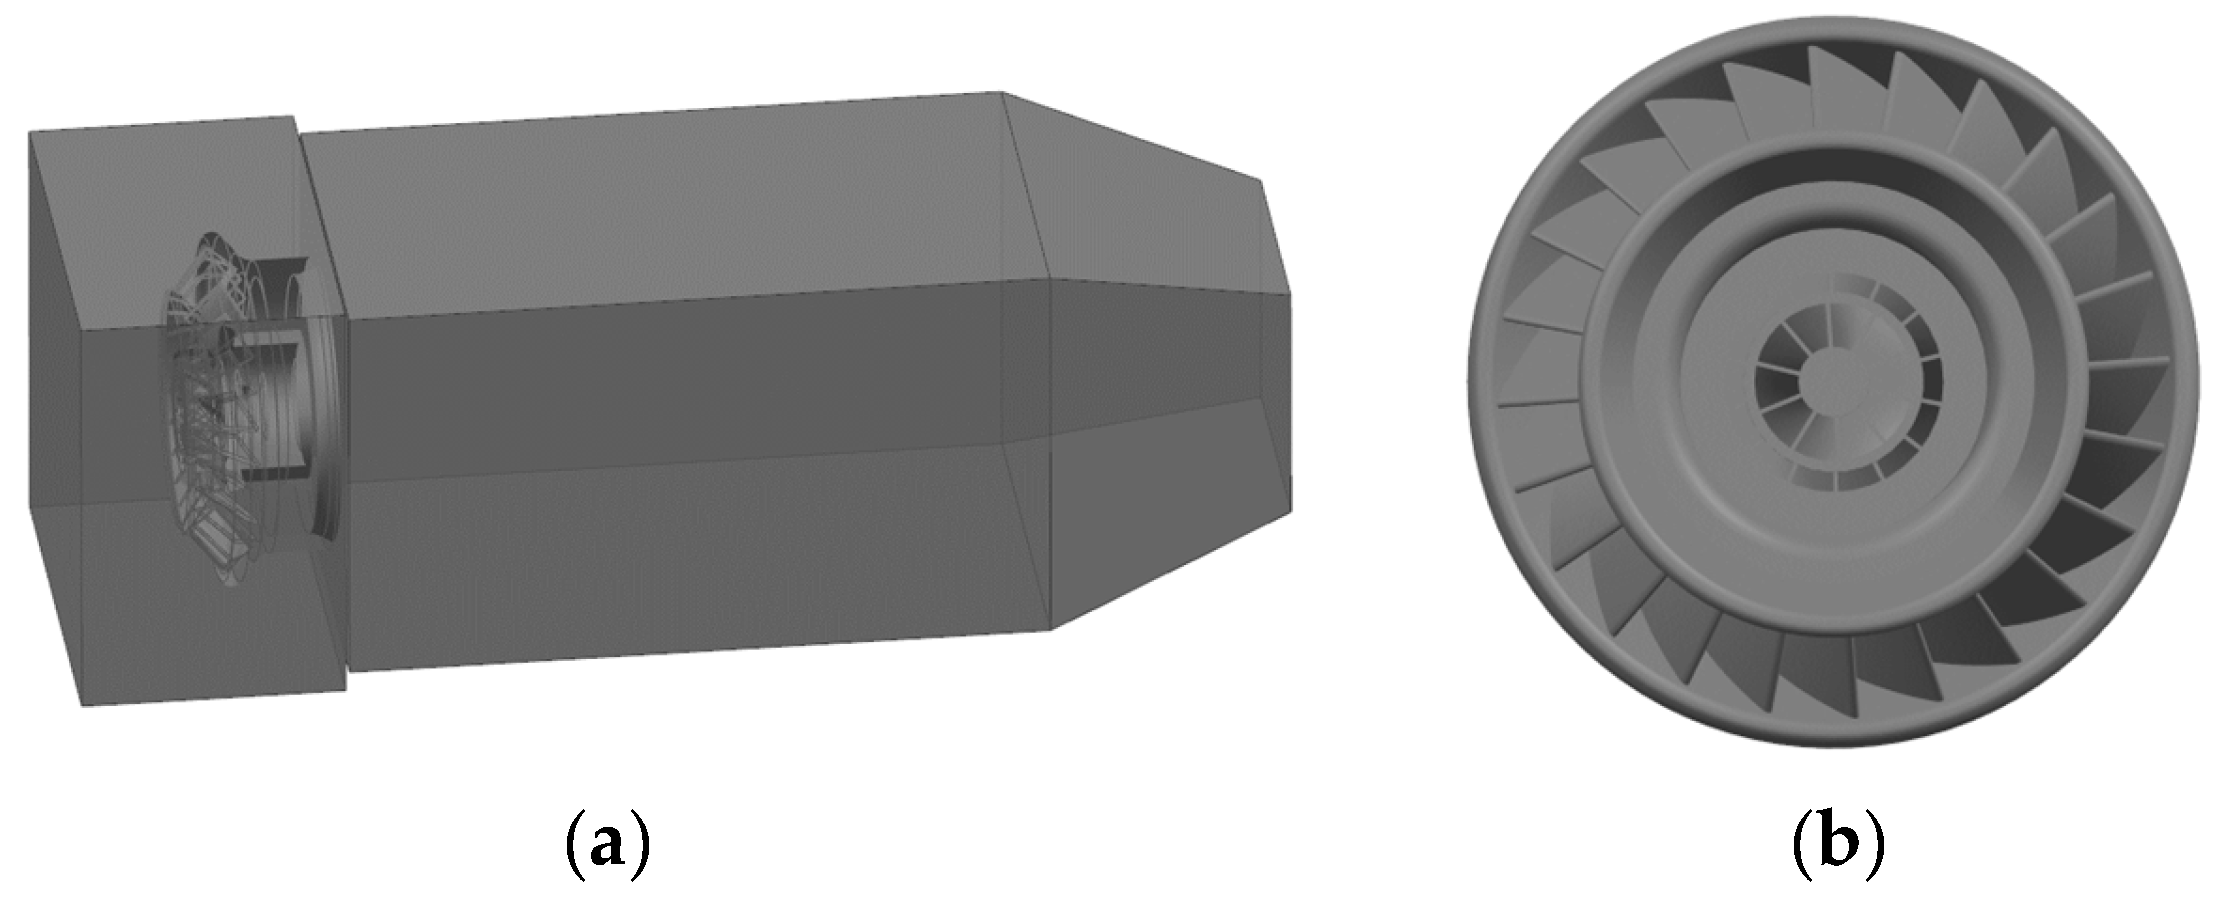
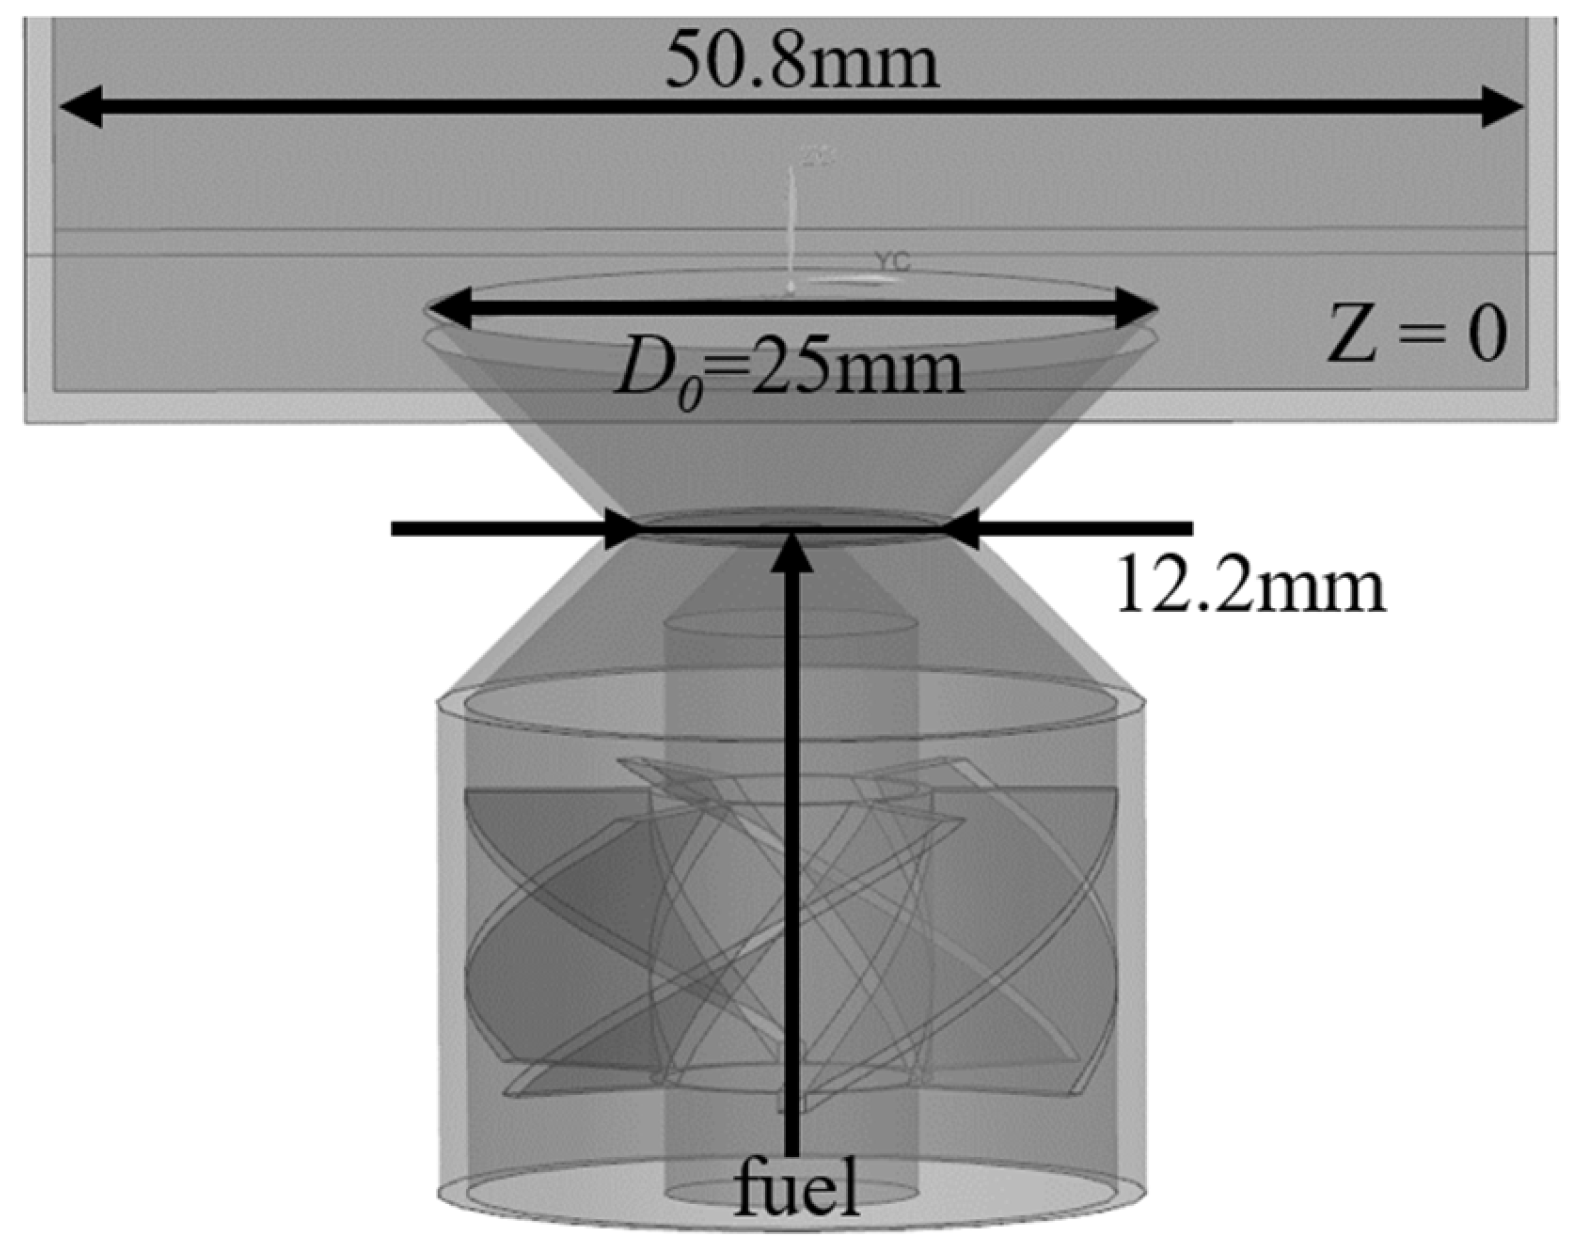
2.1. Model Structure
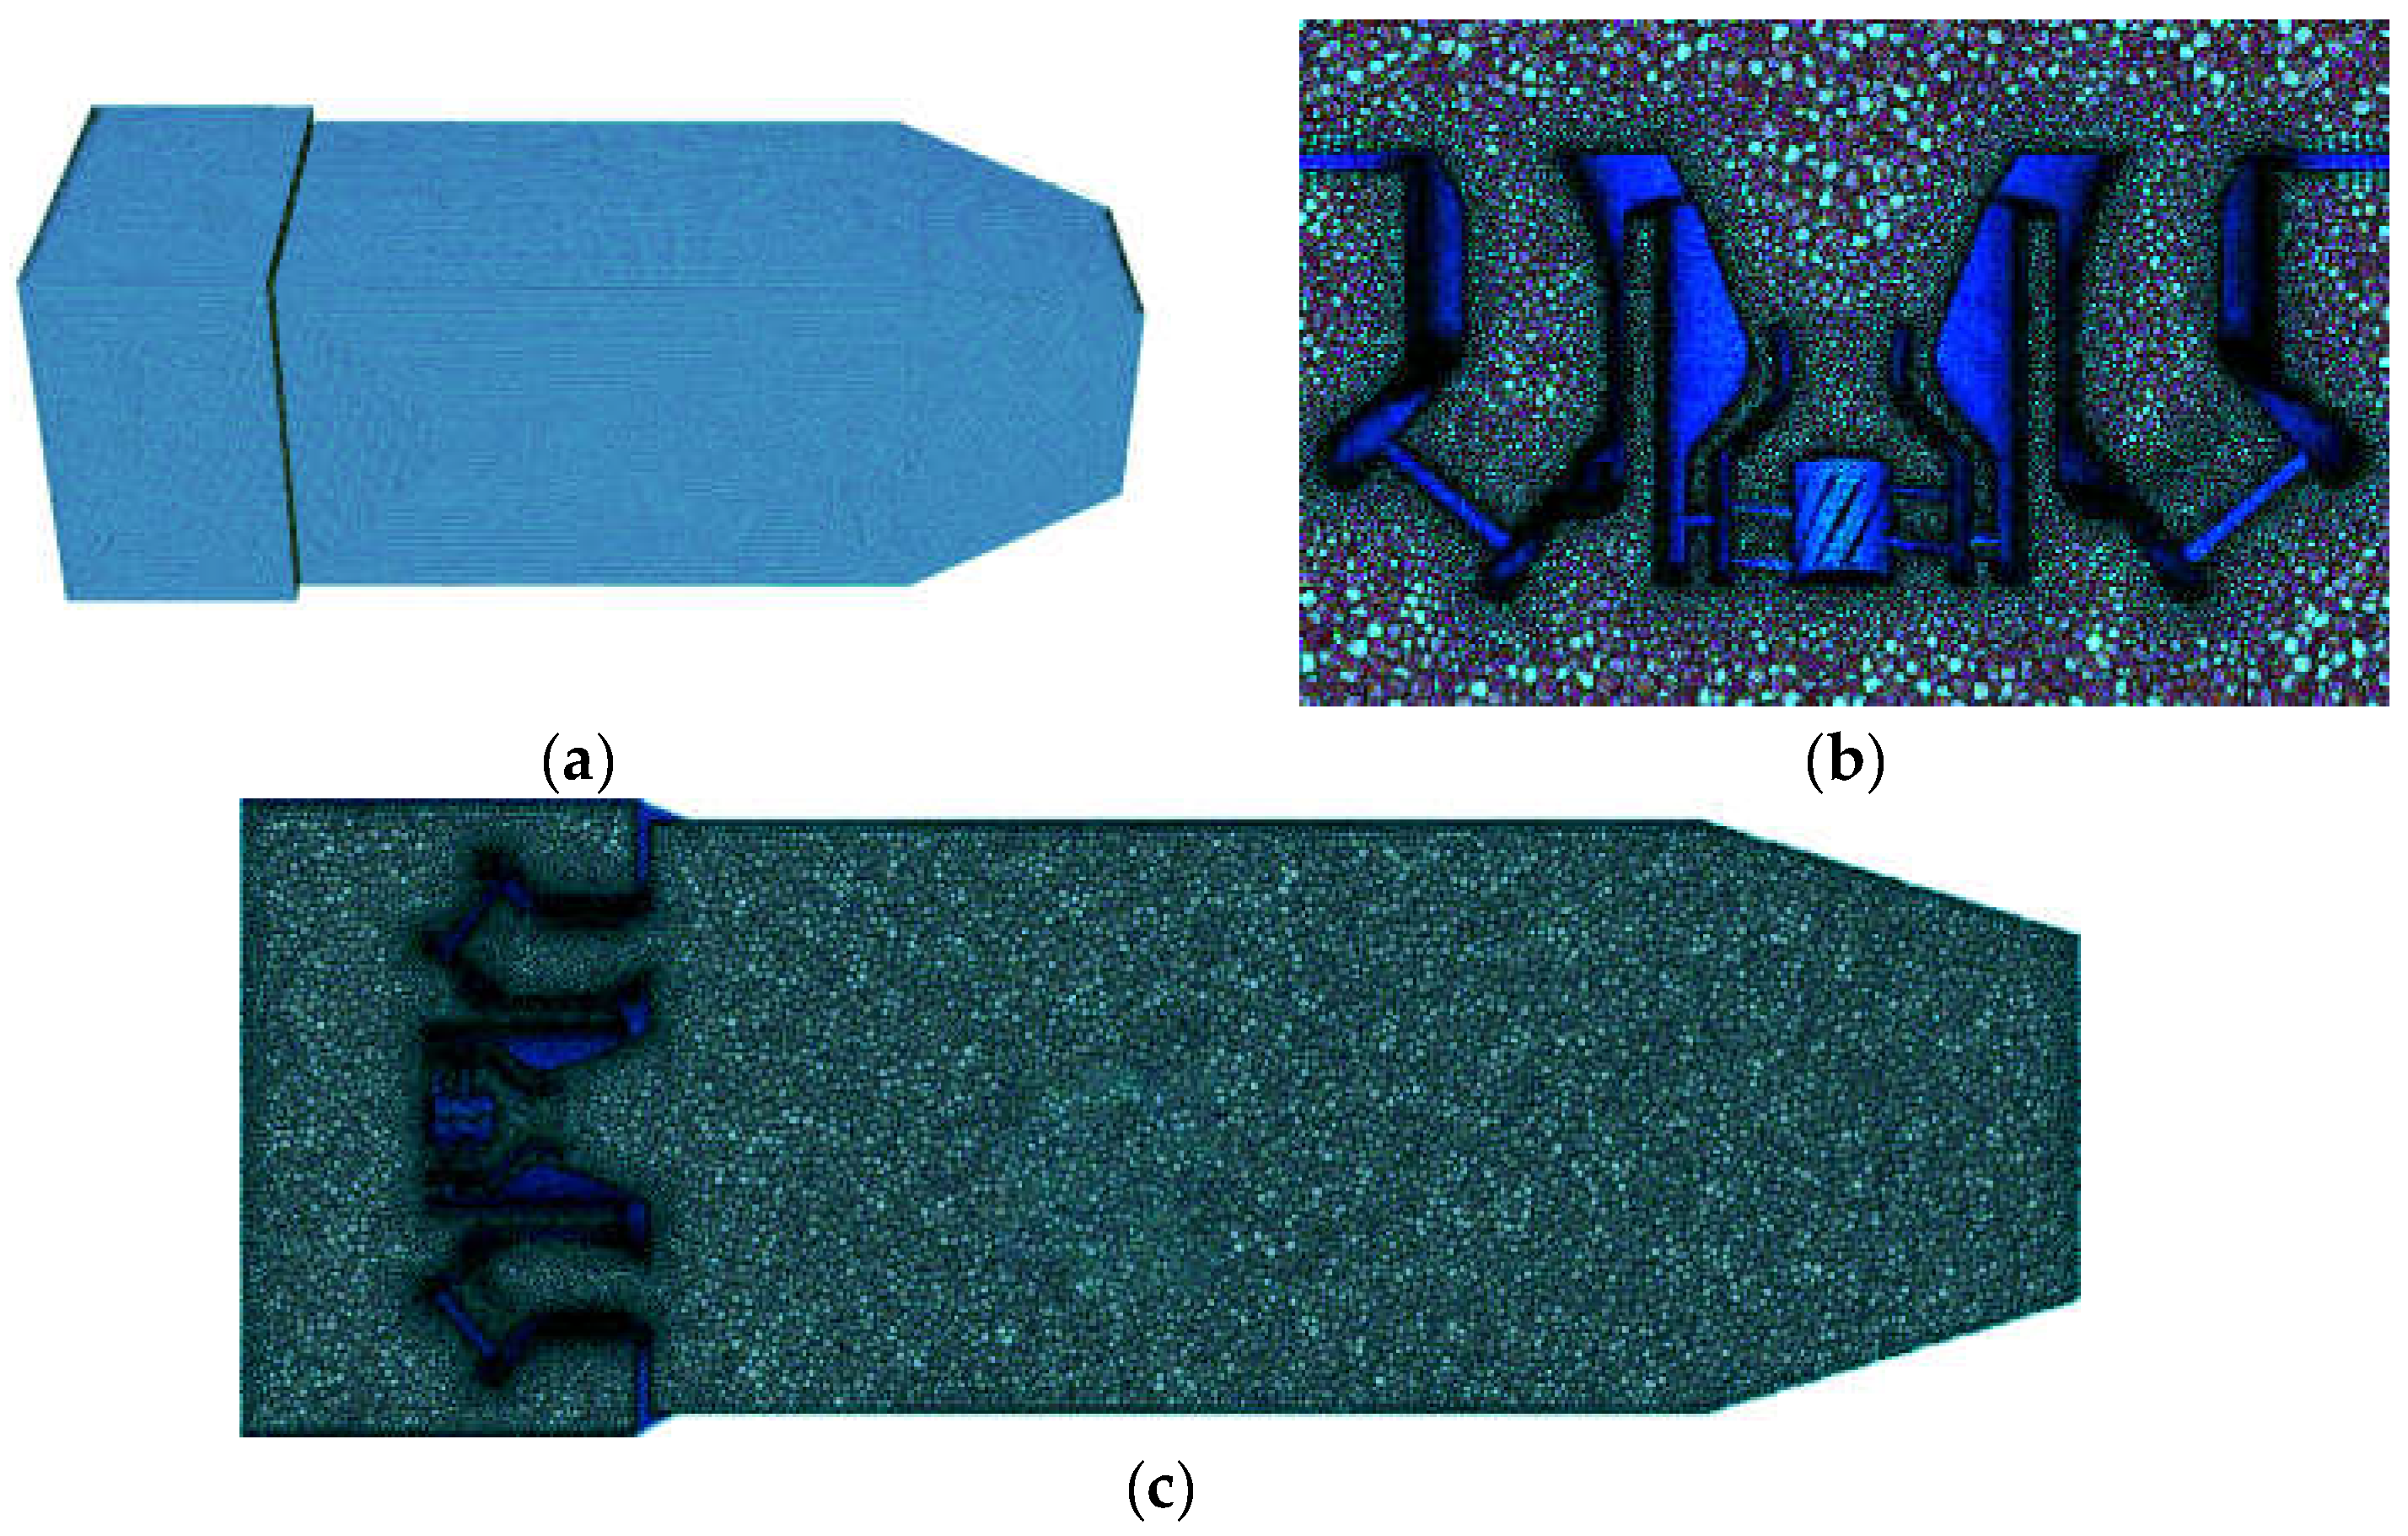
In this paper, the three-dimensional modeling software Siemens UG NX 8.0 (Siemens PLM Software, Munich, Germany) is used to build a model combustion chamber. Realistic problems such as the outer magazine, wall cooling structure, and test monitoring device are ignored in the calculation. Figure 1 shows the structure diagram of the model combustion chamber and the swirl structure. The model combustion chamber adopted in this paper has a total length of 462 mm, which consists of a head swirl structure, a square flame tube structure, and an outlet shrinkage section structure. The side length of the square flame tube is 150 mm, and the graded swirl consists of a pilot swirl, a main combustion stage swirl, a venturi, nozzles, etc. The center stage nozzles are centrifugal pressure nozzles. The center stage nozzle adopts a centrifugal pressure atomization nozzle, and the main combustion stage nozzle is 20 direct injection nozzles. The pilot swirl consists of two levels of axial swirl with an opposite rotation direction, and the first level of swirl blades of the duty level rotates counterclockwise. The second stage of the duty swirl rotates clockwise. The main combustion stage is a tower swirl with counterclockwise rotating blades.

2.2. Meshing

In this paper, fluent meshing ver. 2021 software (ANSYS, Inc., Canonsburg, PA, USA) is used to mesh the model, as shown in Figure 2, with a polyhedral mesh. Among them, the inlet mesh size is 1 mm, the outlet mesh size is 1 mm, the wall mesh size is 2 mm, the swirl mesh size is 0.5 mm, the boundary conditions are used for the mass flow inlet and the pressure outlet, the number of flow boundary layers is 5, the maximum body mesh size is 3 mm, and the total number of mesh is 5.36 million.
The grid-independence in the non-stationary numerical simulation was verified at a temperature of 770 K and a pressure of 1.01 × 10⁶ Pa. The axial velocity time series at the core location of the reflux zone after the swirl and the points out of the shear layer are monitored during the calculation and analyzed spectrally, as shown in Figure 3, in which the slope of the red line is −5/3, and the spectral curve satisfies the Kolmogorov’s −5/3 sub law [40], which indicates that the grid scale basically meets the computational requirements of the LES. Therefore, in this paper, the grid with 5.36 million nodes is selected for the nonstationary calculation.

2.3. Numerical Method

In this paper, the wall-modeled LES (WMLES) method is used to compute the flow field flow in a combustion chamber, and the governing equations used for the large-scale vortex simulation are obtained by filtering the time-dependent N-S equations in Fourier space or group space. Large-scale vortices and small-scale vortices are treated separately by some filtering function, where the large-scale vortices are solved by the filtered N-S equations and the small-scale vortices are closed by a sublattice model.
In order to close the basic equations of large-vortex simulation, various sublattice models have been developed, such as the Smagrinsky model. However, due to the high mesh resolution requirement of the wall boundary layer for large-vortex simulation, the computational cost is extremely high. Therefore, large eddy simulation has very limited engineering applications. For this reason, the wall-modeled LES (WMLES) method was proposed and gradually applied to the calculation of industrial combustors. The original WMLES model was proposed by Shur et al. [41]. It combines the mixing length model, the improved Smagorinsky model, and the wall damping equation proposed by Moin [42]. The WMLES model is essentially a hybrid model. In the computational process, the WMLES model uses the Reynolds averaging method to simulate the flow field within the boundary layer region, while the large vortex simulation method is used to simulate the flow field outside the near-wall region [41], which greatly reduces the mesh requirements of the LES.
In this study, a discrete phase model (DPM) was used to simulate the distribution, trajectory, heating, cooling, and evaporative boiling of the fuel droplets. A partially premixed combustion model was used to simulate turbulent combustion in a swirl combustion chamber. The flamelet generated manifolds (FGM) combustion model with accurate and efficient computational results is used for turbulent combustion simulation. The FGM model refers to the laminar flame front approach, which considers that a three-dimensional flame is essentially composed of a one-dimensional flame, and uses a one-dimensional flame to construct the reaction mechanism subspace. The turbulence is decoupled from the chemical reaction by treating the internal structure of the flame front and the turbulence effect on the flame front separately, which greatly reduces the calculation volume. In the actual calculation process, the distribution of the process variables is obtained by solving the transport equation of the process variables, and then the FGM form data is read to obtain the distribution law of its temperature, component mass fraction, and so on.
The POD is a modal decomposition technique that extracts modes based on optimizing the mean square of the field variable under investigation [43]. It can accurately capture the flow field’s main evolution characteristics and represent unsteady coherent structures. The method of snapshots is used in this study because there are usually far more measured data (measurement or computational grid points) compared to the sample size, and thus the method of snapshots is far more computationally efficient [43]. Detailed mathematical descriptions are omitted here, as they are comprehensively covered in the existing literature [43,44,45].
The input data for the POD consist of K two-dimensional velocity fields (snapshots) sampled in time,
V ( k ) = ( μ i , j , ν i , j ) ( k )
Here, i and j are the indices of the grid points in the numerical simulation plane, and k is the index of the velocity field. In the engine flow, the samples can be phase invariant, where the samples are continuously collected in time for many cycles, or phase independent, where the samples are collected at the same phase angle for many cycles [46]. For this study, only phase-dependent sampling is considered; thus, V ( k ) is the velocity field at a given crank angle from the k th cycle. The properties described in the results here are also valid for scalar fields, three-dimensional samples, and phase-invariant samples of engine flows.
The POD produces a linear basis set consisting of M basis functions ϕ m and the corresponding coefficients c m ( k ) , that can reconstruct all K velocity distributions,
V k = m = 1 M c m ( k ) φ m
where m is the mode index, with the total number of modes equal to the total number of snapshots, M = K. The procedures of determining the orthonormal POD basis functions ϕ m are detailed in [43,44,45]. In this study, the basis functions were created with a code which minimizes the following function:
k = 1 K V ( k ) m = 1 M c m ( k ) ϕ m 2 min
Subject to
( φ i , φ j ) = δ i j = 1 i f i = j 0 i f i j
where   denotes the L 2 norm. The basis functions contain the ‘flow patterns’, normalized in L 2 space so that the sum of the squares of all the vectors in an individual basis function ϕ m is unity [43]:
i = 1 I j = 1 J ( μ i , j 2 + ν i , j 2 ) = 1
where μ and ν are the x and y components of φ , respectively. Furthermore, each basis function is orthogonal to all others, i.e.,
φ m x φ p x d x = δ m , p
These two properties define the basis functions as orthonormal. The K × M coefficient matrix c m ( k ) ,
c m k = c 1 1 c 2 1 c M 1 c 1 2 c 2 2 c M 2 c 1 K c 2 K c M K
contains the amplitude that the corresponding basis function contributes to a particular snapshot. The coefficients are computed by projecting the original K velocity fields onto the M computed basis functions. Thus, in this study, the velocity field from the kth engine cycle can be reconstructed by summing all M modes multiplied by their respective coefficients for that cycle using Equation (1). Since ϕ m is normalized and c m ( k ) is the amplitude, 1 2 c m k 2 quantifies the kinetic energy per unit mass the mth mode contributes in the kth velocity field.
The POD mode spectrum is often used to describe the energy fraction each mode captures of the total ensemble of snapshots. The mass-specific kinetic energy from all of the cycles captured by the mth mode is
K E m = 1 2 k = 1 K c m k 2 = 1 2 K λ m
Thus, Equation (6) relates the coefficients to the eigenvalue. The energy fraction of the mth mode is
k e m = K E m / K E t o t a l
where
K E t o t a l = m = 1 M K E m
Thus, K E t o t a l is the total kinetic energy summed over all K velocity distributions.

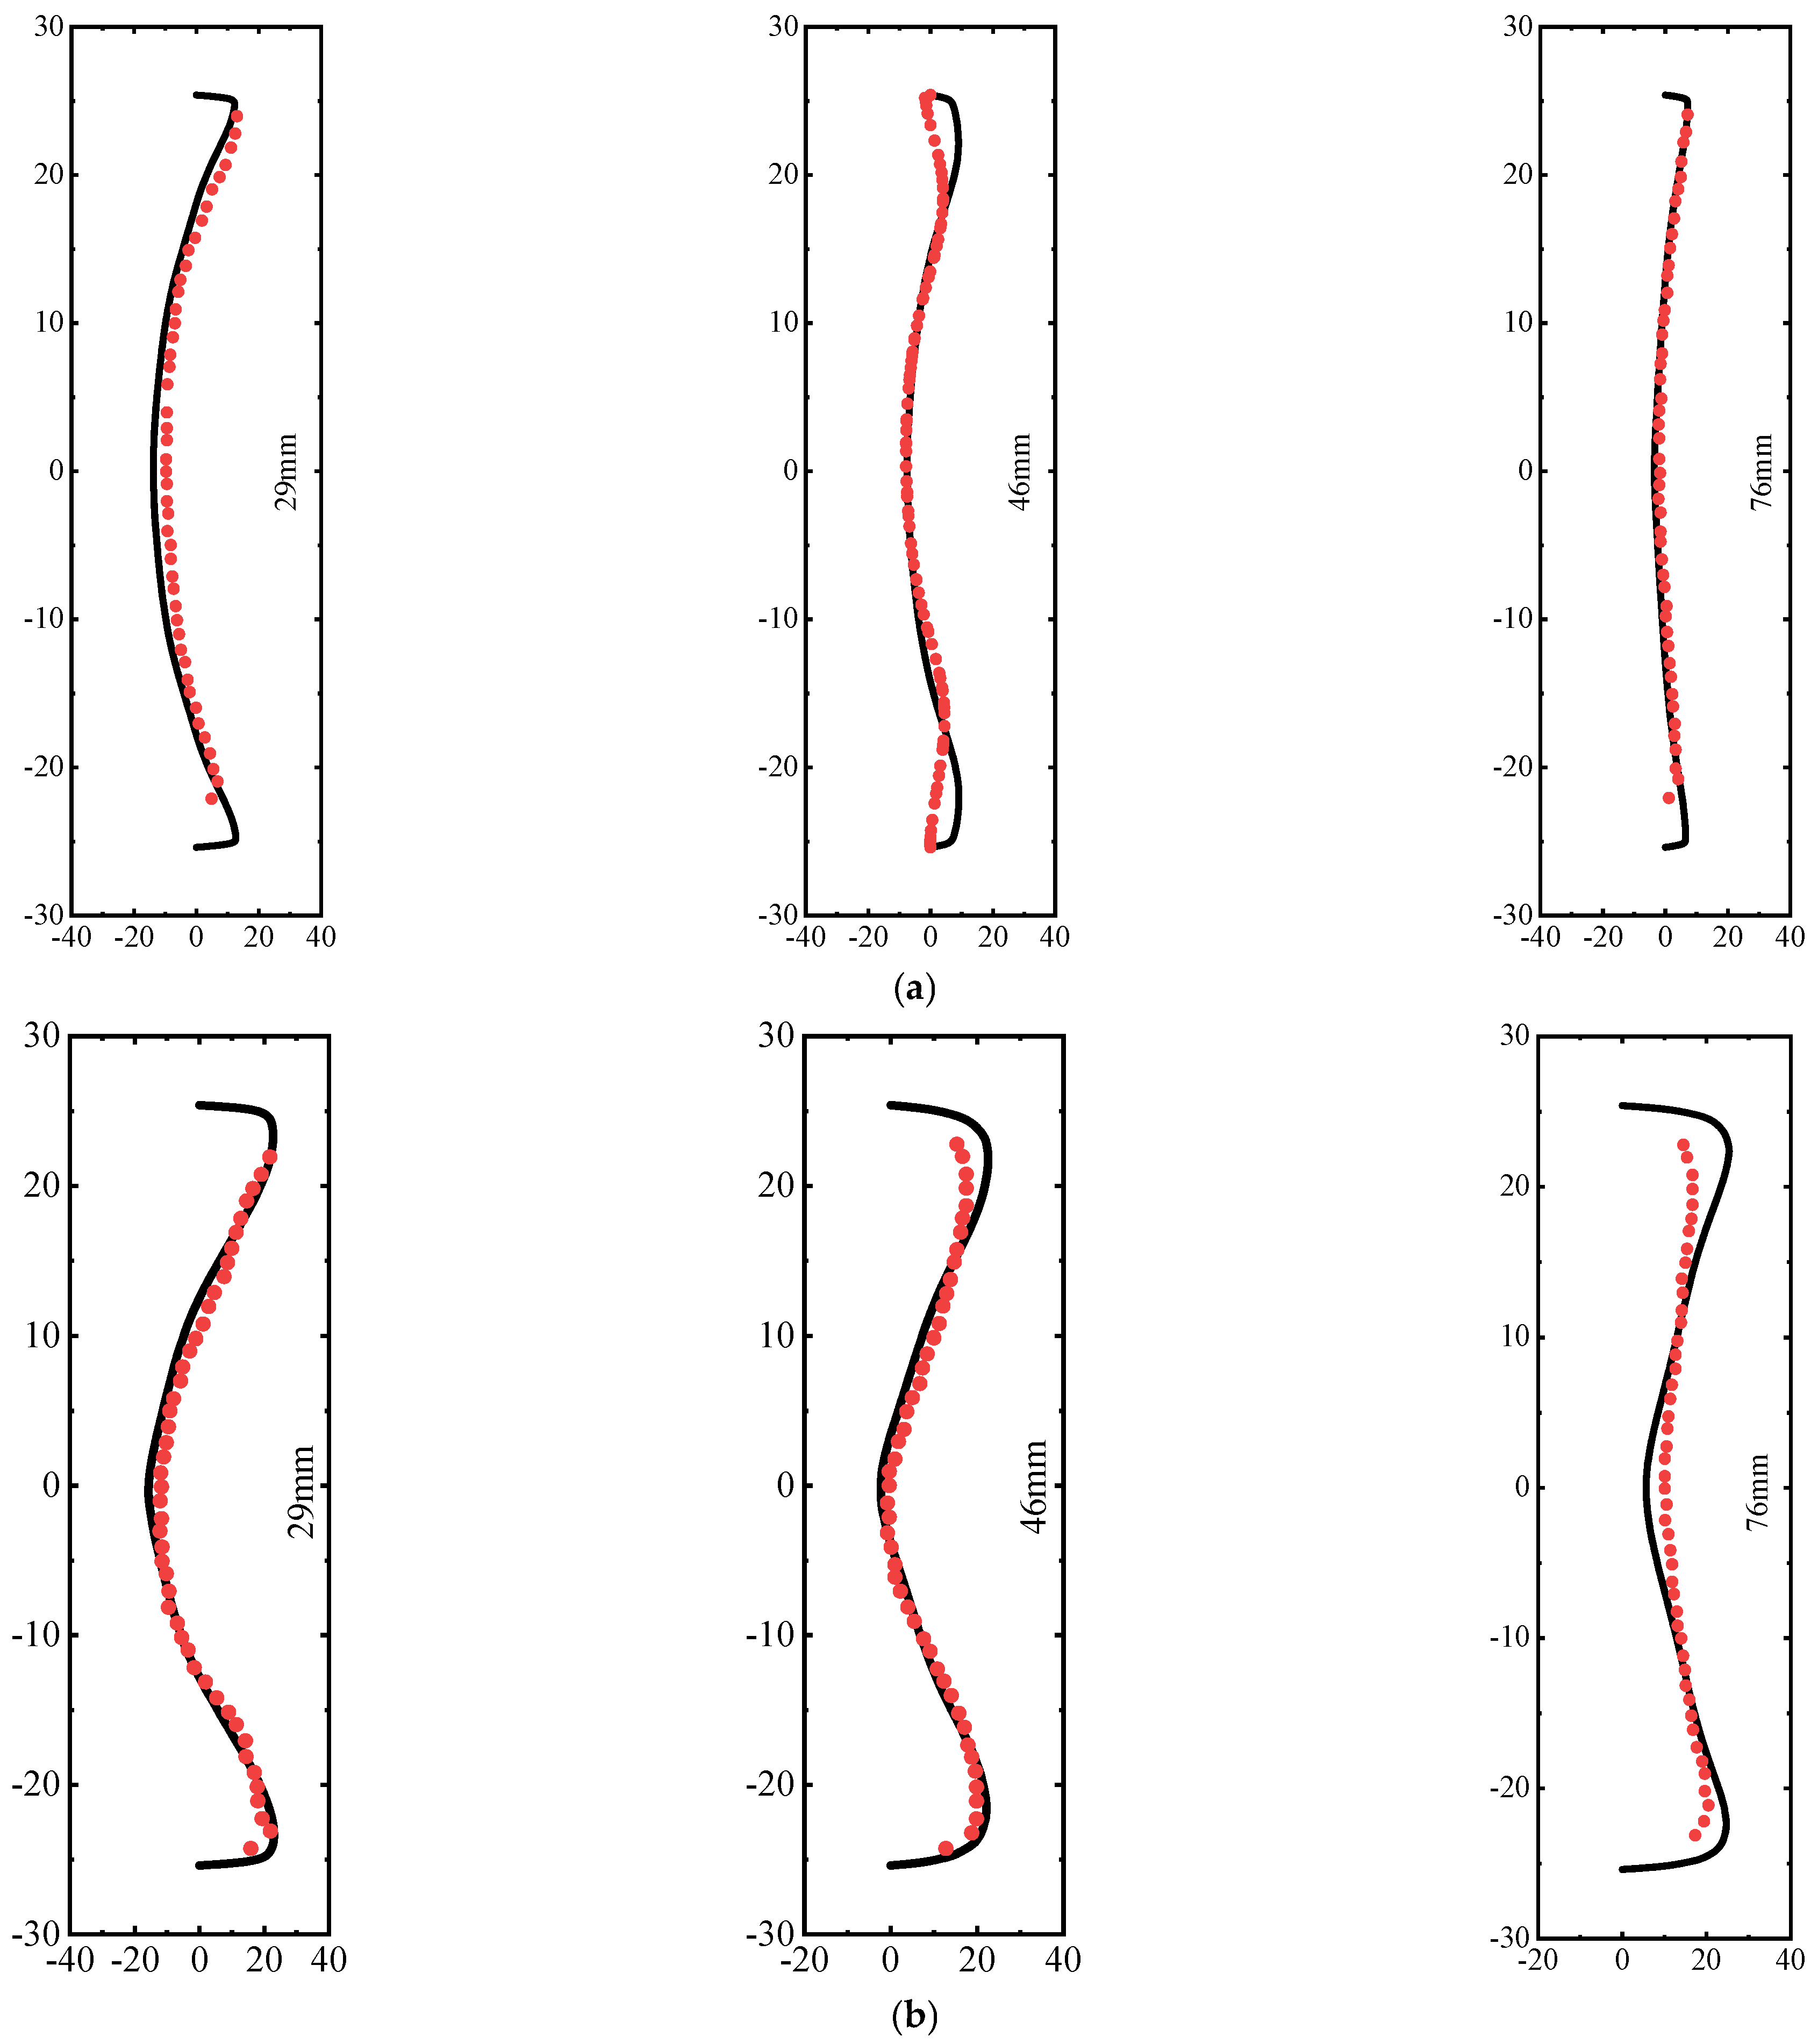
2.4. Model Verification

In order to further verify the accuracy of the numerical method in combustion simulation, a single-point LDI combustion chamber [47] is selected to carry out LES calculations, and the comparison of the simulation results (solid line) with the experimental data (red scattering dots) is shown in Figure 4, which shows that the simulation results (solid line) and the experimental data (red scattering dots) are in good agreement, and the calculation results can capture the velocity changes within the reflux zone and the shear layer.

2.5. Boundary Conditions

Table 1 shows the three operating conditions in this study. The dynamic combustion characteristics were investigated under conditions of a pressure of 1.01 × 10⁶ Pa, a temperature of 770 K, an inlet air flow of 1.44 kg/s, and a fuel flow of 0.0354746 kg/s. Additionally, the oxygen content ranged from 11 wt% to 23 wt%, with variations achieved by adjusting the mass fraction of oxygen. The cone injection model was employed to deliver liquid fuel into the gas turbine combustor. Twenty-one injections are strategically configured to enhance the atomization effect. Specifically, the fuel’s flow rate of the cone injection located in the central stage is 0.0105 kg/s, while the remaining 20 cone injections in the radial direction had a fuel flow rate of 0.00124873 kg/s, totaling a mass flow rate of 0.0354746 kg/s. Within the cone injection model, the minimum, maximum, and mean droplet diameters were defined as 0.001 mm, 0.05 mm, and 0.03 mm, respectively. In this study, the reduced kinetic reaction mechanism developed by NASA [48] was adopted as a surrogate for the liquid fuel to compute the combustion reaction.

3. Results and Discussion

3.1. Flow Field Analysis

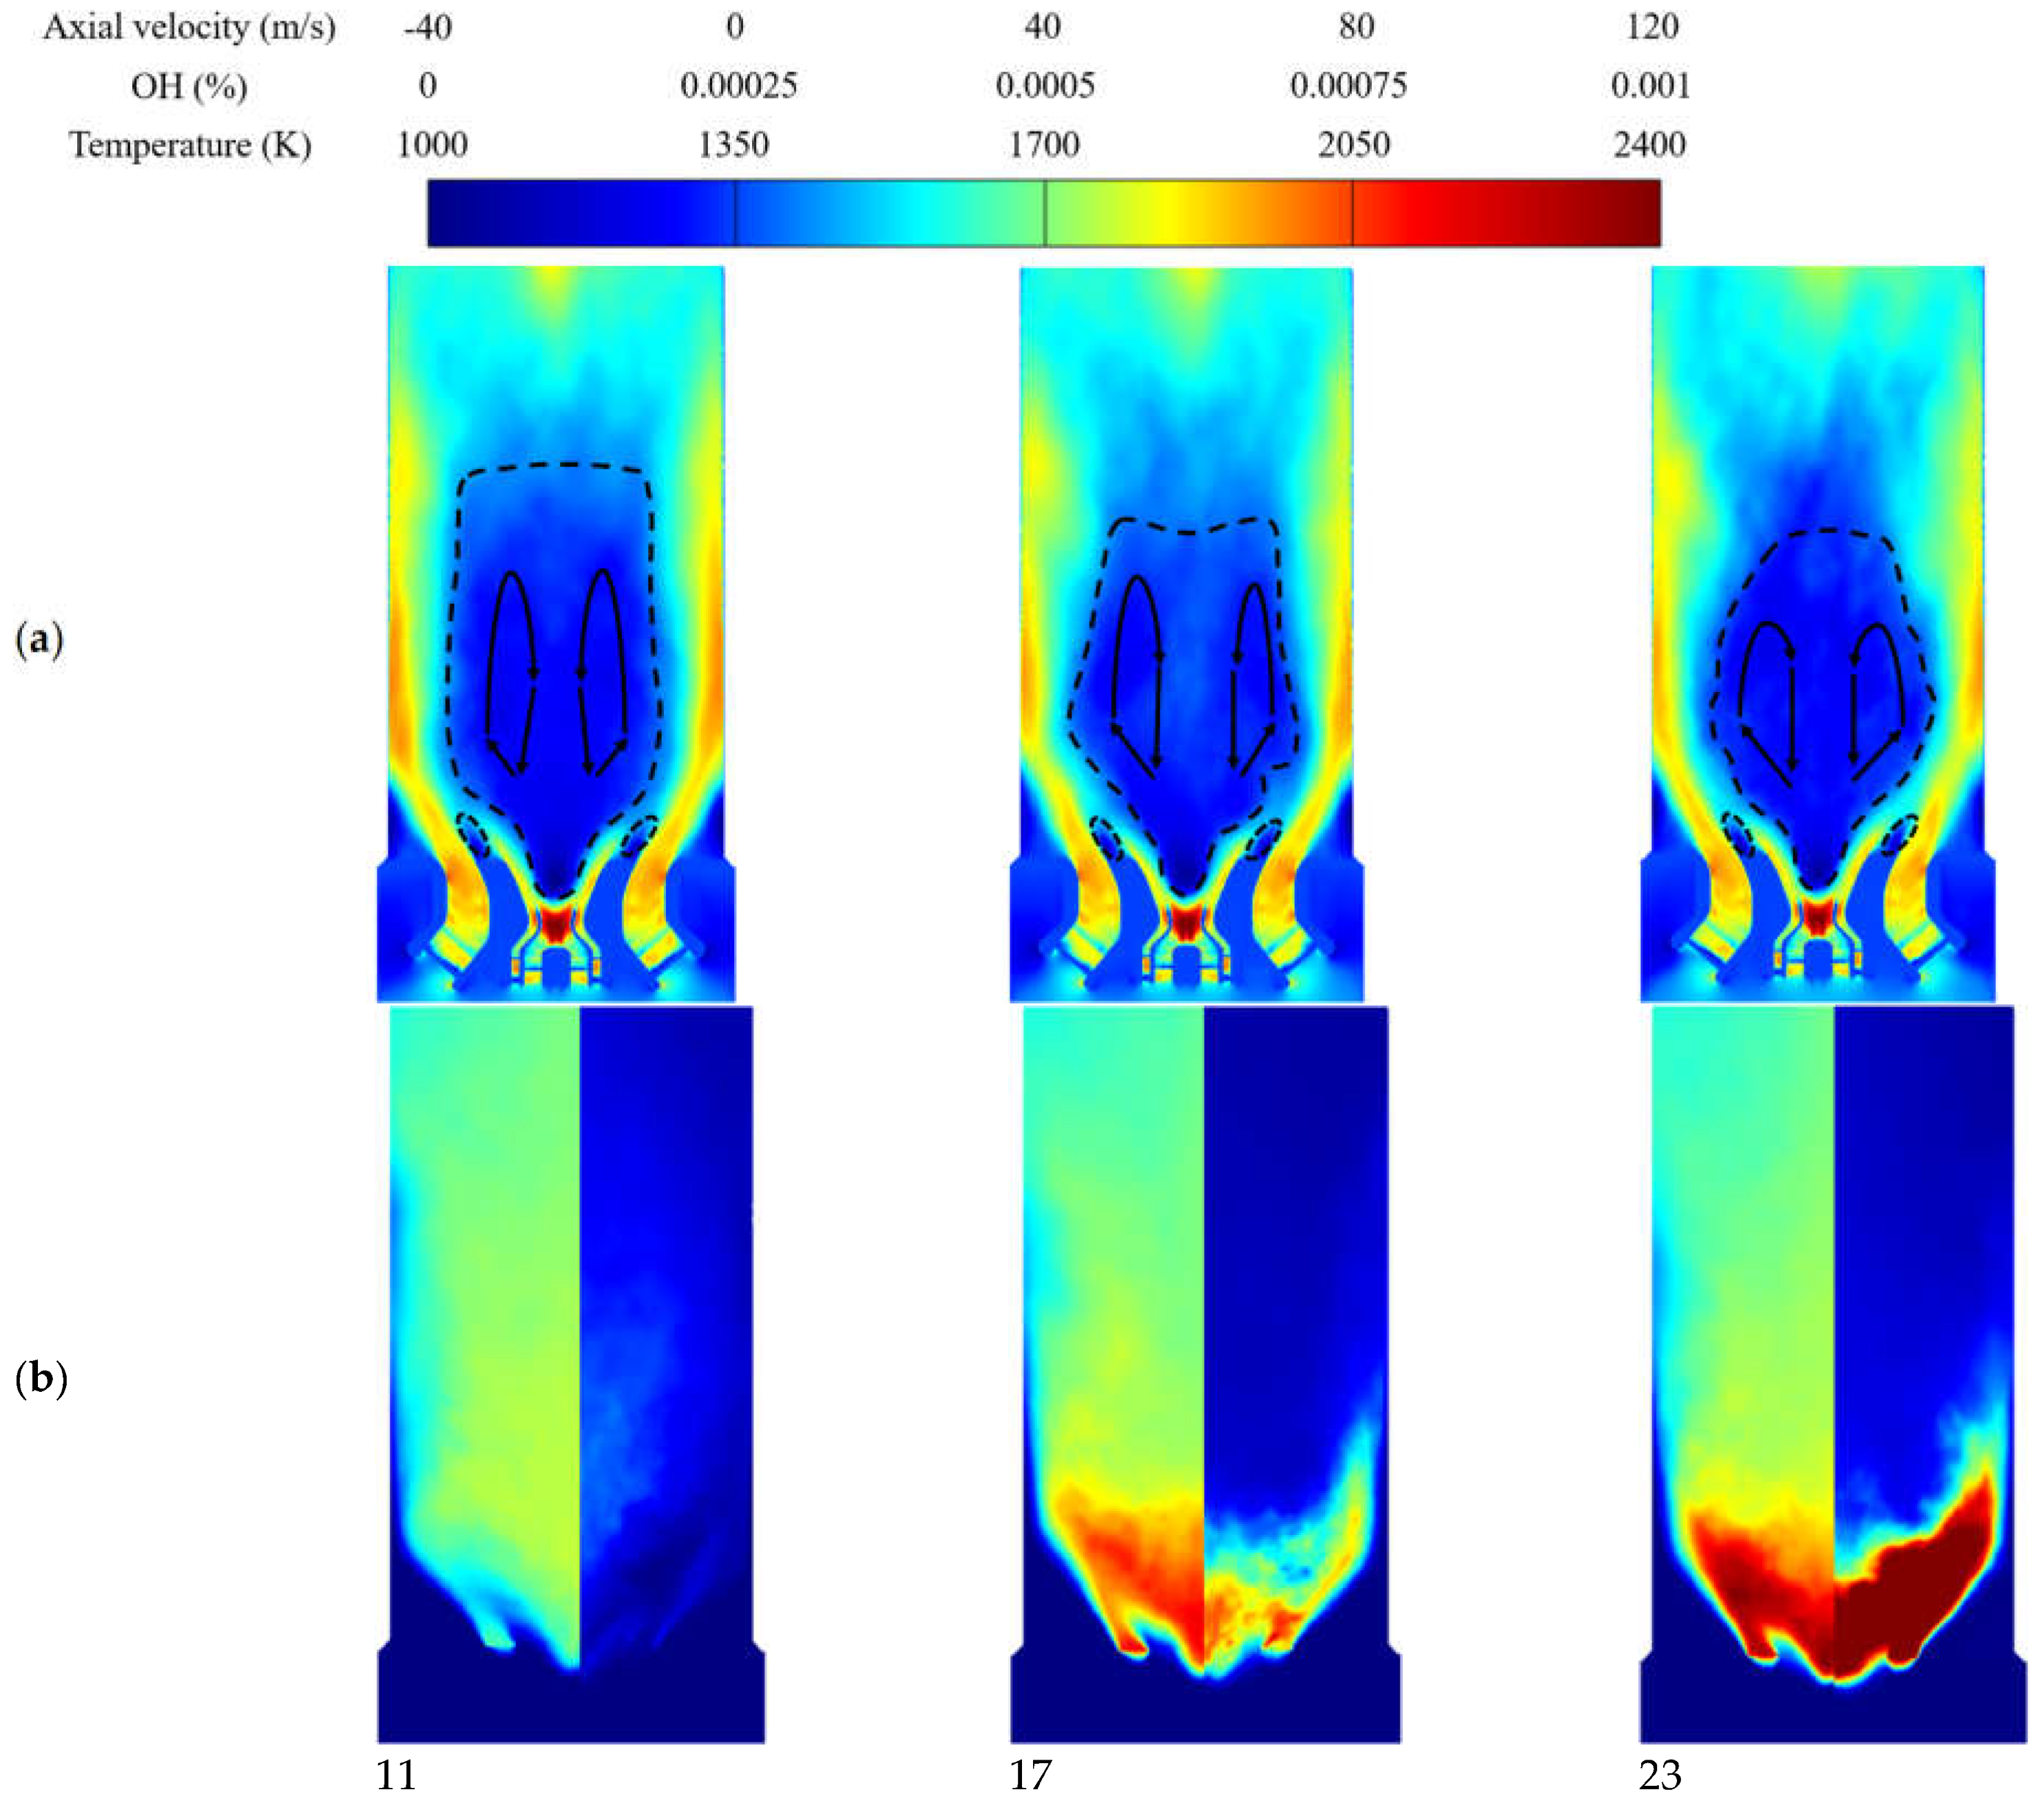
3.1.1. Time-Averaged Structure

Figure 5 presents the time-averaged images of axial velocity profiles, OH, and temperature fields for different oxygen content. In Figure 5a, the dashed lines represent the approximate distribution of the recirculation zone for various oxygen contents. It can be observed that the length of the recirculation zone decreases with increasing oxygen content. From Figure 5a, it can be seen that all three oxygen contents exhibit several typical flow structures. The fluid near the burner exit separates and interacts with the main flame, forming an outer vortex ring (OVR), which plays a dominant role in sustaining flame ignition and influencing flame dynamics and heat release. The fluid closer to the center propagates backward while being entrained inward, forming an inner vortex ring (IVR) which interacts with surrounding vortices to generate the central recirculation zone (IRZ) through mutual entrainment and dissipation. At 11 wt% oxygen content, a complete central jet structure can be observed, with two symmetric recirculation zones in the IRZ. This structure resembles that of the cold flow field. In Figure 5b, a relatively uniform distribution of temperature and OH can be observed, indicating homogeneous heat release and pressure fluctuations, suggesting a greater influence of flow at this oxygen content. However, at 17 wt% oxygen content, the recirculation zone shrinks compared to 11 wt%, and a prominent IVR structure appears, leading to strong vortex shedding and entrainment into the recirculation zone. This intense vortex shedding and entrainment can affect the species transport, forming localized regions of a fuel-rich mixture, which can be captured in the temperature and OH fields in Figure 5b. Additionally, transverse propagation structures appear in the recirculation zone, along with the formation of small vortex rings at the center, indicating the influence of flame heat release fluctuations on the original flow field. A similar structural distribution is observed at 23 wt% oxygen content compared to 17 wt%. The recirculation zone further shrinks, and the central jet disappears, replaced by outward dispersion from the burner exit that directly forms the IVR. The small vortices between the two symmetric recirculation zones also vanish, replaced by more distinct vortex structures. Furthermore, OH exhibits a denser distribution at the swirl generator outlet and higher combustion temperatures.

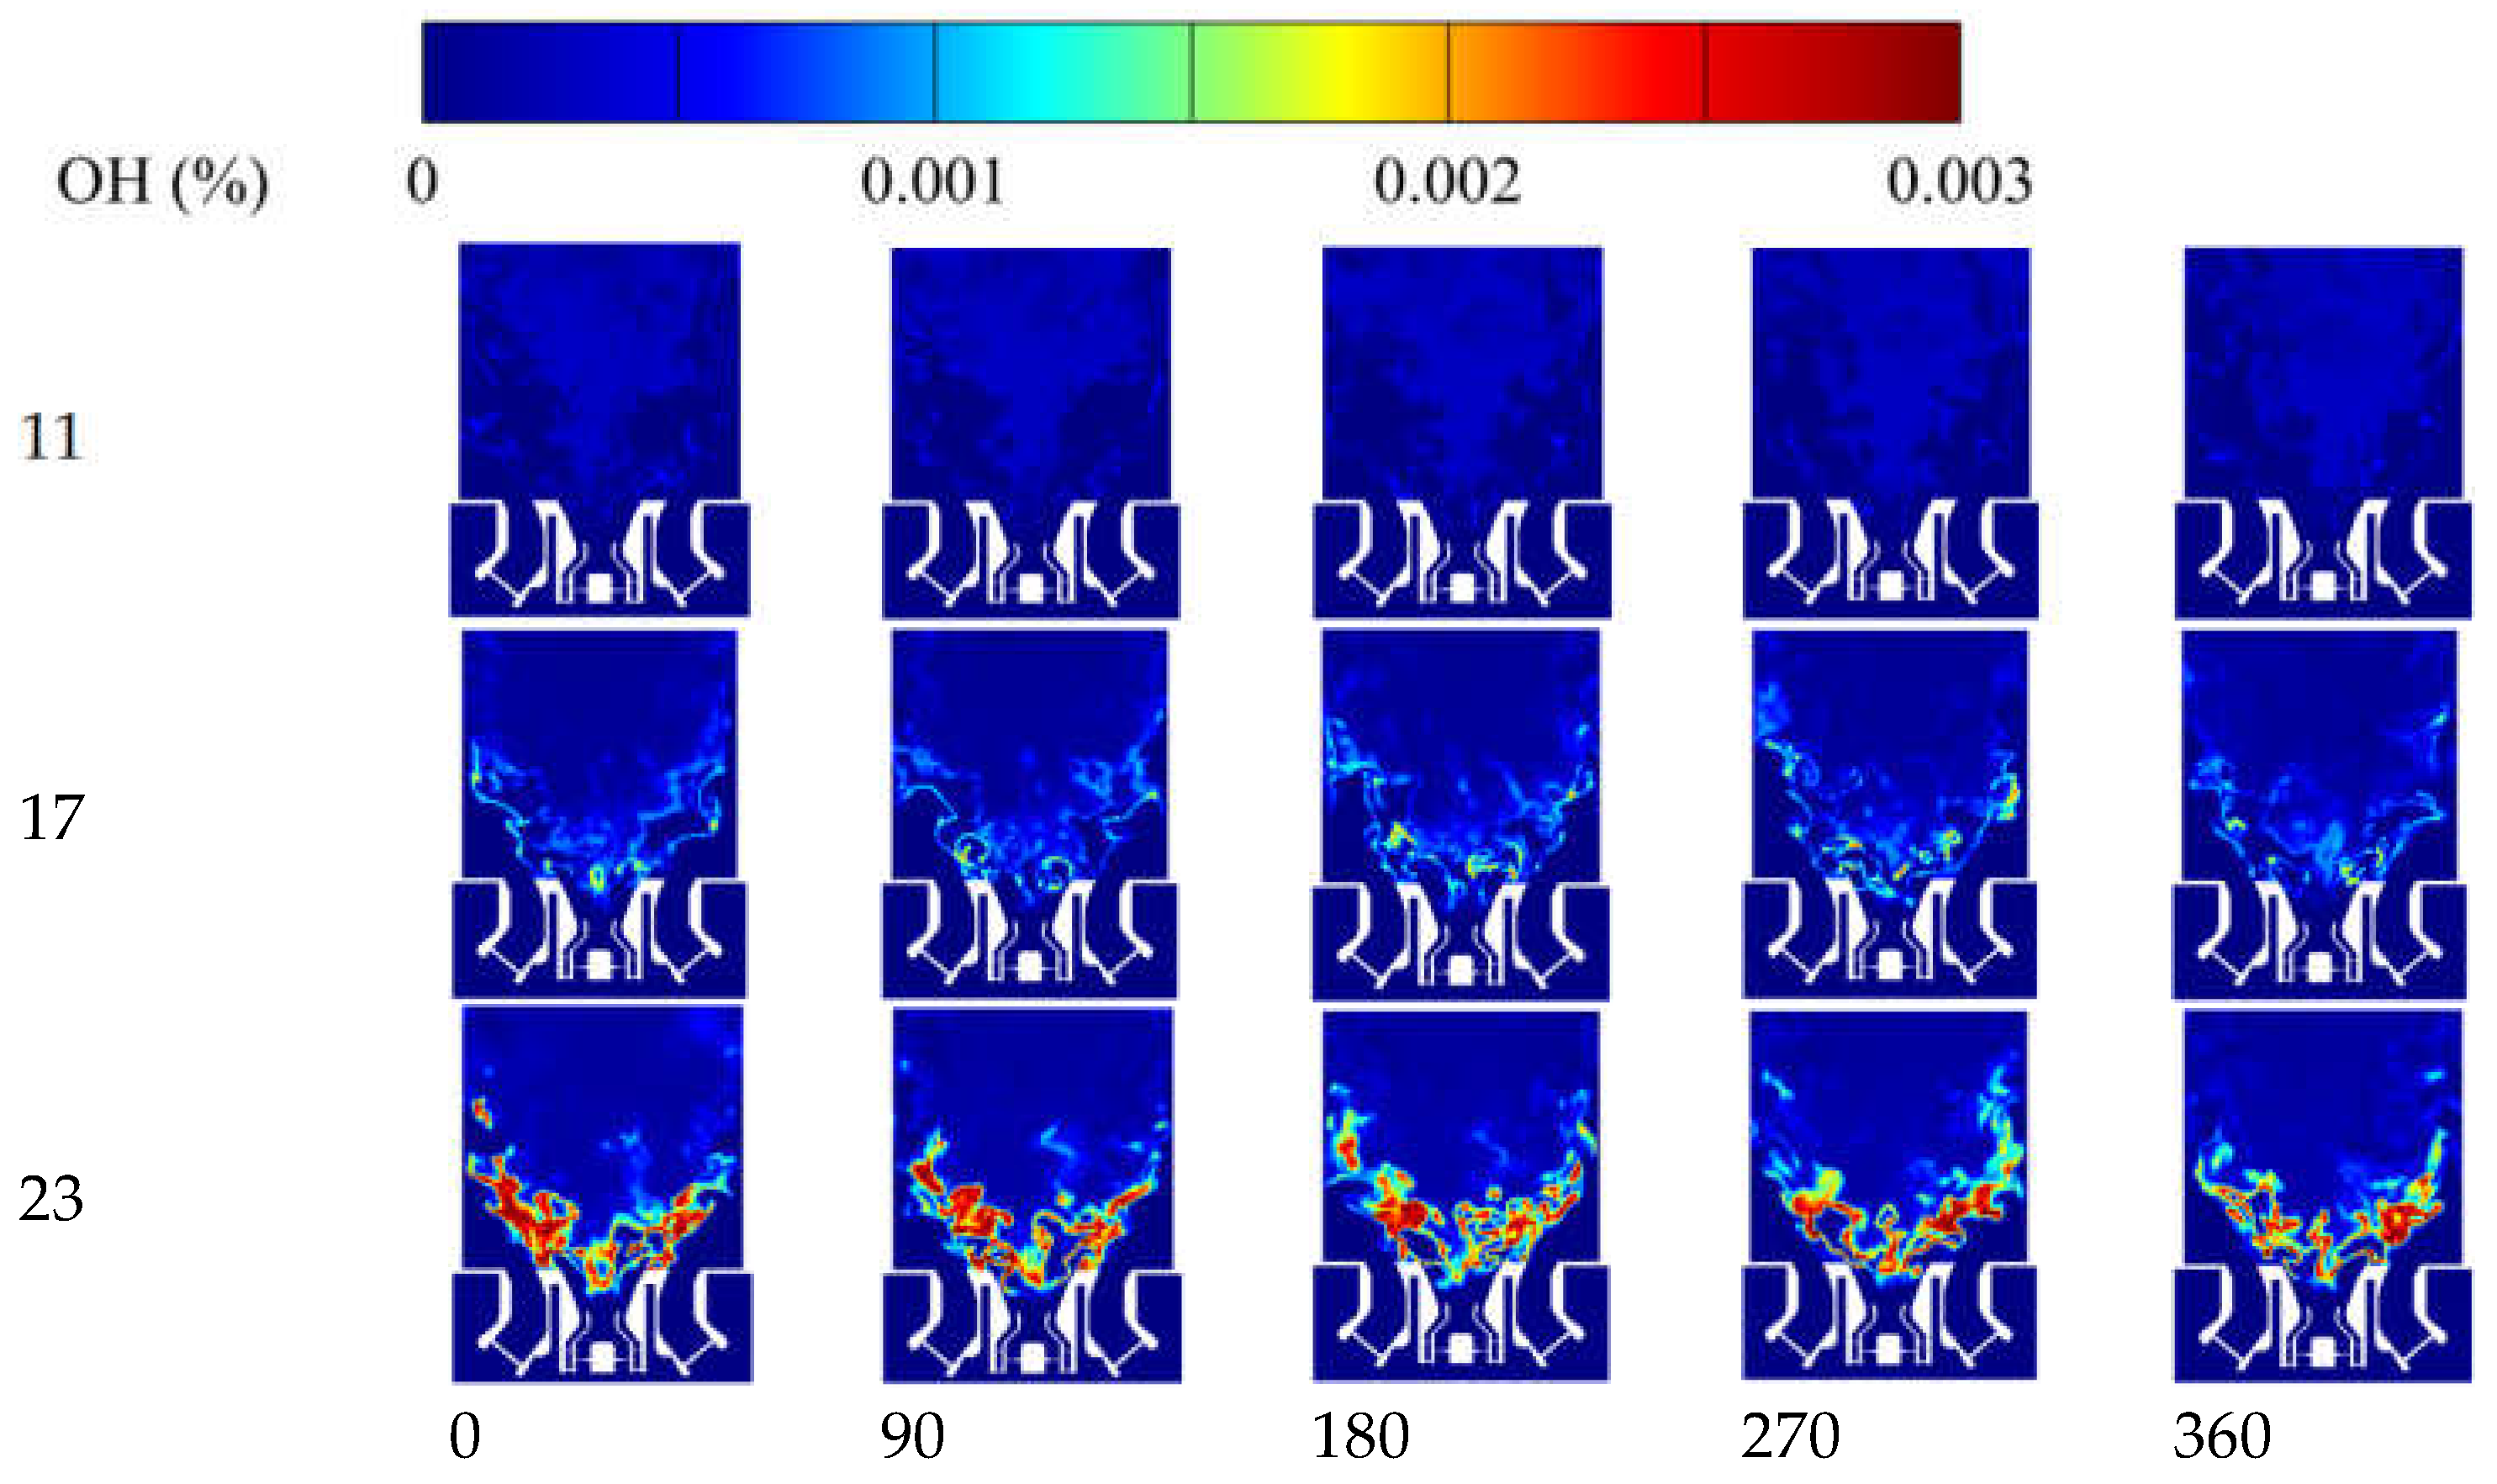
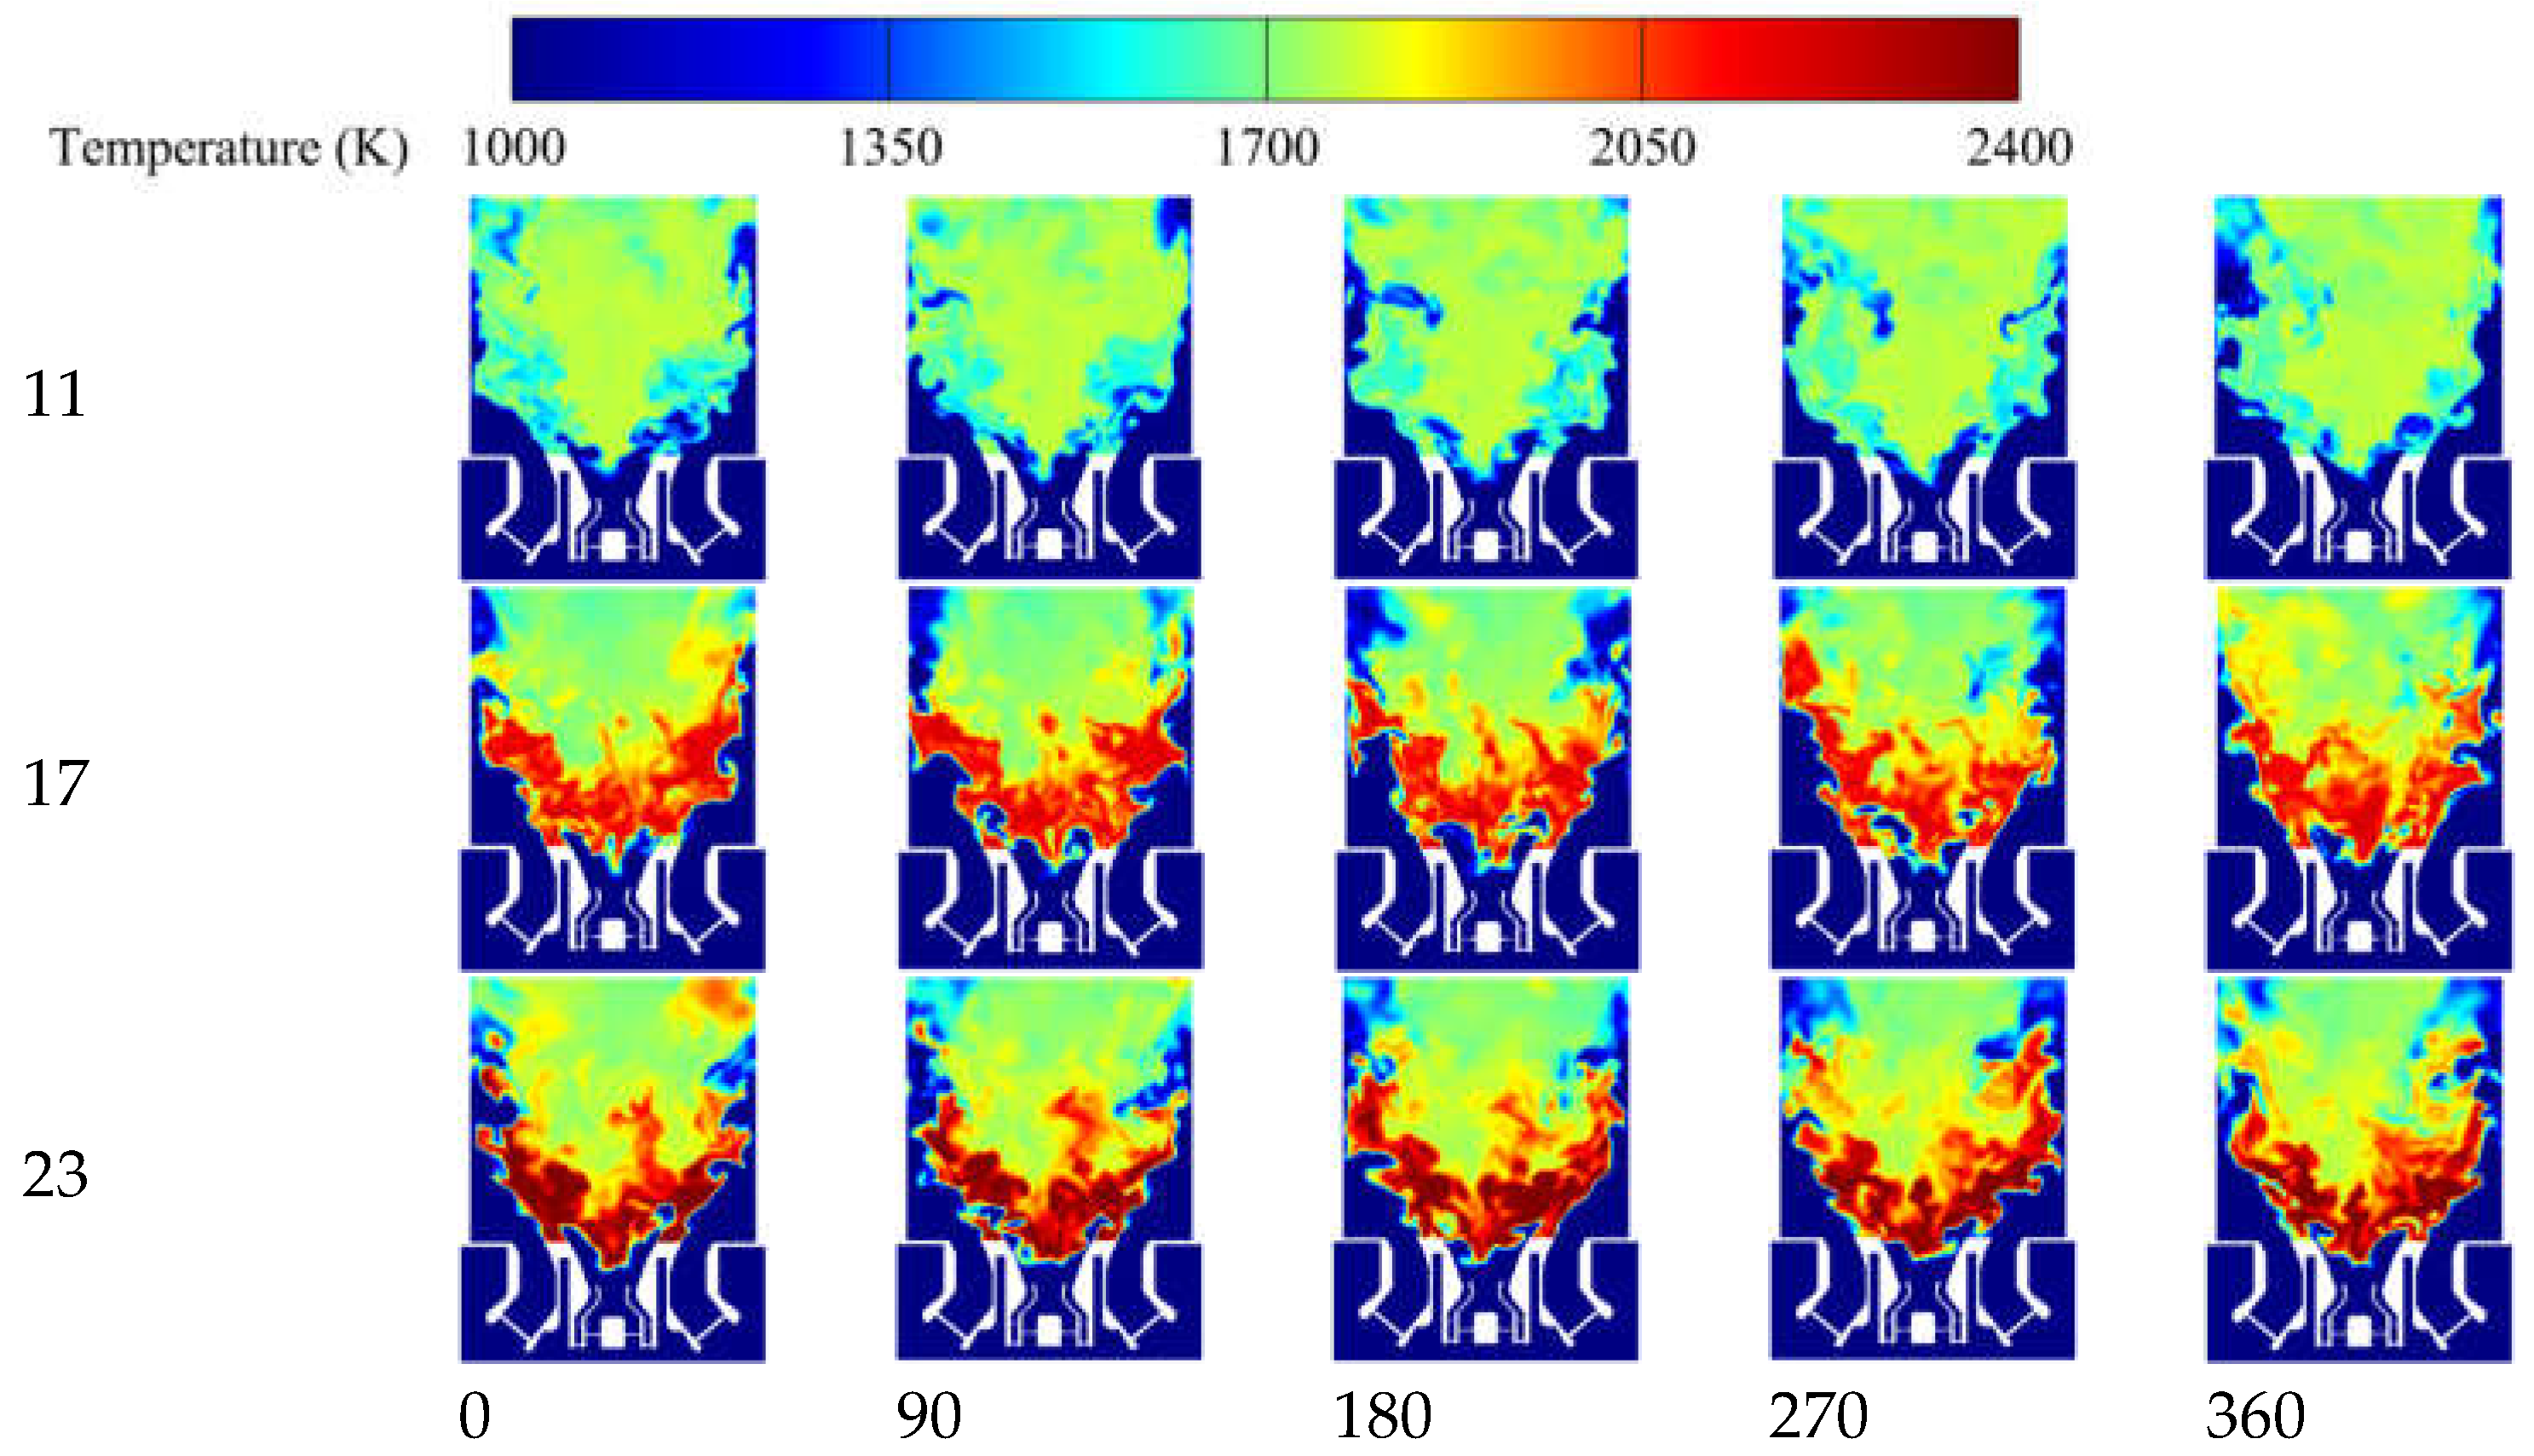
3.1.2. Transient Structure

This study determines the effect of different oxygen contents on flame periodicity by analyzing the frequency of pressure oscillations and heat release oscillations. Figure 6 presents the OH radical mass fraction distribution for different oxygen contents within one flame cycle. OH radicals are intermediate species in combustion and are present in regions of high temperature, specifically at the flame front where fuel decomposition and intense combustion occur. Therefore, the distribution of OH radicals can provide an indication of the flame structure. It can be observed that the content of OH radicals increases with increasing oxygen content. At 11 wt% oxygen content, OH radicals are mainly distributed throughout the combustion chamber, but there is no concentrated distribution and the mass fraction gradient is small, resulting in insignificant fluctuations. At 17 wt% oxygen content, there are scattered but relatively concentrated regions of OH radicals in the shear layer and near the burner exit. Within one cycle, there are axial and circumferential oscillations. At 23 wt% oxygen content, the distribution of OH radicals becomes more concentrated, and the mass fraction gradient increases.
Figure 7 shows the transient temperature distribution contours for different oxygen contents within one flame cycle. The transient temperature contours reveal the motion of high-temperature regions within the jet reaction zone. The location with the highest temperature gradient is generally considered to be the flame front position. The contours display wave-like wrinkles behind the head structure of the combustion chamber, indicating the presence of an internal shear layer between the jet and the main recirculation zone, characterized by numerous small-scale vortex structures and low velocity. These vortex structures enhance mixing and facilitate localized reactions, leading to the consumption of small quantities of reactants. At 11 wt% oxygen content, the flame temperature is approximately 1700 K, exhibiting a uniform distribution without a distinct flame front and minimal fluctuations. With increasing oxygen content, the flame front oscillations intensify. At 17 wt% oxygen content, a higher-temperature flame front of approximately 2200 K is observed, accompanied by fluctuations. During downstream transport, the mixed fuel–air stream maintains consistent entrainment of air and uniform mixing, leading to reaction and heat release in the vicinity of the vortex core. A stable flame front forms in the upstream region of the main recirculation zone, where primary reactions occur. At 23 wt% oxygen content, the flame front temperature further increases to 2400 K. It can be observed in the figure that, at a higher oxygen content, the shear layer in small-scale vortices exhibits higher temperatures, facilitating the heating of fuel at the head of the chamber and promoting combustion reactions. As the oxygen content increases, the reactant content rises, resulting in accelerated reaction rates and an increased temperature in the reaction zone. This operating condition leads to periodic oscillations of the flame front, which in turn cause oscillations in heat release. As the recirculating flow moves downstream within the main recirculation zone, the vortex gradually expands, breaks down, and dissipates. High-temperature regions within the vortex are partially transported towards the head by the center recirculation region and partly mixed with downstream high-temperature regions. The dissipation of the vortex leads to a more uniform temperature distribution downstream.

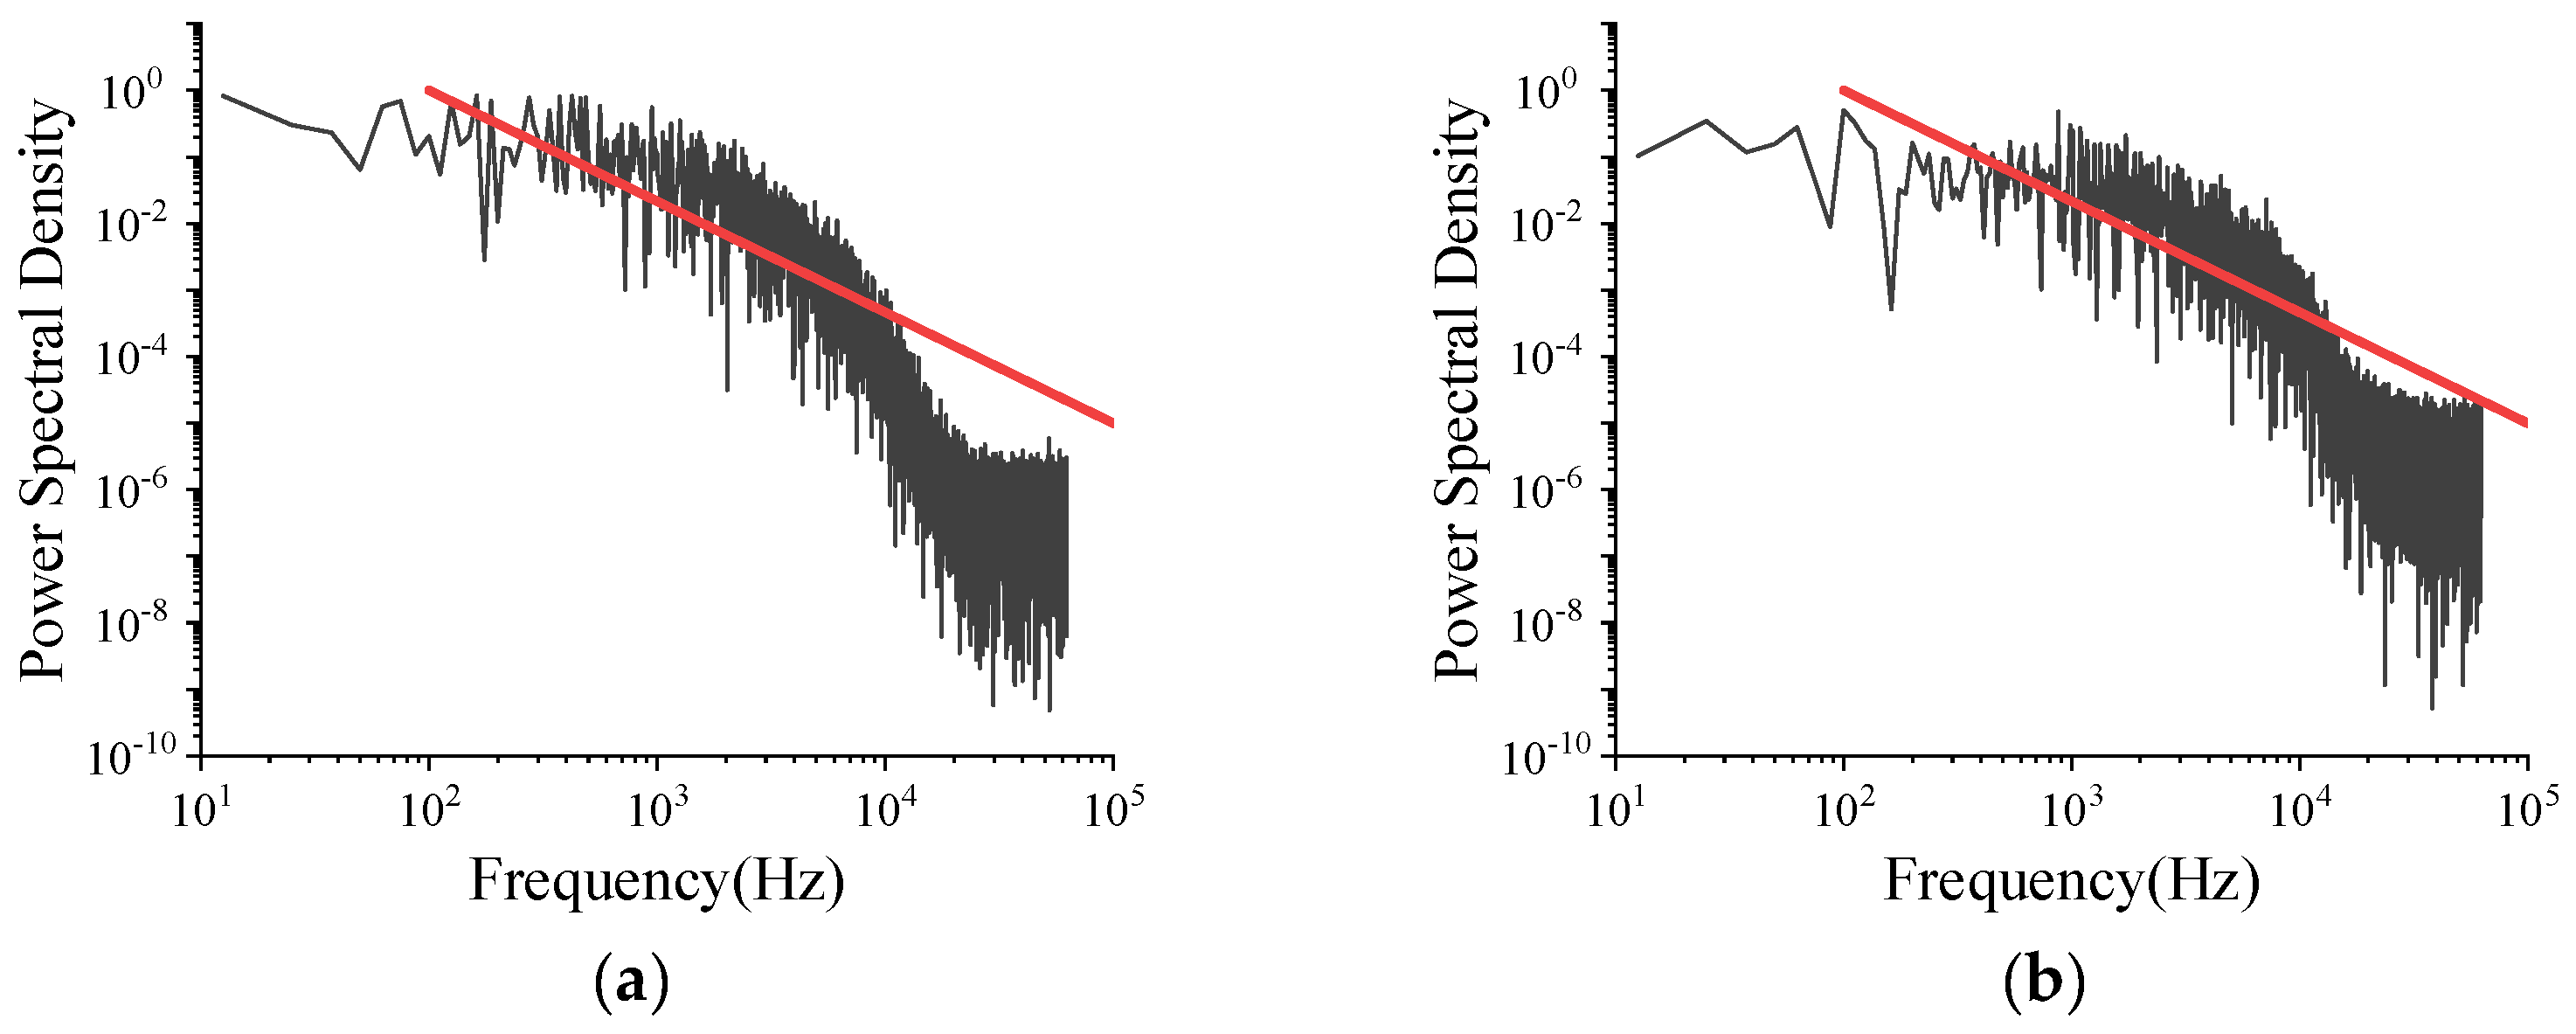
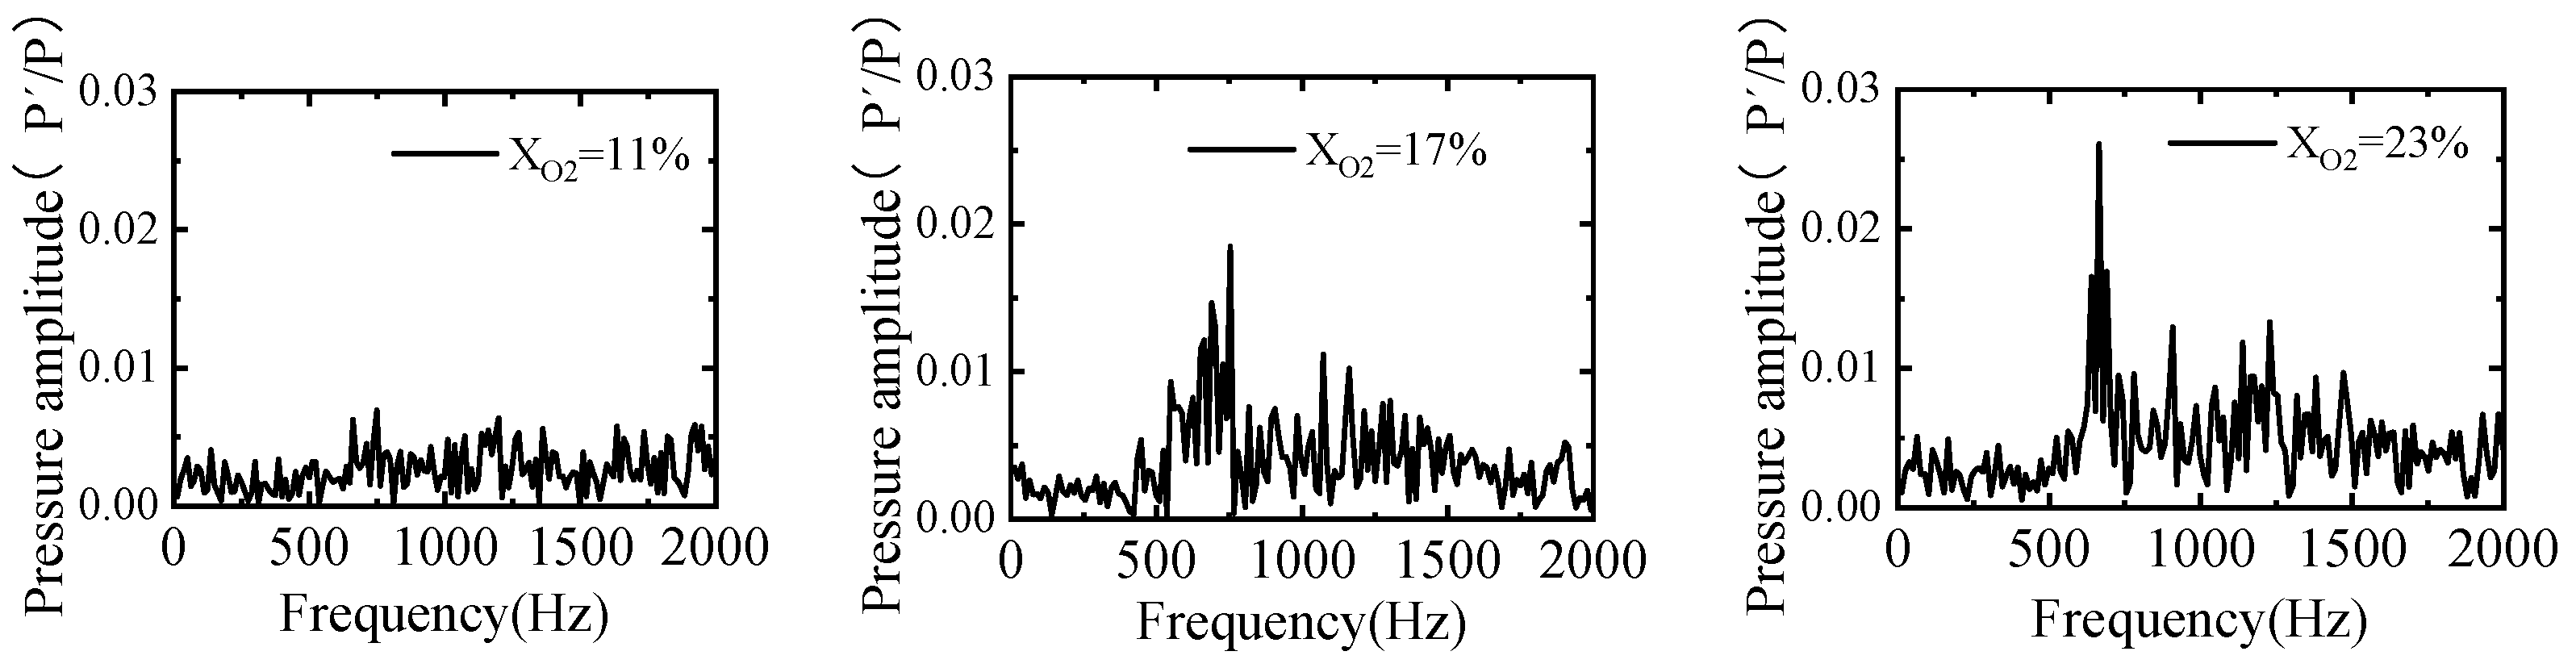
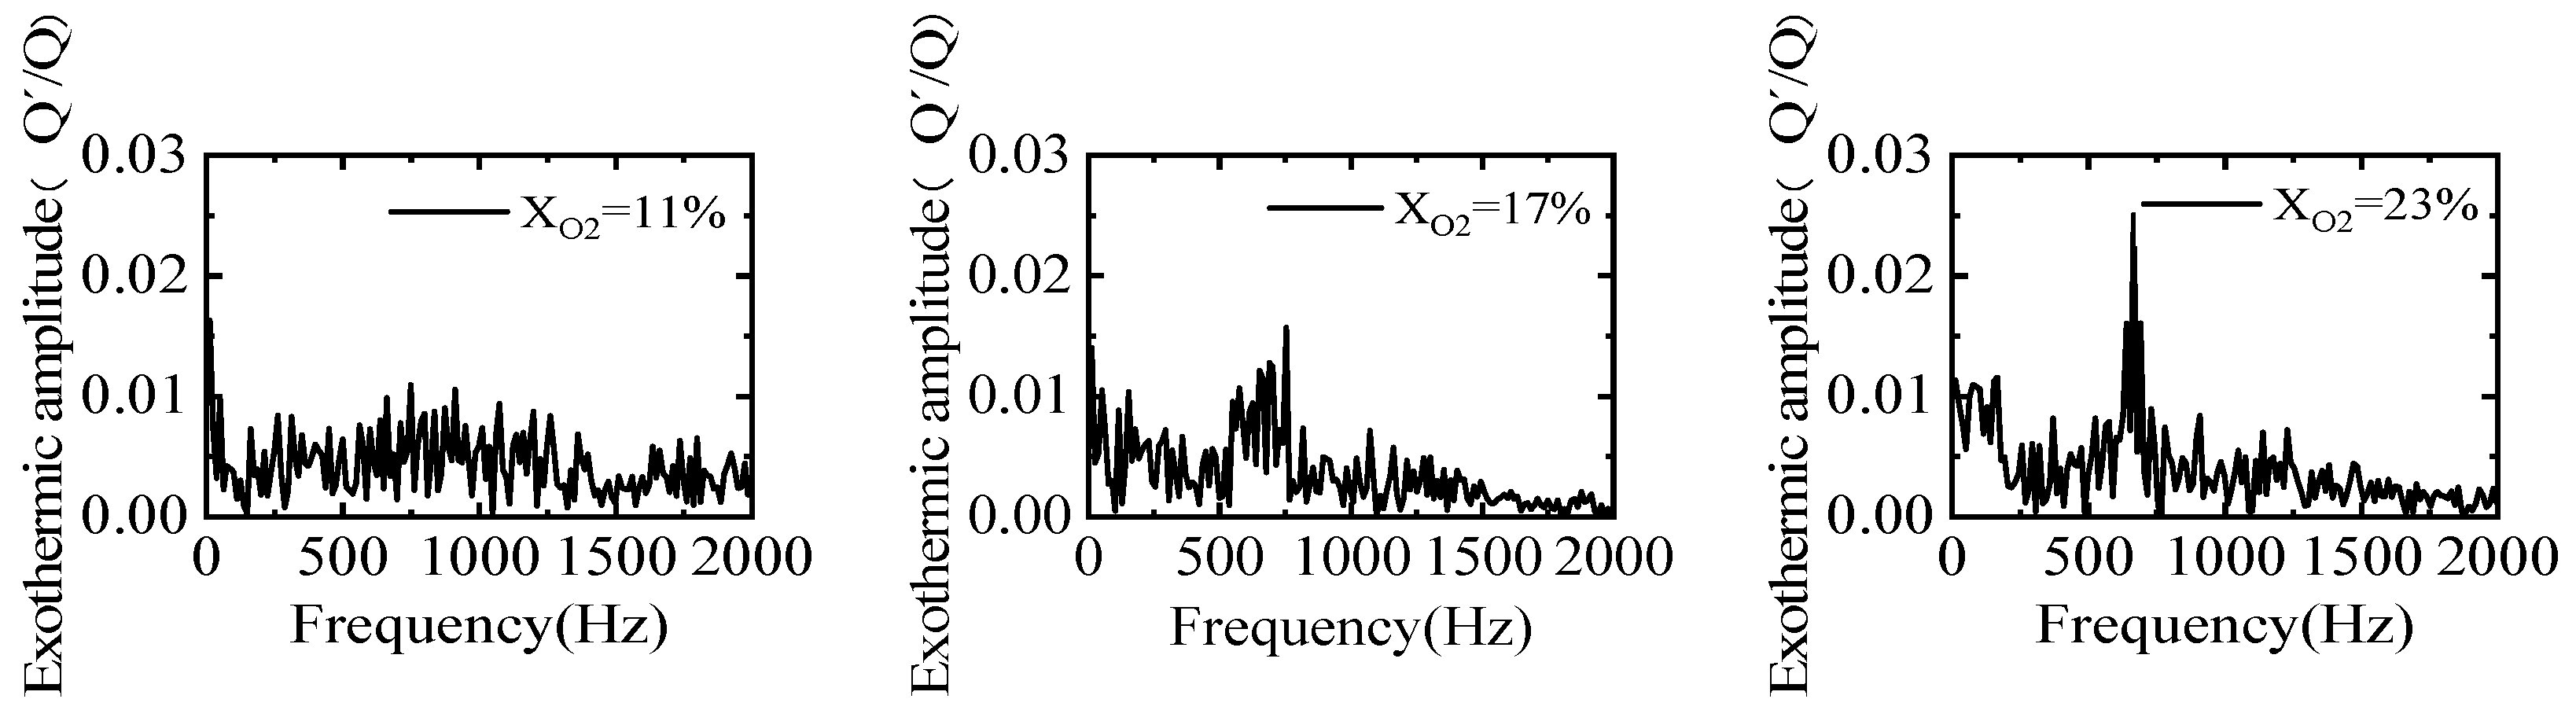
3.2. Spectrum Analysis
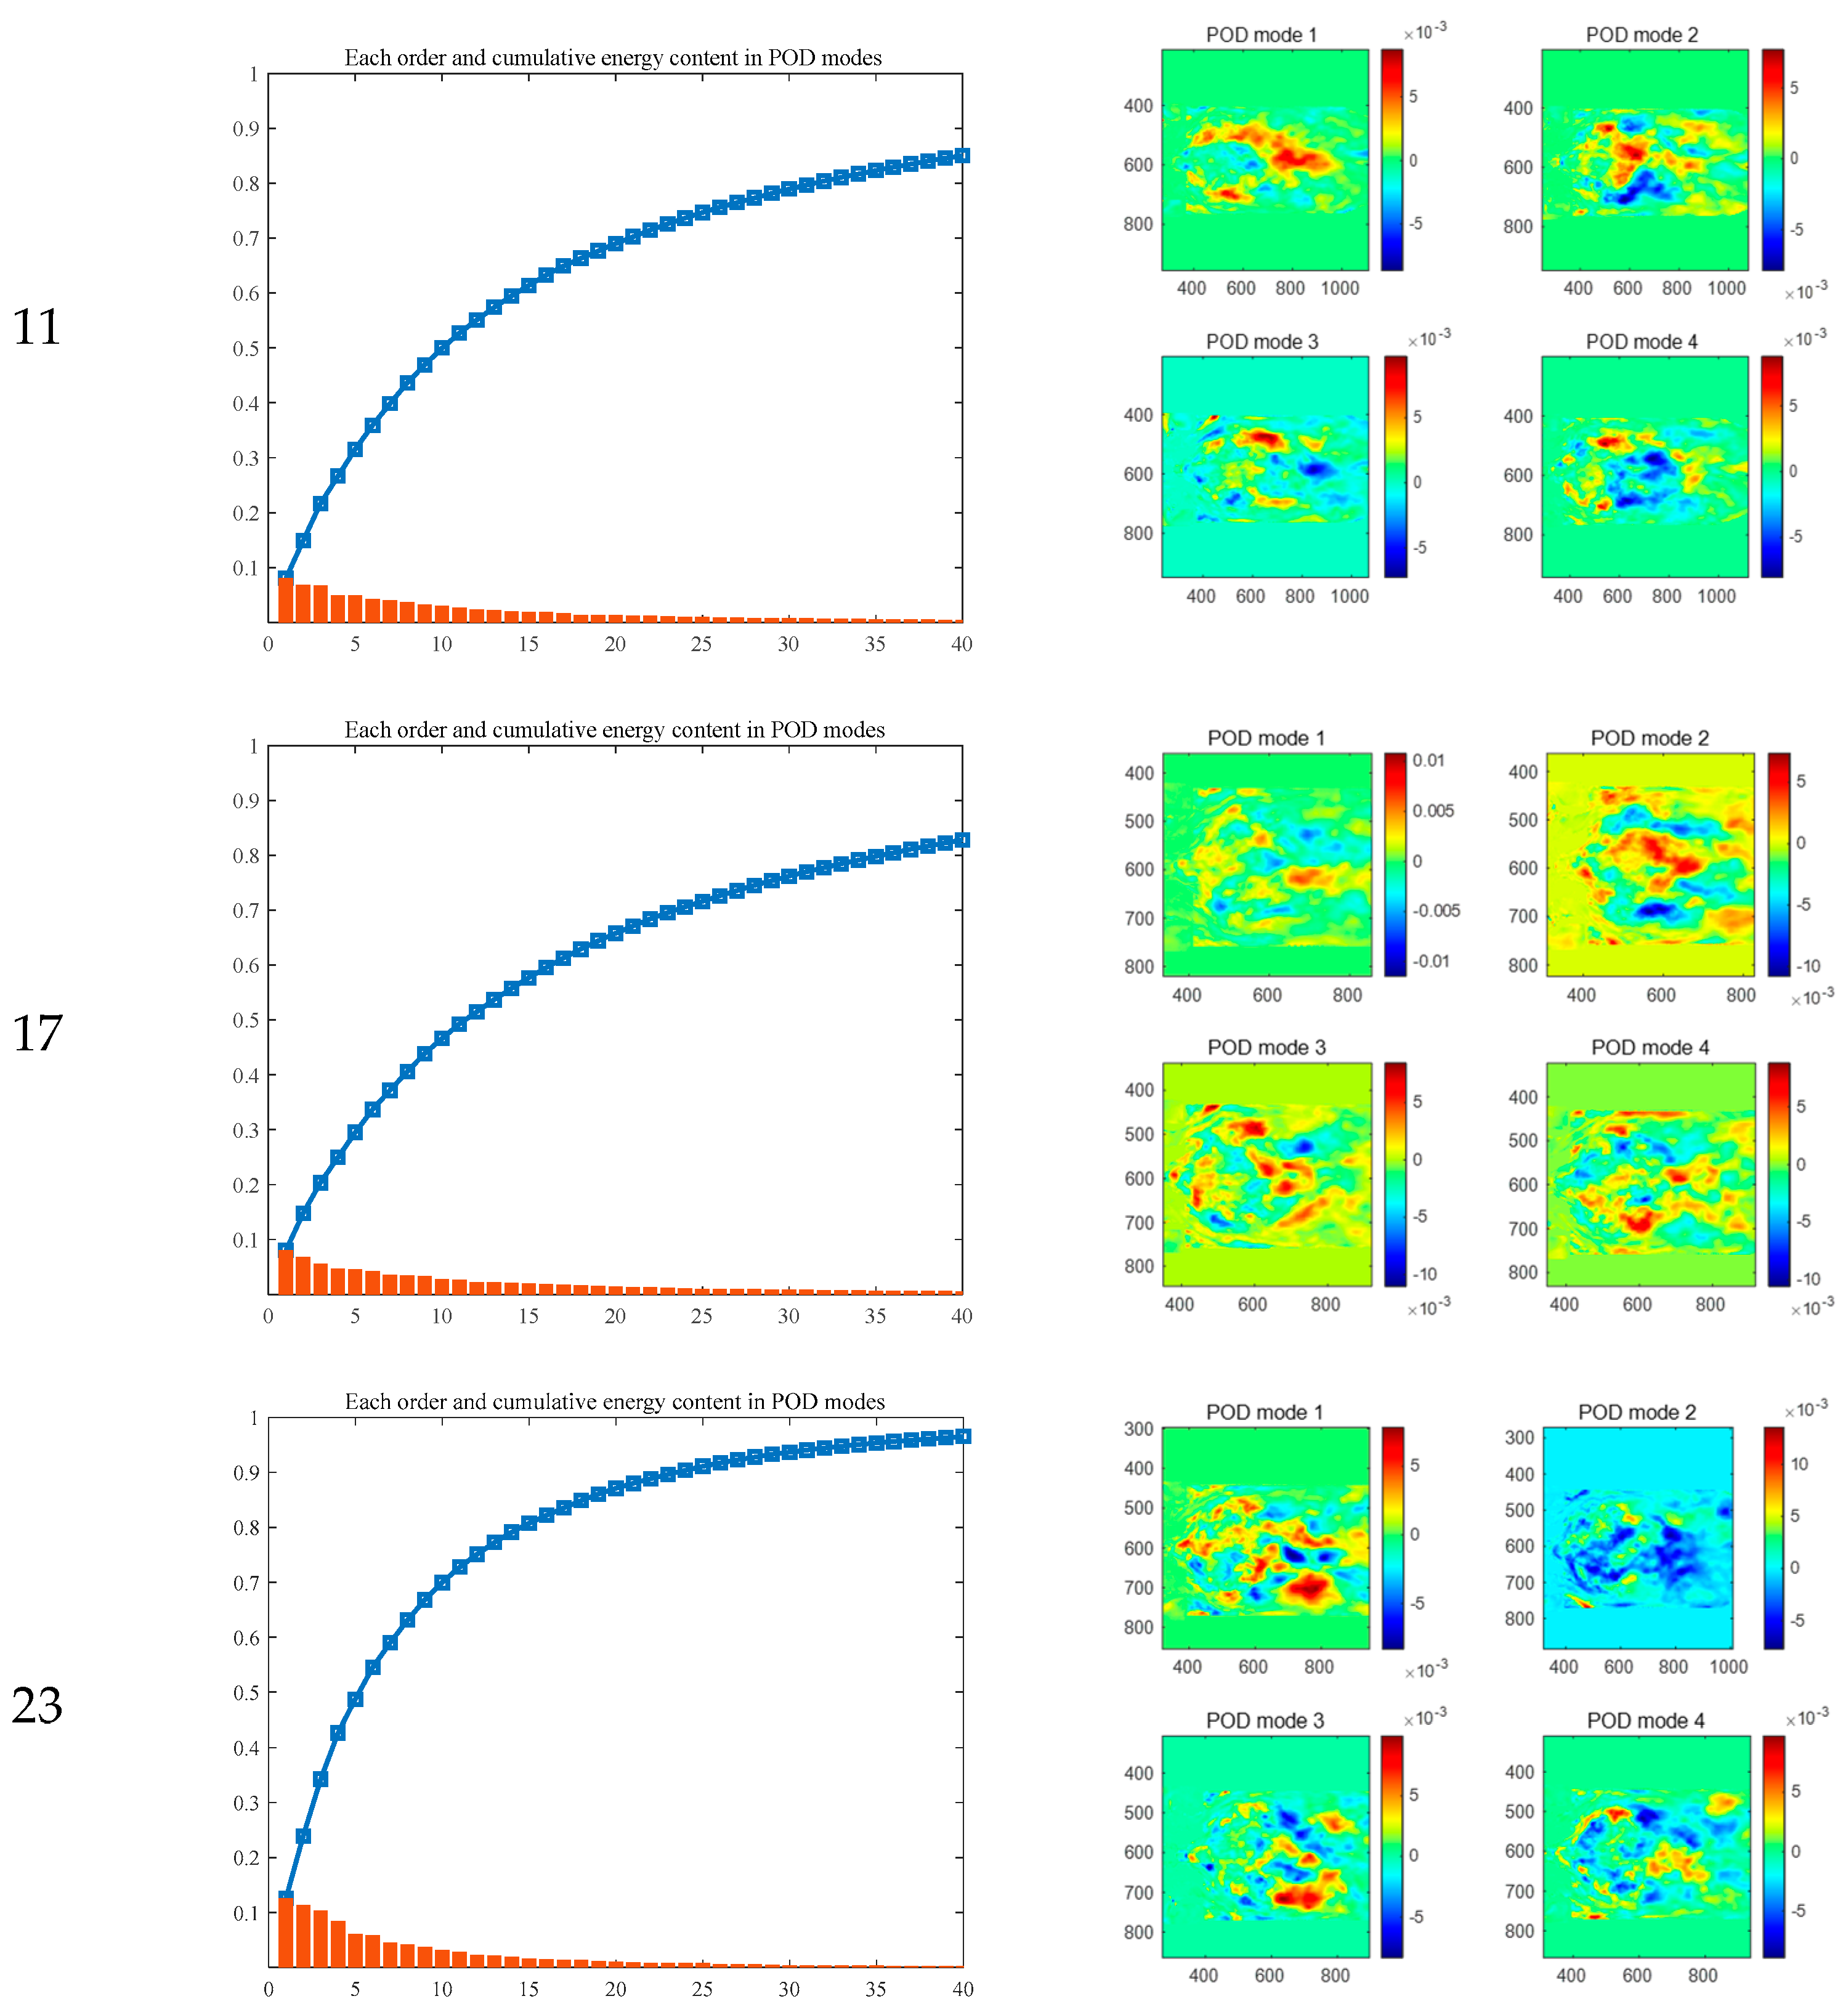
Figure 8 and Figure 9 present the fast Fourier transform (FFT) variation results of the normalized pressure pulsation distribution and the heat release rate pulsation distribution, respectively, for different oxygen contents. From Figure 8 and Figure 9, it can be inferred that there is a similar variation pattern and the same dominant frequency between pressure pulsation and heat release rate pulsation, indicating a coupling relationship between the two. The Rayleigh criterion states that if thermal release occurs in phase with pressure fluctuations, the oscillation persists, which has become a standard for the analysis of unstable flames. When the oxygen content is 11 wt%, there is no distinct dominant frequency for pressure and heat release pulsations, and the pressure oscillation amplitude remains almost consistently within 1 wt% of the combustion chamber pressure. This corresponds to the stable flow field observed in Figure 5, where at 11 wt% oxygen content, the vortex changes within the combustion chamber are slow, corresponding to lower pressure and heat release pulsation amplitudes in Figure 8 and Figure 9. As the oxygen content increases to 17 wt%, a dominant frequency of 753 Hz is observed for both pressure pulsation and heat release pulsation, with a slightly higher amplitude compared to the dominant frequency at 11 wt% oxygen content. The amplitude of the pressure pulsation is approximately 1.8% of the mean value, while the dominant frequency of the heat release pulsation is approximately 1.6% of the mean value. When the oxygen content continues to rise to 23 wt%, the dominant frequencies for both pressure pulsation and heat release pulsation remain the same at 665 Hz, with further increases in pulsation amplitudes. The amplitude of the pressure pulsation increases to 2.6%, and the amplitude of the heat release pulsation rises to 2.5%. In the low-frequency region, the heat release pulsation does not correspond exactly to the pressure pulsation, but in the higher frequency region above the dominant frequency, there is an approximate correspondence between the two. Observation of the amplitude of the heat release rate oscillation reveals that the oxygen content has a significant influence on the thermal release within the combustion chamber. There are periodic pulsations in thermal release drive pressure pulsations, leading to increasing amplitudes of pressure pulsations and exacerbating combustion instability.

3.3. POD Analysis

The POD method can decompose complex flow fields from an energetic perspective, with different modes corresponding to their respective energy contributions within the flow field. This makes POD highly suitable for analyzing the significance of different modes’ impact on the flow field. In this study, POD processing was applied to 1000 transient snapshots obtained from LES under varying oxygen contents. Figure 10 presents the energy contribution charts and mode distribution diagrams resulting from the POD decomposition of axial velocity at different oxygen contents. In the three charts on the left, the orange bar graphs represent the energy contribution of each mode. Specifically, when the oxygen content is 11 wt% and 17 wt%, the energy contribution of the first mode is less than 10%. However, at 23 wt% oxygen content, the energy contribution of the first mode increases to 12%. Additionally, the blue dotted lines in the charts indicate the cumulative energy contribution of the modes. For oxygen contents of 11 wt% and 17 wt%, the combined energy contribution of the first four modes is approximately 27%, while at 23 wt% oxygen content, this value rises to approximately 37%. The three charts on the right show the mode distribution diagrams corresponding to the three different oxygen contents. These diagrams reveal the presence of coherent structures through the observed modal shape distributions. All four modes suggest that the quasi-ordered structure of the single-burner swirling flow is asymmetric relative to the local coordinate axis. At an oxygen content of 11 wt%, the coherent structures in the first mode appear behind the shear layer and at the rear end of the recirculation zone, indicating greater fluctuations in the downstream section compared to the upstream section. The structure in the second mode corresponds to two symmetrical recirculation zone structures. At 17 wt% oxygen content, numerous small modal structures are present in the first mode, while the modal structure corresponding to the central recirculation zone still exists in the second mode. At 23 wt% oxygen content, where the energy contribution of the first mode is relatively high, smaller coherent structures are observed throughout the entire recirculation zone. Moreover, the modal structures in the second, third, and fourth modes are also dominated by smaller turbulent structures.

4. Conclusions

In this study, the LES method coupled with the FGM combustion model was utilized to investigate the dynamic characteristics of flames within a swirl-stabilized model combustor under varying oxygen contents ranging from 11 wt% to 23 wt%. The key findings are summarized as follows:
The presence of two centrally located, symmetrically distributed recirculation zones within the combustion chamber can be observed in different oxygen content. However, as the oxygen content increased, a gradual reduction in the size of the central recirculation zones was noted. This change could be attributed to the accelerated combustion reaction rates resulting from the increased oxygen levels, which subsequently altered the dynamic characteristics of the flow field.
With an increase in oxygen content, both pressure and heat release fluctuations exhibited an upward trend, accompanied by a coupling phenomenon. This indicated a more intense and unstable combustion process. Specifically, at an oxygen content of 17 wt%, a prominent pulsation frequency became apparent, suggesting the presence of specific flow structures or combustion instabilities within the combustion chamber. Furthermore, at 23 wt% oxygen content, while the amplitude of the dominant frequency continued to rise, it remained below 3%. This implied that despite the intensified combustion process, the structural design of the combustion chamber might have contributed to suppressing excessive oscillations and instabilities.
POD modal analysis provided insights into the varying trends of coherent structures within the flow field as oxygen content increased. The observed increase in the number of coherent structures, coupled with a reduction in their size, might reflect more complex flow patterns and smaller vortex structures during combustion. These changes could have direct implications for combustion efficiency, emission characteristics, and combustion stability.

Author Contributions

Study design and literature search, M.C.; data analysis and writing, X.H.; data collection an data analysis, Z.W.; data analysis and article modification, H.Z.; article analysis and modification, F.D. All authors have read and agreed to the published version of the manuscript.

Funding

The research is funded by the Heilongjiang Provincial Natural Science Foundation (LH2020E067), the National Science and Technology Major Project (2017-III-0006-0031), and the Hong Kong Scholars Program.

Institutional Review Board Statement

Not applicable.

Informed Consent Statement

Not applicable.

Data Availability Statement

The data that support the findings of this study are available from the corresponding author upon reasonable request.

Conflicts of Interest

The authors declare no conflicts of interest.

References

  1. Prashanth, P.; Speth, R.L.; Eastham, S.D.; Sabnis, J.S.; Barrett, S.R.H. Post-combustion emissions control in aero-gas turbine engines. Energy Environ. Sci. 2021, 14, 916–930. [Google Scholar] [CrossRef]
  2. Cecere, D.; Giacomazzi, E.; Di Nardo, A.; Calchetti, G. Gas turbine combustion technologies for hydrogen blends. Energies 2023, 16, 6829. [Google Scholar] [CrossRef]
  3. Liu, Y.; Sun, X.; Sethi, V.; Nalianda, D.; Li, Y.-G.; Wang, L. Review of modern low emissions combustion technologies for aero gas turbine engines. Prog. Aerosp. Sci. 2017, 94, 12–45. [Google Scholar] [CrossRef]
  4. Zhang, F.; Lei, F.; Feng, M.; Liao, G.; Jiaqiang, E. Investigation on the effect of the cooler design on the performance of onboard supercritical carbon dioxide power cycle for hypersonic vehicles. Appl. Therm. Eng. 2024, 236, 121854. [Google Scholar] [CrossRef]
  5. Khosravy el_Hossaini, M. Review of the new combustion technologies in modern gas turbines. Prog. Gas Turbine Perform. 2013, 953–978. [Google Scholar] [CrossRef]
  6. Arghode, V.K.; Gupta, A.K. Development of high intensity CDC combustor for gas turbine engines. Appl. Energy 2011, 88, 963–973. [Google Scholar] [CrossRef]
  7. Adamou, A.; Costall, A.; Turner, J.W.; Jones, A.; Copeland, C. Experimental performance and emissions of additively manufactured high-temperature combustion chambers for micro-gas turbines. Int. J. Engine Res. 2023, 24, 1273–1289. [Google Scholar] [CrossRef]
  8. Sadykova, S.B.; Dostiyarov, A.M.; Zhumagulov, M.G.; Kartjanov, N.R. Influence of turbulence on the efficiency and reliability of combustion chamber of the gas turbine. Therm. Sci. 2021, 25, 4321–4332. [Google Scholar] [CrossRef]
  9. Feng, M.; Dai, X.; Zhang, F.; Liao, G.; Jiaqiang, E. Numerical investigation on film cooling and aerodynamic performance for gas turbine endwalls with upstream vane-type and cascade-type slots. Aerosp. Sci. Technol. 2024, 145, 108857. [Google Scholar] [CrossRef]
  10. Srinivasan, S.; Ranjan, R.; Menon, S. Flame dynamics during combustion instability in a high-pressure, shear-coaxial injector combustor. Flow Turbul. Combust. 2015, 94, 237–262. [Google Scholar] [CrossRef]
  11. Cheng, Y.; Jin, T.; Luo, K.; Li, Z.; Wang, H.; Fan, J. Large eddy simulations of spray combustion instability in an aero-engine combustor at elevated temperature and pressure. Aerosp. Sci. Technol. 2021, 108, 106329. [Google Scholar] [CrossRef]
  12. Hashim, M.Y.; Bae, J.; Lee, J. Experimental and numerical studies of the effects of the contraction ratios on the swirling flow characteristics of the model combustor outlet in lean gas turbines. Appl. Therm. Eng. 2023, 218, 119371. [Google Scholar] [CrossRef]
  13. Nam, J.; Yoh, J.J. A numerical investigation of the effects of hydrogen addition on combustion instability inside a partially-premixed swirl combustor. Appl. Therm. Eng. 2020, 176, 115478. [Google Scholar] [CrossRef]
  14. Chen, Z.X.; Swaminathan, N.; Mazur, M.; Worth, N.A.; Zhang, G.; Li, L. Numerical investigation of azimuthal thermoacoustic instability in a gas turbine model combustor. Fuel 2023, 339, 127405. [Google Scholar] [CrossRef]
  15. Deng, F.; Huang, X.; Cheng, S.; Zhang, Y.; Huang, Z.; Tang, H.; Zheng, H.; Xiao, L. Experimental and modeling study of NO2 addition effects on autoignition behavior of propylene. Combust. Flame 2024, 262, 113371. [Google Scholar] [CrossRef]
  16. Zhou, L.; Zhu, Q.; Tse, K.; Ning, X.; Ai, Y.; Zhang, H. Flow pattern-and forces-susceptibility to small attack angles for a rectangular cylinder. Ocean. Eng. 2024, 300, 117376. [Google Scholar] [CrossRef]
  17. Liu, Z.; Zhou, L.; Tang, H.; Wang, Z.; Zhao, F.; Ji, X.; Zhang, H. Primary instability, sensitivity and active control of flow past two tandem circular cylinders. Ocean. Eng. 2024, 294, 116863. [Google Scholar] [CrossRef]
  18. Bai, X.; Cheng, P.; Li, Q.; Sheng, L.; Kang, Z. Effects of self-pulsation on combustion instability in a liquid rocket engine. Exp. Therm. Fluid Sci. 2020, 114, 110038. [Google Scholar] [CrossRef]
  19. Li, F.; Xu, L.; Yang, L.; Cao, Z. Experimental characterization of self-excited combustion pulsation in a thermoacoustic combustor. Fuel 2023, 334, 126423. [Google Scholar] [CrossRef]
  20. Valiev, D.M.; Zhu, M.; Bansal, G.; Kolla, H.; Law, C.K.; Chen, J.H. Pulsating instability of externally forced premixed counterflow flame. Combust. Flame 2013, 160, 285–294. [Google Scholar] [CrossRef]
  21. Deng, F.; Zhao, M.; Qin, S.; Wang, Z.; Xie, Y.; Zheng, H.; Liu, X.; Zhang, F. Numerical Simulation Study on the Dynamics of Bluff-Body Flames under Oxygen-Lean Conditions. Energies 2023, 17, 142. [Google Scholar] [CrossRef]
  22. Du, D.; He, E.; Huang, D.; Wang, G. Intense vibration mechanism analysis and vibration control technology for the combustion chamber of a liquid rocket engine. J. Sound Vib. 2018, 437, 53–67. [Google Scholar] [CrossRef]
  23. Poinsot, T. Prediction and control of combustion instabilities in real engines. Proc. Combust. Inst. 2017, 36, 1–28. [Google Scholar] [CrossRef]
  24. Can Altunlu, A.; van der Hoogt, P.J.; de Boer, A. Sensitivity of combustion driven structural dynamics and damage to thermo-acoustic instability: Combustion-acoustics-vibration. J. Eng. Gas Turbines Power 2014, 136, 051501. [Google Scholar] [CrossRef]
  25. Yilmaz, I.; Alabaş, B.; Taştan, M.; Tunç, G. Effect of oxygen enrichment on the flame stability and emissions during biogas combustion: An experimental study. Fuel 2020, 280, 118703. [Google Scholar] [CrossRef]
  26. Habib, M.A.; Nemitallah, M.A.; Ahmed, P.; Sharqawy, M.H.; Badr, H.M.; Muhammad, I.; Yaqub, M. Experimental analysis of oxygen-methane combustion inside a gas turbine reactor under various operating conditions. Energy 2015, 86, 105–114. [Google Scholar] [CrossRef]
  27. Rao, Z.; Li, R.; Zhang, B.; Wang, B.; Zhao, D.; Akhtar, M.S. Experimental investigations of equivalence ratio effect on nonlinear dynamics features in premixed swirl-stabilized combustor. Aerosp. Sci. Technol. 2021, 112, 106601. [Google Scholar] [CrossRef]
  28. Devi, S.; Sahoo, N.; Muthukumar, P. Experimental studies on biogas combustion in a novel double layer inert Porous Radiant Burner. Renew. Energy 2020, 149, 1040–1052. [Google Scholar] [CrossRef]
  29. Kutne, P.; Kapadia, B.K.; Meier, W.; Aigner, M. Experimental analysis of the combustion behaviour of oxyfuel flames in a gas turbine model combustor. Proc. Combust. Inst. 2011, 33, 3383–3390. [Google Scholar] [CrossRef]
  30. De Santis, A.; Ingham, D.B.; Ma, L.; Pourkashanian, M. CFD analysis of exhaust gas recirculation in a micro gas turbine combustor for CO2 capture. Fuel 2016, 173, 146–154. [Google Scholar] [CrossRef]
  31. Herraiz, L.; Fernández, E.S.; Palfi, E.; Lucquiaud, M. Selective exhaust gas recirculation in combined cycle gas turbine power plants with post-combustion CO2 capture. Int. J. Greenh. Gas Control 2018, 71, 303–321. [Google Scholar] [CrossRef]
  32. Belaissaoui, B.; Cabot, G.; Cabot, M.-S.; Willson, D.; Favre, E. An energetic analysis of CO2 capture on a gas turbine combining flue gas recirculation and membrane separation. Energy 2012, 38, 167–175. [Google Scholar] [CrossRef]
  33. Ditaranto, M.; Heggset, T.; Berstad, D. Concept of hydrogen fired gas turbine cycle with exhaust gas recirculation: Assessment of process performance. Energy 2020, 192, 116646. [Google Scholar] [CrossRef]
  34. Liuzzo, G.; Verdone, N.; Bravi, M. The benefits of flue gas recirculation in waste incineration. Waste Manag. 2007, 27, 106–116. [Google Scholar] [CrossRef] [PubMed]
  35. Kim, H.K.; Kim, Y.; Lee, S.M.; Ahn, K.Y. NO reduction in 0.03–0.2 MW oxy-fuel combustor using flue gas recirculation technology. Proc. Combust. Inst. 2007, 31, 3377–3384. [Google Scholar] [CrossRef]
  36. Guethe, F.; de la Cruz Garci’a, M.; Burdet, A. Flue gas recirculation in gas turbine: Investigation of combustion reactivity and NOx emission. In Proceedings of the Turbo Expo: Power for Land, Sea, and Air, Orlando, FL, USA, 8–12 June 2009; pp. 179–191. [Google Scholar]
  37. Pan, D.; Zhu, T.; Ji, C.; Ke, E. Effects of flue gas recirculation on self-excited combustion instability and NOx emission of a premixed flame. Therm. Sci. Eng. Prog. 2022, 30, 101252. [Google Scholar] [CrossRef]
  38. Røkke, P.; Hustad, J. Exhaust gas recirculation in gas turbines for reduction of CO2 emissions; combustion testing with focus on stability and emissions. Int. J. Thermodyn. 2005, 8, 167–173. [Google Scholar]
  39. Cha, J.; Kwon, J.; Cho, Y.; Park, S. The effect of exhaust gas recirculation (EGR) on combustion stability, engine performance and exhaust emissions in a gasoline engine. KSME Int. J. 2001, 15, 1442–1450. [Google Scholar] [CrossRef]
  40. Pope, S.B. Turbulent flows. Meas. Sci. Technol. 2001, 12, 2020–2021. [Google Scholar] [CrossRef]
  41. Shur, M.L.; Spalart, P.R.; Strelets, M.K.; Travin, A.K. A hybrid RANS-LES approach with delayed-DES and wall-modelled LES capabilities. Int. J. Heat Fluid Flow 2008, 29, 1638–1649. [Google Scholar] [CrossRef]
  42. Moin, P.; Ferziger, J. Model consistency in the large eddy simulation of turbulent channel flows. In Proceedings of the 19th AIAA, Fluid Dynamics, Plasma Dynamics, and Lasers Conference, Honolulu, HI, USA, 8–10 June 1987; p. 1446. [Google Scholar]
  43. Cordier, L.; Bergmann, M. Post-Processing of Experimental and Numerical Data; von Karman Institute for Fluid Dynamics: Sint-Genesius-Rode, Belgium, 2003; Volume 3. [Google Scholar]
  44. Holmes, P. Turbulence, Coherent Structures, Dynamical Systems and Symmetry; Cambridge University Press: Cambridge, UK, 2012. [Google Scholar]
  45. Chatterjee, A. An introduction to the proper orthogonal decomposition. Curr. Sci. 2000, 78, 808–817. [Google Scholar]
  46. Liu, K.; Haworth, D.C. Development and Assessment of POD for Analysis of Turbulent Flow in Piston Engines; 0148-7191; SAE Technical Paper; SAE International: Warrendale, PA, USA, 2011. [Google Scholar]
  47. Cai, J.; Jeng, S.-M.; Tacina, R. The structure of a swirl-stabilized reacting spray issued from an axial swirler. In Proceedings of the 43rd AIAA Aerospace Sciences Meeting and Exhibit, Reno, NV, USA, 10–13 January 2005; p. 1424. [Google Scholar]
  48. Kundu, K.; Penko, P.; VanOverbeke, T. A practical kinetic mechanism for computing combustion in gas turbine engines. In Proceedings of the 35th Joint Propulsion Conference and Exhibit, Los Angeles, CA, USA, 20–24 June 1999; p. 2218. [Google Scholar]
Figure 1. Schematic diagram of the structure of the classifying swirl. (a) Schematic diagram of the model combustion chamber structure; (b) Schematic diagram of the swirl structure.
Jmse 12 00621 g001
Figure 2. Schematic diagram of the computational domain grid for the combustion chamber of the hierarchical cyclone model. (a) Schematic of the surface grid; (b) Schematic diagram of the swirl grid; (c) Schematic diagram of the computational domain body mesh.
Jmse 12 00621 g002
Figure 3. Verification of mesh irrelevance for non–constant numerical simulations (The slope of the red line is −5/3). (a) Shear layer positional velocity energy spectrum; (b) velocity energy spectrum at the core of the refugium.
Jmse 12 00621 g003
Figure 4. Profiles of time–averaged mean axial velocity at Z = 29 mm, 46 mm, and 76 mm in (a) no–reacting conditions and (b) reacting conditions. Symbols: experiments, black line: LES.
Jmse 12 00621 g004aJmse 12 00621 g004b
Figure 5. The time−averaged images of (a) axial velocity profiles, (b) temperature (left), and OH (right) fields for different oxygen content.
Jmse 12 00621 g005
Figure 6. OH radical distribution at different oxygen contents in an oscillation period.
Jmse 12 00621 g006
Figure 7. Temperature distribution isobars of different oxygen contents in an oscillation period.
Jmse 12 00621 g007
Figure 8. The FFT variation results of the normalized pressure pulsation distribution at different oxygen contents.
Jmse 12 00621 g008
Figure 9. The FFT variation results of the normalized exothermic amplitude distribution at different oxygen contents.
Jmse 12 00621 g009
Figure 10. Energy distribution for the first 40 velocity oscillation modes and modal energy proportions at different oxygen content. (The orange bar graphs: the energy contribution of each mode, the blue dotted lines: the cumulative energy contribution of the modes).
Jmse 12 00621 g010
Table 1. Operating conditions to investigate the effect of oxygen content on the combustion performance of the swirl combustor.
Pressure (Pa)Temperature (K)Oxygen Content (wt%)Equivalence Ratio
Case11.01 × 106770110.36
Case21.01 × 106770170.36
Case31.01 × 106770230.36
Disclaimer/Publisher’s Note: The statements, opinions and data contained in all publications are solely those of the individual author(s) and contributor(s) and not of MDPI and/or the editor(s). MDPI and/or the editor(s) disclaim responsibility for any injury to people or property resulting from any ideas, methods, instructions or products referred to in the content.

