1. Introduction
Sea waves are one of the maximum loads in the ocean, and all marine structures encounter sea waves all the time. Studying waves, especially wave elevation, can help analyze these structures’ motions effectively. For example, the ship motion quiescent period prediction has been an attractive topic in recent years, which includes three aspects: the measurement of the wave field, the prediction of the wave propagating, and ship motion prediction. The wave elevation should be determined first to predict the ship’s motion for tens of seconds ahead or to estimate whether the ship will be in proper operating condition in the next tens of seconds. Furthermore, the expected wave elevation provides the main input to the warning of approaching unsafe relative motions between the vessel and the rig. Wave elevation prediction has numerous applications in [
1,
2,
3,
4,
5,
6,
7,
8].
Measuring the wave elevation is the preparation for wave prediction. Many measurement technologies have been developed to help measure the wave elevation or wave fields, such as X-band radar [
9], and LIDAR [
10,
11,
12]. Another direct measurement device is the wave buoy, which measures the wave elevation by the reaction between the waves and mooring system [
13,
14]. Through the analysis of the wave observation data, the sea surface is always described as a stochastic process, and some researchers studied its statistical or spectral properties [
15,
16,
17]. For long-term statistical wave prediction, these models can provide accurate significant wave height, the average period, and other statistical values. However, it is difficult to provide refined wave elevation at fixed points in space.
As the demand for accurate wave prediction grows for a variety of offshore operations, the deterministic sea wave prediction (DSWP) based on the phase-resolved prediction method has gradually become the key research field. Corresponding phase-resolved wave simulation models have also been developed, such as the linear wave theory (LWT), the Higher Order Spectral (HOS) theory [
18], the Boussinesq equation [
19,
20,
21,
22,
23,
24], the Green-Naghdi (GN) model [
25] and others. These wave models have been continuously refined in recent years and have been widely applied. Dutykh and Dias introduced viscous effects into the Boussinesq equation and conducted a detailed analysis of the viscous potential free surface flows in a fluid layer of finite depth in 2007 [
19,
20]. Dutykh further proposed a new modeling method for viscous potential free surface flow and analyzed in detail the phase and group velocities resulting from the presence of boundary layers in 2009 [
21,
22]. The supplementation of these theories is of significant importance for enhancing the accuracy of wave simulation in practical scenarios. Meanwhile, Gao et al., taking the harbor as the research subject, employed the Boussinesq equation to conduct detailed analyses of the interactions between focused transient wave groups and the harbor, as well as Bragg resonance reflection, in 2020 and 2021, respectively [
23,
24]. This has provided a high reference value for the application of the Boussinesq equation in coastal engineering.
As the complexity of wave models increases, in pursuit of more precise simulation results for wave surfaces, Computational Fluid Dynamics (CFD) methods have gradually evolved, including Smoothed Particle Hydrodynamics (SPH) [
26], Finite Volume Method (FVM) [
27], and others. Gao et al. carried out the research on the transient gap resonance with consideration of the motion of floating body by using OpenFOAM [
28] and Gong et al. simulated the transient fluid resonance phenomenon within the narrow gap between two adjacent boxes, which is excited by incident-focused waves with various spectral peak periods and focused wave amplitudes [
29]. These cases demonstrate the good effectiveness of CFD methods in the application of refined flow field and wave field simulation. However, certain boundary conditions can be easily implemented in numerical simulations, yet they are challenging to ascertain in the actual ocean.
Combining the wave model with wave measurement data is an effective method for deterministic wave prediction in real time [
30,
31]. This method firstly extracts effective wave information from the measured data, such as the frequency and amplitude of wave components. Combining the decomposed wave information with the wave propagation model can achieve the wave reconstruction and prediction in the time–space domain. The linear and nonlinear wave propagation model can be selected according to the designed sea conditions [
32,
33,
34,
35,
36]. Generally, the nonlinear wave models showed better performance with wave prediction results. However, the computation time also needs to be considered in the wave short-term prediction.
In the process of wave reconstruction and prediction, determining the spatial–temporal predictable zone is a major problem in DSWP. Halliday et al. studied the short-term prediction of sea wave behavior employing the Fast Fourier Transform (FFT) method. They found that the predictable time was limited by the measurement time of wave elevation [
1]. However, no method for determining the predictable time was given. Wu studied the predictability of the wave propagation using linear and nonlinear wave models [
17]. And this study developed a multi-point measured prediction model aiming to address the limitations of the single-point prediction model. The recent study on DSWP by Naaijen et al. focused on whether the phase or group velocity can indicate the predictable time [
37]. They calculated the predictable zone by assessing the energy variation of propagating waves, preliminarily verifying the feasibility of using group velocity as the wave propagation speed but did not provide corresponding theoretical support. Meanwhile, there are many influencing factors for the predictable time for long crest waves, but there are few studies that mention this problem. Edgar et al. [
2] considered the maximum predictable time and distances due to the length of the measurement time, water depth and spectral width. Halliday et al. calculated the errors of the FFT-based prediction method at different prediction distances under various wind speeds but did not provide an analysis or explanation of the impact of wind speed on the predictable domain [
1]. In conclusion, the selection of propagation velocity is still one of the main problems and the effect of environmental factors needs to be further discussed in DSWP.
In response to the aforementioned issues, this paper firstly presents the reason for selecting group velocity during the wave propagation process using the Taylor expansion of wave numbers, which can provide a theoretical analysis foundation for subsequent related research. Subsequently, this paper conducts a detailed analysis of the consistent zone in time at a fixed point, the consistent zone in space at a specified time, and consistent zone in spacetime, based on the simulated data. Furthermore, this paper carries out the experimental validation and analysis in water tanks. Eventually, catering to the practical engineering application needs, the paper explores and summarizes the predictable time zone of long crest waves under different environmental conditions. We employed different wave spectrums to analyze the impact of factors such as wind speed, water depth, and sea state on the predictable domain, which can offer significant guidance for related marine operations. The rest of this paper is organized as follows: In
Section 2, the long-crested wave propagation model is introduced briefly. In
Section 3, the consistent zone of the long-crested wave propagation is investigated. The detailed analysis are carried out in
Section 4. In
Section 5, the water tank experiment is implemented to verify the calculation results. In
Section 6, a detailed analysis of the factors affecting the predictable time zone is conducted. Finally, discussions and conclusions are explained in
Section 7.
4. Calculation Results Based on Simulated Wave Data
In this section, the irregular waves are simulated to test the accuracy of the statement that group velocity is propagation velocity. The “Original” labeled in the figures means the results generated by the Pierson–Moskowitz spectrum, and “Calculated” means the results calculated via the FFT method. A 12 m/s Pierson–Moskowitz spectrum, in the range of 0–0.5 Hz and with 256 vectors, was used as the input.
S(
ω) can be written as follows:
Measurements of the time length of 1200 s with 4096 samples were used to generate the wave elevation at the original location
x = 0. The variable measurement time
T and the suggested minimum number of
N samples were introduced by Halliday et al. [
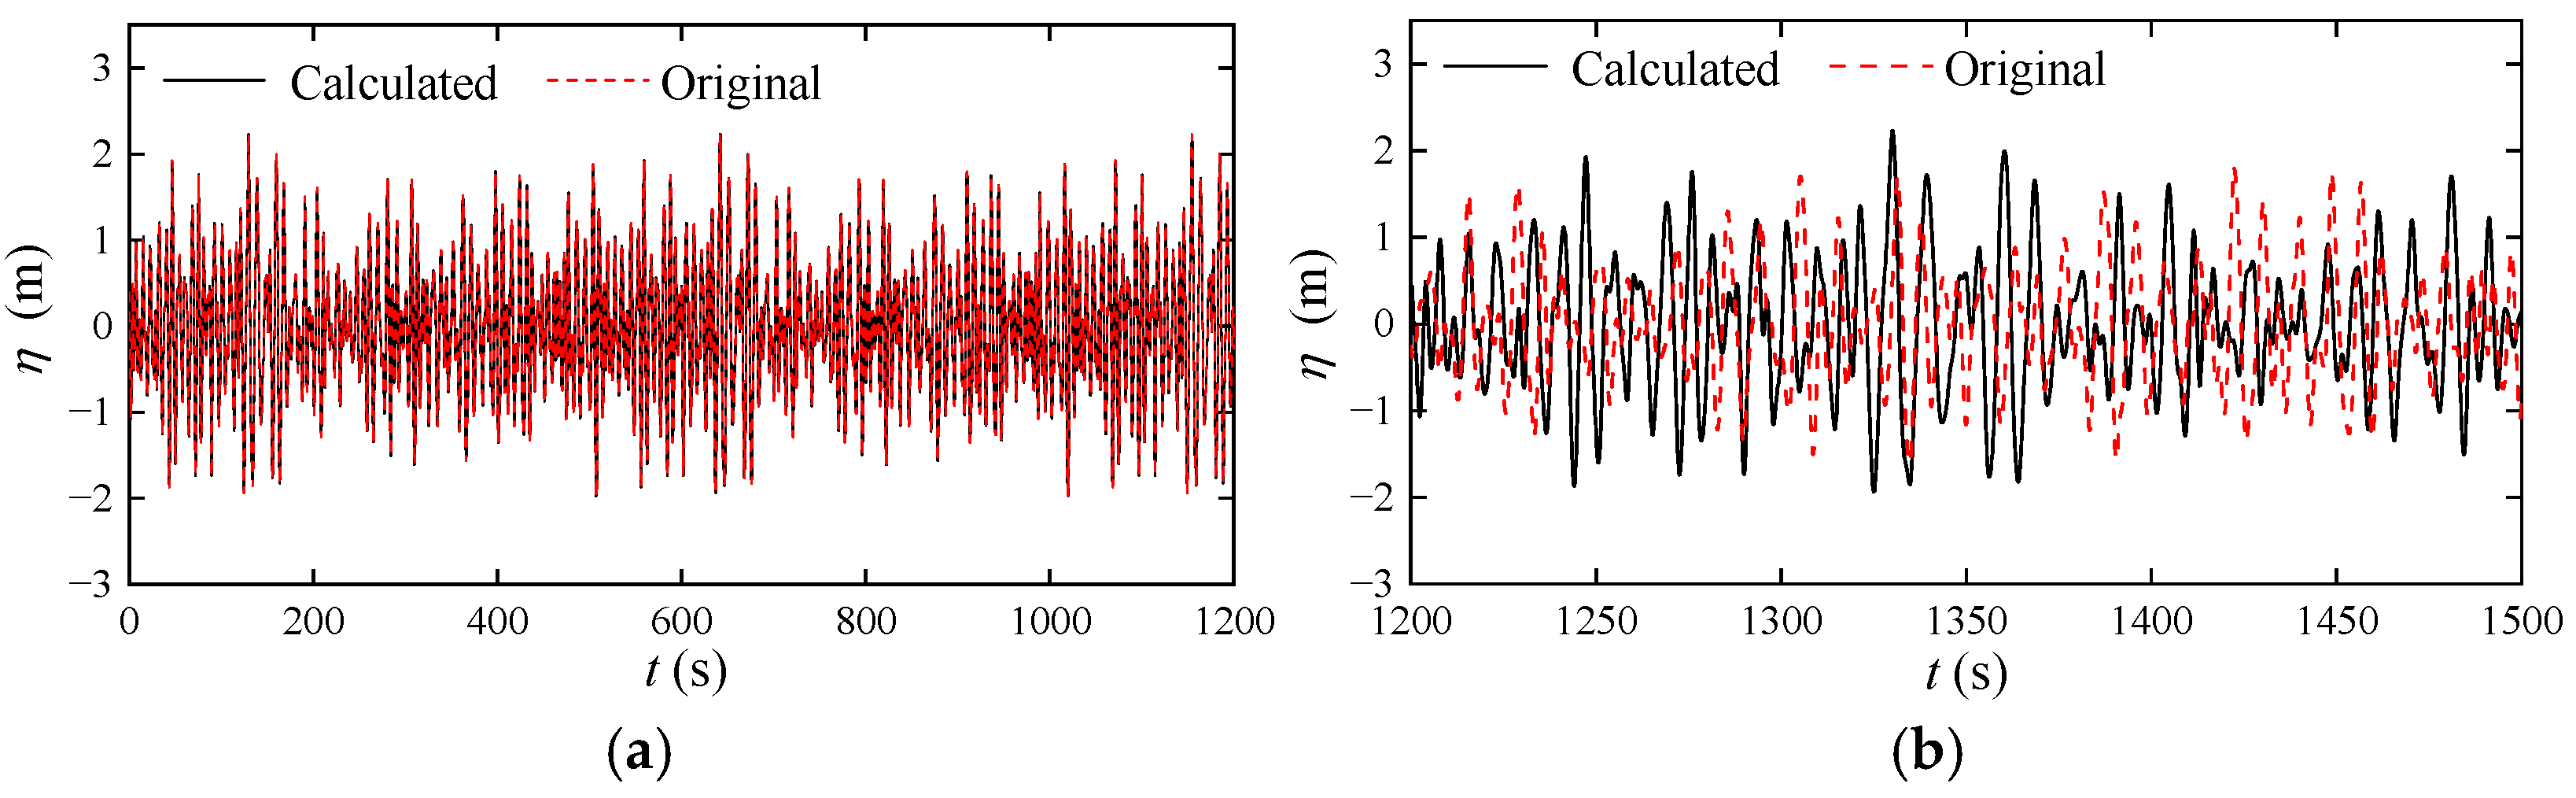
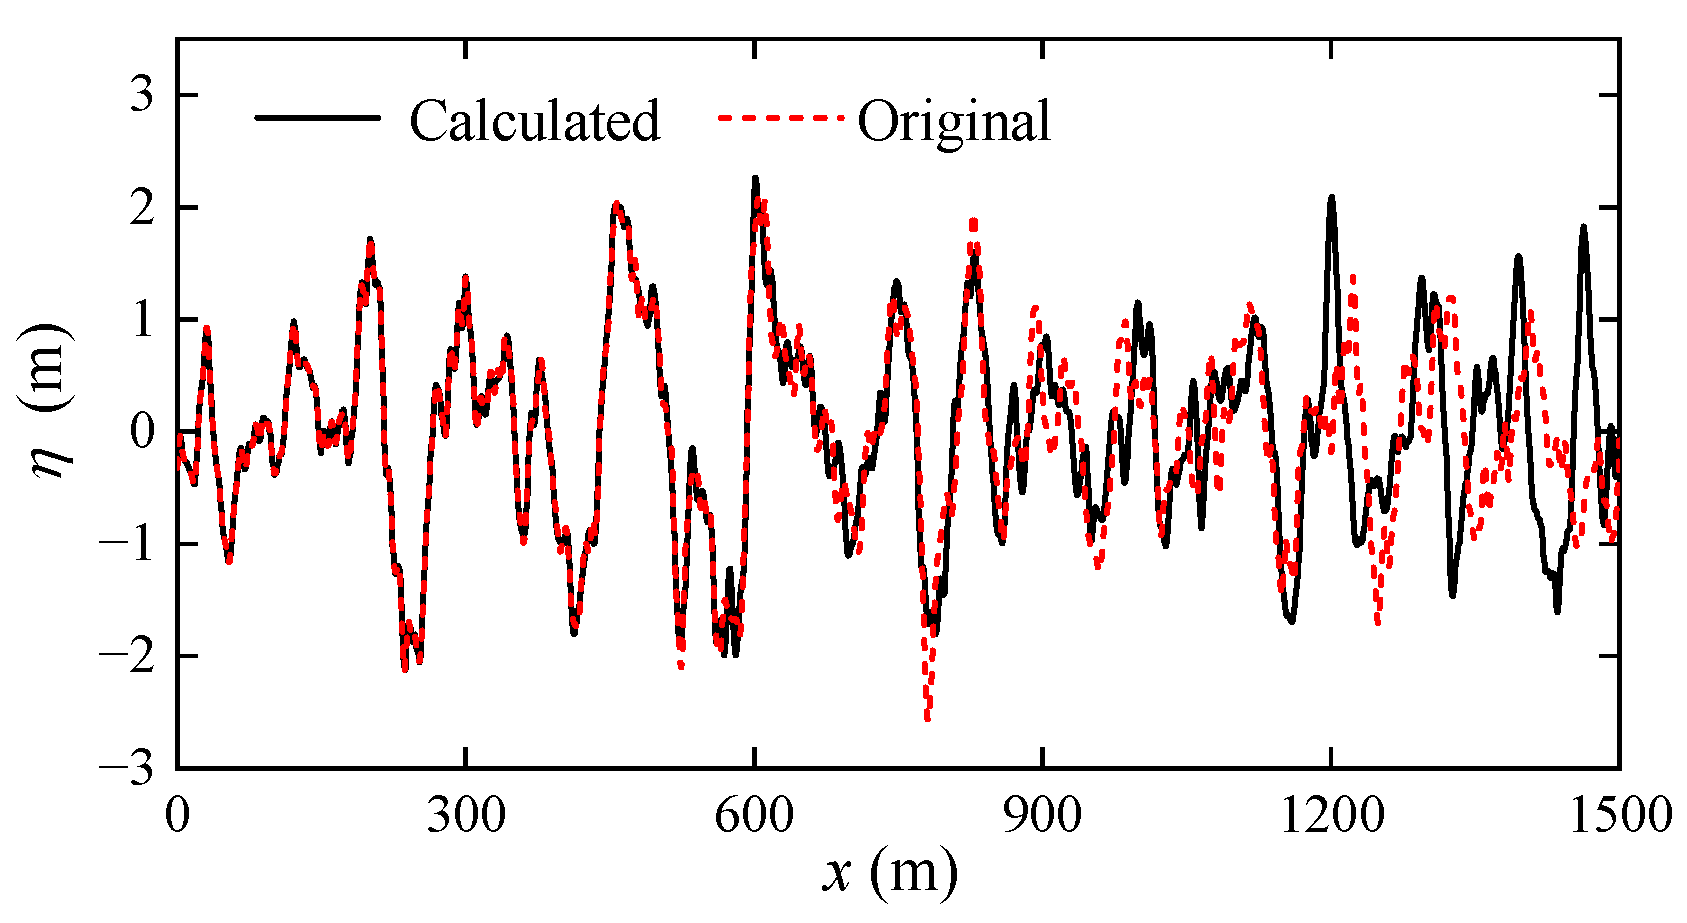
1]. The comparison of the reconstructed and original wave surface from 0 to 1500 s is shown in
Figure 1. To provide detailed comparison results in different time ranges, the computational results are divided into two parts, corresponding to
Figure 1a for the 0–1200 s and
Figure 1b for the 1200–1500 s.
From
Figure 1a, it can be seen that the reconstructed wave surface maintains a good trend of variation in comparison with the original wave surface. However, as shown in
Figure 1b, when the calculation time exceeds 1200 s, the calculated wave time history curve exhibits noticeable differences from the original wave surface in both amplitude and phase. To further analyze the prediction effect, this paper calculated the Root Mean Square Error (RMSE) for the time history segments of
Figure 1a,b, respectively. RMSE is one of the most commonly used errors to measure the degree of fit between time series and the formula is shown in Equation (17) [
39].
where
and
are the simulated wave elevation and the calculated wave elevation by FFT, respectively;
denotes the number of samples contained within the calculated time segment.
After calculation, the RMSE in
Figure 1a is 0.0026, while the RMSE in
Figure 1b is as high as 1.0636, which is far greater than the RMSE of
Figure 1a. This indicates that the predicted wave surface obtained through FFT transformation at this time has a lower accuracy, and the result is considered unacceptable.
4.1. Wave Surface Consistent Zone in Time
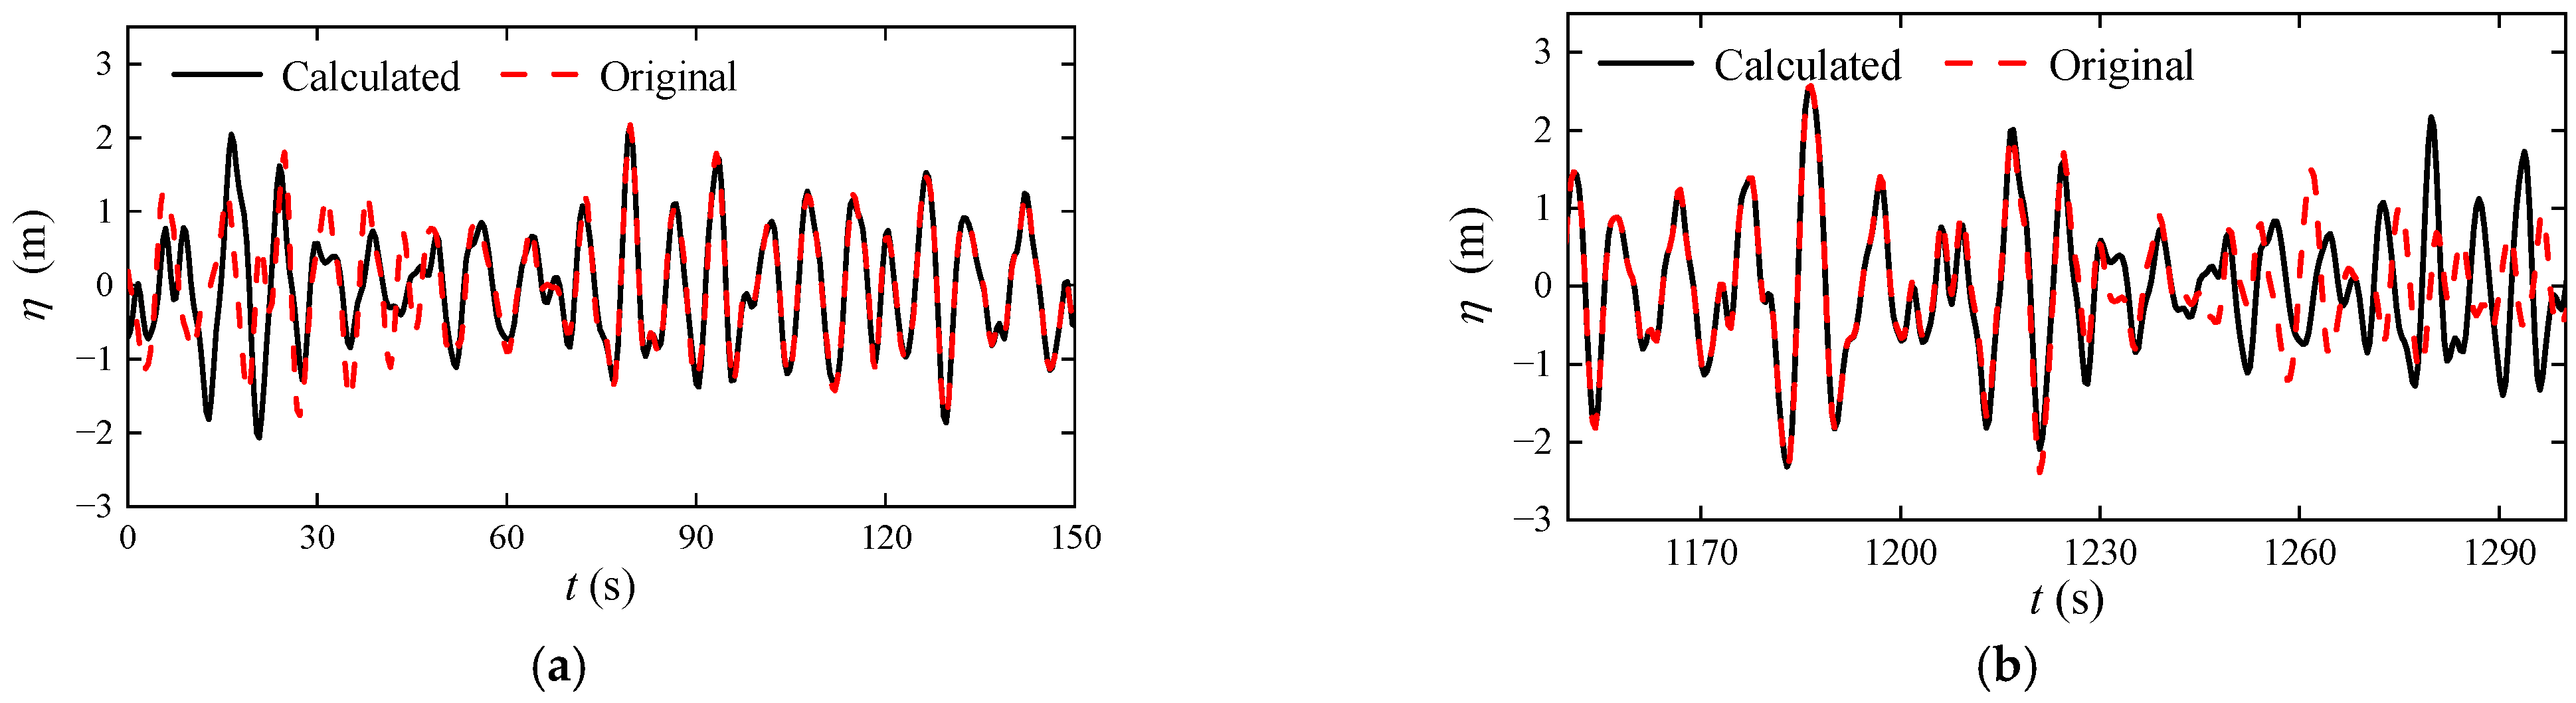
Figure 2 shows the results for the
x = 200 m case. The calculation time range is from 0 s to 1300 s.
Figure 2a shows the detailed comparison results during 0–150 s and
Figure 2b corresponds to 1150–1300 s. It can be seen that the calculated wave elevation and the original elevation of the initial 0~70 s and 1230~1300 s have obvious differences but in the time interval 70~1230 s, the wave surface matches pretty well. Using Equations (12) and (13) to obtain the consistent time zone, the result is shown in
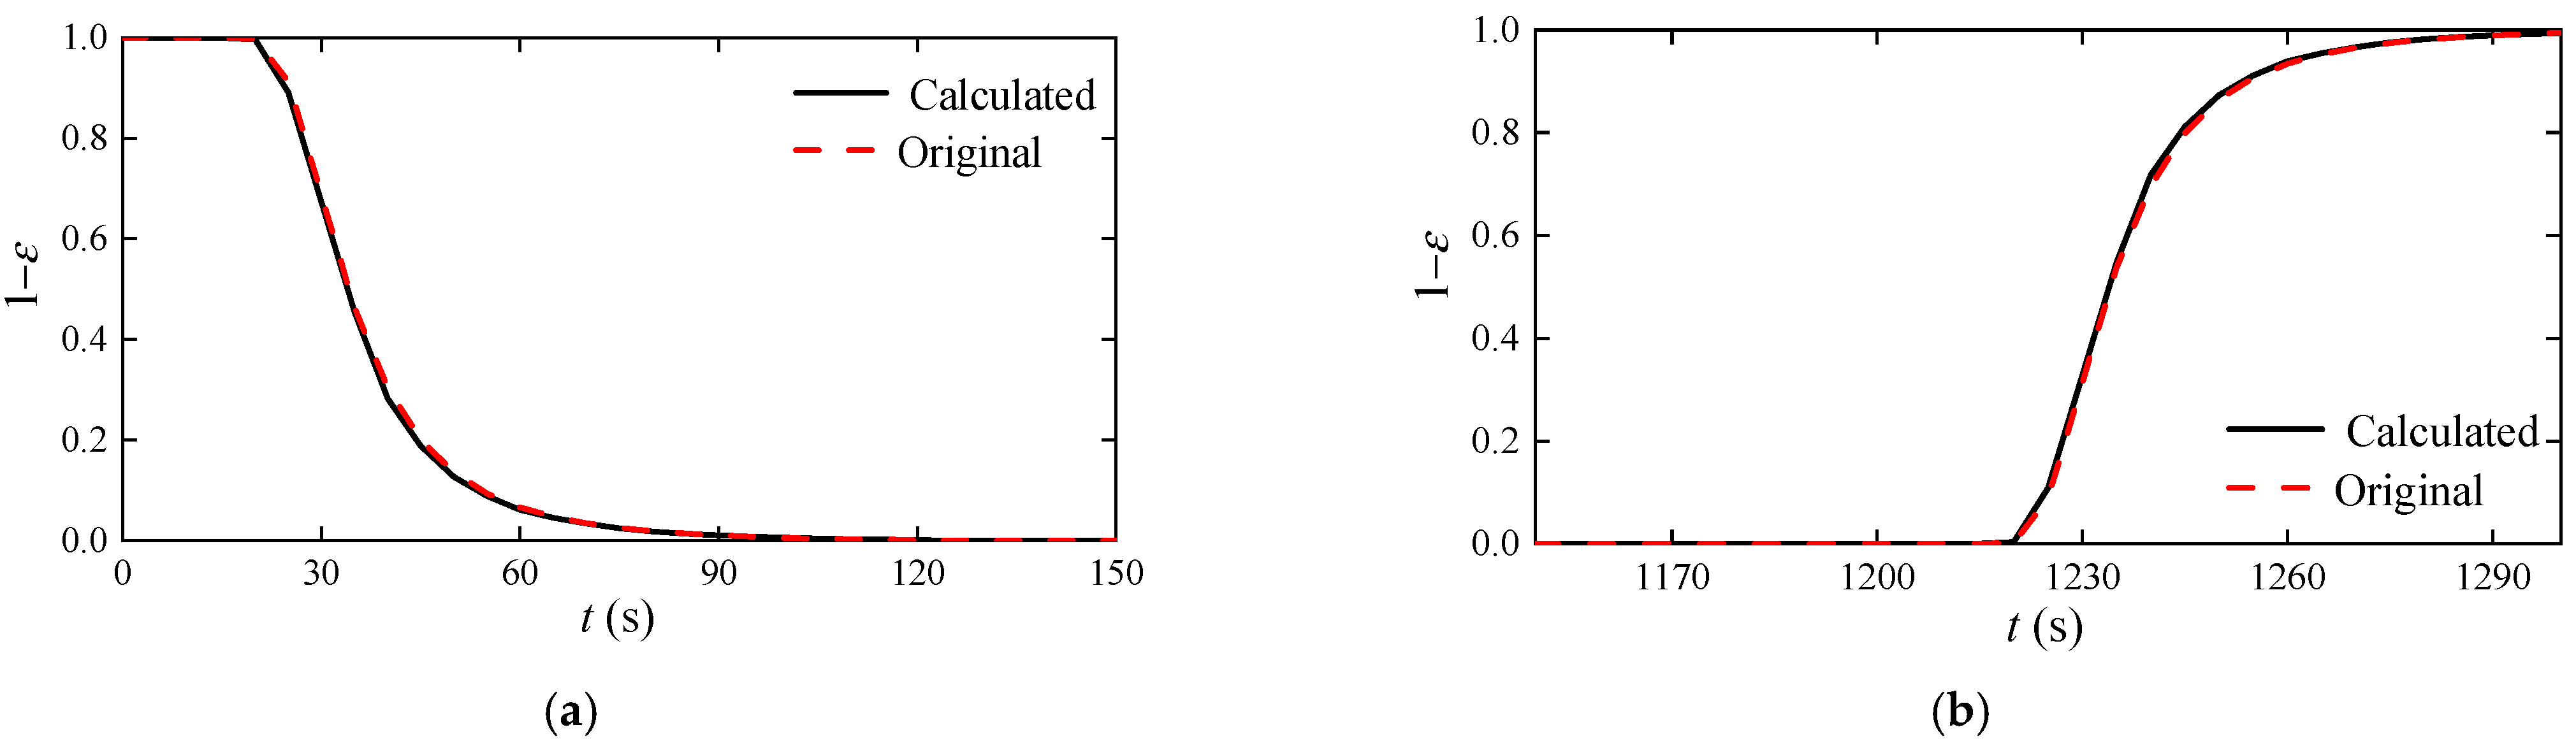
Figure 3.
Figure 3 shows the results of the error indicator based on the theoretical spectrum and the FFT components at
x = 200 m.
Figure 3a,b corresponds to the calculation results in
Figure 2a and
Figure 2b, respectively. The value of the error indicator by FFT components and the value by the original spectrum matches very well. Since in the natural ocean, the spectrum is unknown, the only information is the measured wave elevation. From
Figure 3, we find that the FFT components can give almost the same values of error indicator as the original spectrum.
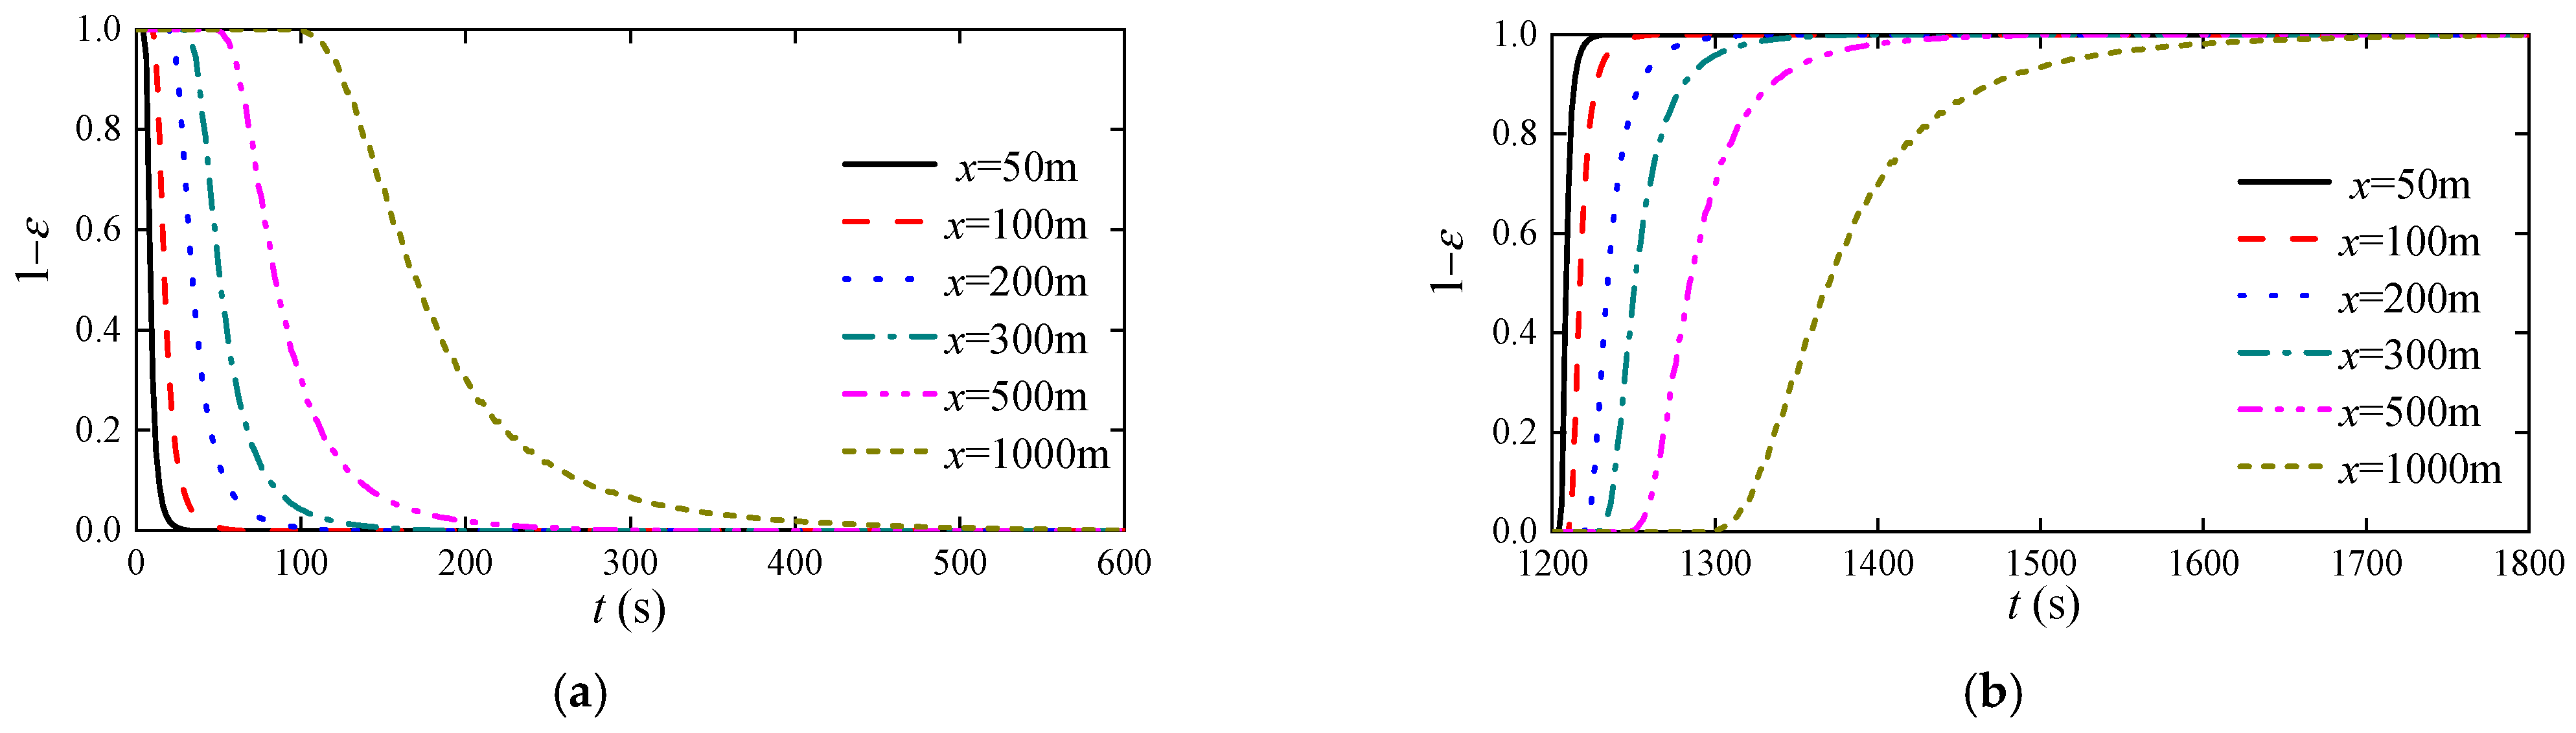
Figure 4 shows the time-series results of the error indicator at the different locations. The calculation time range at these locations are all from 0 s to 1800 s.
Figure 4a shows the comparison among different locations during 0–150 s and
Figure 4b corresponds to 1200–1800 s. These results are calculated based on the group velocity.
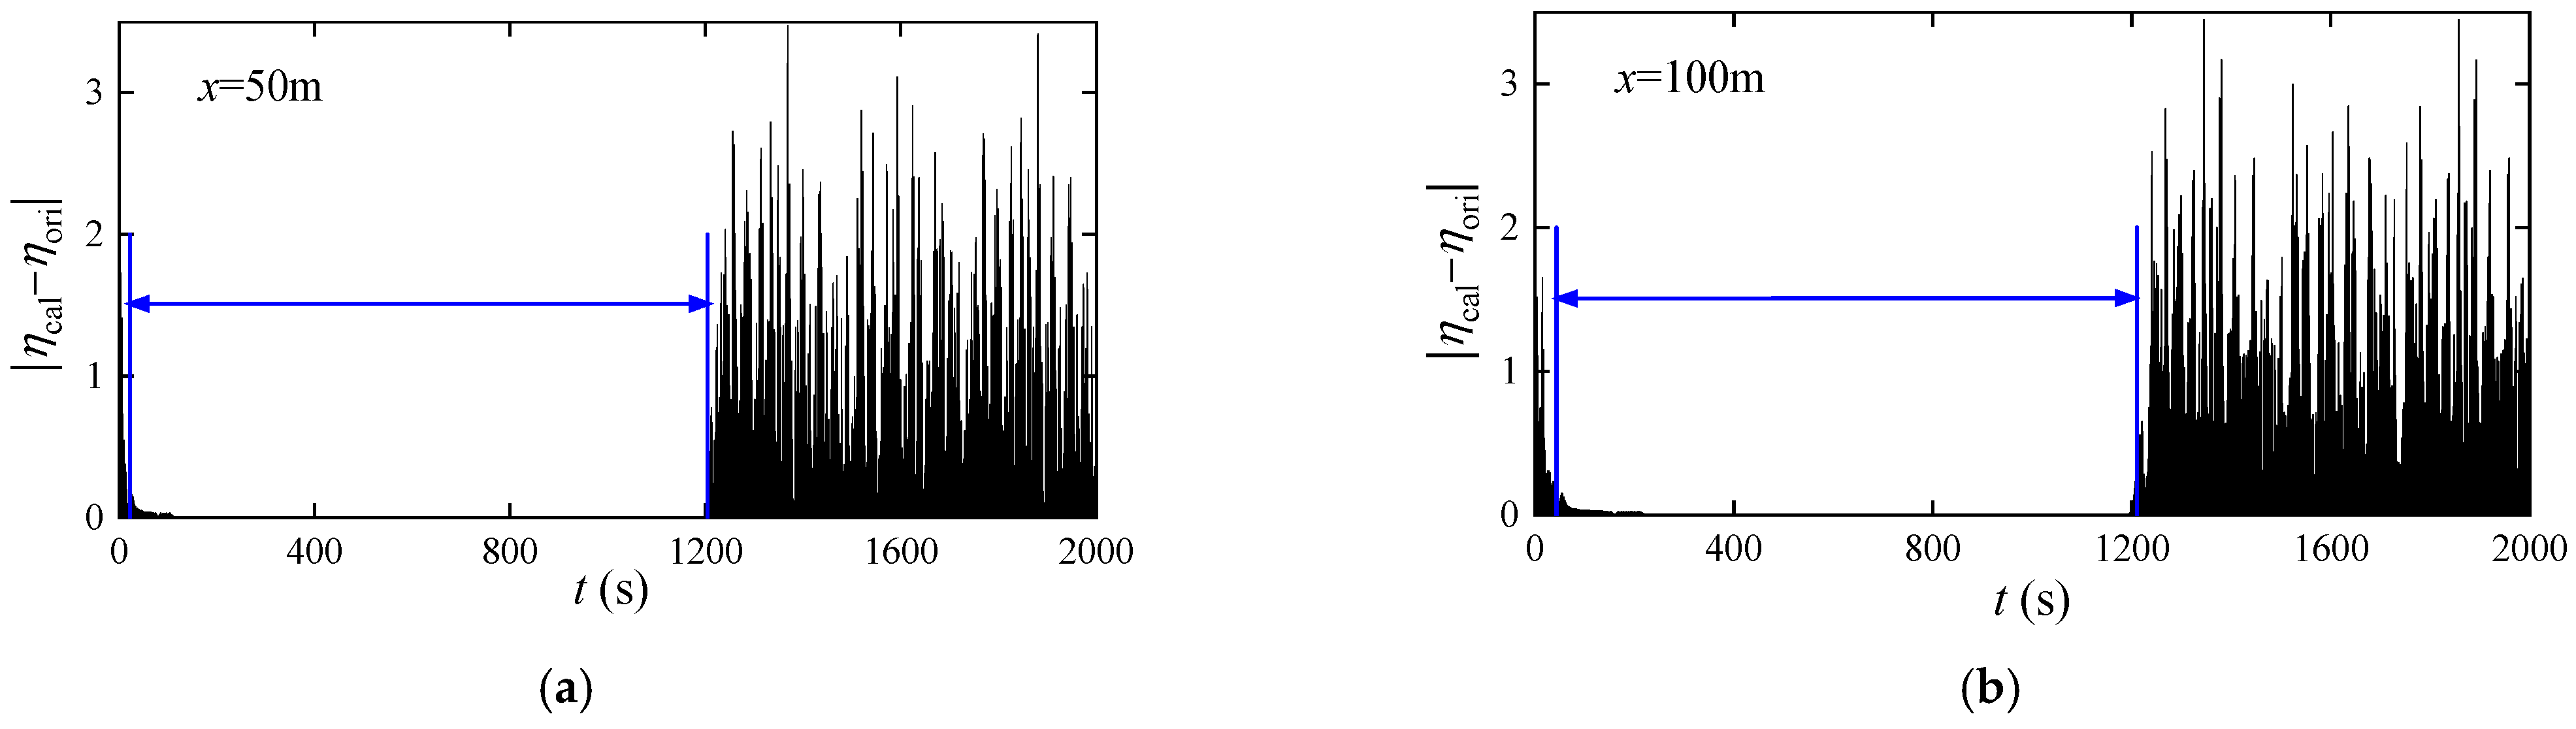
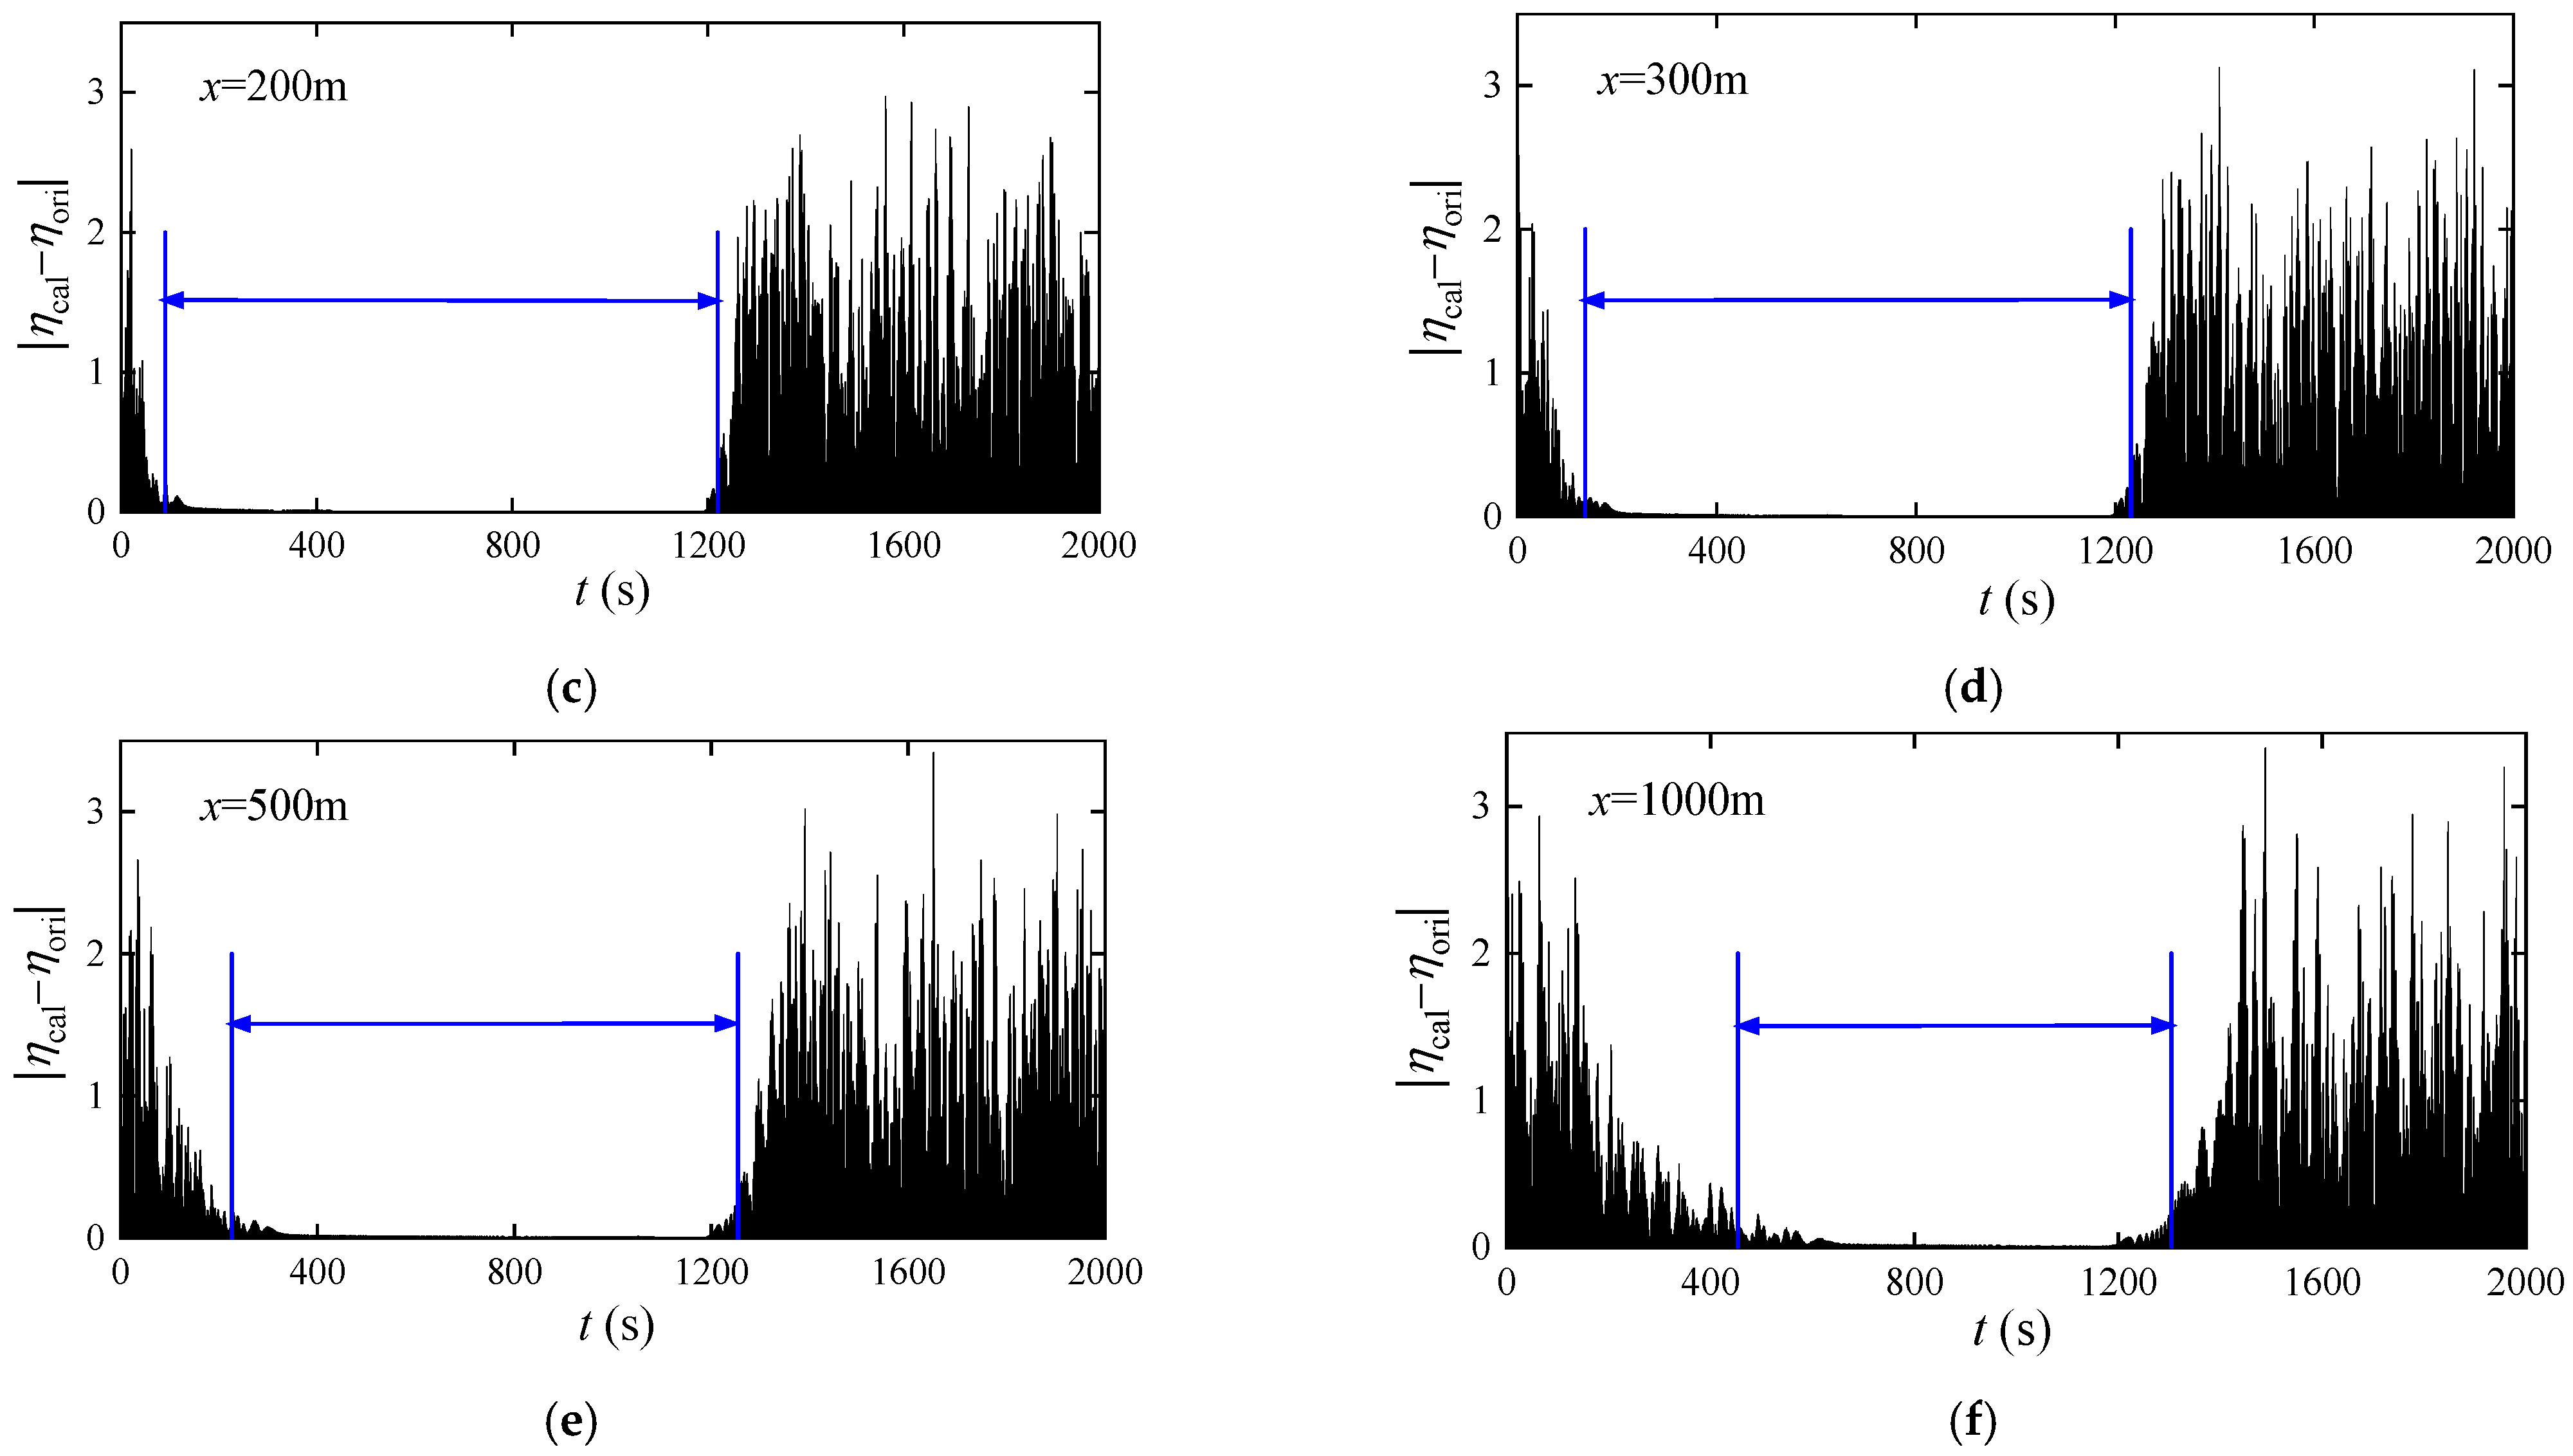
The absolute error function is defined as Equation (18), which can be used to compare the differences between the original elevation and calculated elevation.
Figure 5 shows the absolute error at different locations. The interval between two blue lines is the consistent time zone obtained by the error function.
Table 1 provides the start time and duration of the consistent time zone at different locations. From
Figure 5, it can be seen that the distribution of absolute errors is consistent with the calculated predictable domain. The absolute errors of the constructed wave surface in the consistent time zone are significantly lower. Combining with the detailed results shown in
Table 1, it can be seen that as the distance between the reconstruction point and the measurement point gradually increases, the consistent time zone also deviates from the initial moment, and the length of the consistent time zone shows a significant decrease. This indicates that distance is an important factor affecting the accuracy of wave reconstruction.
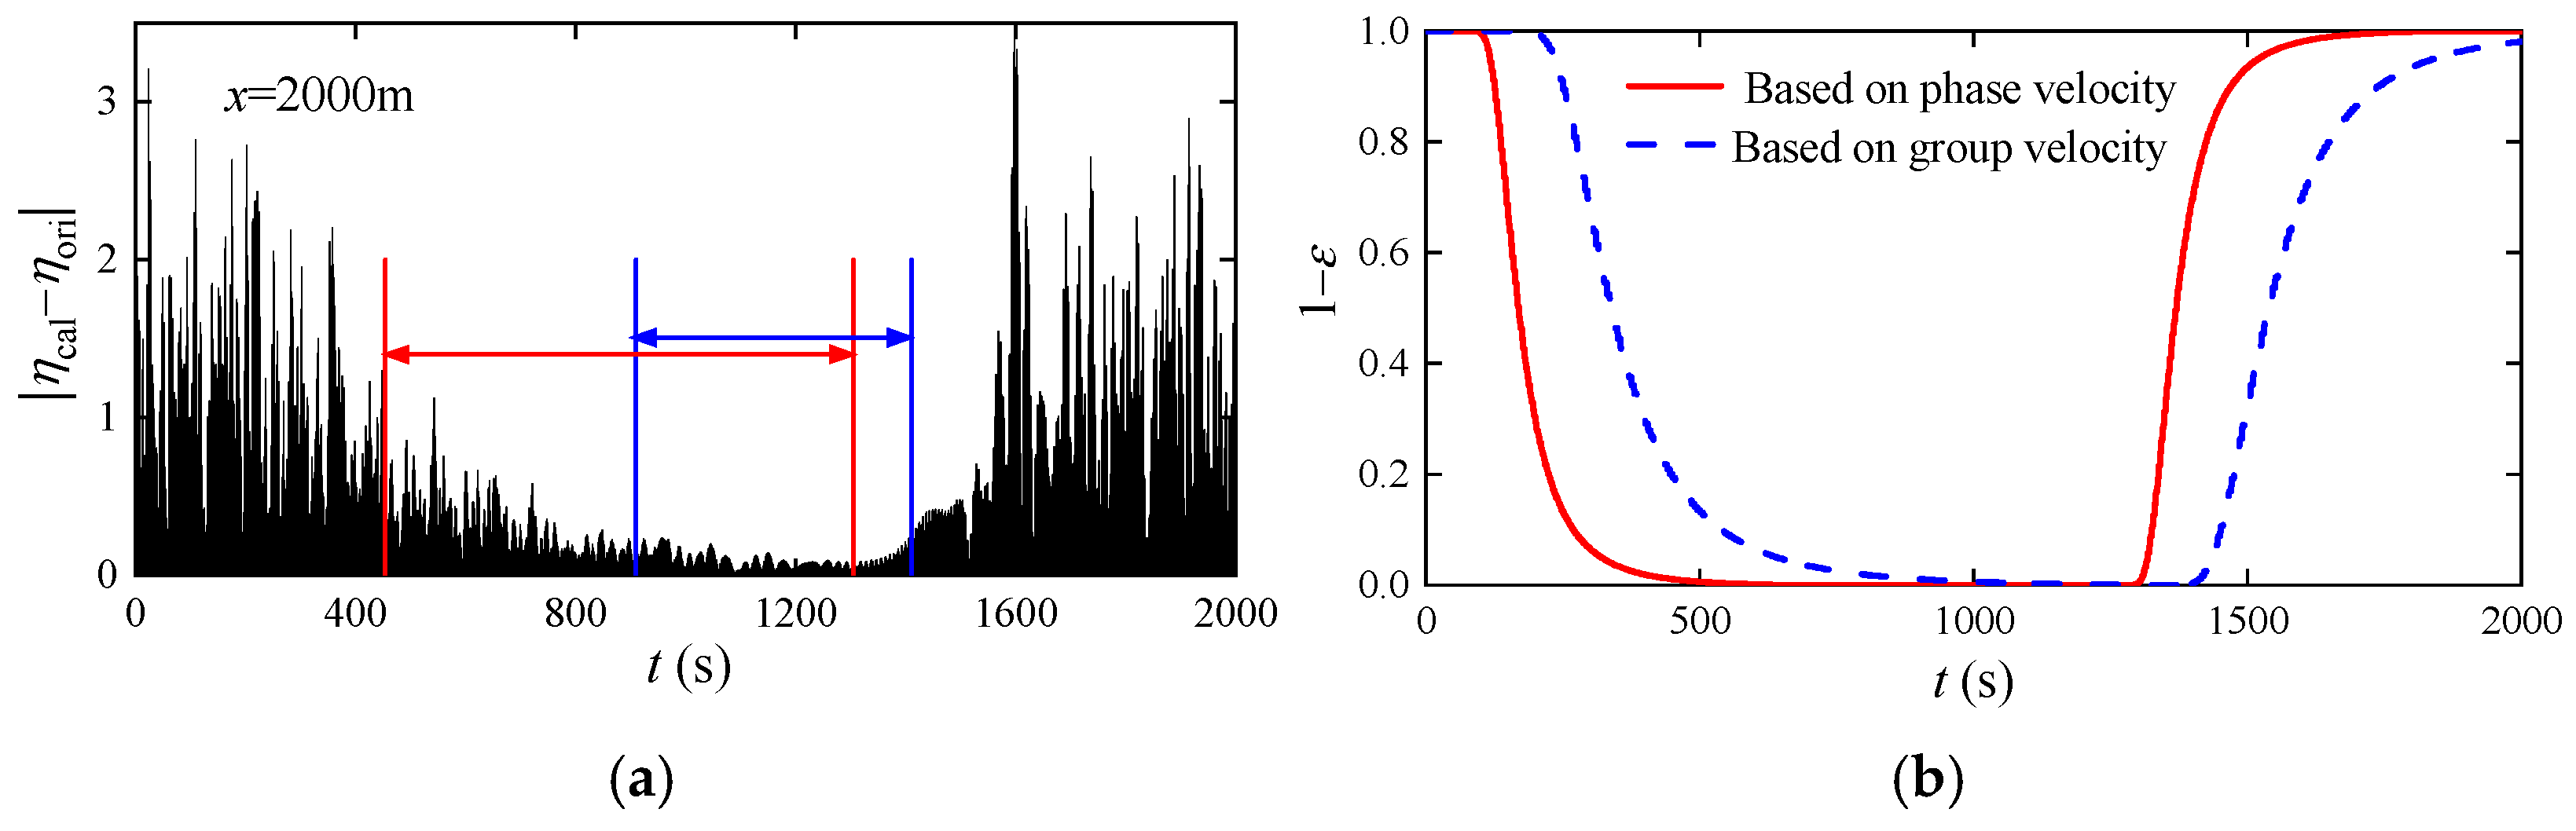
Meanwhile, the consistent time zones obtained by the error function based on group velocity and phase velocity are compared. The target location
x = 2000 m is selected to highlight their differences and the result is shown in
Figure 6. It can be seen that the error function based on group velocity can provide a consistent time zone rather than that of phase velocity.
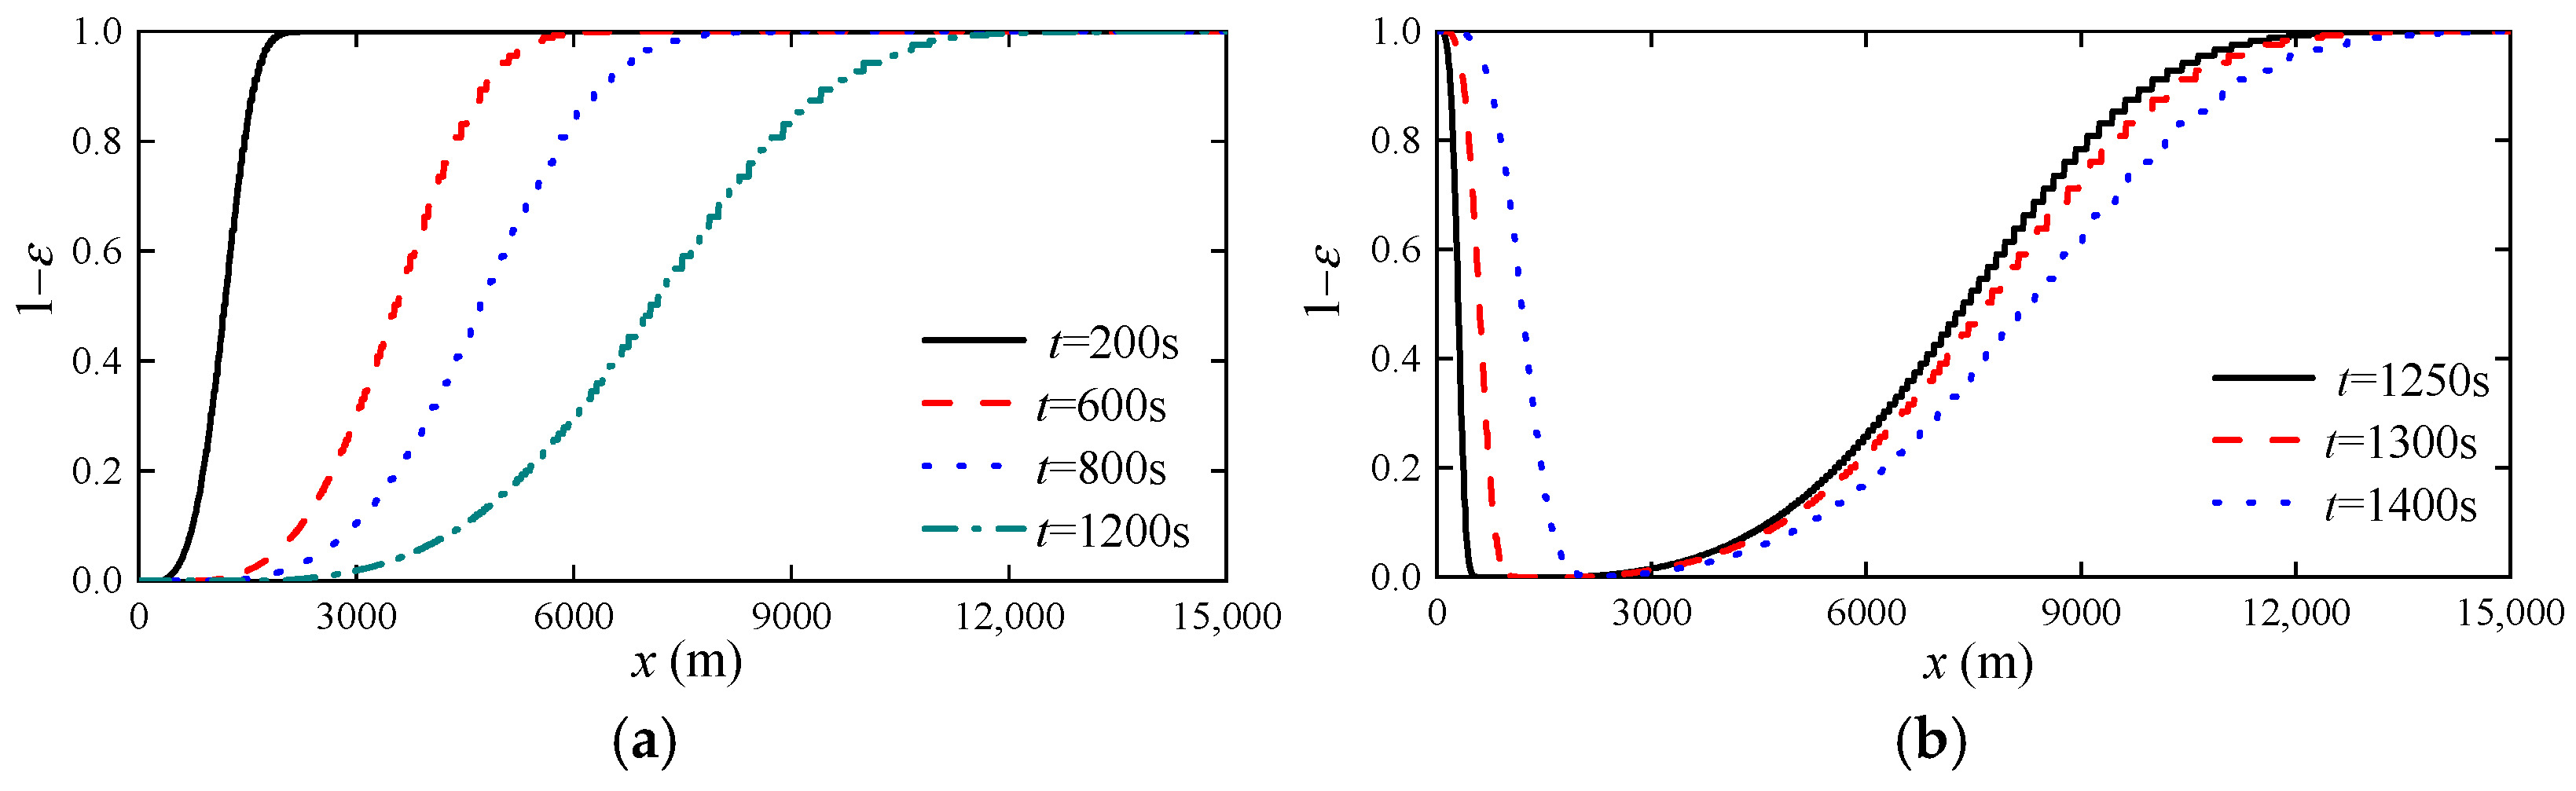
4.2. Wave Surface Consistent Zone in Space
The analysis of the wave surface consistent zone in space selects the fixed time
T = 200 s. The comparison between the calculated wave elevation and the original elevation from 0 to 1500 m is shown in
Figure 7. For the first 800 m, it can be seen that the calculated wave time history at the current distance matches the original time history quite well, including the prediction of some minor wave surface oscillations and the RMSE is only 0.1896. However, for the next 700 m, there are noticeable differences between the original wave elevation and calculated wave elevation. And the RMSE has increased to 0.8025.
Figure 8 shows the result of the error indicator against distance at different times. To clearly demonstrate the consistent zone in the space of waves at different times, the results shown in
Figure 8 are divided into two groups in 1200 s. Before the 1200 s, as shown in
Figure 8a, the consistent distance zones are started from the original location and increase with the measurement time. After the 1200 s, the consistent location no longer starts from the original position. Instead, the consistent distance zones appear at locations significantly deviated from the original position.
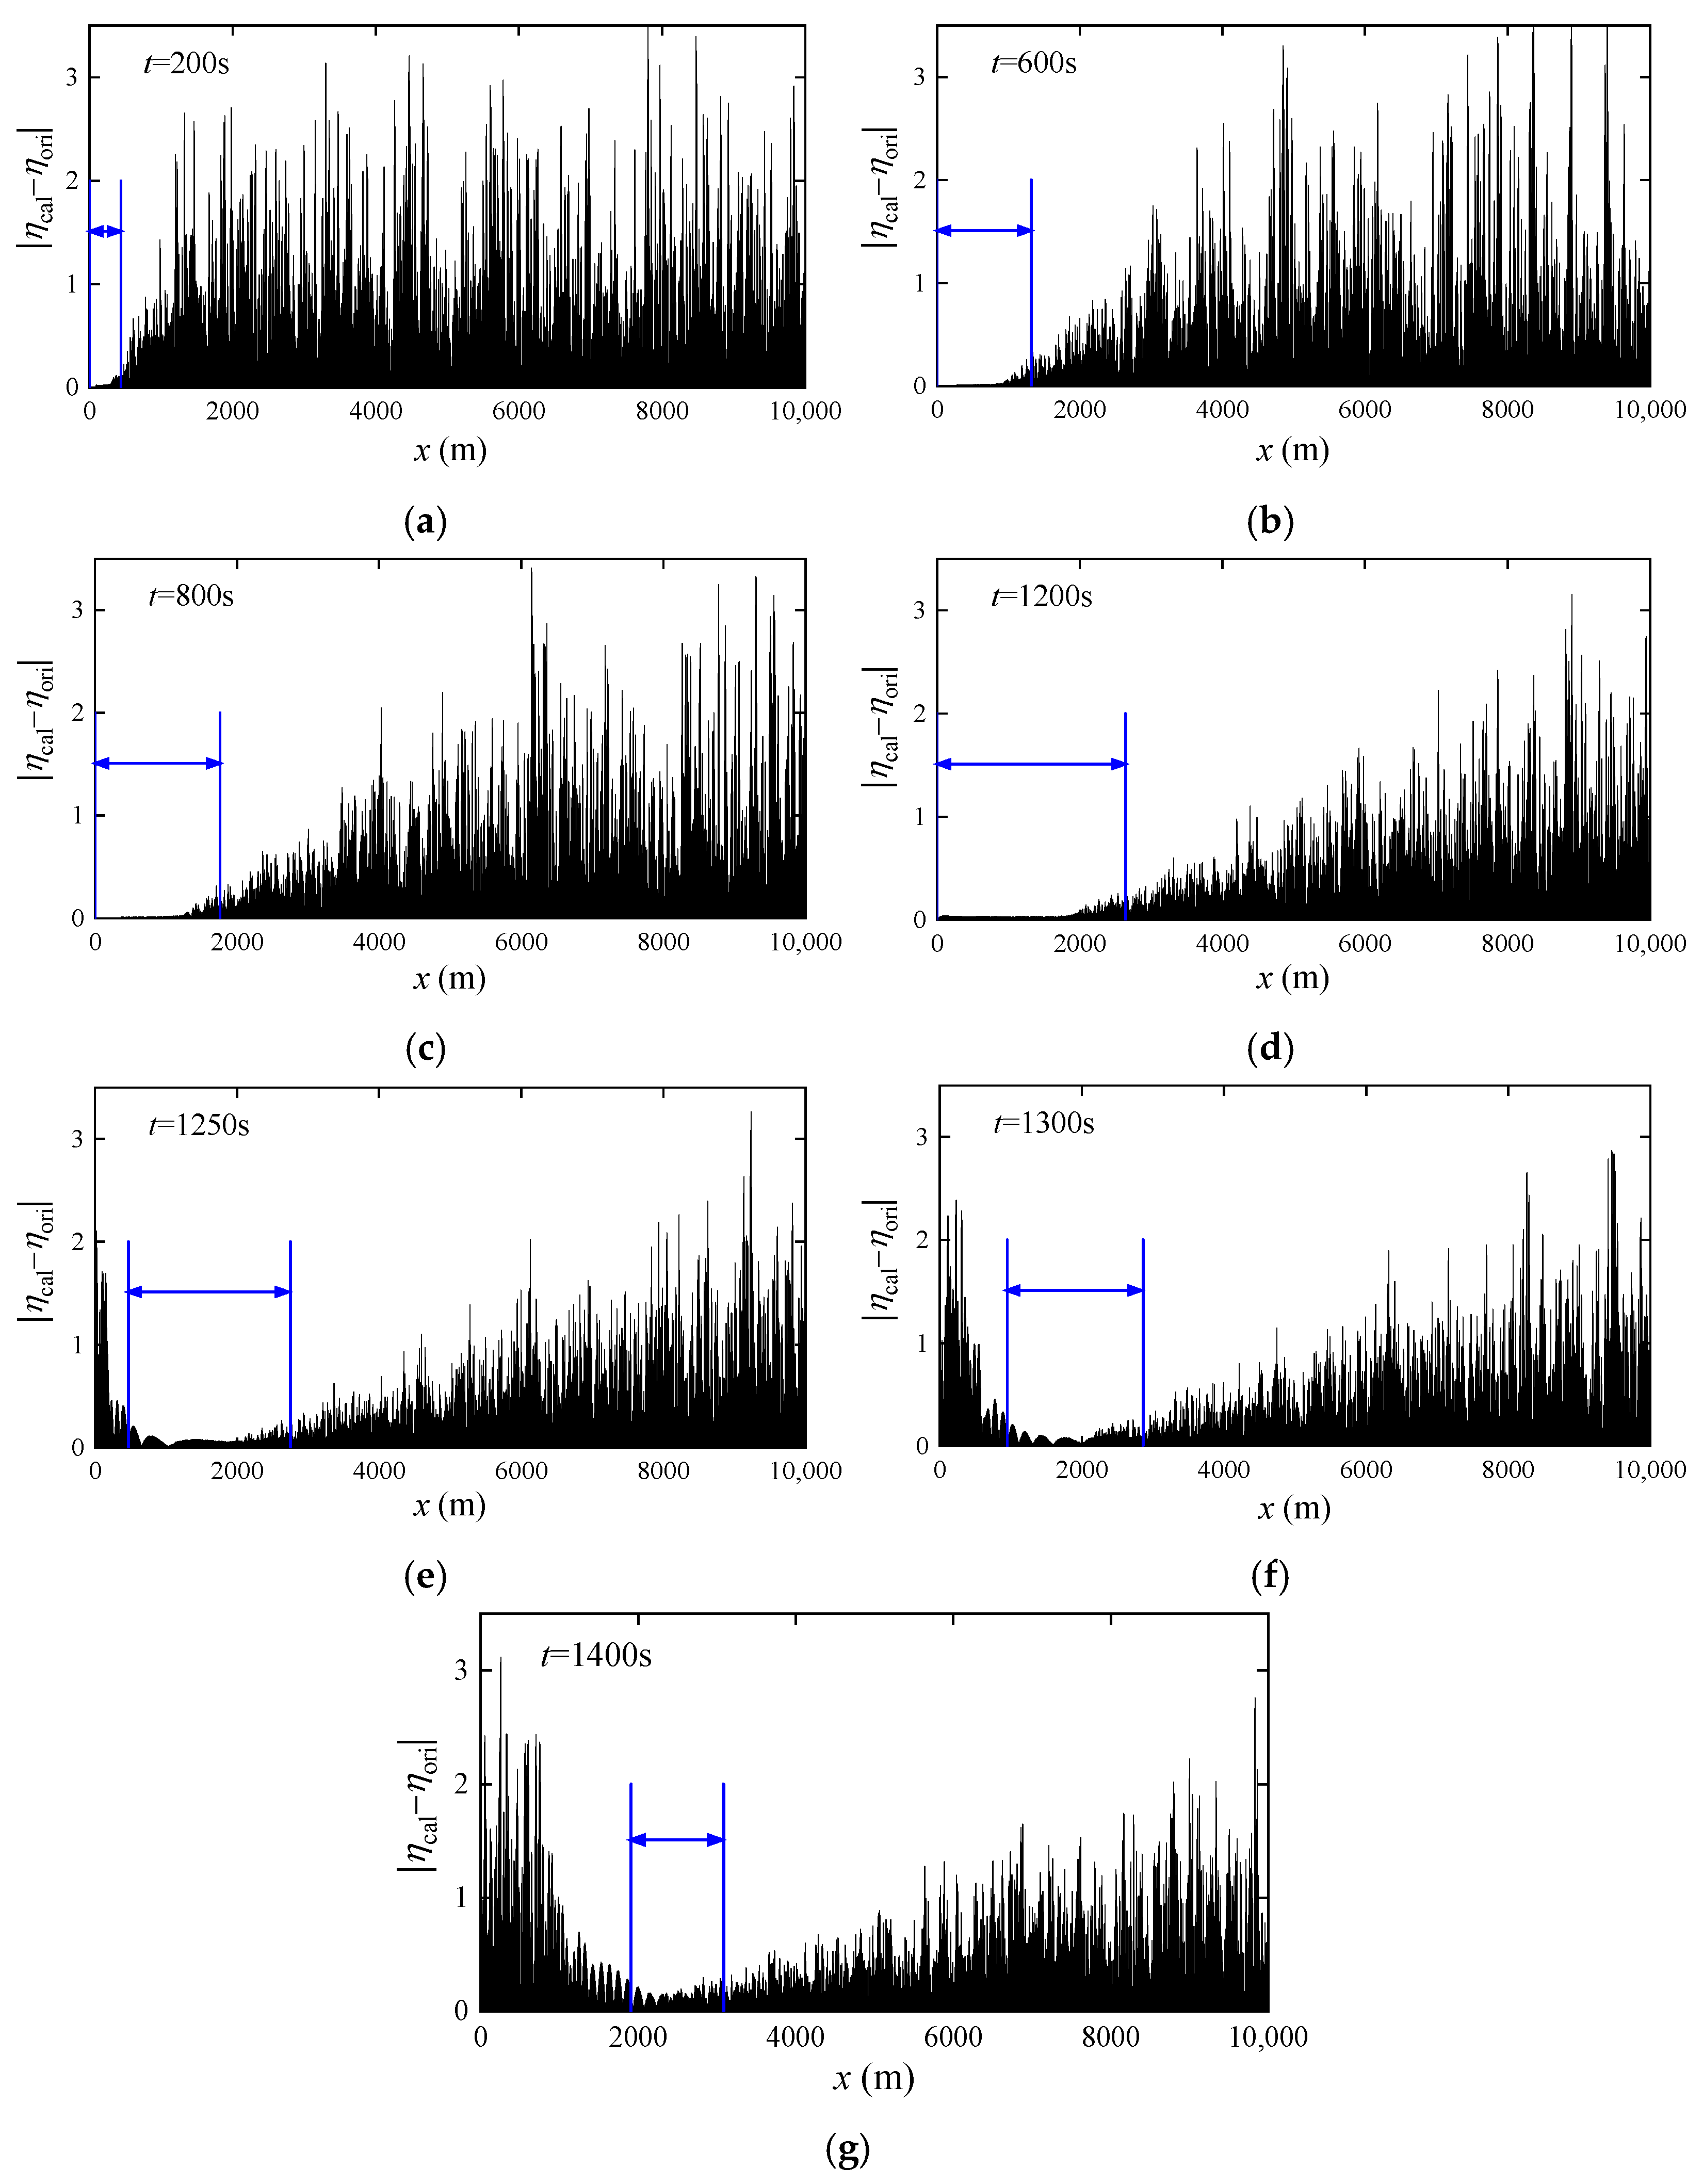
The other six times, including 600 s, 800 s, 1200 s, 1250 s, 1300 s and 1400 s are selected to calculate the absolute error, which is shown in
Figure 9. The interval between the two blue lines is the consistent distance zone obtained from the error function. The consistent distance zones shown in
Figure 9 are the same as
Figure 8, which implies that the calculation of error function can also provide reliable consistent distance zones.
Table 2 shows the relationship between the time and consistent distance zone.
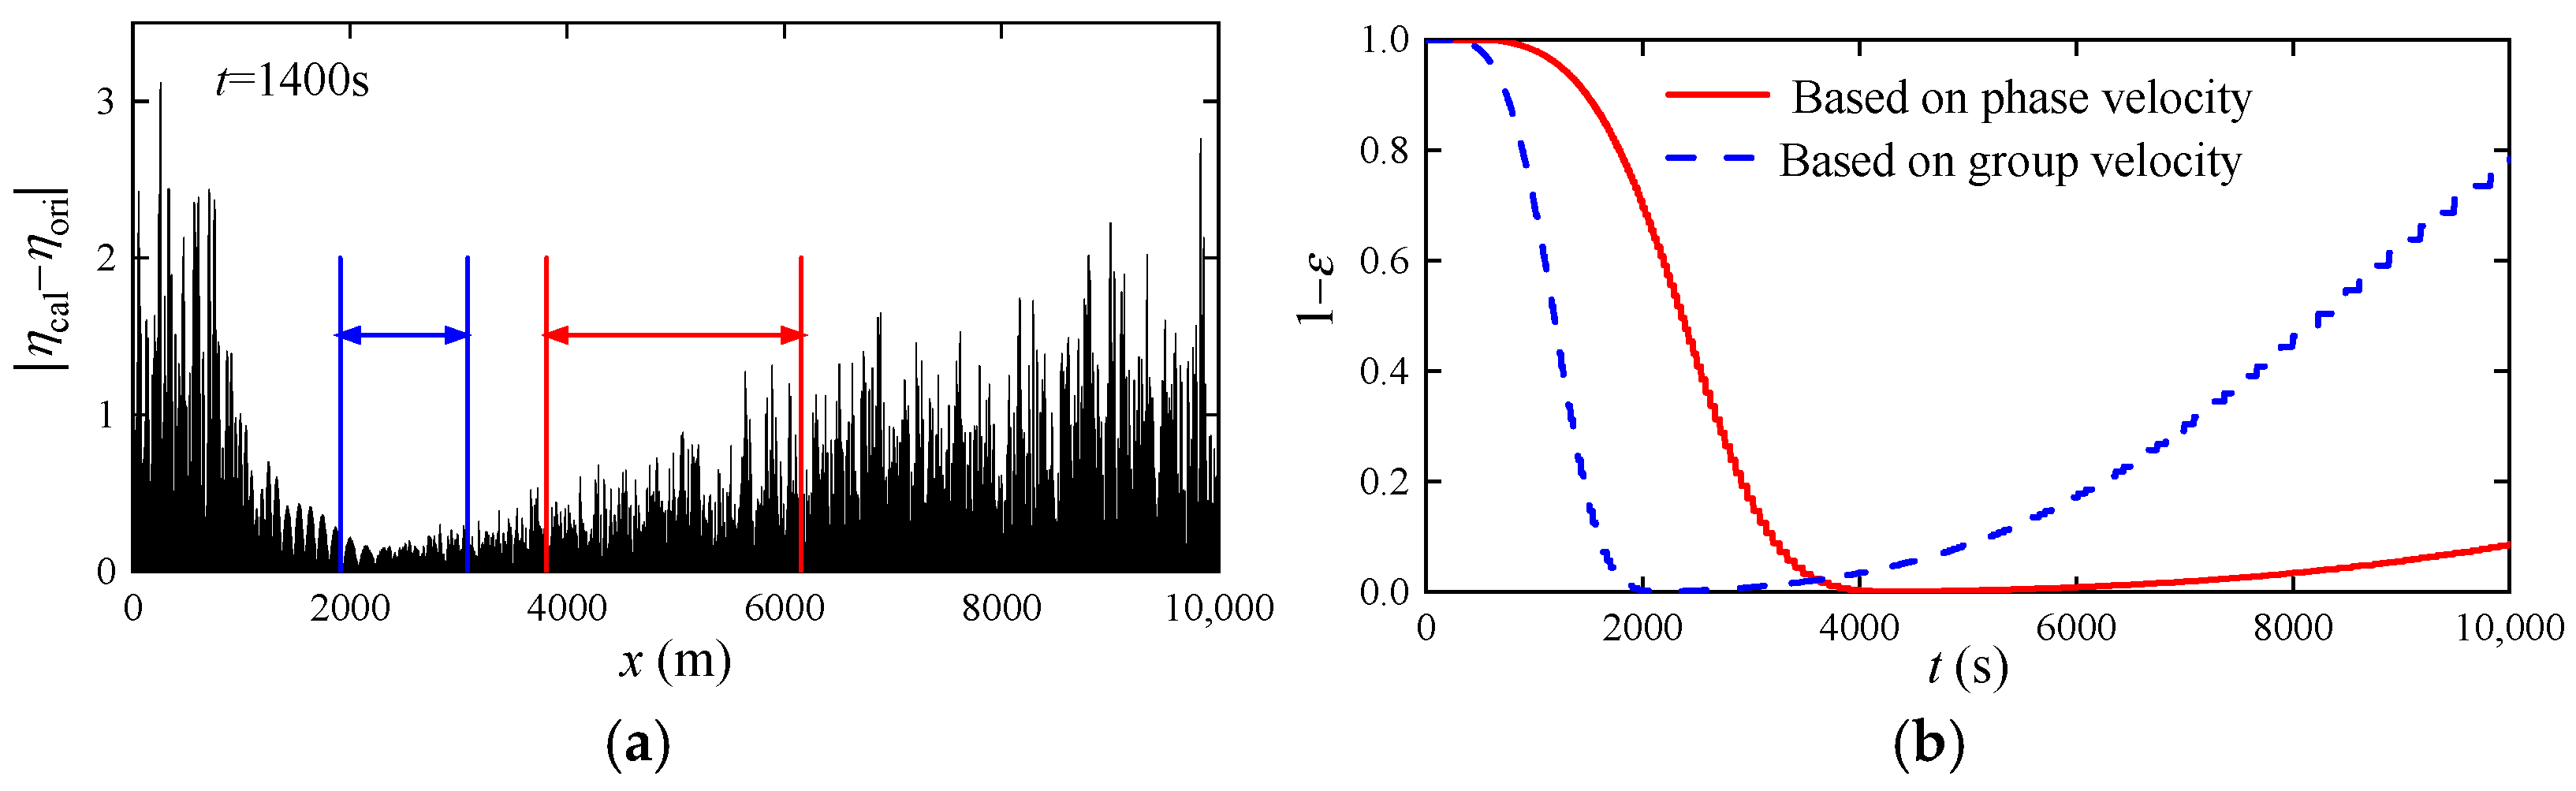
Through the simulation results, the consistent distance zones obtained by error function based on group velocity and phase velocity can be also compared. Here the target location
T = 1400 s is selected to highlight their differences and the result is shown in
Figure 10. It can be observed that the error function based on group velocity can provide a better consistent distance zone rather than that of phase velocity.
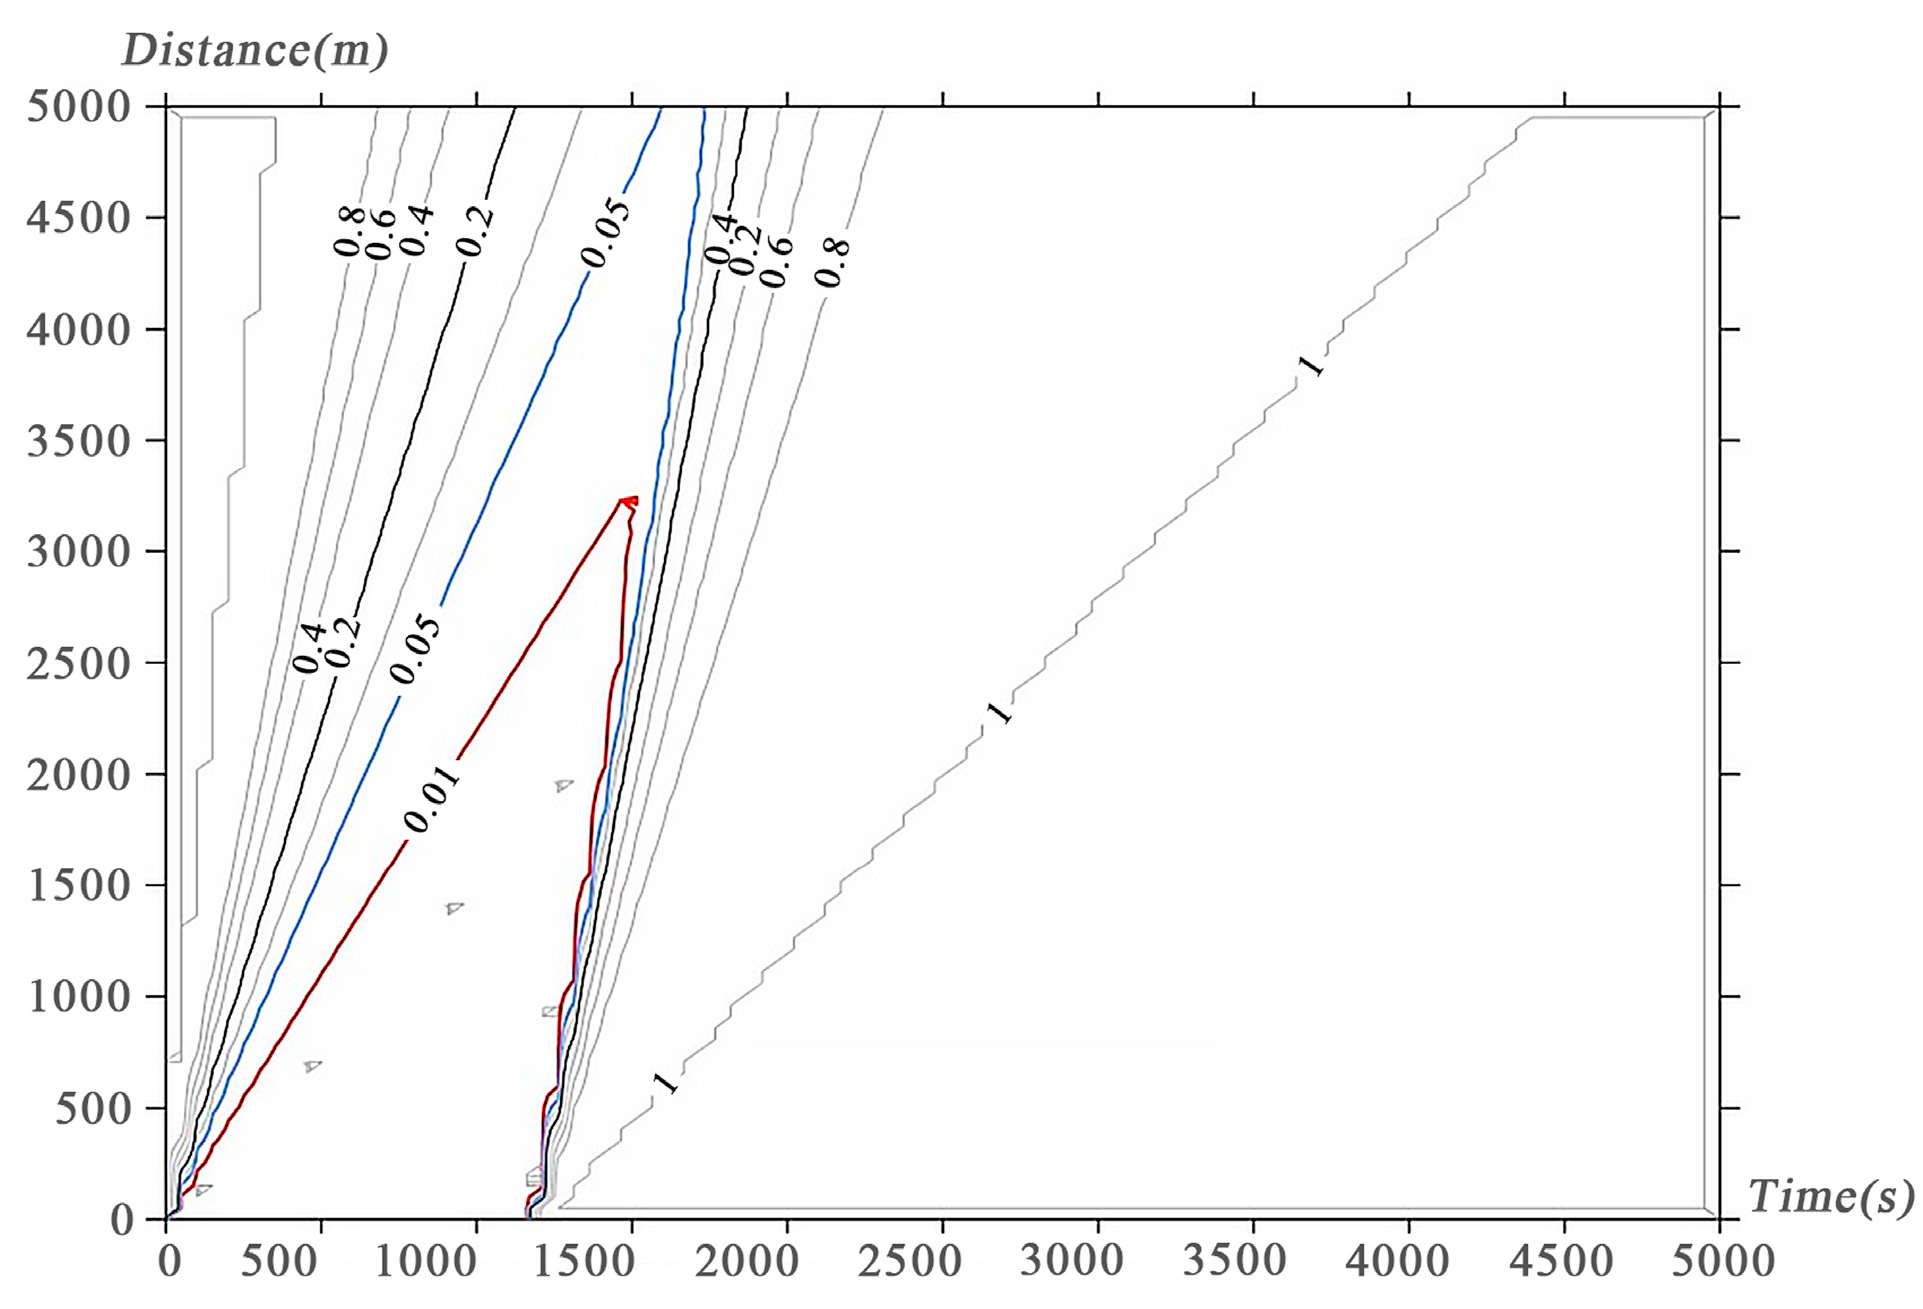
4.3. Wave Surface Consistent Zone in Spacetime
Combining the results of
Section 4.1 and
Section 4.2, the consistent zone in spacetime can be obtained. The contour of error is showed in
Figure 11, and it gives the error in the spacetime coordinate. For any constant error, a closed contour is obtained then. Since the maximum acceptable error is 0.01, the closed area with red lines is consistent with the spacetime zone. The closed area with blue lines is the consistent spacetime zone when the maximum acceptable error is defined as 0.05.
5. Experiments
In this section, the experiments are set up in the wave tank of Harbin Engineering University.
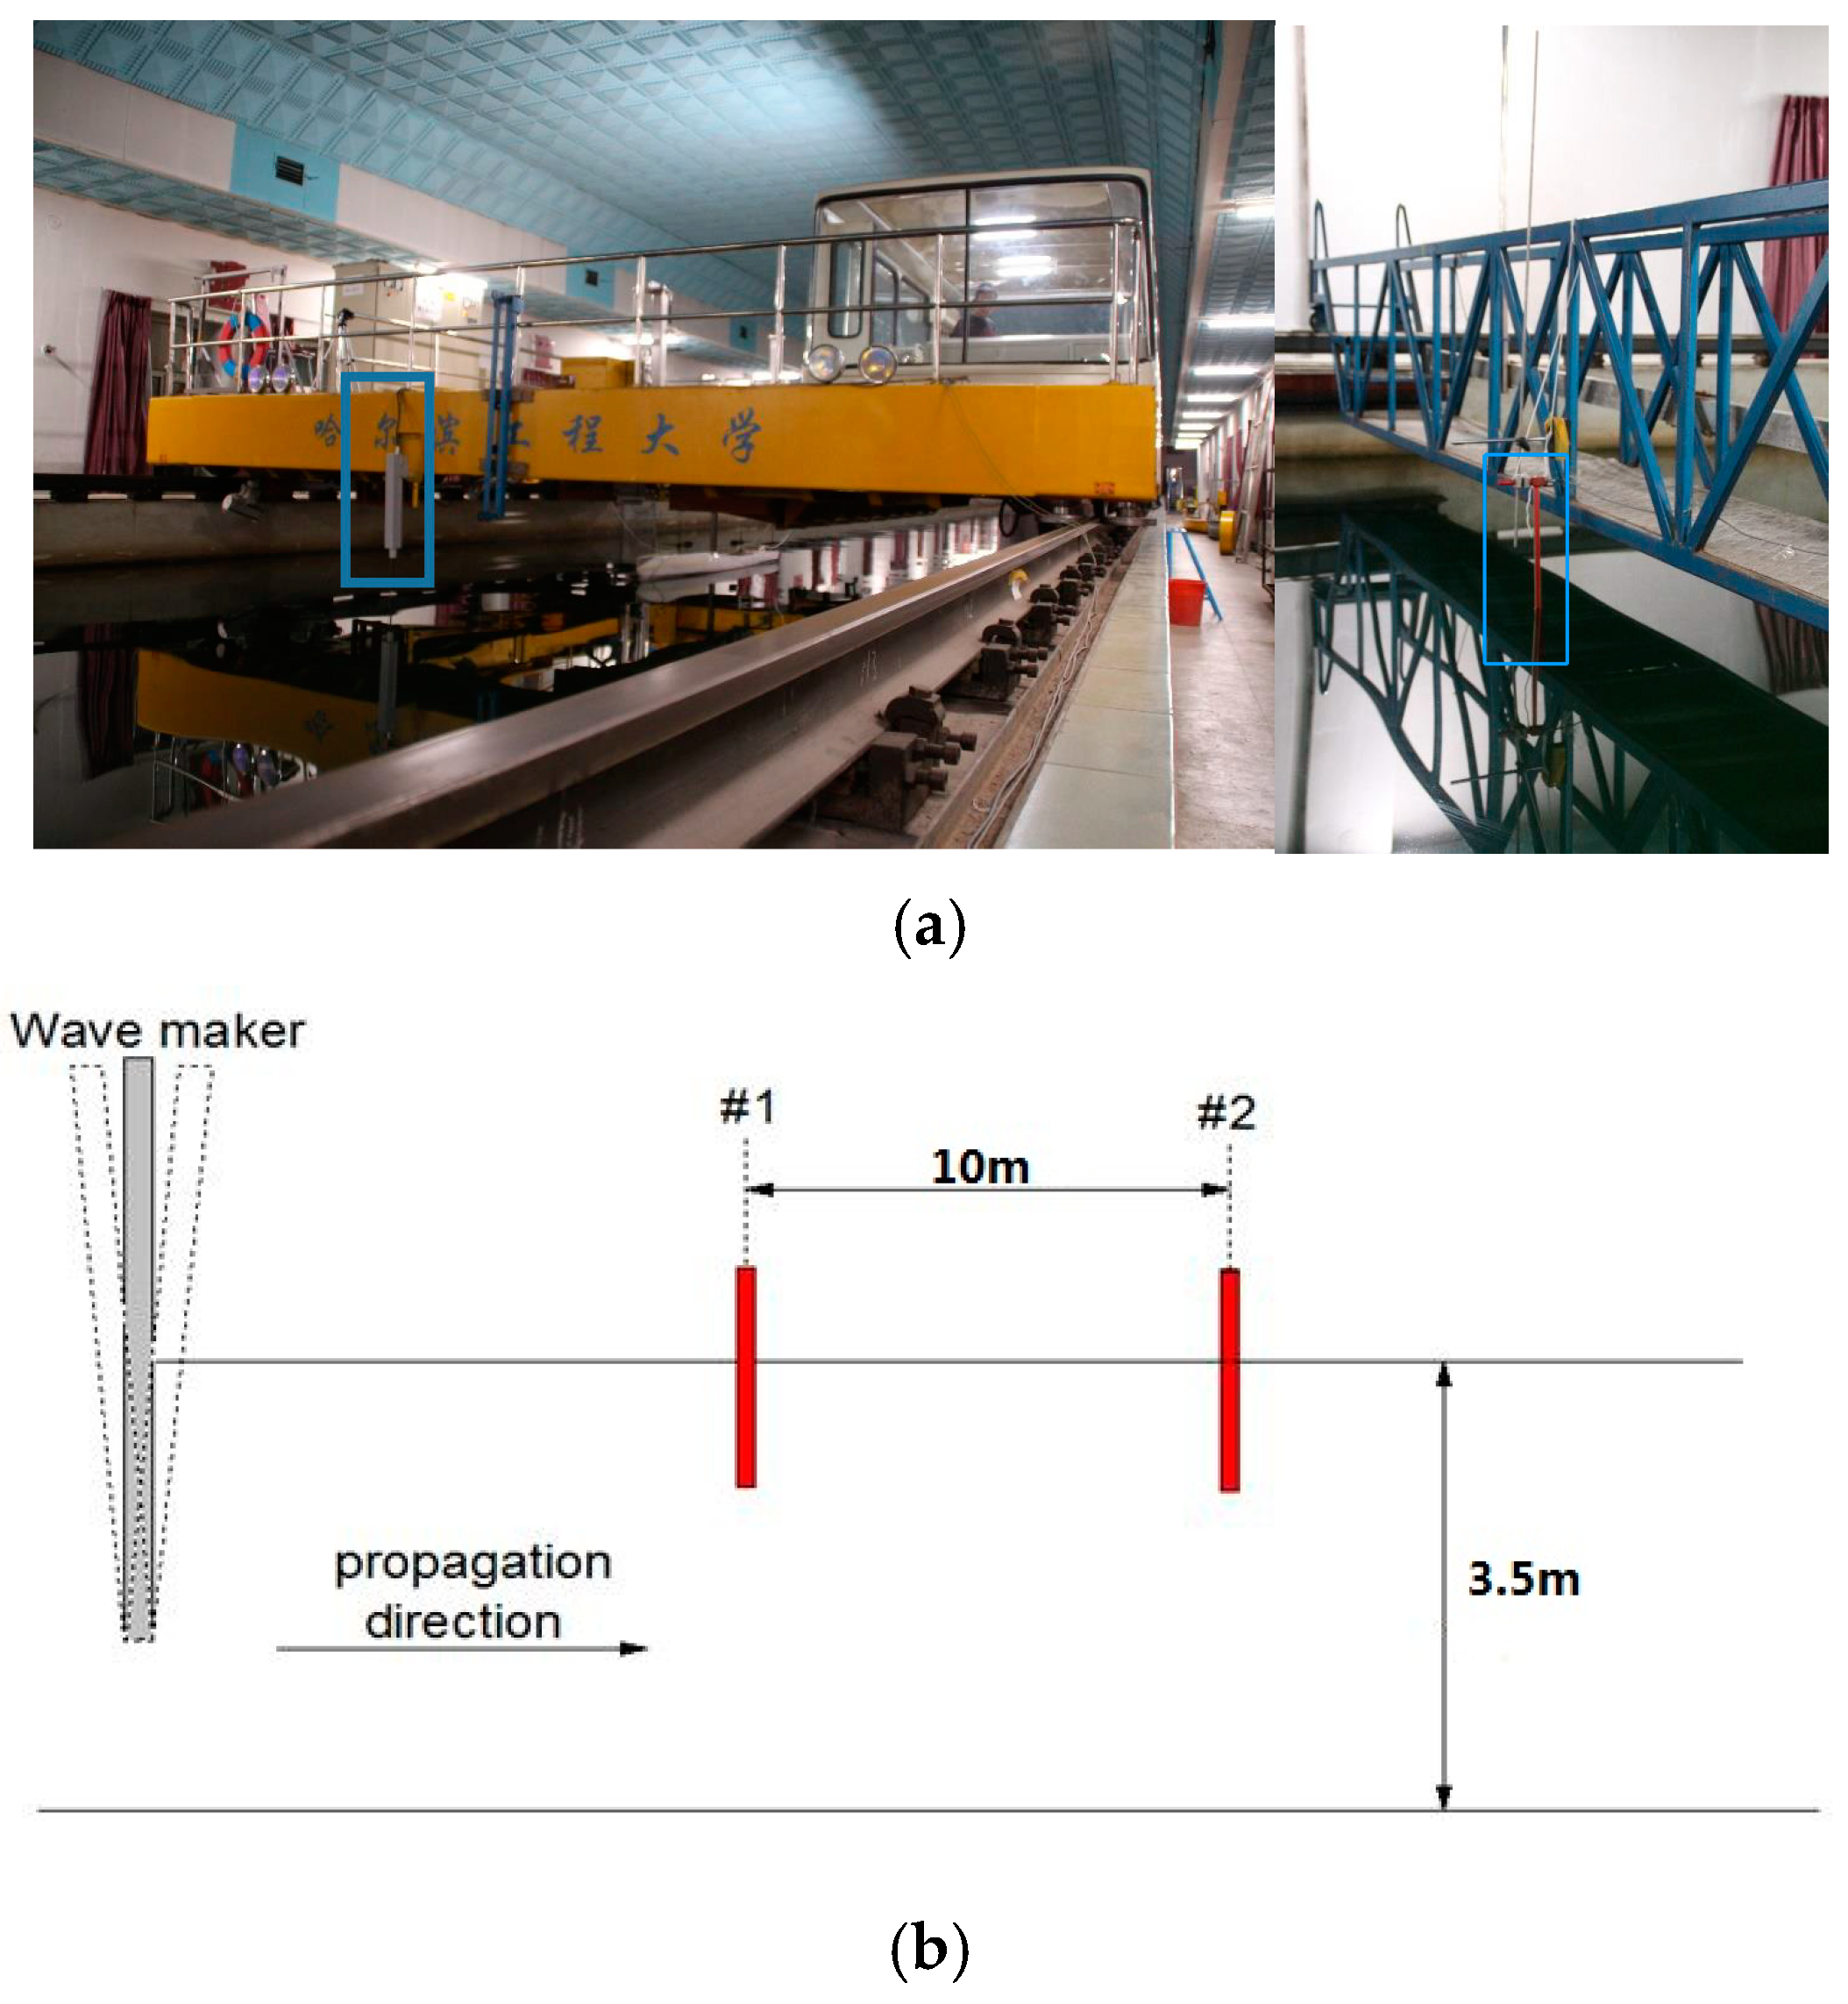
Figure 12 shows the schematic diagram of the experiments.
Figure 12.
The schematic diagram of the experiment (
a): The trailer with the “Harbin Engineering University” logo and the placement of the wave gauge. (
b): The designed diagram of experiment, where #1 represents the first wave gauge located upstream, and #2 represents the second wave gauge located downstream. Two wave probes are fixed with the distances of 10 m. One wave probe, #1, is used to measure the wave elevation at the original location, and another, #2, is used to measure the wave elevation that will be compared to the estimated wave elevation. When the waves have fully developed and the wave field tends to be stochastic, the wave probes start to measure the wave elevation. To avoid the effect of the wave reflection, the measurement time of all cases is set as 90 s. The sampling frequency is chosen as 0.02 s. The scale radio is selected as 1:64. To generate the irregular waves, the JONSWAP spectrum is selected as the target spectrum. Five cases are chosen for the experiments and the parameters of all cases and the calculated consistent time zones are shown in
Table 3.
![Jmse 12 00633 g012]()
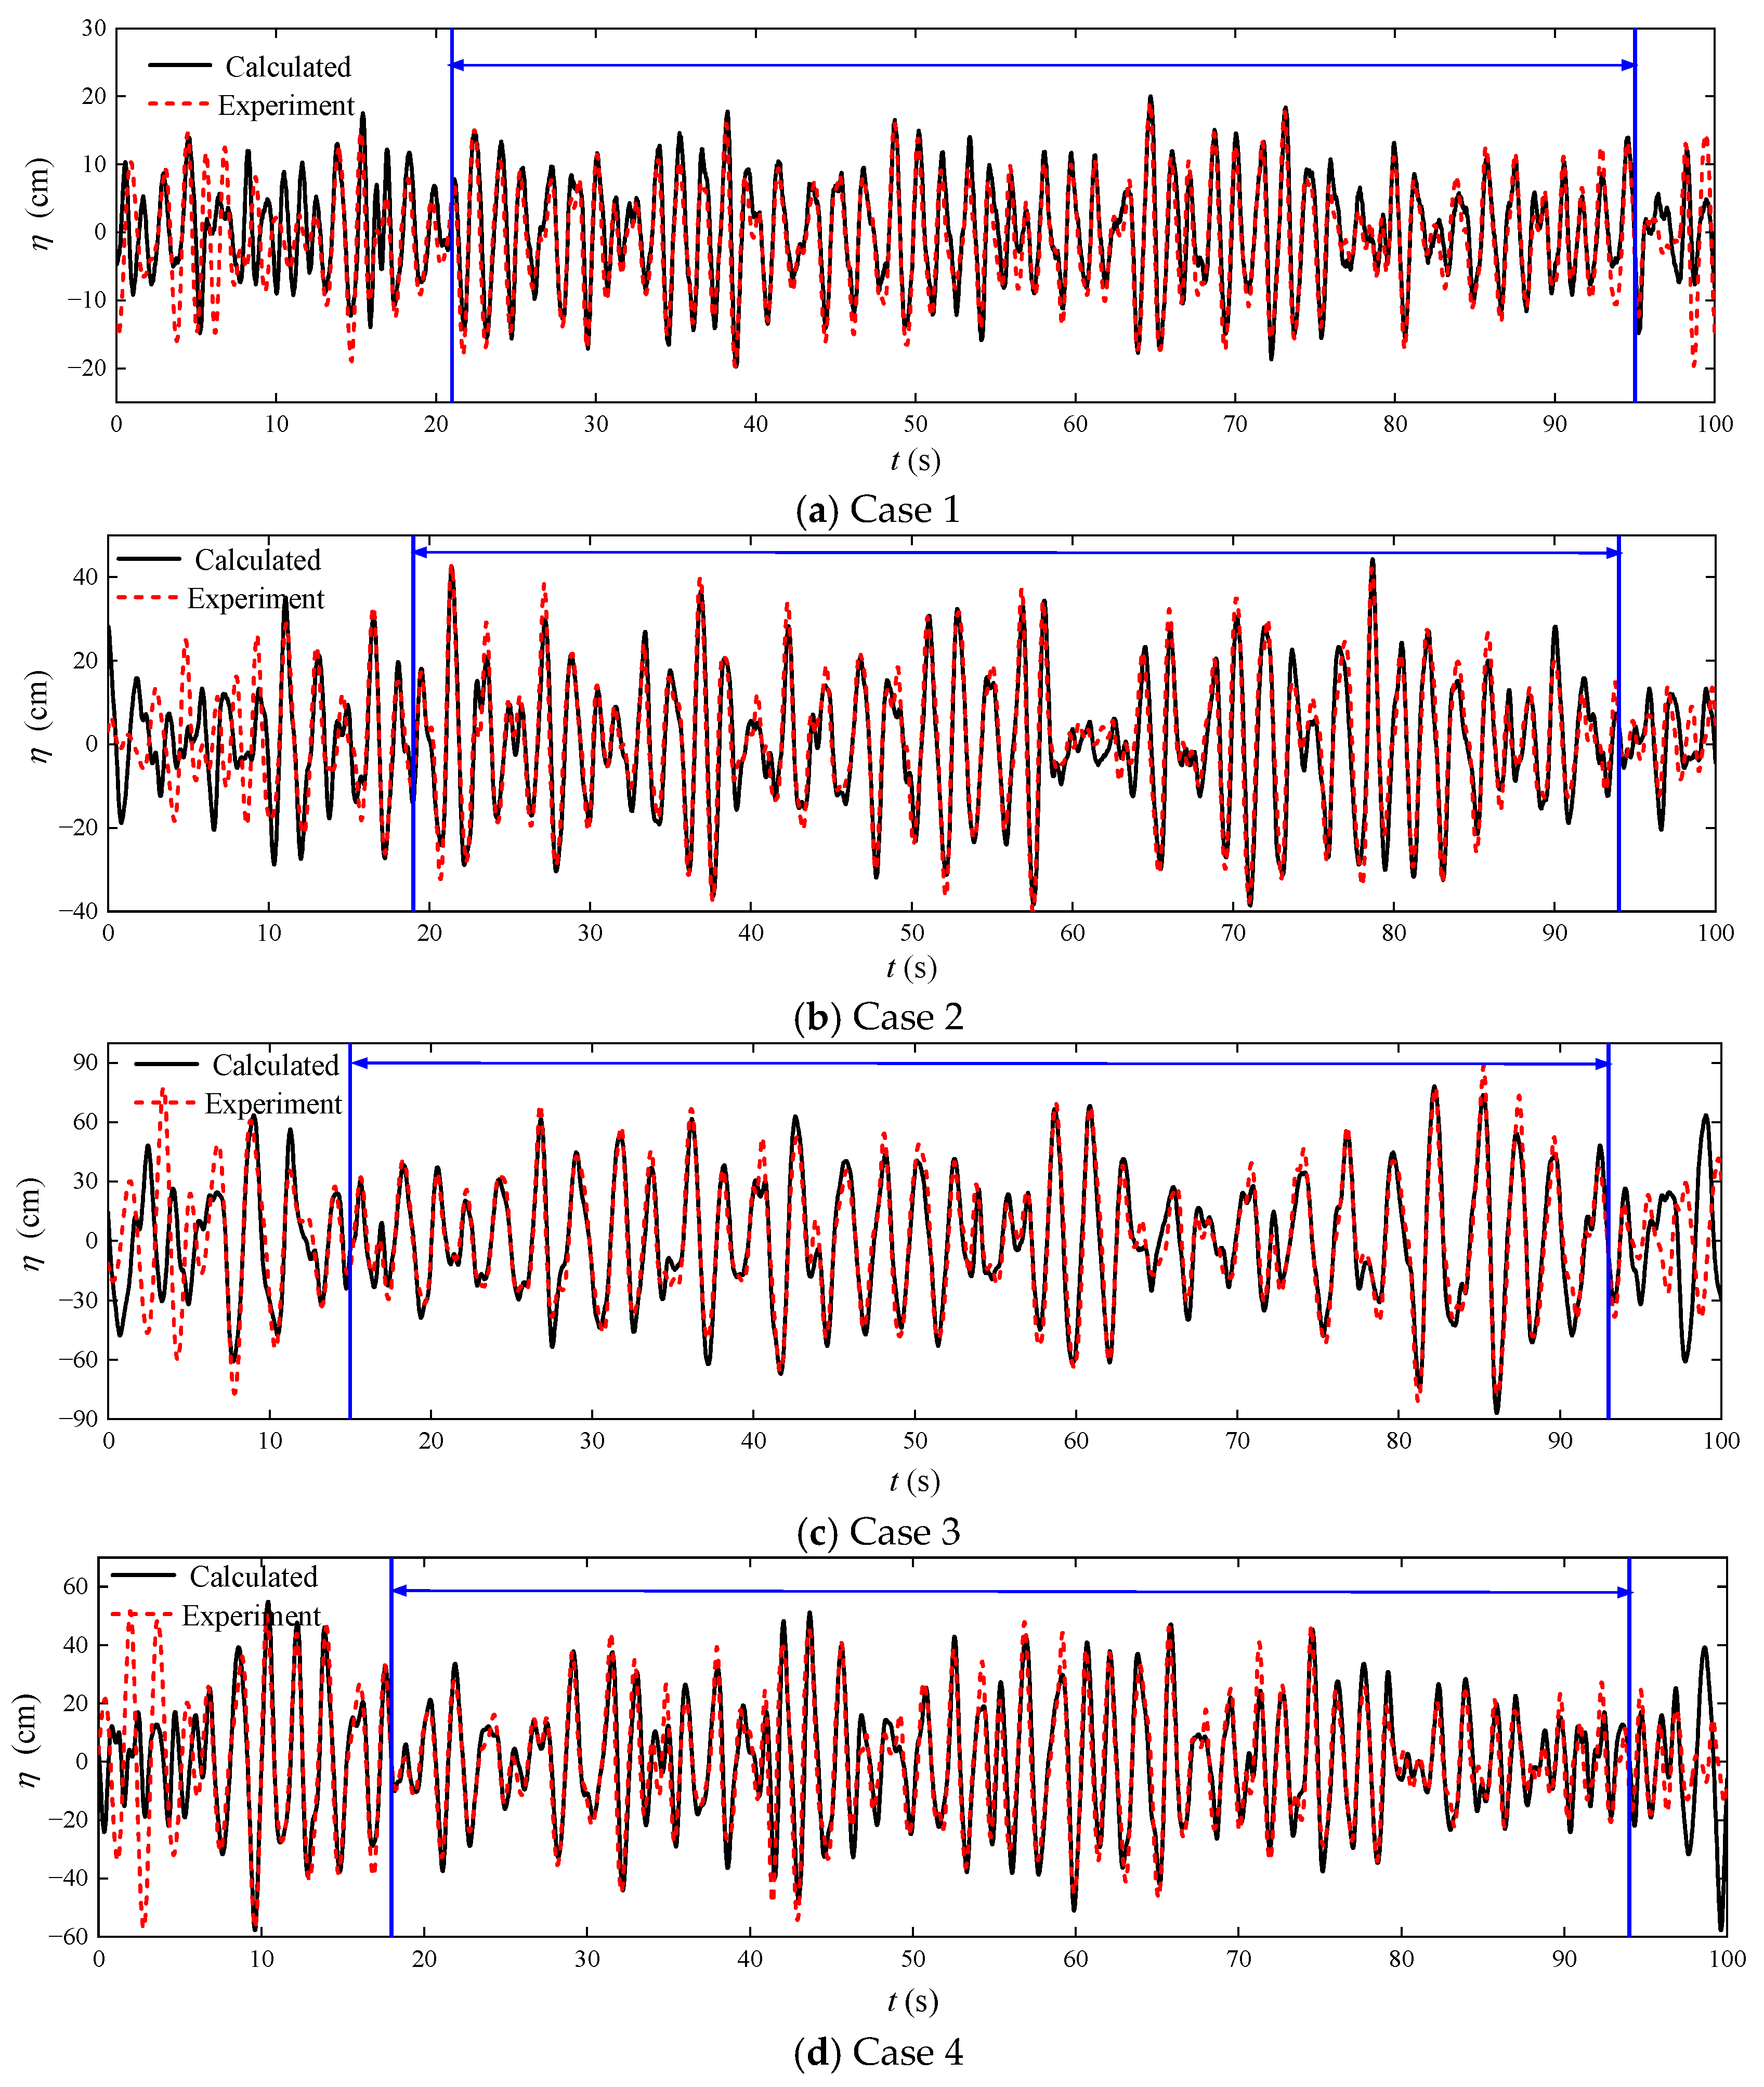
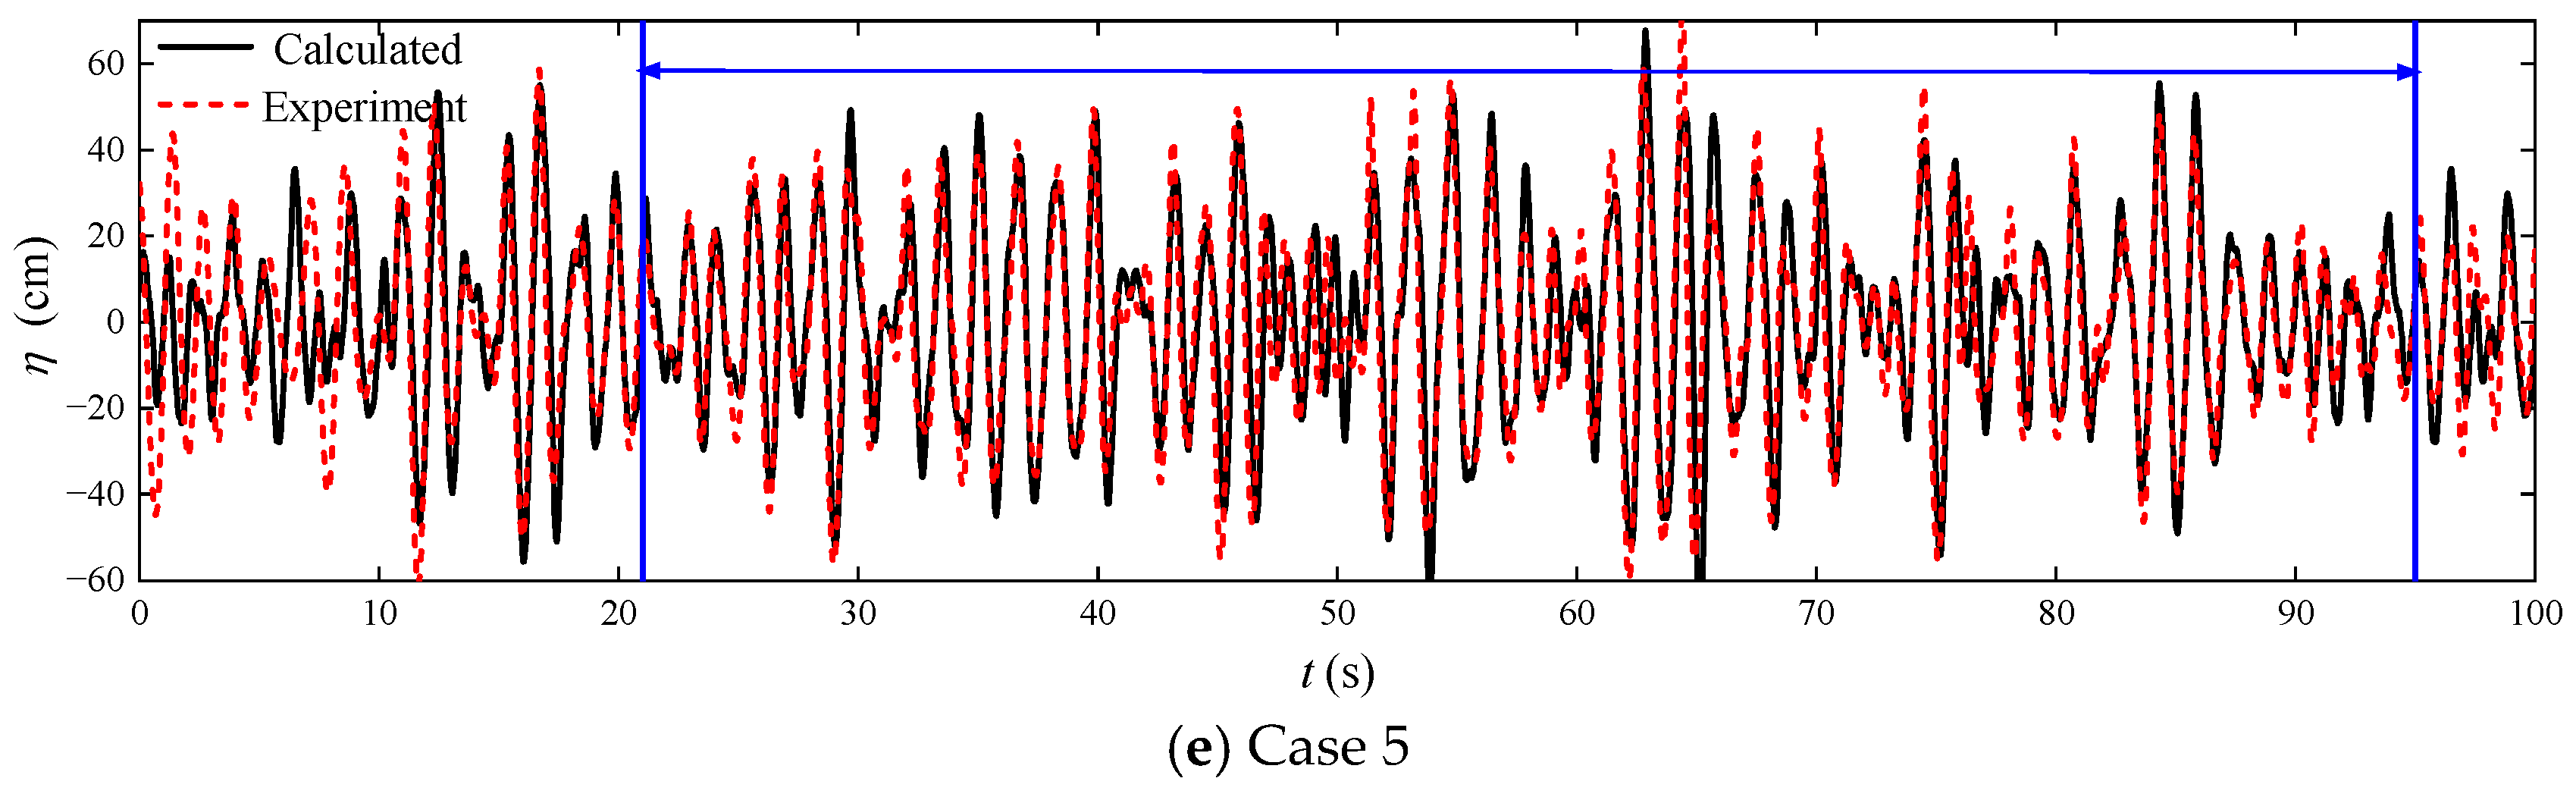
The comparison between the calculated elevation and the measured elevation in the experiment is shown in
Figure 13. For each case, the consistent time zone is given and it can be seen that the reconstructed wave surface elevation maintains good consistency with the measured wave surface in both phase and amplitude. However, when beyond the consistent time zone, there will be a noticeable deviation in the reconstructed wave surface elevation. This result indicates that the consistent time zone calculation method provided in this paper is accurate and the consistent time zones could be conservative due to the maximum error of 0.01. Meanwhile, it can be seen that with the increase in wave periods, the length of consistent time zone increases from 74 s (Case 1 and Case 5) to 78 s (Case 3). This is because the propagation and prediction of waves in this paper are calculated based on linear wave theory. Under the linear assumption, the propagation speed of waves is only related to the wave period. When the wave period is longer, the frequency distribution corresponding to the main energy area of the waves will tend towards the low-frequency part, indicating that its constituent sub-waves are more likely to be low-frequency regular waves. Since low-frequency regular waves spread faster, the length of consistent time zone of the waves will decrease.
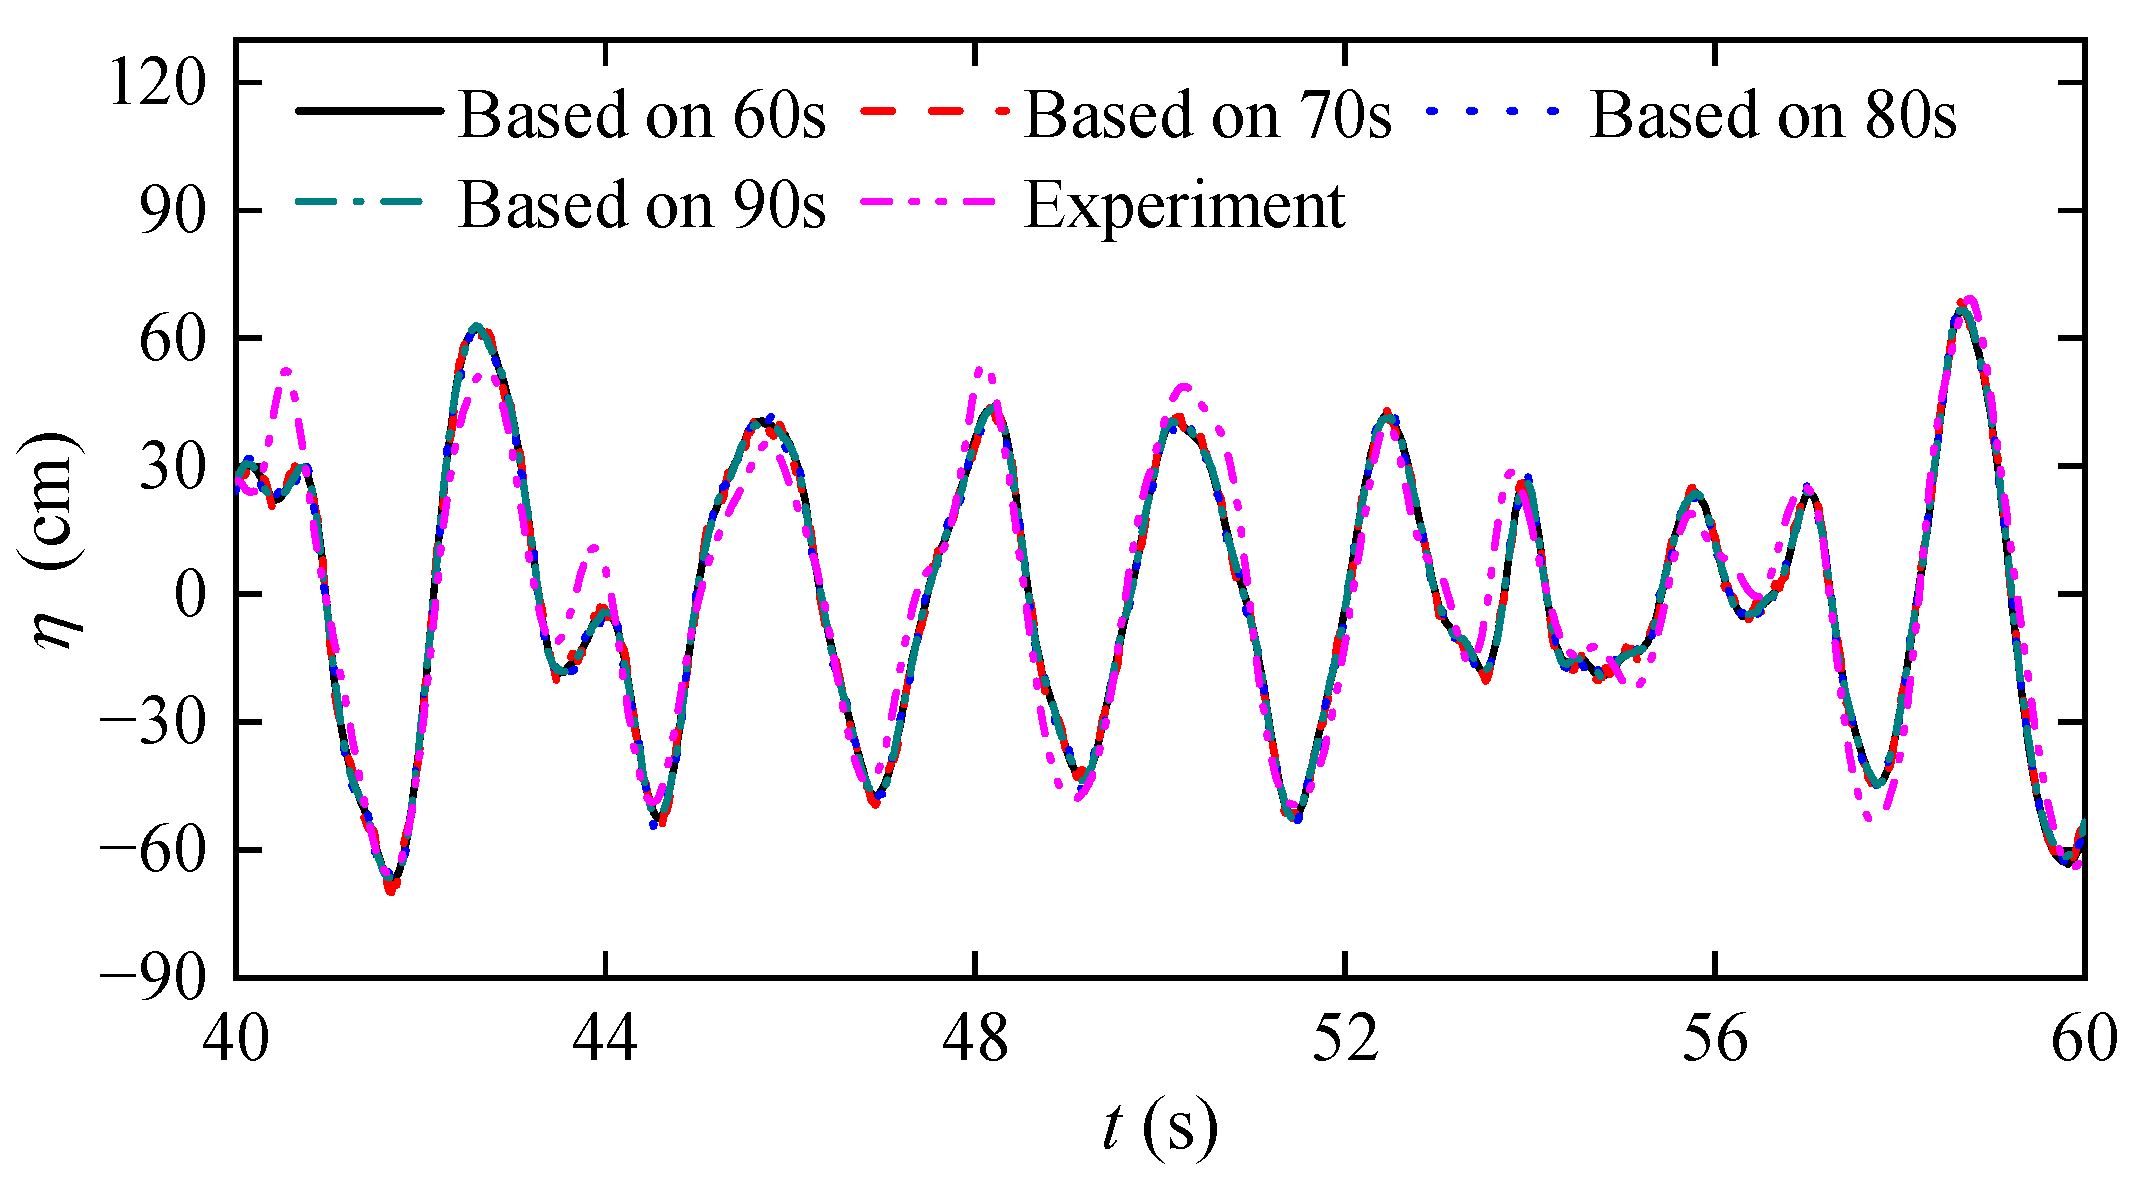
Regarding the consistent time zone, there are some discrepancies between the experimental data and the calculated wave elevation. To investigate the reasons for these differences, four different durations of measured wave elevation from Case 3 are used to calculate the wave elevation for wave probe #2. All four different durations of measured wave elevation can be utilized to determine the consistent time zone interval of 40 to 60 s. As shown in
Figure 14, there are approximately no differences among the four calculated elevations. Therefore, the differences between the calculated elevation and experimental data may be attributed to the wave probe measurement error and the minor nonlinearity of the wave tank experiment data. Meanwhile, when using the FFT method, there may be wave energy leakage during the reconstruction process, leading to certain deviations in the reconstruction results. Overall, the calculated results can keep good consistency with the measured wave elevations.
7. Conclusions
The propagation velocity of DSWP and the influences of environmental factors are studied in this paper. The Taylor expansion to wave number is used to prove that the group velocity is the propagation velocity of wave components. A discrete error function for calculating the consistent time zones and distance zones is defined. A 12 m/s Pierson–Moskowitz spectrum as a target spectrum is used to generate irregular waves in the simulation. The consistent zones of time, space and spacetime are all investigated, and the results show that the method in this paper can accurately obtain consistent time zones and distance zones.
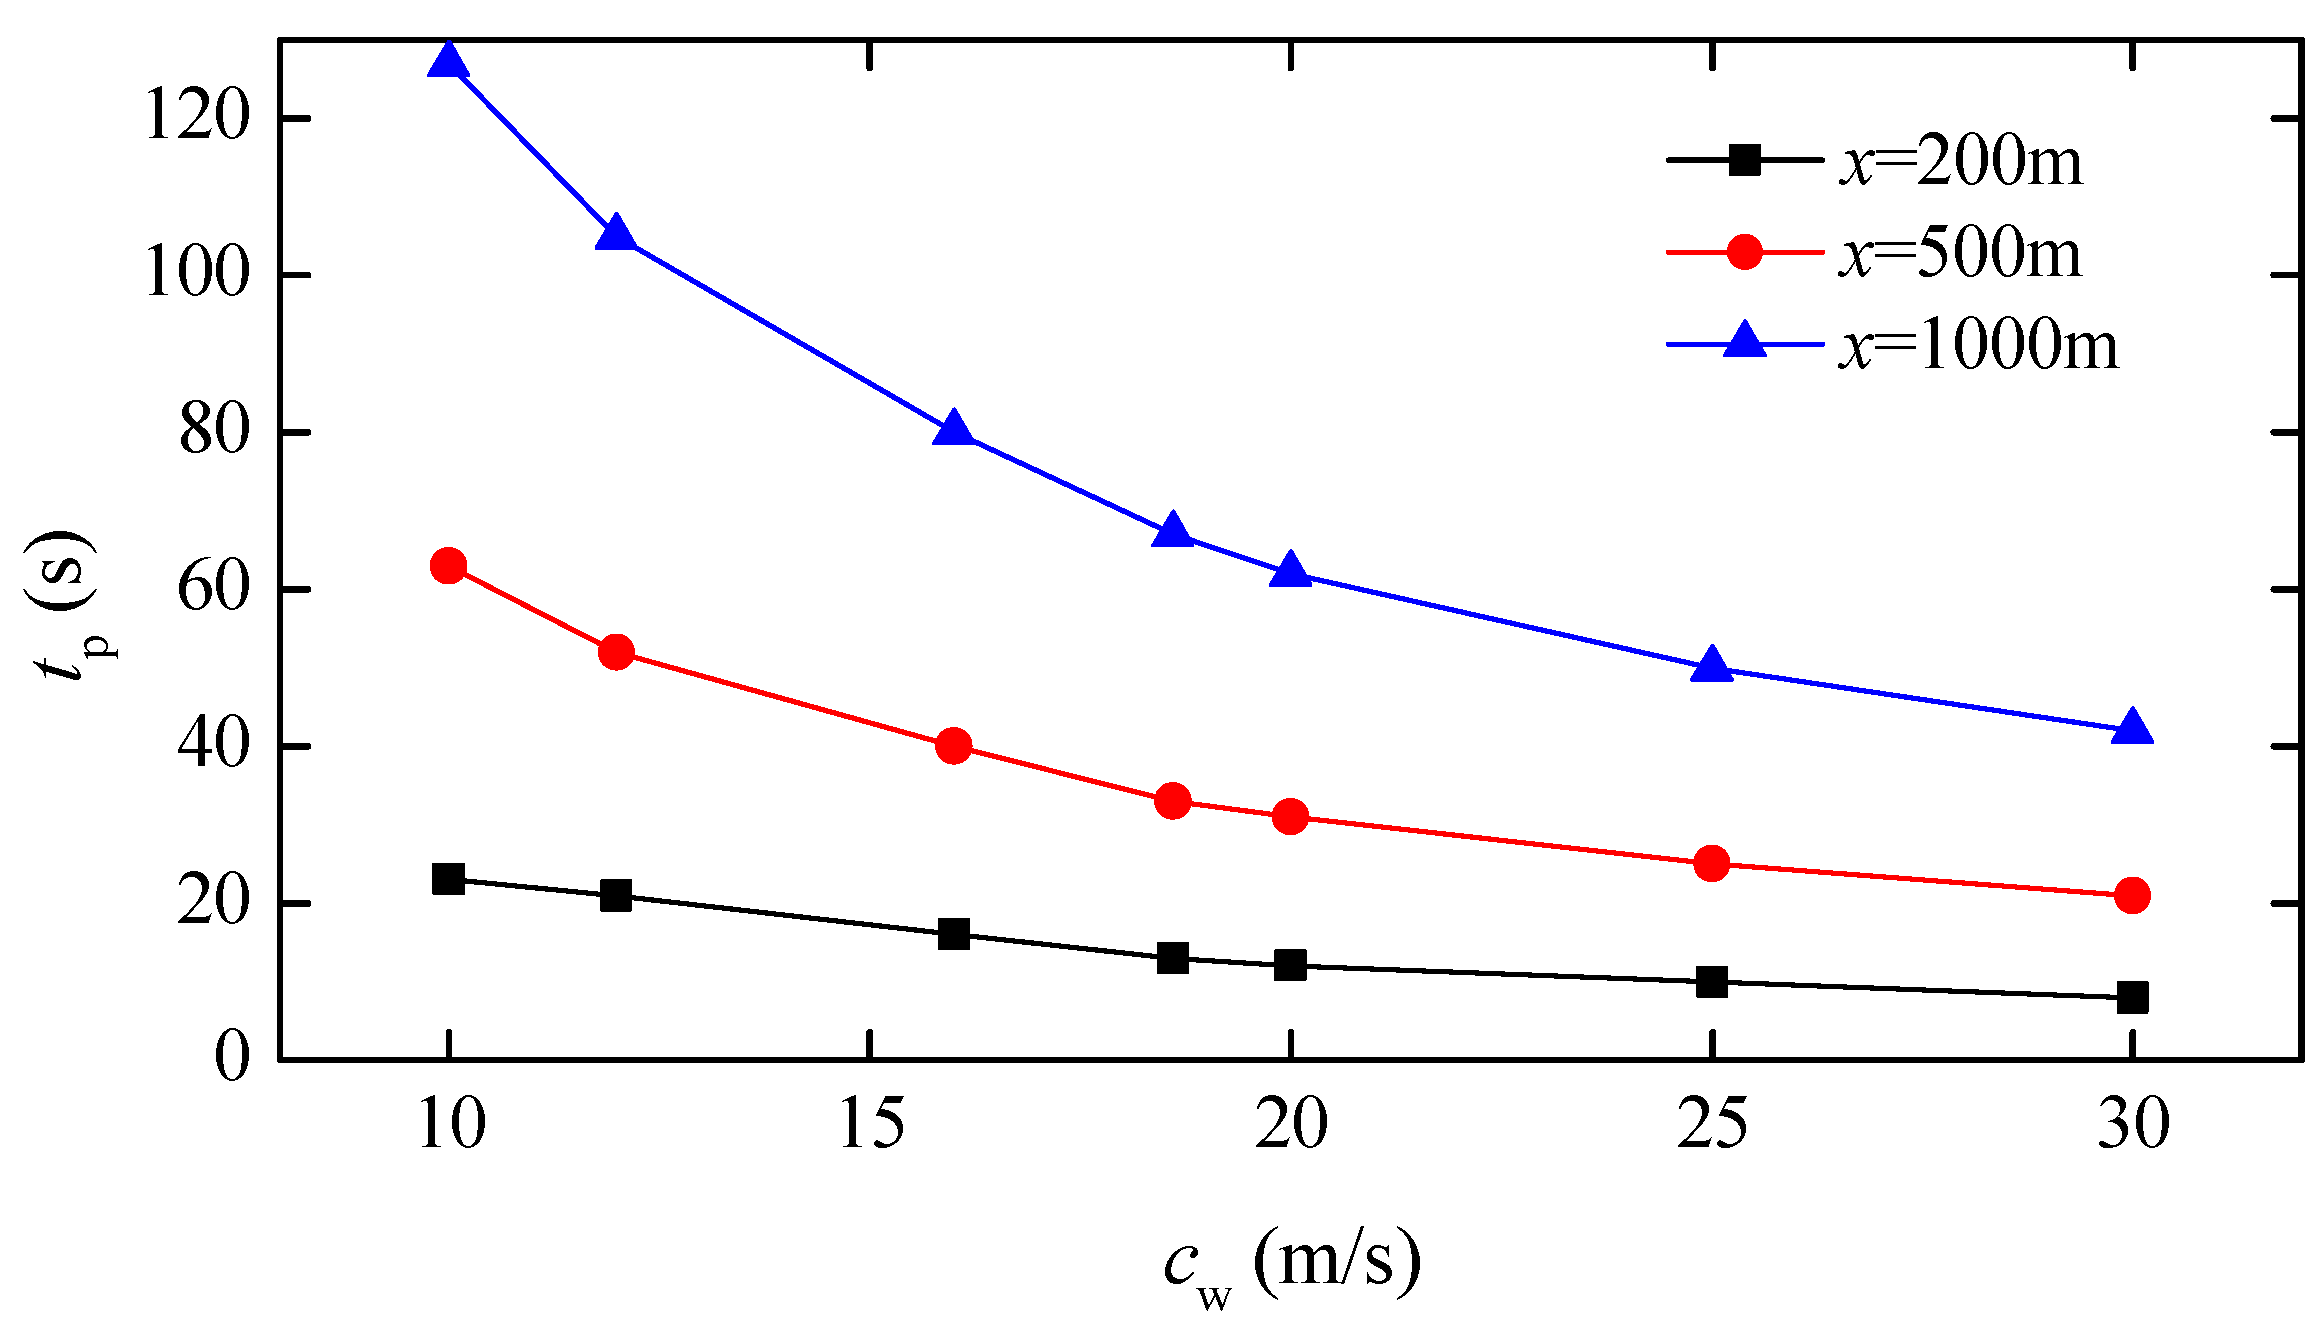
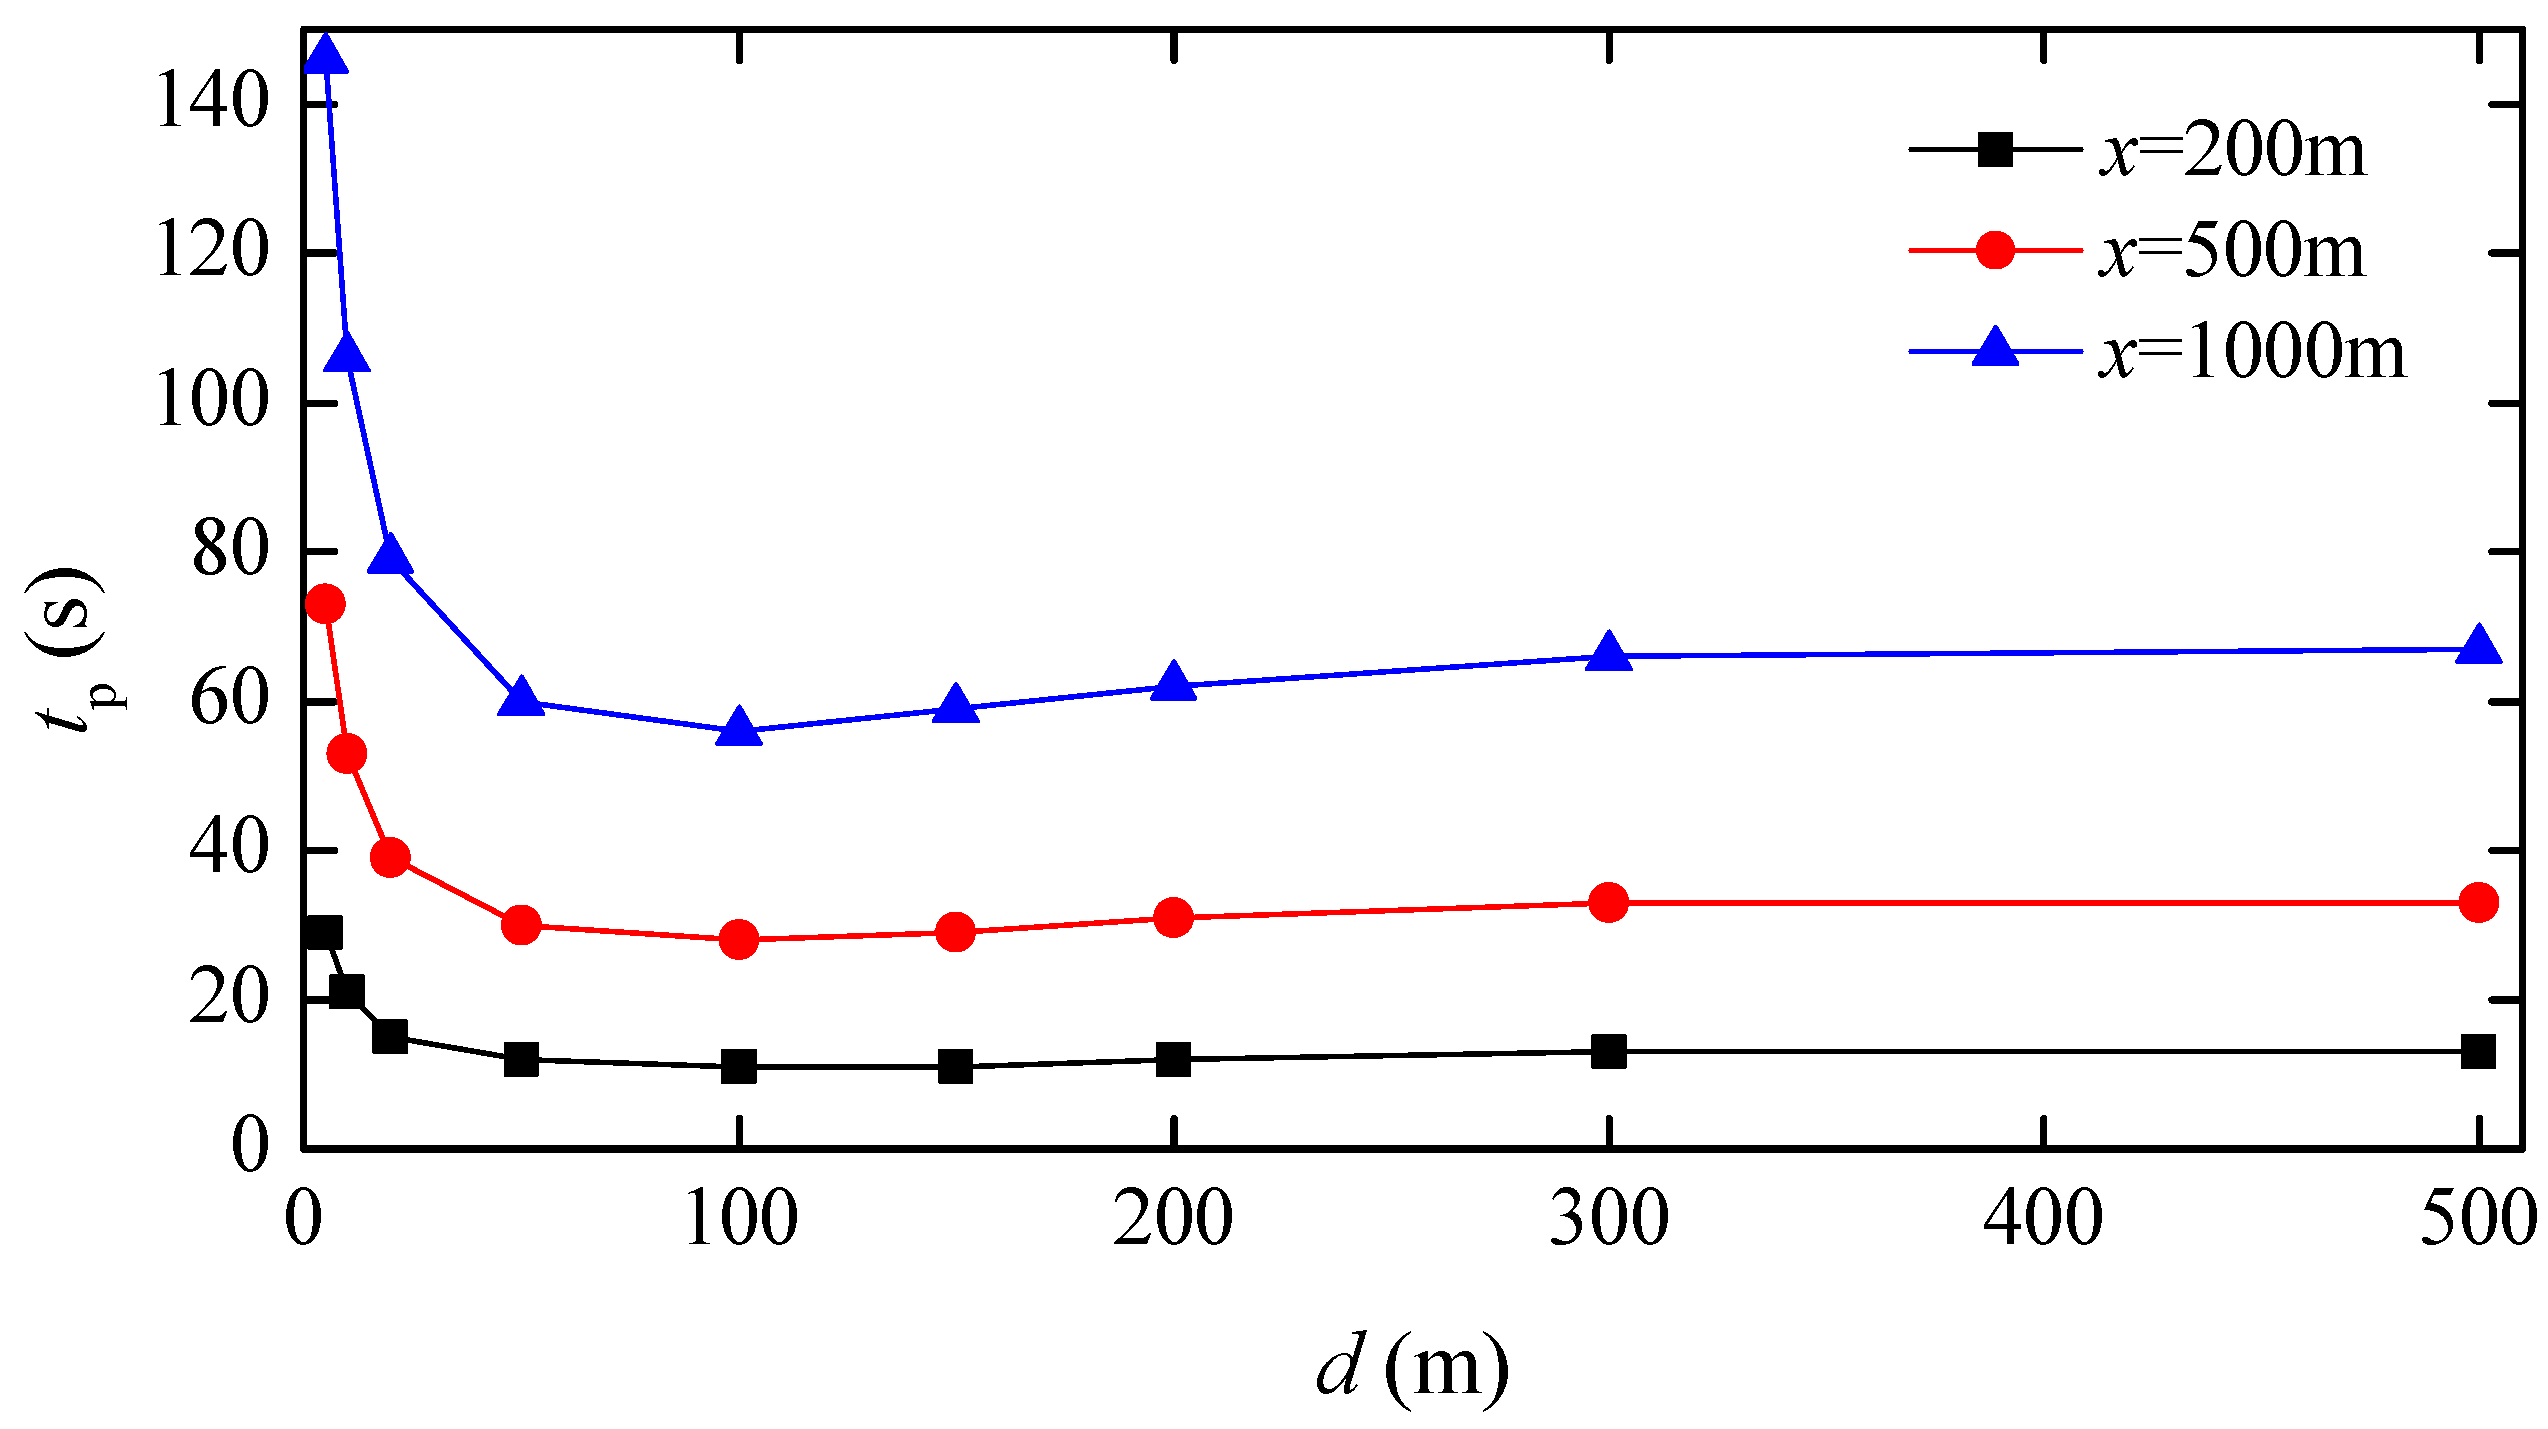
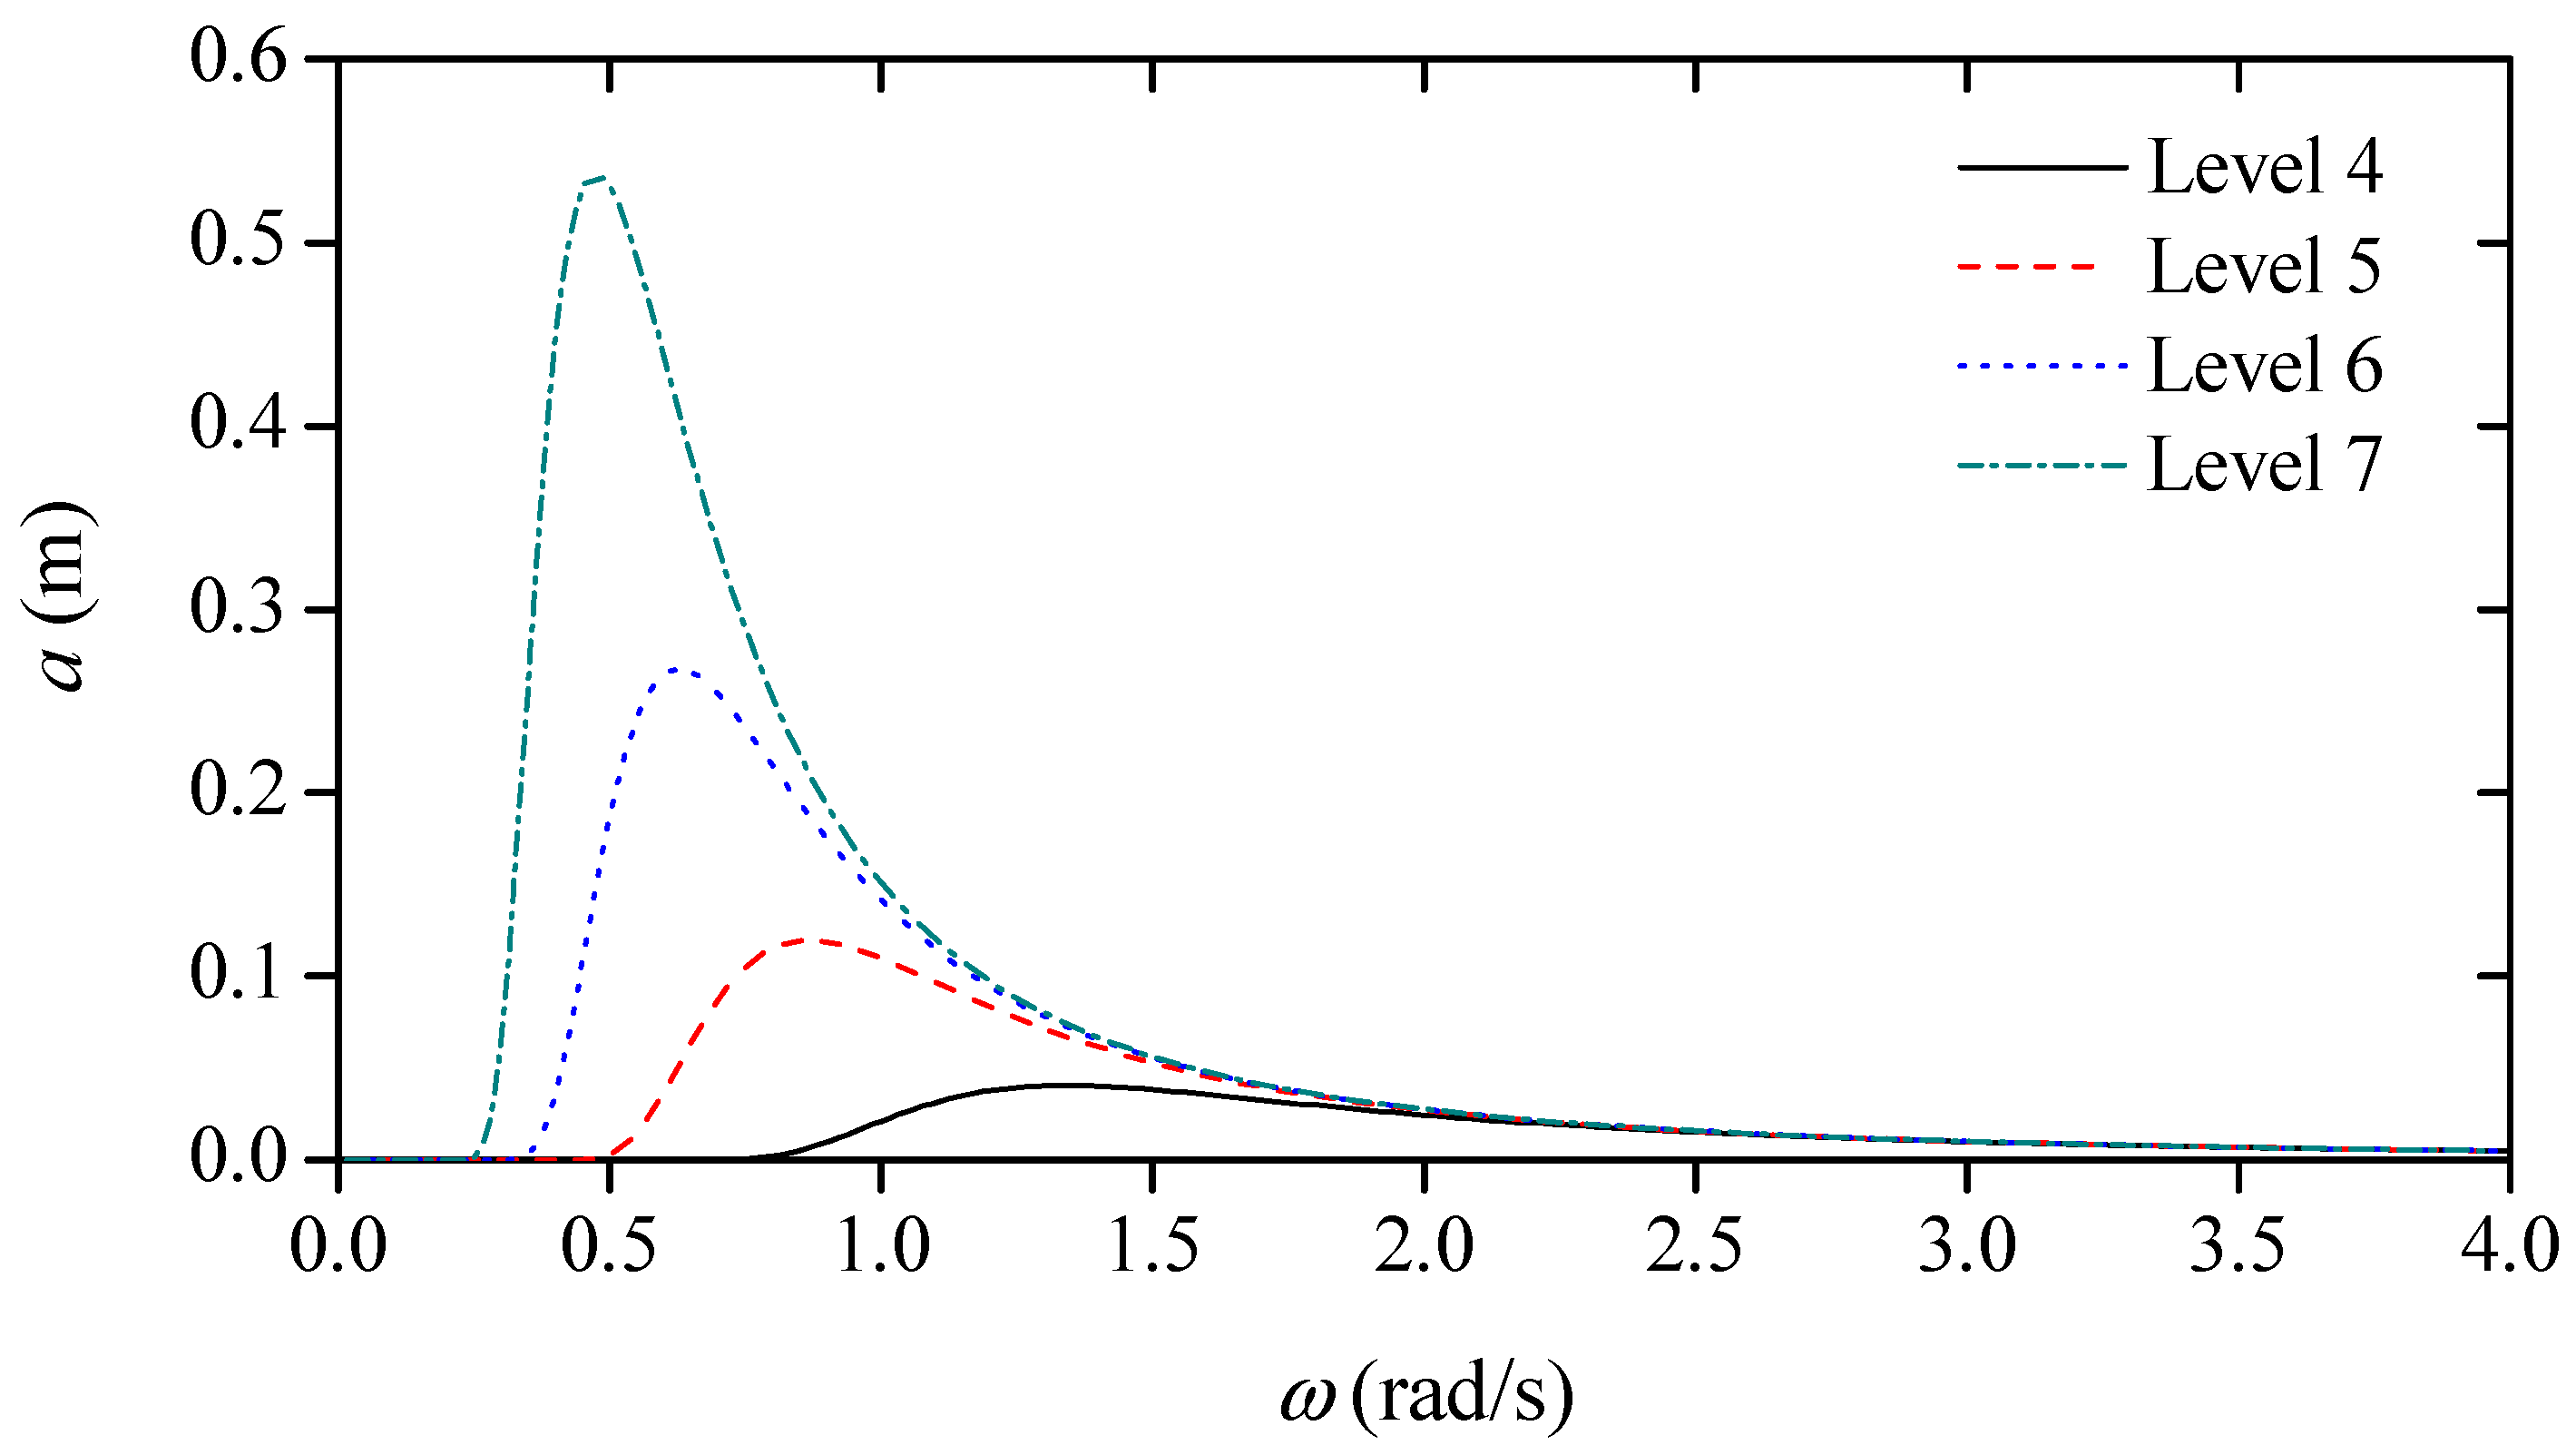
Moreover, the differences of the calculated results based on group velocity and phase velocity are further investigated. The results show that the group velocity can provide good consistent distance zones rather than that of the phase velocity. The results of DSWP methods are verified by the experiments. The influencing factors, including the wind speed, water depth and sea-level of the waves, are considered in this paper. The results show that the predictable time will decrease with higher wind speed or sea-level. With the increase of water depth, the predictable time shows a trend from decline to rise and then it becomes stable.
The detailed analysis of the wave predictable domain can better provide wave prediction information for offshore operations, enhancing the safety of such activities. For instance, during navigation, ships can realize the ship motion prediction by sensing and predicting surrounding waves. The analysis of the wave predictable domain can help to refine the prediction results more effectively. Additionally, as ships navigate through different sea areas, environmental factors such as water depth, wind speed, and sea conditions in the navigational area will change. By integrating the impact analysis of these environmental factors on the wave predictable domain provided in this article, a more precise judgment of the wave predictable domain can be made. This enhances the confidence interval of the predicted results, thereby better ensuring the safety of navigation operations.
It should be noted that the conclusions conducted in this paper are based on linear wave theory. Therefore, when dealing with wave data that exhibits strong nonlinearity, there may be discrepancies between the analysis results of the predictable domain using the methods in this paper. However, the method can still provide a reasonable trend of variation. Nevertheless, nonlinear DSWP models need to be further investigated to achieve accurate nonlinear phase-resolved wave prediction. Meanwhile, in the research concerning the environmental influencing factors on wave propagation, the wave environment under actual sea conditions is more complex. For instance, changes in seafloor topography and variations in water temperature will affect the wave propagation progress. Therefore, conducting detailed studies in specific sea areas based on measured data will be of significance for guiding related offshore operations.


