Abstract
The dynamic evolution behavior of submerged water jet cavitation clouds was studied by combining experiments and simulation. The formation, development, shedding, and collapsing process of a void cloud was analyzed by high-speed camera technology, and the influence of jet pressure was studied. Cavitation water jet erosion experiments were carried out on AL6061 specimens with standard cylindrical nozzles, and the correlation between cavitation cloud evolution and material erosion was studied by surface analysis. The results showed that the evolution of a cavitation cloud has obvious periodicity, that one period is about 0.8 ms, and its action region can be divided according to the attenuation rate of the jet velocity of the nozzle axis. The attenuation rate of the jet velocity at the nozzle axis in the central jet action zone is less than or equal to 82.5%, in the mixed action zone greater than 82.5% and less than 96%, and in the cavitation action zone greater than or equal to 96%. The erosion damage characteristics in different regions of the mixed action zone are significantly different.
1. Introduction
A submerged cavitation water jet combines cavitation with water jet technology and has a wide range of applications in cleaning underwater facilities such as ships, submarine pipelines, and marine aquaculture cages [1]. Cavitation is a common phenomenon in water jets, where cavitation bubbles collide with the material surface and collapse near the surface boundary, causing erosion damage to the target surface [2]. Cavitation impacts, including micro jets and shock waves generated by the collapse of cavitation bubbles, are one of the main mechanisms leading to cavitation erosion [3]. The distance between the cavitation nozzle and the target surface has a significant impact on cavitation erosion, resulting in various morphological changes on the material surface.
Scholars have conducted extensive research on the erosion behaviors of cavitation water jets. Watanabe [4] conducted experimental studies on the structure of cavitation jet clouds and the changes in the surface erosion morphology of specimens using scanning electron microscopy. The results showed that the collapse of cavitation bubbles near the specimen surface in cavitation jets was related to the distribution of erosion areas on the sample surface. Liu [5] studied various erosion modes caused by the impact of cavitation water jets under atmospheric pressure conditions through experiments and numerical simulations. They found that cavitation caused the surface of the specimen to form a ring-shaped erosion zone. Through simulations, it was found that the narrowing of jet width and further reduction of radial wall flow velocity led to a reduction in the impact area of the cavitation cloud. Soyama [6] compared the erosion characteristics of different types of cavitation jets and pointed out that cavitation jets have the strongest erosion ability under atmospheric pressure conditions. Chillman [7,8] studied the erosion characteristics of cavitation jets through experiments; the results showed that there were two typical peak values of mass loss, and there were significant differences in the corresponding erosion characteristics. Han [9] studied the impact load of cavitation water jets through numerical simulation, and the results showed that the collapse of the cavitation cloud on the material surface caused a high-pressure impact load and stress concentration, leading to plastic deformation of the material. Zhaojie [10] studied the influence of different parameters on the erosion effect of cavitation jets through numerical simulation and experiments and found that the angular nozzle corresponds to different optimal target distances at different cavitation numbers. Peng [11] conducted finite element analysis and experimental research on the impact distribution of the flow field at different target distances. The results showed that the impact distribution of the flow field can be divided into circular and annular shapes, and the impact ability of cavitation water jets can be inferred by analyzing the areas of cavitation pits at different target distances. Thermesa [12] studied the pressure distribution generated by the collapse of the cavitation cloud on the wall through numerical simulation and proposed a new erosion prediction and evaluation method. Yongfei [13] studied the instantaneous and time-averaged flow fields of underwater jets through numerical simulation and predicted the evolution process of the cavitation cloud in the jets.
Existing research mainly focuses on the static characteristics of cavitation phenomena, and there is relatively little experimental research on the dynamic behavior of the cavitation cloud in a cavitation water jet, especially the initiation, development, detachment, and collapse processes of the cavitation cloud. Moreover, few scholars have correlated the dynamic evolution of a cavitation cloud with the erosion behaviors of cavitation water jets at different target distances. The dynamic evolution behavior of a cavitation cloud is closely related to cavitation bubble collapse, which is one of the main mechanisms leading to cavitation erosion.
Therefore, this study aims to analyze the dynamic evolution process of the cavitation cloud in cavitation water jets. By experimental investigation exploring the initiation, development, detachment, and collapse cycles of a cavitation cloud; analyzing and determining the range of the concentrated bubble collapse of cavitation water jets; and studying the surface morphology characteristics of the specimen and its relationship with the jet target distance through numerical simulation and experimental research, this study delves into the dynamic evolution of cavitation clouds and their relationship with the erosion effect of cavitation water jets at different target distances. This study helps to reveal the erosion behavior and mechanism of cavitation water jets at different target distances and establishes a foundation for optimizing the process.
2. Experimental Plan
2.1. Experimental Setup
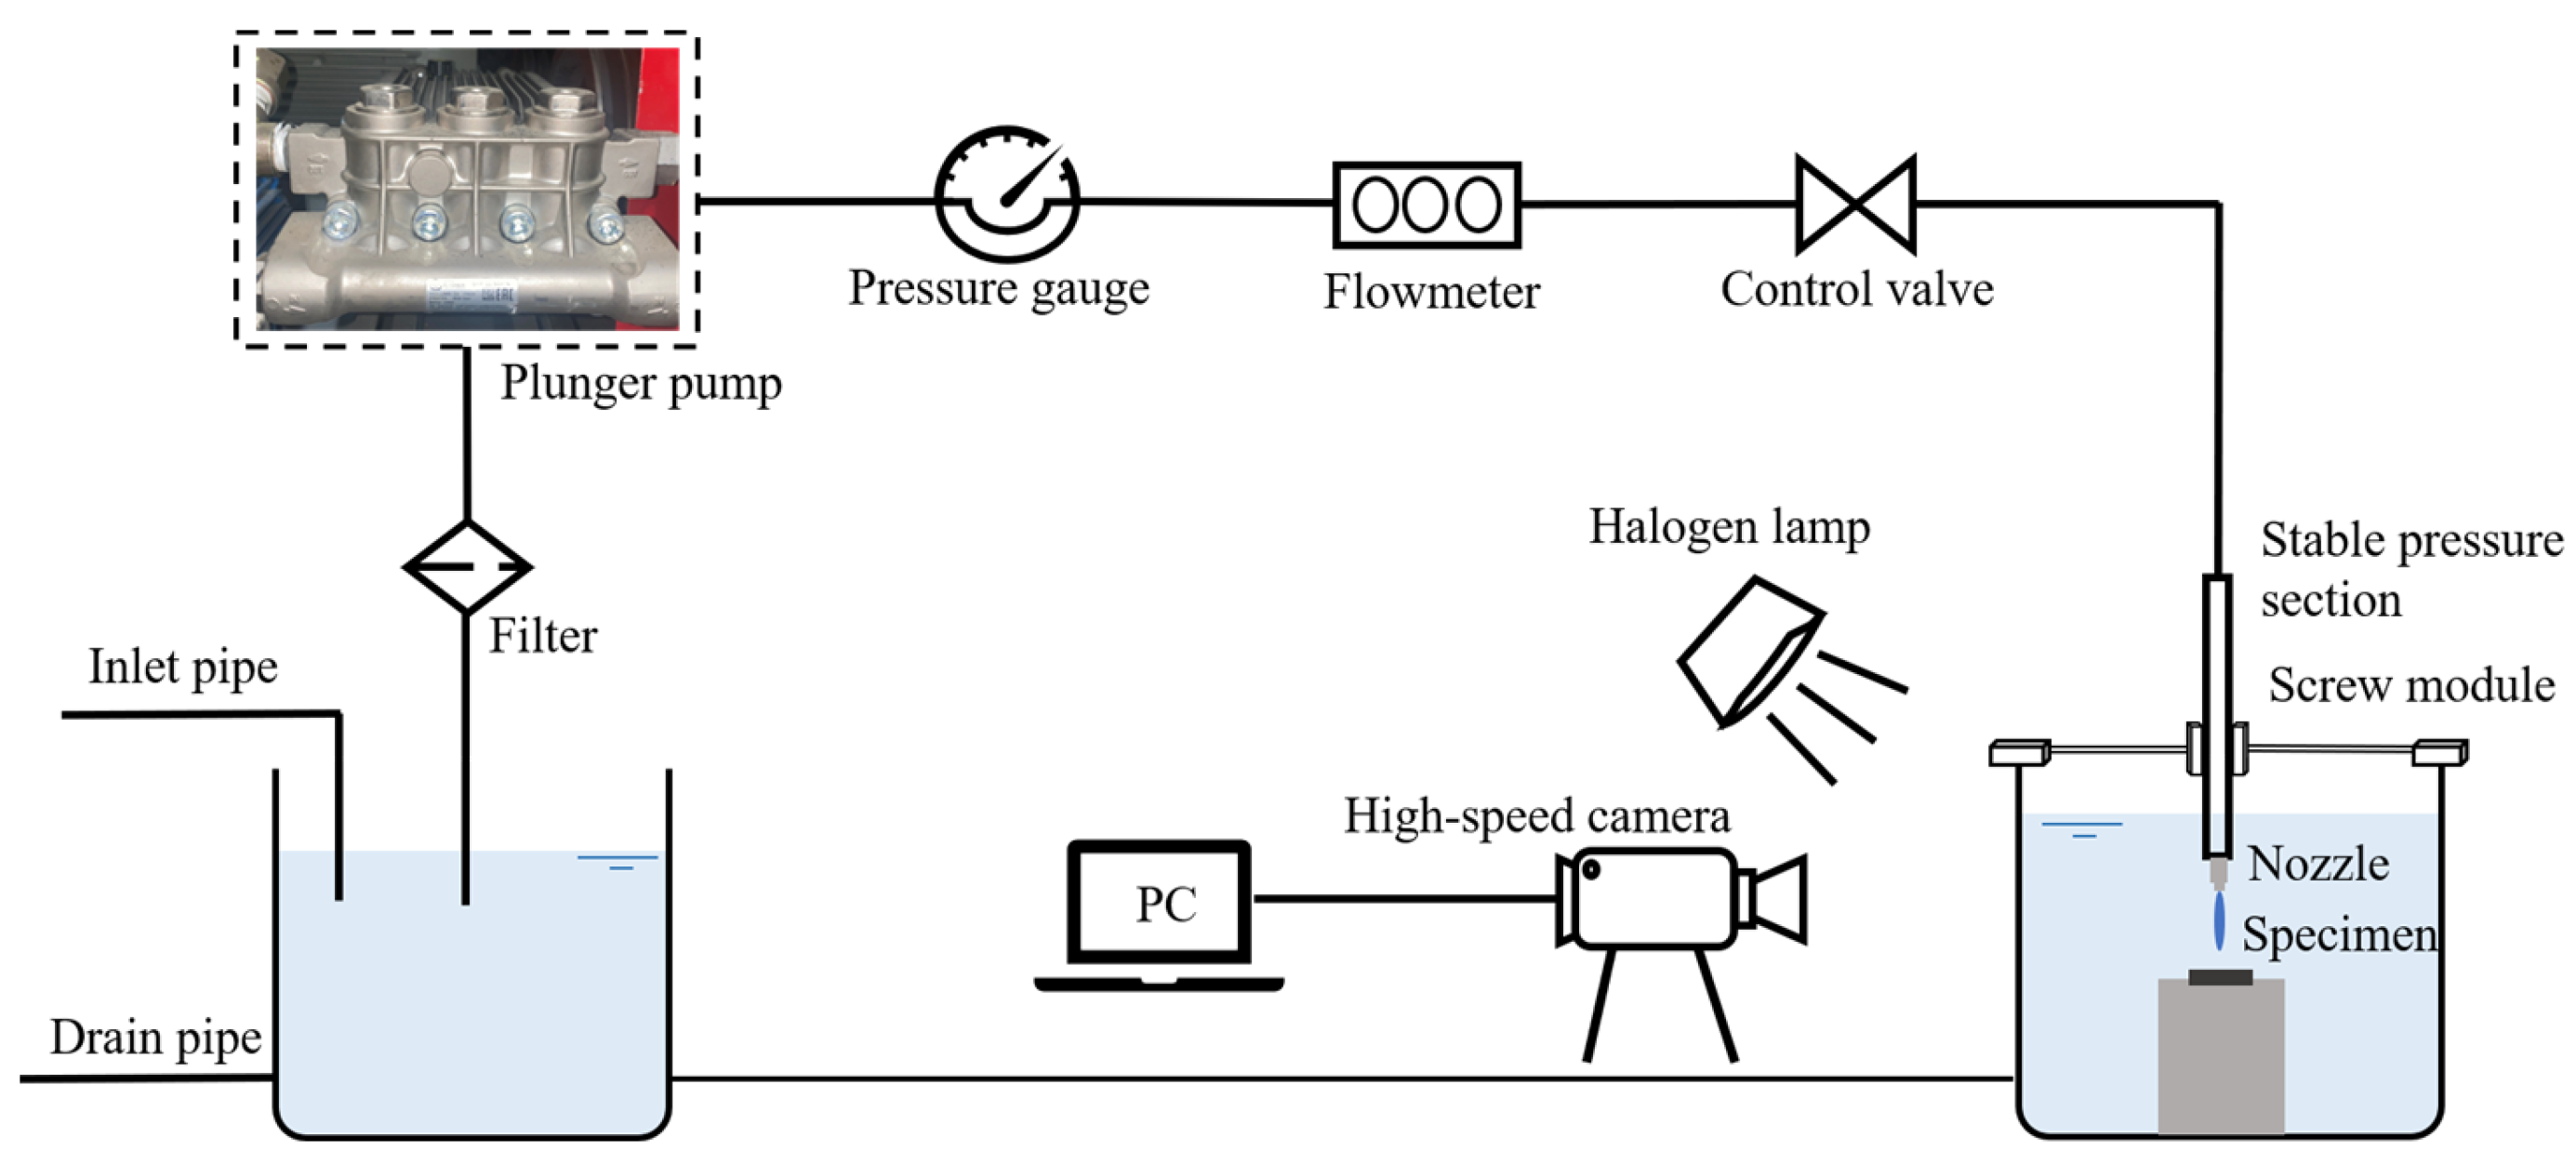
This study conducted a visualized submerged cavitation water jet erosion experiment. A high-pressure water jet erosion system was used in the laboratory to generate cavitation jets; the experimental setup is shown in Figure 1. Analogues of such test rigs are widely used in world practice [14,15,16,17,18,19]. We used an Italian AR high-pressure plunger pump to provide pressure for the jet, with a rated pressure of 50 MPa and a rated flow of 16 L/min. We used a variable-frequency motor to provide power for the plunger pump; controlled the pump speed through the variable frequency to adjust the pressure in the upstream pipeline of the nozzle; measured the pressure through a pressure gauge (accuracy ± 0.5% FS); and measured the flow through a turbine flowmeter (accuracy ± 0.5% FS).
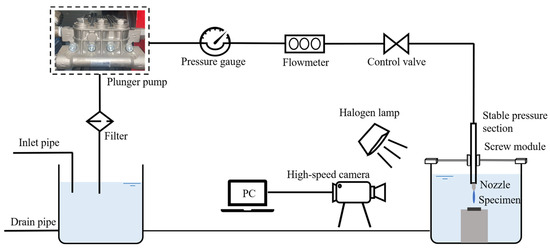
Figure 1.
Scheme of test rig.
Using clean water treated with a soft water filter as the experimental medium, the medium was filtered twice to remove impurities before being fed into the plunger pump to minimize the impact of impurities in the water on its service life and experimental results. A stainless-steel straight pipe with a length of 700 mm and the same diameter as the nozzle inlet was connected upstream of the nozzle to reduce the influence of the upstream bend joint on the flow of the experimental medium at the nozzle. The plunger pump was connected to the stainless-steel straight pipe using a high-pressure hose and the nozzle was fixed on the three degree of freedom screw module with a fixture, with a positioning accuracy of 0.01–0.02 mm. Pressure relief valves and pressure gauges were installed in the high-pressure pipelines to prevent accidental overpressure of equipment.
In cavitation jet experiments, there are many types of nozzles that can be used, including self-oscillating nozzles, conical nozzles, angle nozzles, and standard cylindrical nozzles, all of which can be used for cavitation jet-related research [20]. This experiment used a standard cylindrical nozzle, with an inlet section length (L1) of 29.6 mm; a throat length (L2) of 4 mm; an outlet section length (L3) of 6.4 mm; a throat diameter (d) of 0.8 mm; and an outlet diameter (E) of 6.4 mm. The nozzle structure is shown in Figure 2; the optimal size ratio of d:E:L3 = 1:8:8 [21] was used to generate cavitation jets. The specimen model was Al6061, with a diameter of 45 mm and a thickness of 8 mm; its chemical composition is shown in Table 1.
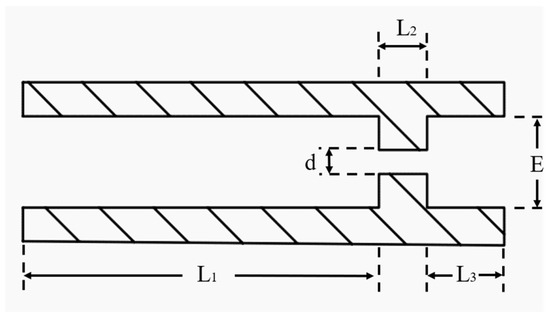
Figure 2.
Cylindrical nozzle.

Table 1.
Chemical composition of specimen (%).
In the engineering application of underwater cleaning, the injection pressure of a water jet is usually less than 20 MPa [22], so in the experiment the plunger pump pressure was set at intervals of 5 MPa, 10 MPa, 15 MPa, and 20 MPa, with target distances (S) of 10 mm, 20 mm, 30 mm, 40 mm, and 50 mm. A total of 20 experiments were conducted. The water temperature in the container was maintained at 20–23 °C to minimize the impact of hydrothermal performance [23], and the valve was adjusted to ensure that the water level inside the container remained basically unchanged. The experiment was conducted at room temperature and pressure, and a high-precision pressure gauge was installed to minimize errors caused by human operation, ensuring the repeatability of the experiment.
The shooting area size of the high-speed camera (Phantom camera) was 640 × 360 px, and the image acquisition frequency was 10,000 fps. To enhance the clarity of the image and the visibility of the cavitation cloud, halogen spotlights were used for supplementary lighting. Due to the opacity and strong reflectivity of the cavitation cloud, its corresponding area in the captured image was displayed as white, and the center of the upper edge of the image is located at the nozzle axis. A regular camera was used to capture the macroscopic appearance of the sample surface after the experiment, and observe and measure the relevant data. The image resolution was 780 × 780 px. A scanning electron microscope was used to observe its microscopic appearance [24]. The secondary electron detector (SED) was selected to obtain a clearer and more three-dimensional image of the edge morphology of the cavitation pit [25].
2.2. Numerical Simulation Methods
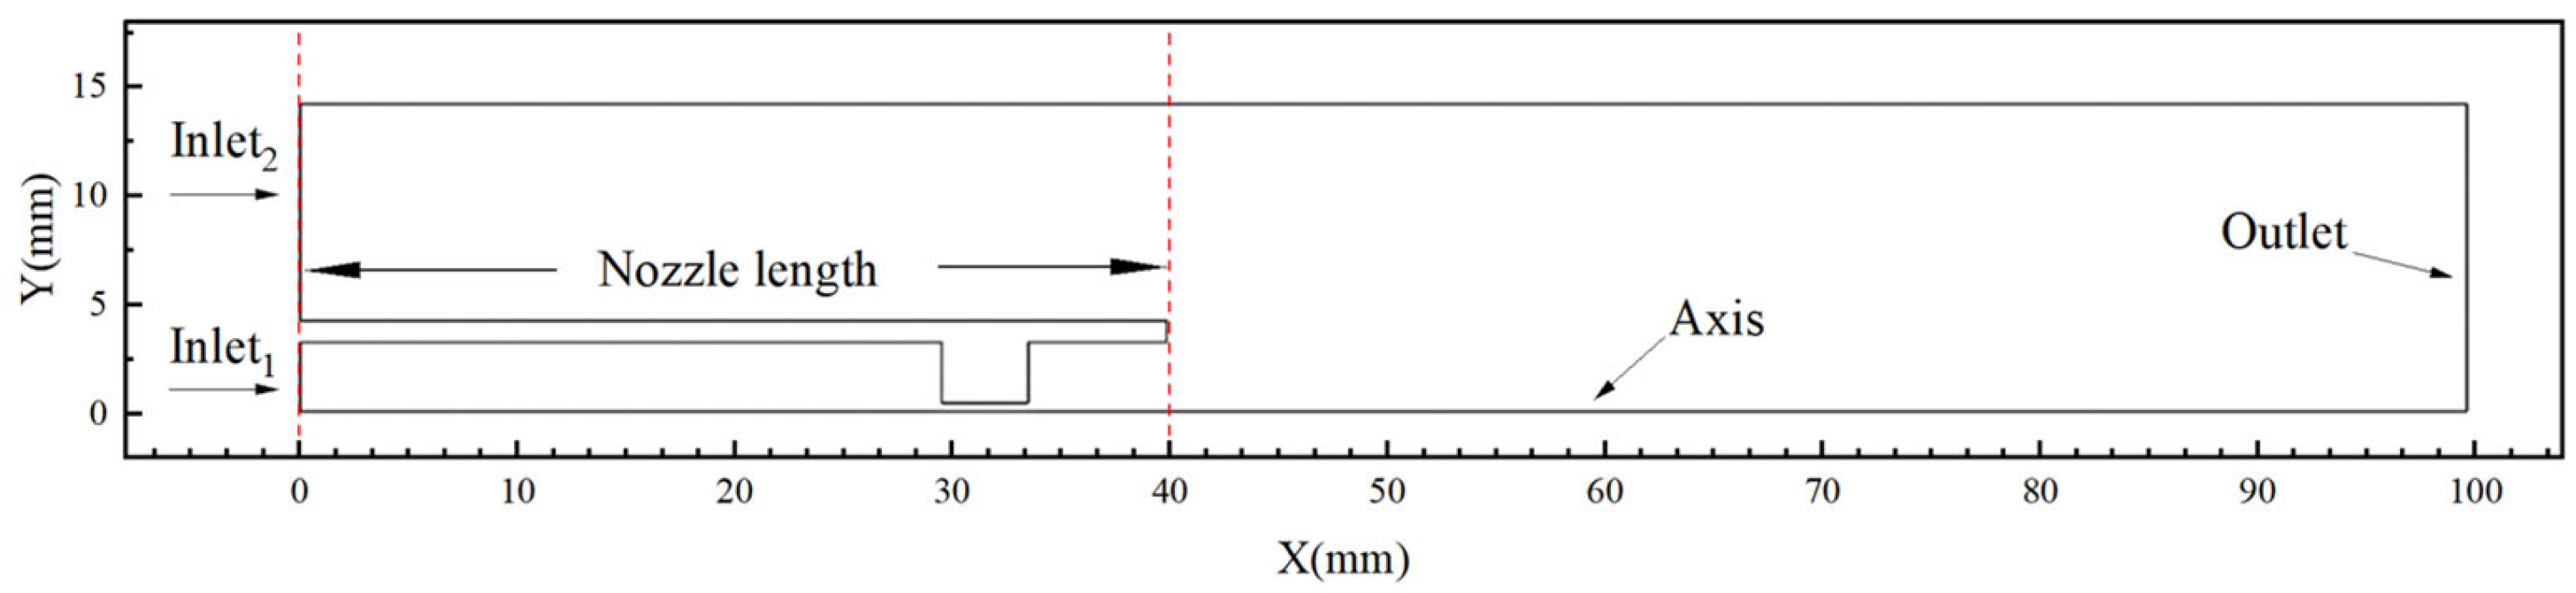
The simulation nozzle model was consistent with the experimental nozzle. The computational boundary must be kept a long way from the nozzle exit in order to reduce its impact on the core area of the jet [26]. Fluent software was thus used to generate a two-dimensional axisymmetric flow field calculation domain with a length of 100 mm and a width of approximately 30 mm (see Figure 3); it is believed that the model boundary has no effect on the core area of the jet. In order to improve grid quality and computational speed, ANSYS-ICEM software was used to create a structured mesh [27]. The cavitation jet is a gas-liquid two-phase flow. A mixture model was used to calculate two-phase flow [28], and the Zwart–Gerber–Belamri (ZGB) model was used to calculate two-phase cavitation flow in order to improve the accuracy and convergence speed of numerical solutions [29,30]; these models have been widely used in other studies [31,32]. The nozzle inlet and liquid level boundary conditions were set by the pressure inlet. The inlet pressure of the nozzle was 10 MPa and the inlet pressure of the liquid level was atmospheric pressure. Due to the nozzle being submerged in liquid, the boundary of the model was actually still a liquid substance, so the volume fraction of the boundary gas mentioned above was 0. The global reference pressure was set to 0. The remaining boundaries were set as non-slip walls [33]. A cavitation jet is a non-stationary phenomenon, so transient calculations were used, and the pressure and velocity coupling adopted the PISO algorithm, with a time step set to 1 μs [34]. X was the horizontal axis length in numerical simulations, including the nozzle length of 40 mm, and S was the experimental target distance: X = S + 40. Finally, the cavitation jet flow field at the nozzle outlet was simulated to obtain the axial jet velocity of the nozzle, and the data were analyzed to study the impact damage of the jet center on the surface of the specimen.
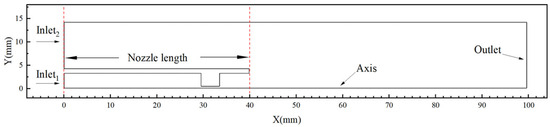
Figure 3.
Fluid computational domain.
3. Discussion
3.1. Analysis of Dynamic Evolution of Cavitation Cloud
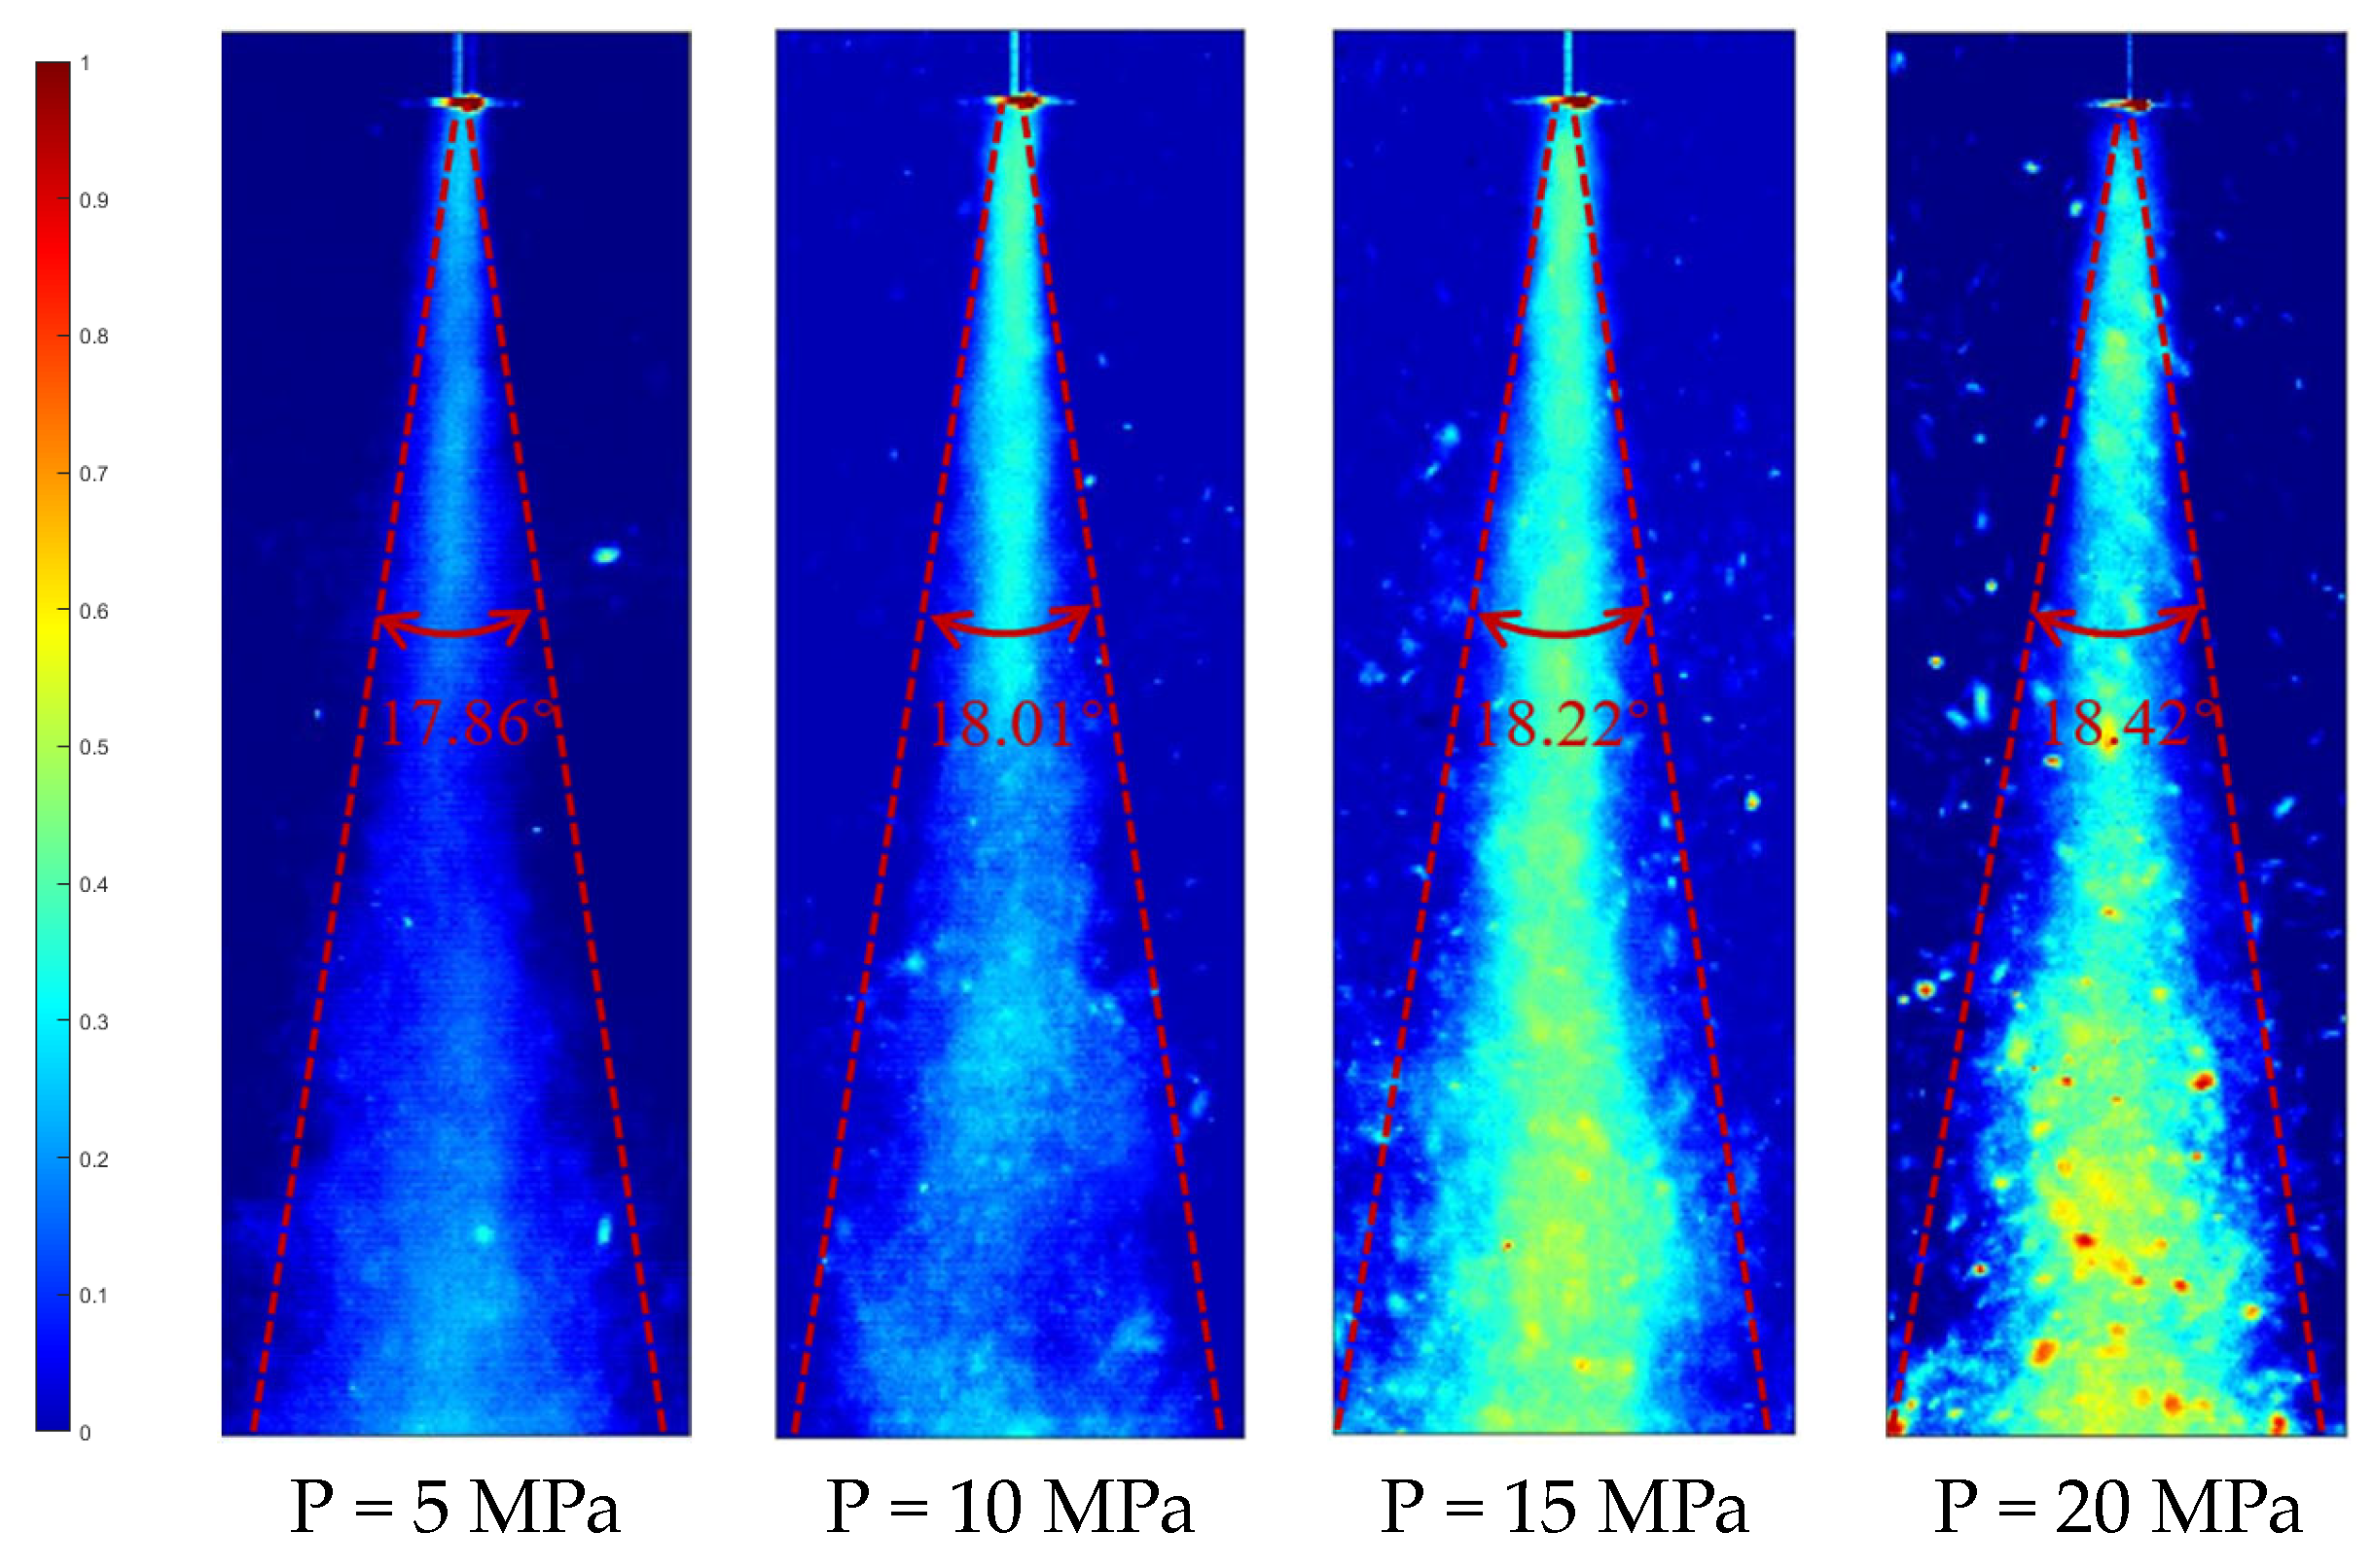
Cavitation first occurs at the nozzle throat [35], and the flow area of the throat decreases, promoting an increase in the liquid flow velocity inside the throat. This leads to the rapid ejection of a water jet carrying a small number of bubbles, forming a cavitation cloud of varying shapes and sizes in the water, and diffusing downstream from the nozzle at a certain angle. In order to measure the diffusion angle of the cavitation cloud more clearly and scientifically under different pressures, professional software was used to convert thousands of images captured by high-speed cameras into grayscale images. Hundreds of grayscale images were synthesized to obtain an average image of corresponding grayscale intensity to obtain a more stable cavitation cloud image. Finally, by mapping the grayscale level to different colors, the synthesized grayscale image was converted into a color image to obtain a clearer image of the cavitation cloud. The closer the value in the color indicator bar is to 1, the greater the grayscale intensity value of the synthesized grayscale image, and the denser the cavitation cloud.
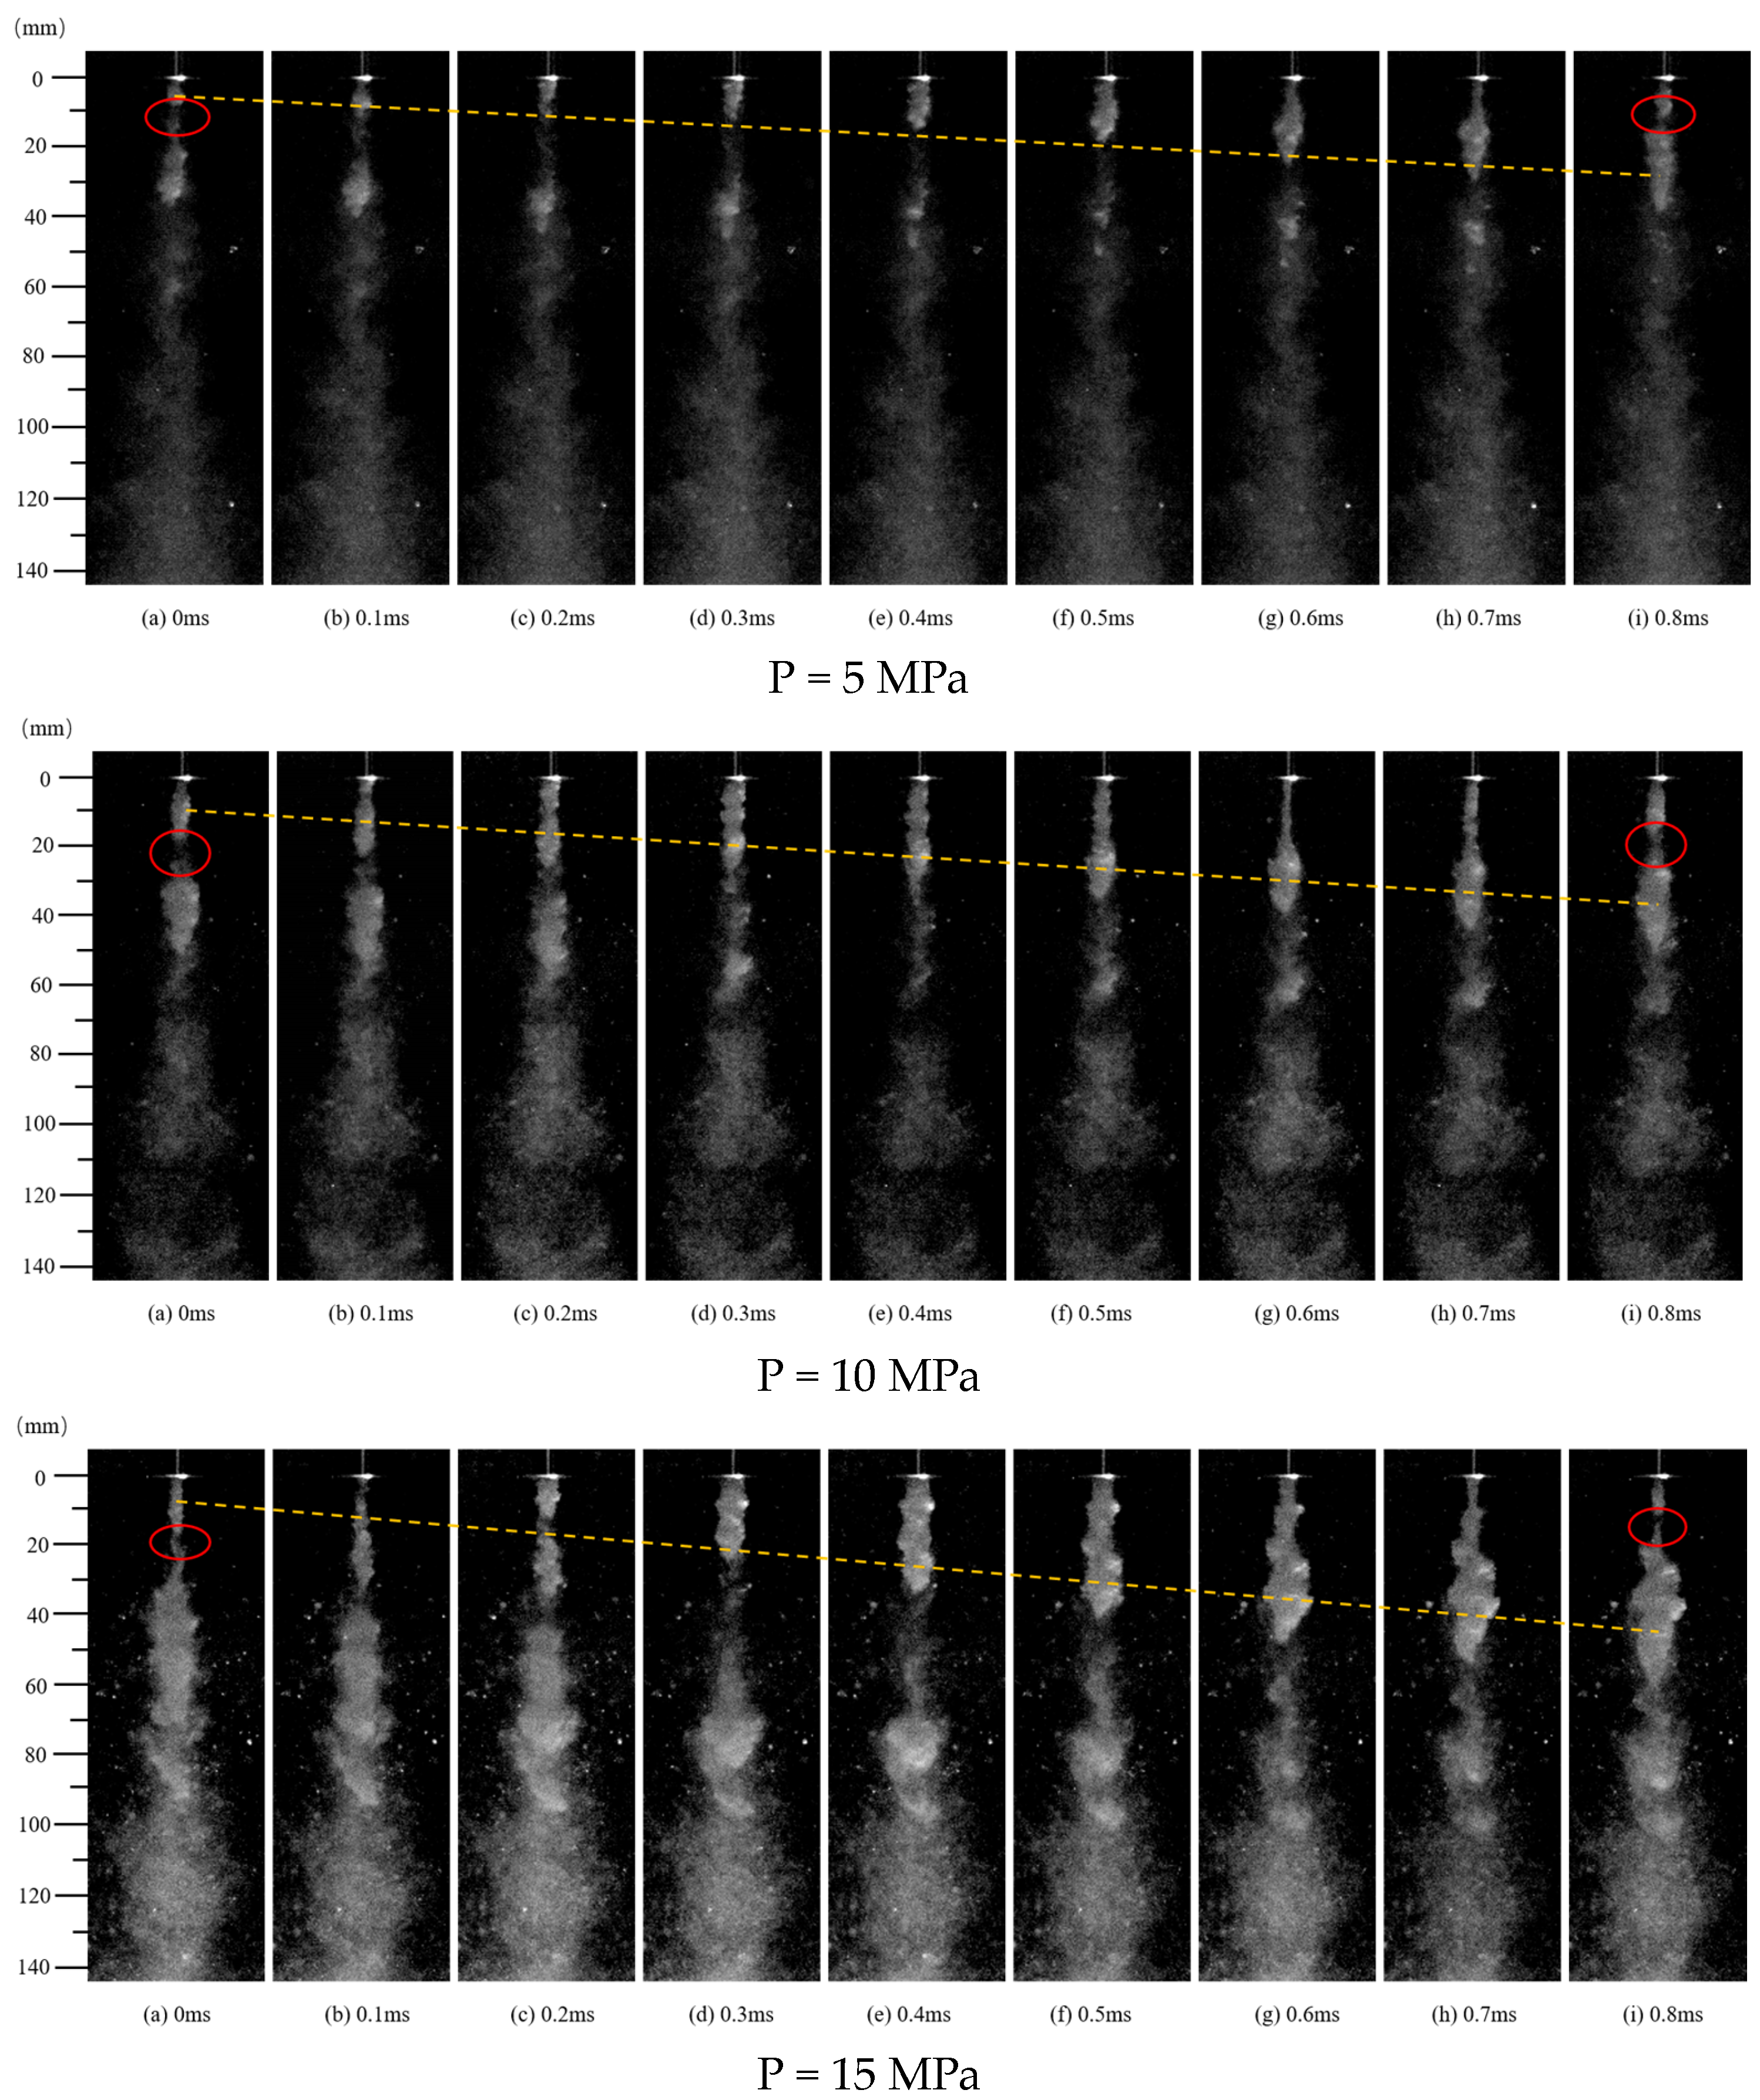
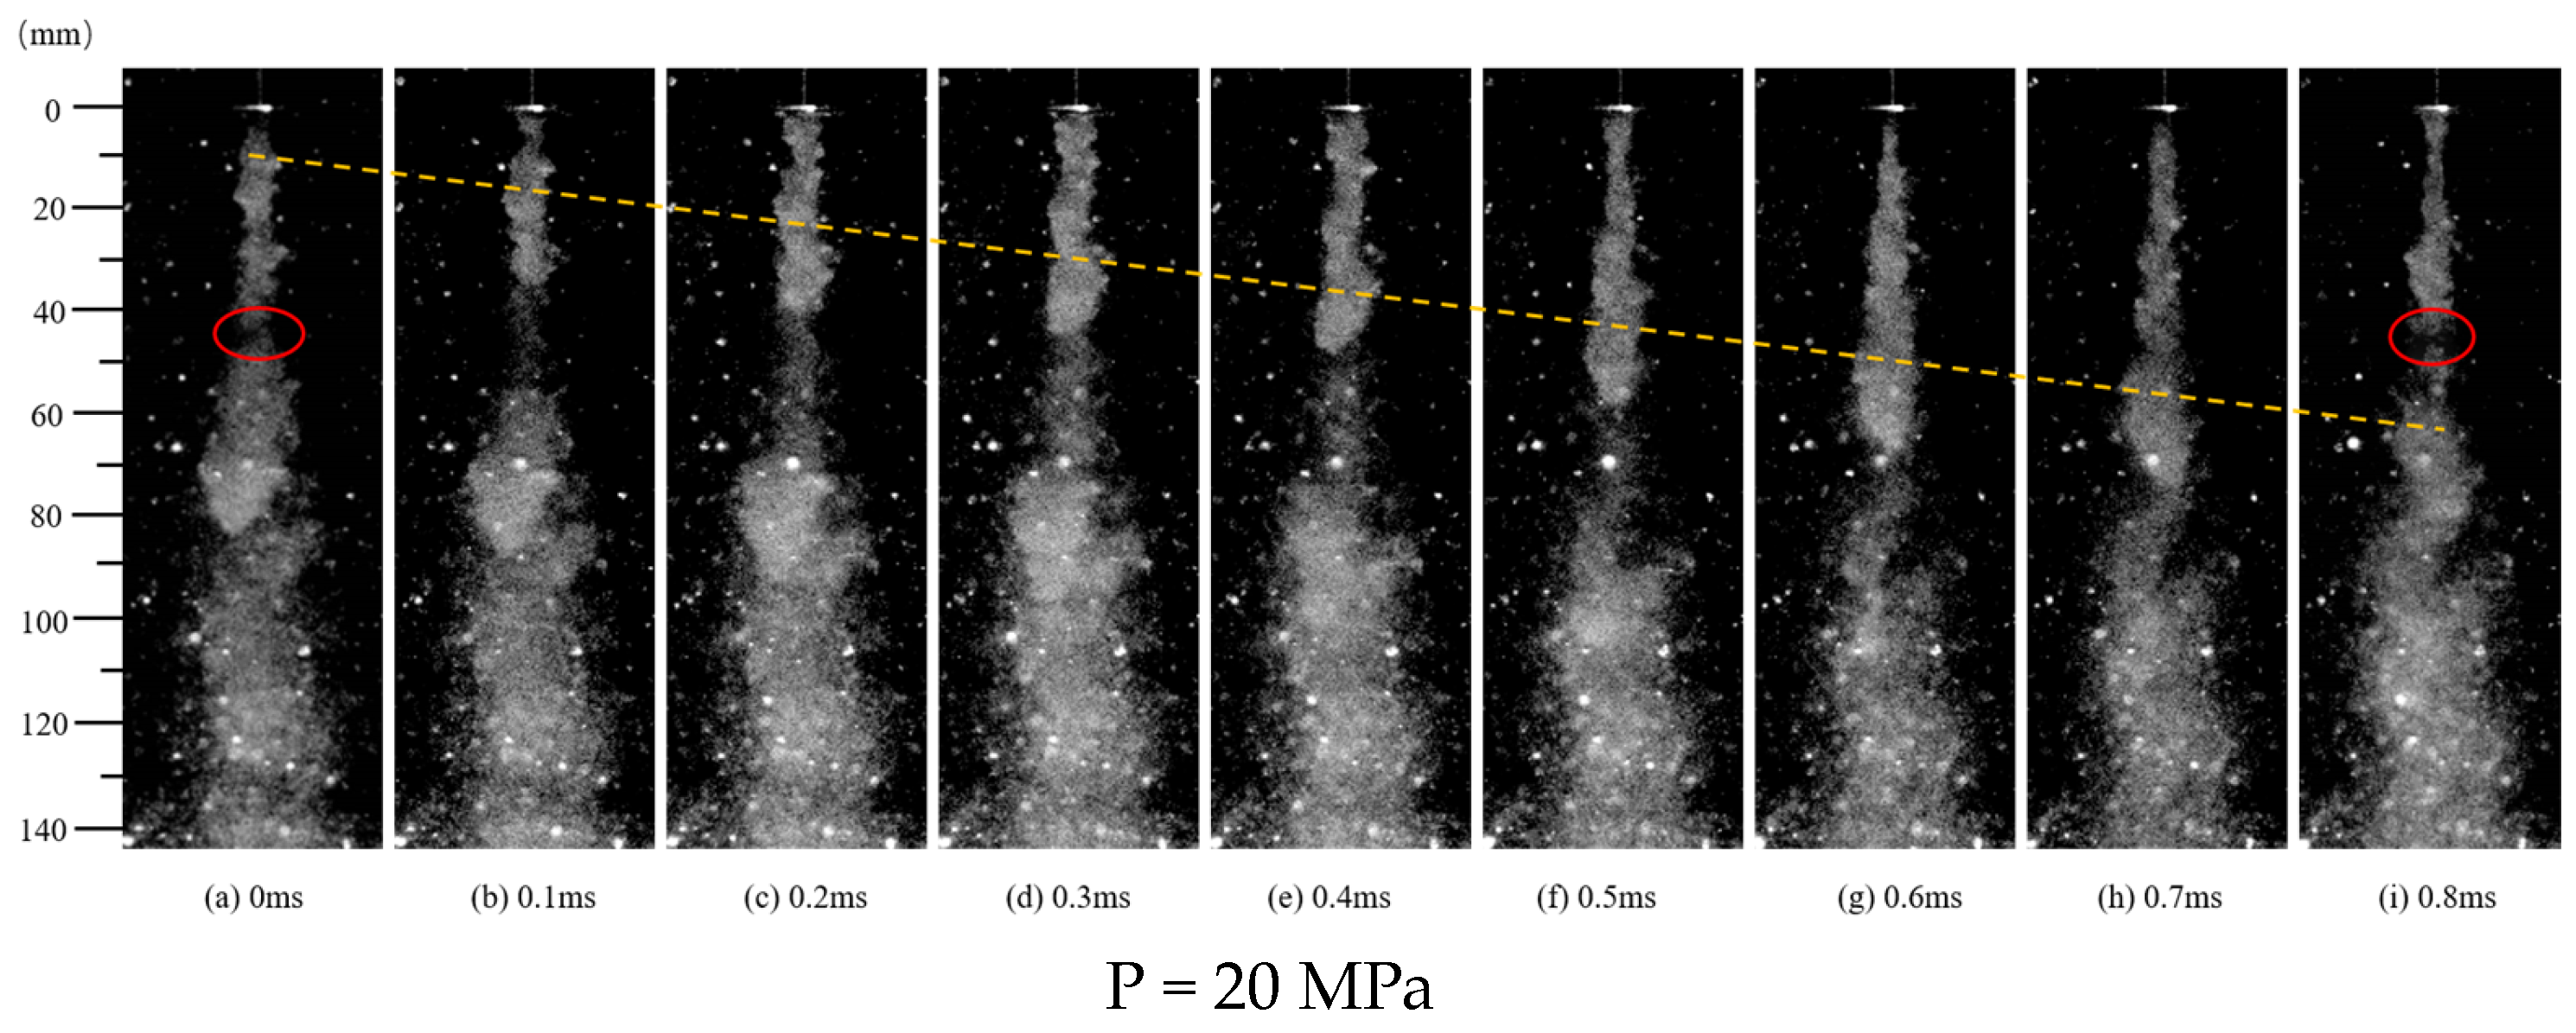
The schematic diagram for measuring the diffusion angle of the cavitation cloud is shown in Figure 4, with a diffusion angle of 17–19°. The greater the pressure, the greater the diffusion angle of the cavitation cloud; the range of violent dynamic evolution of the cavitation cloud varies under different pressures. The dynamic evolution process of the cavitation cloud under different pressures within a period of cavitation cloud variation is shown in Figure 5. The circle in Figure 5 shows the detachment state of the cavitation cloud, while the dashed line shows its constantly changing and developing state. A cavitation cloud has repeated shedding cycles [36]. Upstream cavitation clouds begin to form, a downstream cavitation cloud detaches, develops, and collapses, while upstream cavitation clouds continue to develop until they detach, resulting in periodic changes in cavitation clouds. The greater the pressure, the more downstream the detachment range of the cavitation cloud moves, the larger is the maximum width value of the cavitation cloud, the fuller and more swollen its shape, and the greater the extent of damage to the solid wall surface.

Figure 4.
Measurement diagram of cavitation cloud diffusion angle.
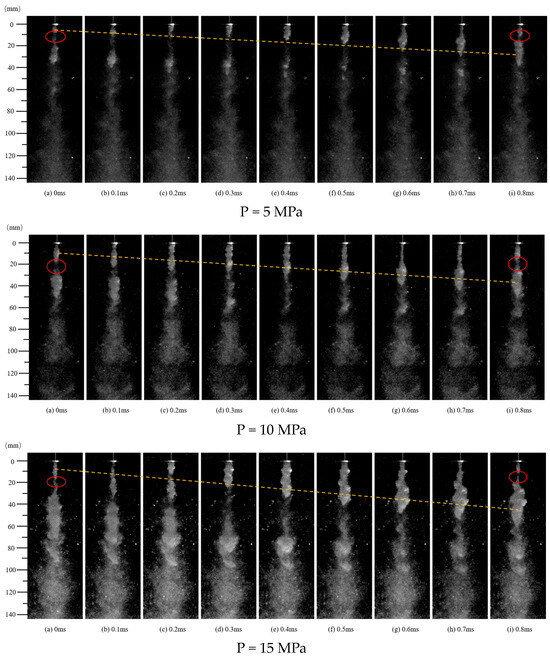
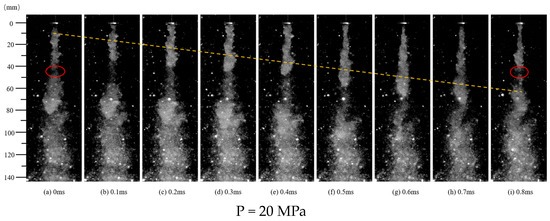
Figure 5.
Changing appearance of a cavitating jet in water with time.
Taking 10 MPa as an example, the evolution process of cavitation cloud was analyzed in detail. At 0–0.1 ms, the cavitation cloud concentrated within 10 mm near the nozzle outlet is in its nascent stage; at the same time, the fully developed cavitation cloud in the previous cycle began to detach and develop downstream of the jet. At 0.1–0.4 ms, in the low-pressure region at the center of the jet shear layer vortex structure, the cavitation cloud moved downstream and gradually expanded and developed [37], as shown by the dashed line in Figure 5. In addition, it can be observed that within 20–35 mm of the nozzle outlet, the length, width, and area of the cavitation cloud continued to increase, obtaining a maximum width of 8.5 mm, indicating that the cavitation cloud was in a developmental stage. At 0.5–0.8 ms, the upstream cavitation cloud gradually expanded and eventually fell off. This forms the periodic variation of the cavitation cloud. The interval between the two detachments of the cavitation cloud was 0.8 ms, indicating that the current development cycle of a cavitation jet was around 0.8 ms. The evolution behavior of a cavitation cloud under different pressures was similar, and the development cycle of the cavitation jets was around 0.8 ms.
Due to the unstable variation of the axial jet velocity of the nozzle, the flow field was unstable. Therefore, the development of vortex structures on both sides of the jet could not be guaranteed to be completely consistent, and the two ends of the cavitation cloud could not be completely symmetrical. On the other hand, the axial velocity changes of the same nozzle under different pressures had similar trends, resulting in similar flow field changes. The changes in the cavitation cloud followed a periodic development pattern of initiation, development, detachment, and collapse.
Within a target distance of 20–35 mm, the expansion and development of the cavitation cloud was the greatest. If a high-speed water jet carrying many bubbles encountered the solid wall at this time, the cavitation cloud spread at a certain speed from the center of the jet along the surface of the specimen and continuously collapsed, thereby eroding the surface of the specimen through cavitation. Observing the cavitation cloud map at a certain moment with 10 MPa at a target distance of 20 mm and 50 mm (see Figure 6), it was found that the cavitation cloud layer was approximately 12 mm, and the width, length, and development status of the cavitation cloud in front of the solid wall were different. Therefore, the range and shape of the contact between cavitation cloud at different target distances and the surface of the specimen were different, resulting in varying degrees of damage to the surface of the specimen.
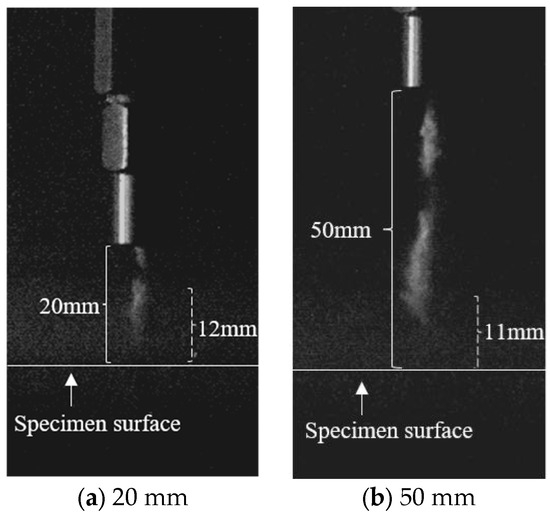
Figure 6.
Cavitation cloud at different target distances.
3.2. Analysis of Velocity Distribution of Nozzle Axial Jet
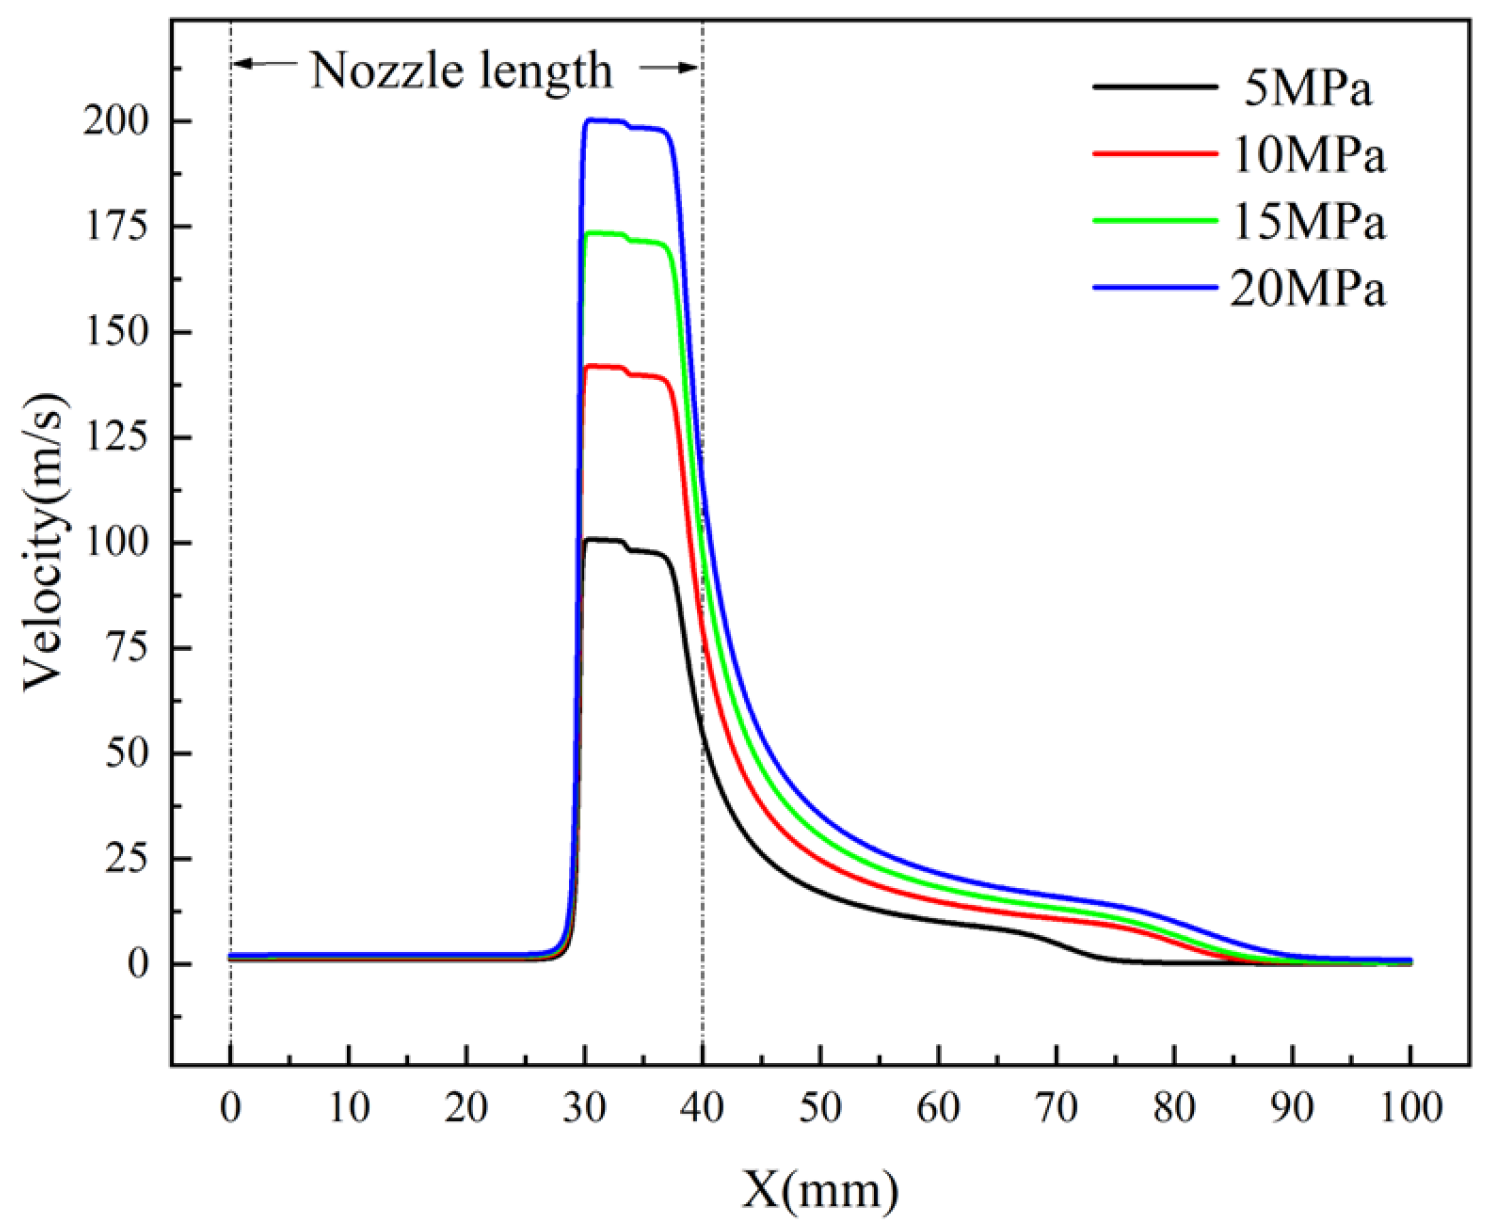
Figure 7 shows the velocity distribution pattern at the axis of a standard cylindrical nozzle. The reduction of the flow area at the nozzle throat promotes an increase in the liquid flow velocity inside the throat. The maximum velocities at 5 MPa, 10 MPa, 15 MPa, and 20 MPa were approximately 100.3 m/s, 141.2 m/s, 172.9 m/s, and 200.1 m/s, respectively. The length of the jet core section was around 8 mm. After the water jet was injected into static water, due to the viscosity of the water momentum exchange occurred between the jet water and static water, causing the flow of surrounding water. The velocity of the jet itself continuously decayed and eventually approached zero. Comparing the velocity at the nozzle outlet and 20 mm away from the nozzle under different pressures, it can be concluded that the velocity attenuation rate at the jet axis was approximately 82.5%. The trend of axial velocity variation under different pressures was highly similar; therefore, it was considered that the axial velocity variation trend of the same nozzle under different pressures would be similar. When the pressure was low, the axial velocity of the jet decayed to 0 earlier. Taking a pressure of 10 MPa as an example, when the axial velocity of the jet approached to 0 the impact damage of the water jet on the surface at the corresponding target distance was very weak (see Figure 8d).
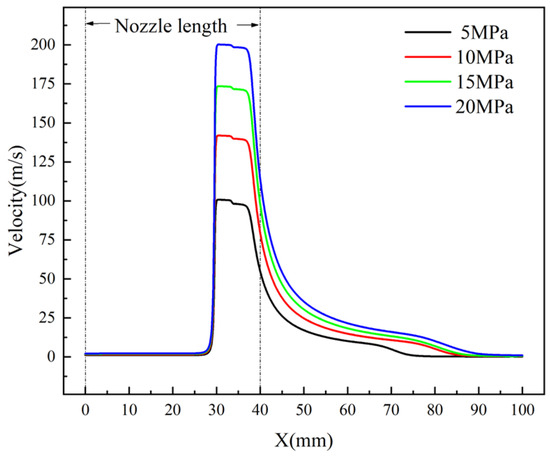
Figure 7.
Distribution of axial velocity under different pressures.
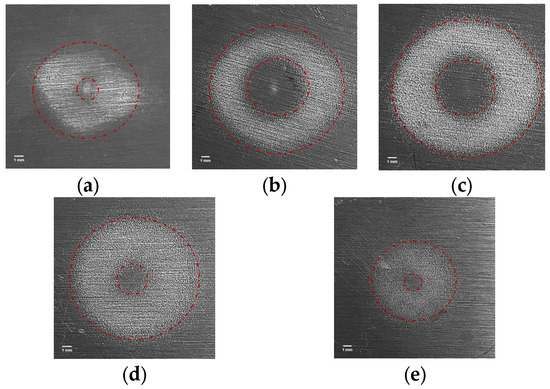
Figure 8.
Macroscopic surface erosion pattern observed (standoff distance: (a) 10 mm, (b) 20 mm, (c) 30 mm, (d) 40 mm, (e) 50 mm).
3.3. Analysis of Surface Morphology Damage of Specimens
Figure 9 shows the variation trend of the surface cavitation ring area after cavitation water jet erosion of the AL6061 specimen at different target distances (S). When the pressure was 5 MPa and 10 MPa, the overall erosion ring area showed a trend of first increasing and then decreasing with the increase in target distance. When the pressure increased to 15 MPa and 20 MPa, the overall area of the erosion ring showed an increasing trend. According to the cavitation cloud map, the cavitation cloud gradually collapsed and dissipated when S was 70–90 mm.
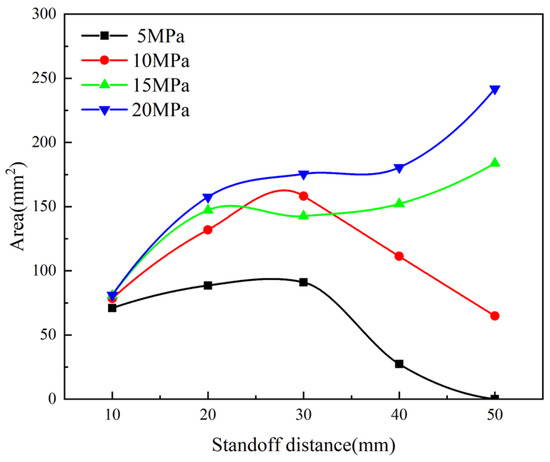
Figure 9.
Change curve of erosion pattern area.
The macroscopic morphology changes of the specimen surface under different pressures were similar. Taking a pressure of 10 MPa as an example, the macroscopic morphology of the specimen after cavitation water jet erosion at different target distances (S) was analyzed. It can be clearly observed from Figure 8 that there is a circular damage area on the surface of the specimen. Given X = S (target distance) + 40 (total nozzle length), when S = 10 mm, the axial jet velocity of the nozzle was about 24.6 m/s, and the central jet caused obvious pits with a diameter of about 1 mm. The range of the cavitation cloud was small and basically in the initial stage, and the unstable development of morphology led to a small area of damage caused by cavitation, with an irregular and uneven distribution of the damage areas. When S = 30 mm, the axial jet velocity of the nozzle was about 10.2 m/s, and the central jet depression was reduced. At this stage, the width of the cavitation cloud was relatively large, and it was basically in the development cycle. Therefore, the damage area caused by cavitation was the largest, and the damage area presented a relatively regular circular shape, with obvious damage. The cavitation performance was good. When S = 50 mm, the axial jet velocity of the nozzle was about 0.2 m/s, which basically could not cause damage to the surface. The central depression disappeared, and the cavitation cloud was in the stage of collapse and dissipation. The damage area caused by cavitation was relatively small. Therefore, as the target distance (S) increased, the axial jet velocity of the nozzle gradually decreased to 0, and the central depression caused by water jet impact gradually decreased and weakened, and completely disappearing at S = 40 mm. The shape and size of the cavitation cloud varied at different target distances during the stages of initiation, development, and collapse and dissipation, leading to an increase and then a decrease in the damage area caused by cavitation erosion.
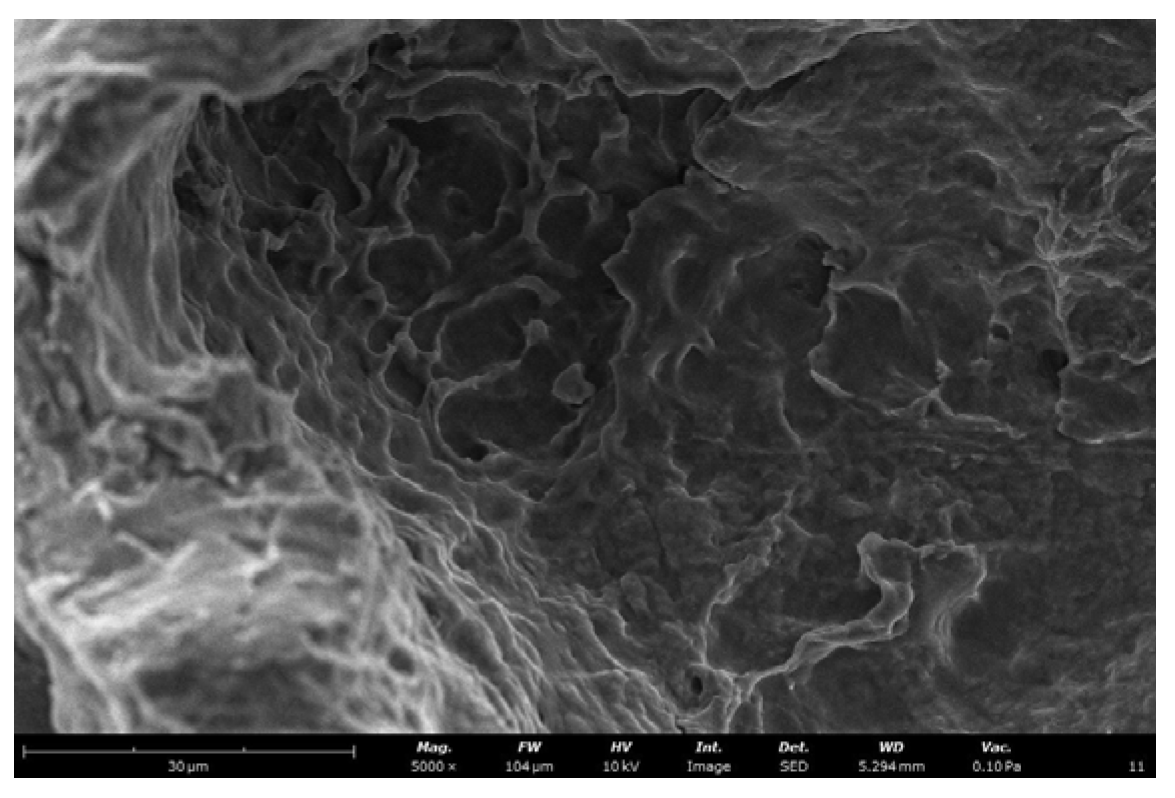
When the pressure was 10 MPa, the microstructure of the specimen after being impacted by a central water jet and eroded by cavitation is shown in Figure 10. The area captured via a scanning electron microscope (SEM) is the annular cavitation area on the surface of the specimen, with a magnification of 1000 times and an image resolution of 1920 × 1275 px. The original surface of the specimen (see Figure 10a) was relatively smooth, with only a few scratches. After the experiment, the surface of the specimen underwent plastic deformation, and the erosion appearance changed significantly. At a smaller target distance (see Figure 8a,b), the center aperture caused by water jet impact was larger, while the surface morphology change caused by cavitation was not significant. Only a small number of shallow pits were left on the surface of the annular area around the center aperture, with most of the pits being 8 μm (pear peel surface, see Figure 10b), and they were not connected. When S = 20 and 30 mm, the center hole marks formed by the water jet impact disappeared, and there was a clear intact area between the cavitation ring and the center hole, resulting in a typical distribution of annular cavitation pits. From Figure 10c,d, it can be seen the erosion pits were interconnected, resulting in cavitation erosion in the form of numerous hemispherical or irregularly shaped pits. In addition, when S = 30 mm, the surface erosion ring diameter of the specimen was the largest, and the intensity of bubble collapse was relatively balanced with the bubble concentration, with most of the cavitation pits being 25 μm. Cavitation erosion was the most significant. As the target distance further increased, both the macroscopic diameter and microscopic pit size of the erosion ring decreased. In Figure 11, it can be seen that the microstructure of the damage to the surface of the specimen caused by the impact of a central water jet at S = 10 mm. Comparing the surface cavitation damage areas of the specimens under the same conditions (see Figure 10b), it can be clearly observed that the pits in the center jet impact damage area were denser. Further comparison of the severe cavitation damage area (see Figure 10d) revealed that the pits in the center jet impact damage area were shallower and more evenly distributed. In addition, after randomly selecting the cavitation area and enlarging it by 5000 times, it can be more clearly observed, with an image resolution of 960 × 637 px, that due to the plastic flow of the metal, some edges of the cavitation area protrude (see Figure 12). The regional expansion of cavitation erosion is manifested as: (1) a single cavitation pit continuously expands in depth and diameter under the impact of continuous cavitation collapse; (2) adjacent cavitation pits are connected to each other when they are close enough.
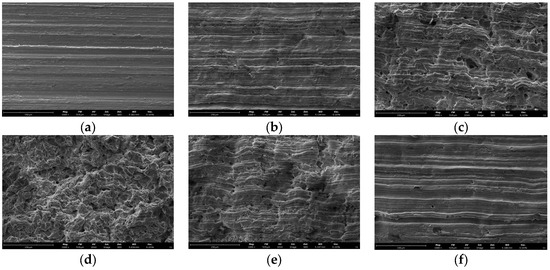
Figure 10.
Microscopic diagram of erosion pits (1000X; (a) pristine surface; standoff distance: (b) 10 mm, (c) 20 mm, (d) 30 mm, (e) 40 mm, (f) 50 mm).

Figure 11.
Microscopic diagram of surface jet impact damage (1000X).

Figure 12.
Microscopic surface erosion pits observed (5000X).
Microscopic cavitation erosion is caused by micro jets and shock waves generated by the rupture of cavitation bubbles. Under the same hydraulic conditions, the intensity of micro jets and shock waves is determined by the maximum size of the cavitation bubble before collapse [38]. In this way, although there are indeed many cavitation bubbles reaching and breaking on the surface of the specimen, their size is too small to cause serious damage. This indicates that the rupture of cavitation bubbles on the surface of the specimen is a necessary condition for severe cavitation erosion to occur. Therefore, there are two reasons for the low degree of cavitation erosion at a smaller target distance: (1) there is not enough time for bubbles to develop and grow into large-sized bubbles before reaching the target [39], and this is not enough to cause serious damage; (2) even for cavitation bubbles that successfully reach their target, their destructive power is limited after several cycles of collapse and rebound. The reason for the low degree of cavitation erosion at a larger target distance is that there are fewer cavitation bubbles reaching the surface of the specimen.
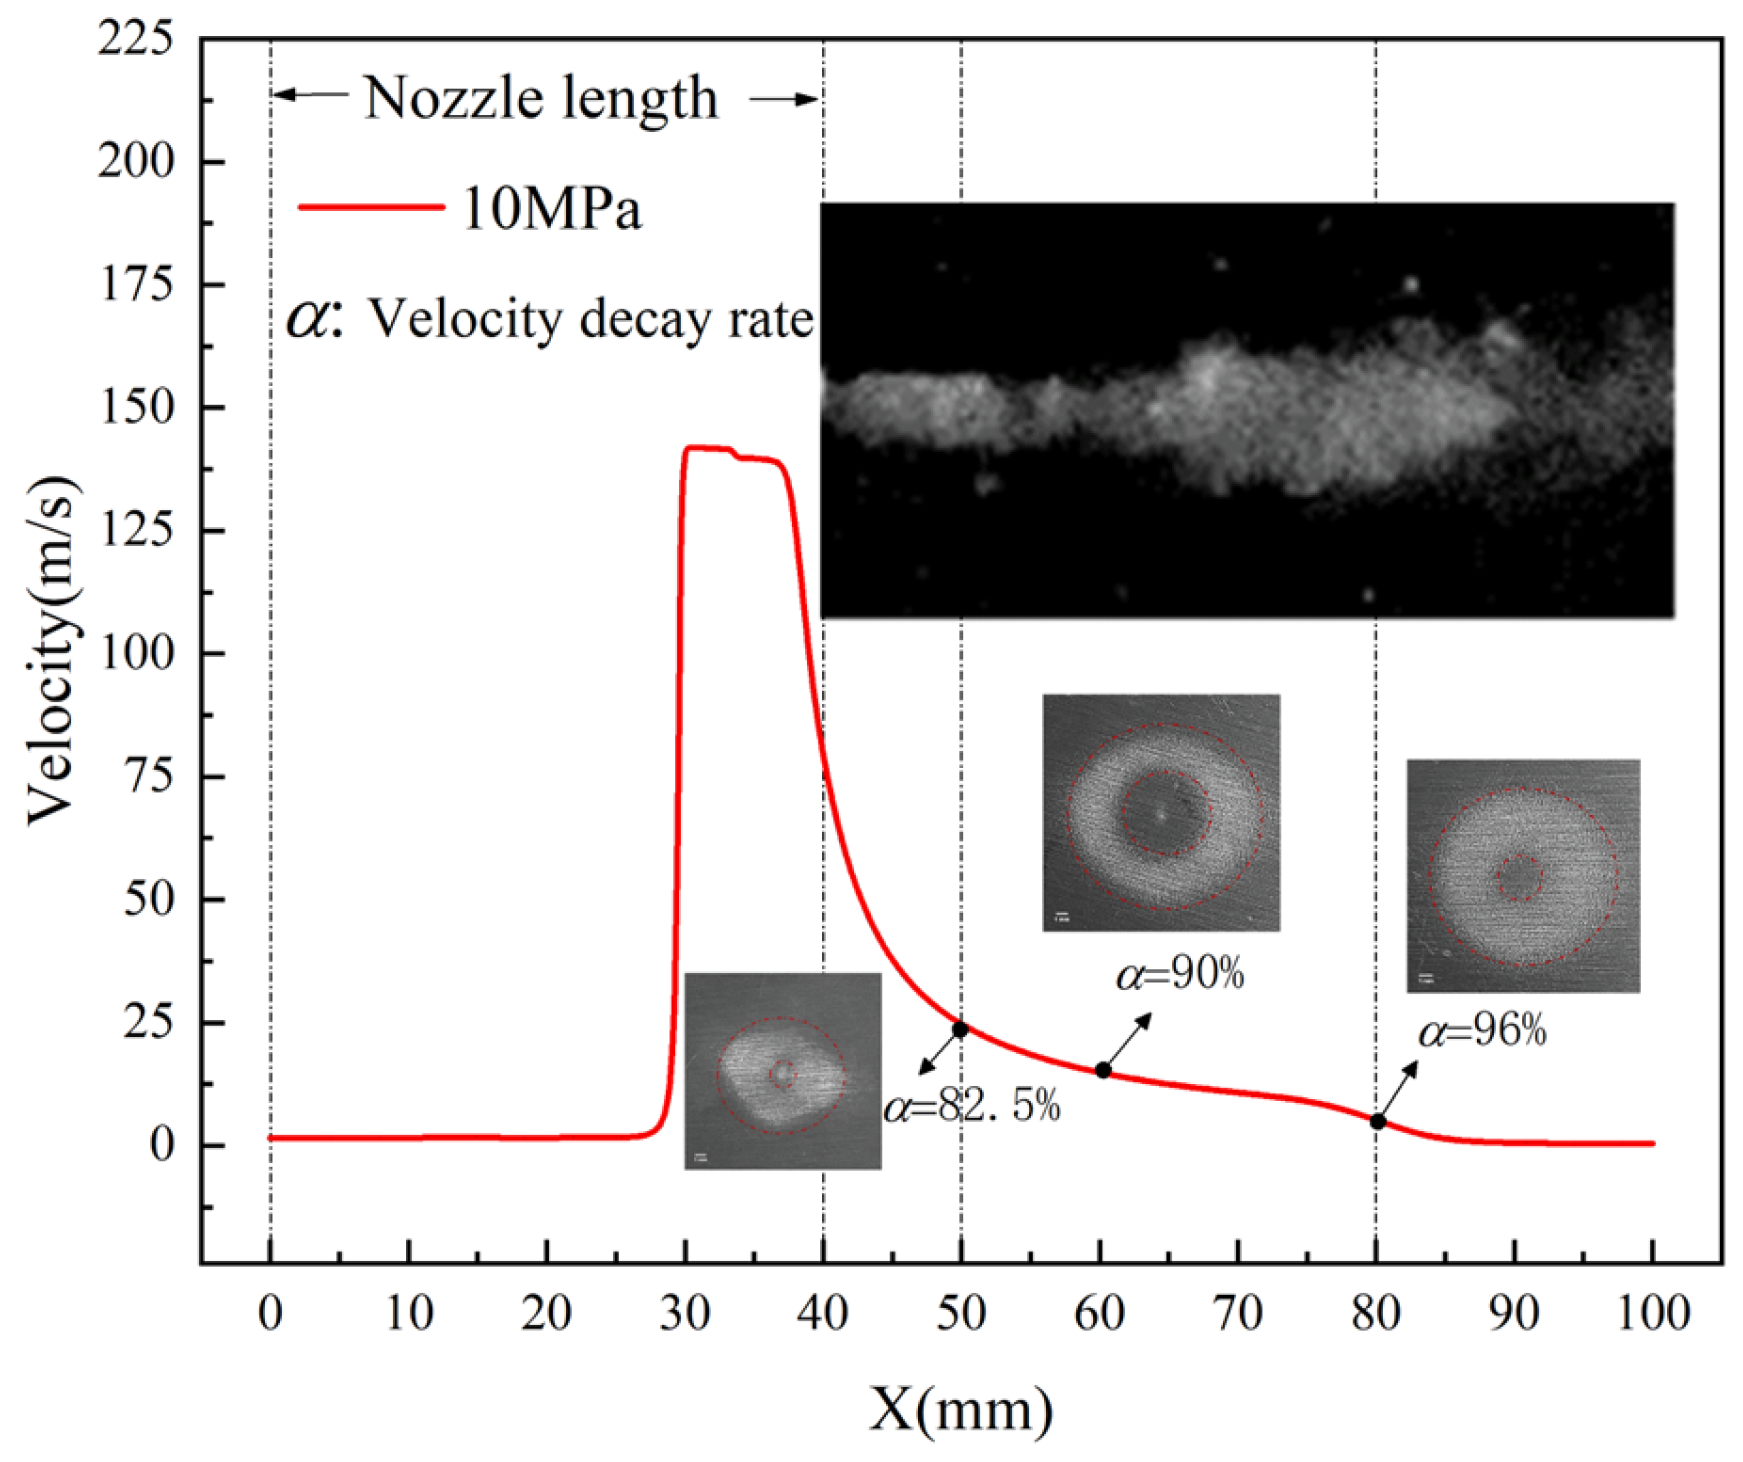
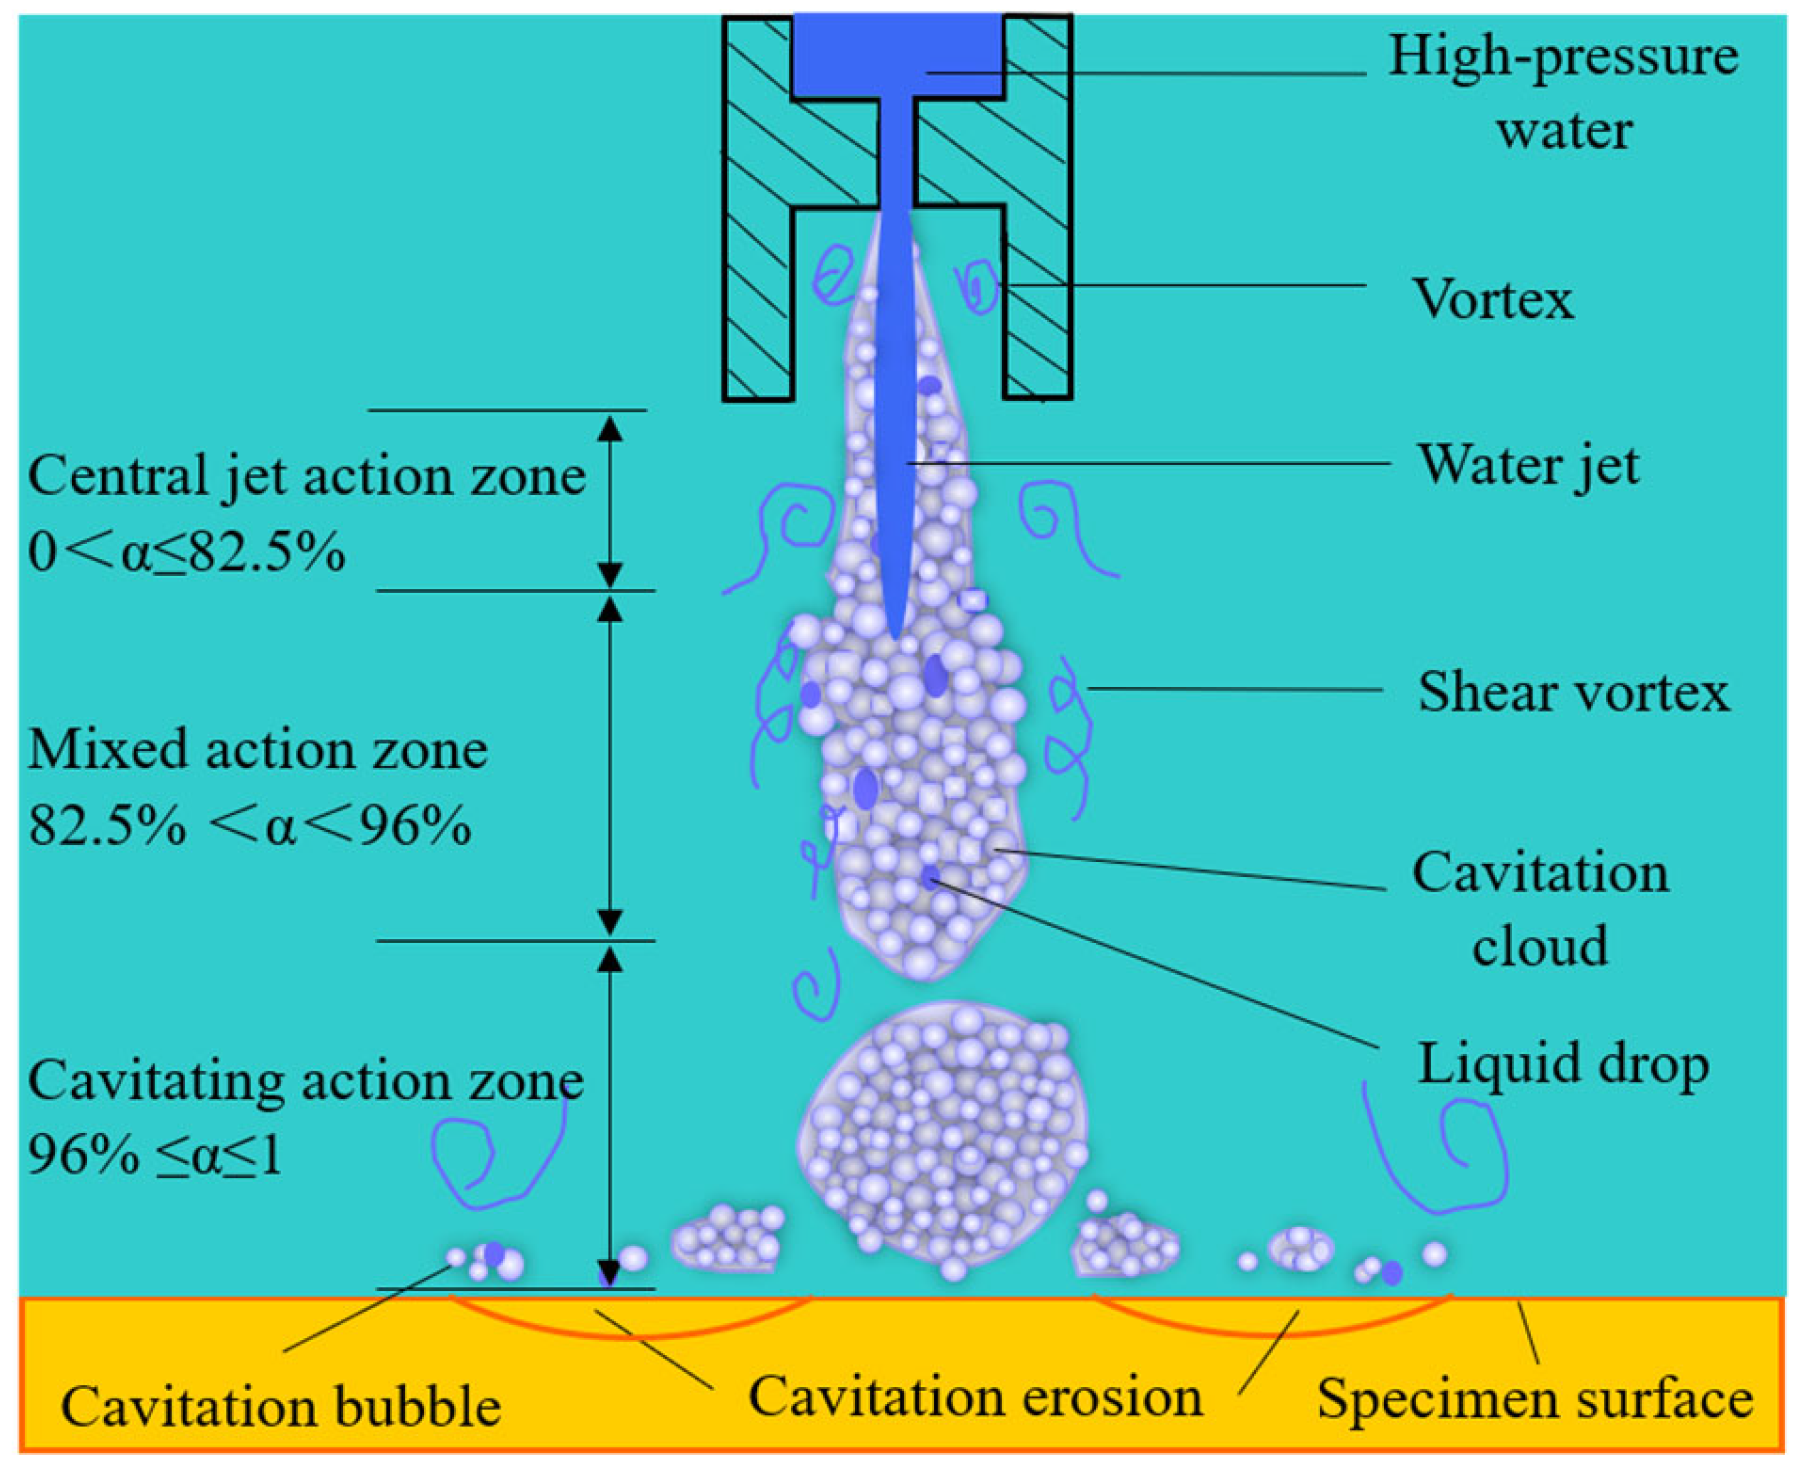
The surface morphology analysis of the AL6061 specimen showed that different pressures lead to different maximum widths and ranges of the cavitation cloud; therefore, different pressures correspond to different optimal target distances. When selecting different target distances for experiments, the velocity of the central water jet continuously decays, leading to a decrease in the intensity of the impact damage as the target distance increases. The erosion intensity of the cavitation cloud shows a trend of first increasing and then decreasing with the increase of target distance. Under different pressures, the variations in center jet velocity are similar, and the evolution behaviors of the cavitation cloud are similar. Therefore, taking 10 MPa as an example, the action area of the cavitation water jet was comprehensively analyzed, given X = S (target distance) + 40 (total nozzle length). Within a target distance of 10 mm, the center water jet velocity was relatively high, the jet impact performance was good, and the cavitation cloud was basically in its nascent stage. Its shape was not fully developed, its width was small, there were obvious pits at the center of the specimen surface, and the annular cavitation state was irregular. Therefore, this range is defined as the center jet action zone. When the target distance was 10 mm, The velocity decay rate (α) was 82.5%. Then the center jet velocity increased with the target distance and gradually approached 0, when the target distance reached 40 mm. The velocity decay rate (α) reached 96%, and the speed gradually approached 0 (see Figure 13). The jet impact performance weakened and the cavitation cloud was basically in the stage of development and expansion, with a large width, area, and strength. Many cavitation bubbles encountered the surface of the specimen, and the stagnation pressure caused many cavitation bubbles to rupture and form a cavitation cloud layer, causing serious cavitation erosion. Therefore, this range is defined as the mixed action zone. As the target distance continued to increase, the central jet velocity basically decayed to 0, and the cavitation cloud developed completely and was in the stage of collapse and dissipation. The central jet depression on the surface of the specimen had completely disappeared (see Figure 13), and the degree of cavitation damage had weakened. Therefore, this range is defined as the cavitation action zone. According to the above analysis results, the action area of the cavitation water jet can be roughly divided into the following three parts: the central jet action area, mixed action area, and cavitation action area. The schematic diagram can be seen in Figure 14.

Figure 13.
Analysis diagram of cavitation water jet action zone.

Figure 14.
Cavitation water jet action zone.
4. Conclusions
Using high-speed cameras to observe the dynamic evolution of a submerged cavitation cloud, through experiments and numerical simulations. The specific conclusions are as follows:
- The diffusion angle of the cavitation cloud generated by the cylindrical nozzle is 17–19°, and the greater the pressure, the greater the diffusion angle of the cavitation cloud. A cavitation cloud has obvious periodicity, and there are four different stages of formation, development, detachment, and collapse within each cycle under different pressures. When in the development stage, the range of the cavitation cloud is largest.
- The distribution of the central water jet impact damage area and the cavitation area on the surface of the specimen varies with the target distance. As the target distance increases, the pits formed by the central water jet impacting the surface of the specimen gradually weaken; the degree of cavitation erosion first increases and the material surface shows a typical distribution of annular cavitation pits before decreasing. The impact degree of the central water jet decreases monotonically. The morphological changes on the surface of the specimen can provide data support for studying the erosion ability of cavitation jets. From a microscopic perspective, the intensification of cavitation erosion is the joint result of the growth of cavitation pits and their connection with adjacent pits.
- The submerged cavitation water jet generated by a cylindrical nozzle can be divided into three zones based on the attenuation rate of the nozzle axial velocity: a central jet action zone, a mixed action zone, and a cavitation action zone. The attenuation rate of the axial jet velocity of the nozzle in the central jet action zone is less than or equal to 82.5%, the attenuation rate of the axial jet velocity of the nozzle in the mixed action zone is greater than 82.5% and less than 96%, and the attenuation rate of the axial jet velocity of the nozzle in the cavitation action zone is greater than or equal to 96%. When the target distance is in the mixed action zone, the erosion effect is more obvious.
- This experiment was only conducted at room temperature, so further research could be conducted on the factors affecting temperature and the internal roughness of the nozzle based on existing data.
Author Contributions
Conceptualization, Y.C.; formal analysis, M.Z.; funding acquisition, Q.D.; methodology, Y.C.; software, B.C.; visualization, M.Z. and B.C.; writing—original draft, M.Z.; writing—review & editing, Y.C. and Q.D. All authors have read and agreed to the published version of the manuscript.
Funding
This research was funded by The National Key Technologies Research and Development Program of China, grant number 2021YFB1600500-2021YFB1600502, and Chunhui Project of the Ministry of Education of China, grant number HZKY20220606-202201390.
Institutional Review Board Statement
Not applicable.
Informed Consent Statement
Not applicable.
Data Availability Statement
The data presented in this study are available on request from the corresponding author. The data are not publicly available due to privacy.
Conflicts of Interest
The authors declare no conflicts of interest.
References
- Chu, H.; Guo, Y.; Zhang, N.; Liu, B.; Ren, M.; Hao, C.; Bi, W. Role of microparticles in enhancing jet cavitation and rock breaking ability. China Pet. Mach. 2023, 51, 34–42. [Google Scholar]
- Zhuang, D.; Zhang, S.; Liu, H.; Chen, J. Cavitation erosion behaviors and damage mechanism of Ti-Ni alloy impacted by water jet with different standoff distances. Eng. Fail. Anal. 2022, 139, 106458. [Google Scholar] [CrossRef]
- Luo, C.; Gu, J.; Xu, X.; Ma, P.; Zhang, H.; Ren, X. Impact of solid particles on cavitation behaviors and laser-induced degradation in aqueous suspension. Ultrason. Sonochem. 2021, 76, 105632. [Google Scholar] [CrossRef] [PubMed]
- Watanabe, R.; Yanagisawa, K.; Yamagata, T.; Fujisawa, N. Simultaneous shadowgraph imaging and acceleration pulse measurement of cavitating jet. Wear 2016, 358–359, 72–79. [Google Scholar] [CrossRef]
- Liu, B.; Pan, Y.; Ma, F. Pulse pressure loading and erosion pattern of cavitating jet. Proc. Math. Phys. Eng. Sci. 2020, 14, 136–150. [Google Scholar] [CrossRef]
- Soyama, H. Key factors and applications of cavitation peening. Int. J. Peen. Sci. Technol. 2018, 1, 3–60. [Google Scholar]
- Chillman, A.; Ramulu, M.; Hashish, M. Suitable region of high-speed submerged water jets for cutting and peening. JSME Int. J. Ser. B-Fluids Therm. Eng. 1995, 38, 31–38. [Google Scholar]
- Soyama, H. Surface mechanics design of metallic materials on mechanical surface treatments. Mech. Eng. Rev. 2015, 2, 14–00192. [Google Scholar] [CrossRef]
- Han, B. Numerical simulation and verification of cavitation behavior in water-jet cavitation peening processing. J. Mech. Eng. 2012, 48, 193–198. [Google Scholar] [CrossRef]
- Li, Z.; Jiang, X.; Deng, S. Research on the rust removal performance of cavitation water jet. China Storage Transp. 2009, 10, 109–111. [Google Scholar]
- Peng, K.; Tian, S.; Li, G.; Alehossein, H. Mapping cavitation impact field in a submerged cavitating jet. Wear 2018, 396, 22–33. [Google Scholar] [CrossRef]
- Trummler, T.; Schmidt, S.; Adams, N. Numerical prediction of erosion due to a cavitating jet. Wear 2022, 498–499, 204304. [Google Scholar] [CrossRef]
- Yang, Y.; Wang, G.; Shi, W.; Li, W.; Ji, L.; Wang, H.L. Turbulence characteristics in the mixing layer of a submerged cavitating jet at high reynolds numbers. Sustainability 2022, 14, 11963. [Google Scholar] [CrossRef]
- Fujisawa, N.; Fujita, Y.; Yanagisawa, K.; Fujisawa, K.; Yamagata, T. Simultaneous observation of cavitation collapse and shock wave formation in cavitating jet. Exp. Therm. Fluid Sci. 2018, 94, 159–167. [Google Scholar] [CrossRef]
- Liu, Y.; Wu, Q.; Huang, B.; Zhang, H.; Liang, W.; Wang, G. Decomposition of unsteady sheet/cloud cavitation dynamics in fluid-structure interaction via POD and DMD methods. Int. J. Multiph. Flow 2021, 142, 103690. [Google Scholar] [CrossRef]
- Pan, Y.; Ma, F.; Liu, B.; Cai, T. Cavitation intensity and erosion pattern of a self-excited cavitating jet. J. Mater. Process. Technol. 2020, 282, 116668. [Google Scholar] [CrossRef]
- Fujisawa, N.; Horiuchi, T.; Fujisawa, K.; Yamagata, T. Experimental observation of the erosion pattern, pits, and shockwave formation in a cavitating jet. Wear 2019, 418–419, 265–272. [Google Scholar] [CrossRef]
- Cai, T.; Pan, Y.; Ma, F. Effects of nozzle lip geometry on the cavitation erosion characteristics of self-excited cavitating waterjet. Exp. Therm. Fluid Sci. 2020, 117, 110137. [Google Scholar] [CrossRef]
- ASTM G134-17(2017); Standard Test Method for Erosion of Solid Materials by a Cavitating Liquid Jet. ASTM Internatianal: West Conshohocken, PA, USA, 2017.
- Wang, G.; Yang, Y.; Wang, C.; Shi, W.; Li, W.; Pan, B. Effect of nozzle outlet shape on cavitation behavior of submerged high-pressure jet. Machines 2021, 10, 4. [Google Scholar] [CrossRef]
- Soyama, H. Effect of nozzle geometry on a standard cavitation erosion test using a cavitating jet. Wear 2013, 297, 895–902. [Google Scholar] [CrossRef]
- Zhong, X.; Dong, J.; Liu, M.; Meng, R.; Li, S.; Pan, X. Experimental study on ship fouling cleaning by ultrasonic-enhanced submerged cavitation jet: A preliminary study. Ocean Eng. 2022, 258, 111844. [Google Scholar] [CrossRef]
- Dular, M. Hydrodynamic cavitation damage in water at elevated temperatures. Wear 2016, 346–347, 78–86. [Google Scholar] [CrossRef]
- Mednikov, A.; Zilova, O.; Tkhabisimov, A.; Dasaev, M.; Grigoriev, S. Parametric studies of effect of cavitation jet modes on wear rate of surface of structural materials. Metals 2023, 13, 48. [Google Scholar] [CrossRef]
- Fang, Z.; Ji, Z.; Kang, D.; Chen, Y.; Zhang, X.; Wang, S.; Xiong, T. Cavitation damage characteristics following marine fouling cleaning by a self-excited oscillation cavitation waterjet. Appl. Ocean Res. 2023, 139, 103692. [Google Scholar] [CrossRef]
- Li, L.; Xu, Y.; Ge, M.; Wang, Z.; Li, S.; Zhang, J. Numerical investigation of cavitating jet flow field with different turbulence models. Mathematics 2023, 11, 3977. [Google Scholar] [CrossRef]
- Yang, Y.; Li, W.; Shi, W.; Zhang, W.; El-Emam, M. Numerical investigation of a high-pressure submerged jet using a cavitation model considering effects of shear stress. Processes 2019, 7, 541. [Google Scholar] [CrossRef]
- Zhou, W.; He, K.; Cai, J.; Hu, S.; Li, J.; Du, R. Simulation and experimental study on cavitating water jet nozzle. In Proceedings of the International Conference on Environmental Engineering and Sustainable Development, Sanya, China, 9–11 December 2016. [Google Scholar]
- Zwart, P.; Gerber, A.; Belamri, T. A two-phase flow model for predicting cavitation dynamics. In Proceedings of the International Conference on Multiphase Flow, Yokohama, Japan, 30 May–3 June 2004. [Google Scholar]
- Cao, D.; He, G.; Pan, H.; Qin, F. Comparative investigation among three cavitation models for simulating cavitating venturi. J. Northwest. Polytech. Univ. 2013, 31, 596–601. [Google Scholar]
- Bao, C.; Long, X.; Liang, Y.; Zhang, Z.; Zhang, Z.L. Simulation analysis of cavitation flow and thrust characteristics of high-pressure waterjet propulsion. Chin. Hydraul. Pneum. 2023, 47, 32–43. [Google Scholar]
- Ji, B.; Cheng, H.; Huang, B.; Luo, X.; Peng, X.; Long, X. Research progresses and prospects of unsteady hydrodynamics characteristics for cavitation. Adv. Mech. 2019, 49, 428–479. [Google Scholar]
- Chen, S.; Li, W.; Zhang, W.; Hu, J.; Yang, Y.; Liu, M. Numerical analysis of shear cavitation flow characteristics of convergent-divergent nozzles. J. Drain. Irrig. Mach. Eng. 2023, 41, 275–280+287. [Google Scholar]
- Cao, X. Numerical Study on Cavitation Characteristics of Centralbody Nozzle Underwater Jet. Master’s Thesis, Jiangsu University of Science and Technology, Zhenjiang, China, 2023. [Google Scholar]
- Peng, K.; Tian, S.; Li, G.; Huang, Z.; Zhang, Z. Cavitation in water jet under high ambient pressure conditions. Exp. Therm. Fluid Sci. 2017, 89, 9–18. [Google Scholar] [CrossRef]
- Fujisawa, N.; Kikuchi, T.; Fujisawa, K.; Yamagata, T. Time-resolved observations of pit formation and cloud behavior in cavitating jet. Wear 2017, 386–387, 99–105. [Google Scholar] [CrossRef]
- Choi, J.K.; Chahine, G.L. Relationship between material pitting and cavitation field impulsive pressures. Wear 2016, 352–353, 42–53. [Google Scholar] [CrossRef]
- Field, J.E.; Camus, J.J.; Tinguely, M.; Obreschkow, D.; Farhat, M. Cavitation in impacted drops and jets and the effect on erosion damage thresholds. Wear 2012, 290–291, 154–160. [Google Scholar] [CrossRef]
- Alehossein, H.; Qin, Z. Numerical analysis of Rayleigh-Plesset equation for cavitating water jets. Int. J. Numer. Methods Eng. 2007, 72, 780–807. [Google Scholar] [CrossRef]


Disclaimer/Publisher’s Note: The statements, opinions and data contained in all publications are solely those of the individual author(s) and contributor(s) and not of MDPI and/or the editor(s). MDPI and/or the editor(s) disclaim responsibility for any injury to people or property resulting from any ideas, methods, instructions or products referred to in the content. |
© 2024 by the authors. Licensee MDPI, Basel, Switzerland. This article is an open access article distributed under the terms and conditions of the Creative Commons Attribution (CC BY) license (https://creativecommons.org/licenses/by/4.0/).