1. Introduction
During the transition between the 20th and 21st century, several major oil tanker accidents occurred, forcing major classification societies to join forces in the development of a new set of Common Structural Rules (CSR) for the design of double hull oil tankers [
1]. Their aim was to improve the overall safety of the hull structure, increase the durability of ships in terms of corrosion margin and fatigue strength, and introduce transparency in formulae for scantling requirements. One of the most important newly introduced rule requirements related to the Ultimate Bending Capacity (UBC), which should ensure sufficient strength against breaking ship hulls in two parts [
2]. It was found, namely, that the traditional design criterion based on hull girder section modulus is not a physically justified measure of the hull girder capacity and may result in a scatter between safety levels of different ships, even of the same type. The previous finding was shown analytically by the Structural Reliability Analysis (SRA), resulting in different hull girder failure probabilities for oil tankers of different sizes [
3]. The SRA was then used to calibrate the probabilistically based Partial Safety Factors (PSFs) for the ultimate bending moment capacity, adopted in the CSR, ensuring a consistent safety level among ships of the same type [
3]. Through the years, requirements for oil tankers have been extended to bulk carriers, and two ship types are covered by the Harmonized Common Structural Rules (CSR-H) [
4].
The state-of-the-art and extensive recent literature review around ship SRA was presented by the Committee IV.1 “Design Principles and Criteria” of the International Ship and Offshore Structures Congress [
5]. Related to the present study, the rule development, calibration of design methodology, and establishment of safety factors were emphasized as the main application areas of SRA. The unsatisfactory number of recent practical applications of SRA has been attributed to the fact that SRA studies have been oriented toward some features of academic interest, rather than toward practical applications. It was further found by the Committee that the recent structural rule developments within the maritime industry, where SRA has directly been used as a tool, were missing. It was anticipated, however, that IACS had been working on an update to the wave scatter diagram, with the potential to use SRA as a tool for calibrating design criteria. These findings directly support the present study, which is practically oriented, proposing an approach to apply SRA for updating PSFs in the ship classification rules using new IACS wave scatter diagrams. In the report of the Committee IV.I, the interested reader may find a detailed review of the recent publications in the field of SRA of marine structures regarding different applications and failure modes, including the ultimate limit states of ship hulls [
5].
Quantification of the uncertainties in both loads and structural strength is the prerequisite for SRA and, hence, for defining PSFs in a meaningful way and eventually establishing the extreme values of load and strength to be used in design [
3]. As it has been shown that the uncertainty in the long-term wave-induced loads is larger than the uncertainty in the strength predictions [
6], Classification societies standardized the procedure for the prediction of wave loads in IACS Recommendation No. 34 Rev. 1 [
7]. The procedure standardized the North Atlantic wave scatter diagram, wave spectrum, energy spreading function, ship speed, and probability of heading angles between ship and waves which have been used in the SRA for calibration of PSFs in CSR [
3].
The wave scatter diagram, which is the most important input parameter for the long-term prediction of wave loads, in Recommendation No. 34 Rev. 1, was developed for the North Atlantic Sea environment and was based on visual observations published in the wave atlas Global Wave Statistics (GWS) [
8]. Such a dataset suffers from the inaccuracies of visual observations, especially wave periods, and as GWS data have been collected in the past century, they do not include the effect of climate changes that became relevant in past decades [
9]. Further, it is not clear if and how they consider heavy weather avoidance of individual ships [
10]. As a response to the criticism because of these drawbacks, IACS developed the revised document Recommendation No. 34 Rev. 2 [
11]. The most important revision was the introduction of the new IACS NA scatter diagram, based on the hindcast wave database, filtered for actual shipping routes using the Automatic Identification System (AIS), a satellite ship positioning system available for all merchant ships [
12,
13]. A comprehensive comparison of modifications in Rev. 2 with respect to Rev. 1 is given in
Table 1 [
12].
The consequence assessment showed that the extreme wave load, according to Rev. 2, was reduced by 10% to 30% compared to Rev. 1 [
12]. The finding was confirmed by the analysis of extreme vertical wave bending moments (VWBM), showing that the extreme values calculated by Rev. 2 were reduced by 13% to 19% for tankers and 16% to 23% for container ships, with a larger reduction being obtained for smaller ships [
14]. Differences in wave scatter diagrams were found to be the most important for these reductions, supported by the fact that the extreme wave amplitude for a 25-year return period was 2.2 m higher for Rev. 1 compared to Rev. 2 [
14]. The analysis of significant wave height resulting in the same extreme VWBM as from the long-term distribution was performed in [
15]. It was found that the extreme significant wave height for a 25-year return period was in the range of 11–13.5 m for Rev. 2, depending on the ship size and type, while the extreme significant wave height for Rev. 1 reads from 14 m to 16 m, i.e., about 3 m higher compared to Rev. 2.
It is obvious from the consideration in the previous paragraph that the structural loads are decreased if the assumptions from Rev. 2 are used instead of those from Rev. 1. Consequently, the notional ship structural reliability is increased, even without any structural reinforcements, just because the knowledge about wave statistics has significantly improved in past decades. Namely, in recent years, numerical wave modelling has improved in quality, while at the same time becoming more available to the engineering community [
12]. Improvements in structural safety due to the improved knowledge about some physical processes represents one of the main benefits of the SRA, which has already been used in the past for similar types of problems, as reviewed by Teixeira et al. [
16]. A typical example is the application of SRA to Ultra Large Container Ships (ULCS), as the length of such ships extends outside the scope of the rules for ship classification, and new methods accounting for different hydroelastic responses are being used in their design. SRA is therefore used to quantify the safety margin between load and resistance for ULCS [
17].
The present paper aims to quantify the decrease in the notional hull girder failure probability of oil tankers if IACS Rec. No.34 Rev. 2 [
14] is used for the long-term computation of VWBM instead of Rev. 1 [
7]. Furthermore, the possibility of reducing the PSFs to maintain the existing notional failure probability of oil tankers is also investigated. Reduced PSFs would enable steel saving, which is important nowadays, as besides the economic benefits of reducing ship hull cost, lowering ship weight decreases fuel consumption and consequently CO
2 emissions. However, as the structural safety of oil tankers is the main concern, SRA is used to prove that it is possible to achieve these goals without compromising the existing safety level of vessels.
The test ships analyzed in the present paper are the same as those used in the development of PSFs for CSR [
18]. The reference [
18] is the same as the Rule background document [
2], but provides more details. The main particulars of the test ships are given in
Table 2.
The organization of the paper is as follows. In the next section, the design equation for UBC using PSFs is described. After that, details of the reliability analysis, including uncertainty models of pertinent random variables, are given in
Section 3.
Section 4 provides the results of the reliability analysis using wave loads calculated by two revisions of the IACS recommendation No. 34. In the Discussion, PSFs for VWBM are modified, and results of the reliability analysis using new PSFs are presented together with sensitivity analysis. The paper ends with the Conclusions.
2. Design Equation for Ultimate Bending Capacity
In the present study, only bending in the vertical plane in sagging conditions is considered. This is justified, as the horizontal bending moment for intact oil tankers is low, while the UBC in sagging is lower than in the hogging condition [
18].
A Rule formula for ultimate vertical bending capacity at the midship of an oil tanker is given as [
4]:
where
is the sagging hull girder UBC,
is the characteristic sagging still water bending moment (SWBM),
is the characteristic sagging wave bending moment,
is the heading correction factor, and
are partial safety factors for the UBC, SWBM, and VWBM, respectively.
The vertical wave bending moment
is calculated according to the formula given in IACS UR S11 [
19]. The partial safety factors
and
read 1.1 and 1, respectively [
4]. The heading correction factor
reads 1.05, accounting for the fact that the hull girder ultimate failure occurs in head seas, while the wave load is determined for all heading angles [
4].
The characteristic still water sagging bending moments are determined for two separate load scenarios, namely A and B [
4]. The characteristic value for load scenario A is the maximum bending moment between all seagoing load conditions given in the loading manual and the minimum permissible value provided in CSR. The characteristic value for load scenario B is the maximum sagging still water bending moment for the operational seagoing homogeneous full load condition. The partial safety factor
for two load scenarios is given in
Table 3.
The results of the design formula (1) for test ships in
Table 3 are presented in
Table 4. Characteristic values of still water and wave bending moments are taken from the ref. [
16].
The minimum required UBC in
Table 4 is taken as a higher value resulting from load scenarios A and B. It should be mentioned that the minimum required bending capacity refers to the hull girder net scantlings, i.e., all structural members are modelled using 50% of the rule corrosion deduction thickness [
4].
3. Limit-State Function and Uncertainty Modelling
The problem of quantification of safety is not trivial; as safety is not a physical quantity, it is unclear how it can be “measured”. SRA is therefore applied to assess structural safety, considering load effect components and structural strength components as random variables, thus reflecting the uncertainties involved. The aim of the SRA is to represent the problem as realistically as possible, avoiding unnecessary conservatism. The main outcome of the SRA is the notional (nominal) probability of structural failure (or its counterpart, the safety index) as a quantitative measure of structural safety. The review paper presents full details and practical examples of the application of SRA in ship structures [
16].
In SRA, the demand on the structure and structural capacity are related through a mathematical expression known as the limit–state function, which defines whether the structure fulfils its intended purpose regarding a particular failure criterion or not. The limit–state function with respect to the hull girder ultimate failure under vertical bending moments, considered in the present study, reads:
where
MU is deterministic UBC, and
and
are random variables representing SWBM and extreme VWBM, respectively.
and
are random variables for model uncertainty in the UBC calculation and variation of yield strength of the material, respectively.
,
, and
are random variables representing uncertainties in SWBM, linear VWBM, and non-linear VWBM, respectively.
The limit–state Function (2) corresponds to the application of Turkstra’s rule for load combination, where the average of the SWBM is added to the extreme VWBM [
2,
18]. According to Turkstra’s rule, another combination, where the extreme SWBM is added to the average VWBM, should also be considered. However, if the extreme value of one variable is much larger than the extreme value of another, the combination of the larger extreme and the average of another variable is the governing value for structural reliability [
18]. In the present case, as may be seen from
Table 2, extreme VWBM is more than twice the extreme SWBM, so it is justified to consider extreme VWBM and average SWBM, as given by Equation (2). In the case of using the extreme value of SWBM, the load combination factor between the extreme SWBM and extreme VWBM should be considered [
16]. The comparison of two approaches, i.e., by employing Turkstra’s rule and extreme values of SWBM and VWBM with the load combination factors, is given in [
20], leading to almost identical failure probabilities.
Only the sagging failure in a full load condition is considered in the present study. This is justified for oil tankers, as the UBC in hogging is usually significantly higher than in sagging. Namely, hull girder stresses are larger in the main deck region because the neutral axis is closer to the double bottom. Next, the collapse resistance of the double bottom is larger compared to the one of the main deck. Finally, because of the local pressure requirements, the plate thickness and size of the longitudinal stiffeners are larger at the bottom compared to the main deck area. The consequences of sagging failure are also more critical than those of hogging failure because sagging usually corresponds to the fully loaded condition, whereas hogging corresponds to ballast or partial load conditions [
18].
3.1. Uncertainty in the Ultimate Bending Capacity
The UBC is defined as the maximum bending moment of the hull girder, beyond which the hull will collapse. The UBC is the sum of the contribution of longitudinally effective elements, considering their load deflection characteristics and post-collapse strength.
The ultimate longitudinal strength of ship hulls can be predicted using assumed stress distribution methods, Smith’s progressive collapse analysis (PCA) method, the intelligent supersize finite element method (ISFEM), and the nonlinear finite element method (NFEM) [
21]. The single-step method (HULS-1) for calculation of the sagging hull girder ultimate bending capacity is a simplified method based on reduced hull girder bending stiffness, accounting for buckling of the main deck. HULS-1 was proposed in the initial version of CSR [
1] and used in [
2,
18].
The progressive collapse analysis (PCA) method, initially proposed by Smith, represents the most frequently used method for ultimate strength assessment [
22]. The crucial part of Smith’s method is the stress–strain relationship for beam columns, of which stiffened panels forming the ship hull are composed. Stress–strain relationships and an incrementally iterative procedure for UBC are proposed in the latest CSR [
4]. The PCA method was used as a reference in the reliability assessment in the present study.
The uncertainty in the prediction of UBC consists of a model uncertainty random variable , which considers the uncertainty of the method to assess the UBC, and the variable which accounts for the uncertainty in the yield strength.
The mean of the modelling uncertainty of HULS-1 was estimated to be 1.05 based on repetitive non-linear FEM analyses and additional verifications [
2,
18]. The bias due to the modelling uncertainty of PCA was taken as unity, as the UBC obtained by PCA is slightly higher than that of the HULS-1 method. The same standard deviation of 0.1 was applied as in [
2,
18], as it was assumed to reflect the difference between the simplified calculations and the nonlinear result, as well as the difference between the nonlinear result and real life.
The distribution of the yield strength
was derived from its characteristic value, which represents the lower 5% percentile. A coefficient of variation of 0.08 is commonly used for mild steel with a characteristic yield strength of 235 N/ mm
2, and 0.06 is used for high tensile steel with a characteristic yield strength of 315 N/mm
2 [
2,
18]. Therefore, the mean values of the used lognormal distribution were higher than characteristic values by factors of 1.14 and 1.10 for mild steel and high tensile steel, respectively. It should be mentioned that of the ships examined in this study, the product tanker was built of mild shipbuilding steel, while the remaining ships were built of high tensile steel.
3.2. Uncertainty in the Still Water Bending Moment
The still water load effects result from the longitudinal distribution of the buoyancy and cargo on-board, and, thus, they are likely to change at each departure, and smaller changes may occur during a voyage. Once the distribution of cargo is known, the still water load effects can be calculated. These include bending moment, shear force, and lateral pressure, but typically, the most important still water load is the vertical still water bending moment. The still water load effects vary with time, so they can only be described by a probability distribution. A Gaussian distribution is often used as the stochastic model of still water bending moment for one voyage, while the parameters of the distribution are calculated using different assumptions, as reviewed by Teixeira et al. [
16].
The approach adopted in the present study was to use the characteristic values from the loading manual (such as the maximum value) to define the probabilistic models of the still water bending moment of individual ships. Based on the analysis of eight test tankers, a stochastic model was proposed in [
2,
18] that described the still water vertical bending moment using a normal distribution with a mean value and standard deviation of 70% and 20% of the maximum value in the loading manual, respectively. For the test ships from
Table 2, the maximum value in the loading manual for the three largest ships was achieved at a full load condition, and it is given for load scenario B in
Table 4. For the Product and Aframax tankers, the maximum values were obtained under partial loading conditions and read 565 MNm and 1435 MNm, respectively. These values were higher than those for homogenous loading conditions, given in
Table 4.
The distribution of SWBM was further multiplied with a model uncertainty factor
, defined by a normally distributed variable with a mean value of 1.0 and a coefficient of variation of 0.1. This uncertainty was included to reflect the uncertainty between the actual SWBM and the corresponding calculated value in the loading manual [
2,
18].
3.3. Uncertainty in the Vertical Wave Bending Moment
A stochastic description of the VWBM is given by the long-term probability distribution, calculated for ship operation in sea areas in the North Atlantic in accordance with the IACS Recommendation 34 Rev. 1 and Rev. 2 [
7,
11]. These recommendations are guidance for seakeeping analysis for the computation of extreme wave loads of ships, providing basic assumptions for the analysis, as given in
Table 1.
In the present study, the transfer functions of VWBM at midship were given by the Closed-Form Expression (CFE), formulated by Jensen et al. [
23]. This expression requires only the main ship particulars as input data, i.e., ship length, breadth, draught, block coefficient, forward speed, and heading angle. The formula is semi-analytical, so it can be easily calculated using a usual spreadsheet application. CFE is particularly suitable for seakeeping predictions in conceptual design, enabling rapid sensitivity analysis of the concept ship in regards to the operating profile and the wave scatter diagram [
24]. The precision and accuracy of CFE are lower than those of other commonly used seakeeping tools (such as the strip theory and the 3D panel method), but it is still acceptable, especially for ships sailing with low speed in head seas [
25].
A Weibull two-parameter model is usually used to approximate the long-term probability distribution of VWBM [
16]:
where
θ and
λ are the Weibull scale parameter and the shape parameter, respectively. It is well-known that the Weibull distribution delivers a good approximation of the amplitude of various ship responses in waves.
in Equation (3) represents the probability that the amplitude of the response variable is less than
xp in one random response cycle, and it is also known as a distribution of peak values. The probability that the response amplitude remains less than a given value
xe over a longer period, e.g., 1 voyage, 1 year, or 25 years, is given by the extreme value distribution, i.e., Gumbel law:
where parameters
and
are derived from the parameters of the Weibull distribution (7) by the following relationships:
The symbol
n in (5) and (6) represents the number of response cycles in a given long-term period, while
, calculated by (6), is the most probable extreme value in
n cycles. The mean value and the standard deviation of the Gumbel distribution are already defined by Equations (4) and (5). The Gumbel distribution is the inherent uncertainty of the extreme vertical wave bending moment, as represented by the random variable
in Equation (2). The coefficient of variation of this uncertainty is usually in the range of 6–10%. The number of cycles
n in a given return period
T, expressed in seconds, is given by the following expression:
where the average zero up-crossing response period
is calculated across all sea states. The mean value and standard deviation of the Gumbel distribution are given by Equations (8) and (9), respectively:
The Weibull distribution parameters
θ and
λ, as well as
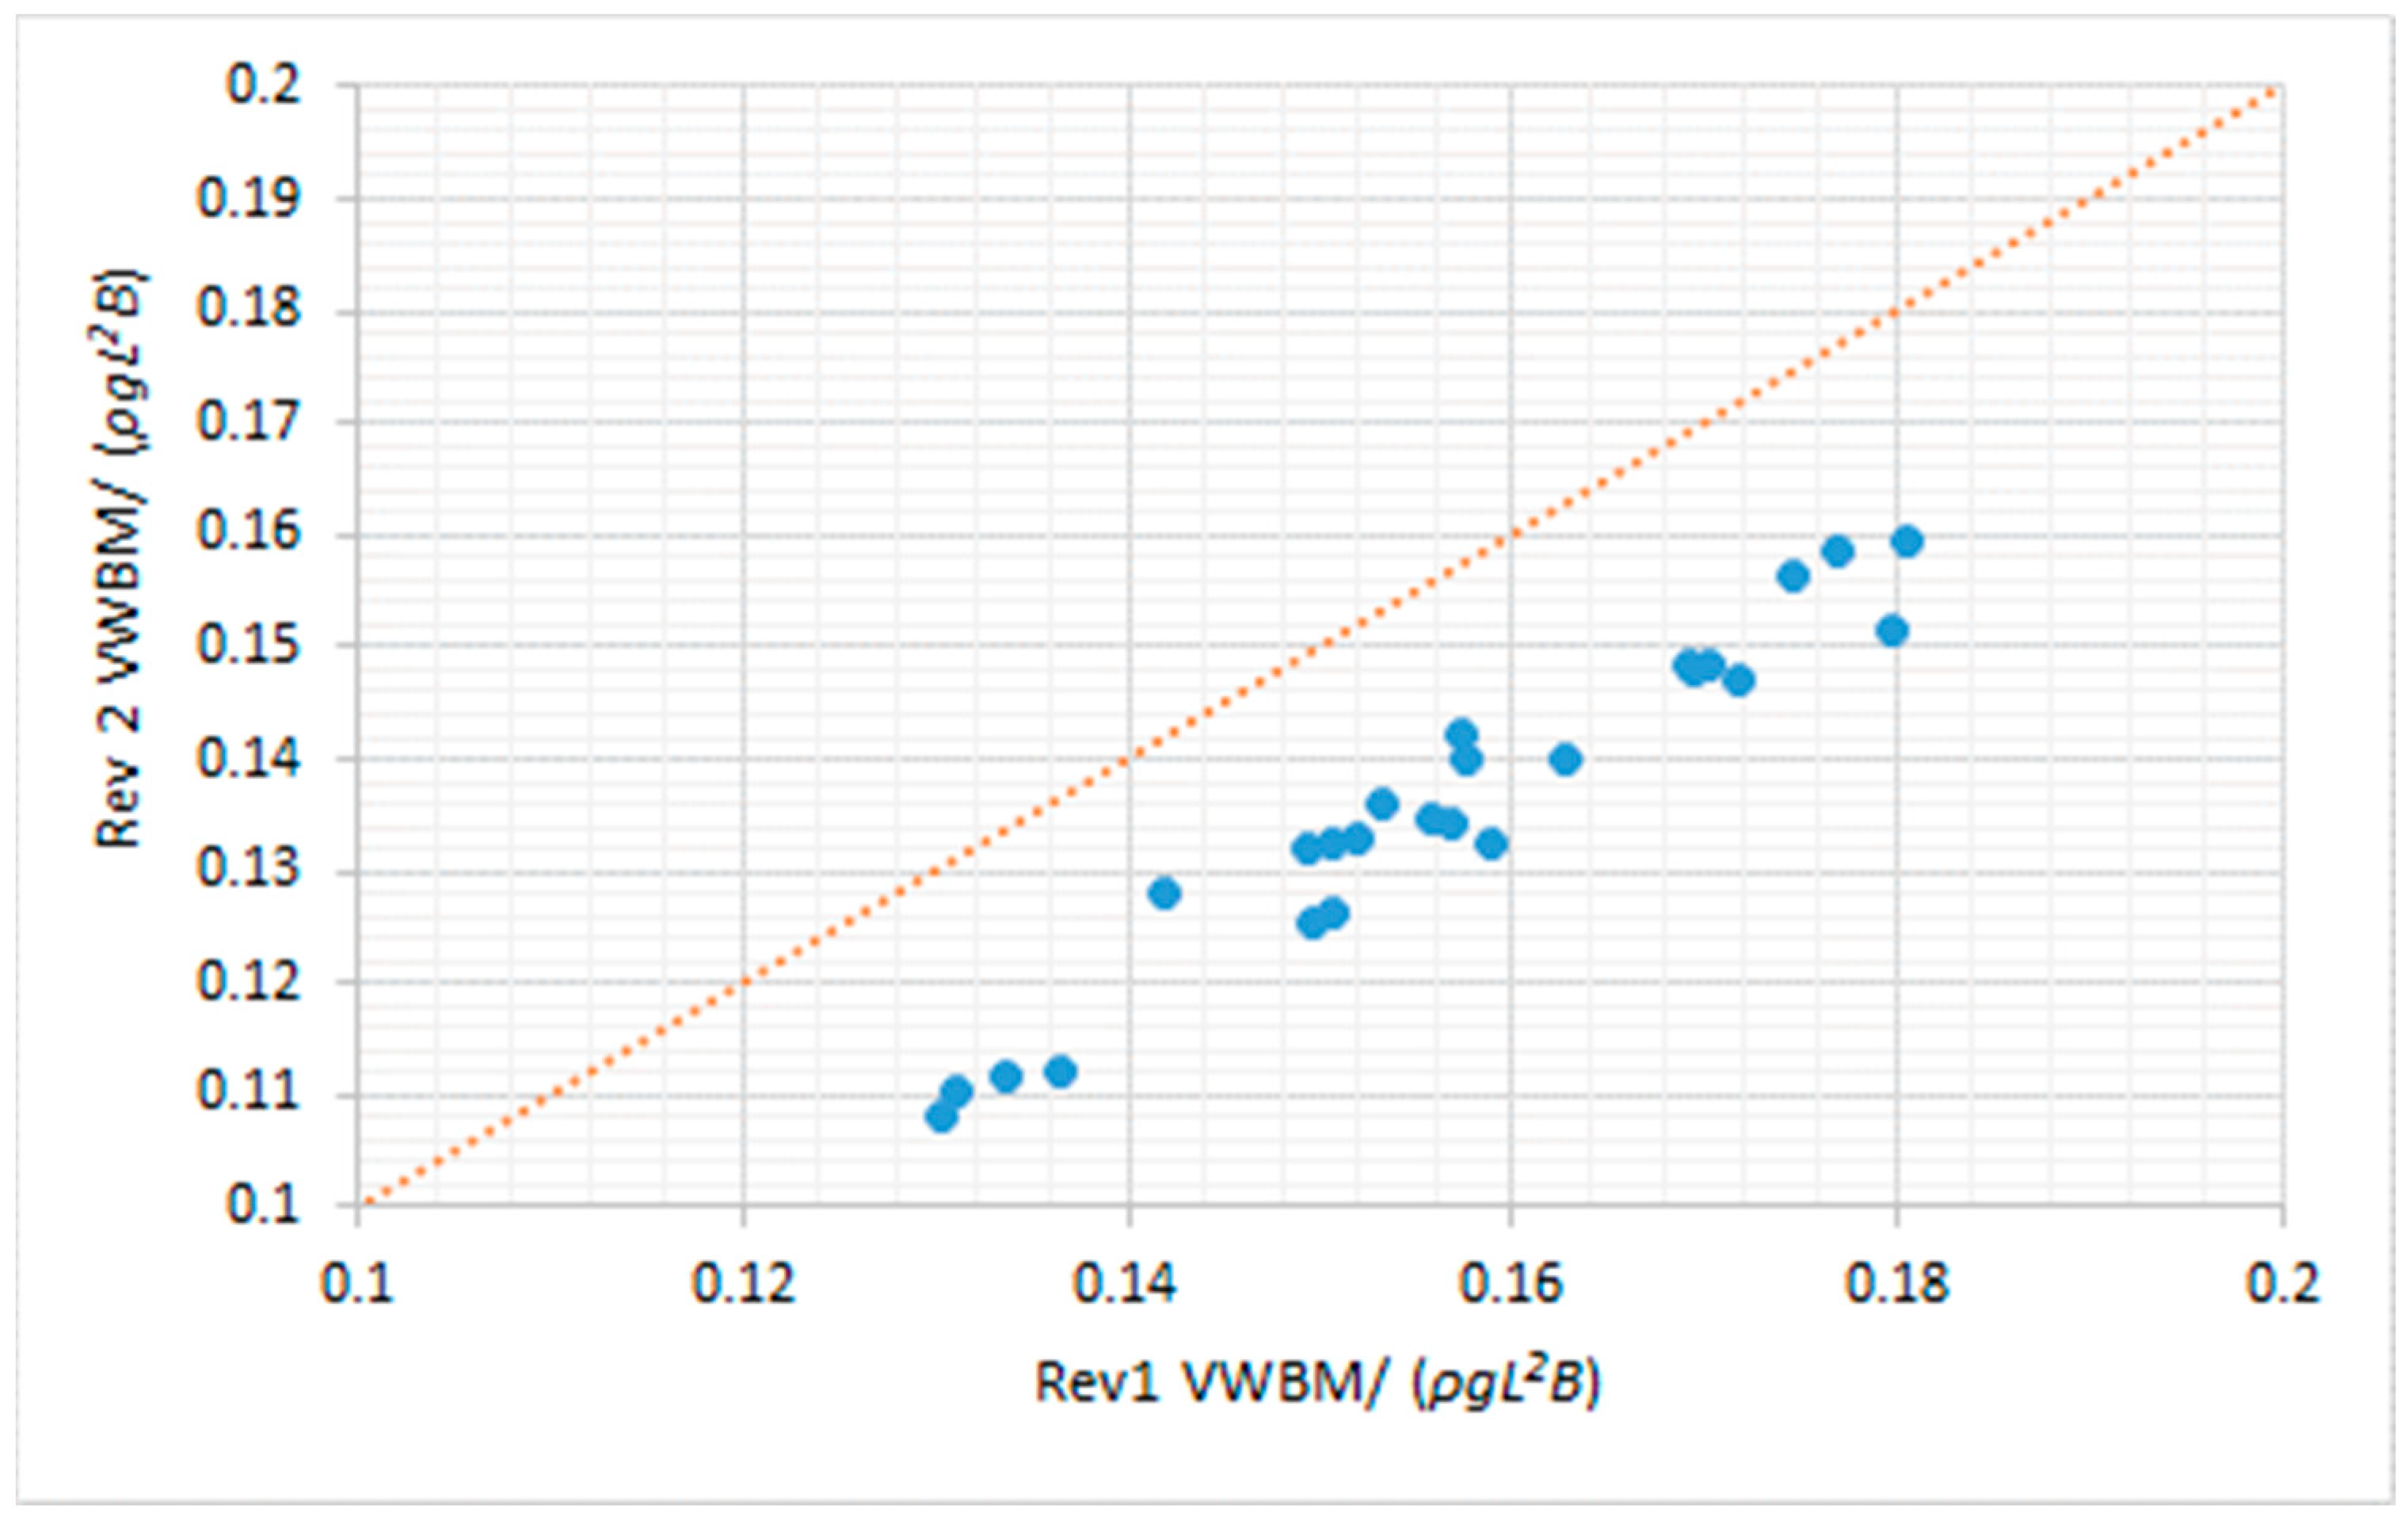
, were determined for twenty-five ships, i.e., eleven bulk carriers, four oil tankers, five container ships, two LNG tankers, one chemical tanker, and a cruise ship. Parameters were determined for two revisions of IACS Rec. No.34, and then the most probable lifetime extreme VWBM was determined for both revisions. The results are presented in
Figure 1. One may observe from
Figure 1 that Rev. 2 provided lower lifetime VWBM compared to Rev. 1, as already reported in [
12,
14].
θ,
λ, and
are presented as a linear function of main ship particulars
L,
B, and block coefficient
Cb, using the following expression:
Regression coefficients
A0–
A3 are determined using multiple linear regression analysis separately for each of parameters
θ,
λ, and
, and for two revisions of IACS Rec. No. 34. Results of the regression analysis are presented in
Table 5, while more details regarding the regression analysis can be found in [
26].
The procedure for calculating design VWBM necessitated the determination of
,
λ, and
θ/
() through employing regression coefficients from
Table 5 in Equation (10). Then,
θ (in Nm) was obtained by multiplying the last variable by
, while the number of cycles
n in the reference return period was obtained by Equation (7). Finally, the parameters of the extreme value distribution of VWBM were calculated using Equations (5) and (6), while the mean value and the standard deviation were given by Equations (8) and (9).
Simplifications, assumptions, and inaccuracies of the linear engineering models used to predict extreme wave loads on ship hulls were considered via the modelling uncertainty variable
, which appears in Equation (2). The mean value and coefficient of variation of the normal variable
depend mostly on the method used for the computation of transfer functions. A mean value equal to 1 and a coefficient of variation equal to 0.1 are used if the 3D panel method is employed for the calculation of transfer functions [
2,
18]. If the strip theory method is used, then a mean value equal to 0.9 and coefficient of variation equal to 0.15 are employed [
27].
The Frequency Independent Model Error (FIME) of VWBM calculated by CFE was determined by the regression equation proposed in [
25]. It was found to be 1.19 for test oil tankers from
Table 2. The regression equation developed in [
25] was based on the extensive comparison of CFE with experiments and other commonly used seakeeping methods. Using data from that same study, FIME for the 3D panel method was found to be 0.98 using corresponding regression coefficients. For the requirements of the SRA presented herein,
was therefore assumed to be a normally distributed random variable with a mean value equal to 1.2. The coefficient of variation was assumed to be 0.2, i.e., larger than those used in the 3D panel and strip theory methods.
The effect of nonlinear response is significant for ships with a low block coefficient, leading to significant differences between sagging and hogging bending moments. For ships with large block coefficients, such as oil tankers, nonlinearities are not so pronounced. In the present study, the model uncertainty
for nonlinear correction is adopted from [
2,
18] as a normal distribution with a mean value of 1.0 and a coefficient of variation of 0.1.
4. Results of the Structural Reliability Analysis
The annual safety indices were calculated for each of the test ships from
Table 2 by the COMREL program using the First Order Reliability Method (FORM) [
28]. Safety indices
β were calculated for the sagging failure mode for ships in full load condition. UBC was represented by the minimum rule requirement, given in
Table 1. The analysis was performed for the extreme value distribution of VWBM calculated according to Rev. 1 and Rev. 2 of IACS Rec. No. 34. The extreme VWBM was calculated for the return period of 1 year, considering that the ship spends 42.5% of the time in the full load condition [
18]. The summary of the stochastic model adopted is shown in
Table 6, where the notation employed in Equation (2) is used.
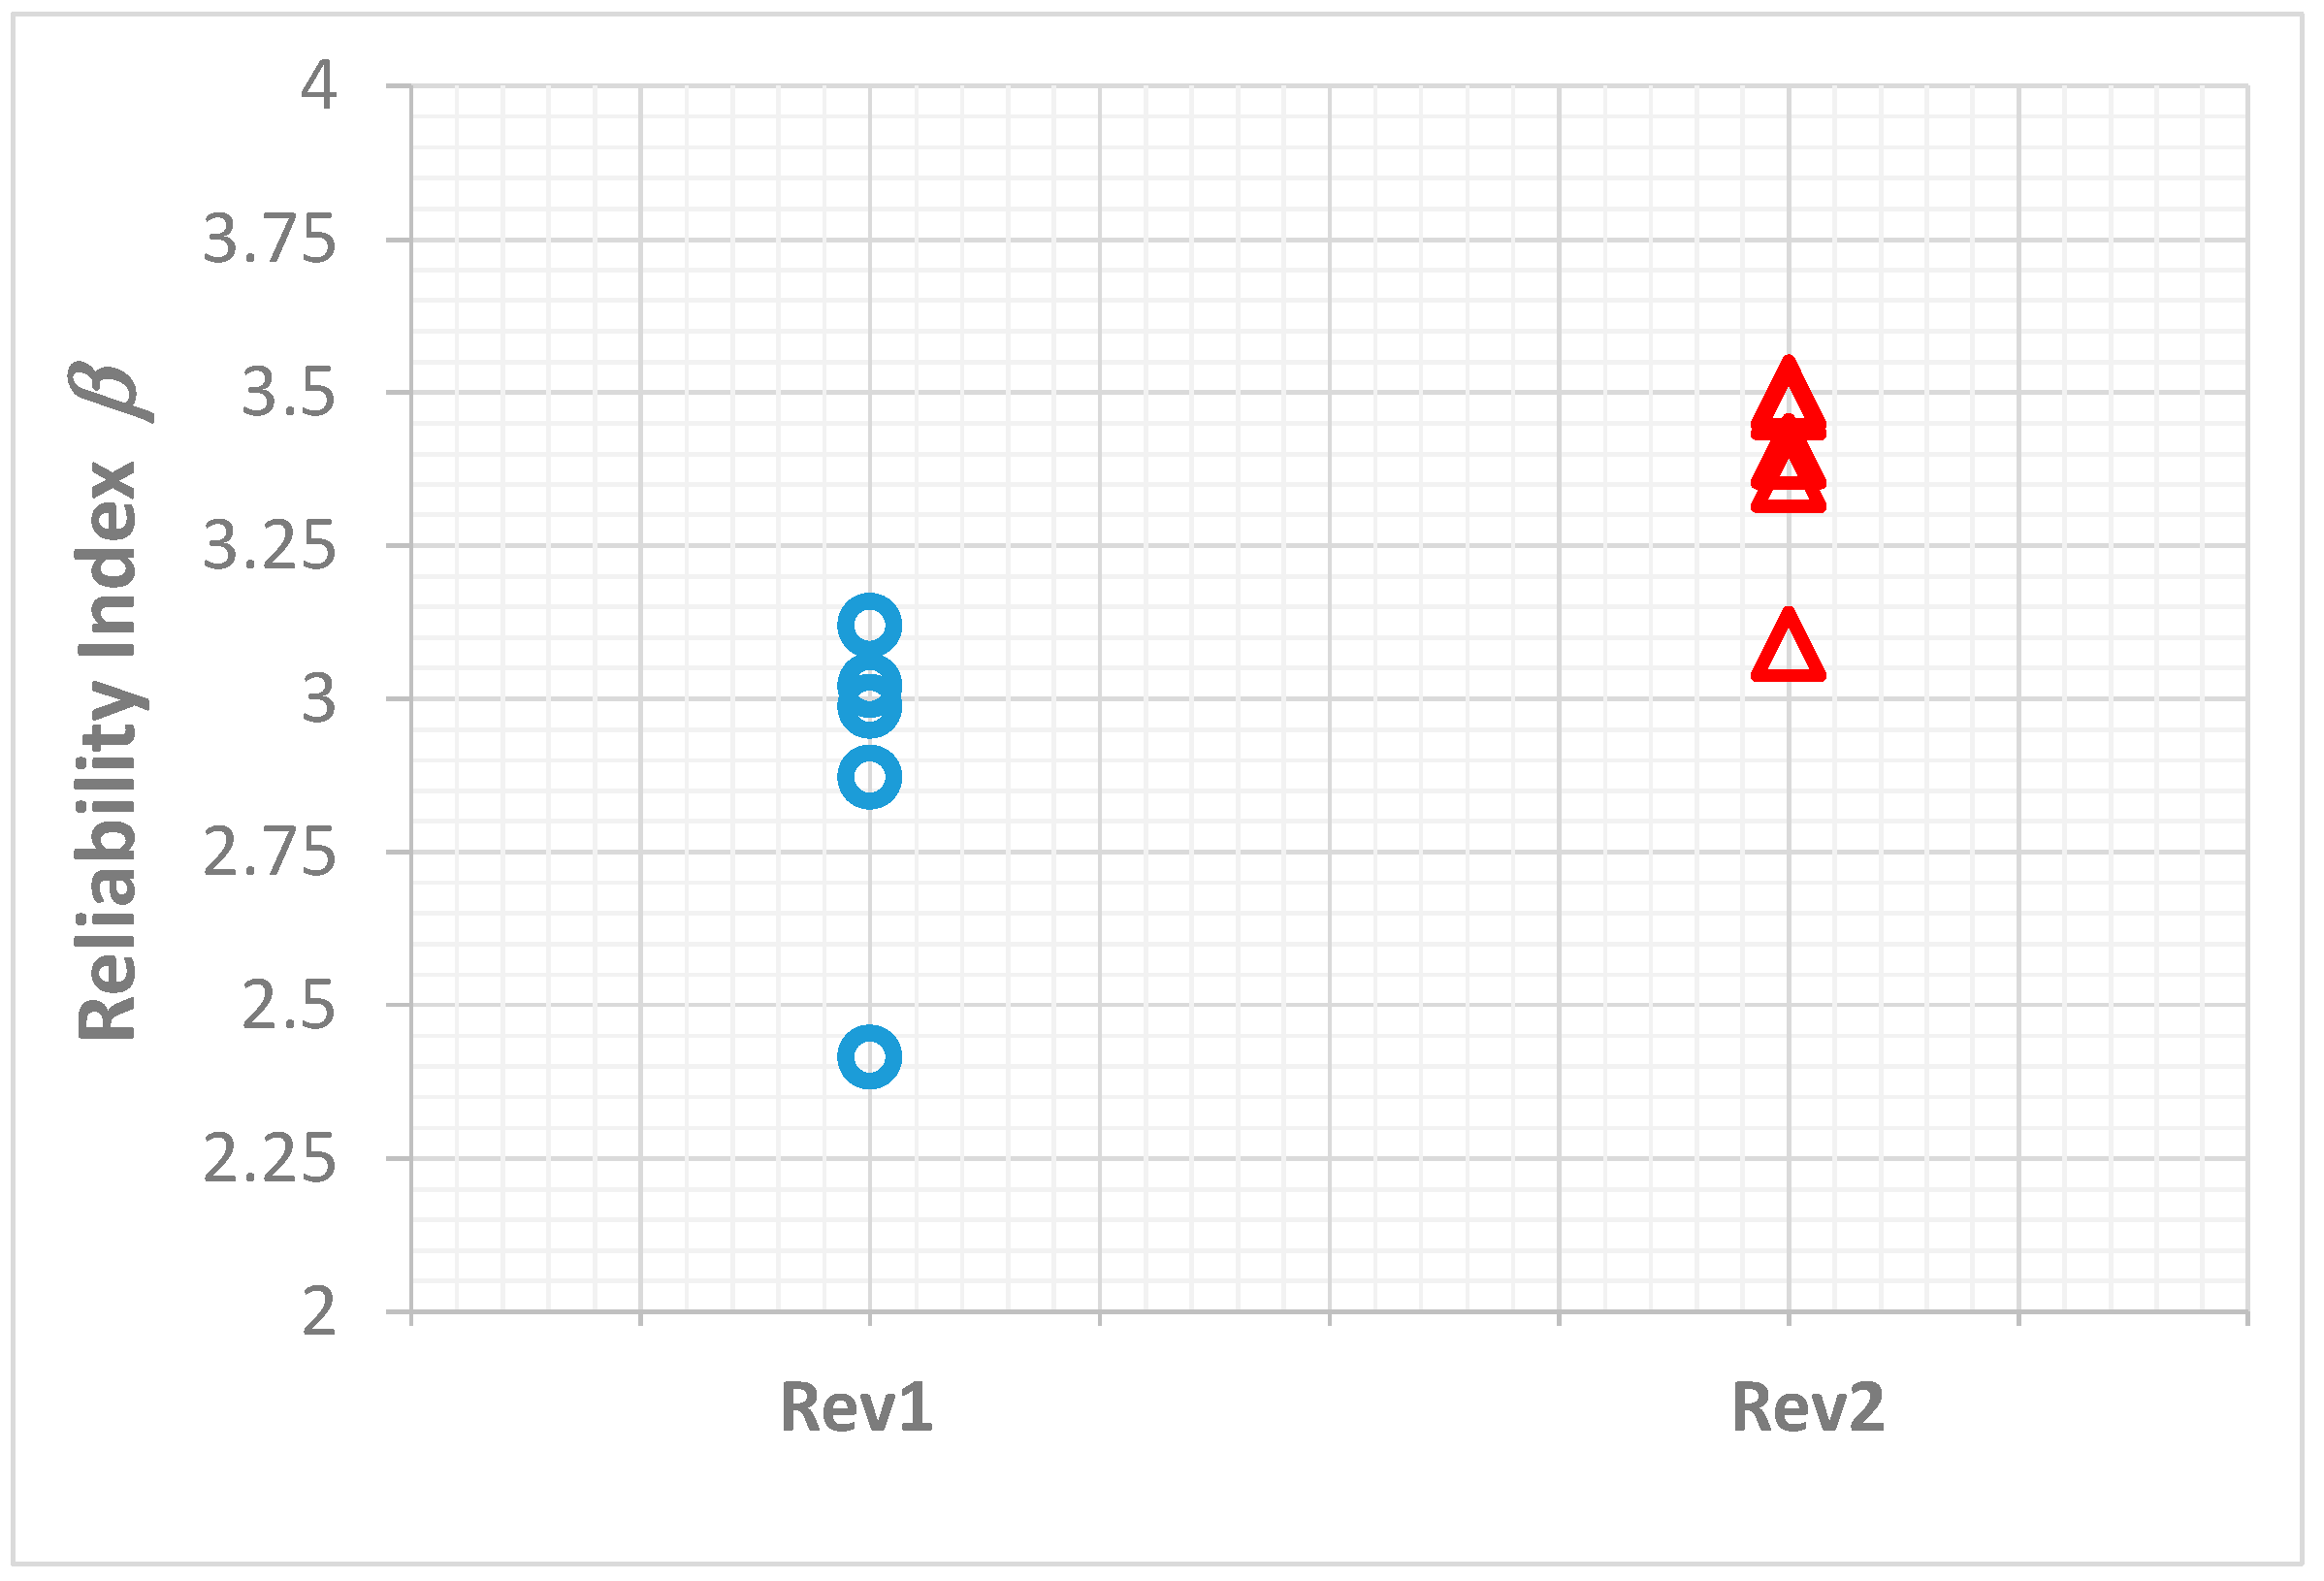
The results of SRA are presented in
Table 7 and
Figure 2 for Rev. 1 and Rev. 2, where the safety indices and failure probabilities are shown.
The reliability indices for Rev. 1 were uniform and close to the target reliability level of 3.09, corresponding to the target failure probability of 10
−3. This was expected, as the same uncertainty models as in
Table 6 were used in the calibration of PSFs, including VWBMs determined according to IACS Rec. No. 34 Rev. 1 [
2,
18].
Reliability indices for Rev. 2 were still uniform, but with a high average value of 3.369, corresponding to the failure probability 4 × 10⁻⁴, much lower compared to the target value. This means that the UBC of ship structures is larger than necessary if state-of-the-art knowledge on wave statistics is used in the SRA.
For both revisions of IACS Rec. No. 34, the lowest safety index was obtained for the Product tanker, which was the only ship made of the mild steel. The yield stress uncertainty of the mild steel had a slightly higher mean value and much larger dispersion compared to the high tensile steel.
5. Discussion
One of the main benefits and unique features of the application of SRA in ship design is providing the potential to reduce weight without loss of reliability if the knowledge or understanding of certain physical phenomena is improved [
29]. This is exactly what happens when wave statistics based on the hindcast wave database and information about ship positions replace wave statistics obtained by visual observations collected a century ago. This change in statistics represent improved knowledge, reflecting in increased notional ship structural reliability that also influences reliability based PSFs.
The problem of adjusting PSFs can be formulated as the optimization task to find a set of PSFs that minimize the deviation in annual failure probability from the target annual failure probability of 10
−3 [
18]. In other words, PSFs from
Table 3 should be re-calibrated in a way that results in the required
Mu corresponding to the target annual failure probability. Since the change in the safety indices is caused only by the modification of wave-induced loads, the corresponding PSF
is varied accordingly in the present study. This is not exactly the truth, as the change in the uncertainty model of one variable also influences other PSFs, albeit to a much lesser extent, and that consideration is hence neglected.
Optimized
values, which are about 14% lower than the initial values in
Table 3, are presented in
Table 8.
The required UBCs for each test ship are presented in
Table 9, together with the ratio of
after re-calibration of the PSFs and original values. It can be seen that the required
was consistently reduced by 10% for all ships. Referencing the results presented in Figure 10 of [
18], it may be concluded that the main deck cross-sectional area could be reduced by the same percentage, representing considerable material savings.
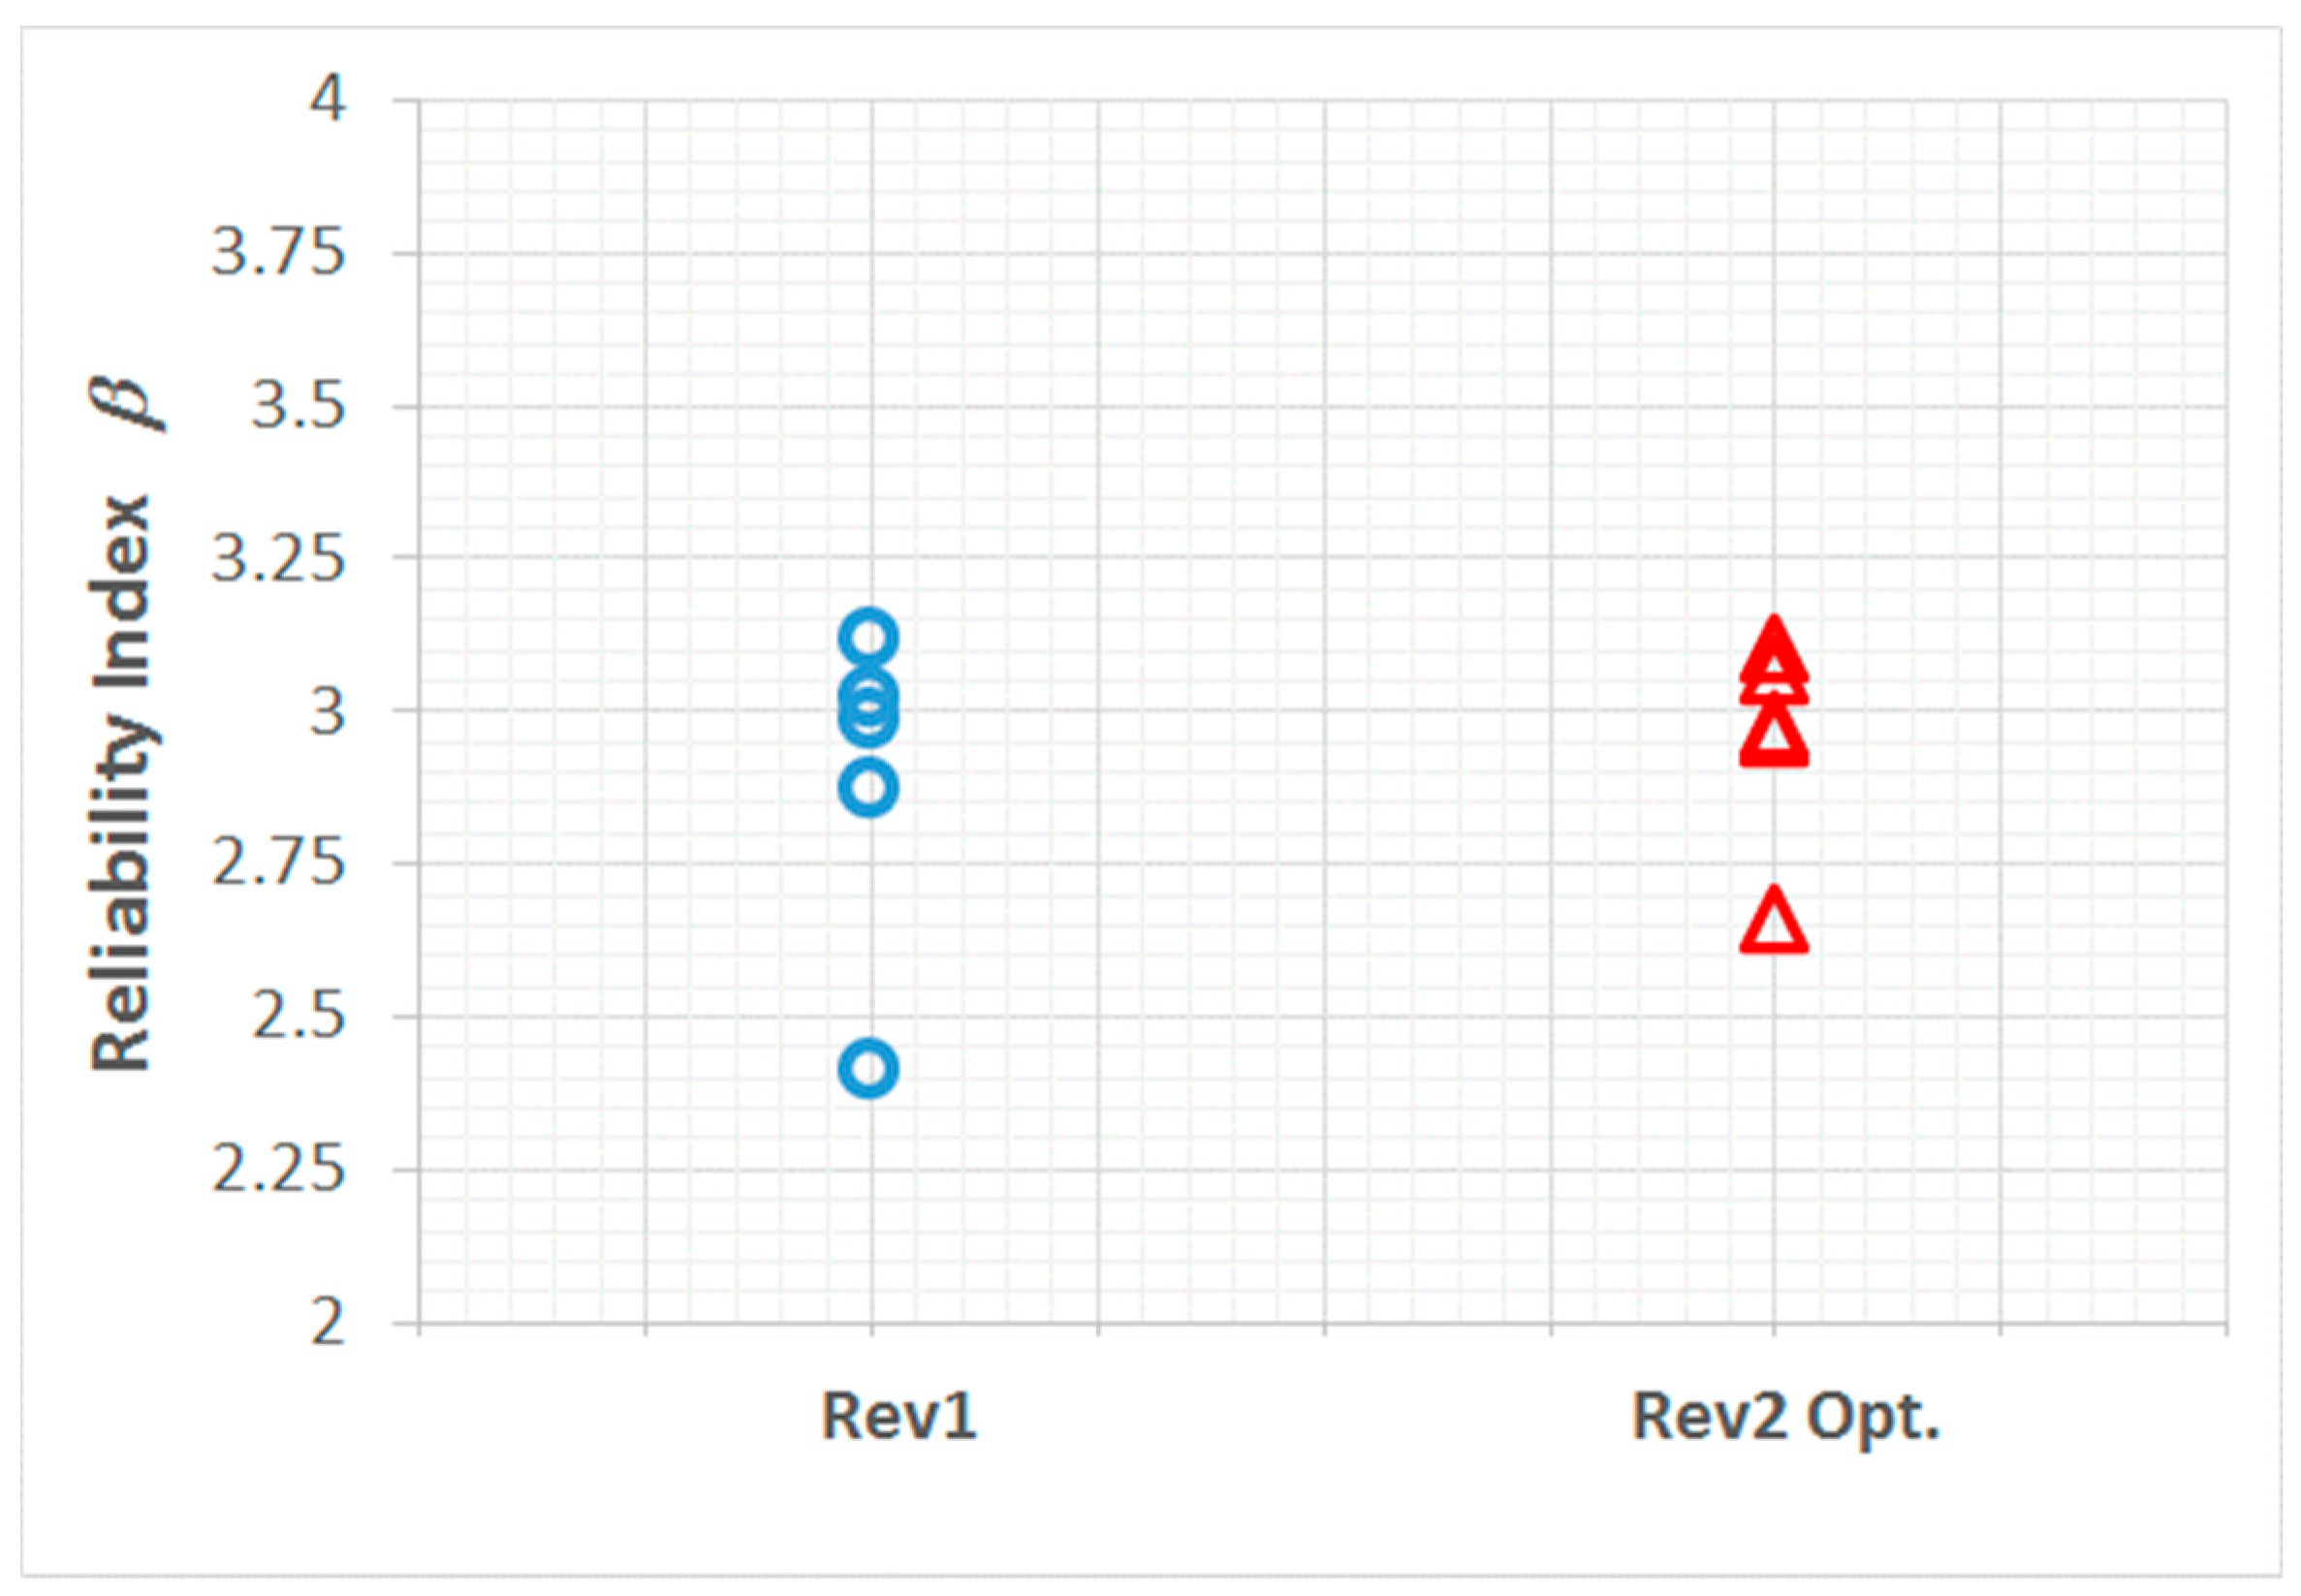
Results of the SRA of “re-designed” ships, according to Rev. 2 and using
from
Table 9, are presented in
Table 10 and
Figure 3. For comparison,
Figure 3 includes the original results for Rev. 1, already presented on the left-hand side in
Figure 2.
It may be concluded from
Table 10 and
Figure 3 that the safety of ships designed according to the optimized PSFs is slightly improved compared to the original PSFs if Rev. 2 is used instead of Rev. 1. Therefore, the weight reduction of double hull oil tankers is possible without compromising ship structural safety.
Among the benefits of the application of SRA is the provision of rational means for the decomposition of the global safety of a structure into partial safety factors associated with the individual design variables [
29]. This is achieved through the coordinates of the “design point”, representing the scenario most likely to occur at failure, i.e., the point on the limit–state function that has the maximum conditional probability when failure occurs. The coordinates of a “design point” are provided as the results of the SRA. By dividing these coordinates by characteristic values of pertinent variables, “rational” PSFs are calculated as:
where * denotes the coordinate of the design point of the corresponding random variable, and
and
are characteristic values of SWBM and VWBM, given in
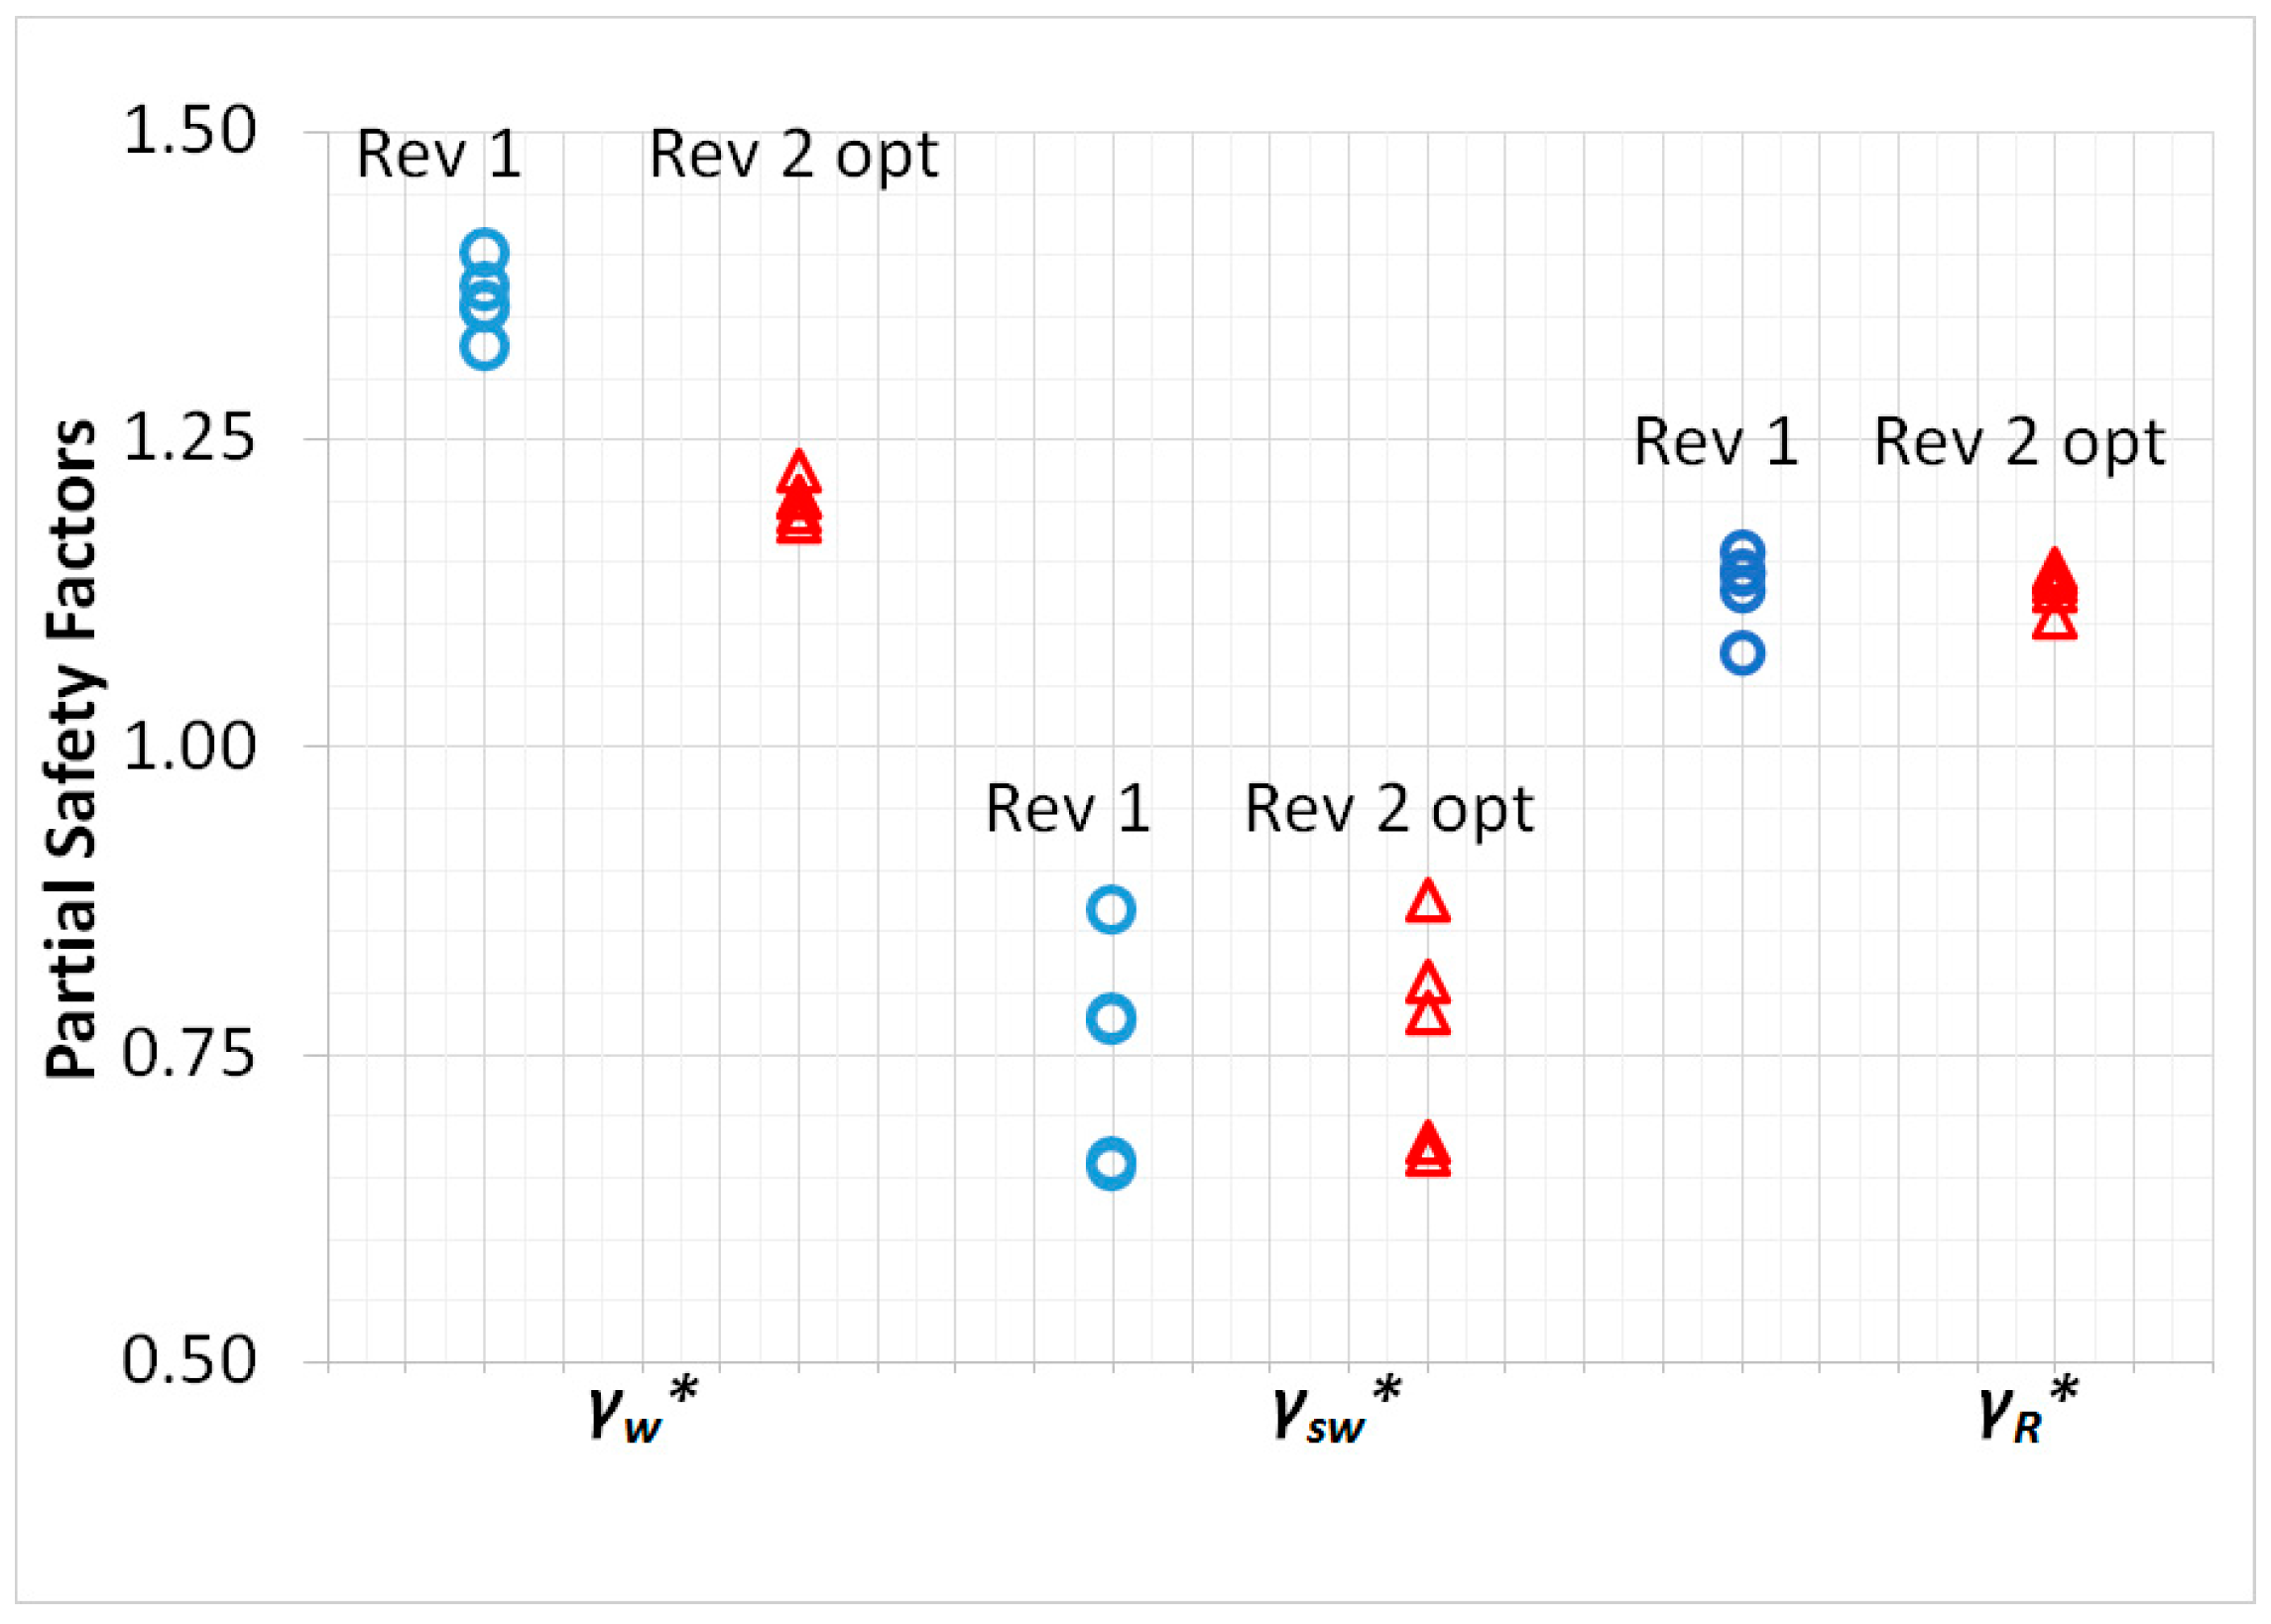
Table 2. The “rational” PSFs from SRA are presented in
Figure 4, for Rev. 1 using original PSFs, and for Rev. 2 using optimized PSFs.
One may notice from
Figure 4 that only
changed significantly for “re-designed” ships analyzed, according to Rev. 2. Thus, the average
was reduced from 1.36 for Rev. 1 to 1.2 for Rev. 2. Next, the average
and
read about 0.75 and 1.13 for both revisions, respectively. This also justifies the approach to optimize only
. Similar values of “rational” PSF for Rev. 1 were obtained in [
2,
18], where the spread of
was the largest, followed by the spread of
, while
was almost constant among ships. Classification societies decided to slightly adjust rational PSFs in CSR for convenience, i.e.,
and
were fixed to 1 and 1.1, respectively [
4].
Another benefit of the SRA is in the provision of a framework of sensitivity measures [
30]. The normalized sensitivity factors
are calculated by COMREL, representing the sensitivity of the safety indices to the basic variables. The square of each sensitivity factor
represents the relative importance of each random variable, and the overall importance of each strength or load component can be obtained by the sum of
of the corresponding random variables. The relative importance of each component is presented as a pie chart in
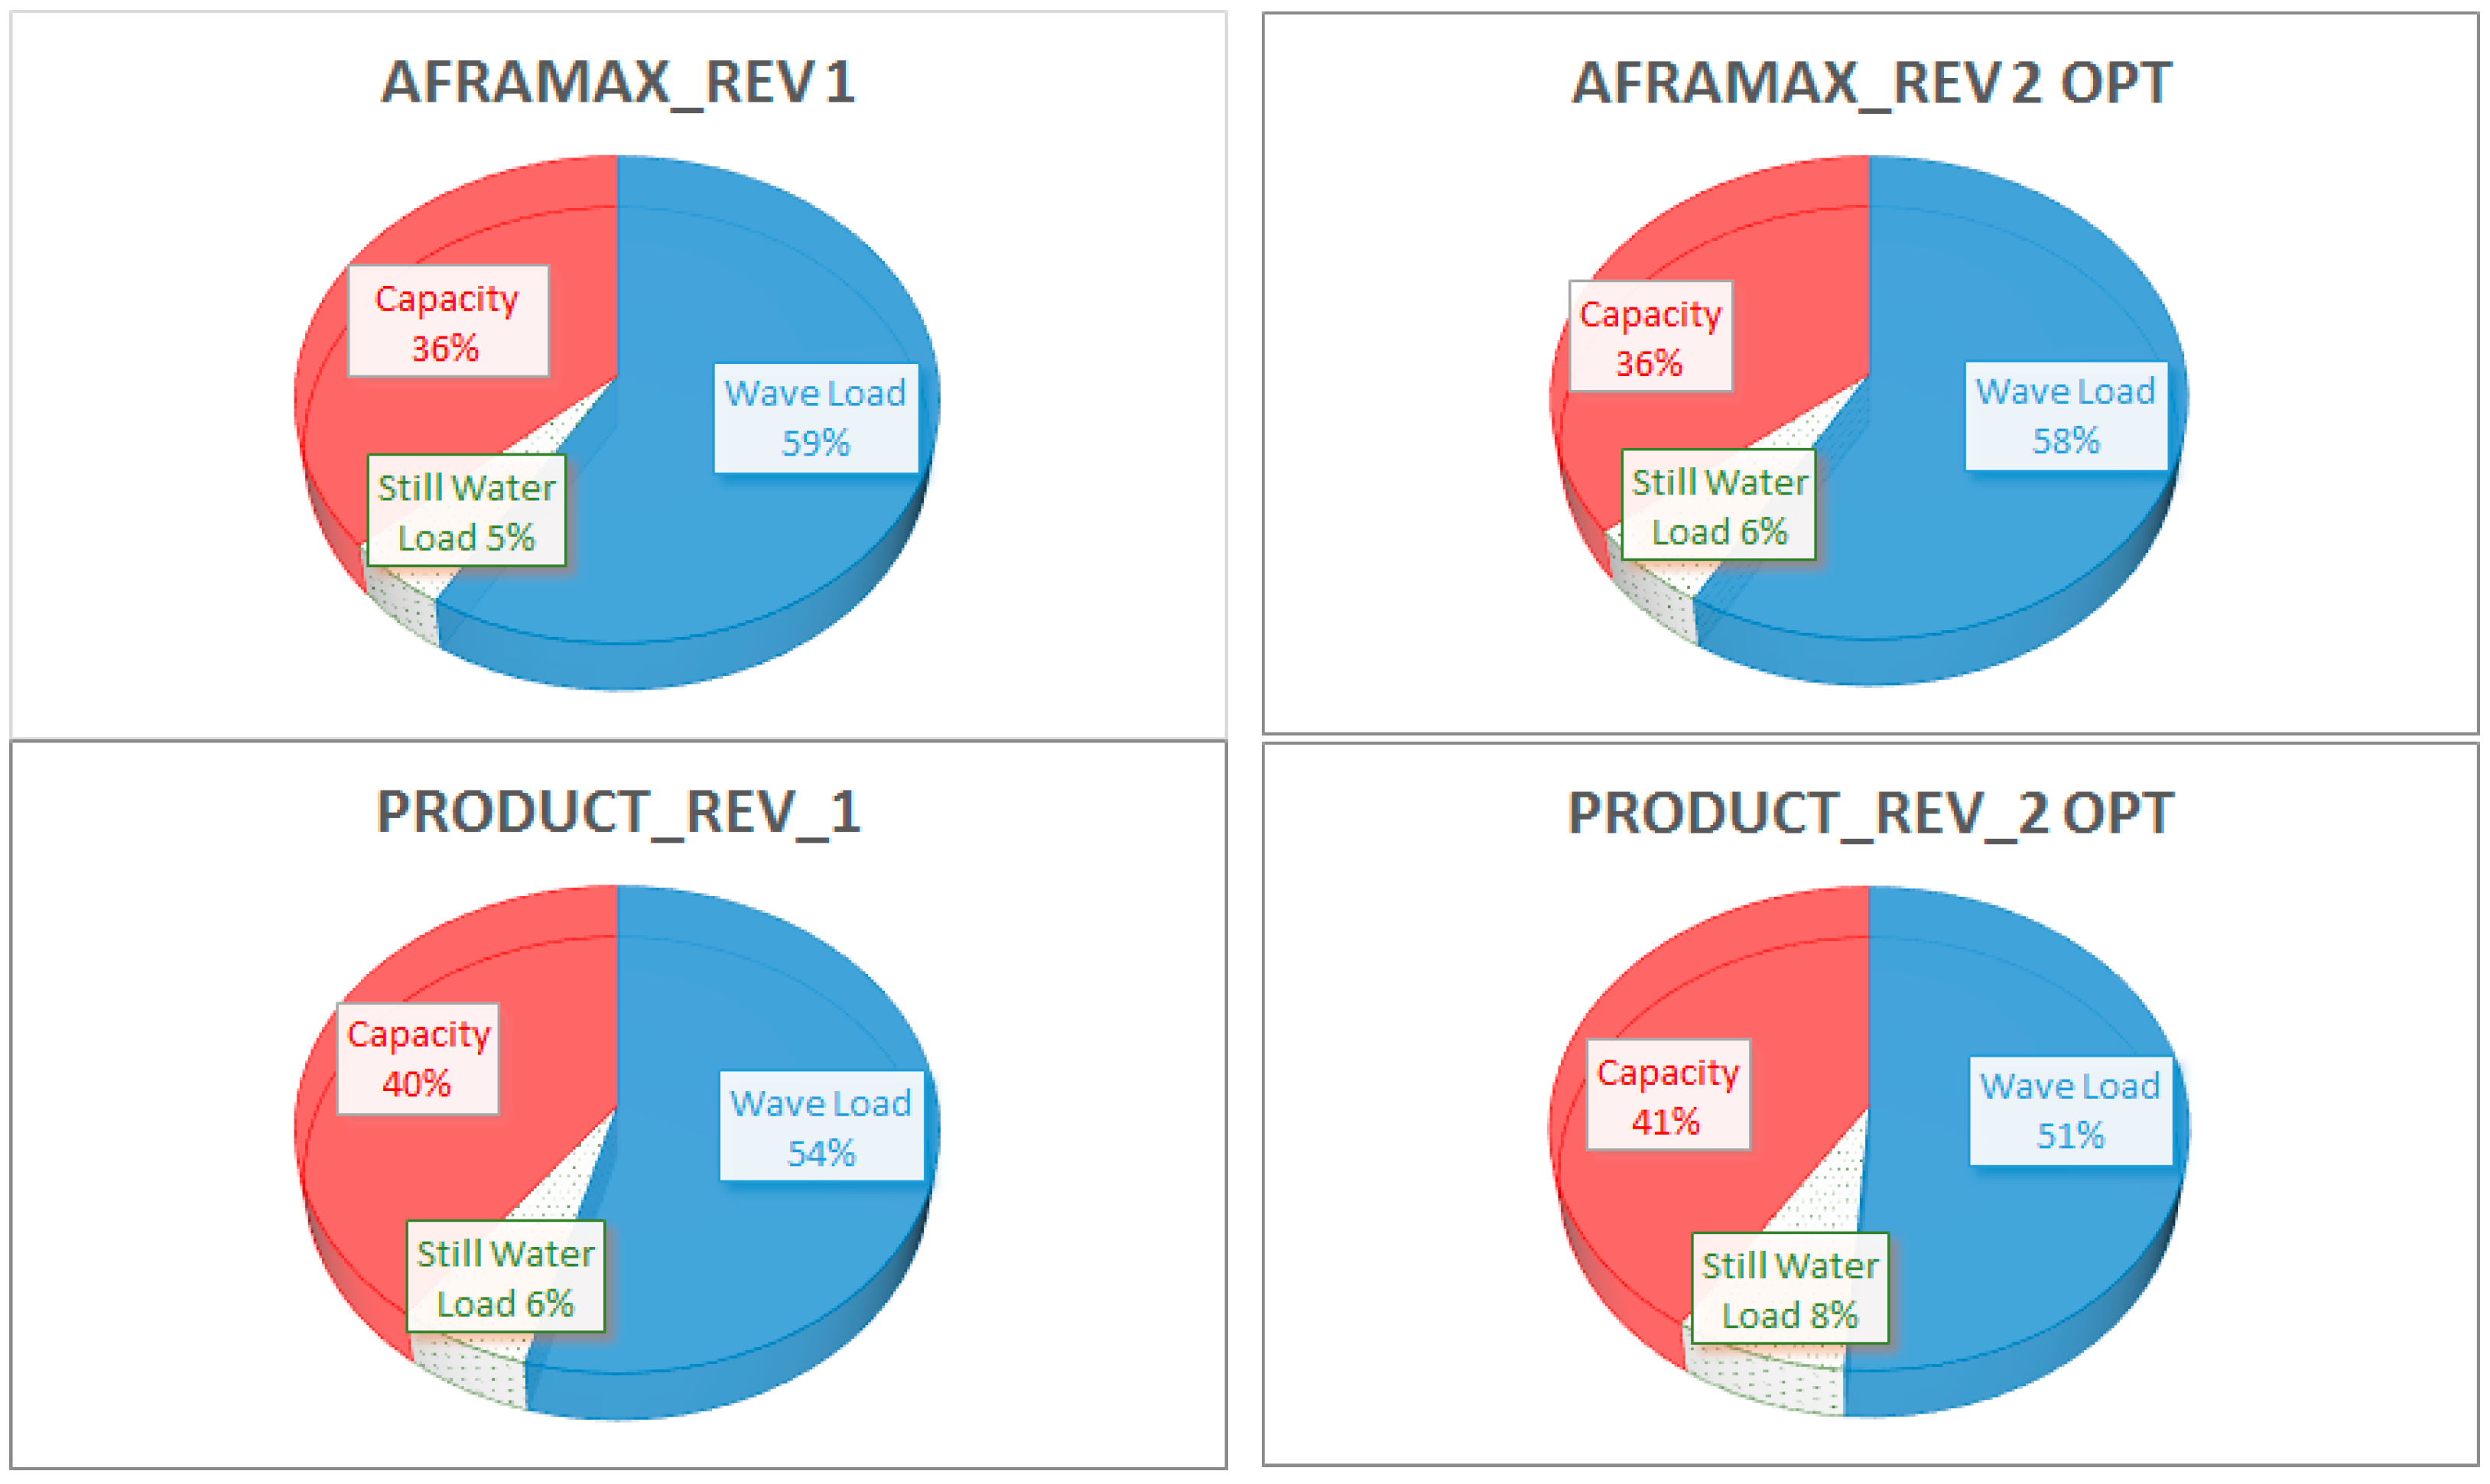
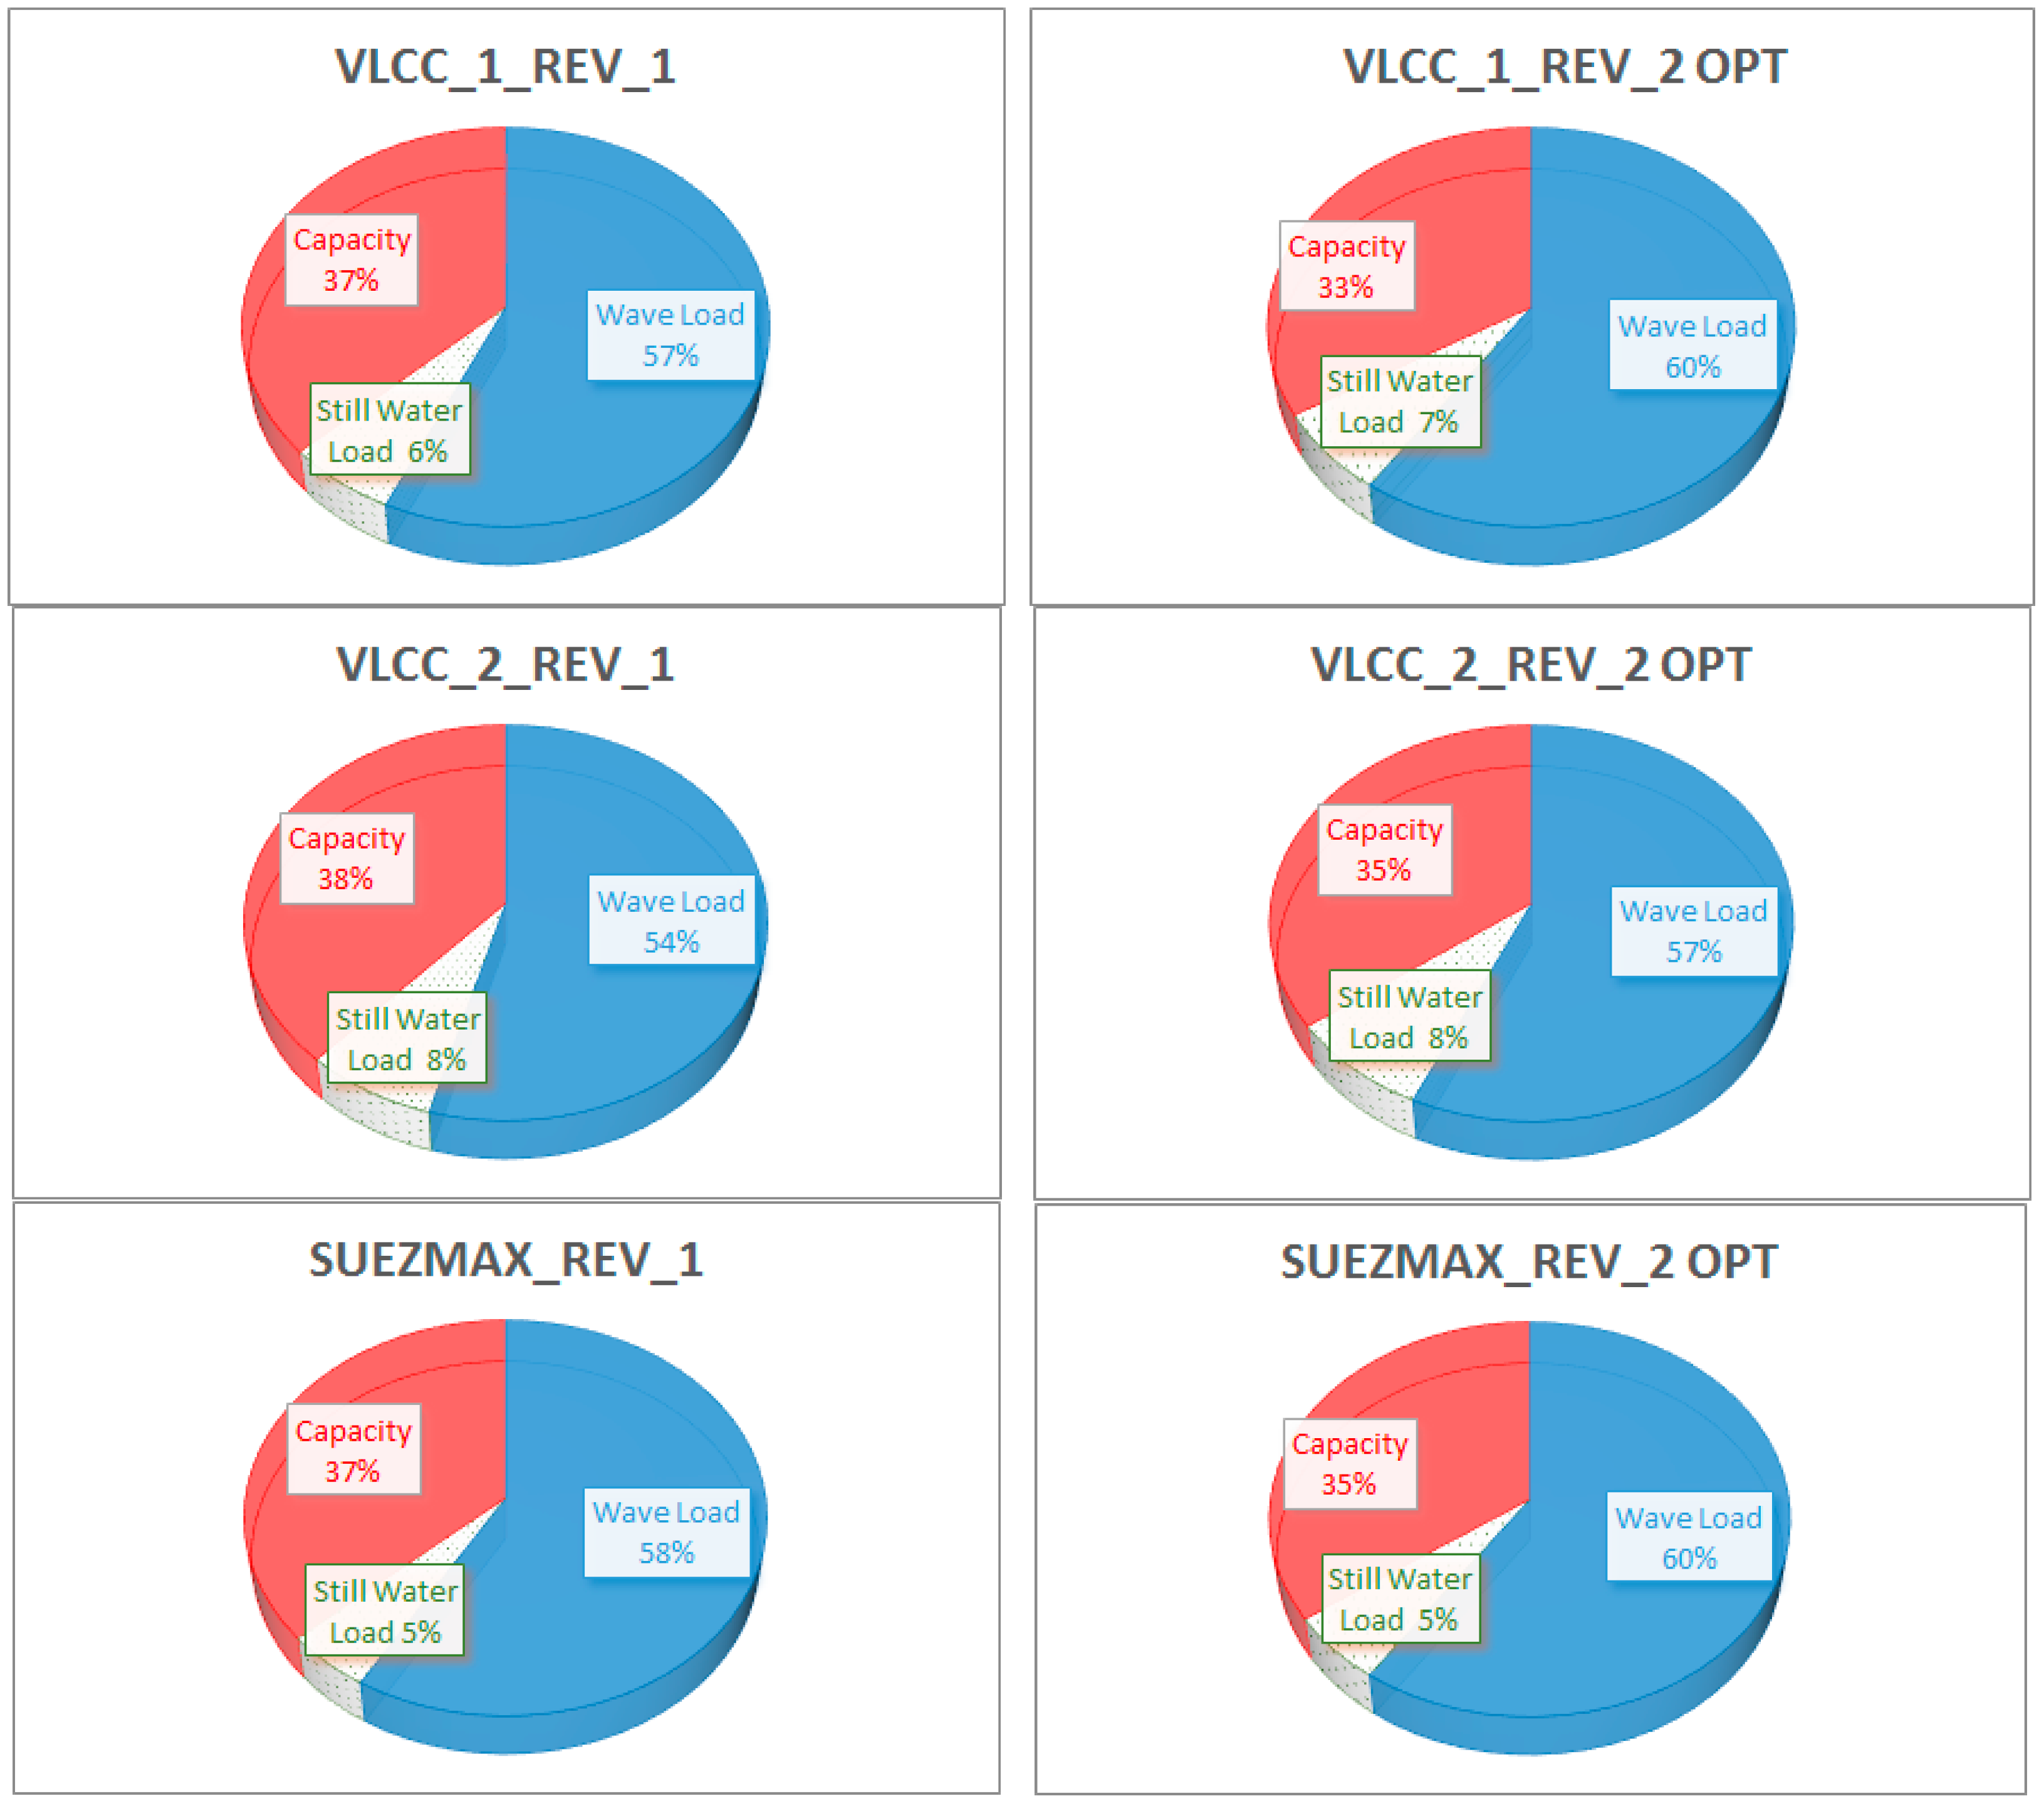
Figure 5 for test ships for Rev. 1 and Rev. 2.
It may be concluded from
Figure 5 that the uncertainty in VWBM had the largest influence on the safety index in both absolute and relative terms. Namely, in all cases, the “share” of the sensitivity in VWBM was larger than 50%. More precisely, for Aframax, Suezmax, and both VLCCs, the importance of wave loads was 60%, while for the Product tanker it was slightly more than 50%. The importance of the uncertainty in the UBC was second most influential, representing about 40% of the total importance for the Product tanker and 30% for the remaining ships. The uncertainty in SWBM was the least important, with a “share” of about 10% for all ships. It follows from
Figure 5 that the sensitivity factors (represented in terms of percentage) were similar for Rev. 1 and for Rev. 2 after the optimization of
.
6. Conclusions
The presented study aimed to investigate the structural reliability consequences of improved knowledge on wave statistics, as reflected in the revised procedure of classification societies for direct computation of long-term extreme wave loads on ships. The reduction of notional failure probability based on the improved knowledge on some physical phenomena, along with achieving corresponding steel savings without compromising ship safety, are some of the main benefits of implementing structural reliability analysis. This has been demonstrated in the present study, which was based on the same assumptions and uncertainty models as the procedure used by the International Maritime Organization for probability-based calibration of partial safety factors for the ultimate longitudinal strength of double hull oil tankers. The following conclusions have been drawn from the study:
The structural reliability of test ships, regarding ultimate longitudinal strength, using the “old” recommendation for global wave load computation, was found to be similar to that calculated by the International Maritime Organization.
The structural reliability of test ships can be increased if the extreme wave loads are calculated using the revised recommendation of the International Association of Classification Societies, which presents improved wave statistics.
The partial safety factor for vertical wave bending moment may be reduced by 15%, and consequently, the required cross-sectional area of the main deck may be reduced by 10% to get the same notional structural reliability through using the “new” recommendations as opposed to the “old” procedure for wave loads computation.
Other structural reliability measures, such as “rational” (or meaningful) partial safety factors and sensitivity factors, were found to be almost unaffected by the new procedure for wave load computation and were in line with previous ship structural reliability studies, proving that the results of the analysis are stable and credible.
In addition to the novel investigation of the safety of oil tankers using a revised wave scatter diagram, this study offered a new rapid method for calculation of extreme vertical wave bending moments, based on the regression of parameters of the Weibull function, used as the long-term probability distribution of wave-induced loads.
The positive economic benefits of lower steel weights in ship design will be reduced by increased maintenance costs, e.g., because of the higher probability of fatigue cracks and corrosion-related failures. These effects, which eventually should be considered via employment of a risk-based cost–benefit analysis, are outside the scope of the present study.


