1. Introduction
Ship transportation has always occupied a dominant position in world trade and transportation since the age of navigation. As the main layout of the ship’s main and auxiliary engines, the engine room is called the “heart of the ship”, and its importance is self-evident. In the field of ship design and manufacturing, the advancement and development of ship automation are largely reflected in the increased level of automation in the engine room. The complexity of the engine room equipment and the reduction in crew size increase the difficulty of crew operation. Meanwhile, the development of large-scale and intelligent ships, as well as the gradual widespread application of informational and intelligent devices in the industrial sector, further determine the significant research status of intelligent engine rooms.
As an essential component of ship automation, the engine room monitoring and alarm system is installed in the centralized control room of the ship’s engine room. It can accurately and reliably monitor the operating conditions of various power equipment items in the engine room, such as the main and auxiliary engines. Once a fault occurs in the operating equipment, the system can automatically emit audible and visual alarm signals and record the alarm information, thereby facilitating the timely detection of equipment malfunctions and enhancing operational reliability. However, the defects in a large number of valves and instruments in the engine room can only be identified by visual inspection to determine whether they are functioning properly, posing significant challenges for maintenance personnel. Additionally, the lack of timely detection of leaks and gas leaks poses substantial safety hazards. Therefore, the design of a visual sensor capable of monitoring engine room equipment and promptly transmitting visual fault information to the monitoring system is particularly crucial. To design a visual sensor capable of monitoring engine-room equipment, computer vision technology is needed to achieve autonomous recognition without human intervention. This paper mainly utilizes computer vision technology to monitor and recognize engine room equipment, while providing potential guidance for subsequent tasks, such as defect detection.
While convolutional neural networks have demonstrated good robustness in many applications, there is still a long way to go in achieving intelligent object detection and classification within ship engine rooms. Specifically, the main challenges include the following:
Presently, there is limited adoption of visual perception techniques in engine rooms, and there is a dearth of publicly available datasets specifically designed for engine room equipment.
The engine room houses a diverse array of mechanical equipment in large quantities, with potentially significant variations in appearance among devices of the same type. Furthermore, disparate scale discrepancies exist between different devices within the same environment.
The dense layout of equipment within engine rooms, coupled with numerous instances of occlusion between devices, pose significant difficulties in accurately segmenting objects from their surroundings.
To tackle the challenges outlined above, this paper introduces an enhanced model for device detection leveraging YOLOv8-M. By improving upon the detection accuracy of traditional models, this enhanced approach meets the visual monitoring needs of device surveillance. The primary contributions of this paper are as follows:
In order to tackle the dataset problem for engine room equipment detection, we leveraged photographs taken by 3D Engine Room teams on real ships. The data was subjected to screening and augmentation to create a proprietary visual-detection dataset for engine-room equipment, featuring eight categories including valve, meter, reservoir, pump, cooler, marine incinerator, button, and compressor.
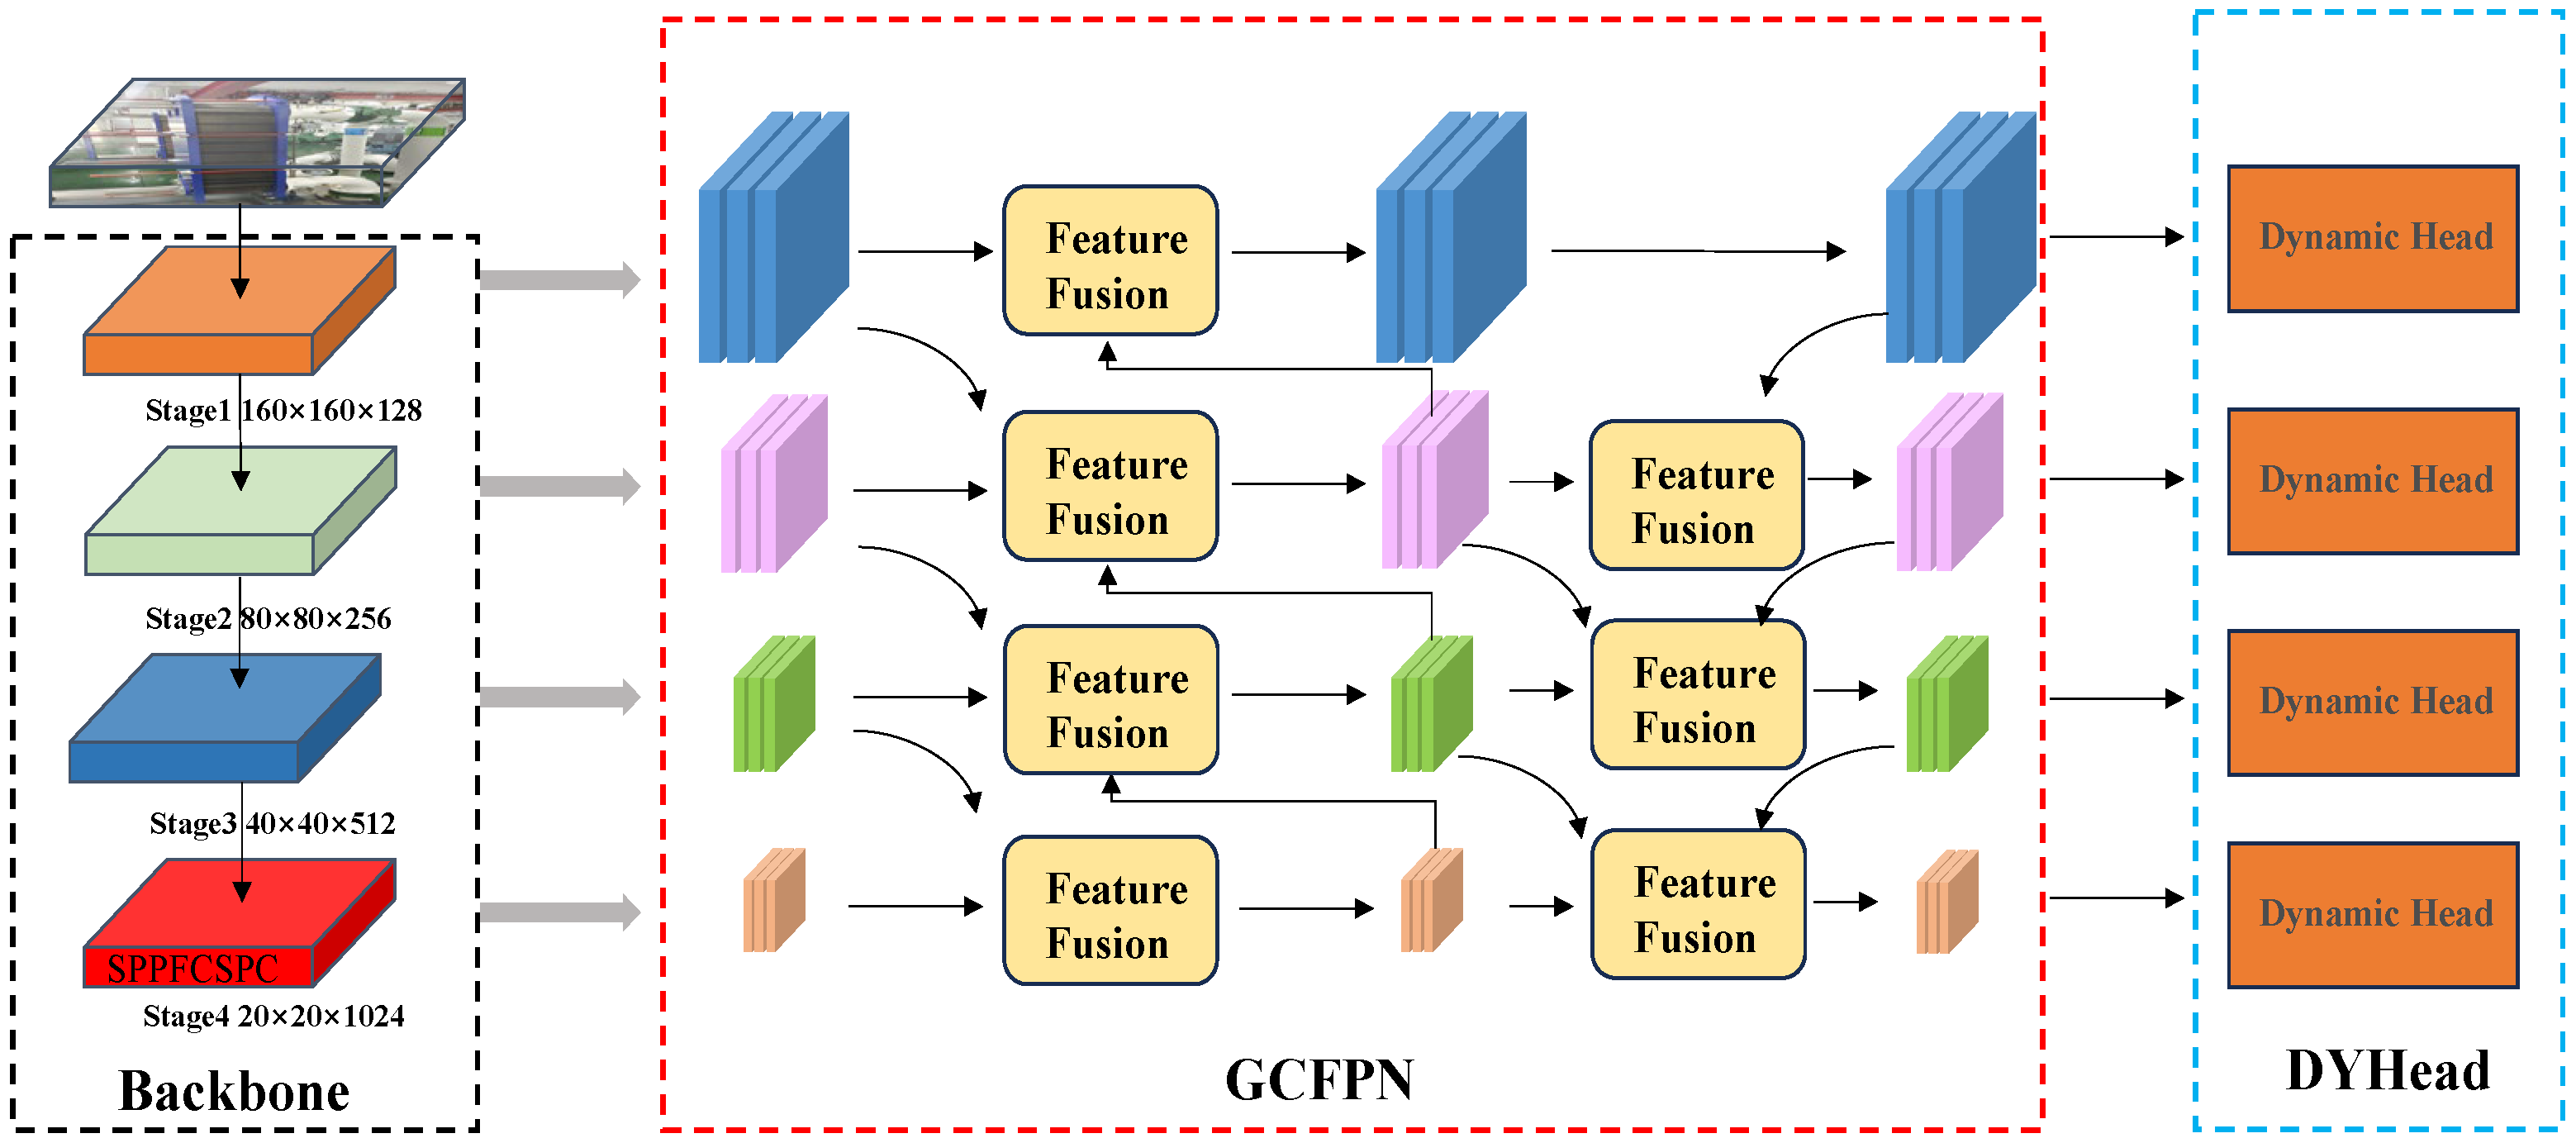
The SPPF module in the backbone network has been replaced with the more powerful SPPFCSPC module; this makes the benchmark model more adaptable to the multi-scale feature input of the cabin equipment. The feature extraction part relies on the feature extraction idea of GFPN to further improve the feature fusion, the generalization ability of the model was improved to better adapt to the changing cabin scenarios. The detection head part introduces the Dynamic Head module, which integrates the deformable convolution so as to improve the performance of the network, sensitive to full-scale targets.
Meanwhile, in order to solve the data imbalance problem, the original CIOU Loss is replaced, and the method for replacing it with EIOU Loss, Focal EIOU Loss, and WIOU Loss was selected for comparison experiments.
The remainder of the paper is structured as follows,
Section 2 describes the related object-detection research and data-collection process;
Section 3 introduces the improved YOLOv8-M based on a multi-angle improved object detection model;
Section 4 validates the model on the COCO dataset and a home-made dataset; and
Section 5 includes a conclusion and discussion section.
2. Related Work
2.1. Object Detection
Object detection plays a pivotal role in numerous computer vision tasks such as instance segmentation [
1,
2,
3,
4], image captioning [
5,
6,
7,
8], and object tracking. The rapid evolution of deep learning technology [
9] has played a crucial role in propelling advancements in object detection, resulting in significant breakthroughs and establishing it as a focal point of research with unparalleled interest. Object detection finds widespread application in numerous practical scenarios, including autonomous driving, robot vision, and video surveillance. To address the real-time demands of object detection, single-stage object detection methods have emerged, utilizing the “anchor point + correction” methodology to enable detection. These methods perform only one feed forward network computation, which is very fast and can achieve real time results. The YOLO framework, introduced by Joseph et al. [
10] in 2015, presents a fast object detection approach employing a single neural network to process entire images. By dividing images into regions and simultaneously predicting bounding boxes and probabilities, YOLO achieves remarkable detection speed. However, it suffers from reduced localization accuracy, especially for smaller objects. To address this issue, subsequent versions of YOLO [
11,
12,
13] and the SSD approach [
14] have prioritized improving accuracy. One noteworthy advancement is YOLOv7 [
15], an iteration following the YOLOv4 team’s work. YOLOv7 outperforms existing object detectors in terms of both speed (5–160 fps) and accuracy. Released on 10 January 2023, YOLOv8 by Ultralytics represents an advanced model surpassing its predecessors, including YOLOv5 and YOLOv7, in terms of detection accuracy and speed.
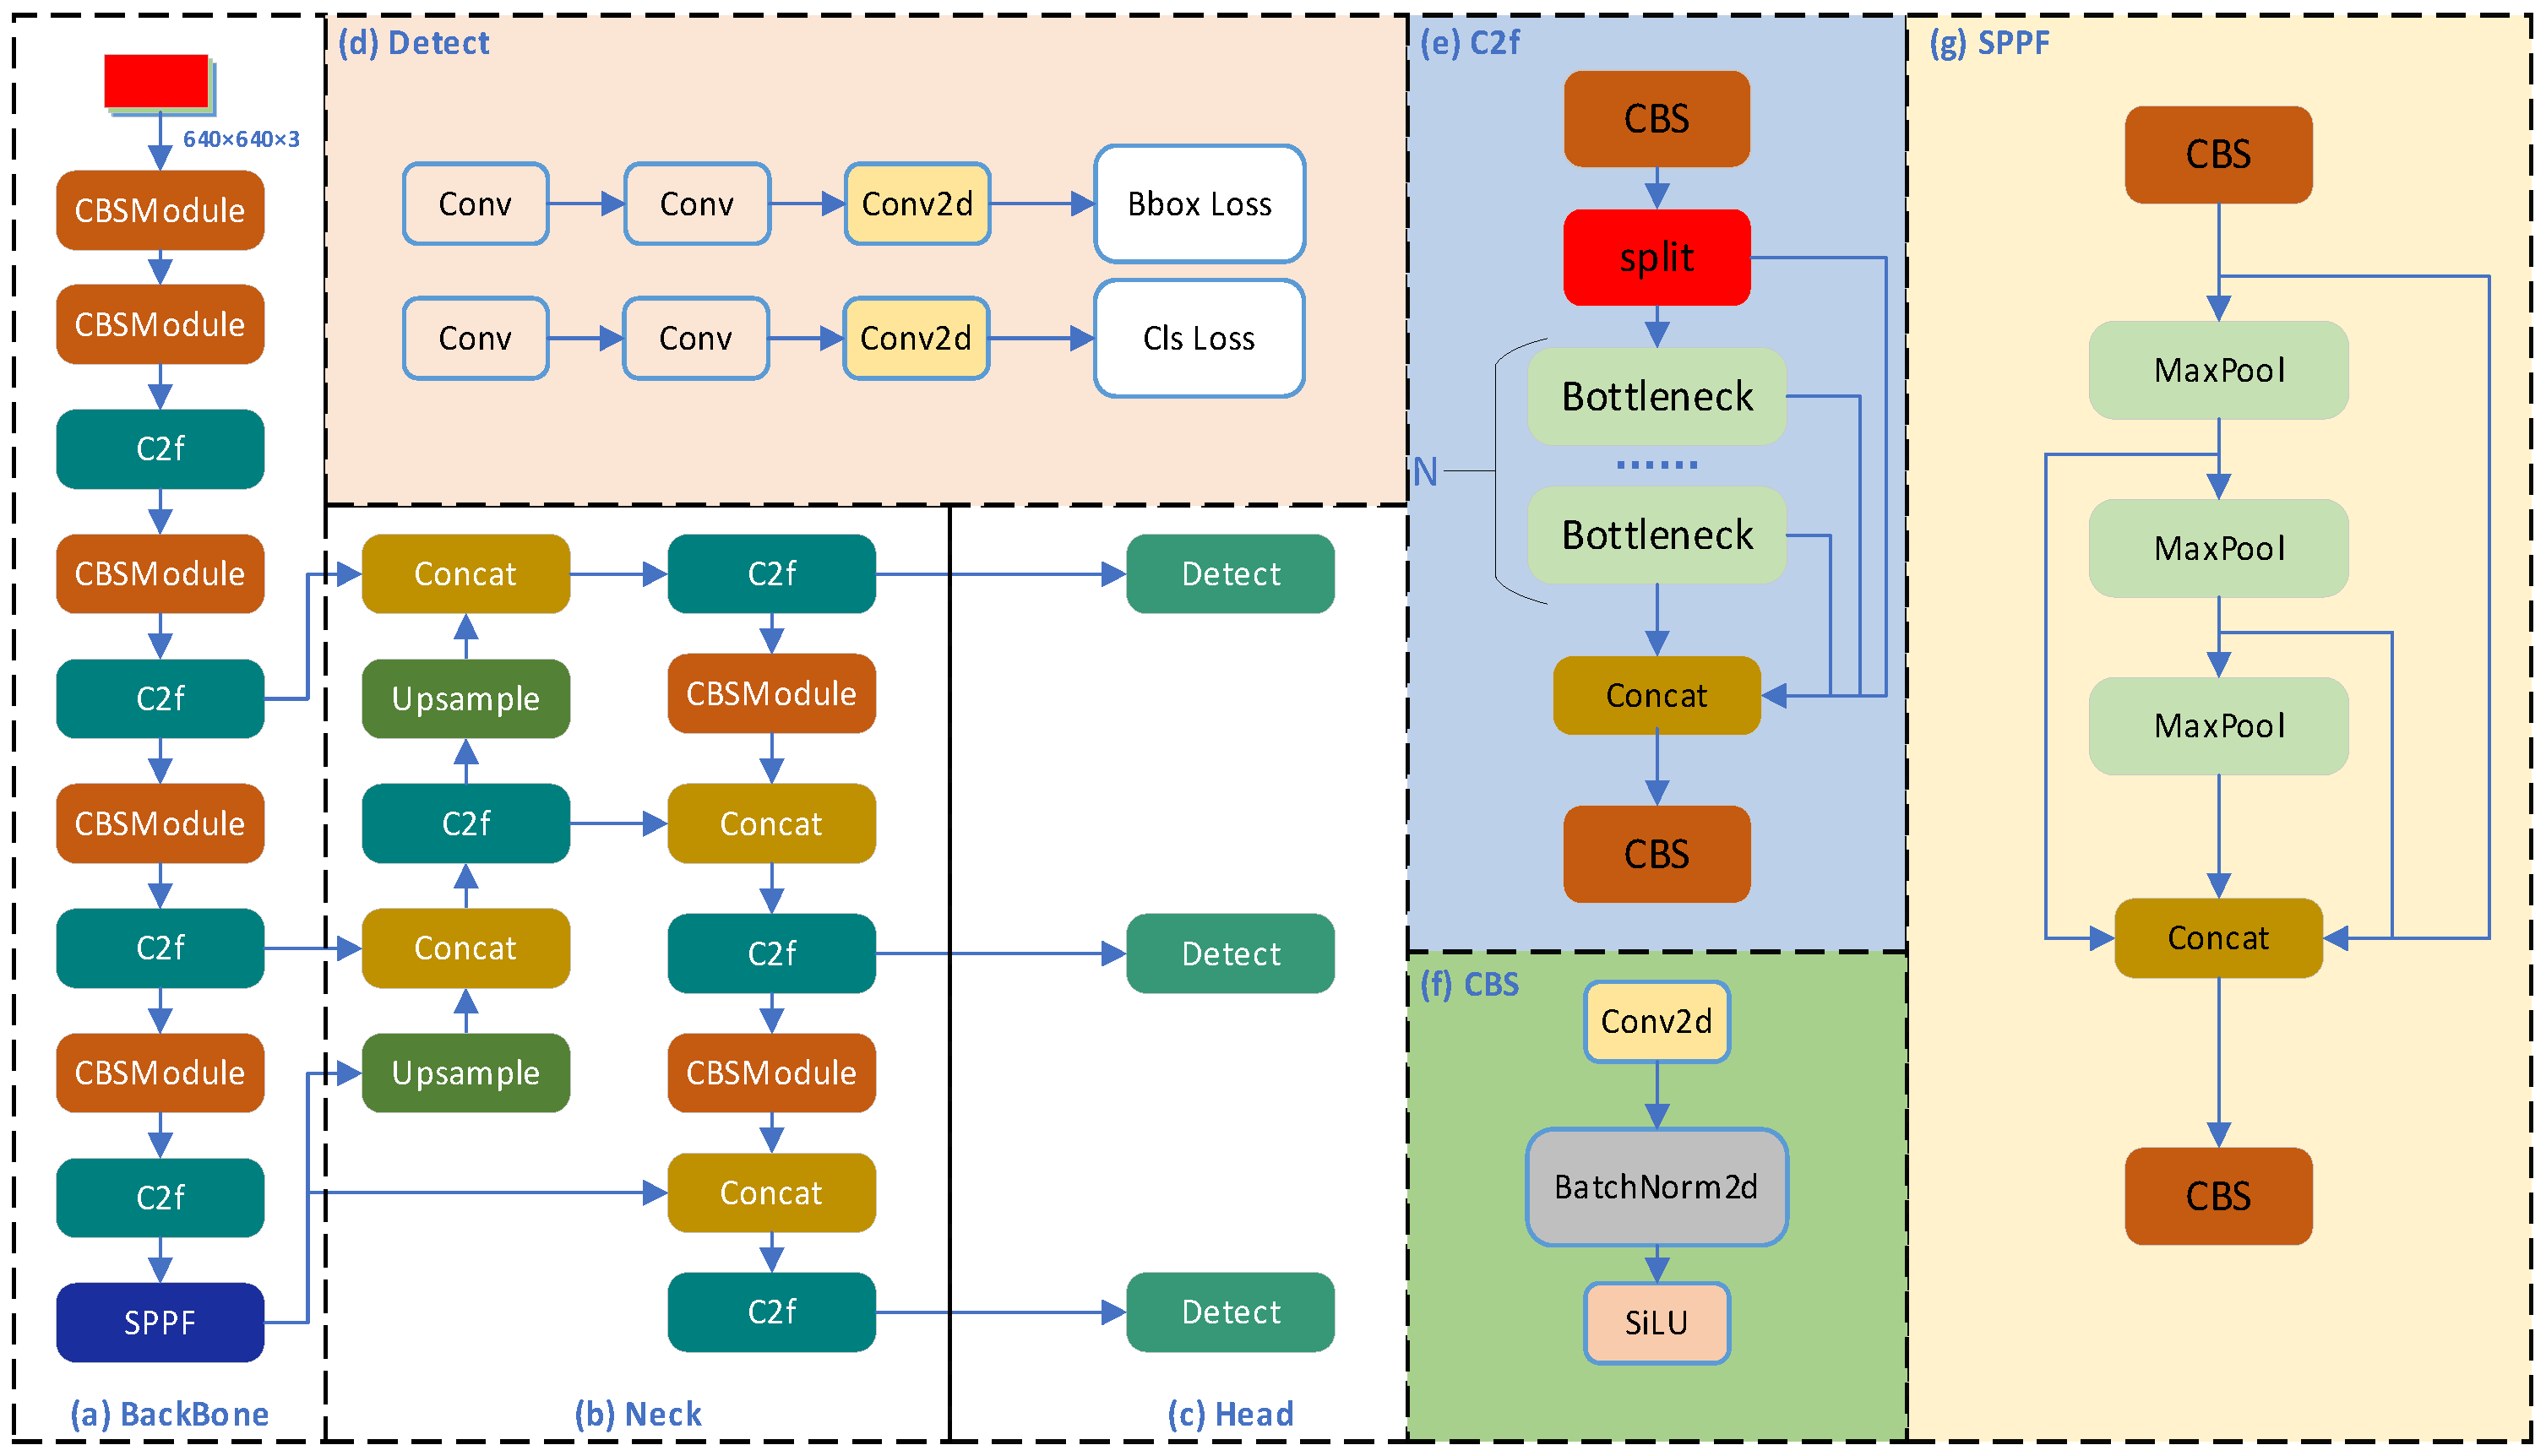
Figure 1 illustrates the network architecture of YOLOv8.
Compared with previous generations of YOLO algorithms, YOLOv8 is more worthwhile for the following reasons:
Backbone achieves a lighter weight and is easy to deploy and run.
Anchor-Free: YOLOv8 abandons the previous Anchor-Base and uses the idea of Anchor-Free, which can detect arbitrarily shaped objects and is more flexible and efficient.
Loss function: YOLOv8 uses VFL Loss as the classification loss and DFL Loss+ CIOU Loss as the classification loss, which improves the detection accuracy.
Sample Matching: YOLOv8 abandons the previous IOU matching or unilateral proportion allocation, and instead uses Task-Aligned Assigner matching to reduce false matching and effectively improve the stability of the model.
2.2. Data Acquisition
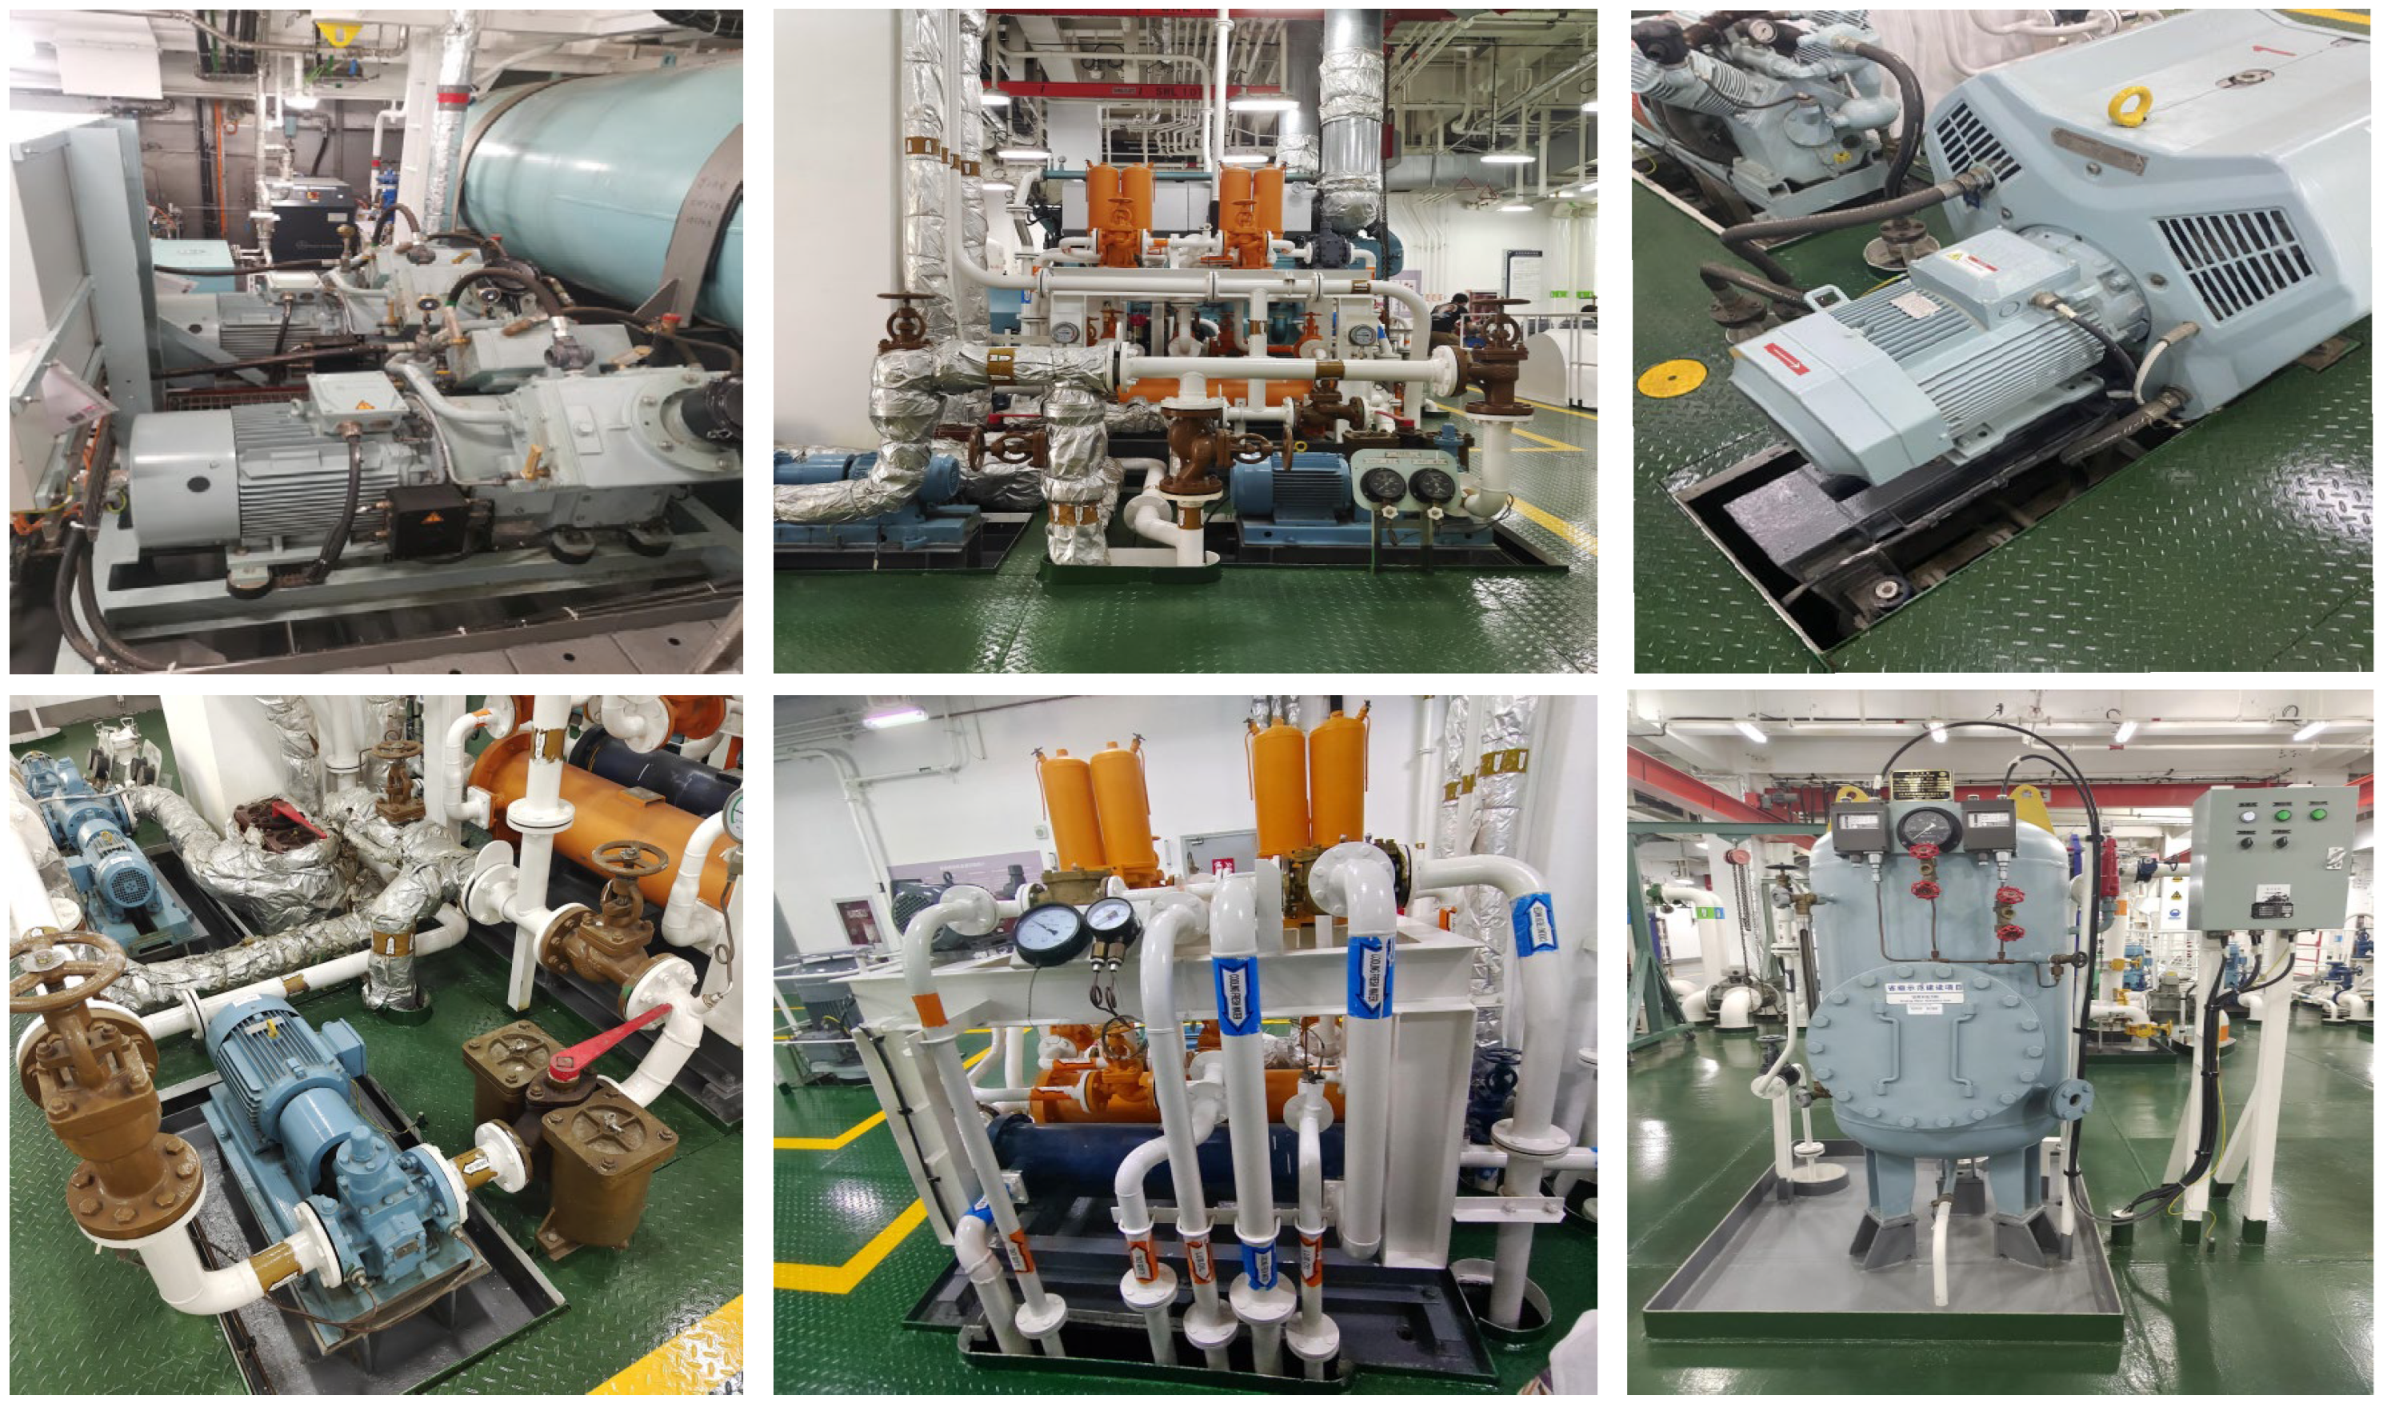
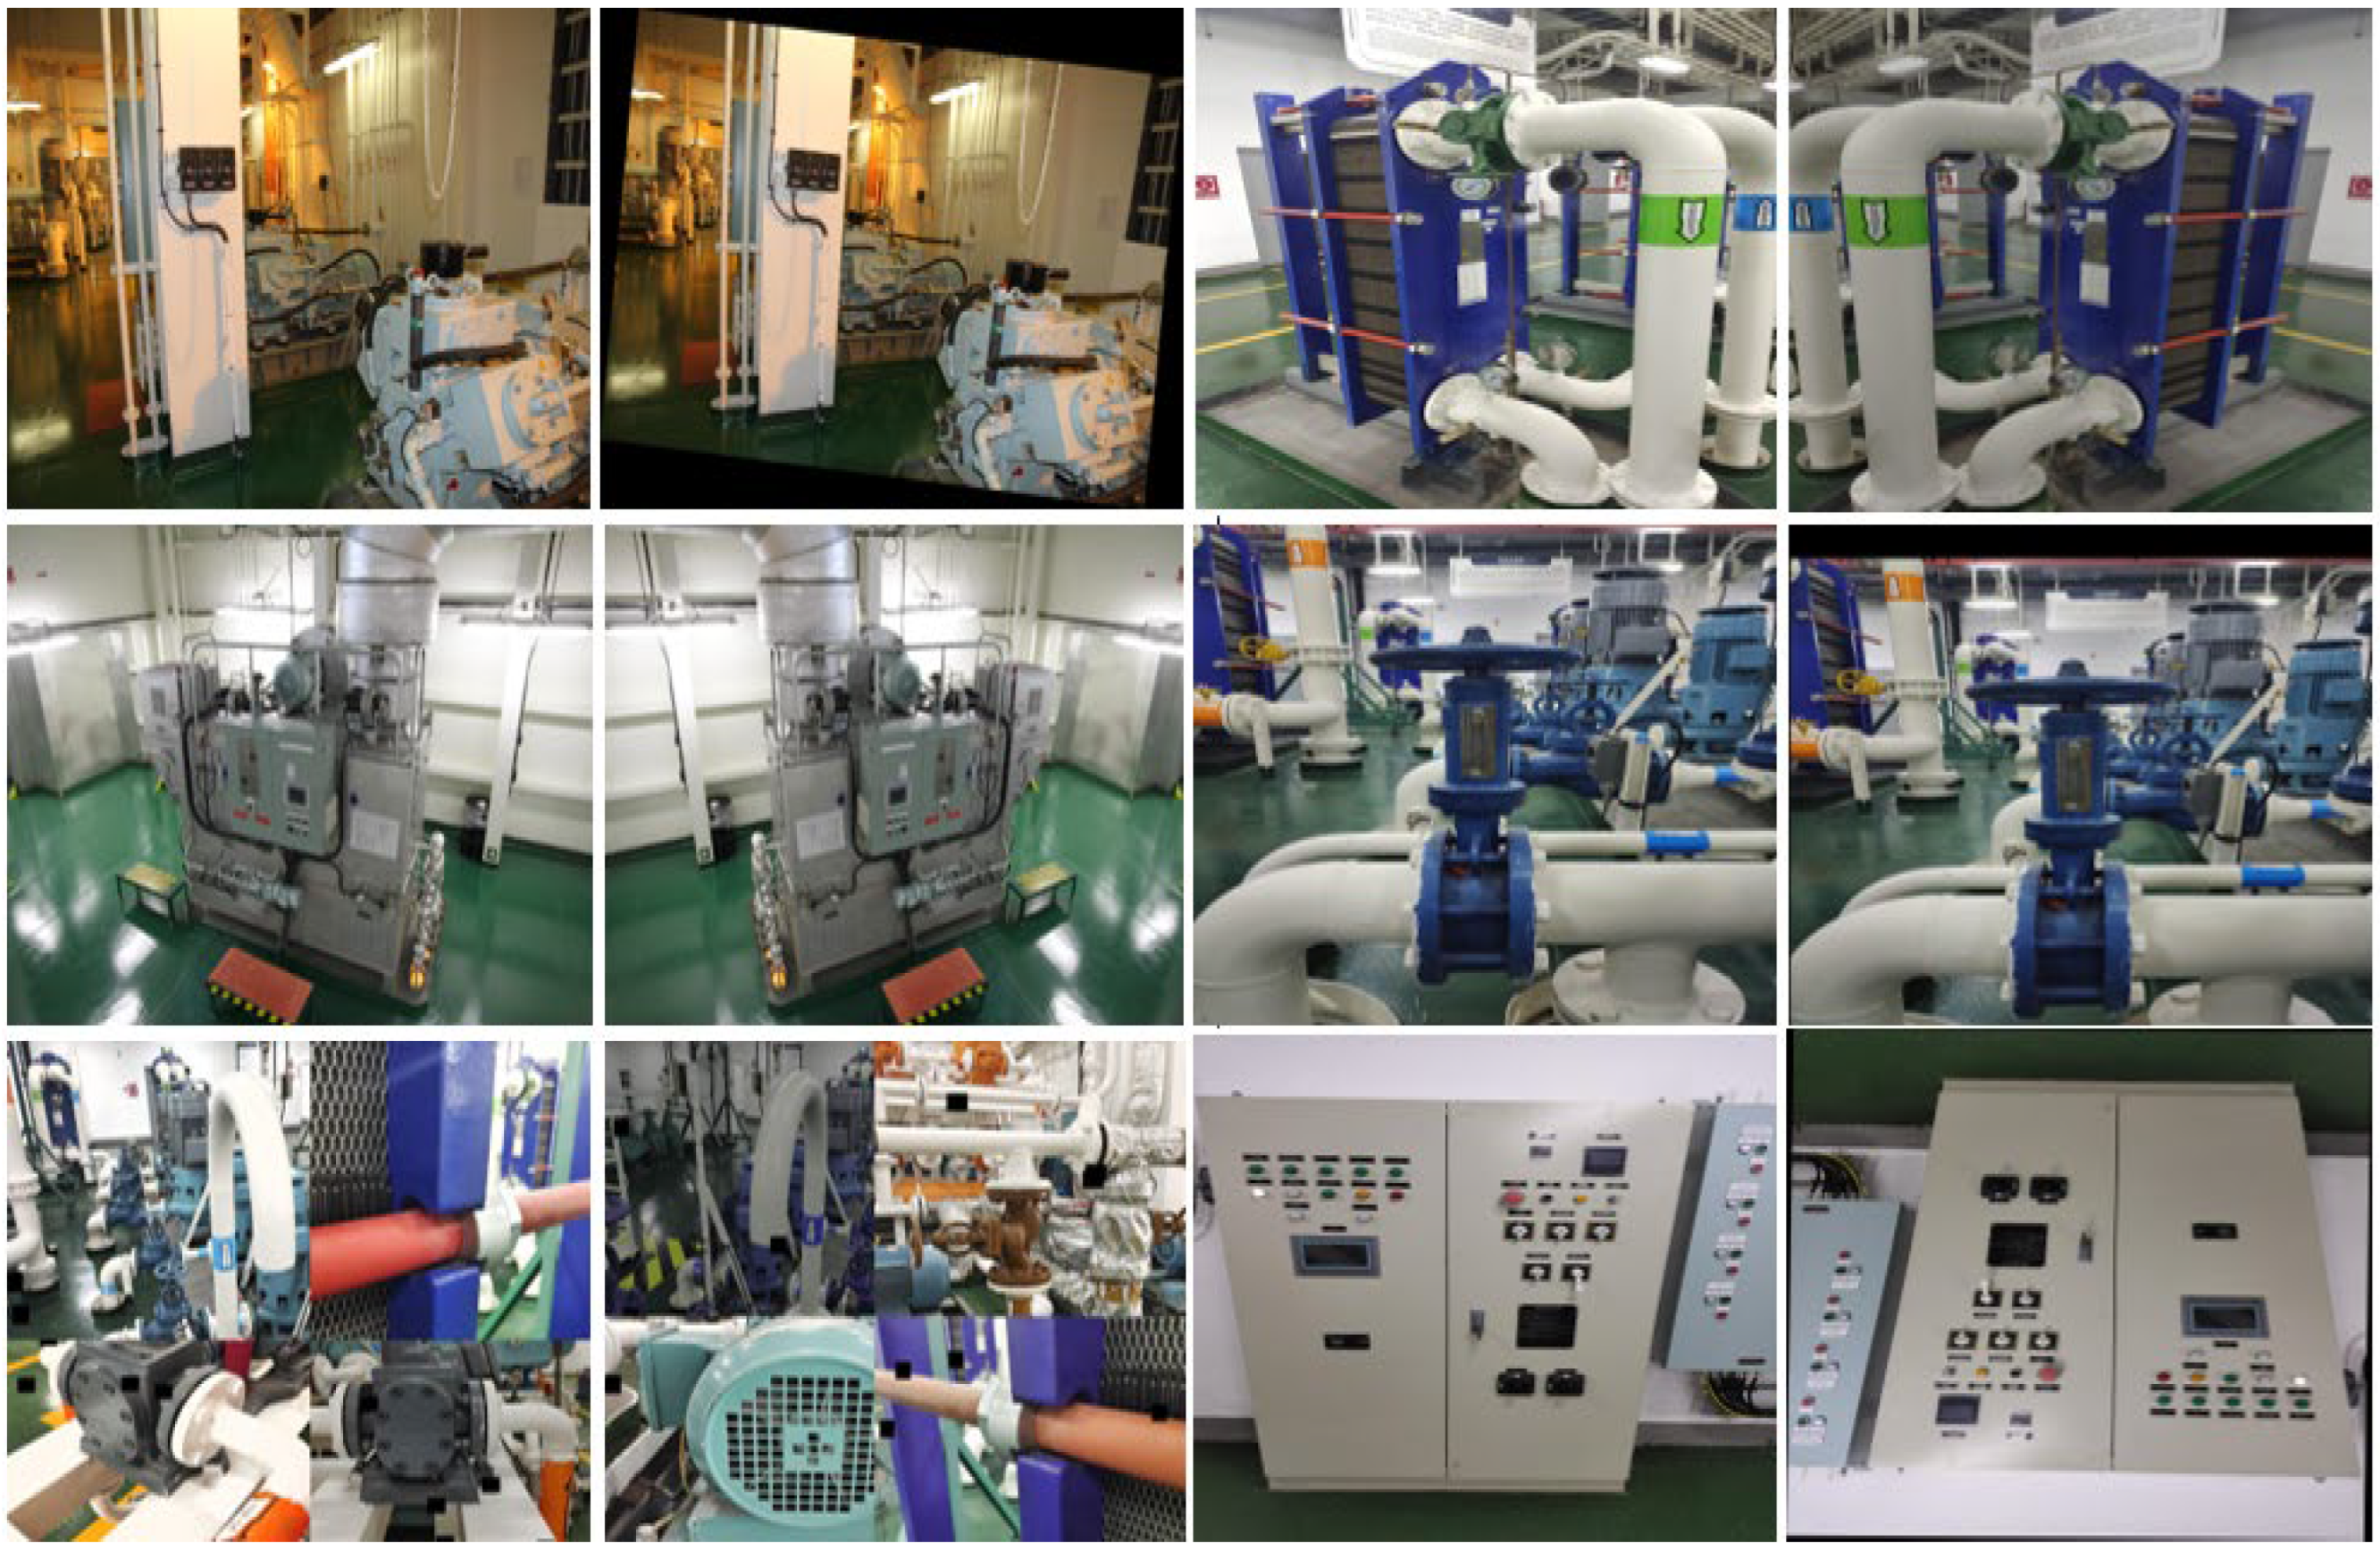
The images within the dataset utilized for object detection models should encompass a comprehensive representation of the primary equipment and scenes within the engine room. In this context, initially, the three-dimensional virtual engine room team at the Laboratory of Marine Engine Automation and Intelligence, Dalian Maritime University, utilized an authentic engine-room scene and equipment image resources captured on real ships. From the collection of tens of thousands of photographs, typical images that align with the demands of real-world scenarios (a total of 1032 photos) were initially screened. During the screening process, typical photographs showcasing a compact layout of equipment and dense distribution of pipelines within the engine-room scene were prioritized. Additionally, common scenarios like overlapping and occlusion among different devices, unobstructed individual devices, substantial variations in external dimensions between devices, and the discrete arrangement of multiple devices were selected. Up to this point, after careful screening, the original image-sorting work, which comprehensively covers a variety of actual scenarios, has been basically completed. The dataset consists of a total of eight types of equipment, namely valve, meter, pump, reservoir, cooler, button, compressor, and marine incinerator, characterized by dense arrangement and intricate scenes. As depicted in
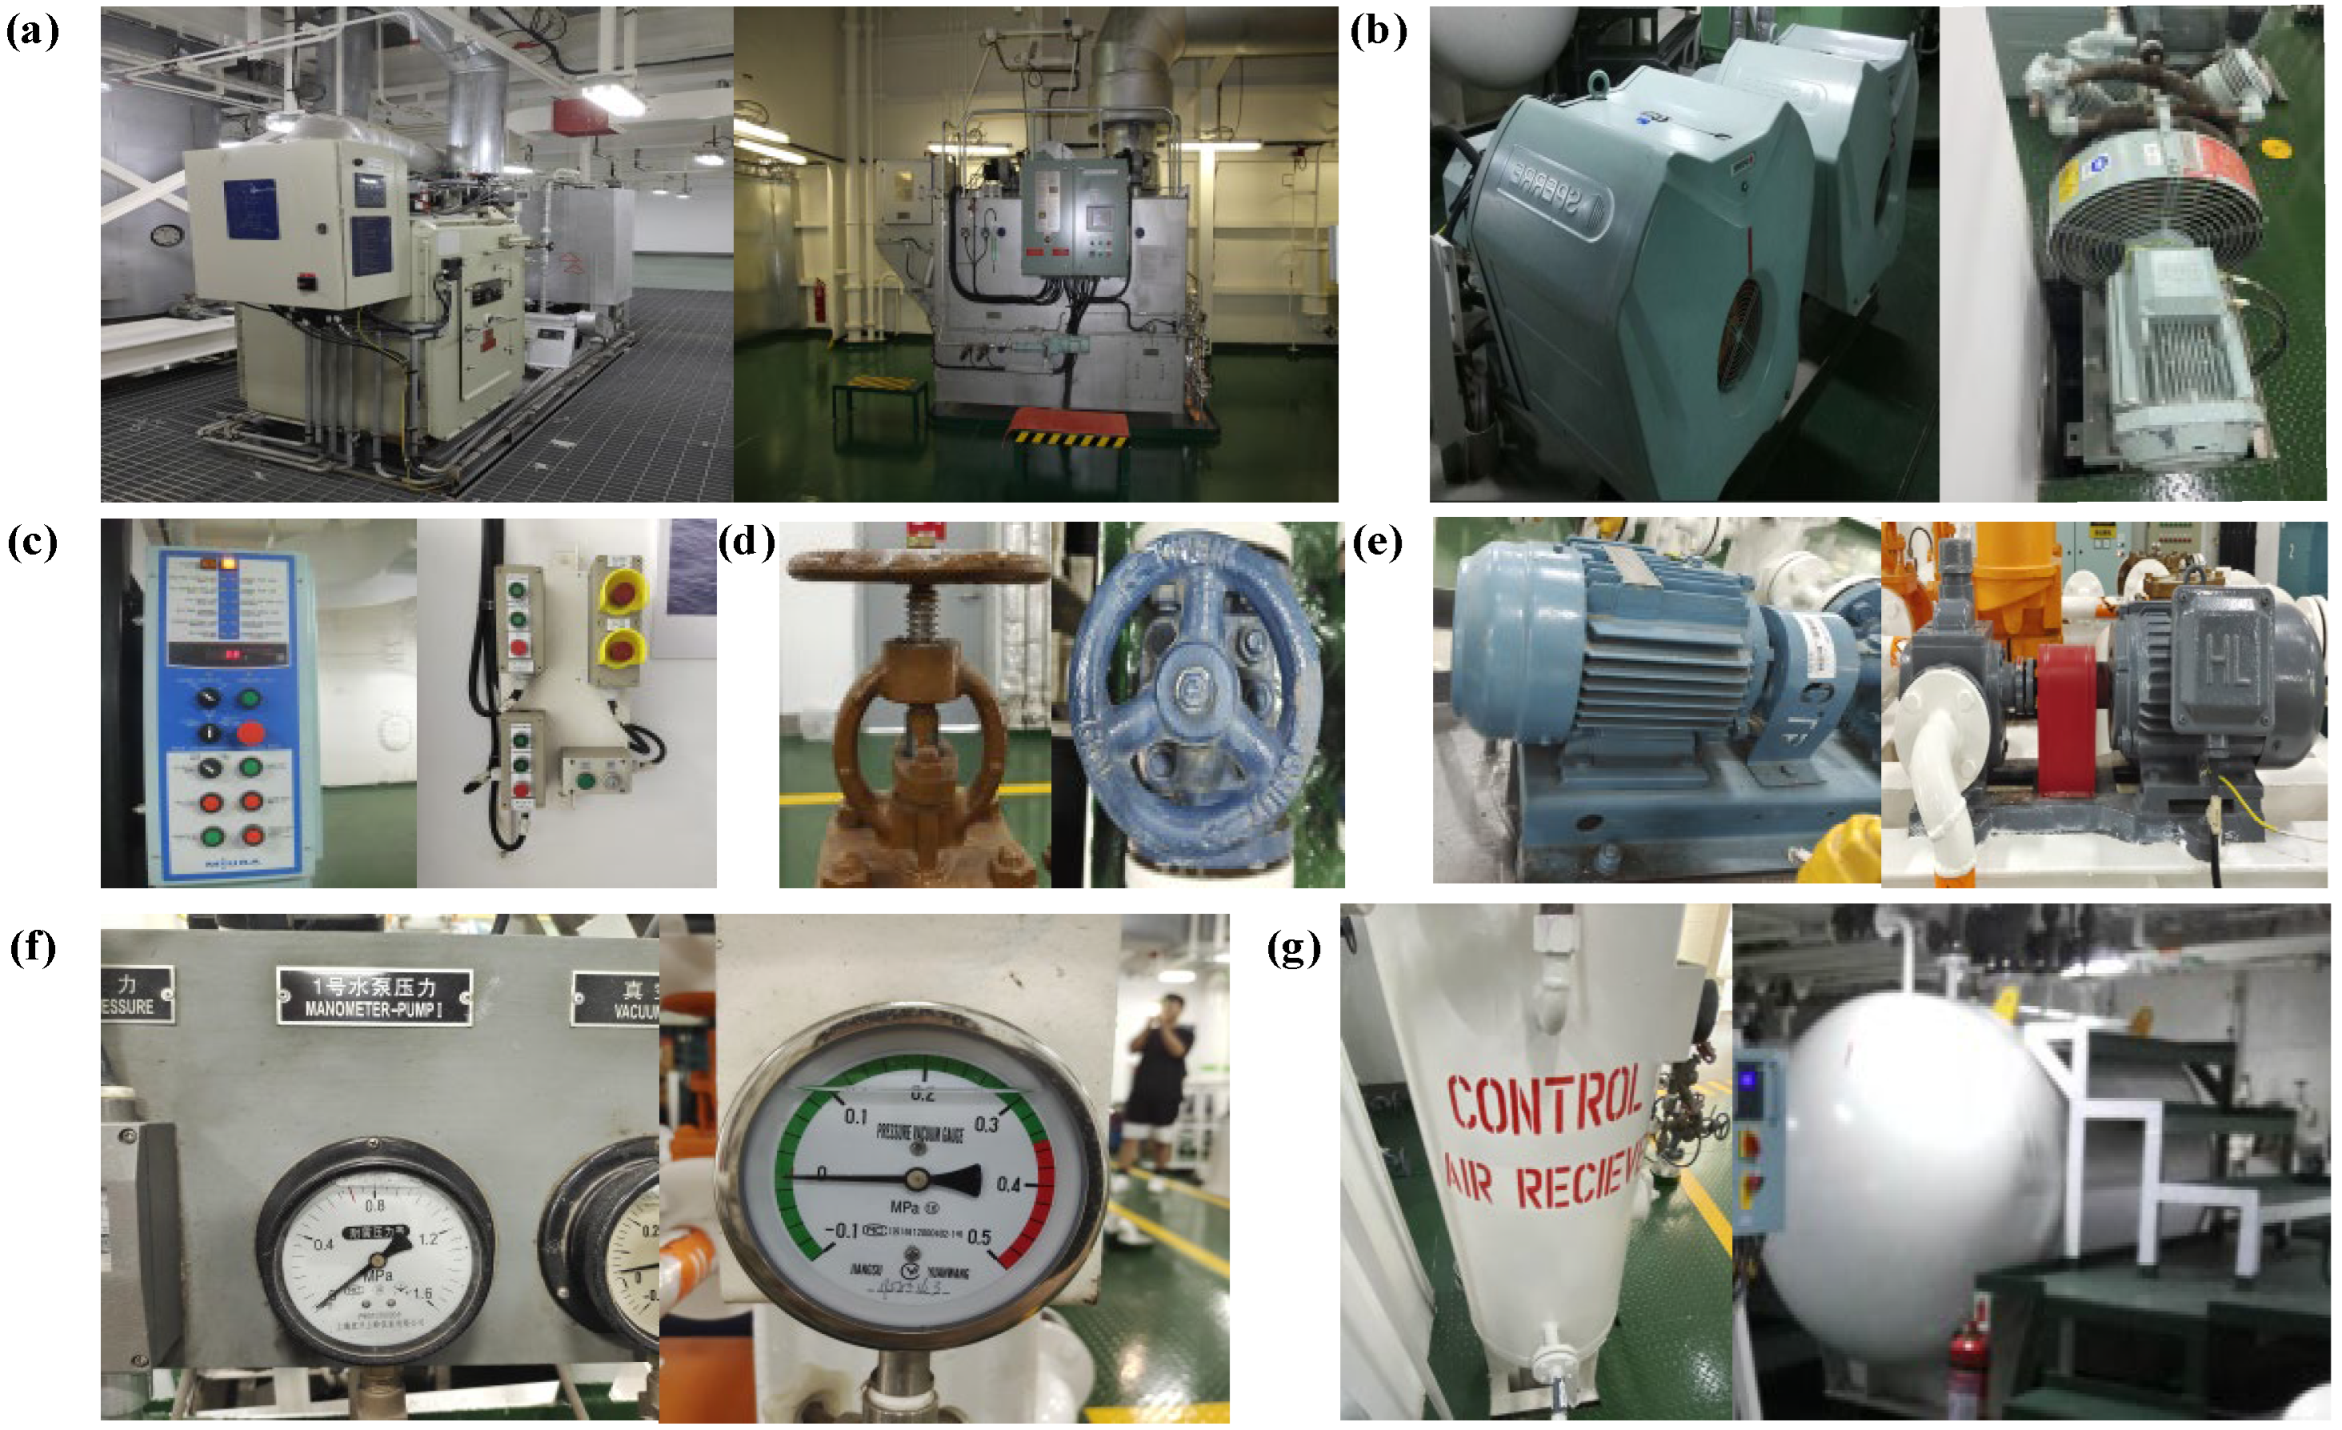
Figure 2, the dataset exhibits a significant number of occlusions. Furthermore, within the same equipment category, there are discrepancies in appearance, as indicated in
Figure 3.
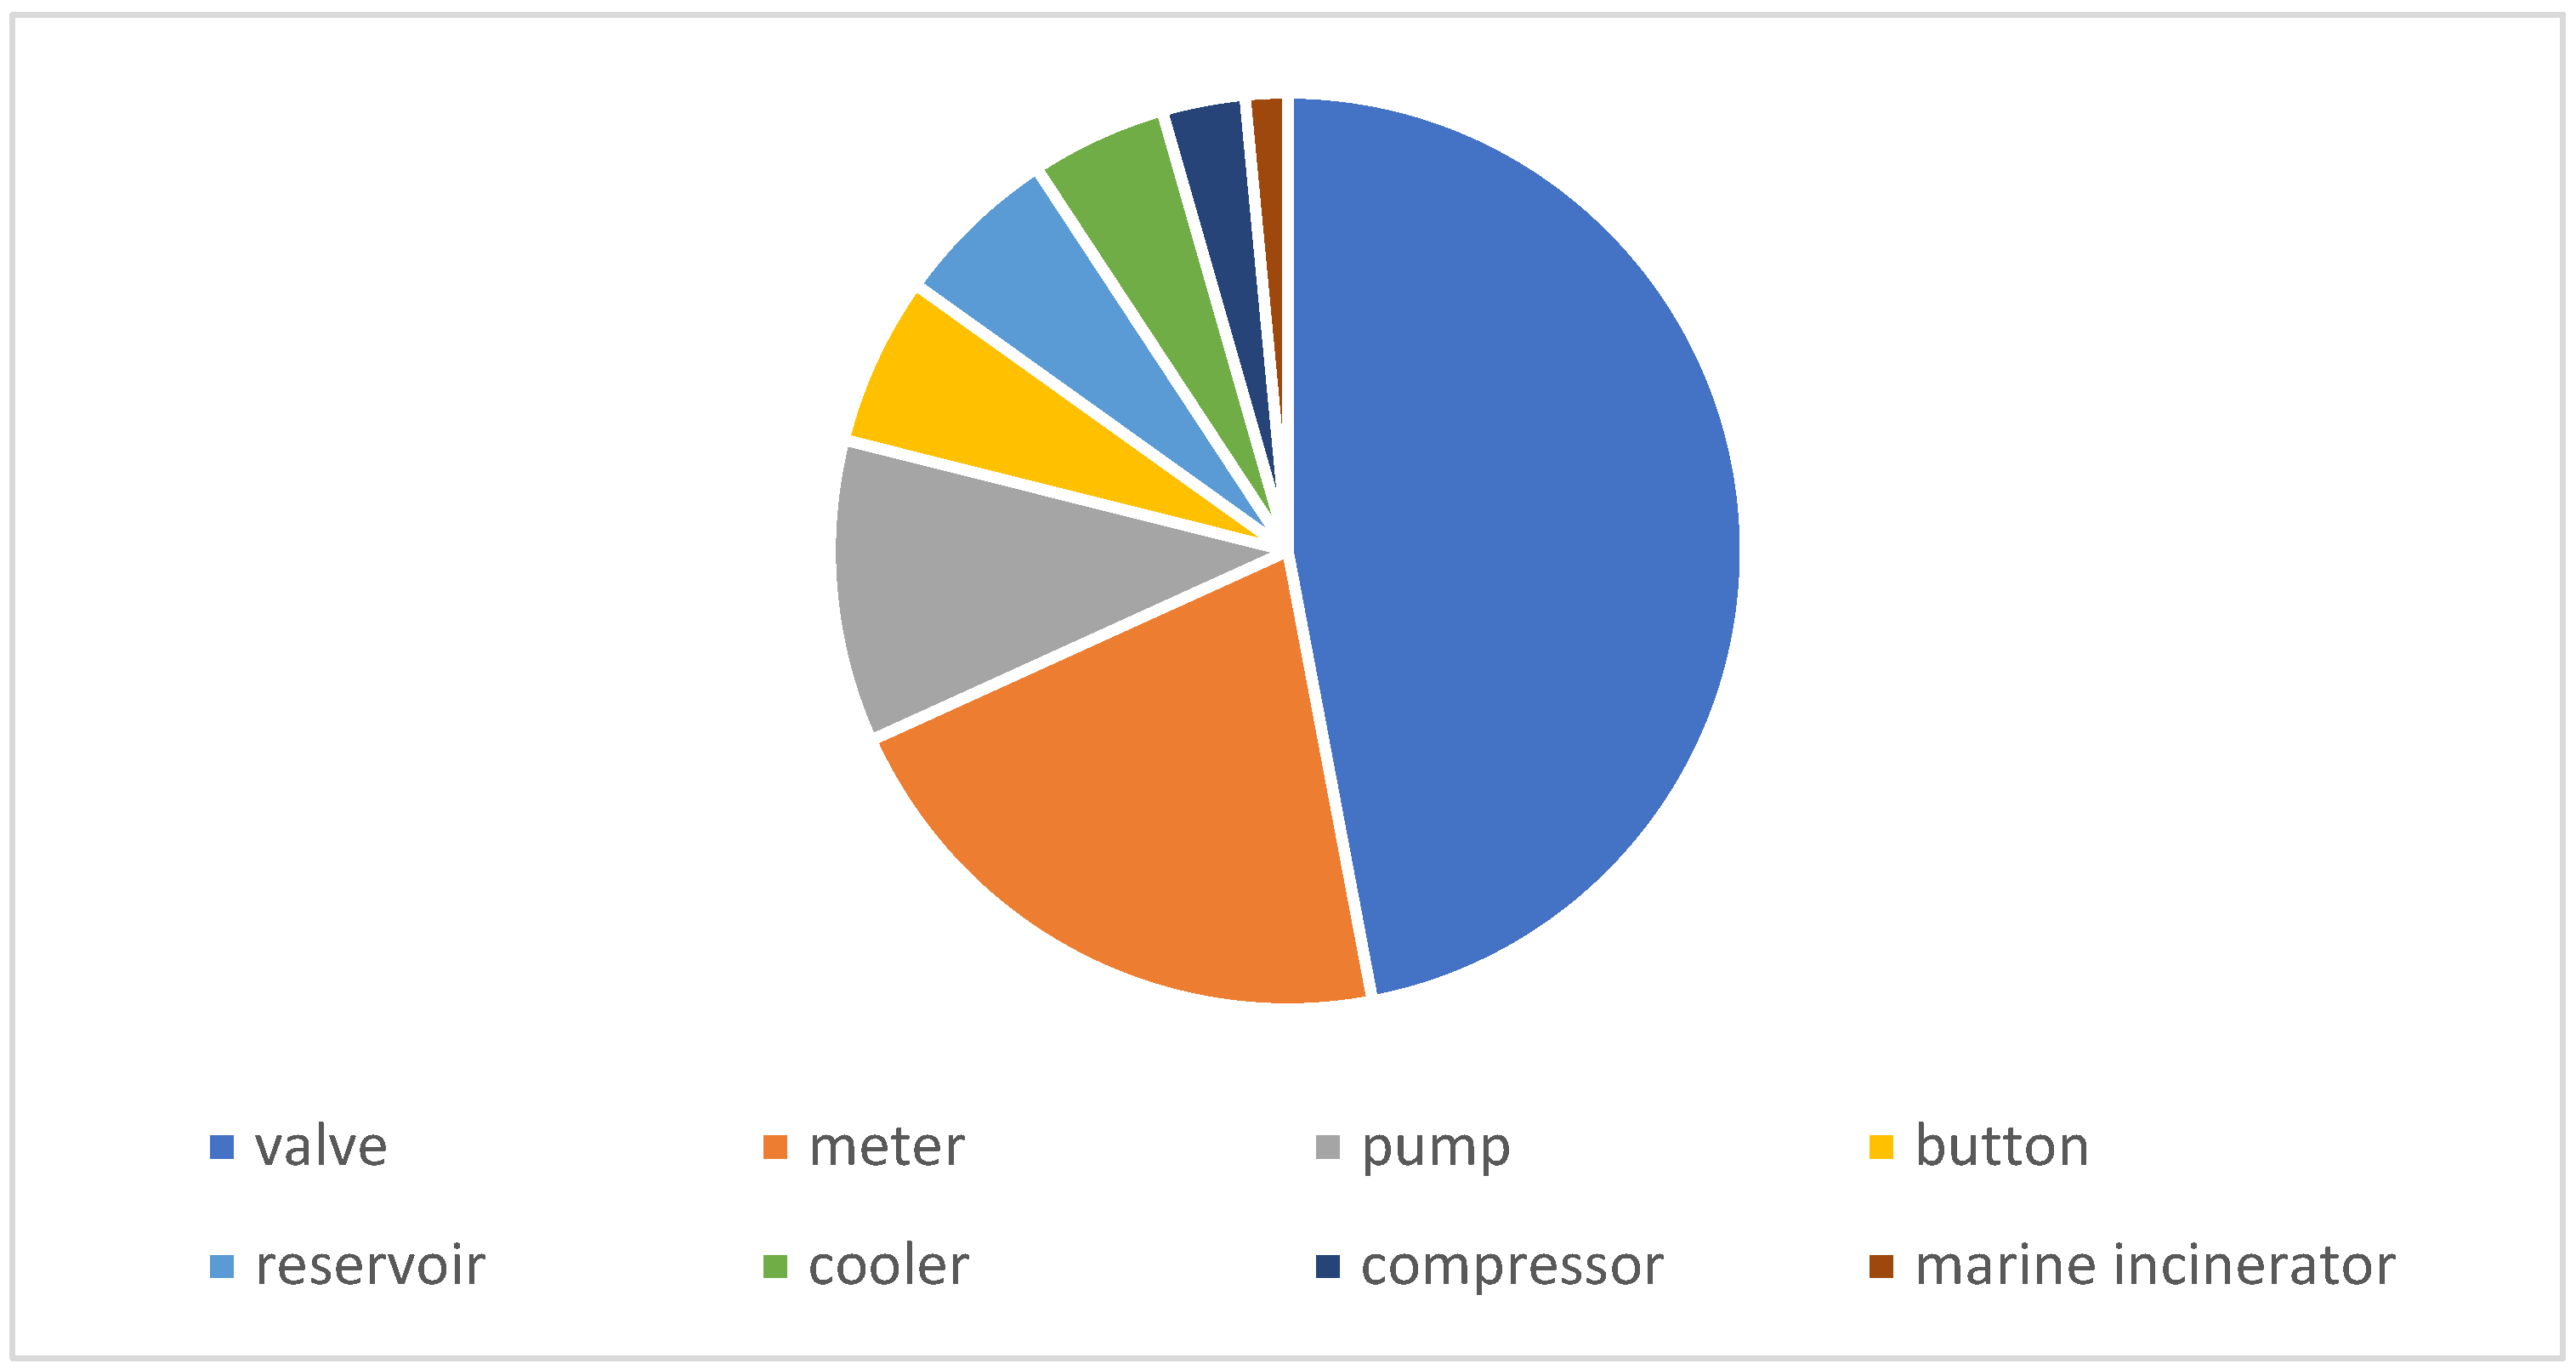
These raw images were taken using a Nikon D7100 with 24 million pixels and a Canon EOS 7D digital camera with 18 million pixels; the output horizontal and vertical resolution of the camera was 300 dpi, the resolution of the photo was uniformly 3024 × 4032, and the ratios of the eight categories of equipment are shown in
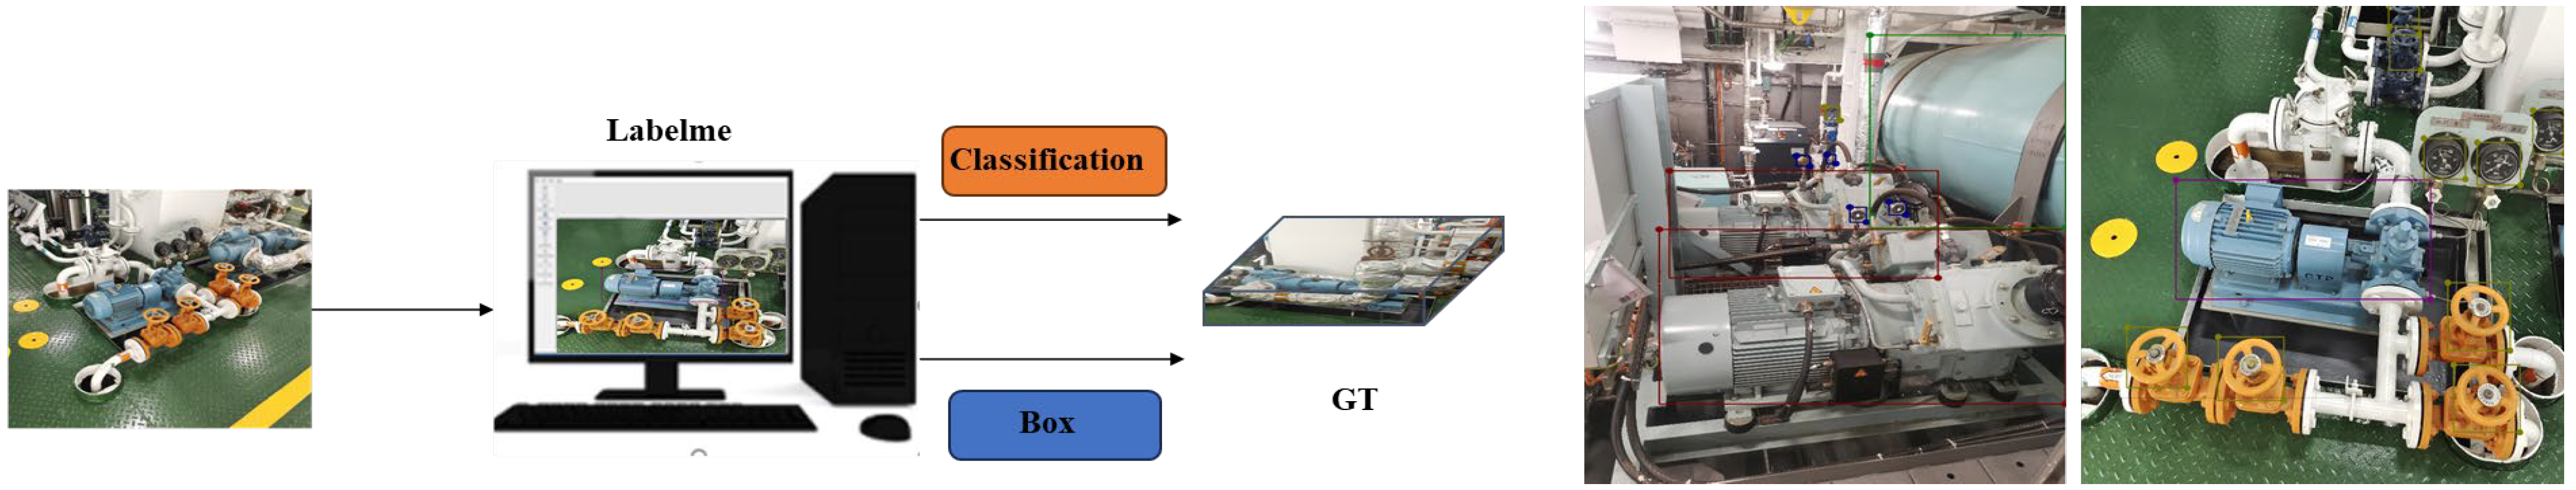
Figure 4, below. Some categories, such as the number of marine incinerators and compressors are extremely small, and the valves and meters outnumber them by more than 10-fold. There is an imbalance in the data. Some examples of labelled ground-truth images and the process of collecting images to obtain labels are shown in
Figure 5. The numbers for each category are: ’valve’: 2134, ‘meter’: 961, ‘pump’: 485, ‘button’: 271, ‘reservoir’: 266, ‘cooler’: 219, ‘compressor’: 133, ‘marine incinerator’: 68.
3. Methodology
3.1. Data Augmentation
Data augmentation is a key machine-learning technique that aims to expand training datasets by generating new data points based on existing samples. The goal is to ensure that the augmented training data closely resembles the real data distribution, leading to improved detection accuracy. Moreover, data augmentation encourages the model to learn more robust features, ultimately enhancing its ability to generalize effectively. However, the abundance of data enhancement methods also brings challenges, and the selection of appropriate data enhancement methods requires consideration. In this regard, this study adopts the method of analyzing the visualization test results of the original dataset, selects appropriate data enhancement methods for the classification, and implements the following steps: (1) Obtaining the visualization test results of the original dataset. (2) Counting the types of omissions and misdetections of each category in the dataset. (3) Analyzing the reasons for the occurrence of misdetections and omissions, and selecting the appropriate data enhancement methods.
Based on the bad case analysis, specific data augmentation methods were determined for each category, as detailed in
Table 1: rotation and mirroring augmentation for meter and reservoir; mosaic augmentation for pump with additional random transformations; rotation and mirroring for button; rotation (within 30 degrees) and occlusion for compressor; horizontal mirroring for marine incinerator, and random augmentation for the remaining classes. This method effectively addressed some of the data imbalance issues. After augmentation, the numbers of valve and meter remained relatively high, ranking first and second, while other categories were almost balanced.
The data before and after augmentation are compared, as shown in
Figure 6 below; after augmentation, the number of valves and meters is still larger, ranking first and second, and the other classes are almost balanced.
3.2. Proposed Structural Improvements
In order to adapt to the complex scenario in which the ship’s cabin equipment is located, we improved the YOLOv8-M model to improve the detection accuracy without significantly increasing the number of parameters, and its network structure is shown in
Figure 7 below.
3.2.1. Improved Neck
The SPP module was proposed by Kaiming He [
16] in 2015 (as shown in
Figure 8) to address two main issues:
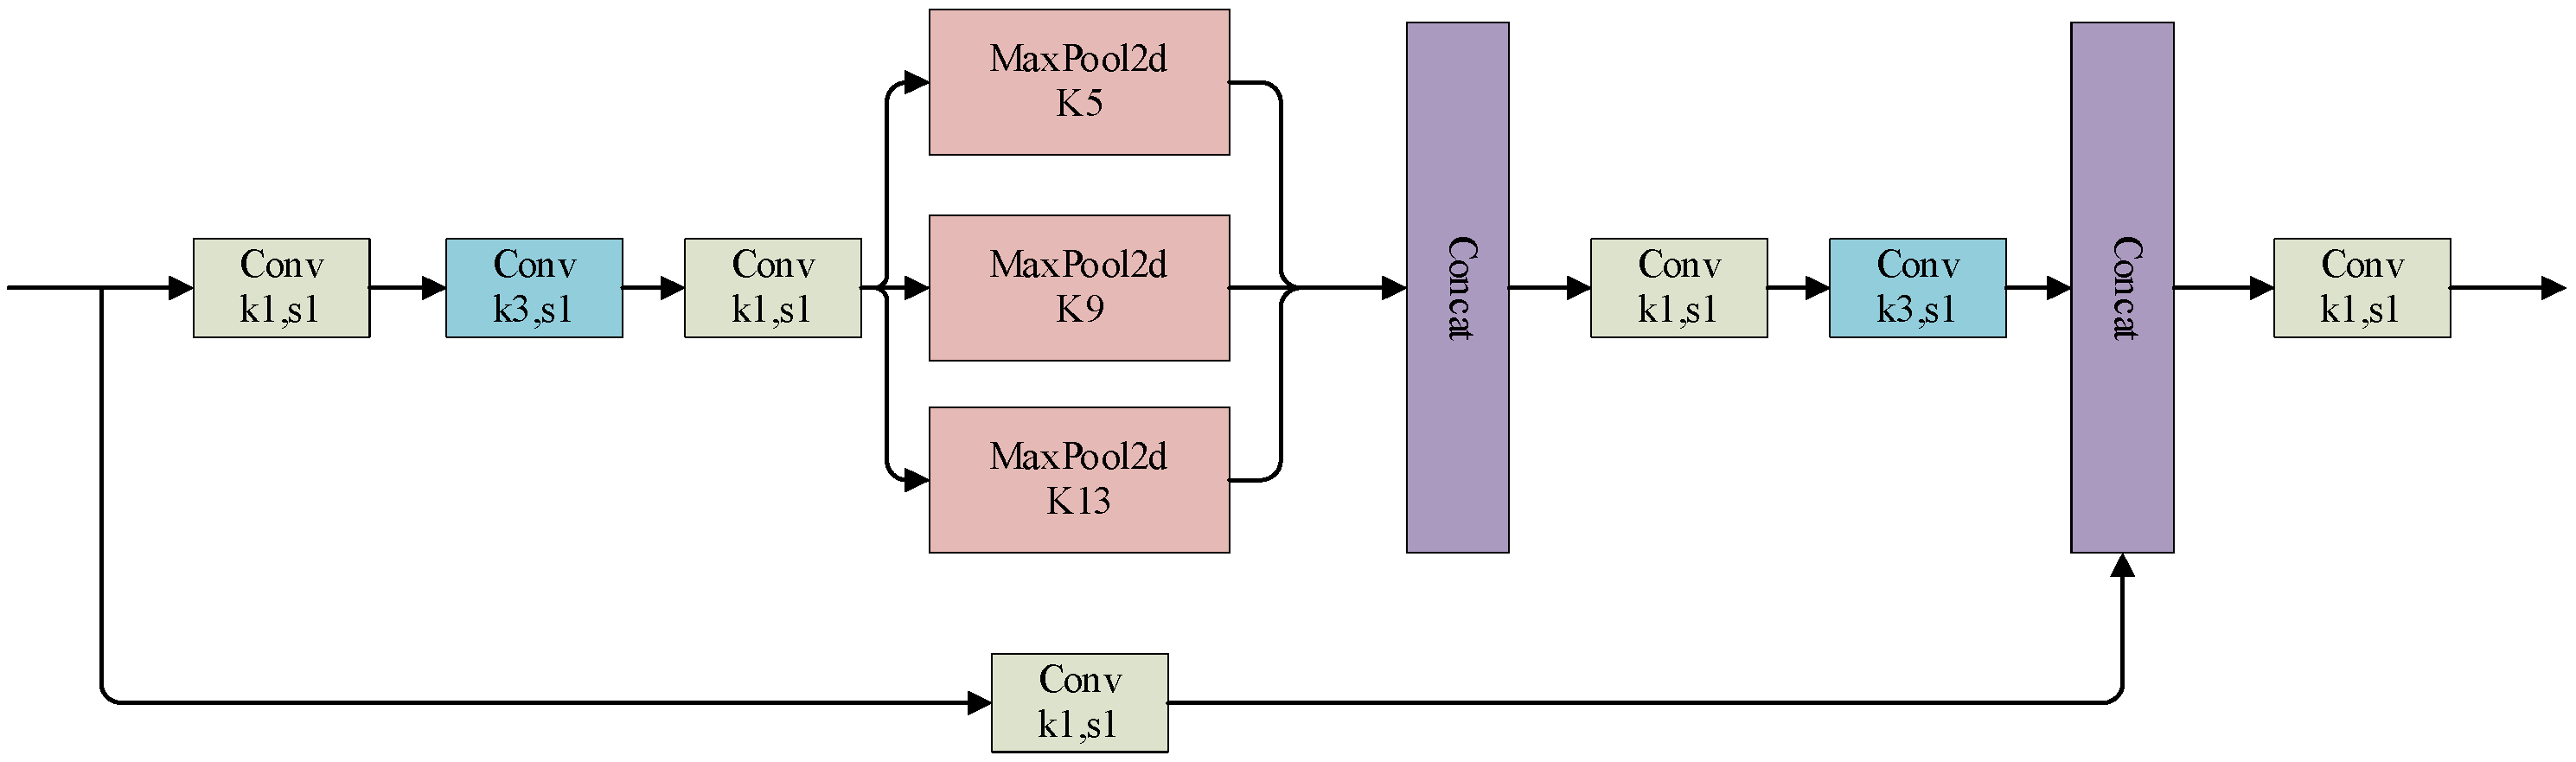
Different Maxpool layers bring different sensory fields to the network, which are used to distinguish and process objects of different sizes. The SPPF module proposed in YOLOv5 builds on this foundation and speeds up training by designing tandem-type Maxpool layers. YOLOv7 further optimizes SPPF based on SPPF by dividing the backbone-extracted features into two parts, one of which was processed by SPP, and the other part was processed by conventional convolution to obtain the SPPCSPC structure (as shown in
Figure 9), which performs better than SPPF; however, the computational and parametric quantities are increased a lot.
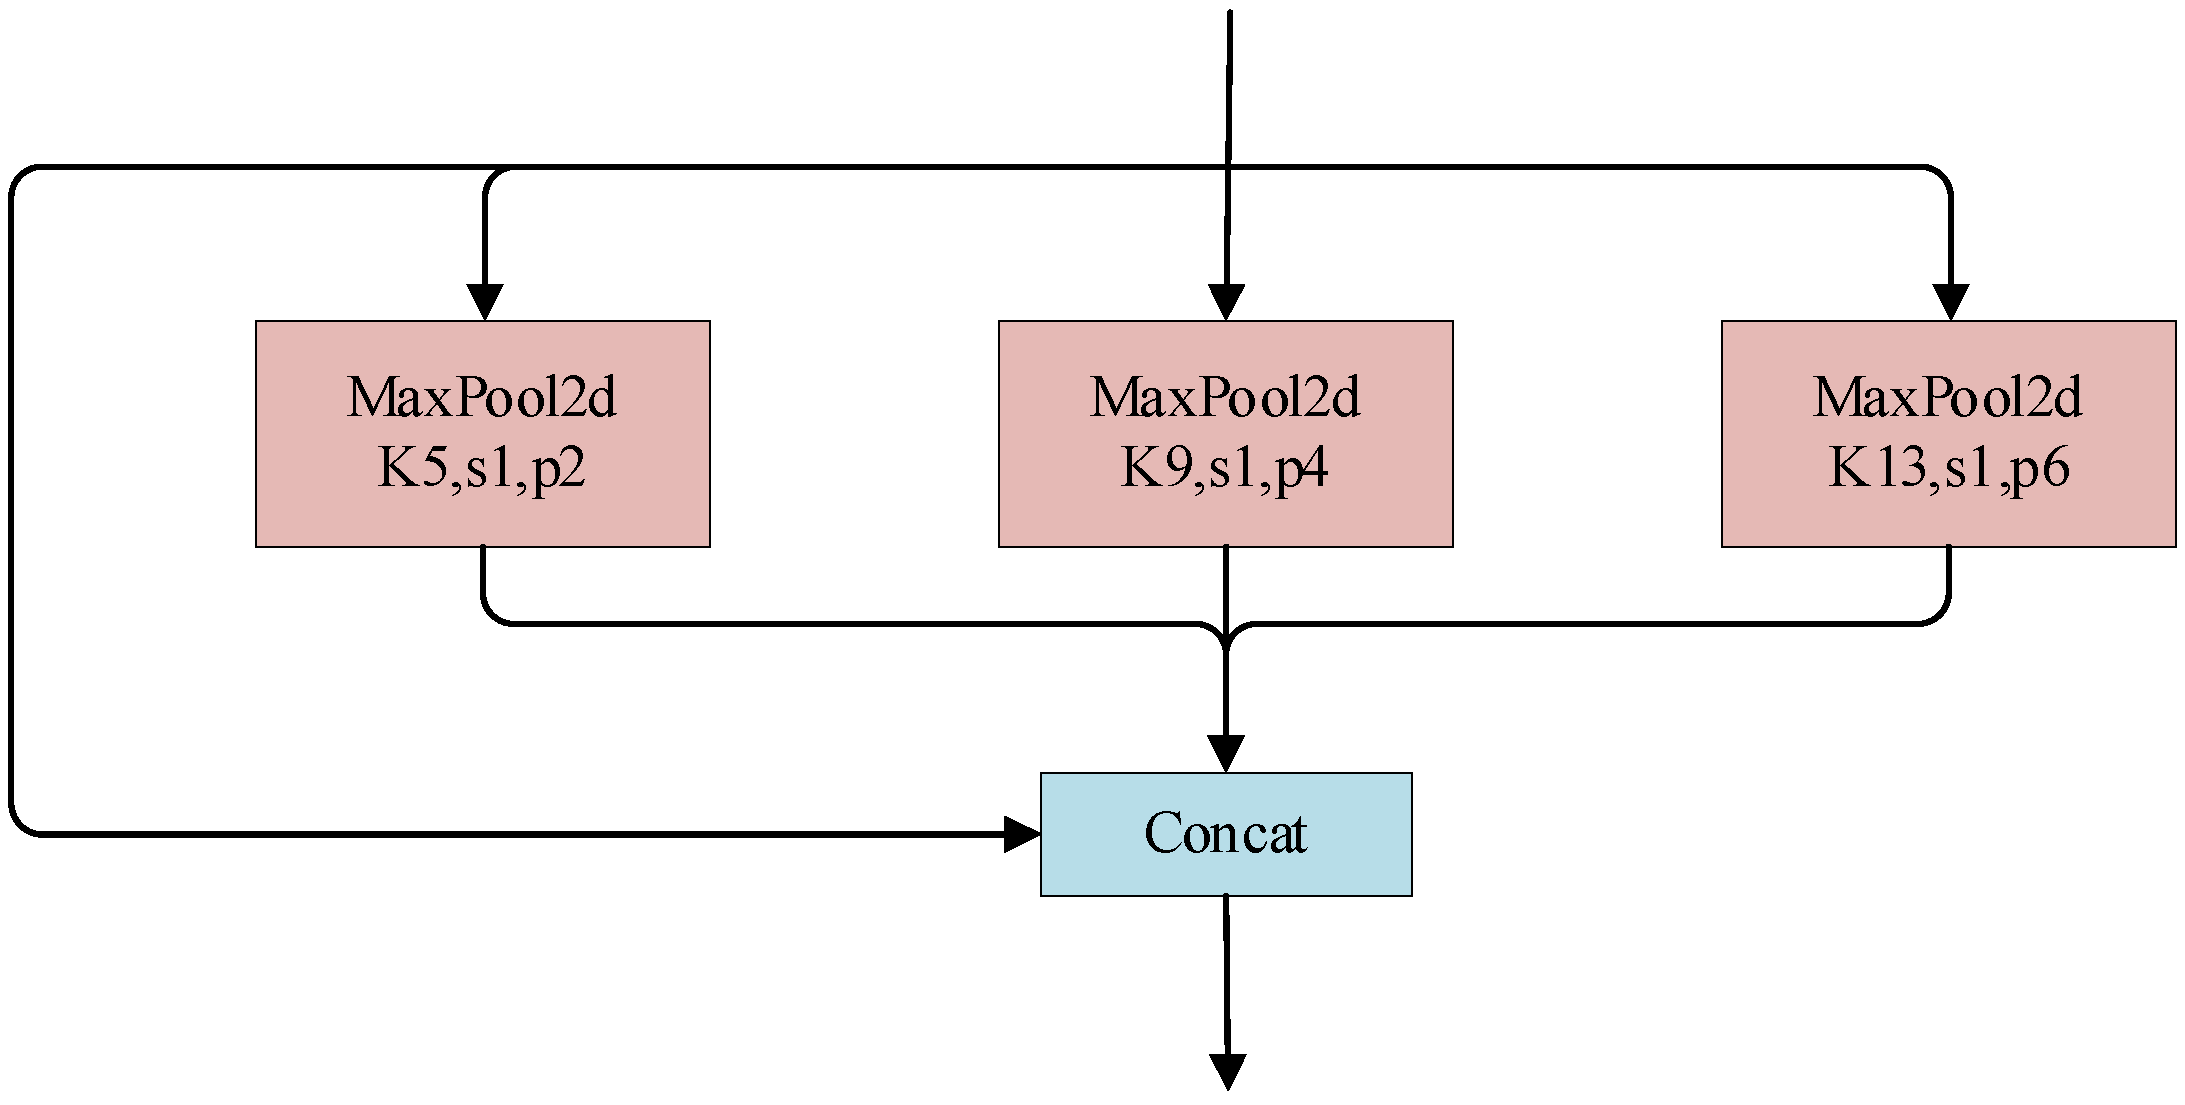
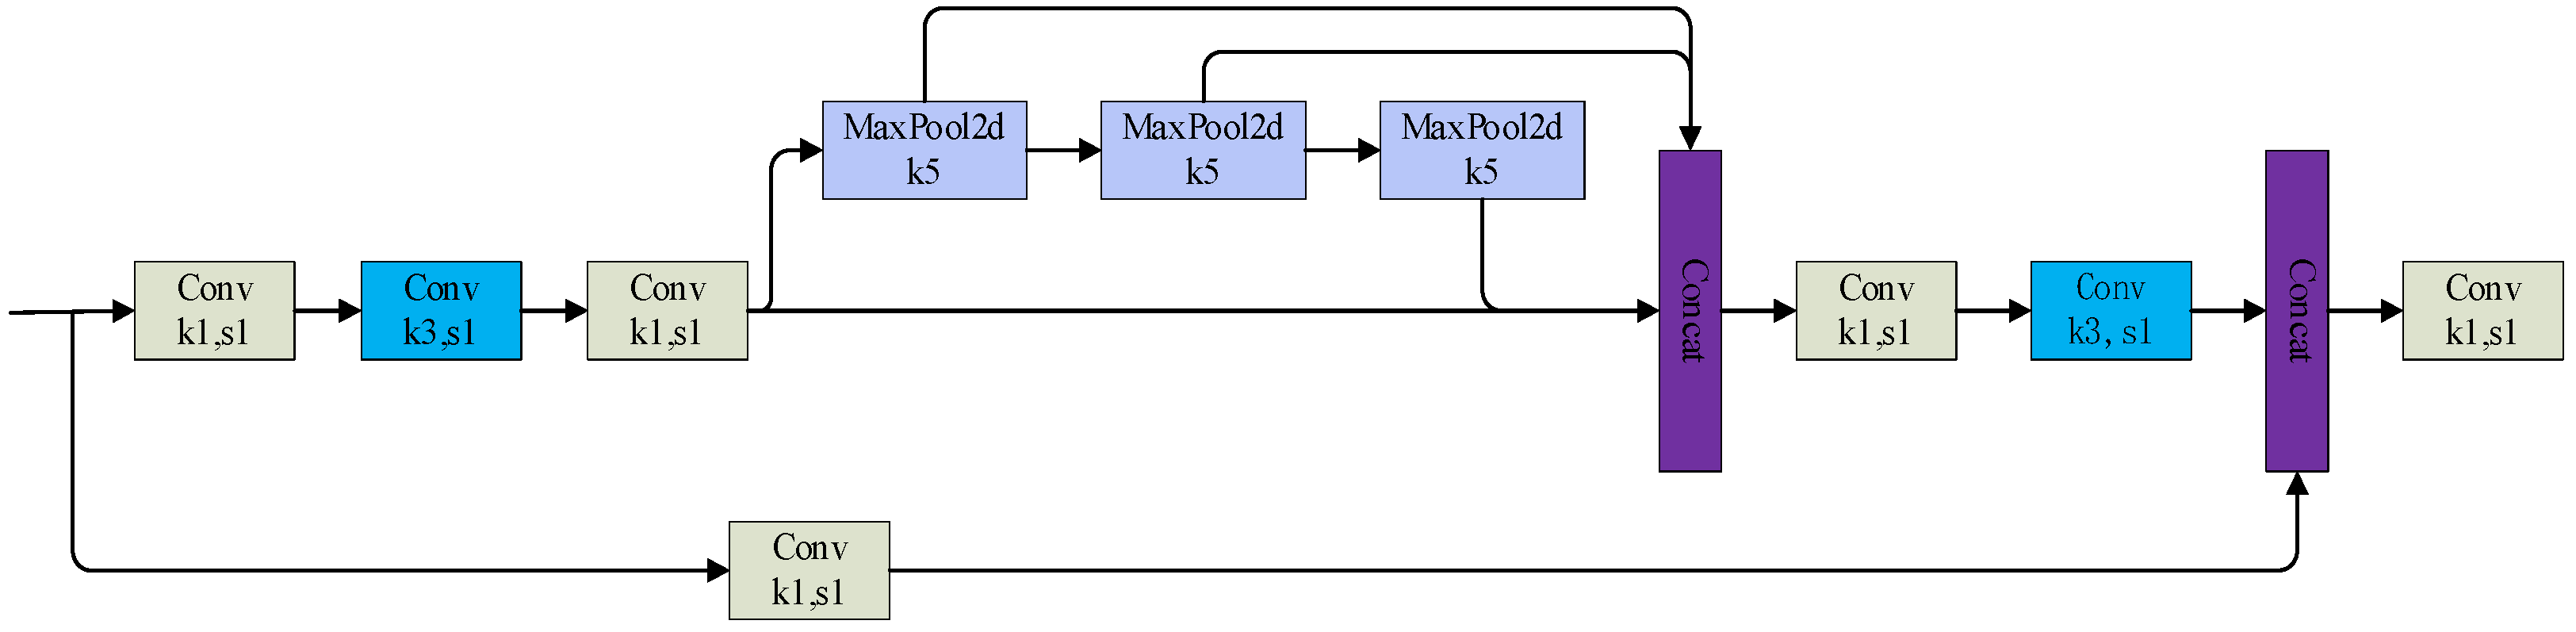
For visual detection methods applied to ship cabins, it is important to optimize the detection speed while simultaneously ensuring the detection accuracy. The SPPFCSPC module combines the ideas of both the SPPF in the original model and the SPPCSPC proposed in YOLOv7, and the speed is improved while keeping the sensory field unchanged, and at the same time the accuracy is improved compared with that of the SPPF. Its network structure is shown in
Figure 10 below.
3.2.2. Improved Neck
The importance of the neck network, which fuses features extracted from the backbone network to enable the head to detect objects at different scales depending on the resolution, has been discussed in other works [
17,
18,
19,
20]. The Feature Pyramid Network (FPN) [
17] has been shown to be an effective method for fusing multi-scale features; however, the top-down and bottom-up structures rely on the aggregation of features from neighboring layers, as shown in
Figure 11b, with less attention paid to the exchange of information in the non-neighboring layers. GFPN [
18] improves FPN by a novel swarm fusion; as shown in
Figure 11c, its feature extraction part further fuses the semantic information across neighboring layers, so that the network learns more adequately about the object and is able to fully exchange high-level semantic information and low-level spatial information. In this study, guided by this idea, the cross-neighborhood layer information is further fused to design the GCFPN structure, as shown in
Figure 11d.
3.2.3. Improved Head
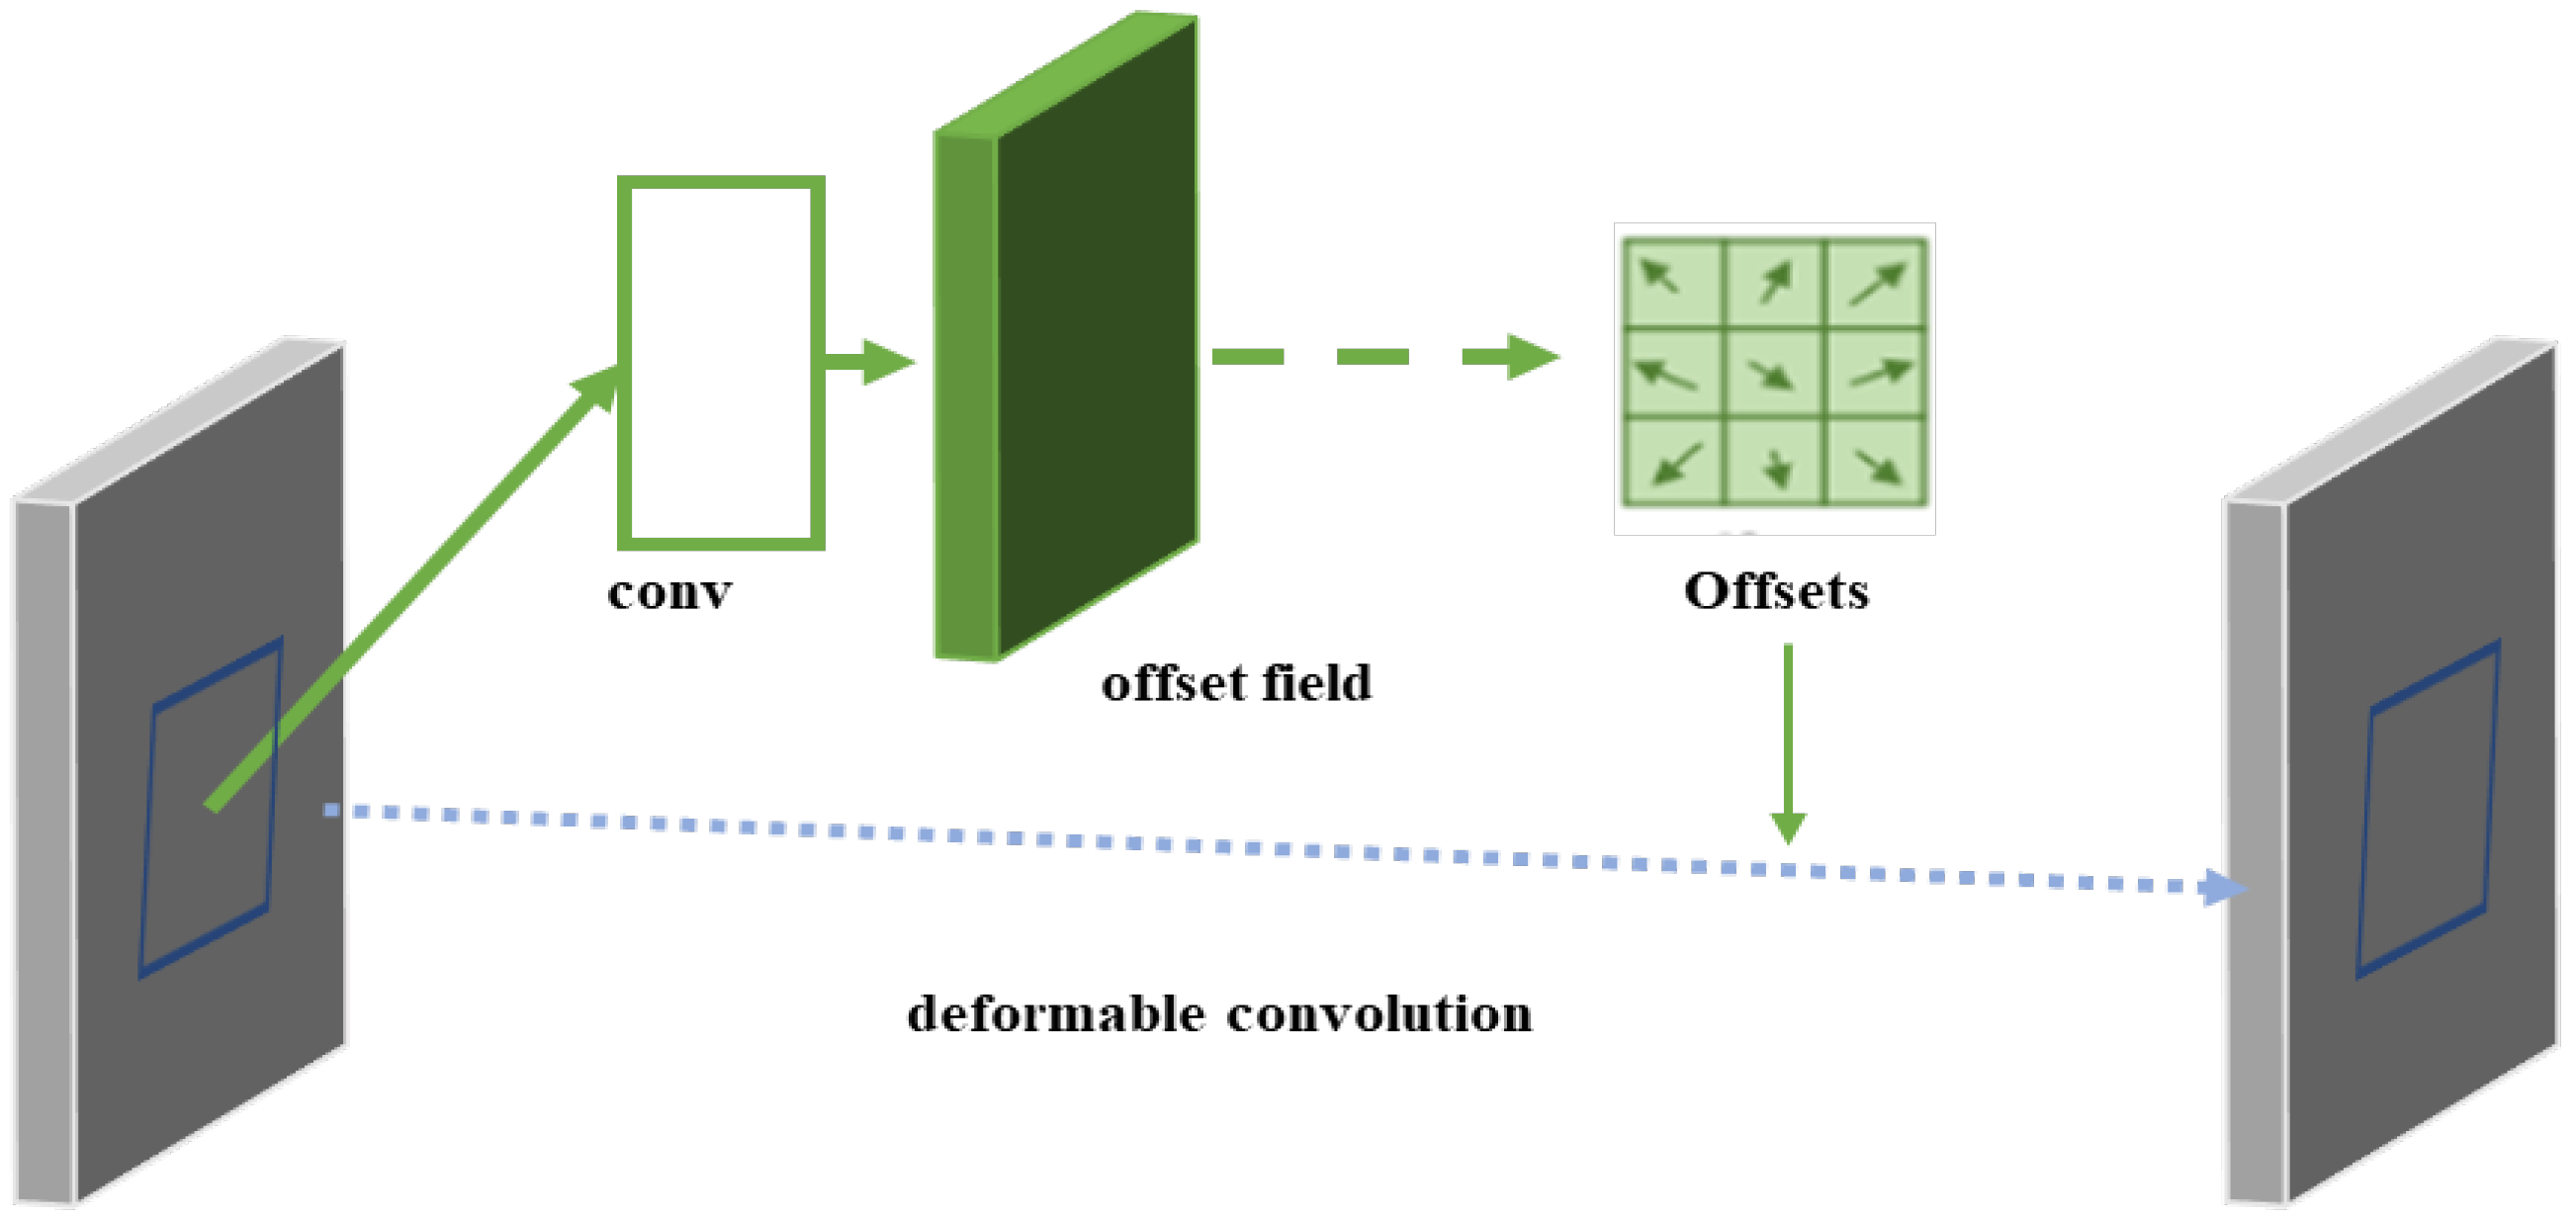
DCNs [
21] (deformable convolutional networks) are convolutional neural network modules for object detection and image segmentation, which improve the model’s ability to model object deformation by introducing the deformable convolution operation, where the standard convolution samples the regular grid positions of the input feature map. The operation of deformable convolution is shown in
Figure 12 below.
Where the left side is the input features, the right side is the output features, and the size of the convolution kernel is 3 × 3, we will map the 3 × 3 region in the input features to the 1 × 1 in the output features; the problem lies in how to select this 3 × 3 region. The traditional convolution is the regular shape; the deformable convolution involves adding an offset, then calculating for each point separately, and then changing the 3 × 3 region in the selection of each point and extracting some points that may have richer features to improve the detection effect, and its sampling position can be adaptively adjusted according to different object scales to capture features more accurately on objects of different scales. This enhances the model’s ability to perceive objects at different scales and makes it more applicable to the task of detecting objects at different scales.
During the process of object detection, objects can have different representations (e.g., bounding boxes [
22], centers [
23], and corner points [
24]) that have completely different goals and constraints. Studies [
22,
23,
24,
25,
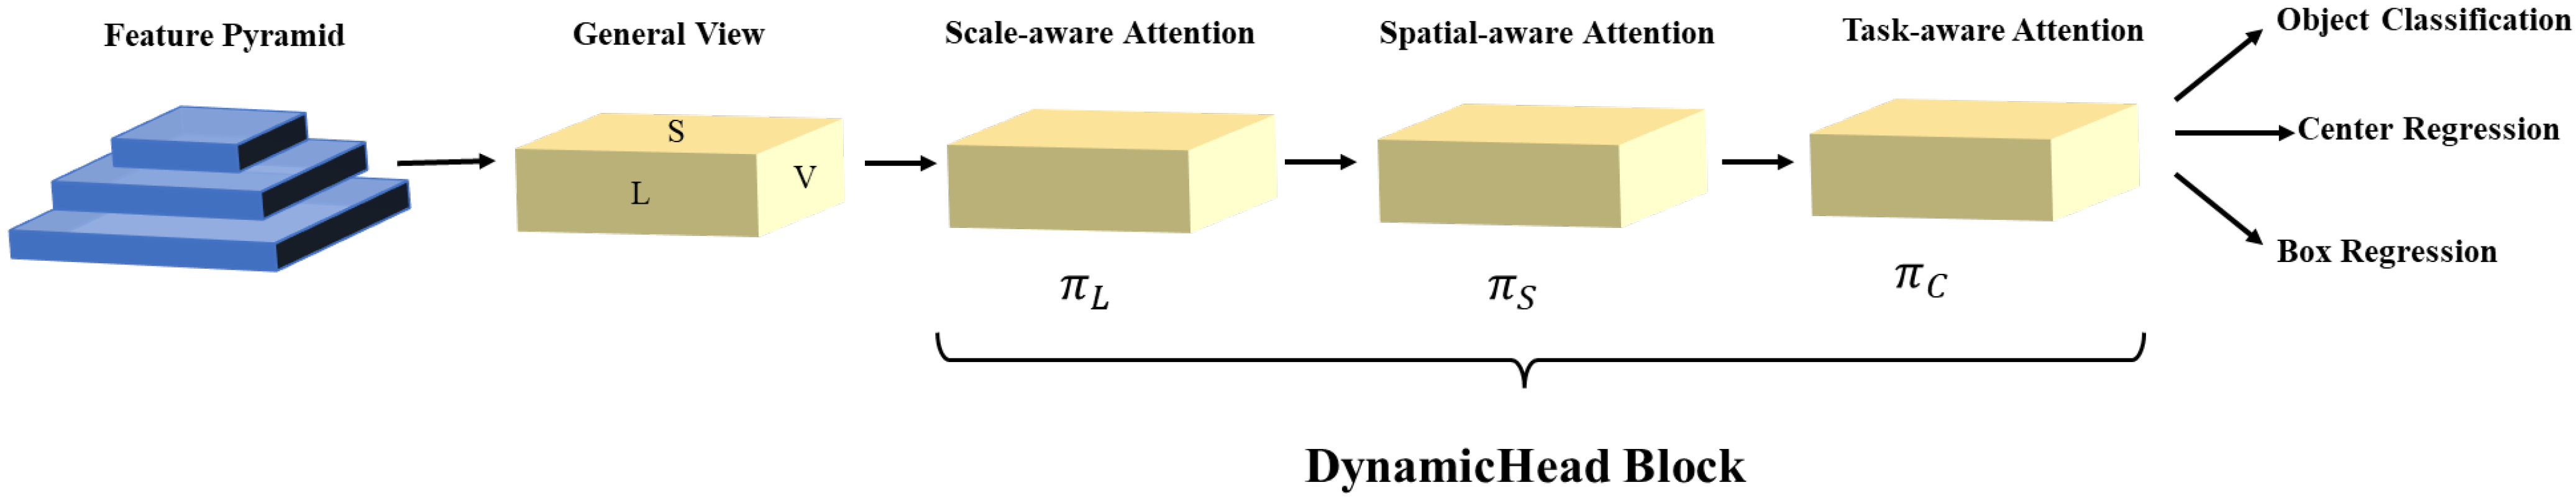
26] have focused on solving only one of these problems in various ways. Dynamic Head [
27] is a detection head based on the attention mechanism, the difference is that the attention function is converted into three sequential attentions, each focusing on only one angle, in such a way that avoids the implementation of the attention function with a fully connected layer, reduces the computational overhead, and the high dimensional features of the tensor can be learned. The implementation of the three layers of attention is shown in
Figure 13 below.
With the introduction of the Dynamic Head Block, a new scale-aware attention approach is presented, dynamically blending features from different scales based on their semantic importance. Subsequently, a spatial-aware attention module, built on the fused features, is used to emphasize discriminatory regions that consistently appear across various spatial locations and feature levels. Deformable convolutions are employed to enhance sparse attention learning within this module, followed by feature aggregation across layers at corresponding spatial positions. Task-aware attention is then utilized to facilitate integrated learning and promote diverse object representations.
3.2.4. Improved IOU
The original YOLOv8 model uses CIOU Loss [
28], which takes into account the complete intersection between the object frames and introduces a correction factor to more accurately measure the similarity between the object frames. The computation of the CIOU Loss Function is more complex compared to the traditional IOU, but this allows the model to better understand the exact location and shape of the object frames during training, and it is computed using the following formula:
where:
d is the distance between the centroid of the prediction box and the real box, and
c is the diagonal distance of the smallest outer rectangle.
α is calculated as follows:
v is the correction factor, which is used to further adjust the loss function to take into account the shape and orientation of the object frame. It is specifically calculated as:
In previous work, experimental results showed that the convergence speed and detection accuracy of the CIOU loss were significantly improved compared to previous loss functions. However, the v of the last term is still not well defined, which slows down the convergence speed of the CIOU. To solve this problem, it is particularly important to choose an appropriate IOU that can both speed up the convergence and balance the dataset samples. The revised losses [
29,
30] can only increase gradients of high-quality examples and cannot suppress the outliers. Meanwhile, the Focal EIOU Loss, which is proposed by Zhang [
31] et al. just meets this need:
γ is a parameter to control the degree of inhibition of outliers; the EIOU Loss [
32] is defined as follows:
We define and as the width and height of the smallest bounding box that encompasses both boxes. To compute the loss function, we break it down into three distinct parts: the IOU loss (), the distance loss (), and the aspect loss ().
In order to verify the superiority of the Focal EIOU Loss, it was tested against the current generalized Loss for comparison on the ship cabin equipment dataset, and the results are shown in
Table 2.
4. Experiment
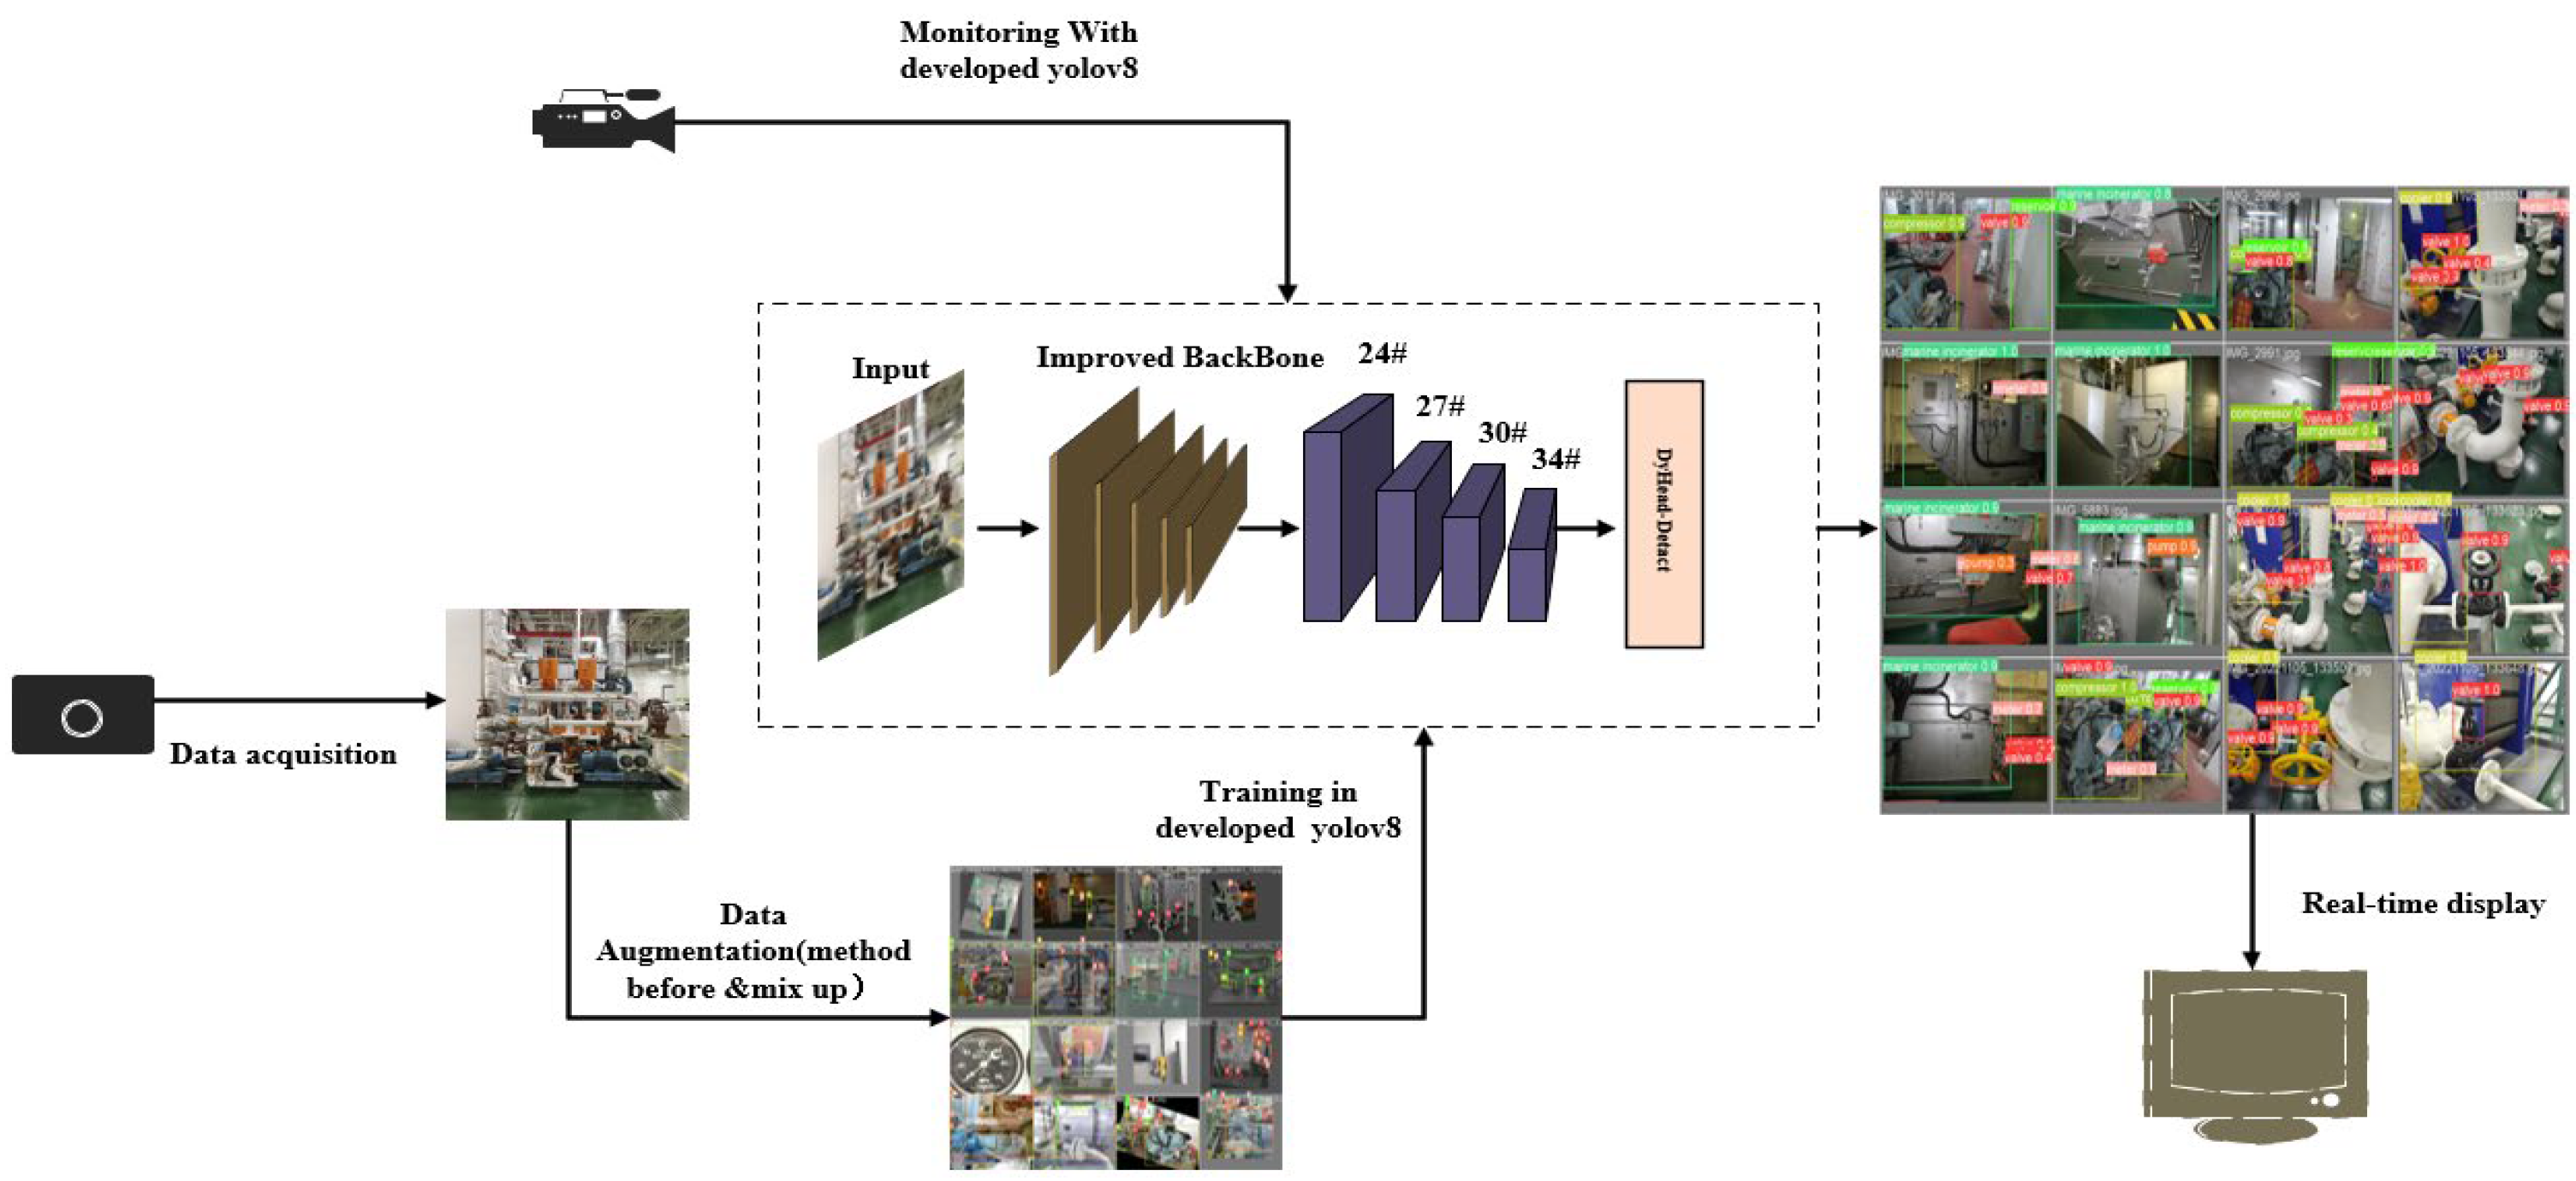
In this section, the improved YOLOv8 model is applied on the homemade cabin dataset; firstly, the structure of the dataset will be introduced, secondly, on the public dataset we compare the other classical models for comparison, and finally, we enter the test on the homemade dataset to prove that the improvement is effective and can be applied, and the visualization results are given. The testing process of ship cabin equipment is shown in
Figure 14.
4.1. Ship Equipment Dataset
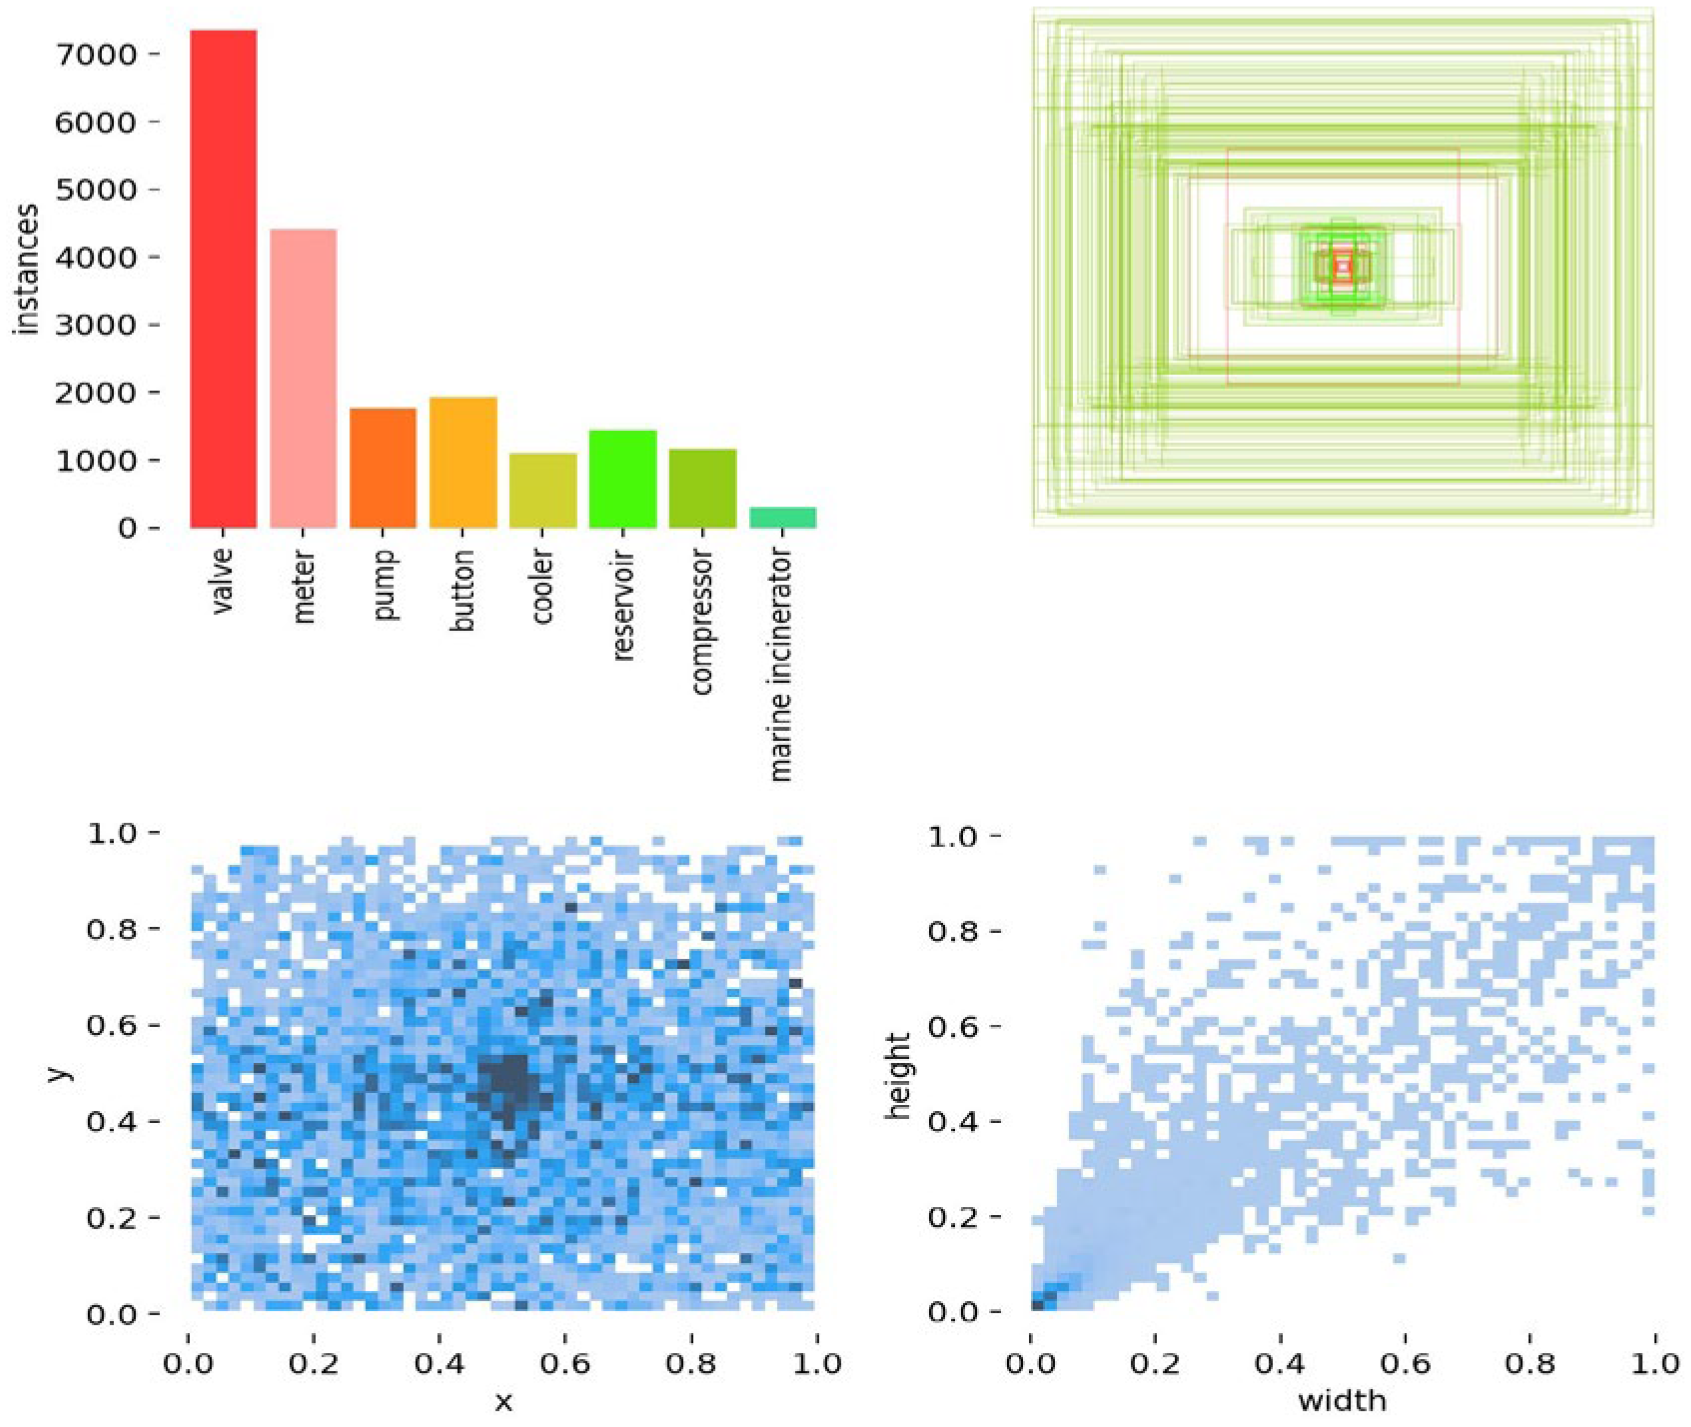
In the previous two sections, this paper provides the sample numbers and proportions of the original dataset, as well as the corresponding augmentation methods. The augmented dataset is the cabin equipment dataset that we use for experiments, and the ratio of the training set, validation set, and test set obtained by random division is 7:2:1. According to the sample distribution graph, it can be seen that there are a large number of small objects in the dataset and the object equipment to be detected in the dataset is distributed randomly in the graph, and the scenario is complex. The sample number and size distribution of the dataset is shown in
Figure 15.
The experimental environment is shown in
Table 3.
4.2. Model Validation
4.2.1. Evaluation Indicators
Average Precision (AP) represents the mean accuracy level of a model. In multi-class problems, the mean Average Precision (mAP) is a critical metric in object detection, calculated by averaging AP values across all categories. The process entails sorting categories by prediction confidence, computing individual AP scores using accuracy-recall curves, and then averaging these scores to obtain the final mAP value. A higher mAP indicates the superior detection performance of the model. Their calculation formulas are as follows:
Latency refers to the time used by the network to predict an image, FPS is the number of frames transmitted per second, which is the inverse of Latency, FPS reflects the inference speed of the model; the larger the FPS, the faster the model runs.
4.2.2. Model Validation on the COCO Dataset
In order to verify the generality and validity of the model improvement, a comparison test was conducted on the publicly available dataset MS COCO2017, training the GCD-YOLOv8M with the following parameter settings: batch size = 32, learning rate = 0.01, epochs = 120, and mixup = 0.8; the optimizer selection SGD, the current generalized object detection model YOLOX, a multi-model version of YOLOv5, and multi-model versions of YOLOv7 and YOLOv8 were used. Two parameter metrics are compared: fps and mAP50. The results show that the performance of the improved model is enhanced, as shown in
Table 4.
4.2.3. Ablation Study on Ship Equipment Dataset
In this section, the effectiveness of the improved part is first demonstrated by conducting ablation experiments on each improved part on the cabin equipment dataset. Secondly, the effectiveness of the improvement is further verified by comparing the mAP50 of the improved algorithm with the individual generalized algorithms in the previous section for each category and overall on the cabin equipment dataset.
In the course of the ablation experiment, the same parameter settings as on the publicly available dataset are used, and the experiment shows that: (1) The accuracy of GCFPN with further feature fusion is improved by 0.25% compared to the original GFPN module, and thereafter the combination experiment with the other modules uses only the GCFPN module. (2) The improved detector head, feature pyramid, and IOU all have different degrees of accuracy improvement on the dataset. (3) Finally, the optimized method obtained a performance of mAP50: 81.8% and mAP50-95: 58.12% on the dataset, which is an improvement of 2.6% and 0.88% compared to the original baseline model, which proves that the improved modules effectively enhance the detection of the ship’s cabin equipment, as shown in
Table 5. At the same time, the improved model did not significantly improve the running time (19.91–23.89 ms), which provides a solid guarantee for the real-time detection.
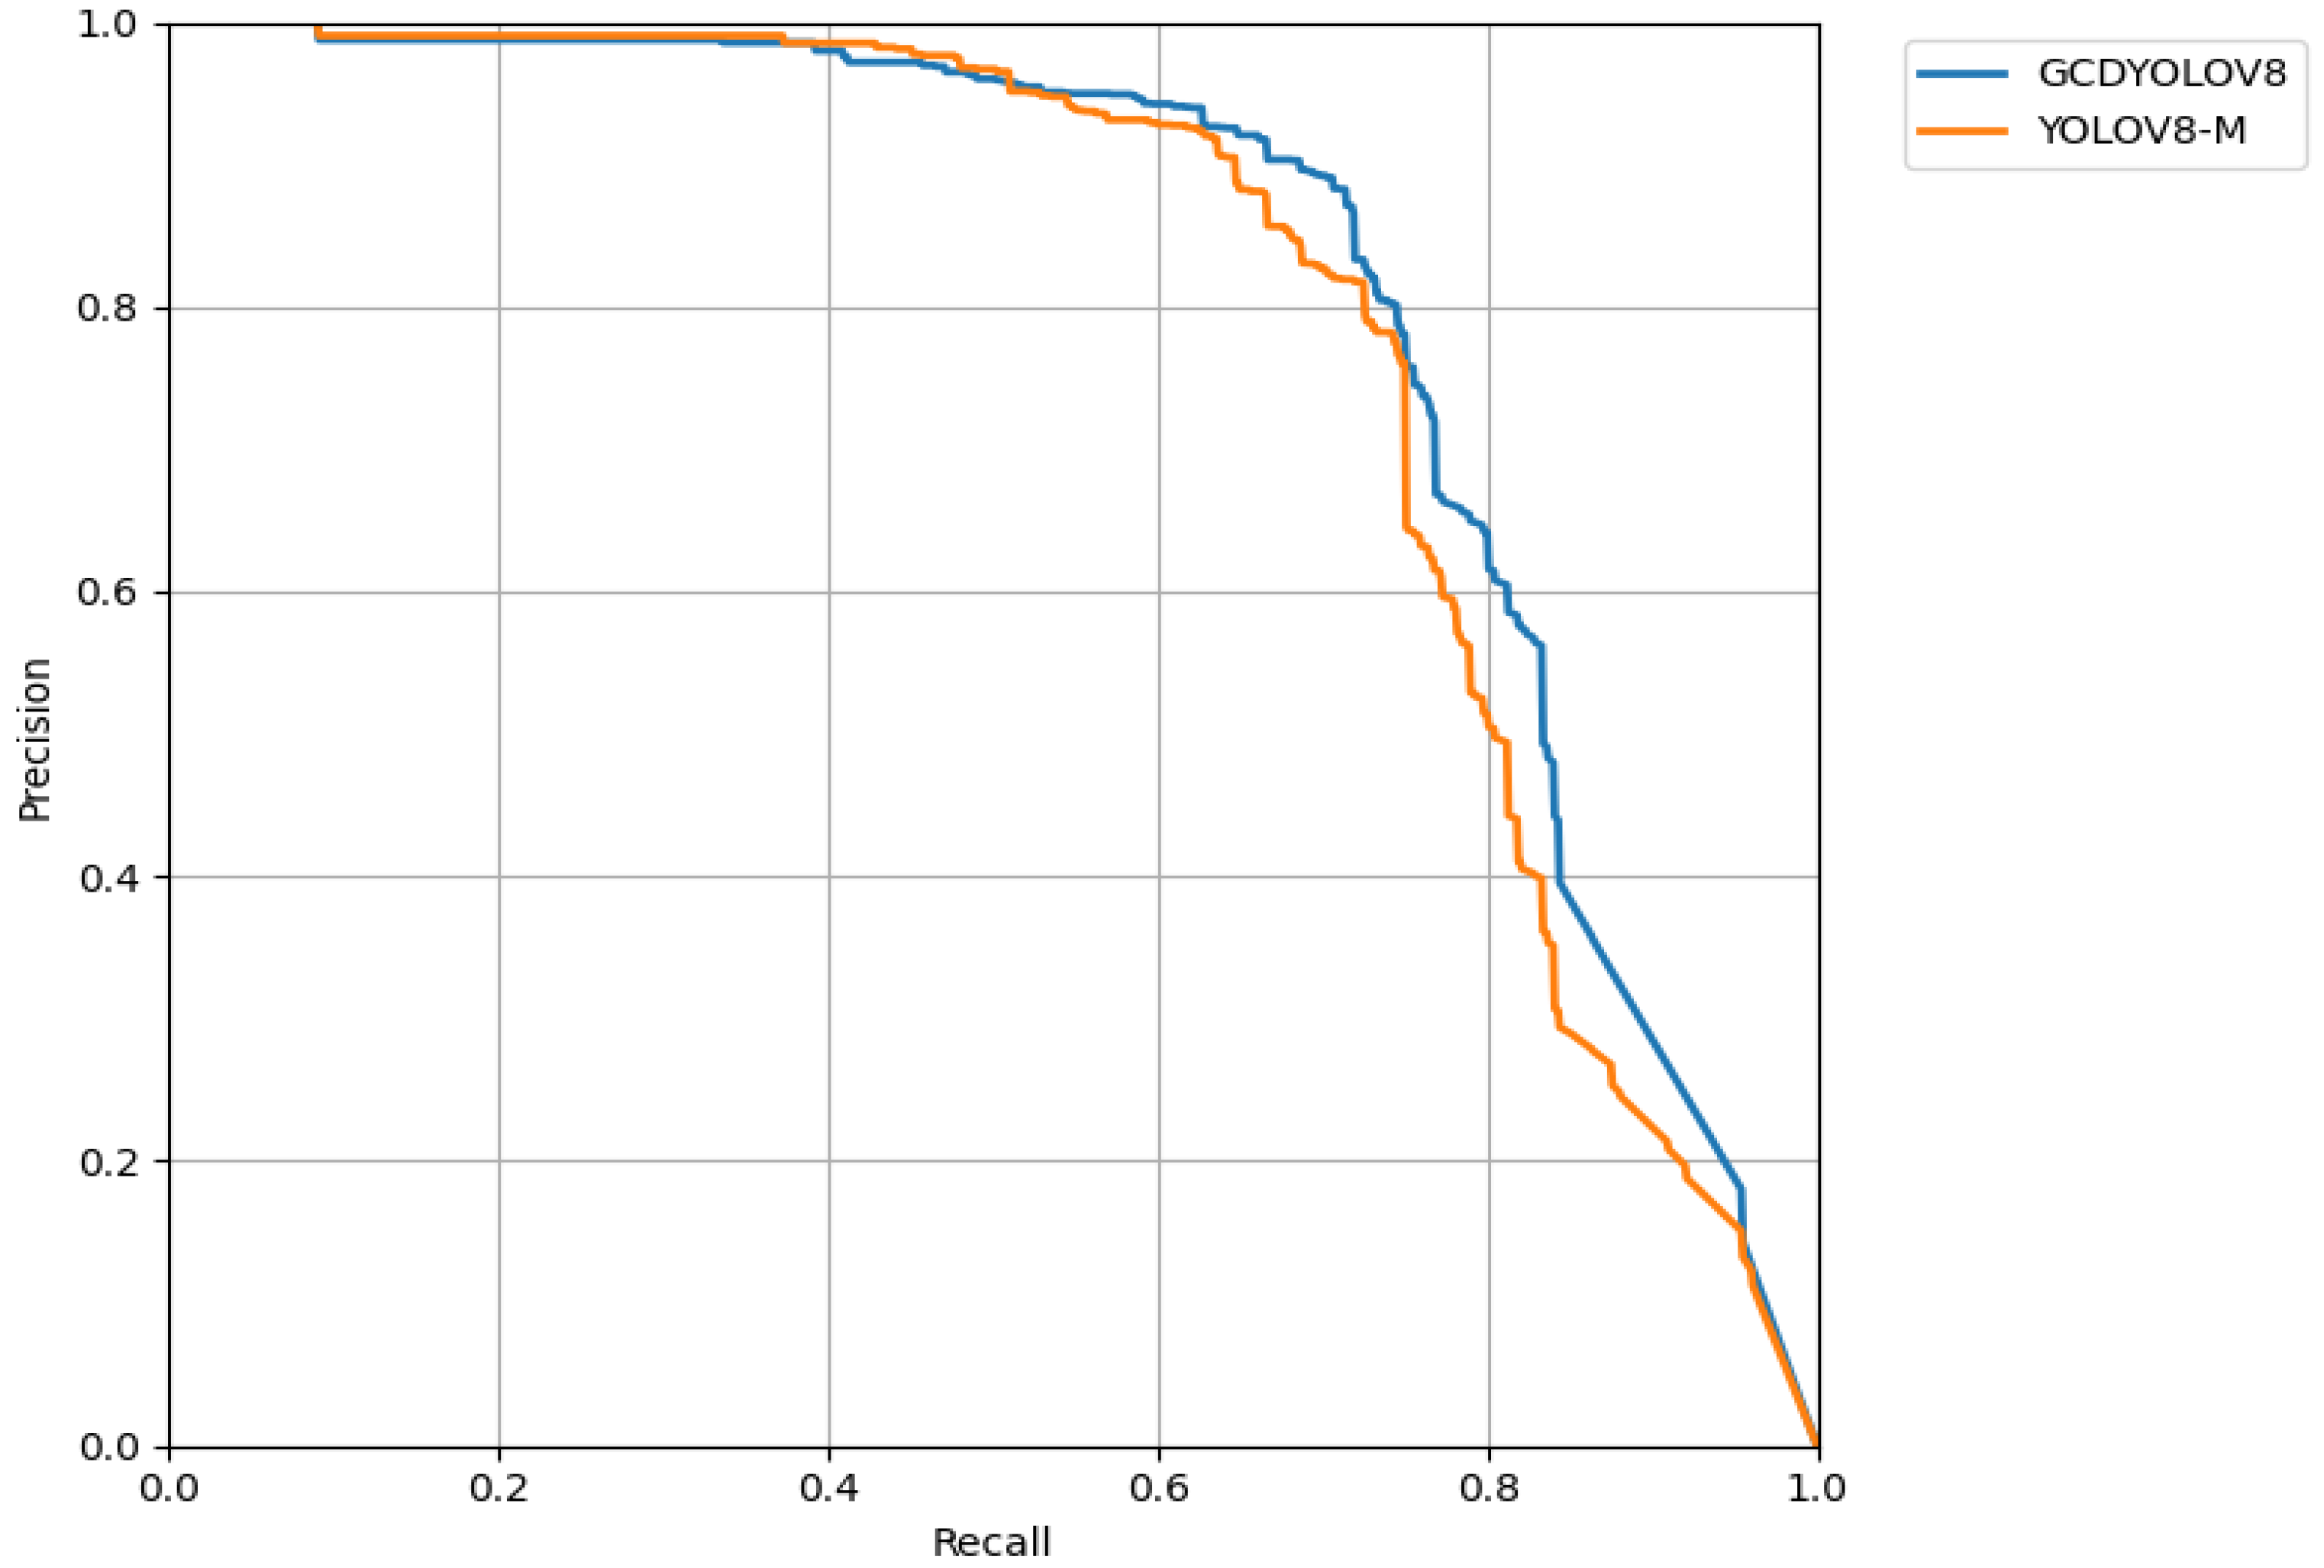
Comparison experiments between the improved GCDYOLOv8 model and other generalized models on the ship’s cabin equipment dataset were conducted to obtain the accuracy of each category and the overall accuracy of the model. The results show that the detection accuracy of each category is improved at the expense of a small number of parametric quantities, which not only enhances the detection accuracy for small objects in the ship’s cabin, but also improves the detection of full-size equipment in complex scenarios, as shown in
Table 6, and the comparison of PR curves is shown in
Figure 16.
The experimental results show that the detection accuracy of GCDYOLOV8 is improved compared with the benchmark model. Although its accuracy is lower than that of the YOLOV8-L model, the higher FPS indicates that it is more practical in the context of applications requiring real-time detection. Through experiments, it was found that GCFPN has a general effect on the large target cases of the Marine Incinerator and reservoir (possibly due to the large number of feature fusion layers), and the detection effect of other categories has been effectively improved. Focal-EIOU solves the problem of data imbalance at its root and is superior in all categories. The combination of DYHead and SPPFCSPC solves the big target loss problem of GCFPN to some extent. The combination of all strategies effectively enhances the performance of the baseline model and makes it more adaptable to the complex cabin environment.
4.2.4. Visualization
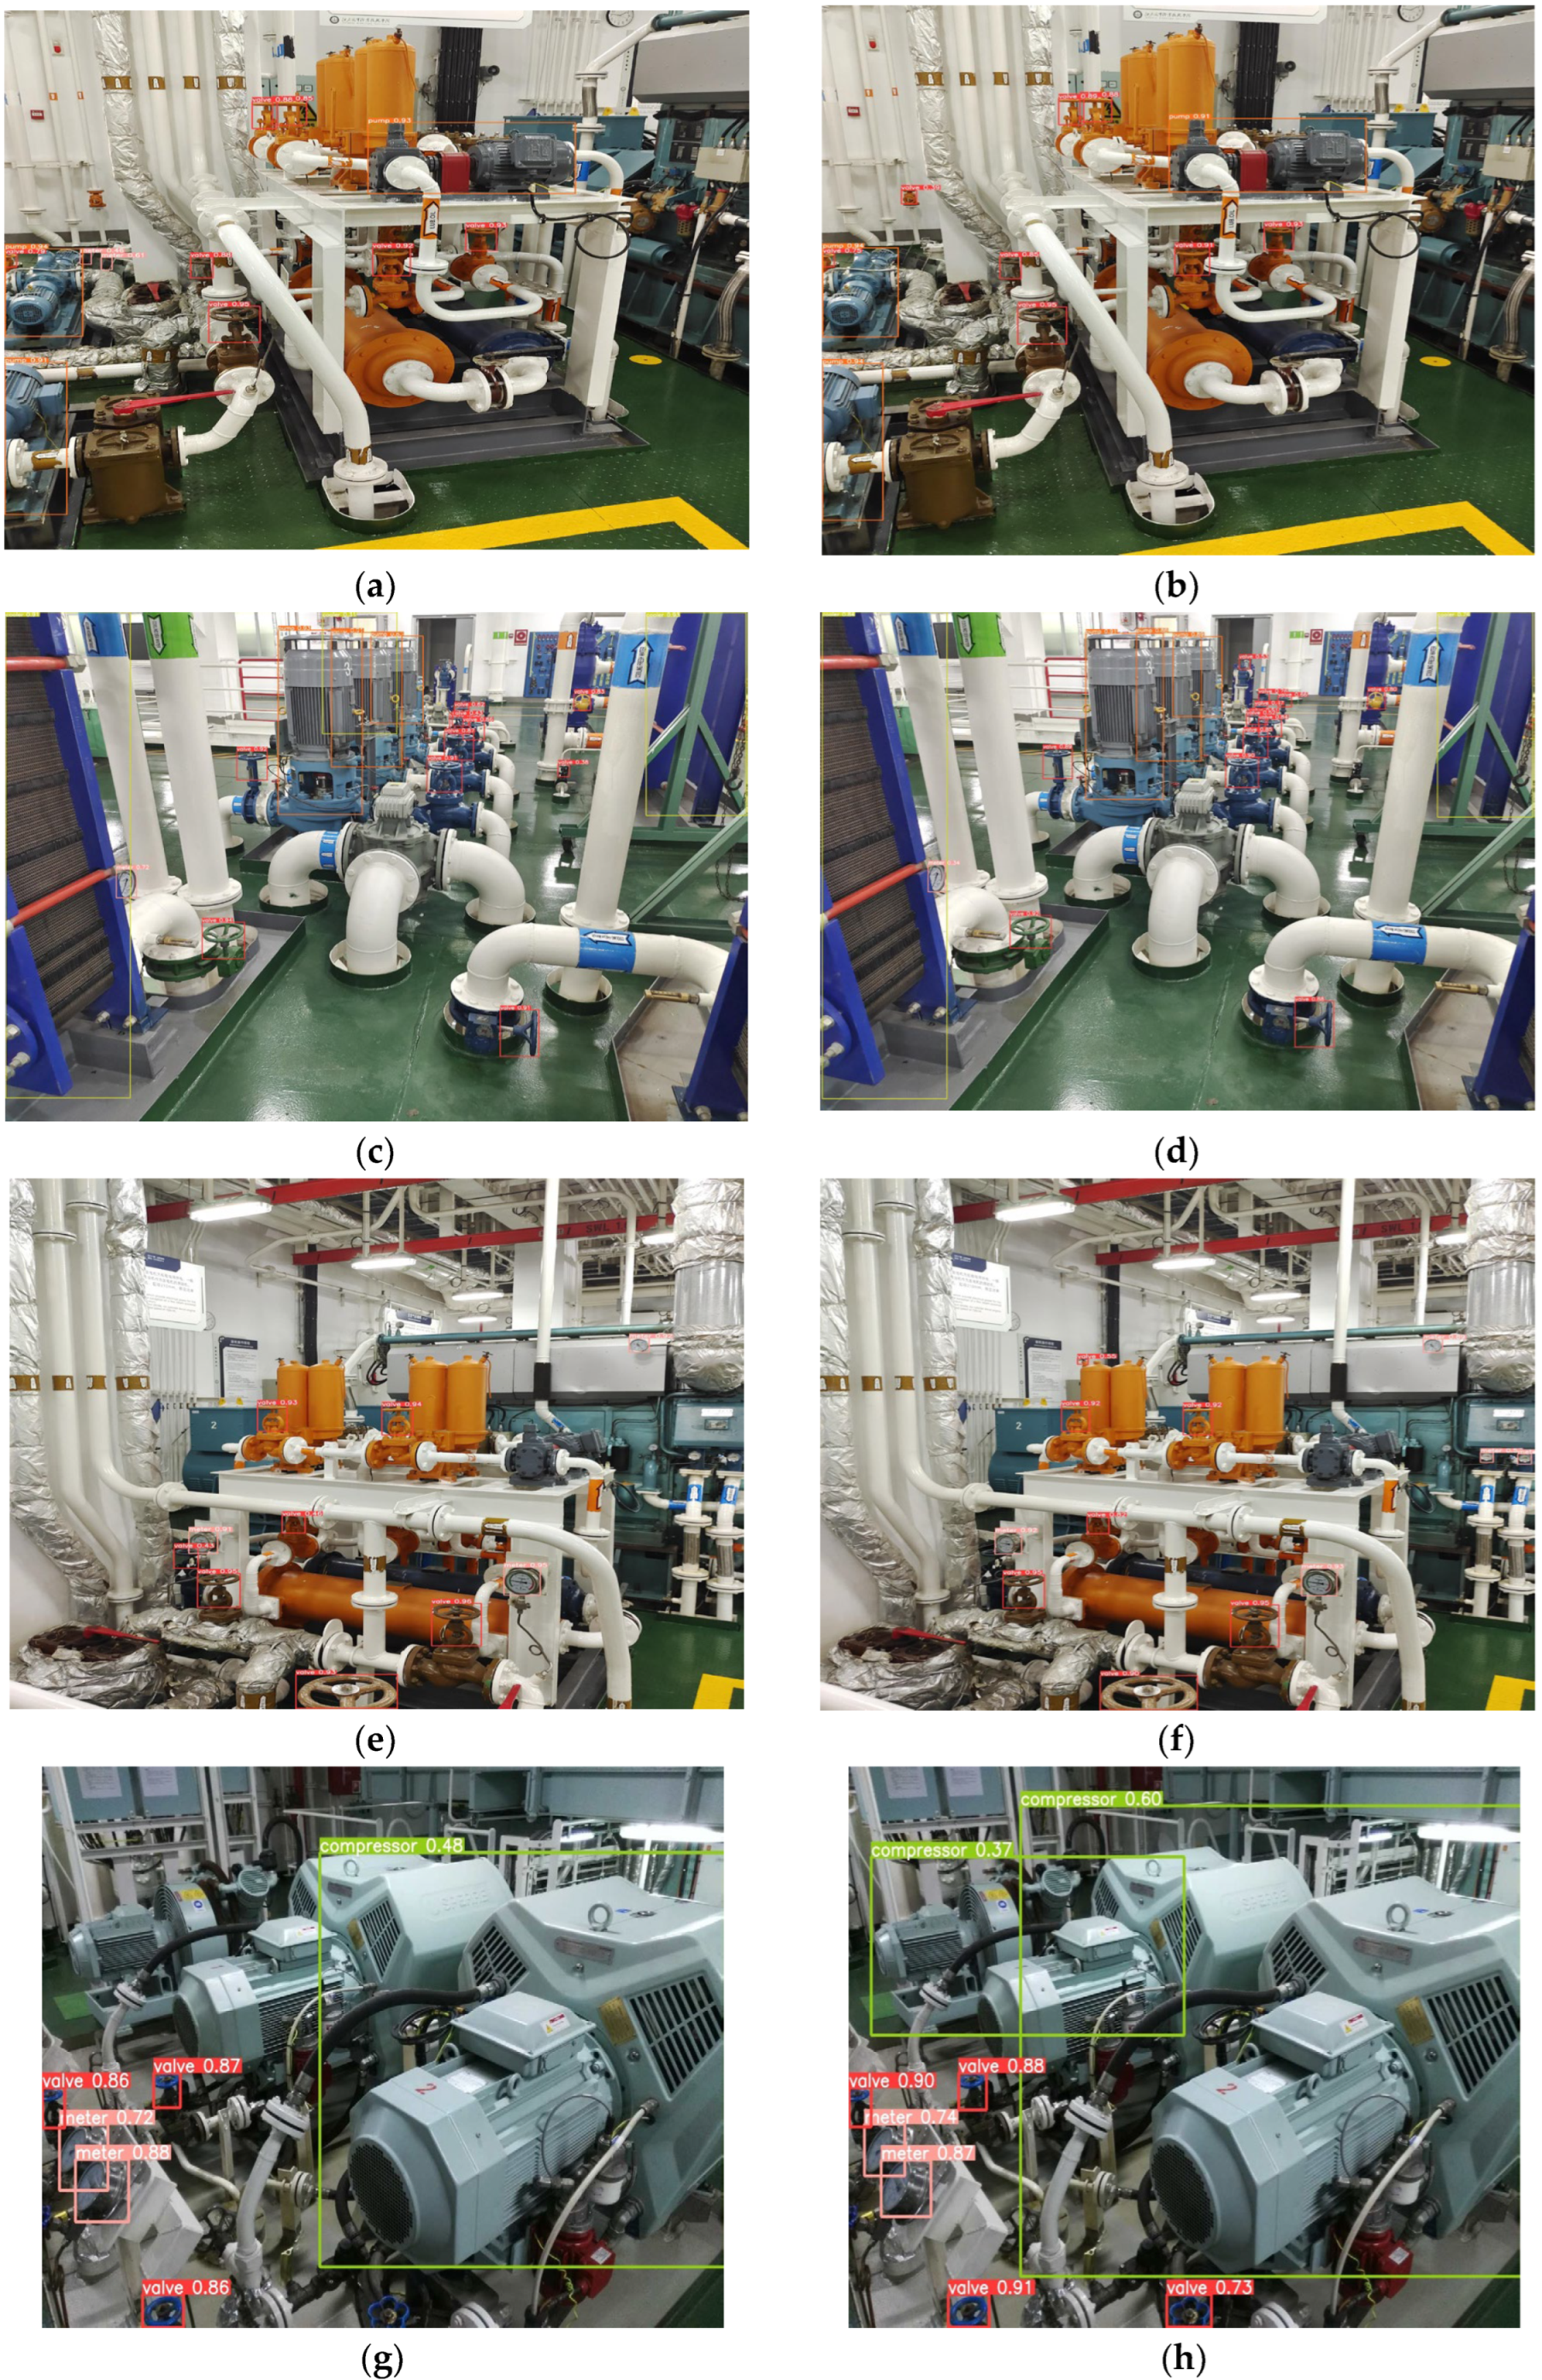
To better evaluate the impact of the enhanced model, a more concrete analysis is required. We randomly selected some images from the ship’s cabin equipment dataset and used YOLOv8-M and GCDYOLOv8 for inference, respectively, and we set the number of inference images in each batch to batch = 1, the object confidence threshold for detection to conf = 0.001, and the IOU threshold was set to 0.6. The inference results are illustrated in
Figure 17 below.
Complex ship cabin equipment scene graphs are randomly selected in the dataset, where the pictures in each row are the detection result graphs of the original model and the improved model in order from left to right.
Figure 17a,b shows the improved model’s better detection ability for small distant objects,
Figure 17c,d shows the improved model’s better detection ability for multiple overlapping objects and small distant objects, which avoids misjudging the background,
Figure 17e,f shows the better detection ability for small objects, and
Figure 17g,h shows the better detection ability for large occluded objects.
5. Conclusions
The study introduces a deep learning method for detecting ship cabin equipment, with the objective of implementing visual perception technology in ship cabins. To achieve this, a dataset comprising ship cabin scenes was meticulously created. Additionally, improvements were made to the baseline model to better adapt it to complex ship cabin backgrounds, thereby enhancing the network’s learning capacity. The experimental results lead to the following conclusions:
For the ship cabin equipment dataset with data imbalance, data enhancement can solve a small portion of the imbalance phenomenon. Focal EIOU can better improve the model learning ability compared to CIOU used in the original model, and the mAP50 on the private dataset is improved by 0.55%.
The new feature fusion network part GCFPN, which further fuses the information features of each layer, improves the mAP50 on the private dataset by 0.69% and 0.25% compared to the FPN and the GFPN of absorbing ideas in the original model.
The DyHead module, which introduces deformable convolution operations to enhance the model’s ability to model target deformations, and the SPPFCSPC module, incorporating the concepts of SPPF from the original model and SPPCSPC from YOLOV7, achieved mAP50 improvements of 0.34% and 0.23% on the private dataset, respectively.
The new network model GCD-YOLOv8, which combines all the improved modules, demonstrates improved accuracy compared to YOLOv8-M on both the MS COCO dataset and the private dataset. The mAP50 has increased by 0.4% and 2.6% respectively. However, the inference time increased by 4 ms, and the FPS decreased by 9.
The proposed improvement method in this paper can be successfully applied to the application environment of cabin monitoring. However, there are urgent issues that need to be addressed: (1) In complex scenarios, despite the multi-level feature fusion and intelligent detection head enhancing the detection capability for small targets, there are still extremely small targets that cannot be detected (such as valves and buttons). (2) For compressors, occasional occurrences of overlapping bounding boxes prevented one from being identified. (3) The monitoring method proposed in this paper only serves the purpose of discriminating instrument categories. In order to more intuitively reflect the environment of cabin equipment, real-time three-dimensional reconstruction of the targets to be inspected can be used to more clearly detect the status of the equipment. (4) The dataset used in this paper consists of static images, and it is currently unable to test the effects of vibration and light changes. In future work, it is necessary to collect relevant videos in order to better approach the real ship environment.
Author Contributions
Conceptualization, R.C. and J.Z.; methodology, R.C.; software and experiments, R.C.; validation, R.C. and H.S.; formal analysis, R.C.; investigation, R.C. and H.S.; resources, J.Z.; data curation, R.C.; writing—original draft preparation, R.C.; writing—review and editing, J.Z.; visualization, R.C. and H.S.; supervision, J.Z.; project administration, J.Z.; funding acquisition, J.Z. All authors have read and agreed to the published version of the manuscript.
Funding
This research was funded by Major Scientific Instrument Development Project of National Natural Science Foundation of China (62127806).
Institutional Review Board Statement
Not applicable.
Informed Consent Statement
Not applicable.
Data Availability Statement
Processed data cannot be shared at this time as they are also part of ongoing research.
Acknowledgments
The original images of the dataset were provided by the 3D Virtual Engine Room team. We thank them for supporting this study.
Conflicts of Interest
The authors declare no conflicts of interest.
References
- Hariharan, B.; Arbeláez, P.; Girshick, R.; Malik, J. Simultaneous detection and segmentation. In ECCV 2014: Computer Vision; Springer: Cham, Switzerland, 2014; pp. 297–312. [Google Scholar]
- Hariharan, B.; Arbelaez, P.; Girshick, R.; Malik, J. Hypercolumns for object segmentation and fine-grained localization. In Proceedings of the 2015 IEEE Conference on Computer Vision and Pattern Recognition (CVPR), Boston, MA, USA, 12 June 2015; pp. 447–456. [Google Scholar]
- Dai, J.; He, K.; Sun, J. Instance-aware semantic segmentation via multi-task network cascades. In Proceedings of the 2016 IEEE Conference on Computer Vision and Pattern Recognition (CVPR), Las Vegas, NV, USA, 27–30 June 2016; pp. 3150–3158. [Google Scholar]
- He, K.; Gkioxari, G.; Dollár, P.; Girshick, R. Mask R-CN. IEEE Trans. Pattern Anal. Mach. Intell. 2017, 42, 2980–2988. [Google Scholar]
- Karpathy, A.; Fei-Fei, L. Deep visual-semantic alignments for generating image descriptions. IEEE Trans. Pattern Anal. Mach. Intell. 2015, 39, 3128–3137. [Google Scholar]
- Xu, K.; Ba, J.; Kiros, R.; Cho, K.; Courville, A.; Salakhudinov, R.; Zemel, R.; Bengio, Y. Show, attend and tell: Neural image caption generation with visual attention. In Proceedings of the 32nd International Conference on Machine Learning, Lille, France, 7–9 July 2015; pp. 2048–2057. [Google Scholar]
- Wu, Q.; Shen, C.; Wang, P.; Dick, A.; van den Hengel, A. Image captioning and visual question answering based on attributes and external knowledge. IEEE Trans. Pattern Anal. Mach. Intell. 2018, 40, 1367–1381. [Google Scholar] [CrossRef] [PubMed]
- Kang, K.; Li, H.; Yan, J.; Zeng, X.; Yang, B.; Xiao, T.; Zhang, C.; Wang, C.; Wang, Z.; Wang, R. T-CNN: Tubelets with convolutional neural networks for object detection from videos. IEEE Trans. Circuits Syst. Video Technol. 2018, 28, 2896–2907. [Google Scholar] [CrossRef]
- LeCun, Y.; Bengio, Y.; Hinton, G. Deep learning. Nature 2015, 521, 436. [Google Scholar] [CrossRef] [PubMed]
- Redmon, J.; Divvala, S.; Girshick, R.; Farhadi, A. You only look once: Unified, real-time object detection. In Proceedings of the 2016 IEEE Conference on Computer Vision and Pattern Recognition (CVPR), Las Vegas, NV, USA, 27–30 June 2016; pp. 779–788. [Google Scholar]
- Redmon, J.; Farhadi, A. YOLOv3: An incremental improvement. arXiv 2018, arXiv:1804.02767. [Google Scholar]
- Bochkovskiy, A.; Wang, C.-Y.; Liao, H.-Y.M. YOLOv4: Optimal speed and accuracy of object detection. arXiv 2020, arXiv:2004.10934. [Google Scholar]
- Redmon, J.; Farhadi, A. YOLO9000: Better, faster, stronger. arXiv 2016, arXiv:1612.08242. [Google Scholar]
- Liu, W.; Anguelov, D.; Erhan, D.; Szegedy, C.; Reed, S.; Fu, C.-Y.; Berg, A.C. SSD: Single shot multibox detector. In ECCV 2016: Computer Vision; Springer: Cham, Switzerland, 2016; pp. 21–37. [Google Scholar]
- Wang, C.-Y.; Bochkovskiy, A.; Liao, H.-Y.M. YOLOv7: Trainable bag-of-freebies sets new state-of-the-art for real-time object detectors. arXiv 2022, arXiv:2207.02696. [Google Scholar]
- He, K.; Zhang, X.; Ren, S.; Sun, J. Spatial pyramid pooling in deep convolutional networks for visual recognition. IEEE Trans. Pattern Anal. Mach. Intell. 2015, 37, 1904–1916. [Google Scholar] [CrossRef] [PubMed]
- Ghiasi, G.; Lin, T.-Y.; Le, Q.V. Nas-fpn: Learning scalable feature pyramid architecture for object detection. In Proceedings of the IEEE/CVF Conference on Computer Vision and Pattern Recognition, Long Beach, CA, USA, 15–20 June 2019; pp. 7036–7045. [Google Scholar]
- Jiang, Y.; Tan, Z.; Wang, J.; Sun, X.; Lin, M.; Li, H. Giraffedet: A heavy-neck paradigm for object detection. In Proceedings of the International Conference on Learning Representations, Online, 25–29 April 2022. [Google Scholar]
- Tan, M.; Pang, R.; Le, Q.V. Efficientdet: Scalable and efficient object detection. In Proceedings of the IEEE/CVF Conference on Computer Vision and Pattern Recognition, Seattle, WA, USA, 13–19 June 2020; pp. 10781–10790. [Google Scholar]
- Wang, K.; Liew, J.H.; Zou, Y.; Zhou, D.; Feng, J. Panet: Few-shot image semantic segmentation with prototype alignment. In Proceedings of the IEEE/CVF International Conference on Computer Vision, Seoul, Republic of Korea, 27 October–2 November 2019; pp. 9197–9206. [Google Scholar]
- Wang, J.; Xu, C.; Yang, Z.; Zhang, J.; Li, X. Deformable Convolutional Networks for Efficient Mixed-Type Wafer Defect Pattern Recognition. IEEE Trans. Semicond. Manuf. 2020, 33, 587–596. [Google Scholar] [CrossRef]
- He, K.; Gkioxari, G.; Dollar, P.; Ross, B. Girshick. Mask r-cnn. In Proceedings of the 2017 IEEE International Conference on Computer Vision (ICCV), Venice, Italy, 22–29 October 2017; pp. 2980–2988. [Google Scholar]
- Yang, Z.; Liu, S.; Hu, H.; Wang, L.; Lin, S. Reppoints: Point set representation for object detection. In Proceedings of the 2019 IEEE/CVF International Conference on Computer Vision (ICCV), Seoul, Republic of Korea, 27 October–2 November 2019; pp. 9656–9665. [Google Scholar]
- Zhang, S.; Chi, C.; Yao, Y.; Lei, Z.; Li, S. Bridging the gap between anchor-based and anchorfree detection via adaptive training sample selection. In Proceedings of the 2020 IEEE/CVF Conference on Computer Vision and Pattern Recognition (CVPR), Seattle, WA, USA, 13–19 June 2020; pp. 9756–9765. [Google Scholar]
- Tian, Z.; Shen, C.; Chen, H.; He, T. Fcos: Fully convolutional one-stage object detection. In Proceedings of the 2019 IEEE/CVF International Conference on Computer Vision (ICCV), Seoul, Republic of Korea, 27 October–2 November 2019; pp. 9626–9635. [Google Scholar]
- Wang, X.; Zhang, S.; Yu, Z.; Feng, L.; Zhang, W. Scale-equalizing pyramid convolution for object detection. In Proceedings of the 2020 IEEE/CVF Conference on Computer Vision and Pattern Recognition (CVPR), Seattle, WA, USA, 13–19 June 2020; pp. 13356–13365. [Google Scholar]
- Dai, X.; Chen, Y.; Xiao, B.; Chen, D.; Liu, M.; Yuan, L.; Zhang, L. Dynamic Head: Unifying Object Detection Heads with Attentions. arXiv 2021, arXiv:2106.08322. [Google Scholar]
- Wang, P.; Zheng, Z.; Li, J.; Liu, W.; Ren, D.; Ye, R. Distance-iou loss: Faster and better learning for bounding box regression. In Proceedings of the AAAI Conference on Artificial Intelligence (AAAI), New York, NY, USA, 7–12 February 2020. [Google Scholar]
- Zhang, H.; Chang, H.; Ma, B.; Wang, N.; Chen, X. Dynamic R-CNN: Towards high quality object detection via dynamic training. arXiv 2020, arXiv:2004.06002. [Google Scholar]
- Pang, J.; Chen, K.; Shi, J.; Feng, H.; Ouyang, W.; Lin, D. Libra r-cnn: Towards balanced learning for object detection. In Proceedings of the IEEE Conference on Computer Vision and Pattern Recognition, Seoul, Republic of Korea, 27 October–2 November 2019. [Google Scholar]
- Zhang, Y.F.; Ren, W.; Zhang, Z.; Jia, Z.; Wang, L.; Tan, T. Focal and Efficient IOU Loss for Accurate Bounding Box Regression. arXiv 2021, arXiv:2101.08158. [Google Scholar]
- Tong, Z.; Chen, Y.; Xu, Z.; Yu, R. Wise-IoU: Bounding Box Regression Loss with Dynamic Focusing Mechanism. arXiv 2023, arXiv:2301.10051. [Google Scholar]
Figure 1.
(a–c) Network structure of YOLOv8 with the initial input feature map size of 640 × 640 × 3. The detailed structures of the integrated modules are also shown in (d–g) for the detection head, the C2f module, the CBS module, and the SPPF module, respectively.
Figure 1.
(a–c) Network structure of YOLOv8 with the initial input feature map size of 640 × 640 × 3. The detailed structures of the integrated modules are also shown in (d–g) for the detection head, the C2f module, the CBS module, and the SPPF module, respectively.
Figure 2.
Scenarios of complex equipment arrangement within the engine room.
Figure 2.
Scenarios of complex equipment arrangement within the engine room.
Figure 3.
Appearance variability of the same device: (a) marine incinerators of different colors and construction material, (b) compressors with very different appearances, (c) buttons with different arrangement and material, (d) valves of different colors, (e) compressors with different colors and construction, (f) meter with different outsourcing material and dial format, and (g) reservoir with different setups (vertical vs. horizontal) and different size.
Figure 4.
The data distribution of the original dataset.
Figure 4.
The data distribution of the original dataset.
Figure 5.
Examples of labelled ground-truth images.
Figure 5.
Examples of labelled ground-truth images.
Figure 6.
Amplification effect of the dataset.
Figure 6.
Amplification effect of the dataset.
Figure 7.
Network structure diagram of GCDYOLOv8.
Figure 7.
Network structure diagram of GCDYOLOv8.
Figure 9.
SPPCSPC structure.
Figure 9.
SPPCSPC structure.
Figure 10.
SPPFCSPC structure.
Figure 10.
SPPFCSPC structure.
Figure 11.
Multiple feature fusion methods.
Figure 11.
Multiple feature fusion methods.
Figure 12.
Principle of DCN.
Figure 12.
Principle of DCN.
Figure 13.
Dynamic Head Structure.
Figure 13.
Dynamic Head Structure.
Figure 14.
Training and detecting process of engine room equipment.
Figure 14.
Training and detecting process of engine room equipment.
Figure 15.
Analysis of cabin equipment dataset.
Figure 15.
Analysis of cabin equipment dataset.
Figure 16.
Comparison of PR curves.
Figure 16.
Comparison of PR curves.
Figure 17.
Comparison of picture detection results for the selected test set. (a,b,e,f) Small target detection and comparison (c,d) multiple overlapping objects and small distant objects detection and comparison (g,h) large occluded objects detection and comparison.
Figure 17.
Comparison of picture detection results for the selected test set. (a,b,e,f) Small target detection and comparison (c,d) multiple overlapping objects and small distant objects detection and comparison (g,h) large occluded objects detection and comparison.
Table 1.
Data amplification methods for each category.
Table 1.
Data amplification methods for each category.
| Category | Method |
|---|
| Valve | random |
| Pump | mosaic with others + random |
| Meter | rotate + flip (horizonal/vertical) |
| Reservoir | flip |
| Cooler | random |
| Button | rotate + flip (horizonal/vertical) |
| Compressor | rotate (<30°) + occlusion |
| Marine Incinerator | flip (horizonal) |
Table 2.
Comparison of detection results for different loss functions introduced by YOLOv8-M.
Table 2.
Comparison of detection results for different loss functions introduced by YOLOv8-M.
| Metrics | mAP50 (%) |
|---|
| CIOU | 79.20 |
| EIOU | 79.28 |
| WIOU V1 [32] | 79.40 |
| WIOU V2 [32] | 79.43 |
| WIOU V3 [32] | 79.43 |
| Focal EIOU | 79.75 |
Table 3.
Experimental platform.
Table 3.
Experimental platform.
| Configuration | Specification |
|---|
| Operating System | Windows 10 |
| GPU | NVIDIA GeForce RTX 3090
(NVIDIA, Sanata Clara, CA, USA) |
| IDE | Visual Studio |
| Framework | PyTorch-1.11.0 |
| Toolkit | CUDA11.3 |
Table 4.
Comparison of object detection test results on COCO2017 dataset.
Table 4.
Comparison of object detection test results on COCO2017 dataset.
| Method | Input | GFLOPs | Params (M) | Test | FPS | mAP50 (%) |
|---|
| YOLOX-S | 640 | 26.8 | 9.0 | COCO2017 | 333 | 59.3 |
| YOLOX-M | 640 | 73.8 | 25.3 | COCO2017 | 155 | 65.6 |
| YOLOX-L | 640 | 155.6 | 54.2 | COCO2017 | 94 | 68 |
| YOLOV5-S | 640 | 16.5 | 7.2 | COCO2017 | 376 | 56.8 |
| YOLOV5-M | 640 | 49.0 | 21.2 | COCO2017 | 182 | 64.1 |
| YOLOV5-L | 640 | 109.1 | 46.5 | COCO2017 | 113 | 67.3 |
| YOLOV7 | 640 | 104.7 | 36.9 | COCO2017 | 110 | 69.7 |
| YOLOV8-S | 640 | 28.6 | 11.2 | COCO2017 | 311 | 61.8 |
| YOLOV8-L | 640 | 165.2 | 43.7 | COCO2017 | 91 | 69.8 |
| YOLOV8-M | 640 | 78.9 | 25.9 | COCO2017 | 143 | 67.2 |
| GCDYOLOV8 | 640 | 113.8 | 37.4 | COCO2017 | 126 | 67.6 |
Table 5.
Improved modular ablation experiments on the ship’s cabin equipment dataset.
Table 5.
Improved modular ablation experiments on the ship’s cabin equipment dataset.
| M | Baseline | GFPN | GCFPN | DYHead | SPPFCSPC | Focal-EIOU | Time (ms) | mAP50 (%) | mAP50-95 (%) |
|---|
| 1 | YOLOV8-M | | | | | | 19.91 | 79.20 | 57.24 |
| 2 | YOLOV8-M | √ | | | | | 20.82 | 79.64 | 57.19 |
| 3 | YOLOV8-M | | √ | | | | 20.93 | 79.89 | 57.60 |
| 4 | YOLOV8-M | | | √ | | | 21.16 | 79.54 | 57.23 |
| 5 | YOLOV8-M | | | | √ | | 20.23 | 79.43 | 57.81 |
| 6 | YOLOV8-M | | | | | √ | 19.92 | 79.75 | 57.50 |
| 7 | YOLOV8-M | | √ | | | √ | 20.95 | 80.24 | 57.94 |
| 8 | YOLOV8-M | | √ | | √ | | 21.74 | 80.33 | 58.02 |
| 9 | YOLOV8-M | | √ | √ | | | 22.45 | 80.12 | 58.04 |
| 10 | YOLOV8-M | | √ | √ | √ | | 22.57 | 81.23 | 58.02 |
| 11 | YOLOV8-M | | √ | | √ | √ | 21.76 | 81.62 | 58.10 |
| 12 | YOLOV8-M | | √ | √ | √ | √ | 23.89 | 81.80 | 58.12 |
Table 6.
Comparison experiments between the improved model and the generic model on the ship’s cabin equipment dataset.
Table 6.
Comparison experiments between the improved model and the generic model on the ship’s cabin equipment dataset.
| Model | AP50 (%) | FPS | mAP50 (%) |
|---|
| Valve | Pump | Cooler | Reservoir | Meter | Button | Compressor | Marine Incinerator |
|---|
| YOLOX-M | 76.33 | 70.16 | 72.13 | 71.74 | 81.35 | 79.56 | 87.46 | 86.20 | 46.29 | 78.12 |
| YOLOX-L | 77.92 | 74.05 | 78.12 | 75.30 | 81.80 | 79.82 | 88.85 | 87.61 | 37.82 | 80.43 |
| YOLOV5-M | 75.53 | 67.27 | 71.36 | 74.74 | 78.59 | 80.01 | 80.55 | 81.95 | 48.08 | 76.25 |
| YOLOV5-L | 76.45 | 69.75 | 76.24 | 78.02 | 80.56 | 84.48 | 81.31 | 83.26 | 38.36 | 78.76 |
| YOLOV7 | 75.57 | 73.45 | 80.66 | 81.84 | 82.32 | 80.20 | 85.85 | 84.41 | 49.21 | 80.54 |
| YOLOV8-L | 77.26 | 74.41 | 82.09 | 85.13 | 84.42 | 83.55 | 87.89 | 91.09 | 39.85 | 83.23 |
| YOLOV8-M | 75.18 | 66.98 | 79.98 | 77.18 | 82.68 | 79.68 | 84.45 | 87.48 | 50.23 | 79.20 |
| GCDYOLOV8 | 76.83 | 72.54 | 81.12 | 84.04 | 83.74 | 81.01 | 87.32 | 87.82 | 41.75 | 81.80 |
| Disclaimer/Publisher’s Note: The statements, opinions and data contained in all publications are solely those of the individual author(s) and contributor(s) and not of MDPI and/or the editor(s). MDPI and/or the editor(s) disclaim responsibility for any injury to people or property resulting from any ideas, methods, instructions or products referred to in the content. |
© 2024 by the authors. Licensee MDPI, Basel, Switzerland. This article is an open access article distributed under the terms and conditions of the Creative Commons Attribution (CC BY) license (https://creativecommons.org/licenses/by/4.0/).


