Abstract
The depletion of the grey mullet population in the Taiwan Strait has generated interest in conservation initiatives and to enhance the effectiveness of restoration initiatives, it is essential to comprehend the specific habitat preferences of the species in question, particularly in relation to environmental changes. In this study, habitat suitability modelling was used to investigate the distribution patterns of grey mullet. Sea surface height (SSH) was the most significant predictor of the grey mullet standardized catch per unit effort (S.CPUE). Furthermore, sea surface temperature (SST) was the second most important oceanographic parameter, followed by mixed-layer depth (MLD). The grey mullet S.CPUE peaked in regions with the summed SST, Chla, salinity, SSH, MLD and current values being 20 °C, 0.9 mg/m3, 34.5 psu, 0.45 m, 18–38 m, and 0.25 m2/s2, respectively. From late October, HSI levels in the northern Taiwan ocean increased, with a consistent upward trend. The distribution expanded in November and December, focusing on the northern and mid-ocean regions west of Taiwan. HSI levels peak in January and February, especially in Taiwan’s coastal region. High HSI distribution shifts away from coastlines and diminishes in April. The findings of this study will contribute to the understanding of this specific species and the approach used in this study may be applicable to other fisheries stocks also.
1. Introduction
The lives of communities reliant on ocean resources, biodiversity, and marine ecosystems are all significantly impacted by global climate change [1]. A large amount of the excess heat from greenhouse gas emissions is absorbed by the oceans, which eventually causes ocean warming. Sea level rise, ocean acidification, coral bleaching, disturbance of the marine food web, and decreased oxygen levels are only a few of the major consequences of ocean warming [2]. The cumulative effect of these changes in oceanic circumstances poses serious problems for biodiversity and marine ecosystems. These changes may also have a substantial effect on fish stocks, influencing their financial viability, productivity, and catch rates. They have the potential to alter the distribution and movement patterns of species, increasing the vulnerability of some, changing fishing patterns, and having a detrimental impact on livelihoods and food security [3]. Many studies have predicted that altering oceanic and climatic circumstances will cause a significant shift in habitat or loss [4,5]. For instance, Lam et al. (2020) [6] projected that by the 2050s, changes in oceanic conditions will result in a 40% drop in the tropical fish catch in some economic zones under Representative Concentration Pathway 8.5 [climate change scenario (severe warming condition)]. Therefore, maintaining biodiversity, managing fisheries sustainably, and assisting populations who depend on fisheries for their food security and way of life all depend on study on the effects of oceanographic conditions on fisheries.
The distribution of fisheries is greatly influenced by oceanographic conditions, which include physical, chemical, and biological elements that impact fish species availability and abundance. Therefore, researching the connection between these factors and fish distribution is essential and can serve as a first step towards managing fisheries sustainably [7]. Sea surface temperature (SST), sea surface salinity (SSS), sea surface chlorophyll (Chla), mixed-layer depth (MLD), and ocean currents are examples of oceanographic conditions. These elements may have a direct or indirect impact on distribution. According to Fredston et al. (2023) [8], for example, SST is a critical oceanographic component that controls an organism’s thermoregulation, which in turn affects its distribution, ecology, behavior, and interactions with other creatures. According to Miah et al. (2023) [9], SSS is an additional important oceanographic component that has a major impact on fish physiology, spawning, reproduction, and distribution. Plankton abundance and fish species that depend on these resources are impacted by MLD’s effects on water column temperature and nutrient distribution [10]. Fisheries are impacted by a wide range of other factors, though [11]. Furthermore, major ocean events brought on by climatic oscillations can alter oceanographic conditions [12,13]. These occurrences are a component of a larger climate system that affects ocean conditions, fishery distribution, SST changes, and ocean currents.
The grey mullets (Mugilidae), which are strongly euryhaline, are typically considered marine migrants. They are the most prevalent species in estuary fish communities across tropical to temperate regions [14]. Mullets often reproduce in offshore areas, and their larvae are carried by tidal currents. As they grow, the juvenile mullets go into estuaries to obtain food and refuge until they achieve sexual maturity [15]. These fishes are referred to as estuary-related or estuarine-dependent because they rely on an estuarine habitat during their life cycle [16]. The global distribution and temporal patterns of juvenile mullets in estuaries and other ecosystems have been extensively studied [17,18,19]. Similarly, the occurrence of adult mullets in these areas has been researched by [20,21]. The researchers [22] identified temperature and salinity preferences as the main factors that influence the species mix and abundance of fish. Adult grey mullet typically migrate throughout the breeding season in various regions around the world. These migrations involve mature adults moving from their coastal feeding sites to the open sea, where they spawn [23].
Spatial distribution models (SDMs), which are alternatively referred to as habitat models, ecological niche models, and bioclimatic envelopes, are extensively employed in the evaluation of species-oceanography associations [24]. Spatial distribution models (SDMs) are mathematical models utilized for the purpose of predicting the distribution patterns of a species within its surrounding environment. Algorithmic representations are employed to accurately depict the natural habitats of these species. According to Lee et al. (2020) [25], arithmetic and geometric mean models, which rely on the habitat suitability index (SI), possess some drawbacks. These disadvantages include sensitivity to outliers, inapplicability to zero and negative values, and unsuitability for modelling exponential development. The use of statistical regression models, artificial intelligence models, and classification and regression tree models has been greatly augmented due to developments in technology [26]. The latest models offer enhanced adaptability, precise forecasting, and the ability to handle extensive datasets, outperforming prior methods in terms of effectiveness [27]. In recent years, ensemble methods such as core bagging, boosting, and stacking have garnered significant attention due to their enhanced performance compared to single-algorithm models. By including bias, these models mitigate prediction error variation, resulting in more resilient and precise predictions compared to individual models [28].
Grey mullet (Mugil cephalus L.) is found in the tropical and temperate zones spanning from 42° N to 42° S. This species holds significant importance for the coastal fisheries of Taiwan [29]. As a result, the indigenous population refers to it as the “Grey Gold”. The suitability of grey mullet roe as a delicacy in Taiwan and Japan has been observed in several studies. Khemis et al. (2019) [30] assert that the ingestion of this particular species confers advantageous effects on human health due to its substantial nutritional composition. Additionally, it has the potential to improve the sediment quality in agricultural systems that involve the cultivation of many crop varieties [31]. However, the grey mullet population in Taiwan has seen adverse consequences due to overfishing and alterations in weather patterns, leading to a decline in the overall capture of this particular species [32,33]. As per the Sustainable Development Goal (SDG) 14 set forth by the United Nations [34], it is imperative to safeguard and responsibly utilized the oceans, seas, and marine resources. In line with this objective, the Taiwan Fisheries Agency has implemented a range of policies and regulations [35,36,37]. Sustainable development is a concept that prioritizes the achievement of equilibrium among economic progress, human advancement, and ecological preservation. Sustainable use and ocean protection are two objectives outlined in Sustainable Development Goal 14. These objectives encompass the cessation of overfishing, the preservation of marine ecosystems, and the mitigation of ocean acidification and marine pollution. One of the primary goals of sustainable fishing is to ascertain the extent to which global fish populations have been subjected to overfishing, complete exploitation, or remain unaffected [38]. The sustainability of a fish supply is compromised when it is partially or completely depleted, either due to overfishing or other factors. Therefore, it is imperative to gain a full understanding of the habitat preferences and ranges of grey mullet and other species in order to effectively safeguard their sustainability.
The present study proposed a hypothesis that the distribution of grey mullet in the Taiwan Strait is greatly affected by oceanographic circumstances. The primary objective of this study was to investigate the influence of distinct oceanographic conditions on the distribution patterns of grey mullets in the Taiwan Strait.
2. Materials and Methods
2.1. Data Collection
The logbook data pertaining to the Taiwanese gill net fishery for grey mullet in the western waters of Taiwan, within the geographical coordinates of 119–121.5° E and 21.5–26° N, were obtained from the Fisheries Agency, Ministry of Agriculture, Taiwan. The research was conducted between January 2014 and December 2020. The data were systematically arranged into grid cells of 0.1° × 0.1° and subsequently categorized by month. The dataset comprised various variables, namely the fishing date (year and month), fishing location (latitude and longitude), catch (measured in kilograms), fishing effort (measured in hours), aggregate weight of the catch (without any differentiation between dry and wet weights), fishing gear employed, and vessel tonnage. The nominal catch per unit effort (N.CPUE) for a 0.1° × 0.1° grid cell was determined using the catch–effort relationship, as follows:
where ∑Catch and ∑Fishing effort refer to the total catch number and total fishing effort made by fishing vessels within the 0.1° × 0.1° fishing grid per month, respectively.
Six oceanographic parameters, namely sea surface temperature (SST), sea surface height (SSH), sea surface salinity (SSS), mixed-layer depth (MLD), ocean current velocity (CV), and sea-surface chlorophyll-a concentration (Chla), were used in the study region from the Copernicus Marine Service database. The environmental data were resampled to a spatial resolution of 0.1° and then matched with the fishery data by using MATLAB (2022a) through linear interpolation. Table 1 presents the sources and specifications of oceanographic parameters.

Table 1.
Oceanographic factors derived from various sources, each with specific specifications.
2.2. Grey Mullet N.CPUE Standardization
There are several factors that contribute to the presence of bias in fishing data, such as spatial and temporal considerations, which often result in the provision of inaccurate or incomplete information. Therefore, the standardization of fishery data is imperative in order to guarantee the quality and precision of the data [39]. Thus, in this study, we implemented a Generalized Linear Model (GLM) that incorporated spatiotemporal components (latitude, longitude, year, and month) and interactions (spatial * temporal) to standardize the N.CPUE of grey mullet. The “glm” function from the “glm” package [40] was employed for the analysis in R (version 4.2.3). We developed GLMs (stat package) for N.CPUE standardization as follows:
Interactions used: year × latitude, year × longitude, and latitude × longitude. Only standardized catch per unit effort (S.CPUE) values were used in subsequent analyses.
2.3. Assessment of Oceanographic Importance
The GAM model is popular in fishery science for examining multiple variables without linear assumptions. It investigates environmental fluctuations and capture rates by analyzing temporal, spatial, and environmental factors affecting primary catch species, identifying correlations and estimating changes [38]. Individual GAM models with single environmental conditions were constructed (total six GAM models) to determine the importance of oceanographic factors for the grey mullet S.CPUE. Environmental conditions showed at least a deviance explained of more than 10% were only selected for the models construction. GAM was developed by employing the “mgcv” (“gam” function) packages in R-studio (version 4.2.3) [38]. The mode structure is as follows:
where ξ is the residual term, ξ~N (0, σ2), and Xi is the independent variable, including time, space, and hydrological environment factors. Imporatnce of oceanographic conditions was ranked based on three indices, namely akiake information criterion (AIC), deviance explained in %, and generalized cross validation (GCV) values. Environmental condition with the highest deviance explained value and with least AIC and GCV values was considered as the optimal condition.
2.4. Oceanogrpahic Preferences of Grey Mullet
In order to gain a deeper understanding of the grey mullet’s preferred range of oceanographic circumstances, an investigation was conducted to examine the association between the grey mullet S.CPUE and selected oceanographic parameters. Suitability index (SI) curves were constructed for each selected oceanographic factor using summed grey mullet S.CPUE data by smoothing spline regression [41]. The regression study utilized the S.CPUE as the dependent variable, whereas the chosen oceanographic components were employed as explanatory variables. The observed value of SI (between 0 and 1) is calculated with a normalized function. The method is: all frequency distribution values are subtracted from the minimum value and divided by the maximum frequency distribution value (i.e., normalized). The formula is as follows:
is the simulated CPUE; are the maximum and minimum values of the simulated CPUE, respectively. The establishment of a SI empirical model can describe the relationship between a single environmental factor and fishery activities. Its calculation formula is:
where m represents environmental variables, such as surface water temperature, surface salinity and chlorophyll concentration. α and β are the solutions of the least-squares method corresponding to each observation of the SI function [42].
2.5. Grey Mullet Habitat Distribution
Two very common empirical HSI models—the arithmetic mean model (AMM) [43,44,45] and the geometric mean model (GMM) [43,44,46]—were employed to evaluate habitat preferences [32,33,36]. The SI values of each environmental factor were introduced into these two models [36,37,38]. HSI was assumed to have a univariate value range between 0 and 1 [39]. The AMM and GMM empirical HSI models were calculated as follows:
where SIn is the SI for nth environmental factors, and m is the number of environmental factors inserted into the model. The selected environmental conditions were applied in all possible combinations to construct empirical habitat models. The performance of the HSI models were evaluated, and the model with the lowest Akaike’s information criterion was selected as the optimal one. Finally, the spatial distribution of HSI values was determined using the selected HSI model and mapped using ArcGIS (version 10.2) software to predict potential habitats; these data were then compared to standardized CPUE data. The least and best habitat preference are indicated by 0 and 1.
3. Results
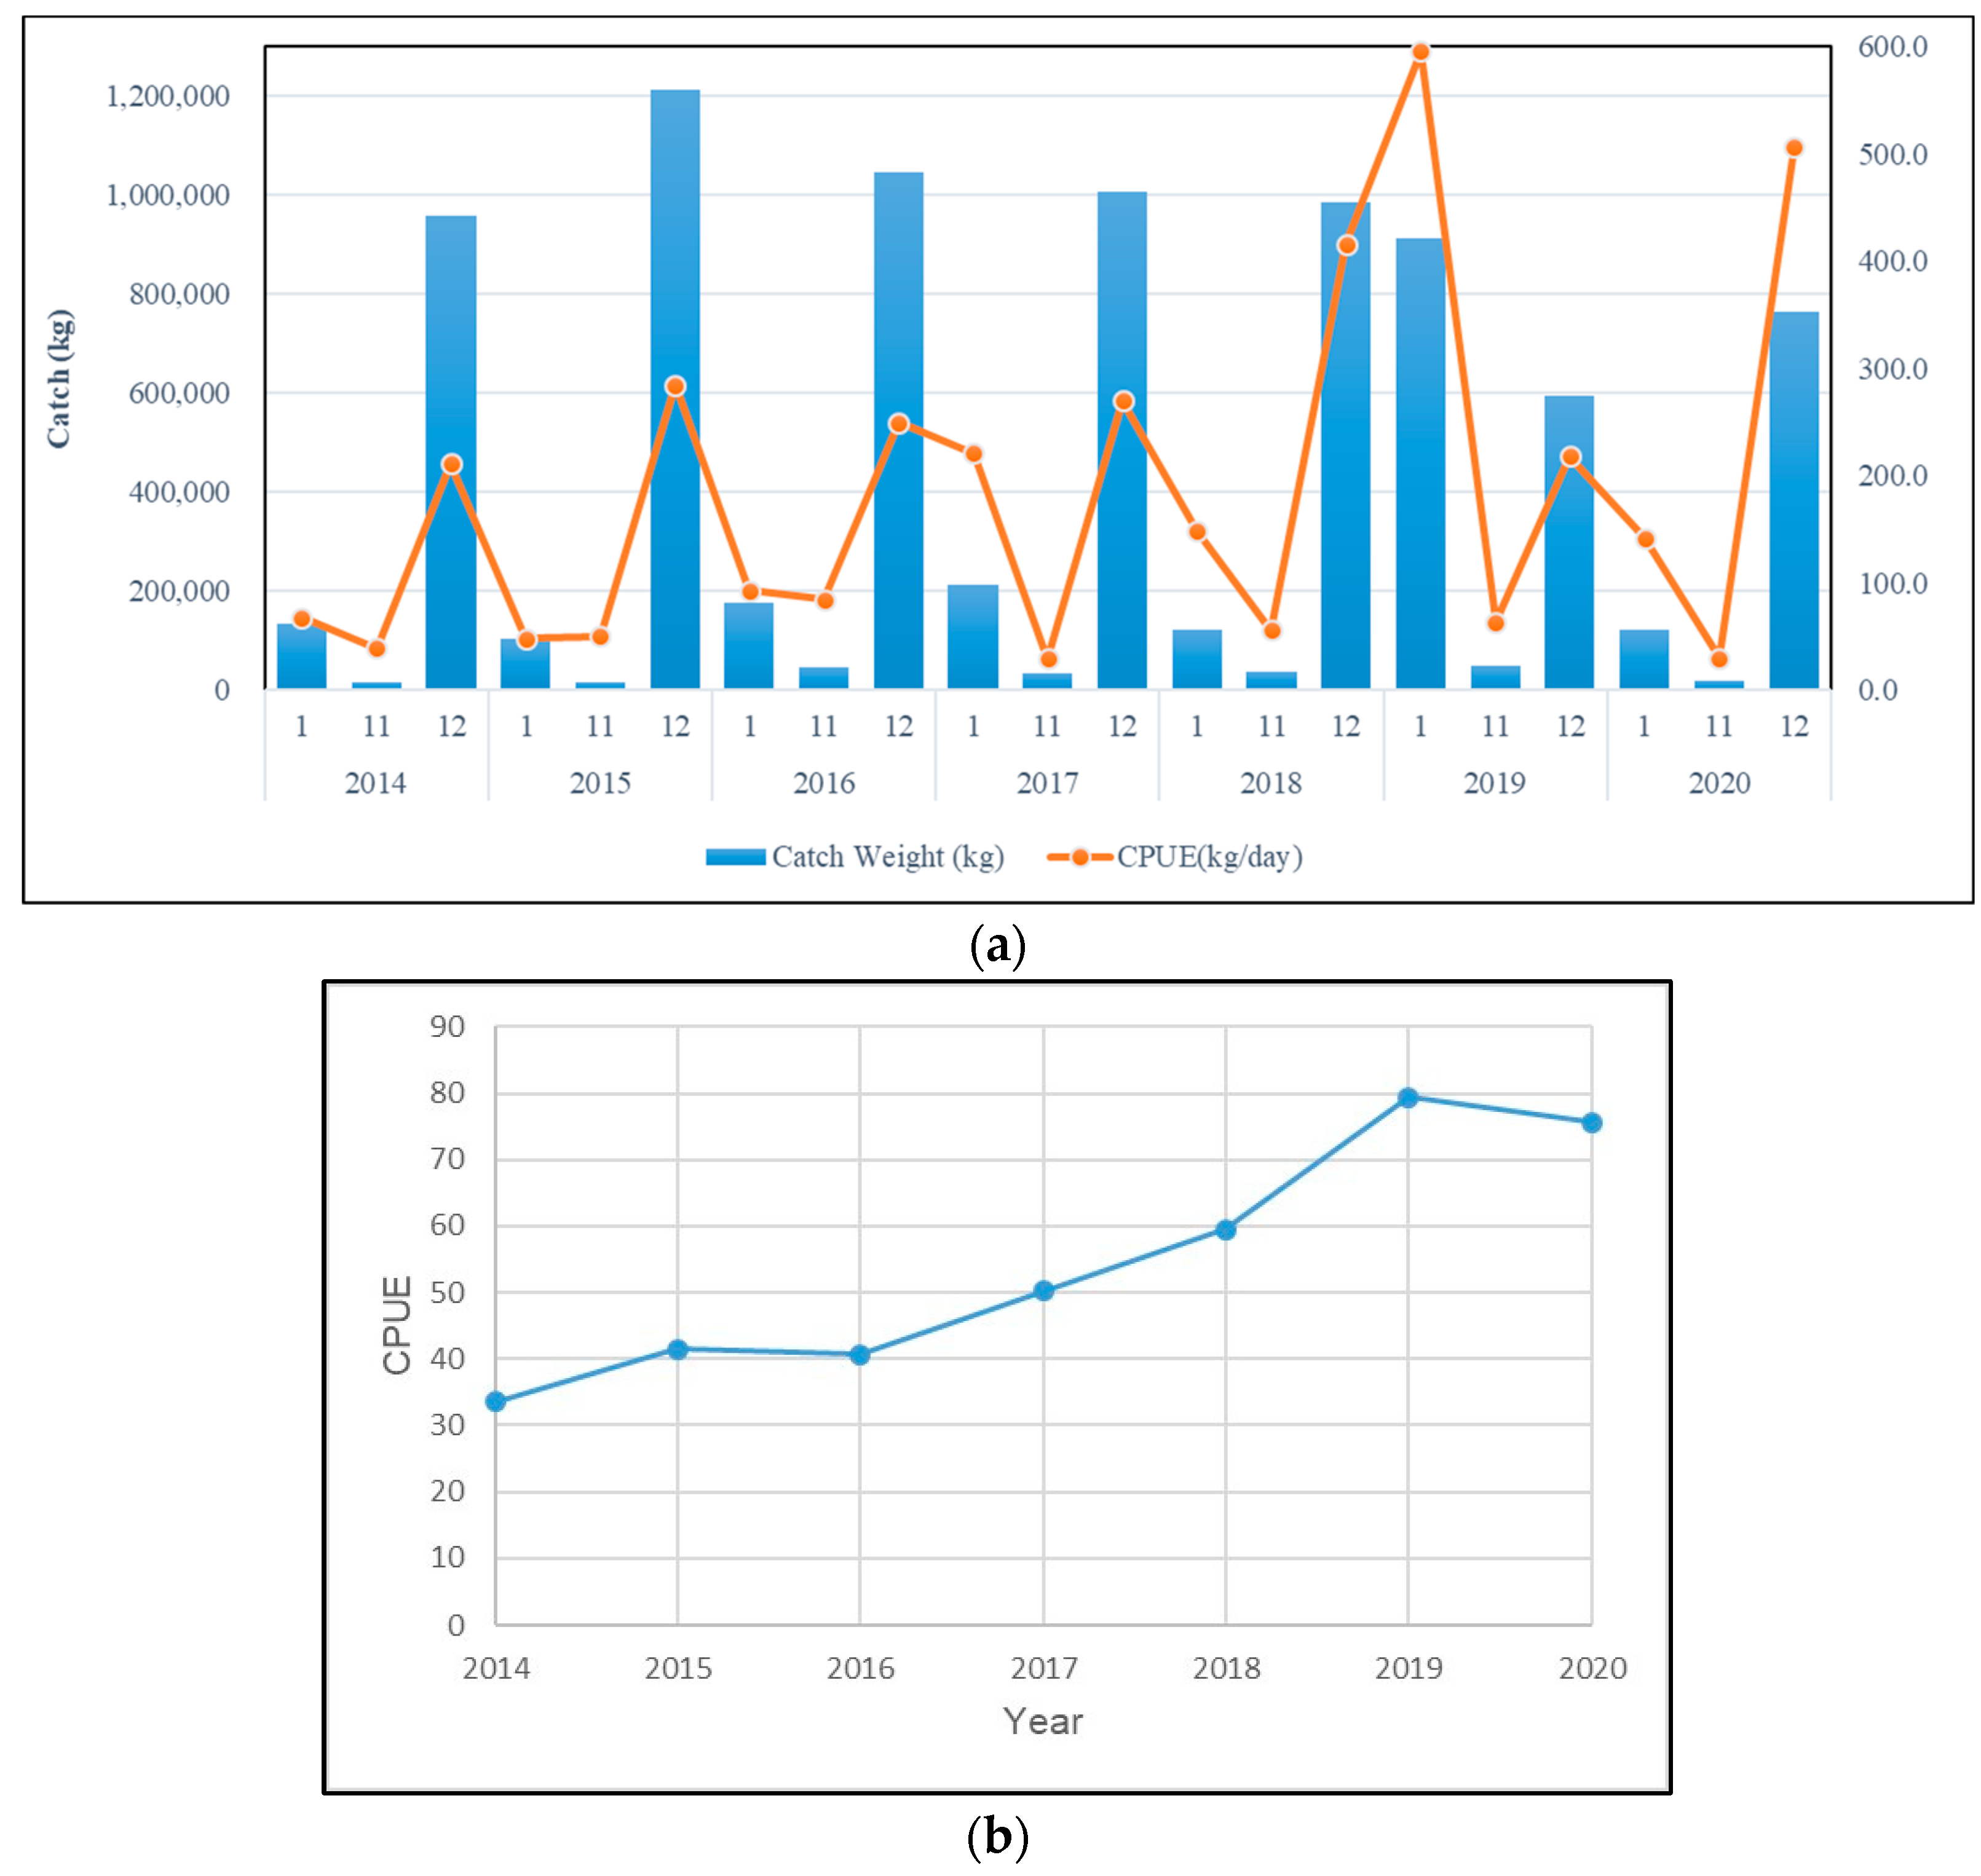
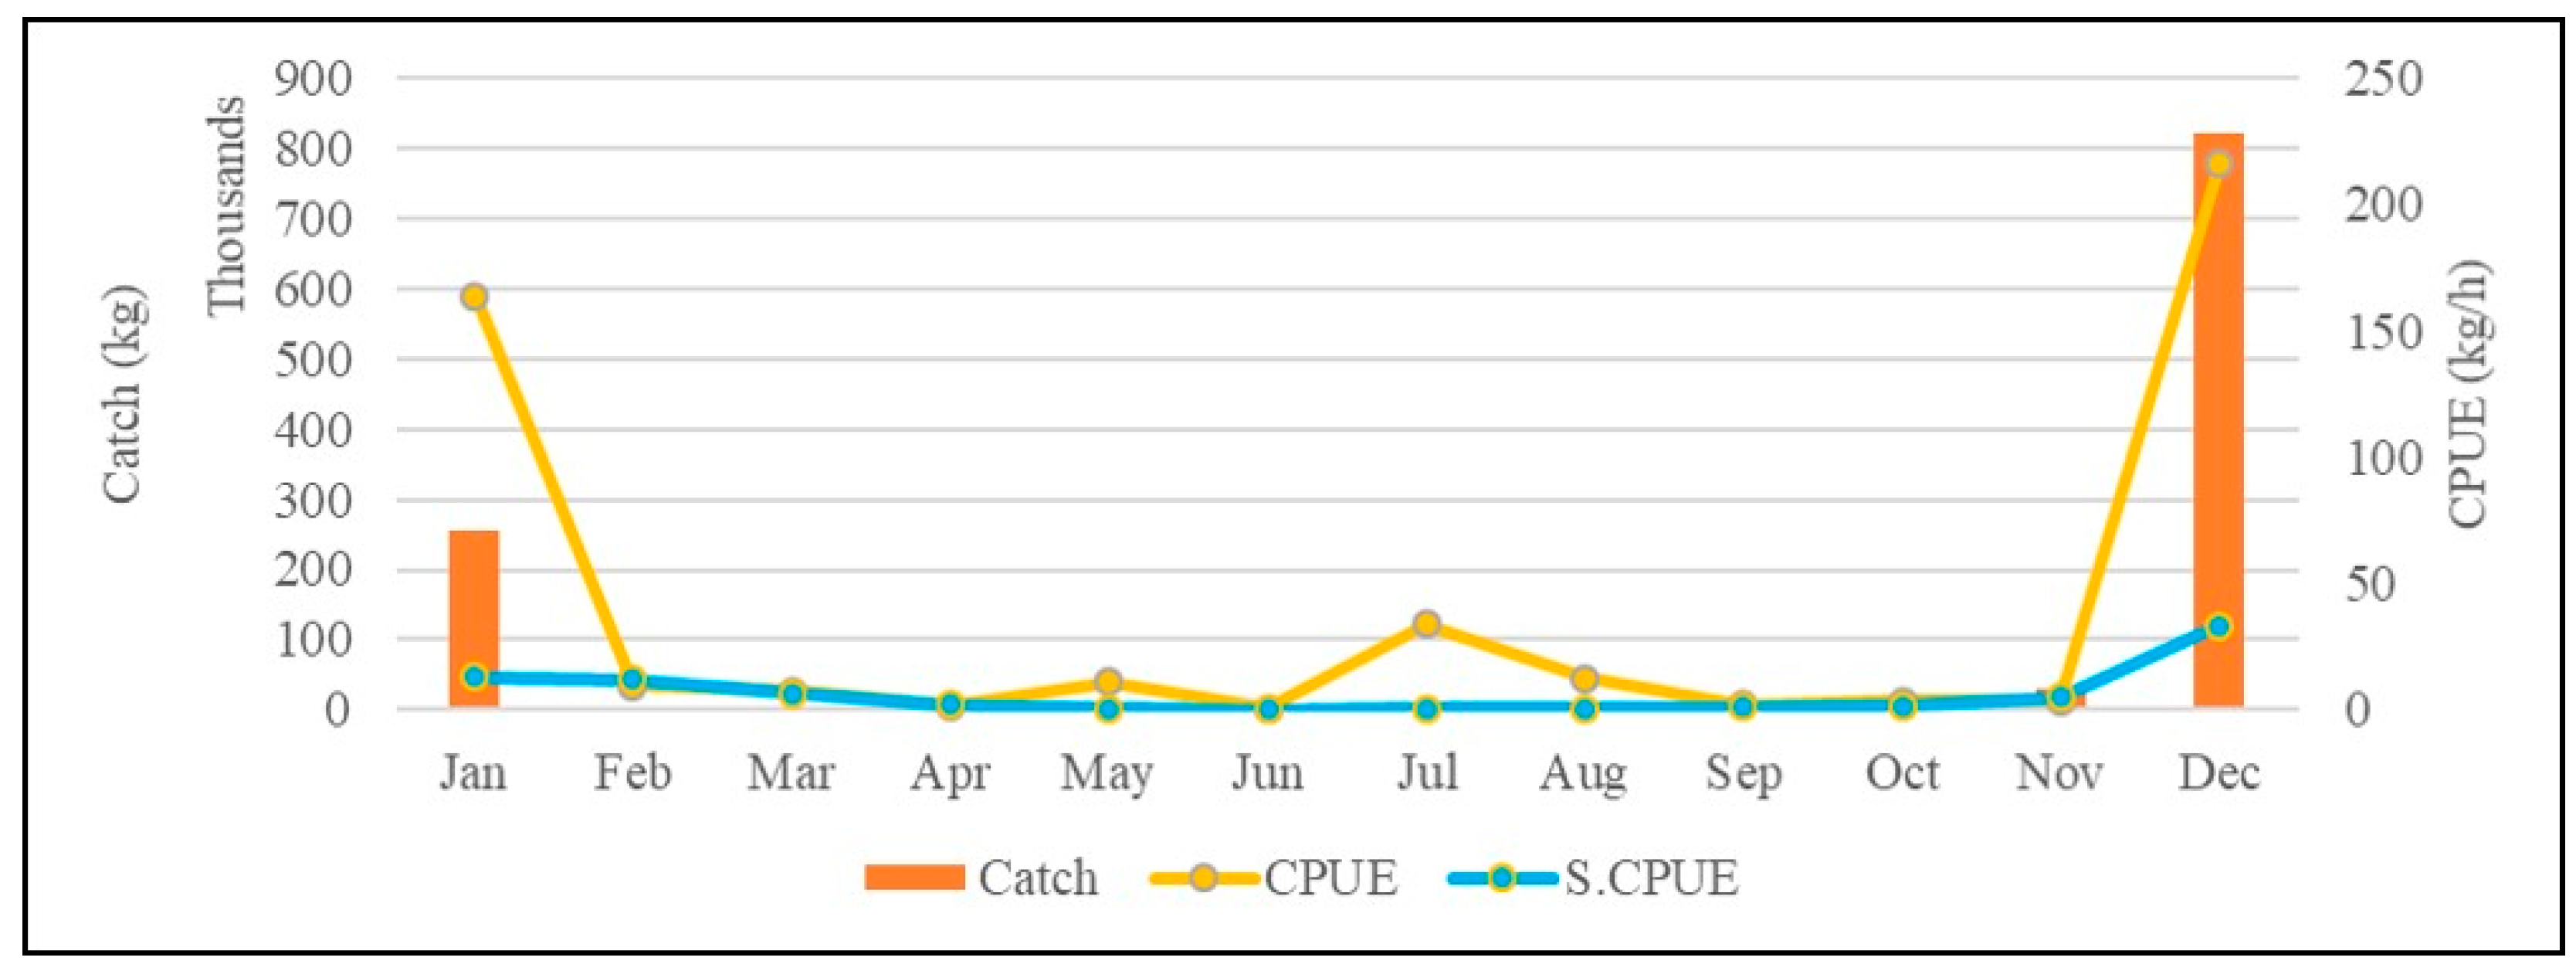
From the annual change chart (Figure 1), it can be seen that the catch of mullet is mainly concentrated around December, and from the passage of months in each year, the monthly catch and the CPUE of this species change significantly. The monthly catch of mullet ranges from approximately 1.21 million kilograms (December 2015) to approximately 760,000 kg (December 2020), and the highest and lowest CPUE values of this species from November to January are, respectively, approximately 595.6 kg/day (January 2019) and 29.3 kg/day (November 2017) (Figure 1a). Only the standardized CPUE of grey mullet was used for the analysis (Figure 2). Since the mullet fishing season in western Taiwan waters is around the winter solstice, we can see the average monthly catch and CPUE changes in mullet (Figure 2). The analysis results show that the catch of this species starts at the beginning of the fishing season (November) approximately 30.119 kg, and reached the highest production in December (approximately 822.788 kg), and then gradually drop to approximately 254.455 kg at the end of the fishing season in January; the mullet catch fall between approximately 807 and 1586 kg during the non-fishing season. At the same time, the CPUE of this species falls between 0.6 kg/h and 7.4 kg/h during the non-fishing season. But when entering the fishing season (December), approximately 216 kg can be caught per hour, and then drop to approximately 164 kg/h in January. Yearly, the highest and lowest grey mullet CPUE were observed in 2019 and 2014, respectively (Figure 1b).
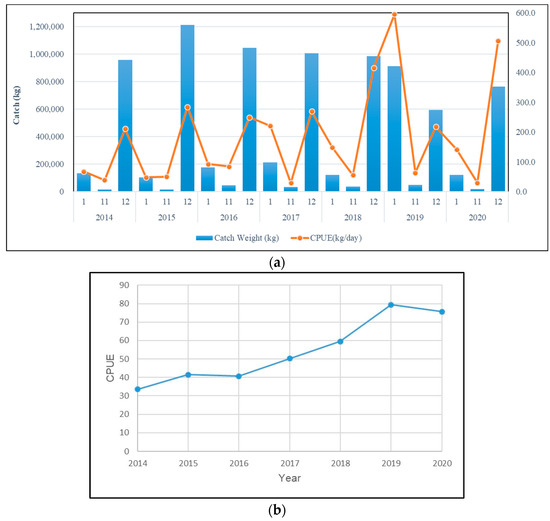
Figure 1.
(a) Monthly catch and CPUE changes in mullet in western Taiwan waters from 2014 to 2020 and (b) yearly catch and CPUE changes in mullet in western Taiwan waters from 2014 to 2020.

Figure 2.
Average monthly catch and CPUE changes in mullet in western Taiwan waters from 2014 to 2020.
3.1. Oceanographic Importance
The significance of oceanographic parameters for the grey mullet S.CPUE based on AIC, GCV, and deviance explained values is showed in Table 2. Based on these values, SSH (AIC = 27,821, GCV = 1.221, and deviance explained = 21.8%) was the most significant predictor of the grey mullet S.CPUE. Furthermore, SST (AIC = 27,829, GCV = 1.278, and deviance explained = 19.4%) was the second most important oceanographic parameter, followed by MLD (AIC = 27,842, GCV = 1.297, and deviance explained = 17.3%). Current, salinity, and Chla showed deviance explained less than 10%, thus, omitted from the models construction. Impact of various oceanographic condition on the grey mullet fishery is showed in Figure 3.
Table 2.
Importance of the oceanographic conditions from GAM analysis. Bolded ones are the selected ones.
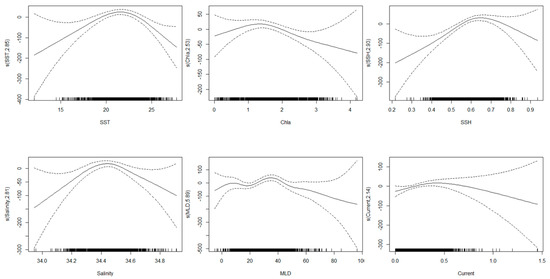
Figure 3.
Partial response plots for the environmental effects on the grey mullet S.CPUE. The relative density of data points is marked by the “rug” on the x-axis. The “s” sign on the y-axis indicates the smooth function used to fit the models, with the degrees of freedom in parentheses. Dashed lines represent the 95% confidence intervals.
3.2. Oceanogrpahic Preferences of Grey Mullet
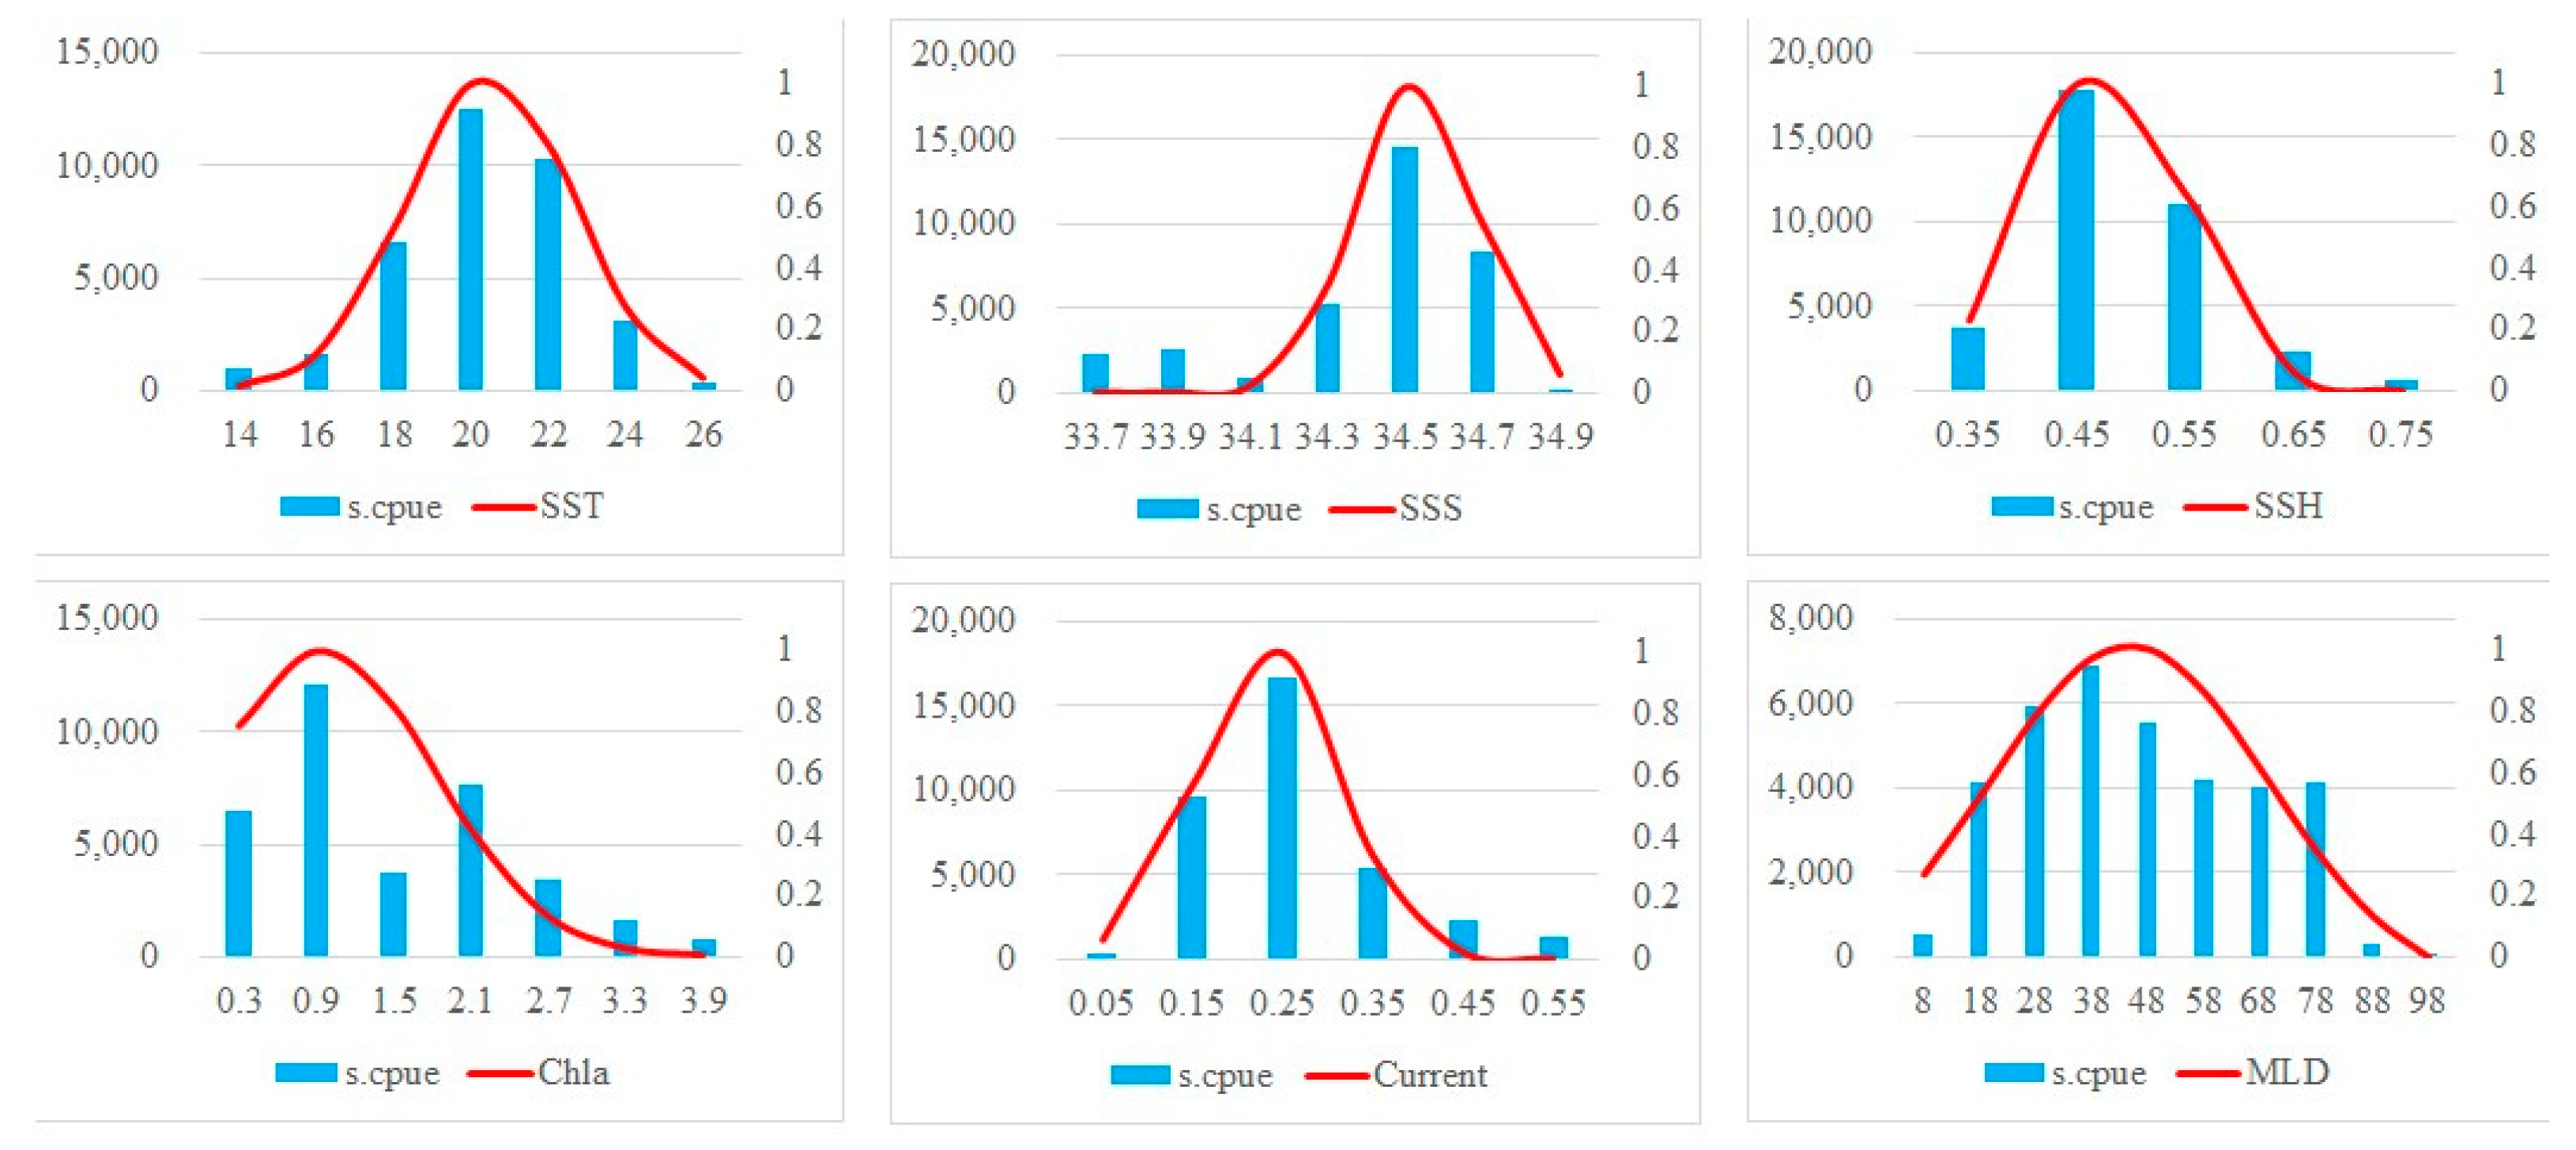
Figure 4 illustrates the preferences of grey mullet for all the oceanographic parameters. The optimum ranges of SST, Chla, Salinity, SSH, MLD and current as indicated by SI > 0.6, were 19 °C–23 °C, 0.5–1 mg/m3, 33.4–34.6 psu, 0.4–0.5 m, 18–68 m, and 0.17–0.31 m2/s2, respectively. The grey mullet S.CPUE peaked in regions with the summed SST, Chla, Salinity, SSH, MLD and current values being 20 °C, 0.9 mg/m3, 34.5 psu, 0.45 m, 18–38 m, and 0.25 m2/s2, respectively. Therefore, the oceanographic conditions for grey mullet within the study area remained favorable throughout the study period.
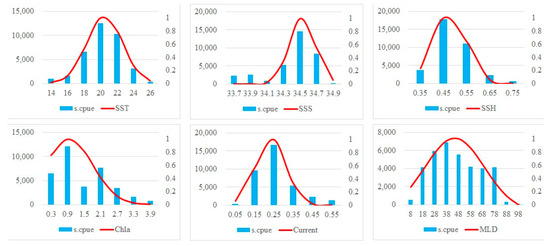
Figure 4.
Present oceanographic suitability for grey mullet during the study period. The blue solid bars and red solid line indicates the S.CPUE and SI, respectively. Left and right y axes indicate the summed S.CPUE and SI, respectively. X-axis indicated environmental values.
3.3. Grey Mullet Distribution
The models incorporating all three environmental conditions (SST, SSH, and MLD) demonstrated superior performance in both AMM and GMM techniques, as indicated by the lowest AIC and highest adj. R-squared values. The AMM- and GMM-generated full model exhibited similar R-squared values of 0.948 and 0.905, respectively (Table 3). Therefore, only the GMM-derived habitat model incorporating SST, SSH, and MLD was utilized for the ultimate habitat prediction.
Table 3.
Performance of various combinations of habitat models. Bolded ones are the final selected models for habitat distribution.
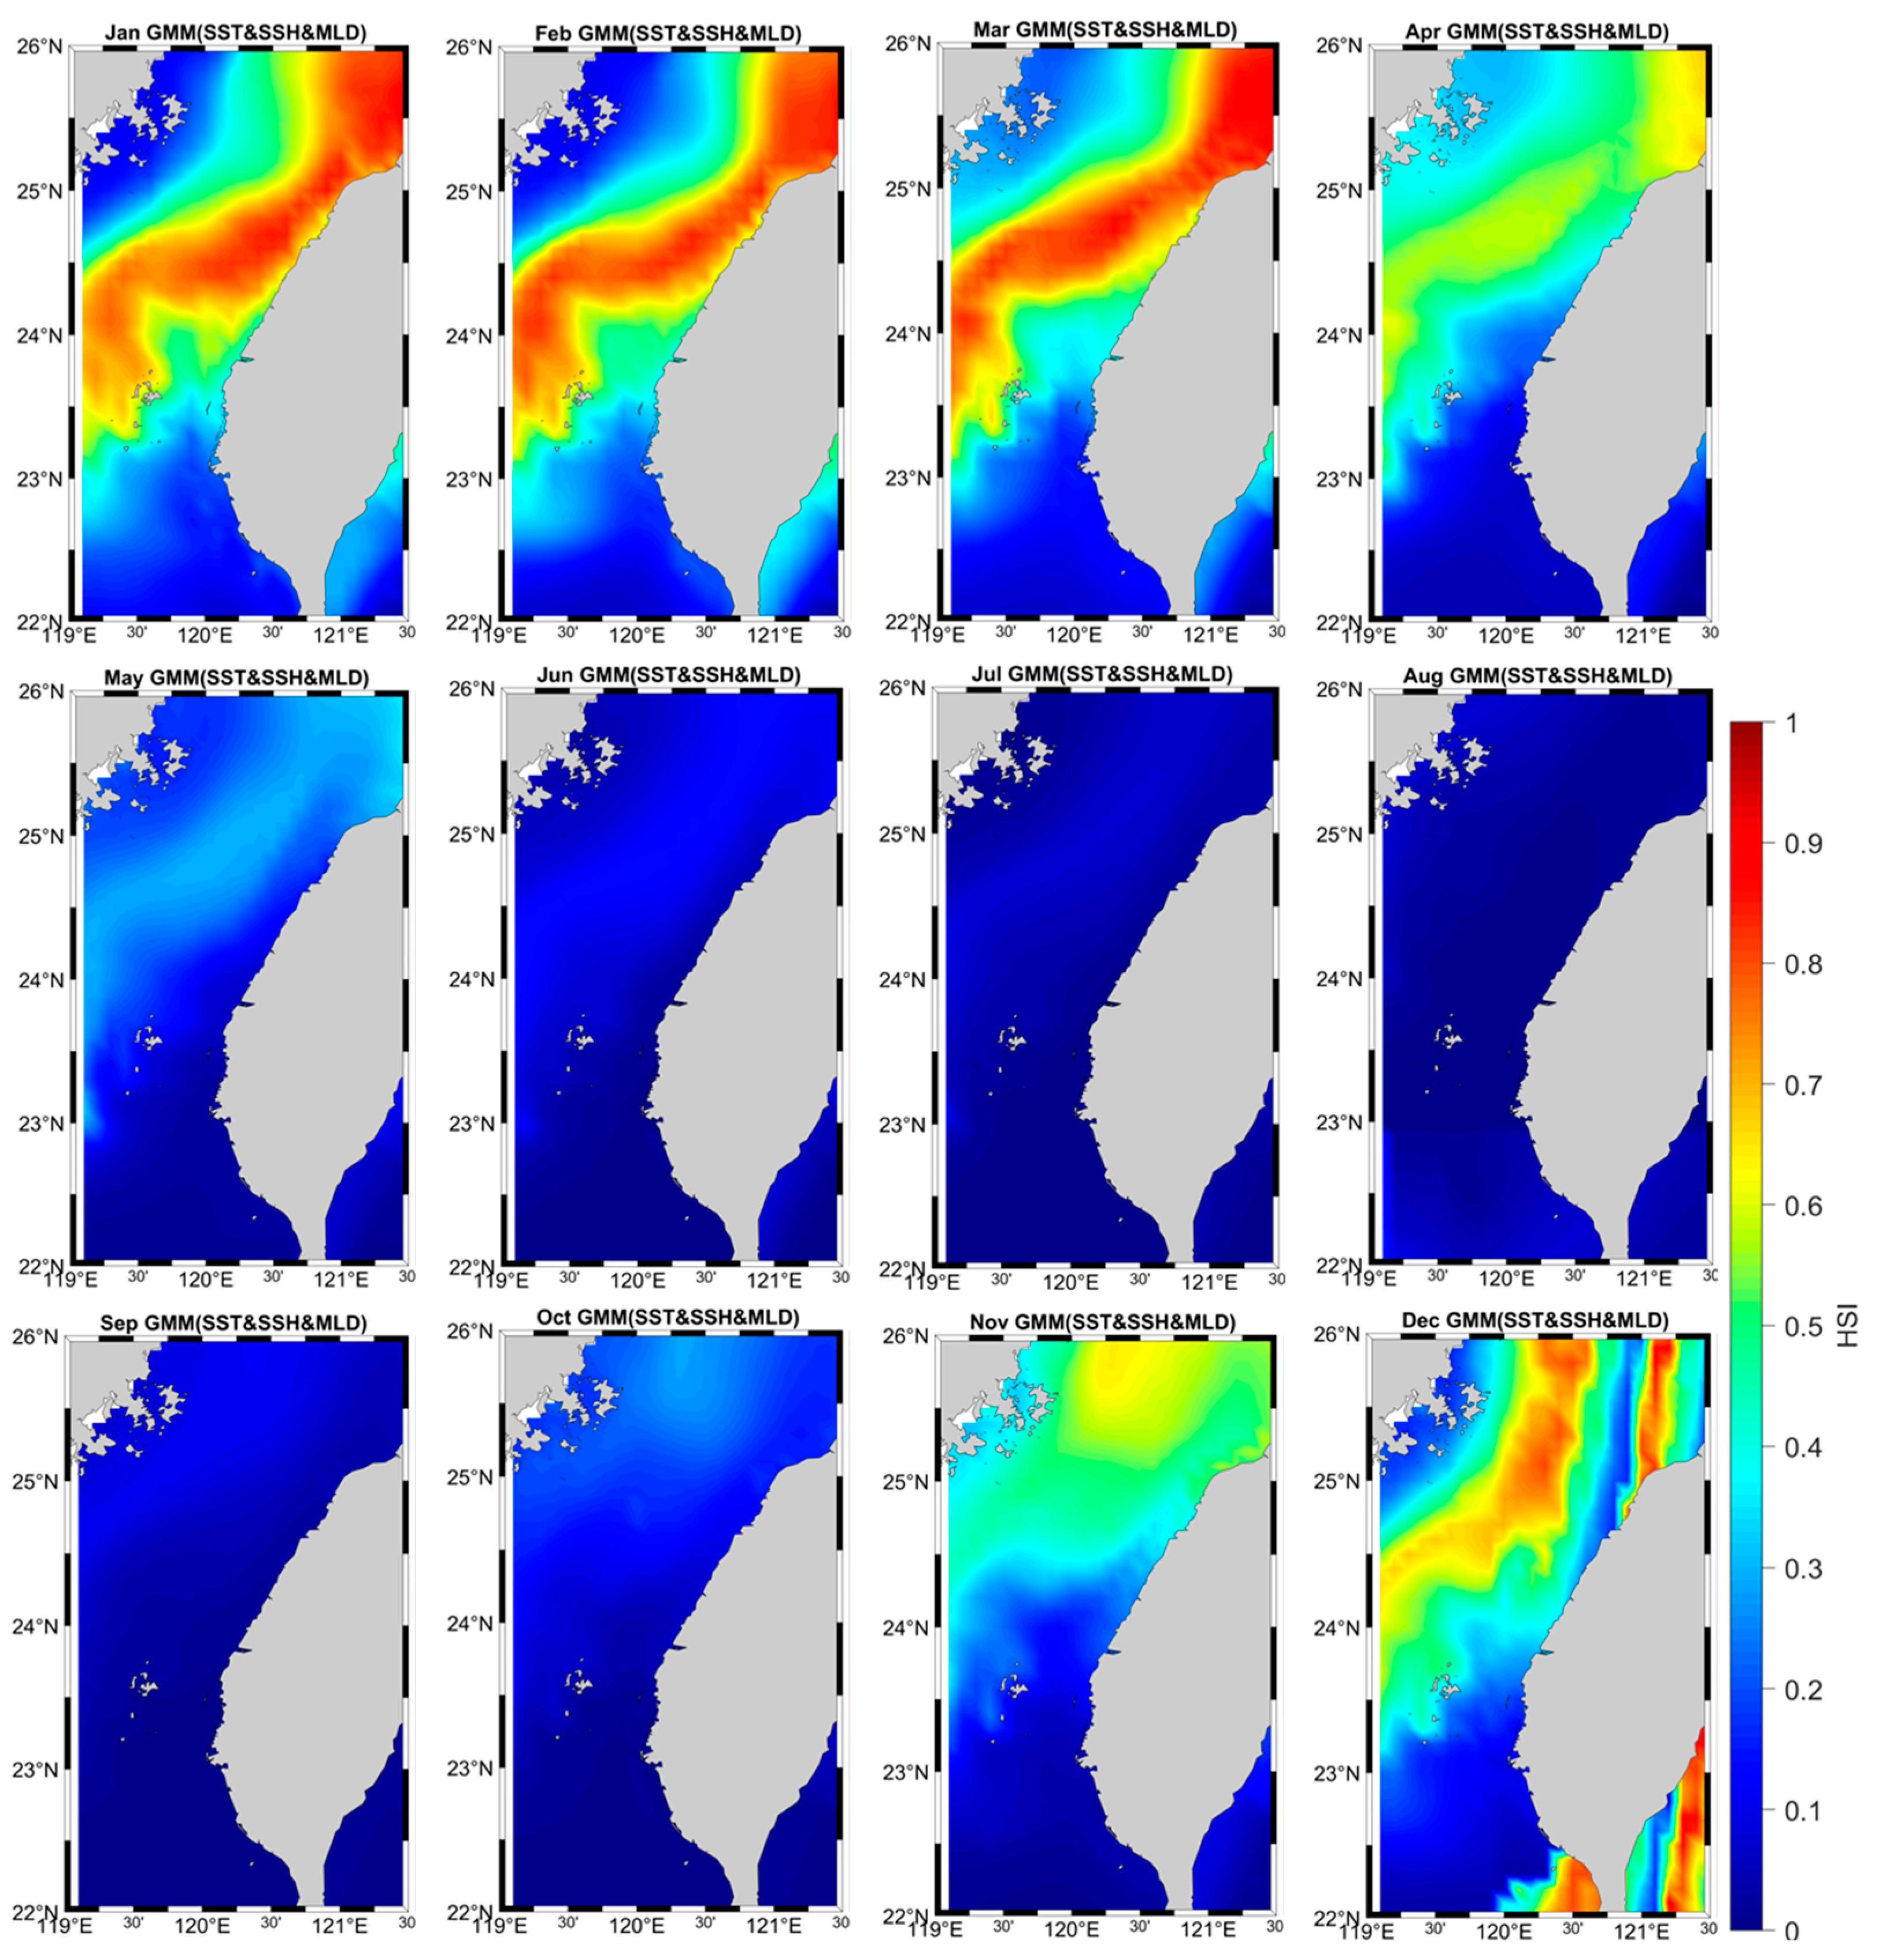
From the monthly HSI distribution results, it can be seen that the winter period is suitable for grey mullet to reproduce and grow. Starting from late October, HSI increased in the northern Taiwan ocean. HSI distribution continued to increase and spread throughout November and December, concentrating north and mid-ocean west of Taiwan (Figure 5). In January and February, HSI peaks and is closest to coastal Taiwan. Starting from March, the high HSI distribution area moves away from the coast and gradually decreases in April. During the summer (from May), the HSI index becomes very small because the high temperature is not suitable for growth of mullet.

Figure 5.
Grey mullet distribution in the waters of Taiwan during the study period depicted by the GMM-derived model with SST, SSH, and MLD.
4. Discussion
4.1. Yearly Catch Variability
The present study observed the catch per unit effort (CPUE) of grey mullet in two distinct areas. In 2016, the capture of grey mullet exhibited a declining pattern, which could be attributed to the occurrence of an El Niño phase following a period of neutral ENSO phase in 2014–2015. Prior research has indicated that El Niño occurrences have a negative impact on fish catches mainly due to their disruption of the usual ocean current and temperature patterns [47,48,49,50,51,52,53]. This disruption leads to a decrease in the upwelling of cold, nutrient-rich water, which is crucial for the marine food chain [54]. In areas such as the western Pacific, this disturbance results in a reduced availability of nutrients for phytoplankton, which are the foundation of the food web [55]. Consequently, this leads to a decline in populations of fish and other marine organisms.
The period from 2017 to 2020 experienced a neutral ENSO phase, which could potentially explain the rise in catch following a warming phase in 2016. During a neutral ENSO phase, which happens when neither El Niño nor La Niña conditions are present, the oceanic conditions become more stable and predictable, which is beneficial for marine productivity [56]. During this phase, there are consistent upwelling processes that occur without the severe disturbances induced by El Niño or the excessive nutrient flow of La Niña. As a result, there is an ideal amount of nutrients available in the surface waters [57]. The presence of stability in the marine ecosystem fosters a state of health and equilibrium, ensuring the maintenance of food chains from plankton to larger fish species [58]. Consequently, this leads to a notable rise in fish catches. Under these conditions, fish populations flourish, resulting in increased abundance and accessibility of fish. This, in turn, improves catch rates and contributes to the growth of local economy.
4.2. Grey Mullet Distribution
According to Naimullah et al. (2020a) [59], the presence of the Kuroshio Current and coastal currents has contributed to the enhancement of species diversity and productivity in the waters next to Taiwan. The Taiwan strait (TS), situated in the tropical to subtropical western Pacific, is influenced by three significant currents: the Kuroshio Branch Current (KBC), the China Coastal Current (CCC), and the South China Sea (SCS) Current. The fishing grounds and marine habitats of the East China Sea and South China Sea, which are adjacent to the Taiwan Strait to the north and south, respectively, are impacted by these currents [60]. The KBC system creates a conducive environment for the cultivation of diverse species in the TS region. According to Shiah et al. (2000) [61], the CCC provides a neritic water mass characterized by low salinity and temperature, while exhibiting a high nutrient content due to its proximity to the rivers of the Chinese mainland. Despite common belief, the KBC, originating from the Kuroshio Current, exhibits elevated salinity and temperature, as well as a nutrient concentration similar to that of the CCC [62]. These qualities give rise to a water mass that possesses physical attributes that are different from those of the adjacent water. The distribution of grey mullet is influenced by various properties, including temperature and salinity. The observed pattern suggests that throughout the summer season, both South China Sea Water and Kuroshio Branch Water exhibited a northward invasion. The mean summer current on the eastern side has the potential to attain a velocity of 90 cm/s. During the summer season, the southwest monsoon typically has a value below 0.025 N/m2. According to Jan et al. (2002) [63], a stream travelling at a velocity of 90 cm/s cannot be propelled by a wind force that is inadequate. Consequently, instead of being influenced by local winds, a substantial portion of the circulation must be driven by remote forcing that originates on a vast scale. The implementation of extensive forcing is designed to induce a northward flow of waters in the northern South China Sea, facilitating their entry into the East China Sea via the Taiwan Strait. The windward Kuroshio Branch Current on the eastern side is influenced by remote factors during winter, while the China Coastal Current on the western side is influenced by the northeast monsoon. This could potentially explain the increased occurrence of grey mullet on the northeast coast from September to January.
Furthermore, both the KBC and the CCC play a role in the process of upwelling. According to Naimullah et al. (2020b) [64], the lower current in the TS exhibits an upward flow direction from the continental slope, whereas the surface current is predominantly influenced by wind. Furthermore, intermittent water injections from the Kuroshio Current are observed on the eastern side of the TS. The aforementioned phenomenon of upwelling induces the upward movement of water that is rich in nutrients and typically cold in temperature. The nutrients facilitate the process of fertilization in surface waters, hence promoting a significant level of biological productivity. As a result, these fertilized TS zones have the potential to function as optimal fishing sites for grey mullet. In addition to its hydrological nature, upwelling exerts a significant impact on the ecological system. According to Tang et al. (2002) [65], the Taiwan Bank upwelling and Dongshan upwelling zones are well aligned with fishing areas on the west coast during the summer. This alignment may explain the higher occurrence of grey mullet on the south-west coast near Taiwan Bank during the summer season.
Lastly, the bottom in the subsea region is complex. Tidal currents are influenced by the morphology of the seabed and the presence of capes, resulting in the formation of anticlockwise eddies [66]. According to Lin et al. (2005) [67], the topographic profile of Taiwan Strait reveals a shelf-like terrain extending from the northwest to the southwest region. The western region of Taiwan exhibits a higher tidal amplitude, which has been identified as a favorable fishing area in the current study. Tidal currents transport high chlorophyll concentrations from the estuary to the ocean current, where they attract secondary producers such as fish, crabs, and mollusks. This process facilitates the harvesting of grey mullet.
4.3. Implementation of This Study
Habitat models can facilitate the identification of fishing grounds that are underutilized or just partially utilized. Nevertheless, the potential for overfishing to occur as a consequence of simplifying the identification of fishing sites underscores the significance of the Sustainable Development Goals (SDGs). The implementation of SDG 14 has initiated deliberation over the well-being of the ocean and its significance for the plane’s future [68]. The conservation is the most crucial factor in this context. Conservation measures can be implemented in areas that have been excessively exploited, and habitat models can be utilized to initially determine the distribution zone of a specific species. An evaluation of the condition of these high or low catch zones can be conducted by assessing the stock in areas that are either overexploited or underexploited. The SDGs aim to tackle significant challenges that pose a danger to ocean resources, including overfishing and climate change. However, achieving these goals necessitates a focus on the socioeconomic aspects of ocean politics and the unique perspectives of the least developed countries and tiny island states. Since their implementation, the SDGs have gained institutional support [69,70]. An examination of the habitat of grey mullet in the TS has the potential to enhance the implementation of sustainable management strategies for the species. The main objective of SDG 14.4 is to achieve fish stock levels that are biologically sustainable. Habitat modelling can be essential for defining the habitat of grey mullet in the TS, which is critical for achieving this goal. Furthermore, SDG 14.5 specifically targets the preservation of coastal and marine regions. In order to enhance the sustainability of fish stocks, it is possible to designate highly fished areas as protected zones by implementing temporary fishing prohibitions. SDG 14.6 advocates for the cessation of subsidies that support overfishing. To prevent overfishing, it is advisable to cease providing subsidies to fishing vessels that sail to less-exploited regions. The promotion of ocean sustainability and resource conservation can be facilitated by advancing scientific knowledge, conducting research, and facilitating the transfer of marine technologies. It is imperative for relevant policies to take into account the Criteria and Guidelines established by the Intergovernmental Oceanographic Commission (SDG 14.a), provide assistance to small-scale fisheries (SDG 14.b), and effectively enforce and uphold international maritime law (SDG 14.c). The initial stage in sustainability research may involve the modelling of species distribution or habitats. The significance of this work is evident, and we have chosen habitat modelling as the initial measure for achieving sustainable management of the black Pomfret fishery in Taiwan Strait.
5. Conclusions
The distribution patterns of grey mullet were investigated using habitat suitability models in this study. The primary determinant of grey mullet standardized catch per unit effort was found to be sea surface height (SSH). In addition, it is worth noting that sea surface temperature (SST) ranked as the second most significant oceanographic measure, with mixed-layer depth (MLD) ranking higher. The grey mullet S.CPUE reached their highest levels in areas with the combined SST, Chla, salinity, SSH, MLD, and current values of 20 °C, 0.9 mg/m3, 34.5 psu, 0.45 m, 18–38 m, and 0.25 m2/s2, respectively. Starting in late October, the levels in the northern Taiwan ocean exhibited a steady and continuous increase. In November and December, the distribution increased, with a specific emphasis on the northern and mid-ocean areas located to the west of Taiwan. HSI reaches its highest point in January and February, particularly in the coastal region of Taiwan. The distribution of high HSI exhibits a shift away from coastal areas and experiences a decrease in April. The results of this study will enhance comprehension of this particular species, and the methodology employed in this study may be relevant to other fishery populations as well.
Author Contributions
Conceptualization, S.-Y.T. and S.M.; methodology, S.-Y.T.; software, S.M.; validation, Q.-H.L., P.L. and M.-A.L.; formal analysis, S.M.; investigation, P.L.; resources, M.-A.L.; data curation, S.M.; writing—original draft preparation, S.M.; writing—review and editing, Q.-H.L.; visualization, L.G.K.; supervision, M.-A.L.; project administration, M.-A.L.; funding acquisition, M.-A.L. All authors have read and agreed to the published version of the manuscript.
Funding
This study received funding from the National Science & Technology Council of Taiwan (NSTC), under grant number NSTC 112-2811-M-019-004 and NSTC 112-2621-M-019-005.
Institutional Review Board Statement
Not applicable.
Informed Consent Statement
Not applicable.
Data Availability Statement
For access to the data used in this study, please contact the corresponding author via email (malee@mail.ntou.edu.tw).
Acknowledgments
We thank the anonymous reviewers and editors for their valuable comments and suggestions, as well as the team members of the Taiwan Fisheries Agency and National Science and Technology Council of Taiwan for their assistance in data preparation.
Conflicts of Interest
The authors declare no conflicts of interest. The funders had no role in the design of the study; in the collection, analyses, or interpretation of data; in the writing of the manuscript; or in the decision to publish the results.
References
- Guo, J.; Zhao, Z.; Cao, R.; Lv, X. Regional to global assessments of ocean transparency dynamics from 1997 to 2019. Prog. Oceanogr. 2023, 219, 103165. [Google Scholar] [CrossRef]
- Yashayaev, I.; Seidov, D.; Demirov, E. A new collective view of oceanography of the Arctic and North Atlantic basins. Prog. Oceanogr. 2015, 132, 1–21. [Google Scholar] [CrossRef]
- Mordy, C.W.; Bond, N.A.; Cokelet, E.D.; Deary, A.; Lemagie, E.; Proctor, P.; Stabeno, P.J.; Tabisola, H.M.; Van Pelt, T.; Wisegarver, E. Progress of fisheries-oceanography coordinated investigations in the Gulf of Alaska and Aleutian Passes. Oceanography 2023, 36, 94–100. [Google Scholar] [CrossRef]
- Hollowed, A.B.; Barange, M.; Garçon, V.; Ito, S.I.; Link, J.S.; Aricò, S.; Batchelder, H.; Brown, R.; Griffis, R.; Wawrzynski, W. Recent advances in understanding the effects of climate change on the world’s oceans. ICES J. Mar. Sci. 2019, 76, 1215–1220. [Google Scholar] [CrossRef]
- Heck, N.; Beck, M.W.; Reguero, B.; Pfliegner, K.; Ricker, M.; Prütz, R. Global climate change risk to fisheries-A multi-risk assessment. Mar. Policy 2023, 148, 105404. [Google Scholar] [CrossRef]
- Lam, V.W.; Allison, E.H.; Bell, J.D.; Blythe, J.; Cheung, W.W.; Frölicher, T.L.; Gasalla, M.A.; Sumaila, U.R. Climate change, tropical fisheries and prospects for sustainable development. Nat. Rev. Earth Environ. 2020, 1, 440–454. [Google Scholar] [CrossRef]
- Frawley, T.H.; Muhling, B.; Brodie, S.; Blondin, H.; Welch, H.; Arostegui, M.C.; Bograd, S.J.; Braun, C.D.; Cimino, M.A.; Farchadi, N.; et al. Dynamic human, oceanographic, and ecological factors mediate transboundary fishery overlap across the Pacific high seas. Fish Fish. 2023, 25, 60–81. [Google Scholar] [CrossRef]
- Fredston, A.L.; Cheung, W.W.; Frölicher, T.L.; Kitchel, Z.J.; Maureaud, A.A.; Thorson, J.T.; Auber, A.; Mérigot, B.; Palacios-Abrantes, J.; Palomares, M.L.D.; et al. Marine heatwaves are not a dominant driver of change in demersal fishes. Nature 2023, 621, 324–329. [Google Scholar] [CrossRef]
- Miah, M.G.; Islam, M.R.; Roy, J.; Rahman, M.M.; Abdullah, H.M. A changing coastal ecosystem: Cox’s Bazar in southeastern coastal region of Bangladesh. Environ. Dev. Sustain. 2023, 25, 6141–6165. [Google Scholar] [CrossRef]
- Wang, F.; Li, X.; Tang, X.; Sun, X.; Zhang, J.; Yang, D.; Xu, L.; Zhang, H.; Yuan, H.; Wang, Y.; et al. The seas around China in a warming climate. Nat. Rev. Earth Environ. 2023, 4, 535–551. [Google Scholar] [CrossRef]
- Molina-Valdivia, V.; Bustos, C.A.; Castillo, M.I.; Search, F.V.; Plaza, G.; Landaeta, M.F. Oceanographic influences on the early life stages of a mesopelagic fish across the Chilean Patagonia. Prog. Oceanogr. 2021, 195, 102572. [Google Scholar] [CrossRef]
- Mondal, S.; Ray, A.; Osuka, K.E.; Sihombing, R.I.; Lee, M.A.; Chen, Y.K. Impact of climatic oscillations on marlin catch rates of Taiwanese long-line vessels in the Indian Ocean. Sci. Rep. 2023, 13, 22438. [Google Scholar] [CrossRef] [PubMed]
- Báez, J.C.; Gimeno, L.; Real, R. North Atlantic Oscillation and fisheries management during global climate change. Rev. Fish Biol. Fish. 2021, 31, 319–336. [Google Scholar] [CrossRef]
- Blaber, S.J. Tropical Estuarine Fishes: Ecology, Exploitation and Conservation; John Wiley & Sons: Hoboken, NJ, USA, 2008. [Google Scholar]
- De Silva, S.S. Biology of juvenile grey mullet: A short review. Aquaculture 1980, 19, 21–36. [Google Scholar] [CrossRef]
- Lenanton, R.C.; Potter, I.C. Contribution of estuaries to commercial fisheries in temperate Western Australia and the concept of estuarine dependence. Estuaries 1987, 10, 28–35. [Google Scholar] [CrossRef]
- Blaber, S.J.M. Factors affecting recruitment and survival of mugilids in estuaries and coastal waters of southeastern Africa. Am. Fish. Soc. Symp. 1987, 1, 507–518. [Google Scholar]
- Chang, C.W.; Tzeng, W.N. Species composition and seasonal occurrence of mullets (Pisces, Mugilidae) in the Tanshui estuary northwest Taiwan. J. Fish. Soc. Taiwan 2000, 27, 253–262. [Google Scholar]
- Paterson, A.W.; Whitfield, A.K. The fishes associated with three intertidal salt marsh creeks in a temperate southern African estuary. Wetl. Ecol. Manag. 2003, 11, 305–315. [Google Scholar] [CrossRef]
- Cardona, L. Effects of salinity on the habitat selection and growth performance of Mediterranean flathead grey mullet Mugil cephalus (Osteichthyes, Mugilidae). Estuar. Coast. Shelf Sci. 2000, 50, 727–737. [Google Scholar] [CrossRef]
- Whitfield, A.K.; Taylor, R.H.; Fox, C.; Cyrus, D.P. Fishes and salinities in the St Lucia estuarine system—A review. Rev. Fish Biol. Fish. 2006, 16, 1–20. [Google Scholar] [CrossRef]
- Harrison, T.D.; Whitfield, A.K. Temperature and salinity as primary determinants influencing the biogeography of fishes in South African estuaries. Estuar. Coast. Shelf Sci. 2006, 66, 335–345. [Google Scholar] [CrossRef]
- Whitfield, A.K.; Panfili, J.; Durand, J.D. A global review of the cosmopolitan flathead mullet Mugil cephalus Linnaeus 1758 (Teleostei: Mugilidae), with emphasis on the biology, genetics, ecology and fisheries aspects of this apparent species complex. Rev. Fish Biol. Fish. 2012, 22, 641–681. [Google Scholar] [CrossRef]
- Rodrigues, L.D.S.; Pennino, M.G.; Conesa, D.; Kikuchi, E.; Kinas, P.G.; Barbosa, F.G.; Cardoso, L.G. Modelling the distribution of marine fishery resources: Where are we? Fish Fish. 2023, 24, 159–175. [Google Scholar] [CrossRef]
- Panzeri, D.; Russo, T.; Arneri, E.; Carlucci, R.; Cossarini, G.; Isajlović, I.; Šifner, S.K.; Manfredi, C.; Masnadi, F.; Reale, M.; et al. Identifying priority areas for spatial management of mixed fisheries using ensemble of multi-species distribution models. Fish Fish. 2023, 25, 187–204. [Google Scholar] [CrossRef]
- Lee, M.A.; Weng, J.S.; Lan, K.W.; Vayghan, A.H.; Wang, Y.C.; Chan, J.W. Empirical habitat suitability model for immature albacore tuna in the North Pacific Ocean obtained using multisatellite remote sensing data. Int. J. Remote Sens. 2020, 41, 5819–5837. [Google Scholar] [CrossRef]
- Mondal, S.; Lee, M.A.; Weng, J.S.; Osuka, K.E.; Chen, Y.K.; Ray, A. Seasonal distribution patterns of Scomberomorus commerson in the Taiwan Strait in relation to oceanographic conditions: An ensemble modeling approach. Mar. Pollut. Bull. 2023, 197, 115733. [Google Scholar] [CrossRef]
- Brodie, S.; Pozo Buil, M.; Welch, H.; Bograd, S.J.; Hazen, E.L.; Santora, J.A.; Seary, R.; Schroeder, I.D.; Jacox, M.G. Ecological forecasts for marine resource management during climate extremes. Nat. Commun. 2023, 14, 7701. [Google Scholar] [CrossRef] [PubMed]
- Ibáñez, A.L.; Gutiérrez-Benítez, O. Climate variables and spawning migrations of the striped mullet and white mullet in the Northwestern area of the Gulf of Mexico. J. Fish Biol. 2004, 65, 822–831. [Google Scholar] [CrossRef]
- Khemis, I.B.; Hamza, N.; Sadok, S. Nutritional quality of the fresh and processed grey mullet (Mugilidae) products: A short review including data concerning fish from freshwater. Aquat. Living Resour. 2019, 32, 2. [Google Scholar] [CrossRef]
- Lupatsch, I.; Katz, T.; Angel, D.L. Assessment of the removal efficiency of fish farm effluents by grey mullets: A nutritional approach. Aquac. Res. 2003, 34, 1367–1377. [Google Scholar] [CrossRef]
- Lan, K.W.; Zhang, C.I.; Kang, H.J.; Wu, L.J.; Lian, L.J. Impact of fishing exploitation and climate change on the grey mullet mugil cephalus stock in the Taiwan Strait. Mar. Coast. Fish. 2017, 9, 271–280. [Google Scholar] [CrossRef]
- Lan, K.W.; Lee, M.A.; Zhang, C.I.; Wang, P.Y.; Wu, L.J.; Lee, K.T. Effects of climate variability and climate change on the fishing conditions for grey mullet (Mugil cephalus L.) in the Taiwan Strait. Clim. Change 2014, 126, 189–202. [Google Scholar] [CrossRef]
- Ho, C.H. Climate Risks and Opportunities of the Marine Fishery Industry: A Case Study in Taiwan. Fishes 2022, 7, 116. [Google Scholar] [CrossRef]
- Cormier, R.; Elliott, M. SMART marine goals, targets and management—Is SDG 14 operational or aspirational, is ‘Life Below Water’ sinking or swimming? Mar. Pollut. Bull. 2017, 123, 28–33. [Google Scholar] [CrossRef] [PubMed]
- Mugagga, F.; Nabaasa, B.B. The centrality of water resources to the realization of Sustainable Development Goals (SDG). A review of potentials and constraints on the African continent. Int. Soil Water Conserv. Res. 2016, 4, 215–223. [Google Scholar] [CrossRef]
- Ju, P.; Tian, Y.; Chen, M.; Yang, S.; Liu, Y.; Xing, Q.; Sun, P. Evaluating stock status of 16 commercial fish species in the coastal and offshore waters of Taiwan using the CMSY and BSM methods. Front. Mar. Sci. 2020, 7, 618. [Google Scholar] [CrossRef]
- Dunn, A.; Harley, S.J.; Doonan, I.J.; Bull, B. Calculation and interpretation of catch-per-unit effort (CPUE) indices. New Zealand Fish. Assess. Rep. 2000, 1, 44. [Google Scholar]
- Richter, I.; Roberts, B.R.; Sailley, S.F.; Sullivan, E.; Cheung, V.V.; Eales, J.; Fortnam, M.; Jontila, J.B.; Maharja, C.; Nguyen, T.H.; et al. Building bridges between natural and social science disciplines: A standardized methodology to combine data on ecosystem quality trends. Philos. Trans. R. Soc. B 2022, 377, 20210487. [Google Scholar] [CrossRef] [PubMed]
- Sarr, O.; Kindong, R.; Sow, F.N.; Tian, S. Standardized catch per unit effort and size compositions of Atlantic bonito, Sarda sarda (Bloch, 1793), harvested by artisanal fisheries in the Senegalese Exclusive Economic Zone (SEEZ). Fish. Res. 2023, 261, 106626. [Google Scholar] [CrossRef]
- Bednaršek, N.; Feely, R.A.; Reum, J.C.; Peterson, B.; Menkel, J.; Alin, S.R.; Hales, B. Limacina helicina shell dissolution as an indicator of declining habitat suitability owing to ocean acidification in the California Current Ecosystem. Proc. R. Soc. B Biol. Sci. 2014, 281, 20140123. [Google Scholar]
- Chen, K.S.; Crone, P.R.; Hsu, C.C. Reproductive biology of albacore Thunnus alalunga. J. Fish Biol. 2010, 77, 119–136. [Google Scholar] [CrossRef] [PubMed]
- Vayghan, A.H.; Lee, M.A.; Weng, J.S.; Mondal, S.; Lin, C.T.; Wang, Y.C. Multisatellite-Based Feeding Habitat Suitability Modeling of Albacore Tuna in the Southern Atlantic Ocean. Remote Sens. 2020, 12, 2515. [Google Scholar] [CrossRef]
- Moore, R.D.; Nelitz, M.; Parkinson, E. Empirical modelling of maximum weekly average stream temperature in British Columbia, Canada, to support assessment of fish habitat suitability. Can. Water Resour. J. 2013, 38, 135–147. [Google Scholar] [CrossRef]
- Hess, G.R.; Bay, J.M. A regional assessment of windbreak habitat suitability. Environ. Monit. Assess. 2000, 61, 239–256. [Google Scholar] [CrossRef]
- Lauver, C.L.; Busby, W.H.; Whistler, J.L. Testing a GIS model of habitat suitability for a declining grassland bird. Environ. Manag. 2002, 30, 88–97. [Google Scholar] [CrossRef] [PubMed]
- Chen, X.; Tian, S.; Chen, Y.; Liu, B. A modeling approach to identify optimal habitat and suitable fishing grounds for neon flying squid (Ommostrephes bartramii) in the northwest Pacific Ocean. Fish. Bull. 2010, 108, 1–14. [Google Scholar]
- Vayghan, A.H.; Poorbagher, H.; Shahraiyni, H.T.; Fazli, H.; Saravi, H.N. Suitability indices and habitat suitability index model of Caspian kutum risiilus frisii kutum) in the southern Caspian Sea. Aquat. Ecol. 2013, 47, 441–451. [Google Scholar] [CrossRef]
- Vayghan, A.H.; Fazli, H.; Ghorbani, R.; Lee, M.A.; Saravhi, H.N. Temporal habitat suitability modeling of Caspian shad (Alosa spp.) in the southern Caspian Sea. J. Limnol. 2016, 75, 210–223. [Google Scholar] [CrossRef]
- Muhling, B.A.; Brill, R.; Lamkin, J.T.; Roffer, M.A.; Lee, S.K.; Liu, Y.; Muller-Karger, F. Projections of future habitat use by Atlantic bluefin tuna: Mechanistic vs. correlative distribution models. ICES J. Mar. Sci. 2017, 74, 698–716. [Google Scholar] [CrossRef]
- Lin, H.; Wang, J.; Zhu, J.; Chen, X. Evaluating the impacts of environmental and fishery variability on the distribution of bigeye tuna in the Pacific Ocean. ICES J. Mar. Sci. 2023, 80, 2642–2656. [Google Scholar] [CrossRef]
- Kemarau, R.A.; Eboy, O.V. How do El Niño Southern Oscillation (ENSO) Events Impact Fish Catch in Sarawak Water? J. Phys. Conf. Ser. 2022, 2314, 012013. [Google Scholar] [CrossRef]
- Broughton, J.M.; Codding, B.F.; Faith, J.T.; Mohlenhoff, K.A.; Gruhn, R.; Brenner-Coltrain, J.; Hart, I.A. El Niño frequency threshold controls coastal biotic communities. Science 2022, 377, 1202–1205. [Google Scholar] [CrossRef] [PubMed]
- Feng, Z.; Yu, W.; Zhang, Y.; Li, Y.; Chen, X. Habitat variations of two commercially valuable species along the Chilean waters under different-intensity El Niño events. Front. Mar. Sci. 2022, 9, 919620. [Google Scholar] [CrossRef]
- Clarke, T.M.; Wabnitz, C.C.; Frölicher, T.L.; Reygondeau, G.; Pauly, D.; Cheung, W.W. Linking observed changes in pelagic catches to temperature and oxygen in the Eastern Tropical Pacific. Fish Fish. 2022, 23, 1371–1382. [Google Scholar] [CrossRef]
- Barrier, N.; Lengaigne, M.; Rault, J.; Person, R.; Ethé, C.; Aumont, O.; Maury, O. Mechanisms underlying the epipelagic ecosystem response to ENSO in the equatorial Pacific ocean. Prog. Oceanogr. 2023, 213, 103002. [Google Scholar] [CrossRef]
- Vollrath, S.R.; Tanner, S.E.; Reis-Santos, P.; Possamai, B.; Grimm, A.M.; Gillanders, B.M.; Vieira, J.P.; Garcia, A.M. Complex interactions of ENSO and local conditions buffer the poleward shift of migratory fish in a subtropical seascape. Sci. Total Environ. 2023, 896, 165129. [Google Scholar] [CrossRef] [PubMed]
- Frankemölle, P.F.; Nooteboom, P.D.; Scutt Phillips, J.; Escalle, L.; Nicol, S.; Van Sebille, E. Assessing the drift of fish aggregating devices in the tropical Pacific Ocean. Ocean Sci. 2024, 20, 31–41. [Google Scholar] [CrossRef]
- Naimullah, M.; Lan, K.-W.; Liao, C.-H.; Hsiao, P.-Y.; Liang, Y.-R.; Chiu, T.-C. Association of Environmental Factors in the Taiwan Strait with Distributions and Habitat Characteristics of Three Swimming Crabs. Remote. Sens. 2020, 12, 2231. [Google Scholar] [CrossRef]
- Naimullah, M.; Lee, W.Y.; Wu, Y.L.; Chen, Y.K.; Huang, Y.C.; Liao, C.H.; Lan, K.W. Effect of soaking time on targets and bycatch species catch rates in fish and crab trap fishery in the southern East China Sea. Fish. Res. 2022, 250, 106258. [Google Scholar] [CrossRef]
- Shiah, F.K.; Chung, S.W.; Kao, S.J.; Gong, G.C.; Liu, K.K. Biological and hydrographical responses to tropical cyclones (typhoons) in the continental shelf of the Taiwan Strait. Cont. Shelf Res. 2000, 20, 2029–2044. [Google Scholar] [CrossRef]
- Chung, S.W.; Jan, S.; Liu, K.K. Nutrient fluxes through the Taiwan Strait in spring and summer 1999. J. Oceanogr. 2001, 57, 47–53. [Google Scholar] [CrossRef]
- Jan, S.; Wang, J.; Chern, C.-S.; Chao, S.-Y. Seasonal variation of the circulation in the Taiwan Strait. J. Mar. Syst. 2002, 35, 249–268. [Google Scholar] [CrossRef]
- Naimullah, M.; Lan, K.W.; Liang, Y.R.; Hsiao, P.Y.; Chiu, T.C.; Liao, C.H. Distribution and Habitat Characteristics of Three Important Commercial Swimming Crab (Crustacea: Decapoda: Portunidae) Related with the Environmental Factors in Taiwan Strait; Fisheries Society of Taiwan: Keelung City, Taiwan, 2020. [Google Scholar]
- Tang, D.; Kester, D.R.; Ni, I.H.; Kawamura, H.; Hong, H. Upwelling in the Taiwan Strait during the summer monsoon detected by satellite and shipboard measurements. Remote Sens. Environ. 2002, 83, 457–471. [Google Scholar] [CrossRef]
- Hsu, P.C. Surface current variations and hydrological characteristics of the Penghu Channel in the southeastern Taiwan Strait. Remote Sens. 2022, 14, 1816. [Google Scholar] [CrossRef]
- Lin, S.F.; Tang, T.Y.; Jan, S.; Chen, C.J. Taiwan Strait current in winter. Cont. Shelf Res. 2005, 25, 1023–1042. [Google Scholar] [CrossRef]
- Ntona, M.; Morgera, E. Connecting SDG 14 with the other Sustainable Development Goals through marine spatial planning. Mar. Policy 2018, 93, 214–222. [Google Scholar] [CrossRef]
- Friess, D.A.; Aung, T.T.; Huxham, M.; Lovelock, C.; Mukherjee, N.; Sasmito, S. SDG 14: Life below water–impacts on mangroves. Sustain. Dev. Goals 2019, 445, 445–481. [Google Scholar]
- Sturesson, A.; Weitz, N.; Persson, Å. SDG 14: Life below Water. A Review of Research Needs; Technical Annex to the Formas Report Forskning för Agenda, 2030; Stockholm Environment Institute: Stockholm, Sweden, 2018. [Google Scholar]

Disclaimer/Publisher’s Note: The statements, opinions and data contained in all publications are solely those of the individual author(s) and contributor(s) and not of MDPI and/or the editor(s). MDPI and/or the editor(s) disclaim responsibility for any injury to people or property resulting from any ideas, methods, instructions or products referred to in the content. |
© 2024 by the authors. Licensee MDPI, Basel, Switzerland. This article is an open access article distributed under the terms and conditions of the Creative Commons Attribution (CC BY) license (https://creativecommons.org/licenses/by/4.0/).