Article

Power Generation Enhancement through Latching Control for a Sliding Magnet-Based Wave Energy Converter

Department of Ocean Engineering, Texas A&M University, College Station, TX 77843, USA
*
Author to whom correspondence should be addressed.
J. Mar. Sci. Eng. 2024, 12(4), 656; https://doi.org/10.3390/jmse12040656
Submission received: 12 March 2024 / Revised: 28 March 2024 / Accepted: 2 April 2024 / Published: 16 April 2024
(This article belongs to the Topic Control and Optimisation for Offshore Renewable Energy)

Abstract

:
A Surface-Riding Wave Energy Converter (SR-WEC) featuring a sliding magnet inside a pitching cylindrical hull is investigated as an easily deployable small power device to support small-scale marine operations. This study extends the earlier development of the system by authors to enhance power performance through the application of end spring and latching control. The inclusion of springs at the tube’s end enhances the magnet release and travel speeds as well as the average power output compared to systems without them. Further improvement of power output can also be achieved by employing optimal latching control. We introduced constant-angle and variable-angle unlatching strategies to determine optimal parameters in combination with passive and reactive power take-off (PTO) controls to assess their effectiveness. The optimized latching control and end spring can increase 60–80% more power output compared with the case without them under certain PTO damping. Additionally, we discussed the effects of limiting peak powers and associated energy leaks with latching.

1. Introduction

The ocean waves contain vast renewable energy sufficient to contribute to more than 20% of the U.S. Annual Energy Production [1]. The majority of this wave energy resides in mild to intermediate sea states rather than a few severe high sea states [2]. For effective wave energy conversion in the mild to intermediate sea states, a new wave energy converter, a Surface-Riding Wave Energy Converter (SR-WEC), was studied by Jin et al. [3]. The SR-WEC consists of a light horizontal cylinder pitching with waves and a sliding magnet-based linear generator inside it, as illustrated in Figure 1. While riding on wave slopes, the cylinder undergoes pitch motions, causing the magnet to slide inside a tubular structure with coil windings, thereby generating electrical power as a linear generator. The SR-WEC was designed considering four features in addition to its inherent simplicity and conciseness: (1) wave slopes tend to increase in low sea states that occupy most annual sea states, while wave elevations continue to decrease with lower sea states; (2) the surface-riding feature tends to minimize the wave-induced force on the structure; (3) multiple units can easily be modularized, inspected, and installed on the sea surface as a lightweight system, which contributes to reducing costs, resulting in a competitive Levelized Cost of Energy (LCOE); and (4) the dynamic resonance can be applied to maximize the cylinder pitch motions. The proposed WEC is also applicable for a small-power application that can be easily connected to a small-scale marine system to provide small power in low sea states.
The first simplified version of the SR-WEC had been numerically and experimentally tested by Jin et al. [3], which was followed by a series of optimization pathways including geometric optimization to maximize pitch dynamics under target sea states and active control to further enhance power take-off (PTO). In this paper, we focus on developing optimal latching controls and PTO controls. These controls are considered simultaneous electrical and mechanical controls aimed at increasing power generation (or Capture Width Ratio) for short waves, thereby achieving higher annual average power. Our optimum latching control contrasts with previous latching studies in that (1) the mechanical resonance of the PTO dynamics does not exist due to the absence of mechanical restoring force and (2) magnet motions are neither oscillatory nor continuous due to the limitation of sliding length.
Many wave energy converters (WECs) were designed to have their resonance frequencies near the most common sea states while daily sea states continue to change. To better harness wave energy in varying wave conditions, diverse strategies of active controls can be employed, including the latching control. Hals et al. [4] and Maria-Arenas et al. [5] reviewed the conventional methods of PTO optimization utilizing mechanical resonance to maximize mechanical power conversion from hydrodynamic interactions [6,7]. For PTO dynamics with mechanical resonance, either given by springs or hydrostatic restoring, Budal and Falnes [7,8] introduced a conceptual latching control in a point absorber. In their study, its heave motion was controlled to allow the velocity to be in phase with the heave wave excitation. Subsequently, the latching application was extended to include rotational and other translational motions, and the latching duration was optimized based on each specific system and the practicality of latching/unlatching instances, as follows.
Greenhow et al. [9] applied pneumatic latching and the corresponding latching duration study on a terminal type of WEC named Clam, which involves clamping a control rod while interacting with a pitching front plate. Korde [10] investigated the use of latching control with variational formulations on a heaving buoy WEC. Babarit and Clément [11] proposed two techniques for implementing latching, which include an analytical solution for the WEC’s motion equation and an optimal command theory based on Hamiltonian formulation and Pontryagin’s maximum principle. These methods were tested on a heaving point absorber and a four-degree-of-freedom WEC. Falcão [12,13] devised a sub-optimal phase control approach applicable to a high-pressure hydraulic PTO system without requiring wave prediction. Henrique et al. [14] applied a simple threshold unlatching control strategy to a generic two-body heaving WEC. Henrique et al. [15] also studied a latching control strategy over a receding horizon time frame for an oscillating water column spar buoy WEC.
Sheng et al. [16,17] utilized a latching duration that is half of the difference between a wave period and a floater’s natural period and tested the method using a heaving point absorber. The above method for determining the latching duration was similarly employed in a recent study by Shadman et al. [18] on another heaving point absorber, which moves relative to a support structure mounted at the bottom. Wu et al. [19] employed two predictive latching control strategies, one being close-to-optimal and the other sub-optimal, along with one non-predictive strategy on a pitching-type solo Duck. Thomas et al. [20] introduced a machine learning algorithm that utilizes a shallow artificial neural network to determine the optimal latching time for heaving point absorbers. They compared their approach with a constant latching duration.
Latching was utilized to control the phase between motion and load in PTO dynamics, revealing that PTO performance was optimized when latching emulated the mechanical resonance phase condition. Therefore, previous latching applications primarily aimed to align the maximum velocity with the peak of the excitation force, typically in PTO systems involving mass connected to mechanical stiffness. On the other hand, latching and its efficacy have rarely been studied in PTO systems without such mass–spring resonance. In this regard, we emphasize that our latching strategy deviates from conventional schemes.
In this study, we extended the application of latching control to a novel sliding-based PTO system with a finite travel length. The PTO system is further optimized with the electrical reactive control of the electromagnetic field for any additional gain. Another power enhancement was achieved by placing elastic springs at the ends of the tube to store the remaining kinetic energy of the sliding magnet, and we anticipate that these will also minimize impacts on the hull structure. Two latching strategies of fixed- and varying-angle release are compared under varying parameters, and the latching efficiencies on the passive and reactive PTO systems are discussed. Furthermore, the desirable phase relation that maximizes power output is identified.
The subsequent sections are arranged as follows. Section 2 formulates the given PTO system, including the sliding mechanism, excitation, and power estimation. Section 3 formulates end spring dynamics and describes two latching strategies. Section 4 presents simulation particulars and results from parametric studies. Finally, Section 5 provides a summary/conclusions and an outlook for future work.

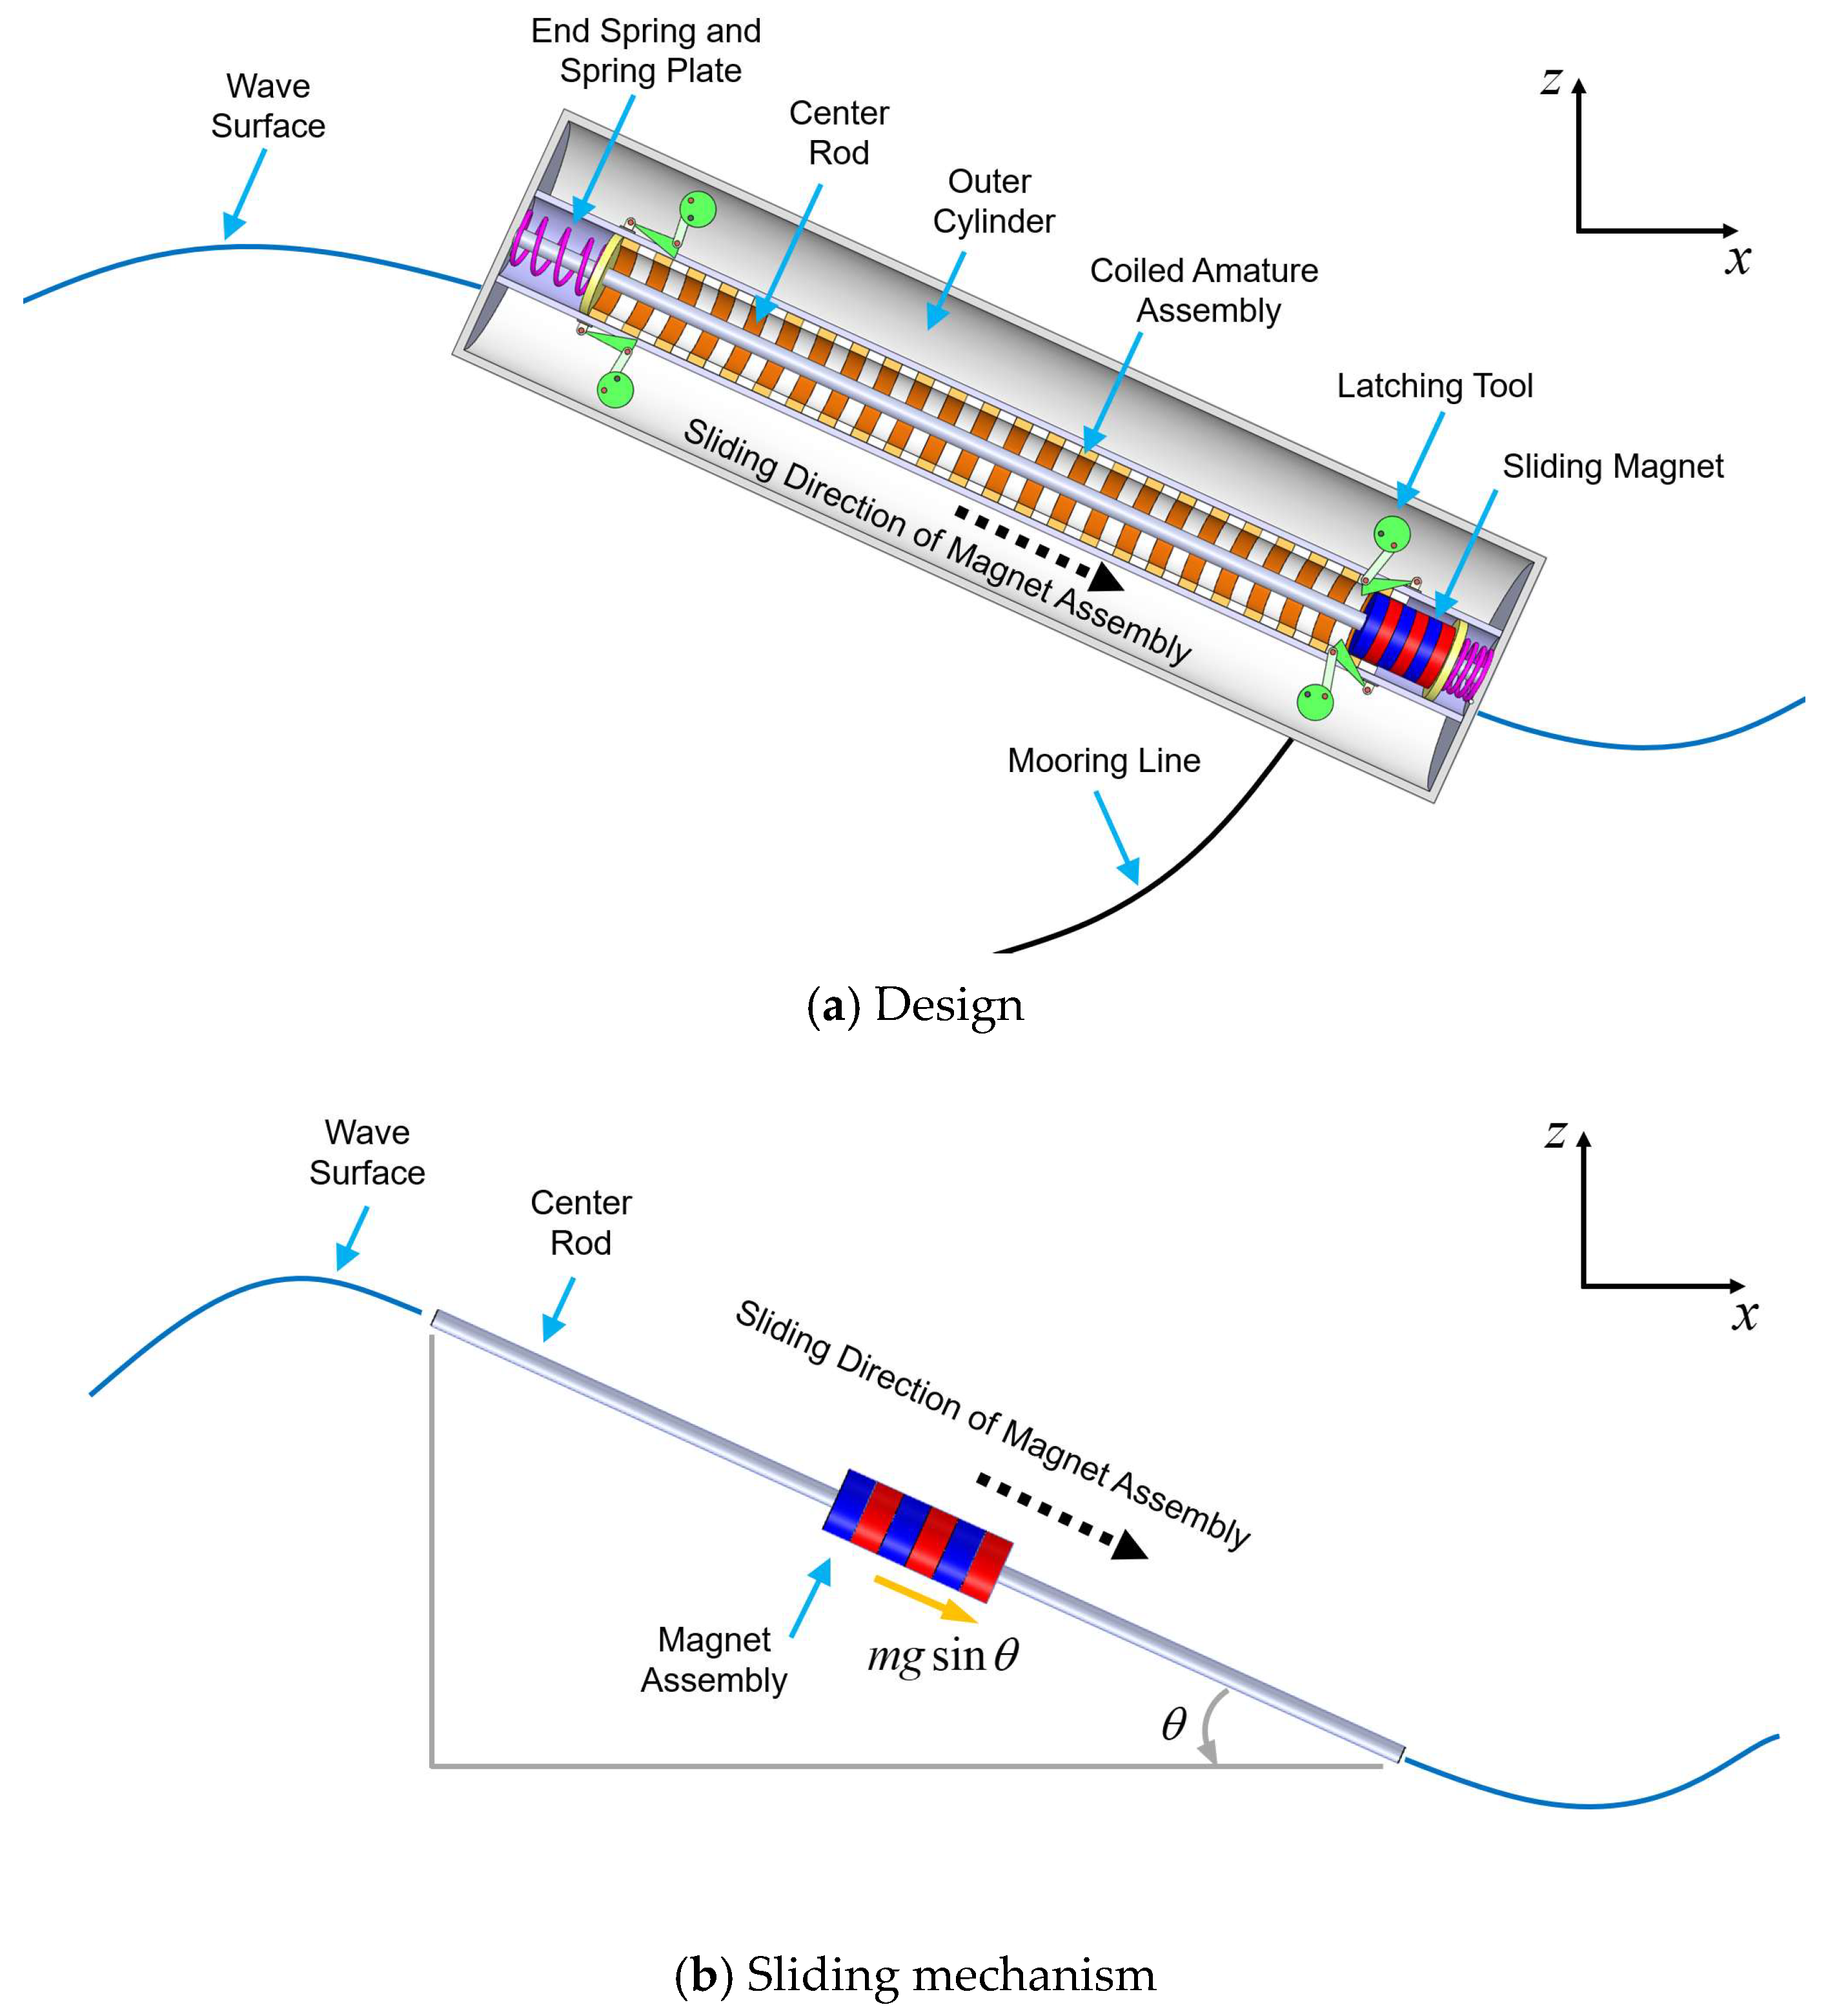
2. Power Take-Off Dynamics of SR-WEC

As illustrated in Figure 1, the SR-WEC has a magnet sliding inside a structure with coil windings to generate electric power from the pitch motion. The sliding PTO system is waterproof sealed inside a floating cylinder, contributing to its excellent operability and durability. The PTO dynamics can be formulated as
m s ¨ ( t ) + c P T O s ˙ ( t ) + k P T O s ( t ) = m g sin θ ( t )
where m is the mass of the magnet assembly, s is the sliding displacement of the magnet along the axis at the middle of the tube, and θ is the time-varying pitch angle of the floating body. The linear generator force is described in terms of c P T O and k P T O as implemented in [5]. The pitch angle, the excitation in the magnet-sliding dynamics, is obtained from the 6 DOF (degree of freedom) time-domain dynamic equations of the floating cylinder by waves, based on Cummins’ equation:
( M i j + A i j ) ξ ¨ j ( t ) + B i j E ξ ˙ j ( t ) + K i j ξ j ( t ) = F i W ( t ) + F i C ( t )    i , j = 1 , 2 , , 6
where M i j is the mass matrix, A i j is the added mass matrix at infinite frequency, B i j E is the linear equivalent viscous damping, K i j is the system’s hydrostatic stiffness matrix, and ξ j is the 6 DOF displacement vector. F i W is the first-order wave-excitation force vector and F i C is the convolution integral related to the retardation function R i j and radiation damping B i j , as formulated below.
F i C ( t ) = 0 R i j ( τ ) ξ ˙ j ( t τ ) d τ
R i j ( t ) = 2 π 0 B i j ( ω ) cos ( ω t ) d ω
It is assumed that the magnet mass is small compared to the total mass of the system so that the magnet sliding minimally affects (within 10%) the moment of inertia of the pitch motion. It is also assumed that the friction force related to the sliding motion is negligible due to sufficient lubrication, which was validated in our previous actuator test [3]. Subsequently, the sliding dynamics, Equation (1), is separated from the cylinder dynamics, Equation (2). More elaborate modeling of the actual electromagnetic forces and power generation by the given magnet and coil design can be found in [3].
Applying Approximate Complex-Conjugate Control [4] for a target period T t a r g e t at which the pitch has the maximum amplitude in its spectrum, the impedance matching condition leads to the electrical linear stiffness coefficient:
k P T O = m ( 2 π T t a r g e t ) 2
The generator force and instantaneous power production are
F g e n e r a t o r = c P T O s ˙ ( t ) k P T O s ( t )
P = F g e n e r a t o r s ˙ ( t ) = c P T O { s ˙ ( t ) } 2 + k P T O s ( t ) s ˙ ( t )
Note that the reactive PTO control has a bi-directional power flow [21] such that the generator is used as a motor in some instances to extract better power. If k P T O is zero, the reactive PTO control becomes a typical passive PTO control. The reactive control application for SR-WEC was also investigated by Sheshaprasad et al. [22].
The PTO dynamics has the power input given as
P i n p u t = s ˙ ( t ) m g sin θ
The power loss and efficiency η can be defined as below.
P l o s s = P i n p u t P
η = P a v g P i n p u t ( a v g ) × 100
The efficiency, denoted as η in Equation (10), aims to quantify the kinetic energy loss in two scenarios: one where no end springs are used, and the other involving a leak induced by introducing realistic power and force limits.
Power rating and generator-force rating represent the maximum power and force input allowed to flow through electrical equipment. Elevating these ratings increases the size, weight, and cost of the generator. Thus, it is desirable to have quantitative limits on electrical power and generator force to balance the cost and average power generation. During the design process of SR-WEC PTO, 3000 W and 1000 N of power and force limits ( P l i m i t and F l i m i t ) were found to be optimal based on an independent parametric numerical study with these two variables for the power performance [23]. The study demonstrated how the average power was affected by the limits on generator peak power and force. Raising the power and force limits resulted in higher average power. However, exceeding the thresholds of 3000 W and 1000 N, respectively, led to diminishing returns. Therefore, considering the size limit and cost of the electrical components, these values were chosen as the power and force design objectives for the linear generator. While applying the power limit, the generator force is also limited in time by both the instantaneous force equivalent to the power limit ( P l i m i t | s ˙ ( t ) | ) and the constant F l i m i t as below.
F g e n e r a t o r , f i n a l ( t ) = s i g n ( F g e n e r a t o r ) min ( | F g e n e r a t o r | , F l i m i t , P l i m i t | s ˙ ( t ) | )
During the sliding, the generator force acts as resistance in the velocity calculation using the Euler method with the passive PTO control as below.
s ( t n ) = s ( t n 1 ) + Δ t ( g sin θ + F g e n e r a t o r , f i n a l ( t n 1 ) m )
where t n represents the current time step, t n 1 represents the previous time step, and Δ t is the time step interval. Once the generator force is limited, a smaller resistance ( F g e n e r a t o r , f i n a l ) than the estimated generator force ( F g e n e r a t o r ) is employed in velocity calculations. This results in a higher magnet speed compared to the non-limiting power and force condition. This acceleration is further elevated by establishing a smaller force limit criterion ( P l i m i t | s ˙ ( t ) | ) due to the increased denominator compared to the non-limiting case. This process is repeated in every time step, leading to a larger impacting velocity v h i t and a larger initial sliding velocity after unlatching. The growth in speed is sometimes repeated during the entire simulation, which results in a divergence of speed. Consequently, this divergence is followed by reduced sliding time, which results in lower average power as observed in some cases. By comparing the power produced by the respective PTO system to the input power from the external forcing, one can check the energy loss as formulated in Equation (9).

3. Latching Control Strategy

Although the given impedance matching condition presents that the electrical stiffness satisfies the sliding natural frequency matched with the target frequency to obtain resonance, the sliding motion is restricted by both ends of the linear generator, so the PTO dynamics become nonlinear rather than harmonic. Moreover, such nonlinearity breaks the resonance condition of the sliding (Equation (5)). To overcome the inefficient performance due to the disabled resonance of the PTO dynamics, we developed a latching control in combination with a mechanical spring at each end of the linear generator. We note again that the floater was independently designed to maximize pitch motions.

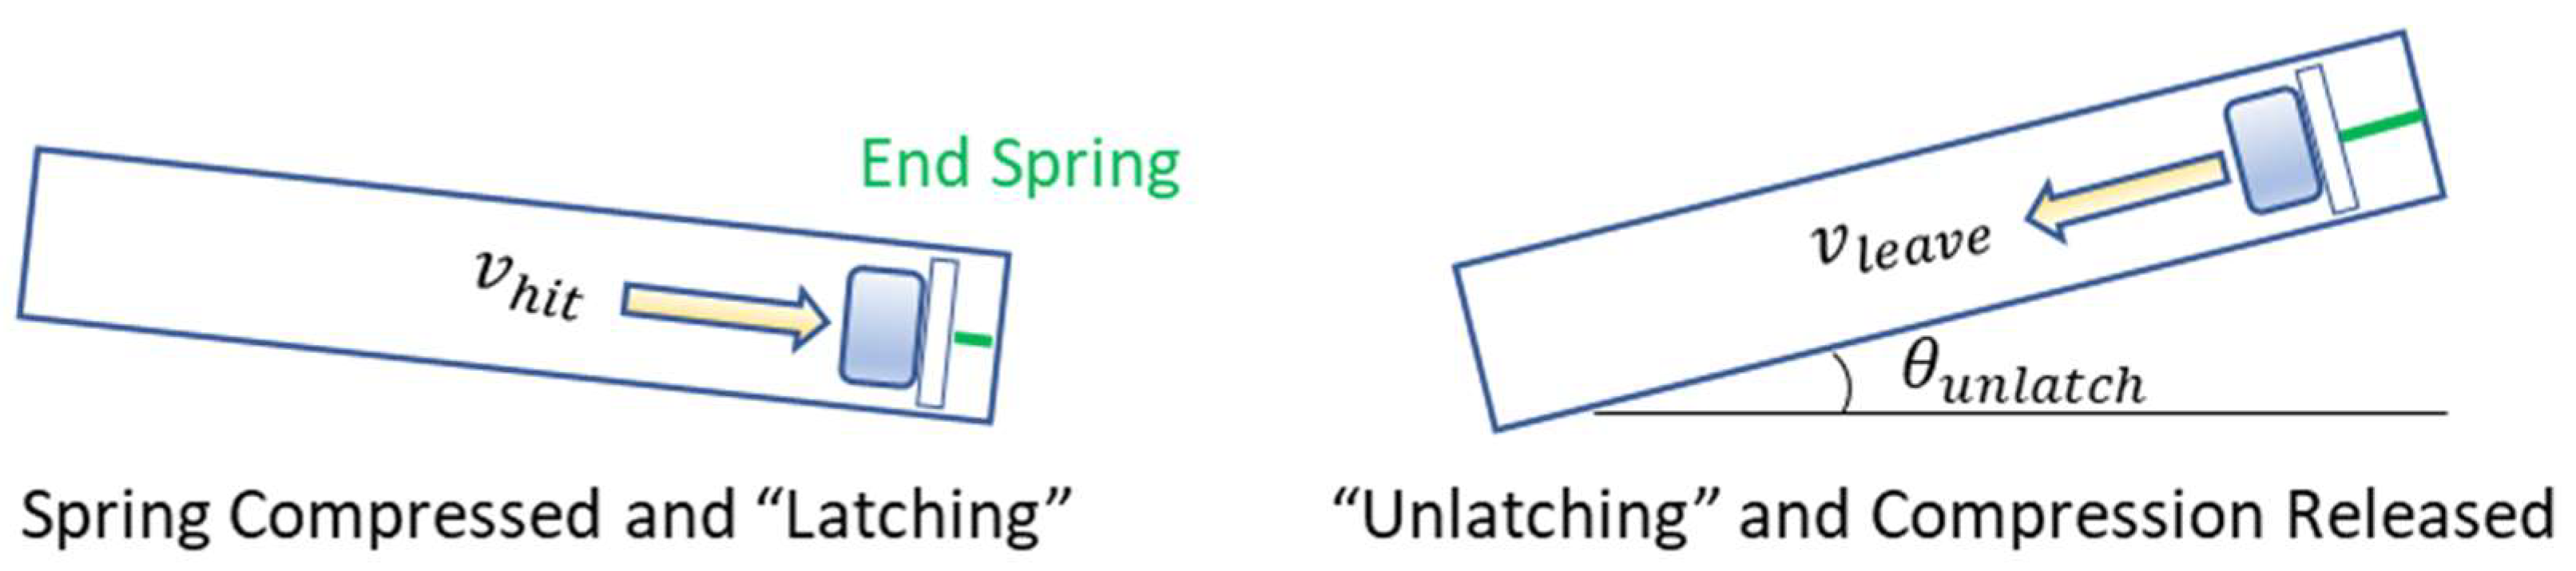
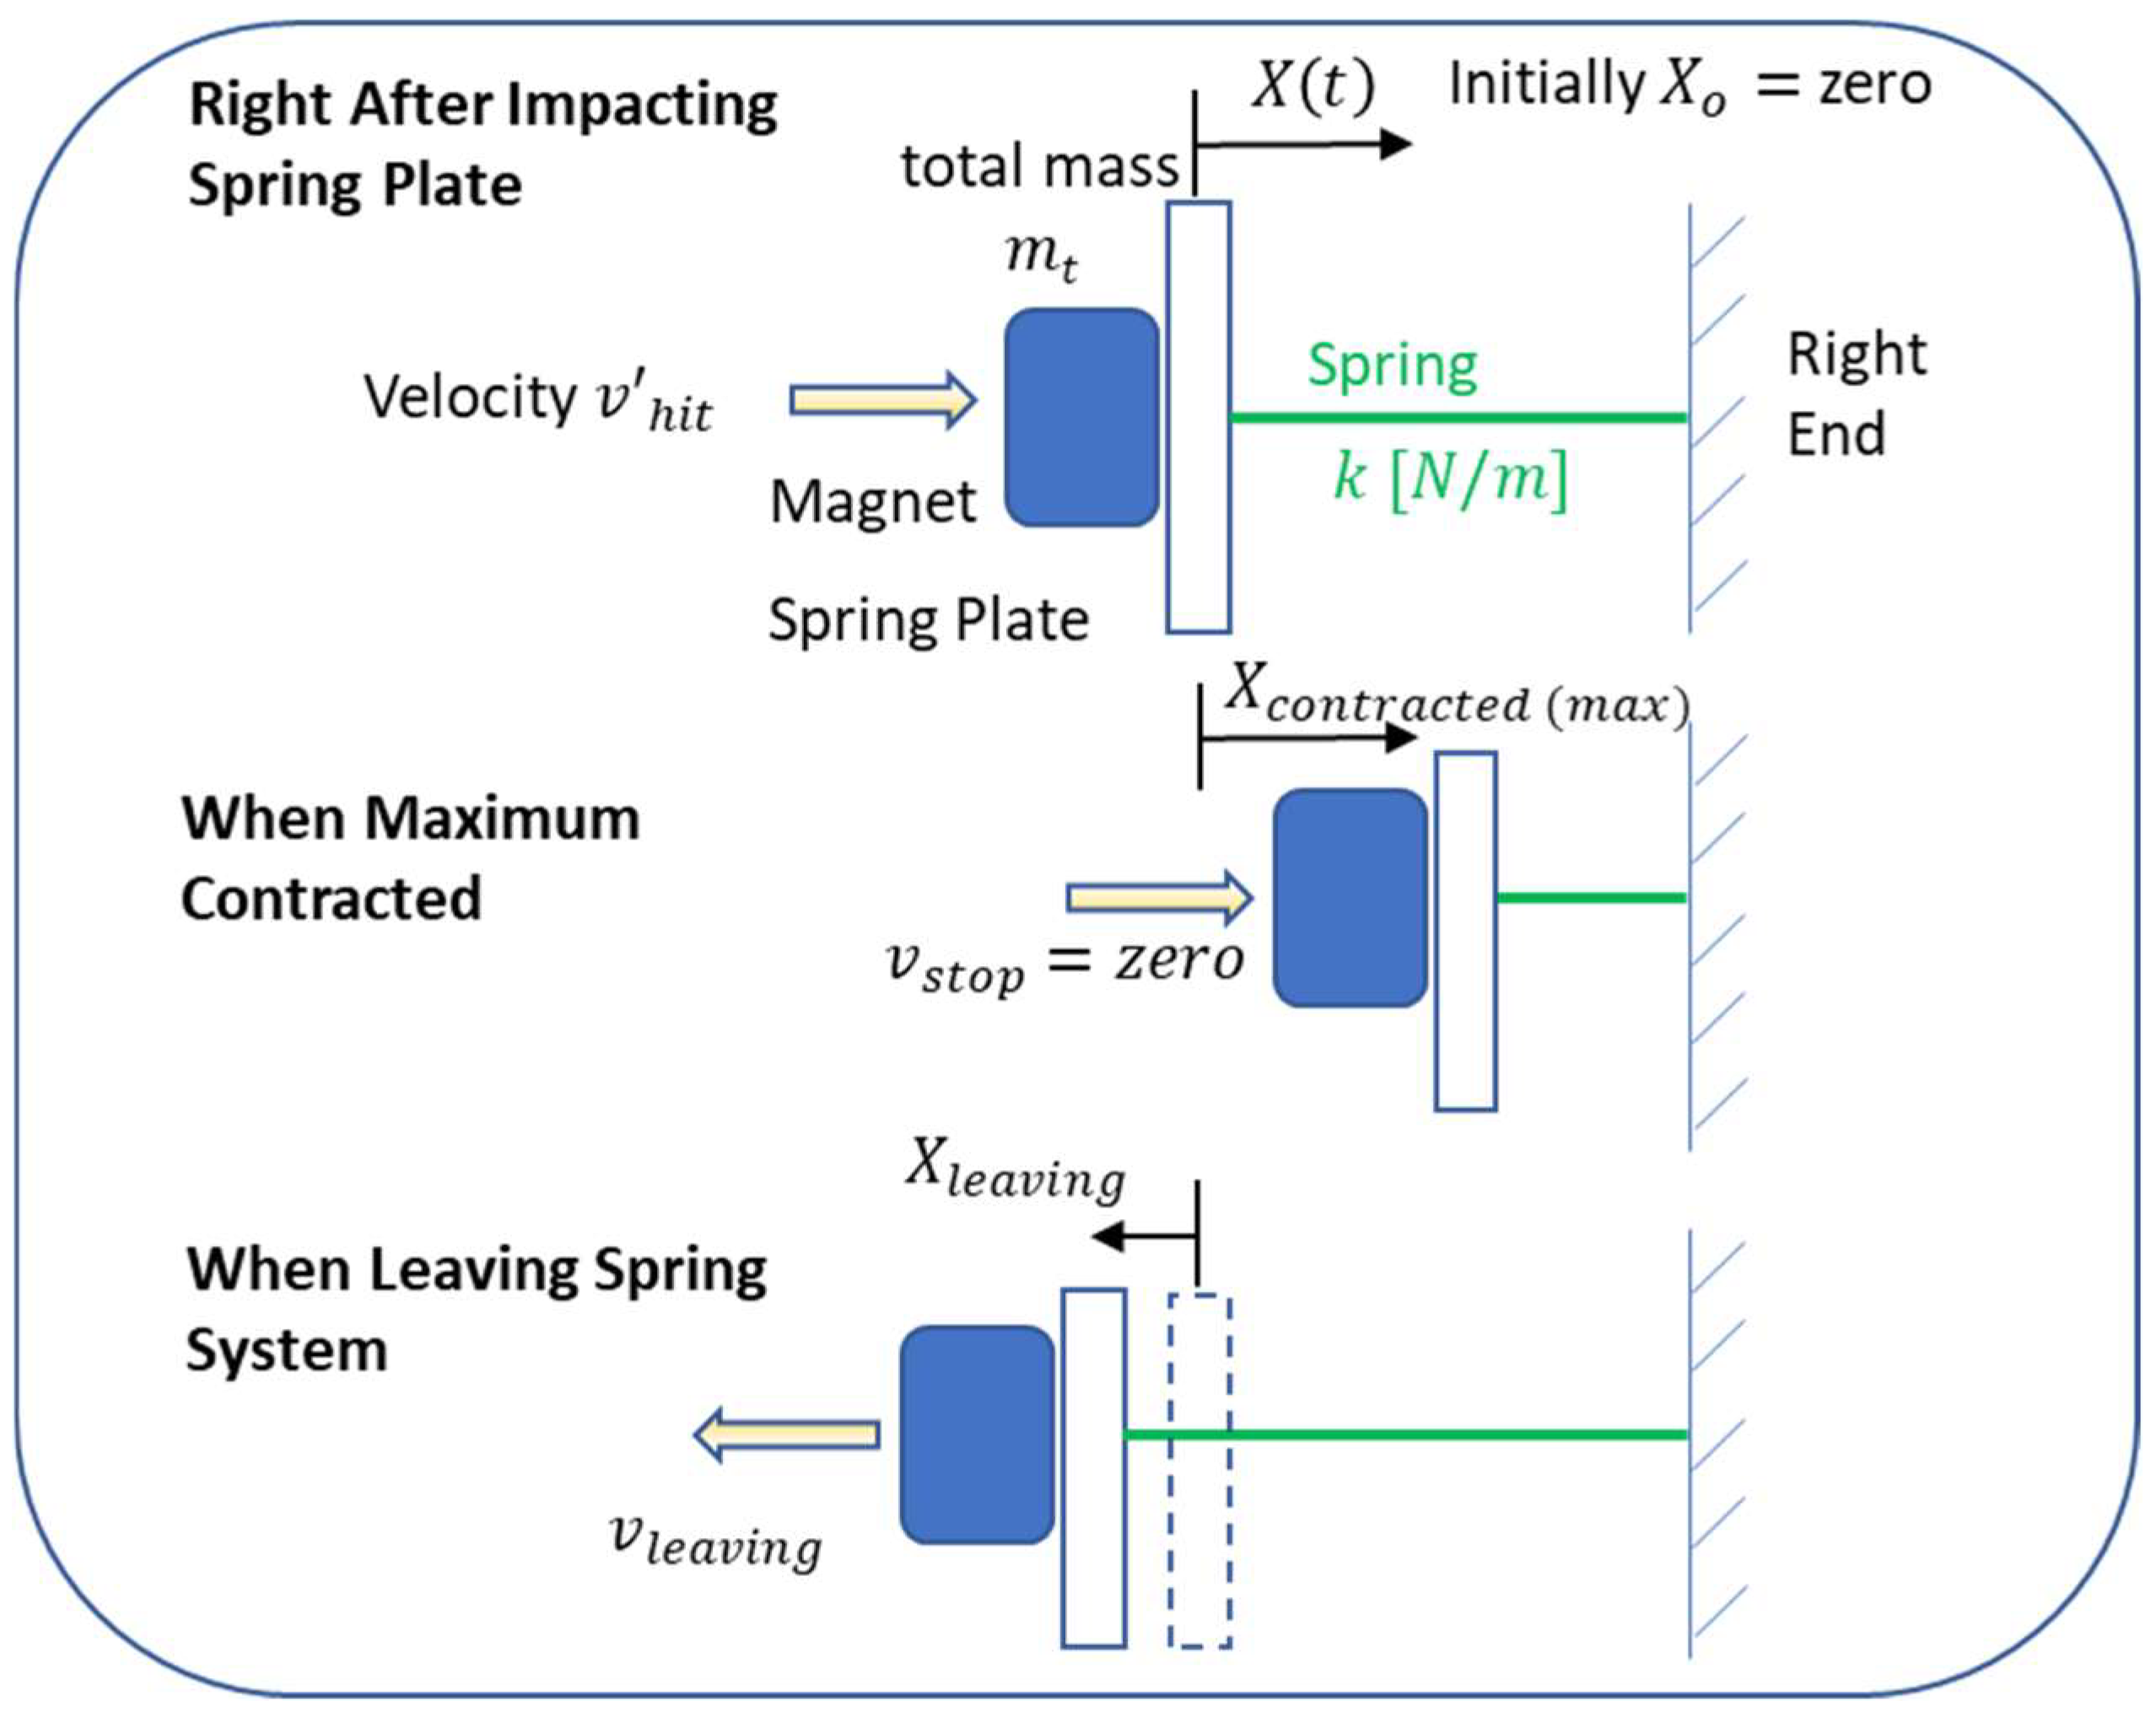
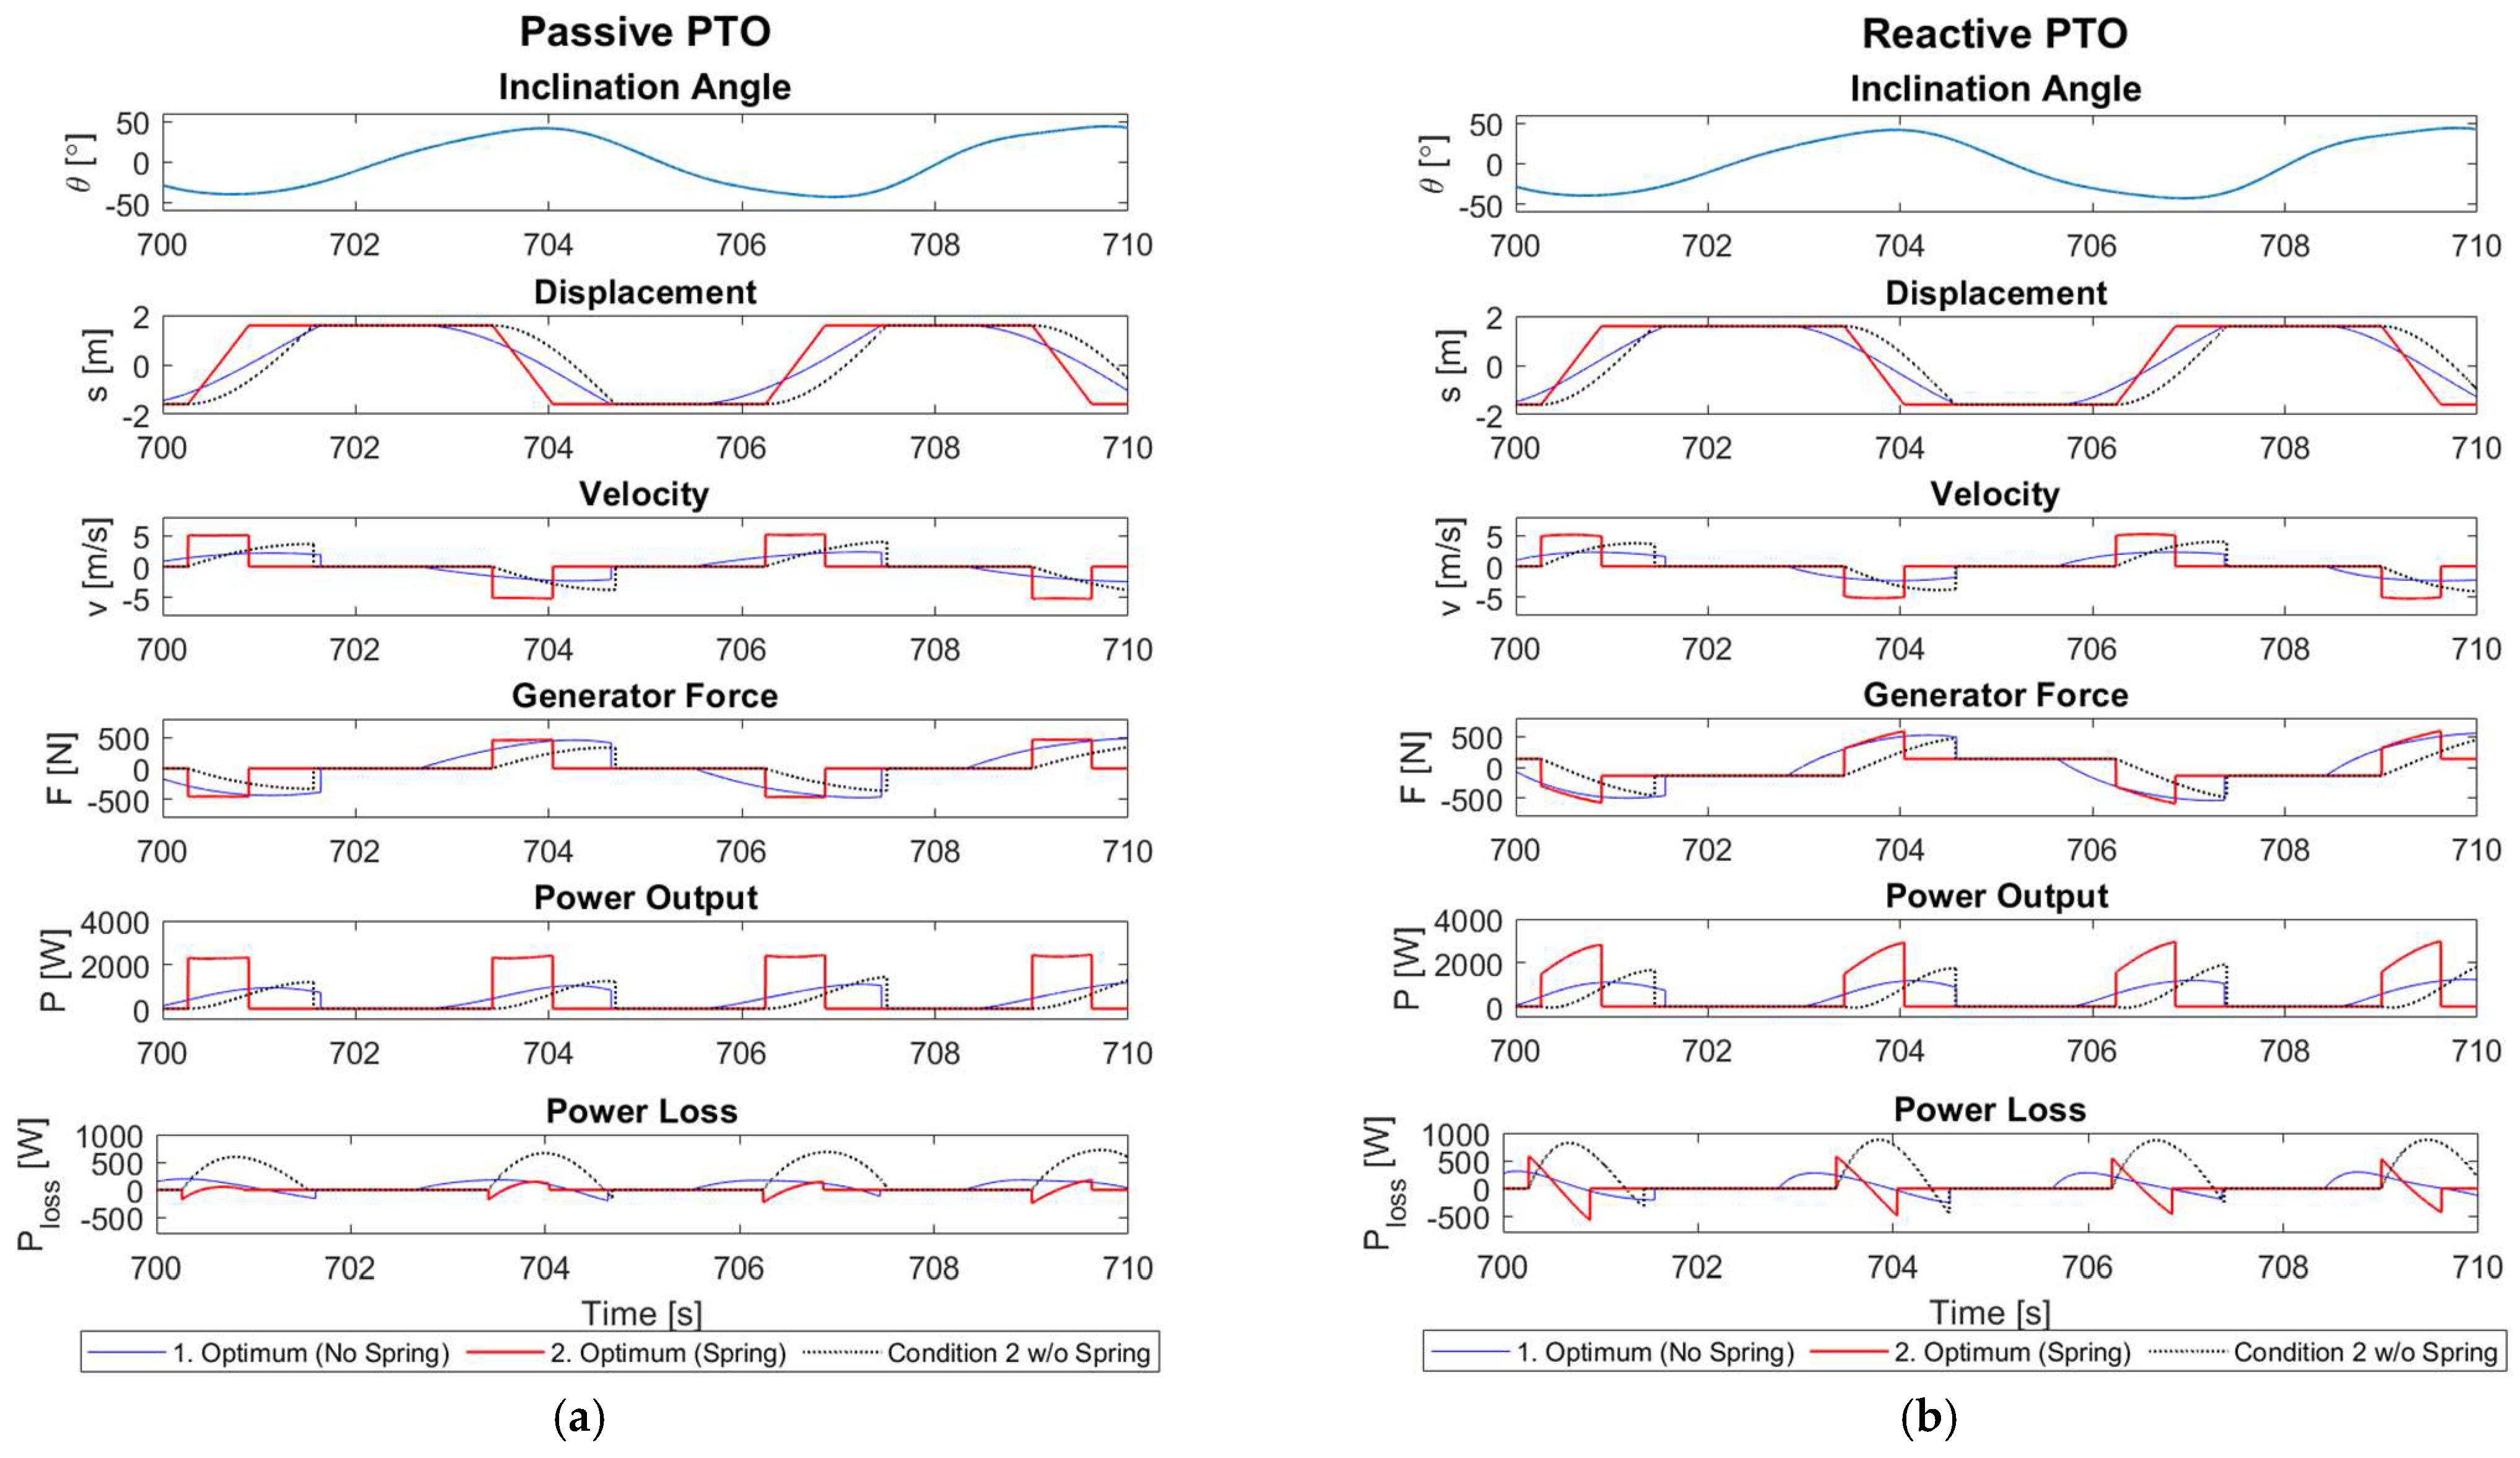
3.1. Phase Control with End Springs

We consider optimizing phase control through latching and elastic energy storage using springs at both ends to enhance PTO dynamics, resulting in a significant improvement in power generation in random waves. Conventional latching control studies often focus on achieving phase matching between PTO velocity and the corresponding excitation force. However, for the present non-resonant PTO system, the traditional phase control concept cannot be applied straightforwardly.
In this study, we apply a fundamental latching control concept, which is latching the magnet and waiting for a favorable time to unlatch. This is mainly performed through numerically conducted parametric studies using the buoy inclination angle as the unlatching variable. Additional power enhancement was also sought by reactive PTO control and the use of end springs. Using the results, we identify the relationship between the sliding motion and the peak excitation for the optimal cases, introducing a new phase-matching concept. The test with the reactive PTO control system aims to determine whether there is any benefit from the essential resonance component when applying latching control.
Figure 2 and Figure 3 illustrate how the leaving velocity v l e a v e is estimated from the impact velocity (hitting velocity) v h i t . During operation, an inclinometer sensor continuously measures the instantaneous pitch angle and provides feedback to the latching tool for unlatching the magnet at the desired moment. It is assumed that the feedback from the sensor and the latching tool works promptly.
After the collision of the magnet with the spring plate, the magnet and the spring plate move together while compressing the spring. Their movement is then stopped by the latching tool. From the conservation of momentum, the speed of the magnet assembly right after the perfect plastic collision is estimated. The mass of the spring may also contribute to the collision, which can be included as an effective spring plate mass.
v h i t = m m a g n e t m m a g n e t + m s p r i n g   p l a t e v h i t = α v h i t
The ratio of kinetic energies before and after is
K E f K E i = 1 2 ( m m a g n e t + m s p r i n g   p l a t e ) ( m m a g n e t m m a g n e t + m s p r i n g   p l a t e v h i t ) 2 1 2 m m a g n e t v h i t 2 = m m a g n e t m m a g n e t + m s p r i n g   p l a t e = α
Therefore, the coefficient represents the loss of kinetic energy, referred to as the collision coefficient in this manuscript. This coefficient is determined based on the mass of the spring plate, and Table 1 displays the values corresponding to a magnet mass of 75 kg, as used in this study.
The rebounding velocity (or leaving velocity) is derived using energy conservation equations during the spring load and unload, as in Equations (15) and (16). By coupling the two equations, the leaving velocity is estimated by Equation (17).
1 2 m t v h i t 2 + 1 2 k X o 2 = 1 2 m t v s t o p 2 + 1 2 k X c o m p r e s s e d ( m a x ) 2
1 2 m t v s t o p 2 + 1 2 k X c o m p r e s s e d ( m a x ) 2 = 1 2 m t v l e a v e 2 + 1 2 k X l e a v e 2
v l e a v e = v h i t = α v h i t
where m t represents the total mass of the magnet and spring plate, and k denotes the stiffness of the end spring. X o , X c o m p r e s s e d ( m a x ) , and X l e a v e are spring displacements for the initial, maximum-compressed, and magnet-leaving instants, respectively. v s t o p and v l e a v e stand for the velocities when the spring is fully compressed and when the magnet leaves the spring plate, respectively.
The potential energy change of the magnet within the spring length during the spring compression is negligible, and, thus, it is not considered. The magnet leaves the spring system at the instant when the compressed spring is fully elongated back. It is also assumed that the magnet can be latched when the spring is fully compressed.
In the latching control analysis detailed in Section 4, the effectiveness of the latching control is primarily investigated assuming a massless spring, with α set to 1.00. The resulting rebounding velocity is simply estimated with
v l e a v e = v h i t
In the last part of Section 4, the analysis continues with the inclusion of spring mass in the form of collision coefficient (Equation (17)) to observe its effect on the latching control output. The latching mechanism holds the magnet in place when kinetic energy is fully transformed into elastic energy in the spring. The simplified rebounding concept replaces the need to consider spring compression for every impact velocity, as formulated in Equations (17) and (18).

3.2. Constant-Angle Unlatching vs. Variable-Angle Unlatching

Finding the optimal unlatching threshold under irregular waves is conducted through a parametric study by varying unlatching angles. First, a constant unlatching angle is applied. That is, the magnet is latched at the end of the tube and released at a specified buoy pitch angle. By comparing the average power production at various release angles (0°, 5°, 10°, 15°, 20°, 25°, 30°, 35°, 40°, and 45°) for the same irregular-wave excitations, the optimal unlatching threshold angle is found. For example, a 20° threshold means that the magnet is unlatched at every 20° of the buoy inclination angle. If the maximum inclination angle is smaller than the threshold for some waves, the magnet is released at the local peak angle of the waves. Using this method, the magnet has a higher chance of being unlatched at the local peaks when a larger unlatching angle is assigned. In this study, only several peaks of the buoy exceeded the angle of 45° (or 40°), so in such a large unlatching angle, the magnet was mostly released at peak angles.
However, the optimal constant unlatching angle found from this parametric study may not be the best unlatching threshold for the average power outputs because the optimal unlatching angle may vary wave by wave under irregular wave conditions. Thus, the wave-by-wave unlatching strategy is suggested to further improve the average power outputs. This is achieved by selecting the unlatching time to occur at a certain angle before reaching the respective peak angles. For example, if 5° is selected as an input relative angle, the magnet is released at a 5° smaller angle than each local peak angle before the peak angle occurs. This criterion is applied to all the oscillations during the numerical simulation, so the respective unlatching angles continuously vary. This variable-angle unlatching strategy is also performed with a range of such relative angles to find the best average power production.
Information on real-time pitch angle is required for unlatching, for which an inside-hull-attached inclinometer can be used. Inclinometers are commonly used in offshore platforms for real-time monitoring. Various wave-prediction techniques [8,24,25] can also be applied to the target unlatching strategy, as discussed in the later section.

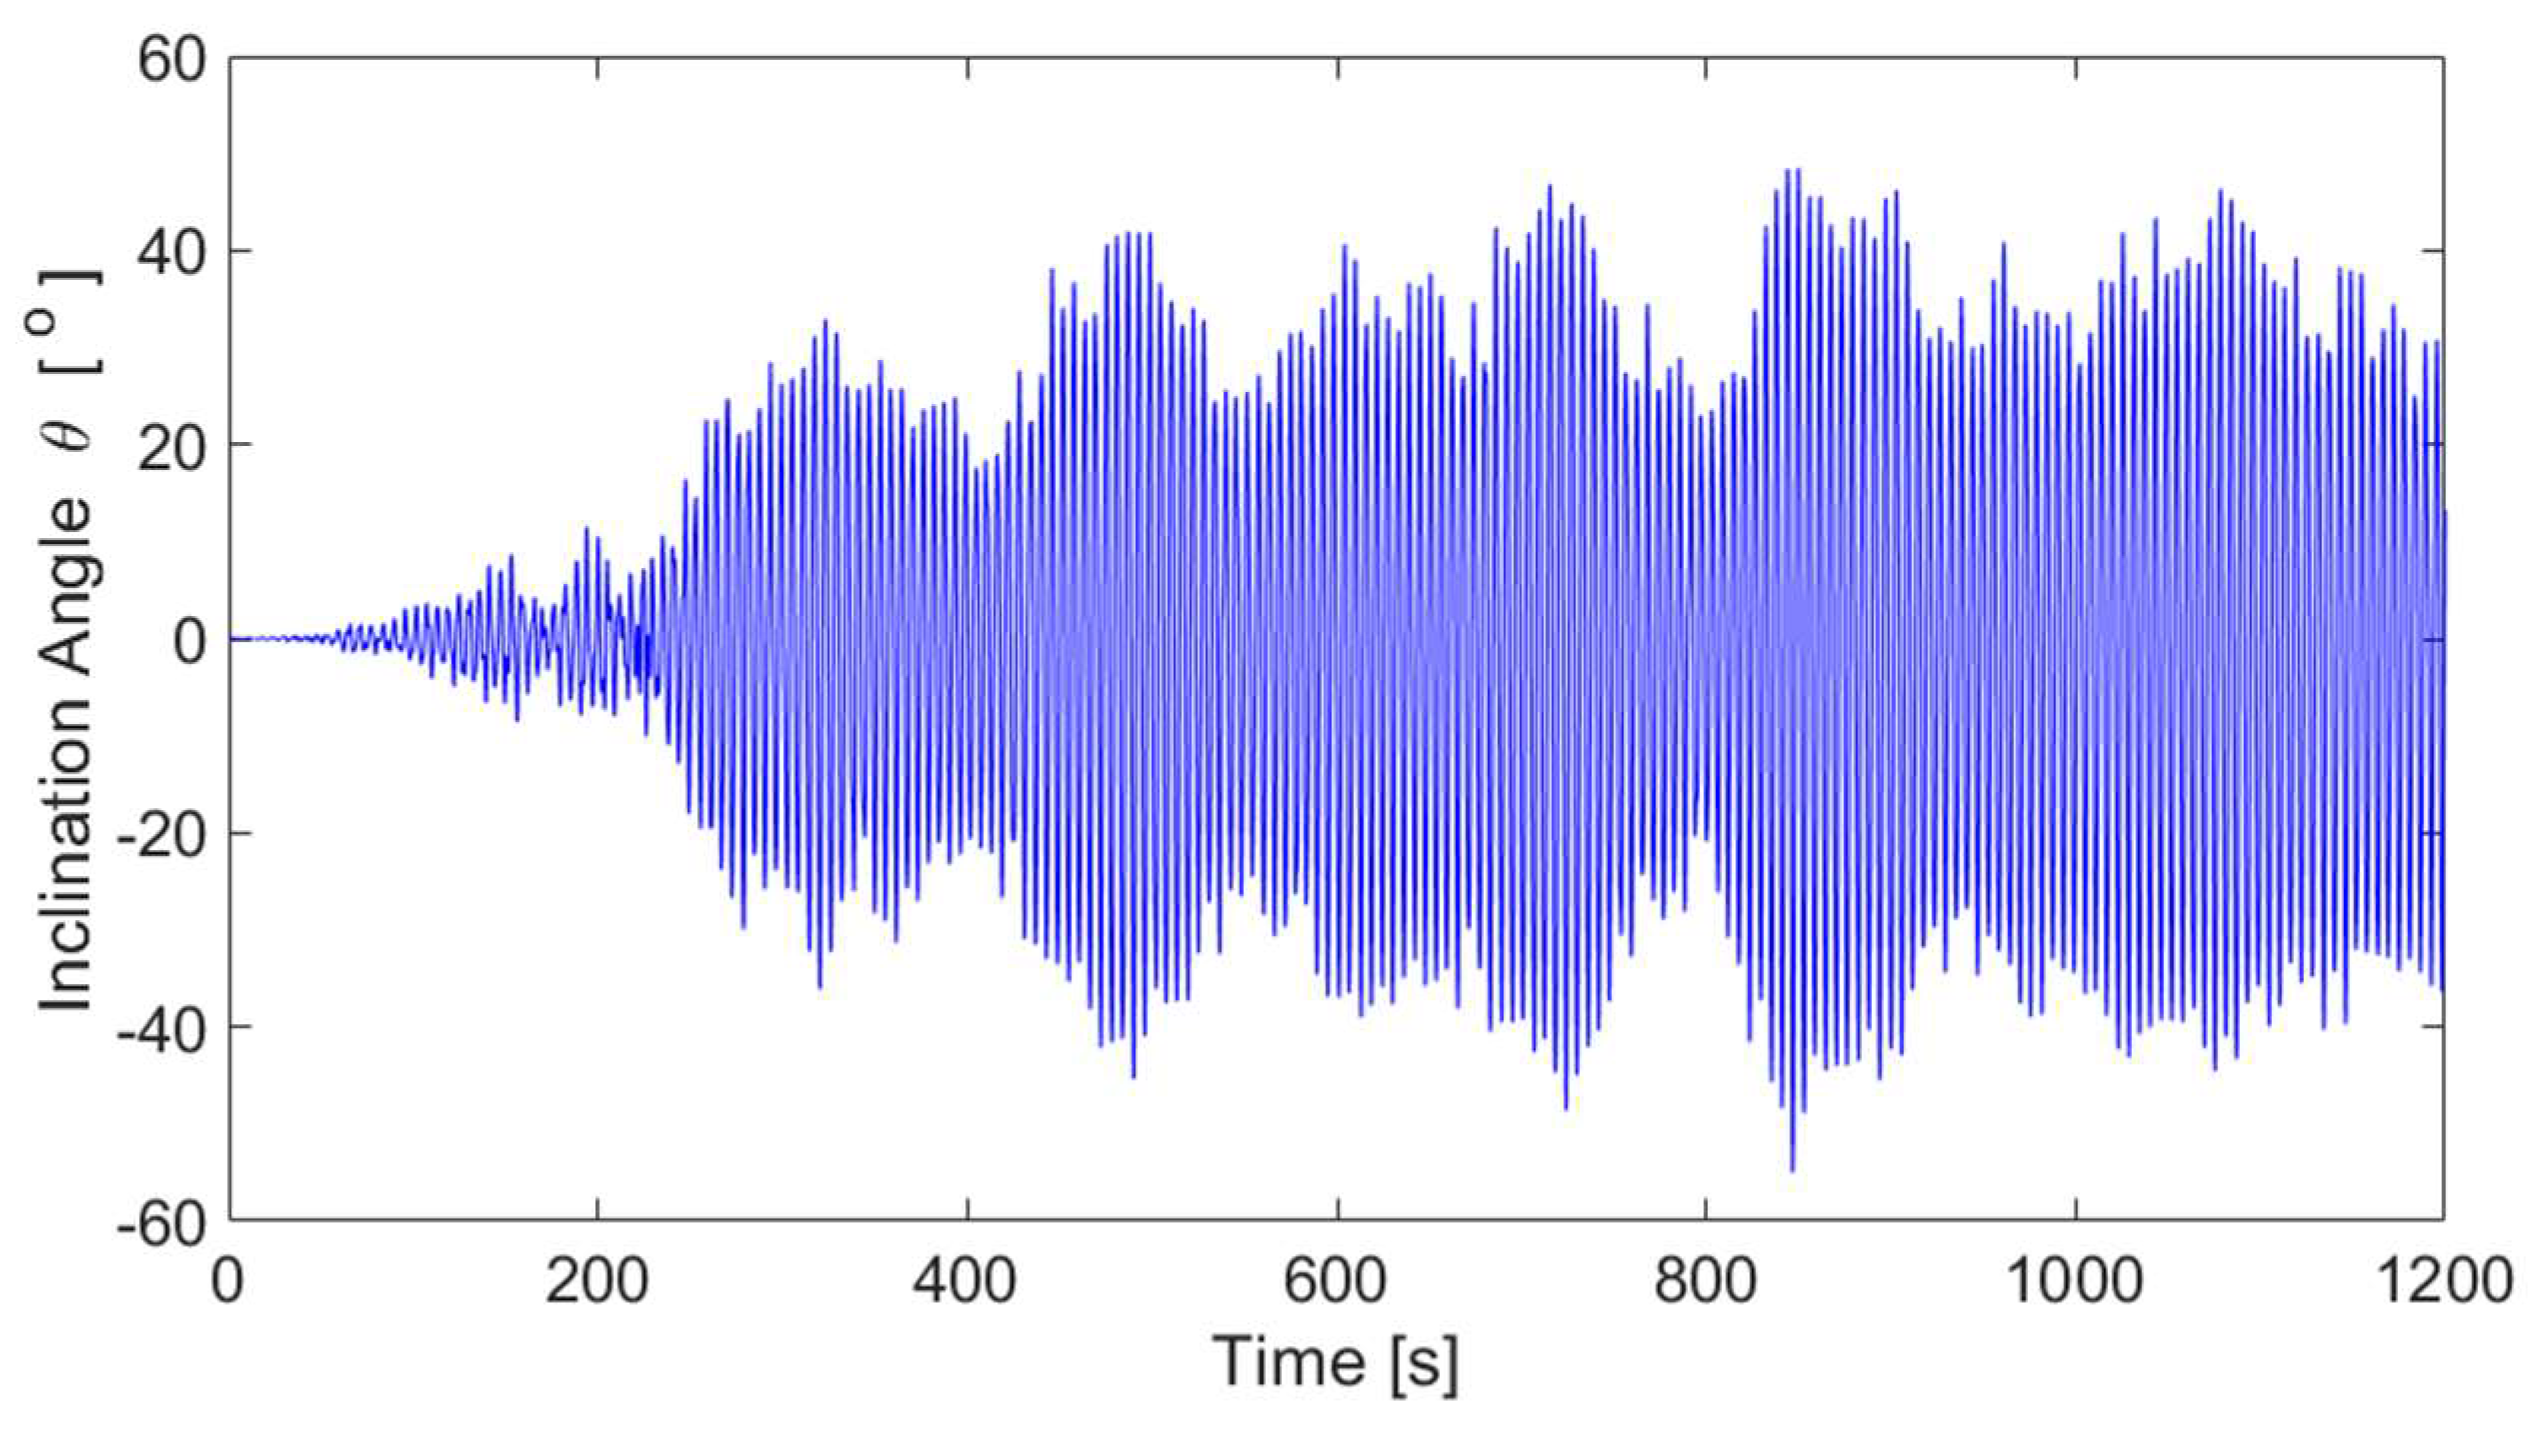
4. Results and Discussions

The target site (off the coast of North Carolina, i.e., NOAA buoy station 41002) was selected as a representative U.S. Atlantic Sea. The choice of a peak period ( T p ) of 5.22 s and a significant wave height ( H s ) of 2.0 m is the case of frequent occurrence, for which power enhancement by latching control is desired. The wave steepness ( H s / L p ) is 0.047, where L p represents the wavelength corresponding to the T p . The 1200 s long wave elevation time history is generated using the corresponding Pierson–Moskowitz (PM) spectrum. The corresponding buoy pitch motion time series is subsequently generated as in Figure 4. To minimize the effects of transient periods and motions in the time-domain simulation, a ramping function is applied, and the time series from 600 s to 1200 s is used as a steady state to calculate the average power output and peak power output. The time step of 1 ms was used for the instantaneous power calculation during the latching control application.
The numerical inputs for the latching control code include the buoy length of 3.18 m, the mass of the magnet assembly of 75 kg, and the target period of 5.85 s. The dimensions of buoy and magnet mass were selected to ensure a balance of buoyancy and weight while targeting a power generation range of 300–500 W without significantly affecting the buoy motion due to the sliding mass. In this regard, the decoupling of sliding dynamics from hull motion is also acceptable. The length and diameter (waterplane area) of the outer buoy and its pitch moment of inertia were the key parameters to the resonance tuning of its pitch motion for the target wave condition. Table 2 tabulates the input parameters and other dimensions of the SR-WEC for reference.
In this study, the sliding dynamics and latching mechanism were simulated using MATLAB® (R2022a). The pitch time series was calculated using Charm3D (v.3.6.2). Charm3D is an in-house simulator, developed at Texas A&M University, that calculates fully coupled floater-mooring dynamics under environmental sea loads.

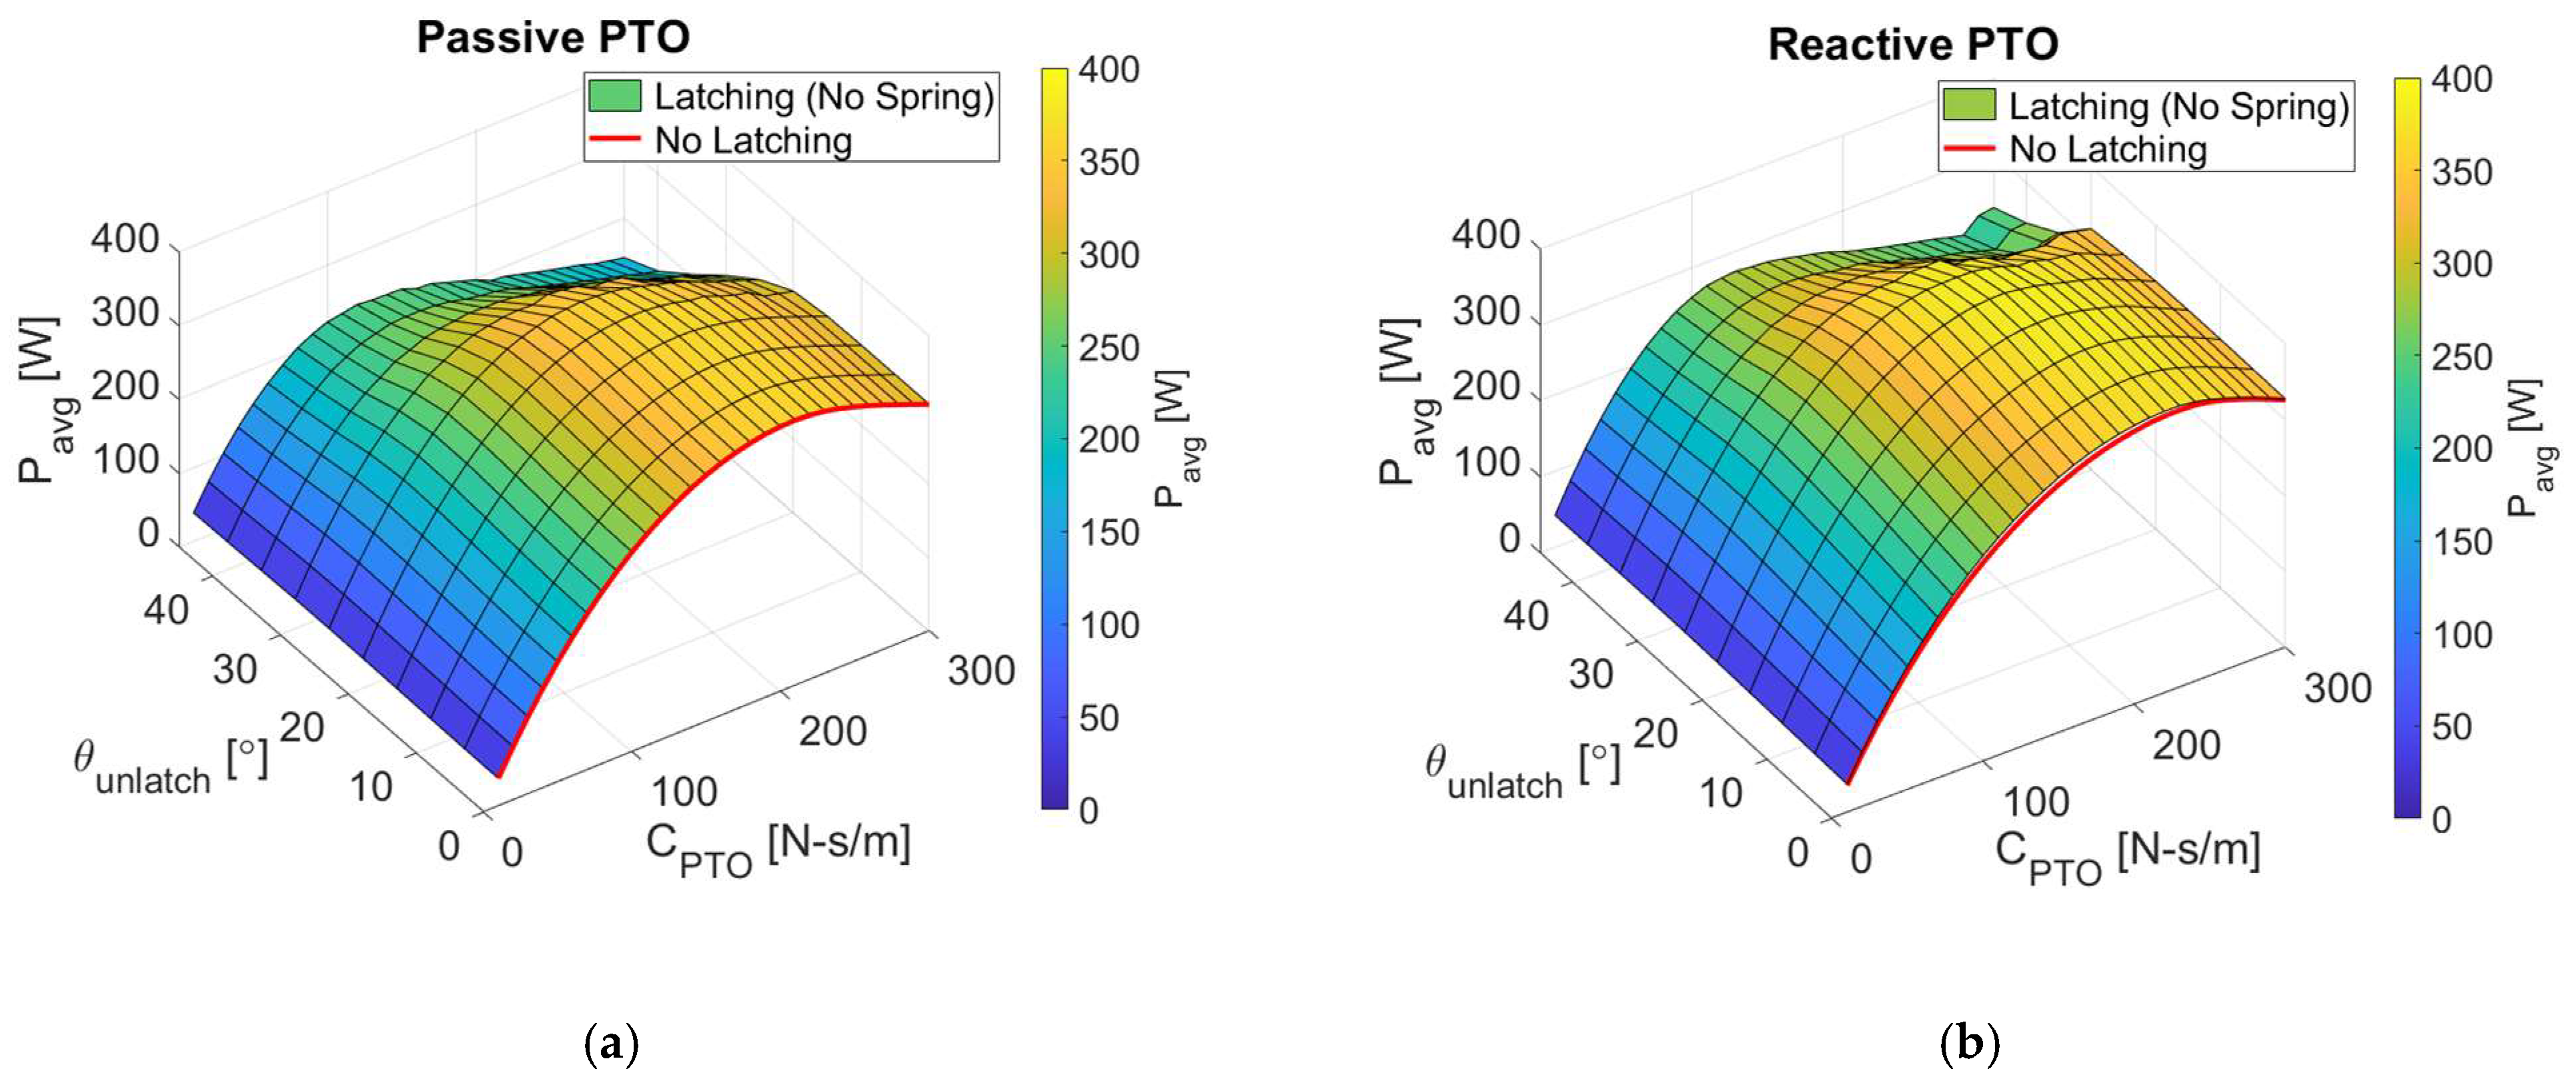
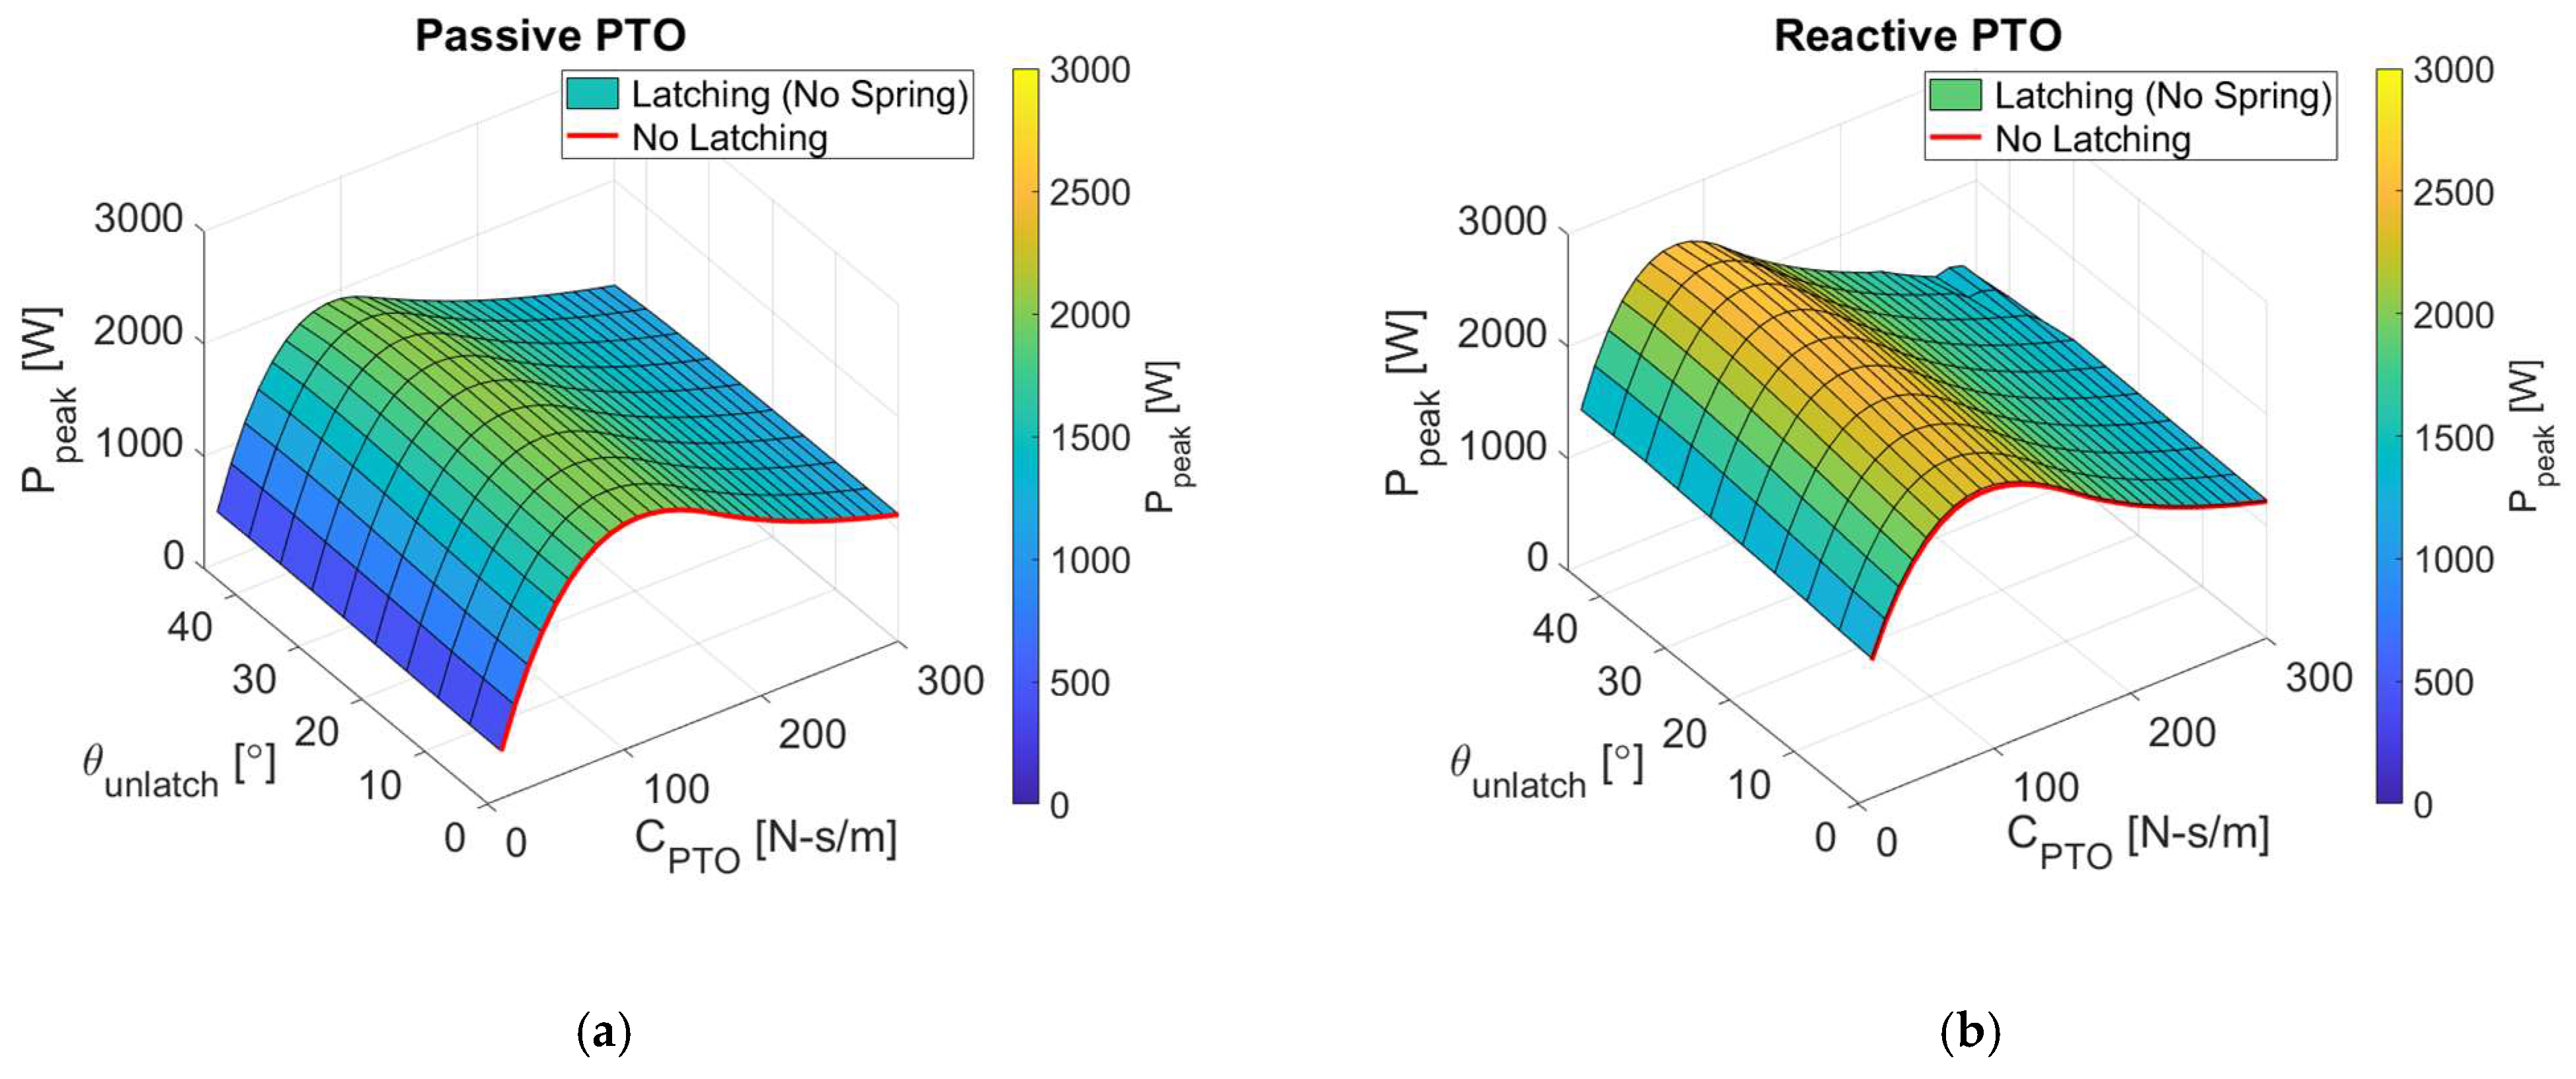
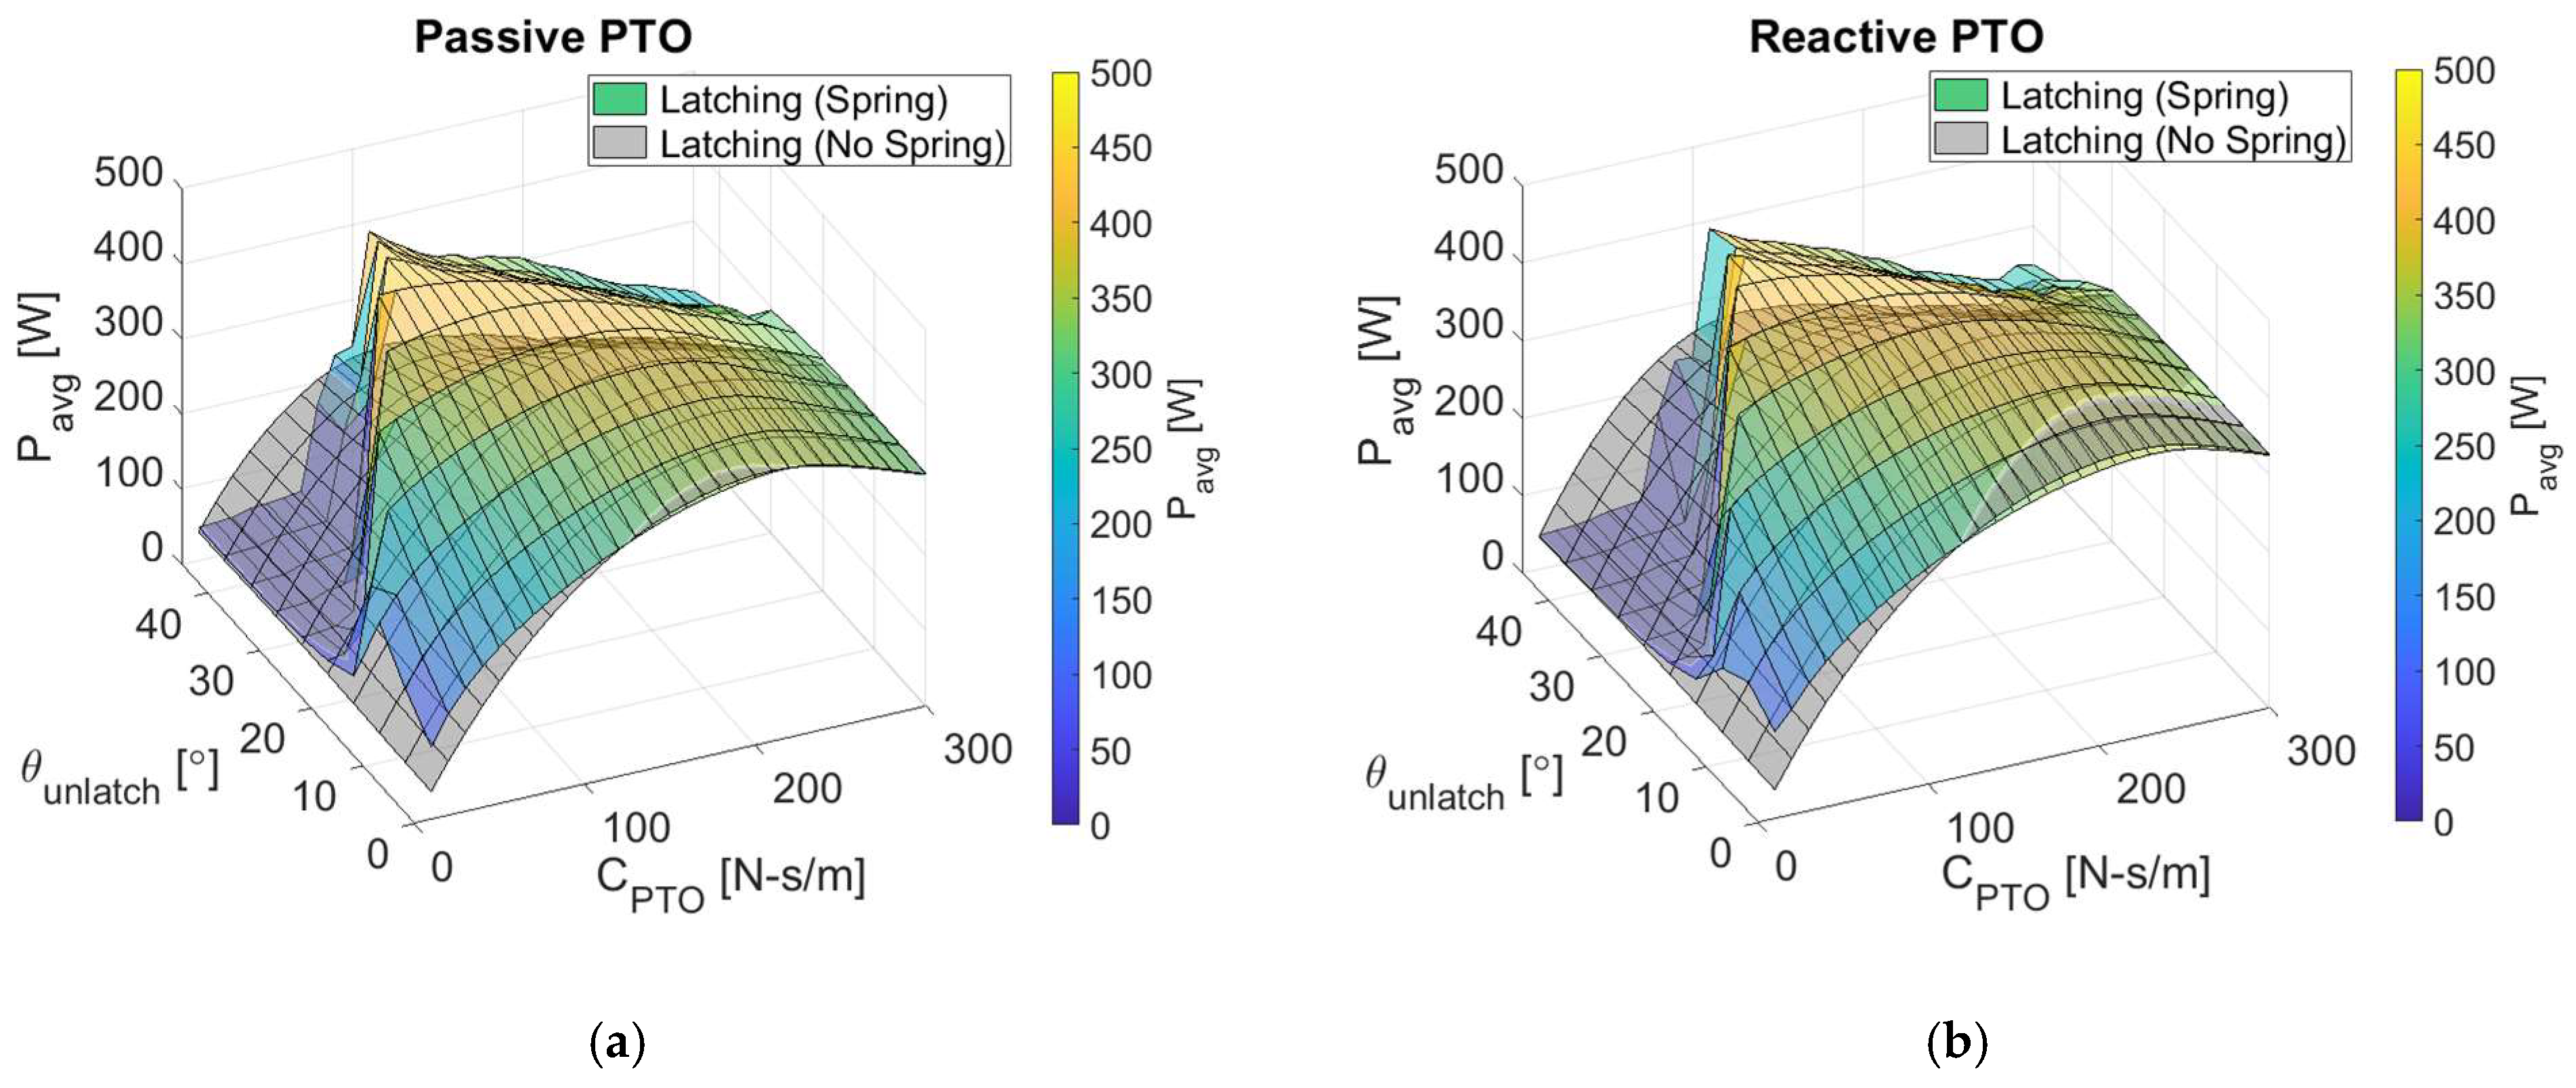
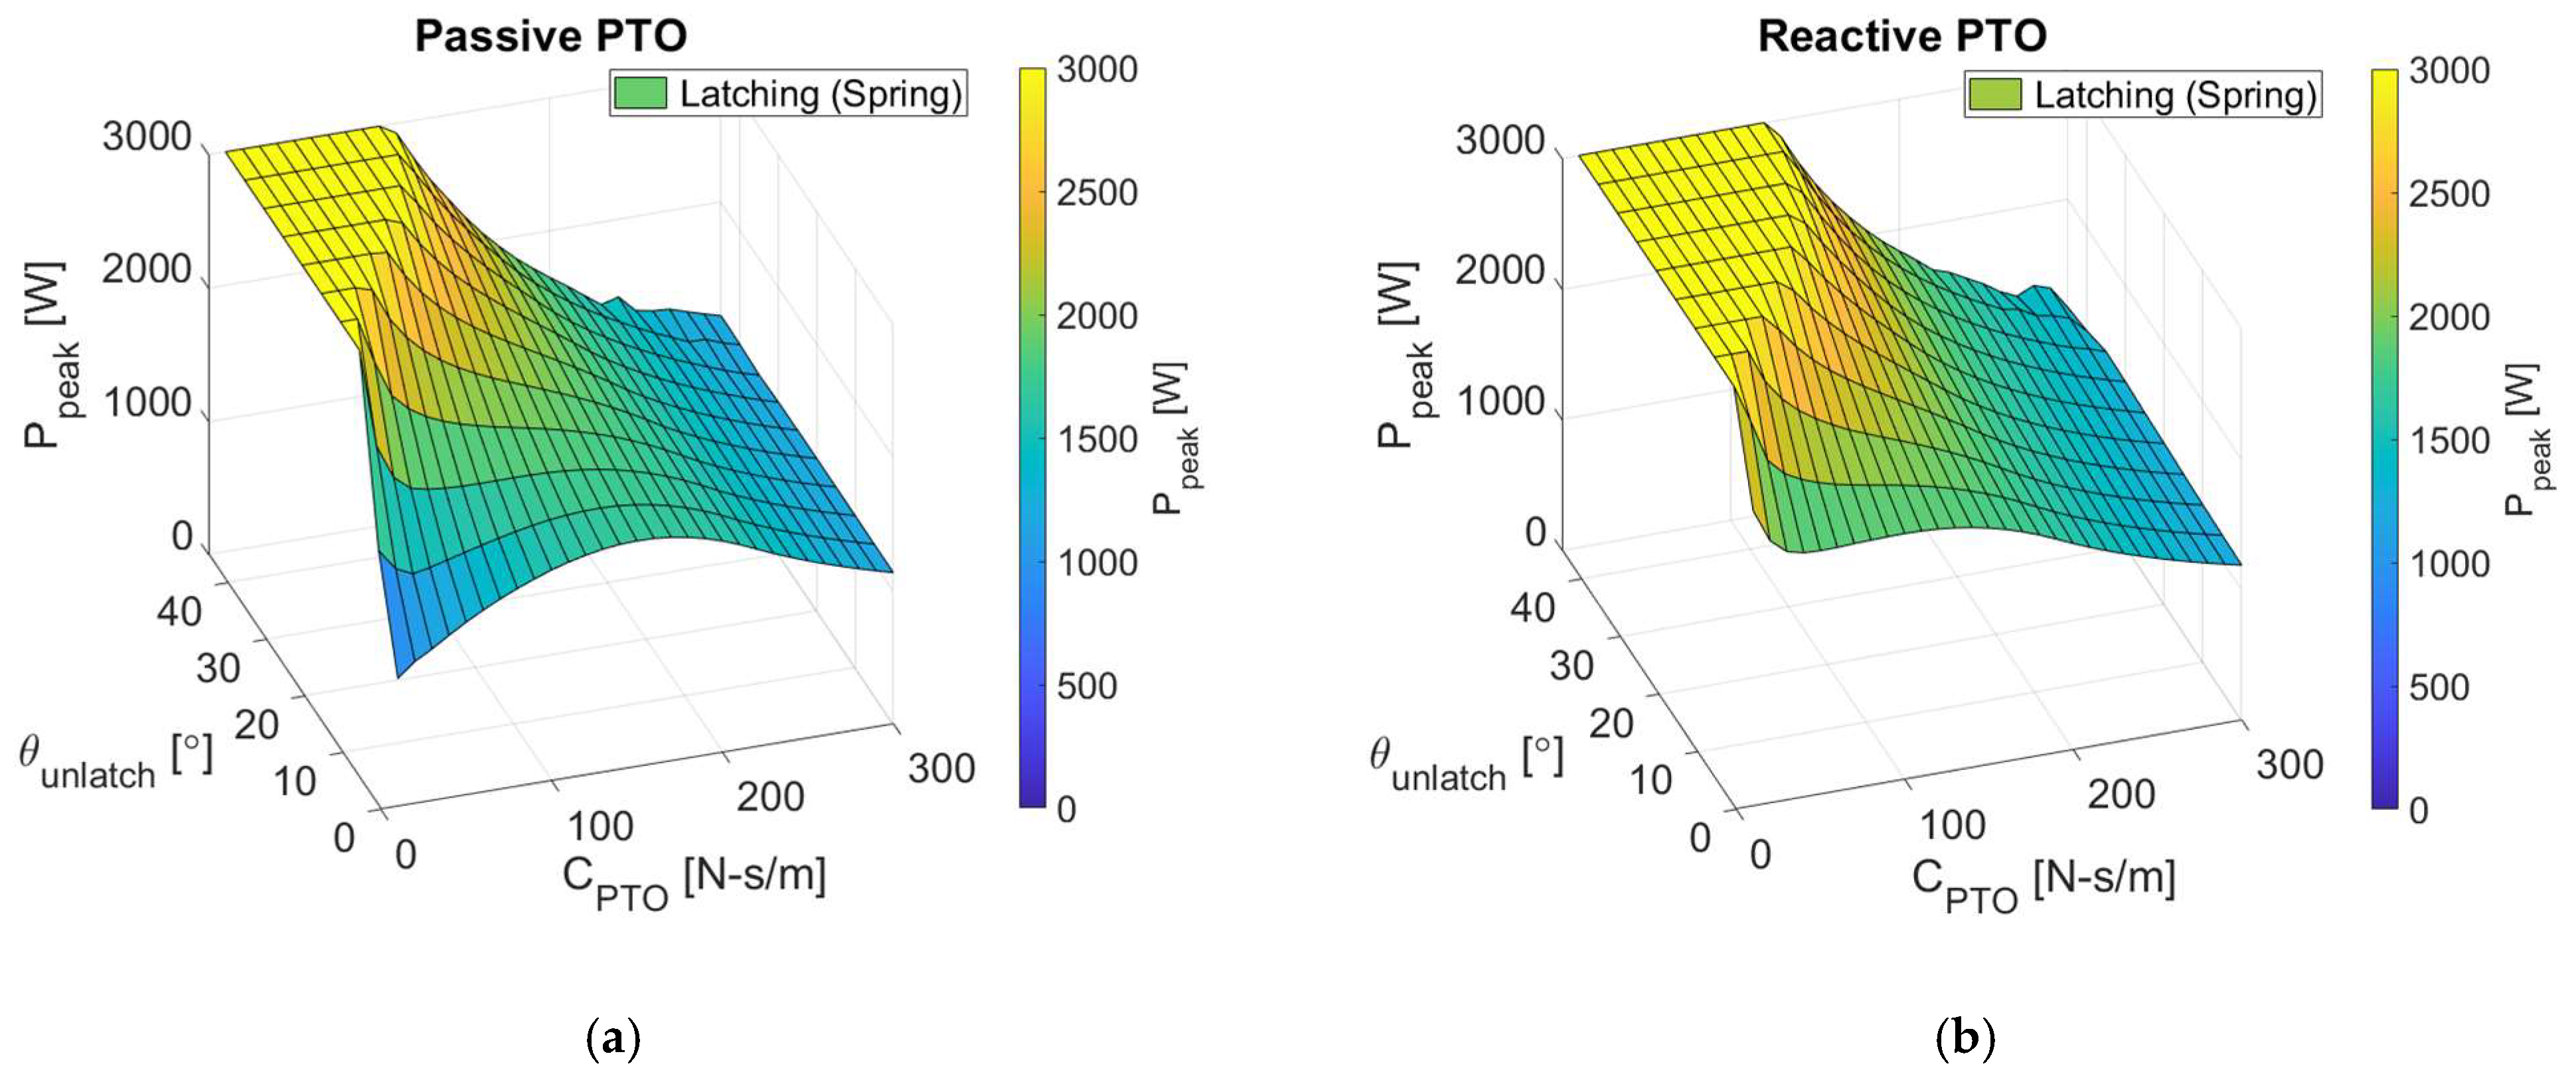
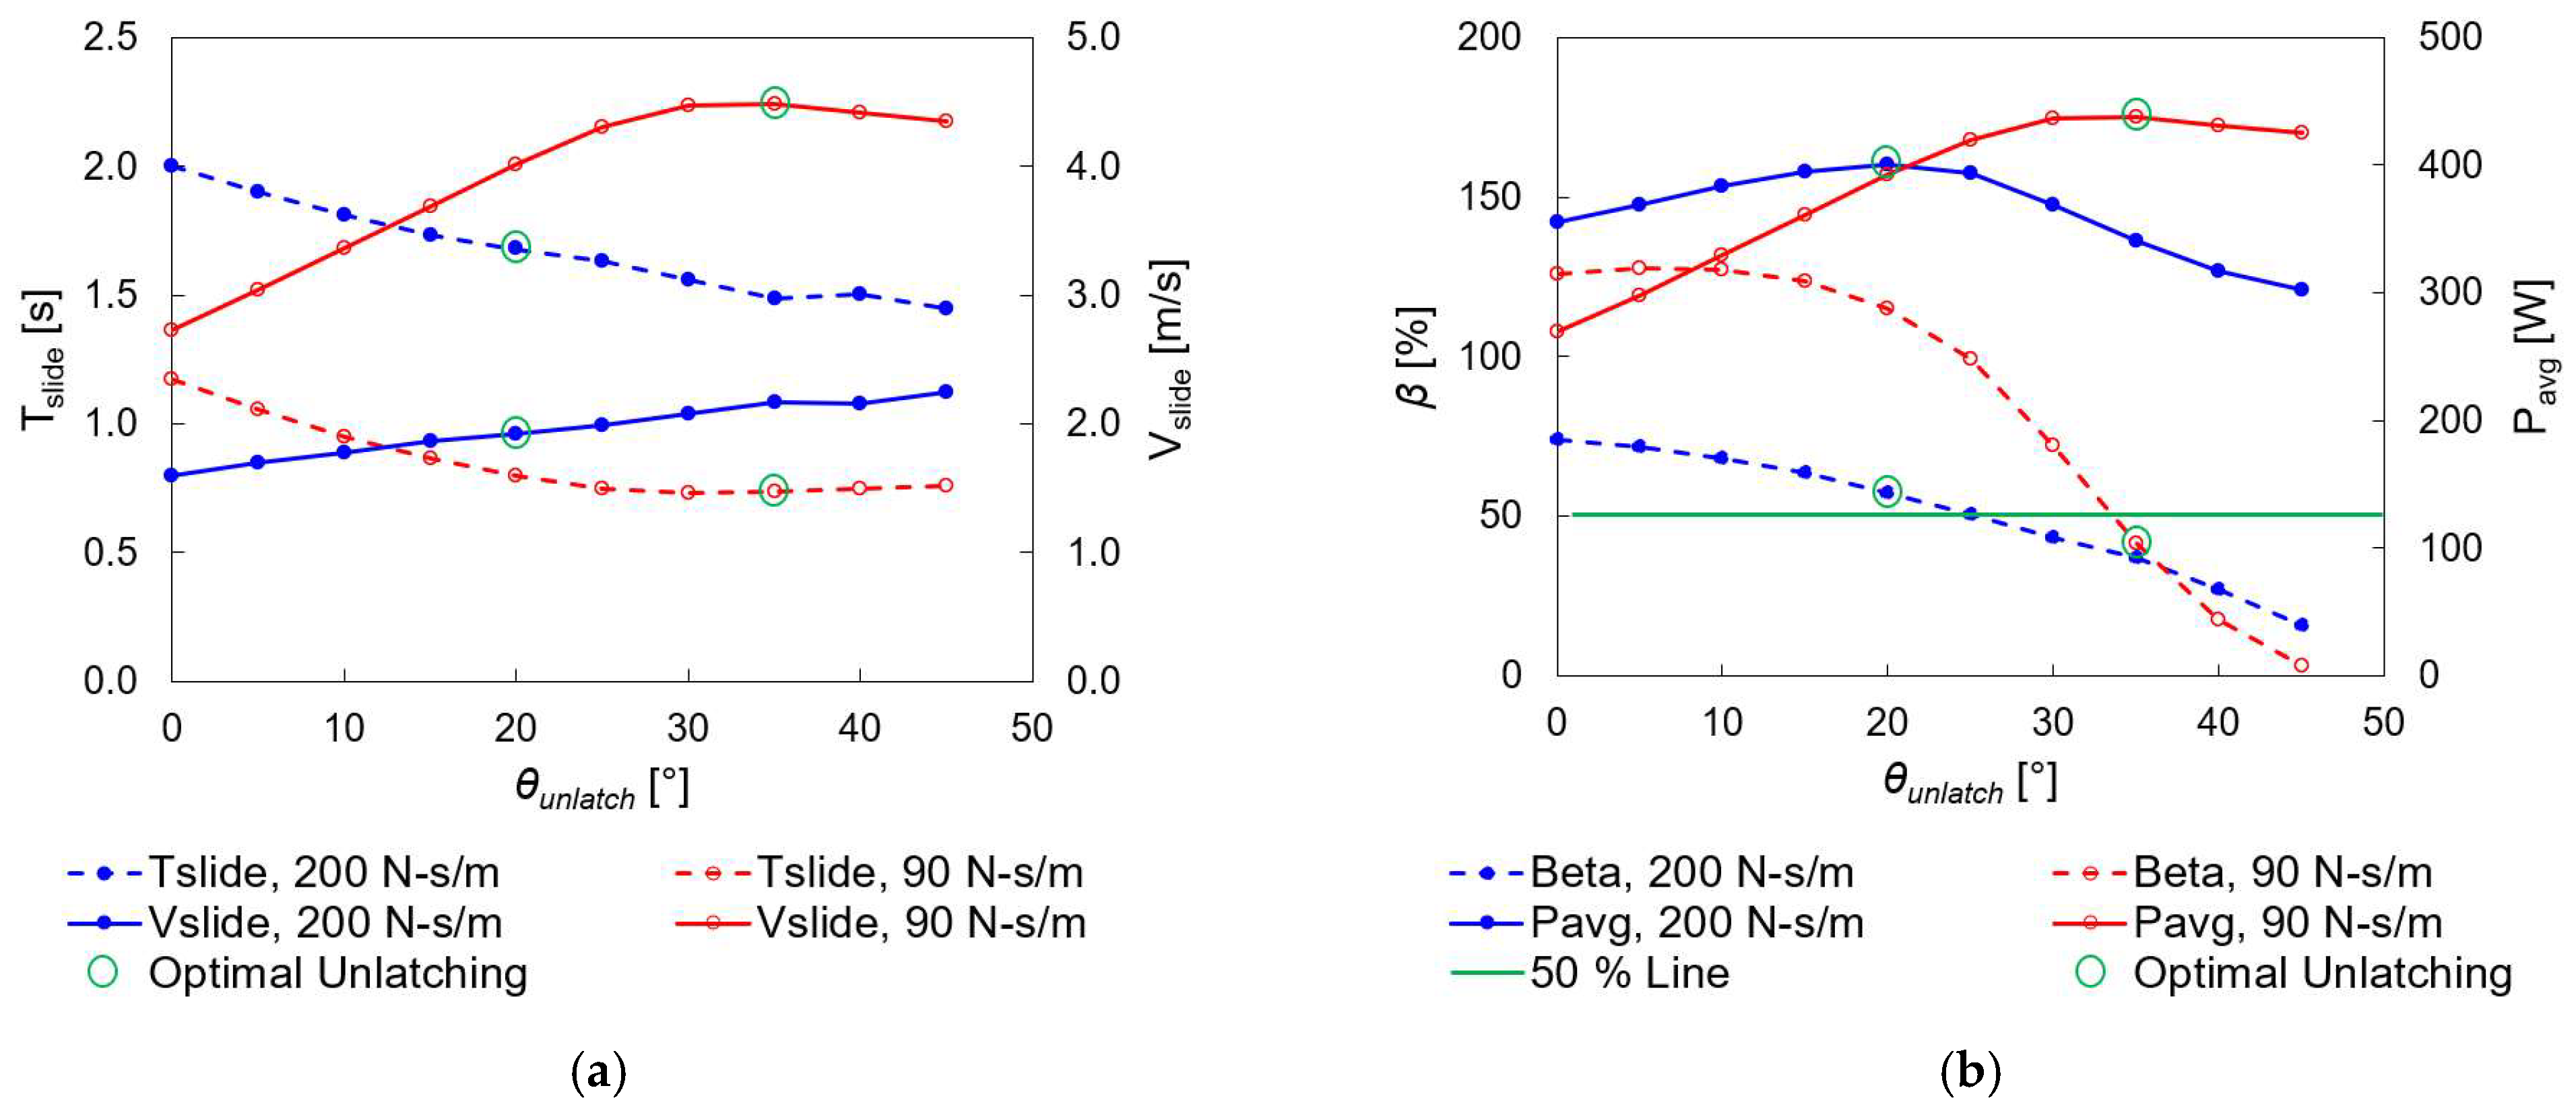
4.1. Latching Control with Constant-Angle Criteria

We conducted two-dimensional parametric studies, varying damping coefficient c P T O from 10 to 300 N-s/m in increments of 10 N-s/m and constant unlatching angles θ u n l a t c h from 0° to 45° in increments of 5°. Note that each time-domain simulation has c P T O and θ u n l a t c h fixed at specific values, while all the time-domain simulations with the reactive PTO control have a constant k P T O defined in Equation (5). Through the two-variable parametric studies, we systematically compared the results to highlight the effects of the end springs, generator power and force limits, and different electrical controls. We compared the results without end spring systems to those with end springs to highlight the importance of the end spring in this latching control application. For the end spring case, we also present the results with the power and force limits to present the optimal condition within the electrical design bounds and then briefly discuss the cases without the limits. The results are also presented side by side for the passive and reactive PTO controls to compare the outcomes from the two different PTO systems.
Figure 5 and Figure 6 illustrate that, in the absence of end springs, the power outputs exhibit a strong dependence on the PTO damping coefficient but a weak dependence on the unlatching angle. The cases of the red line, representing zero-degree unlatching, are equivalent to the situations where there is no latching control. With k P T O , the reactive control produces larger average power than the passive control. Even though the unlatching-angle dependence is not significant, the latching application to the reactive PTO control generates a better enhancement than the passive PTO case, especially when the release angle and c P T O are large. It is also noted the peak powers for all the simulation cases are under the power limit of 3000 W. The average power becomes maximum near c P T O = 200 N-s/m, while the maximum peak power occurs near c P T O = 80–100 N-s/m. We define the maximum average power as the optimal case.
To understand when the maximum average power is produced, Table 3 and Figure 7 compare optimal cases to non-optimal cases that share one of the optimal parameters found, i.e., either damping or unlatching angle. In all three cases, the magnet is unlatched with zero velocity, so a gradual increase in sliding velocity is found. While WEC pitch motions are near-sinusoidal, the patterns of magnet sliding motions, generator forces, and power outputs are highly nonlinear. There exist significant differences in the power generation patterns among different latching parameters, while the pattern remains similar between reactive and passive PTO controls. If c P T O is small, the power output is to be small. If c P T O is too large, the sliding velocity is reduced, resulting in less power generation. In the case of optimal damping (200 N-s/m), the best unlatching time is around 15°–20°. If the magnet is released at much smaller or much larger angles, the sliding velocity with a large c P T O is too slow during the half-pitch period. In these cases, the magnet does not travel the full length until the angle is reversed and slides back. On the other hand, in the optimal case (sufficiently large c P T O and unlatching angle), the magnet tends to travel the full length while generating a large power output. This exemplifies the importance of finding an optimal c P T O and unlatching angle. In the optimal case, additional reactive control further enhances the average power output compared to the passive control.
Figure 8a presents the average power outputs at the optimum unlatching angle as a function of c P T O and the relative enhancement percentage in comparison to those without latching. The figure shows that smaller c P T O results in smaller average power even with greater percentages of enhancement by latching. The relative enhancement is larger in the case of reactive PTO control than passive control. Figure 8b shows that different optimal unlatching angles exist for different PTO damping values. The smaller the damping coefficient is, the larger the optimal unlatching angle becomes.
In the above, we investigated the cases without end springs. Figure 9 shows average power outputs with end springs compared to those without end springs, where significant enhancement is found with end springs. In particular, the enhancement is amplified in the region of smaller c P T O and larger unlatching angles. It is also observed that the damping coefficient 90 N-s/m produces the optimal conditions for both passive and reactive PTO controls. See also the resulting peak power presented in Figure 10. In this case, the maximum power larger than the power limitation value of 3000 W occurs in the small-damping region of less than 60 N-s/m, which corresponds to the flat part at the top. In this region, the average power also drops significantly due to the energy leak compared to the no-spring case.
Table 4 and Figure 11 are for the cases of end springs and correspond to Table 3 and Figure 7 of the no-spring case. With end springs, the average power outputs with the optimal c P T O and unlatching angle are significantly enhanced compared to other non-optimal cases. In other words, the latching control plays a much more important role compared to no-spring cases. In the optimal case, the magnet experiences a large excitation force during the travel. On the other hand, under the ineffective unlatching condition (0° unlatching), the magnet experiences a small excitation force during the sliding by traveling at small inclination angles. In the case of large damping (300 N-s/m), the magnet frequently fails to reach the ends of the tube, resulting in a diminished latching effect.
In the case of end springs, the power outputs are very similar between the passive and reactive PTO controls under the optimal damping coefficient (90 N-s/m). Because of the linear k P T O term in the generator force of the reactive PTO control, it produces a correspondingly linear increase in power output compared to the passive control case, which is not necessarily advantageous when the generated power exceeds the imposed power limit. From a practical point of view, a larger average power with smaller peaks (fluctuations) is the best.
The energy efficiency η with respect to the PTO motion in Table 4 shows that there is no energy loss due to the application of the end spring as it stores the residual kinetic energy of the magnet. However, this happens only under the ideal condition of no friction, as assumed in this paper. In Figure 12, the optimal condition with end springs ( c P T O = 90 N-s/m and θ u n l a t c h = 35°) is directly compared to the optimal condition without end springs ( c P T O = 200 N-s/m and θ u n l a t c h = 15–20°). An additional case of no end springs ( c P T O = 90 N-s/m and θ u n l a t c h = 35°) is also plotted as a reference. For this reference case, the resulting average powers are 235.6 W and 267.5 W for the passive and reactive PTO controls, respectively. In these cases, the efficiency η is 67% and 70%, respectively, indicating a rather significant energy loss due to the loss of magnet kinetic energy at both ends of the tube.
Figure 13 summarizes the power enhancements resulting from optimal unlatching with end springs as a function of c P T O values and compares them to other non-optimal cases. The case of unlatching angle = 0° with end springs shows that even with end springs, if the unlatching timing is not right, there is no significant average power increase compared to the no-spring case. When optimal unlatching timing is applied, the largest average power increase occurs near c P T O = 80–90 N-s/m. When c P T O is smaller than 70 N-s/m, the average power drops rapidly because the generated power exceeds the imposed power limit, leading to significant energy leaks (see Figure 10). Figure 14 shows the corresponding optimal unlatching angles as a function of the PTO damping coefficient. When c P T O is larger than the optimal damping, the optimal unlatching angles decrease with c P T O . Otherwise, the opposite is true. The overall trend of power output and optimal unlatching angle is similar between passive and reactive PTO controls.
Next, let us compare the above case with power limitation to the one without. In the latter scenario, we remove the power- and force-limiting conditions, assuming a sufficiently large generator capacity. Then, the energy leak issue caused by limiting the generator power and force for small c P T O disappears. The results are given in Figure 15. In this case, the best average power production happens when c P T O = 20–30 N-s/m with an unlatching angle of 45° for both PTO controls. Then, passive and reactive controls produce the best average power of 468.3 W and 469.7 W, respectively. Figure 16 shows that the optimal unlatching angles monotonically decrease as c P T O increases for both passive and reactive PTO controls. The reactive PTO control generates a larger peak power (i.e., 10,331.8 W) than the passive case (i.e., 8128.9 W). The energy leaks associated with limiting the large peak powers within 3000 W are substantial in the small- c P T O region, leading to a significant reduction in the corresponding average power, as shown in Figure 9, Figure 10 and Figure 13 compared to Figure 15. The extremely high peak powers may pose practical challenges for generator design, despite some gains in average power production. This means that the examples with reasonable power and force limitations are more practical.

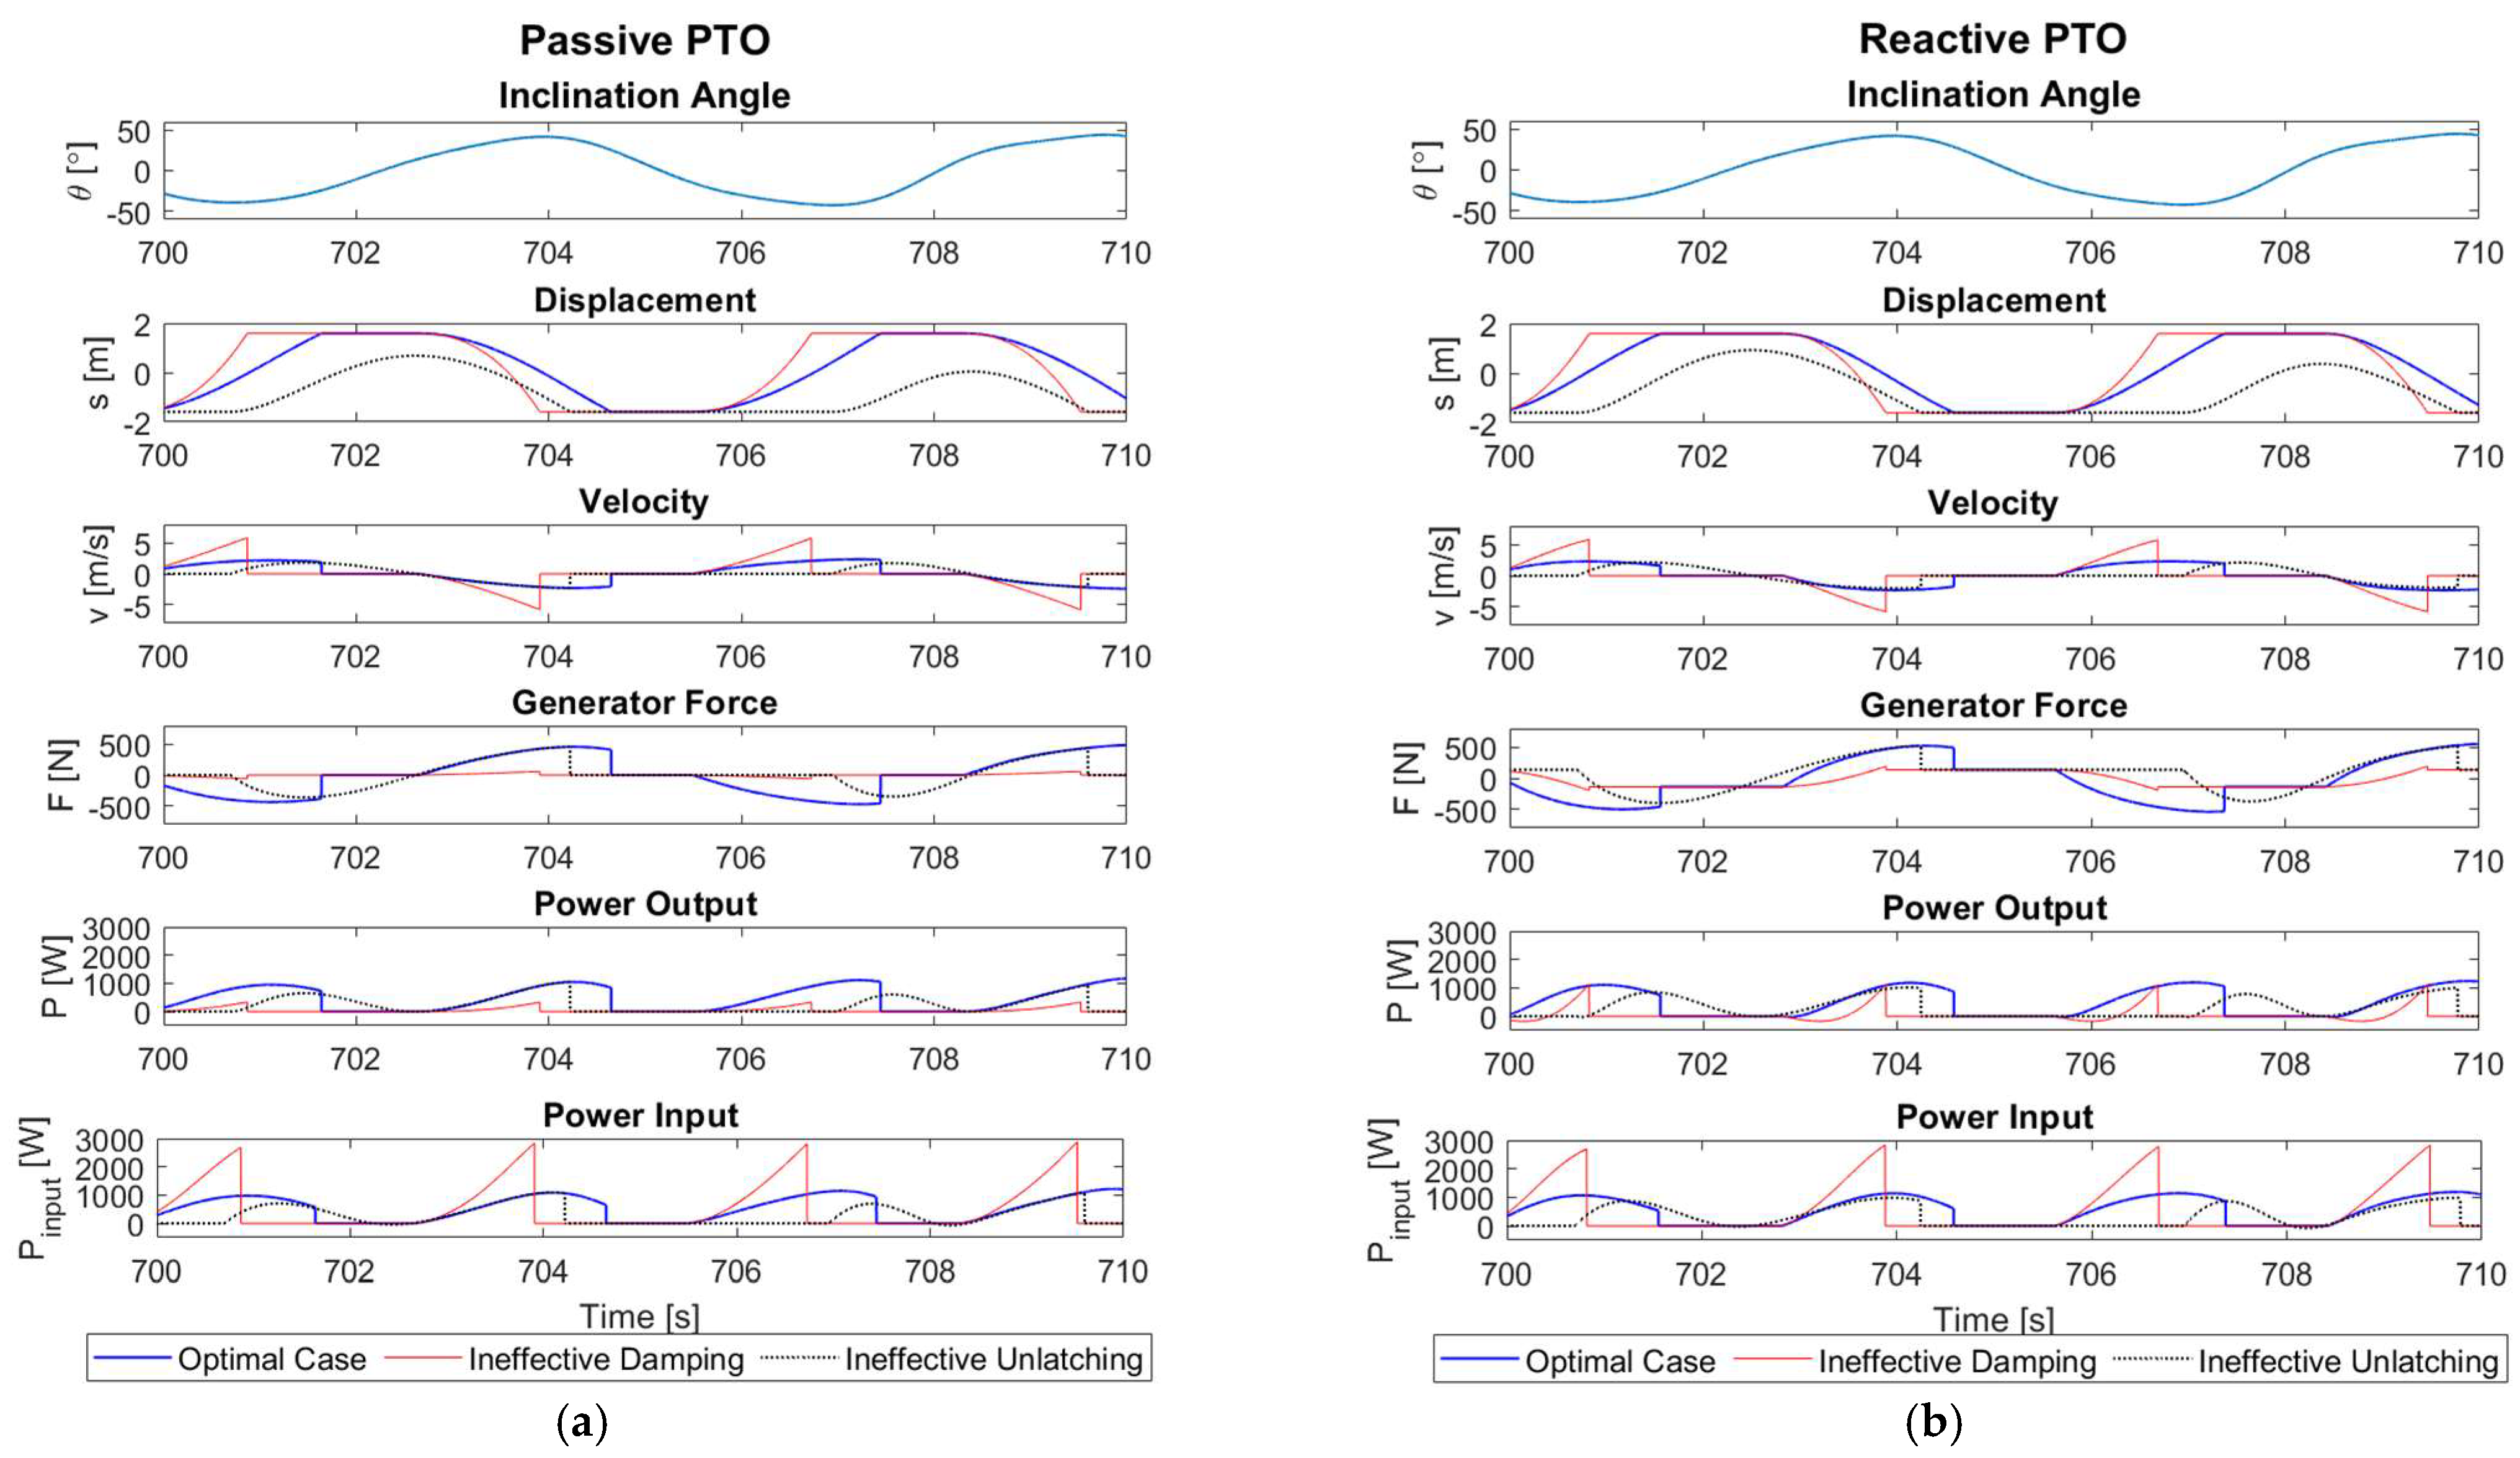
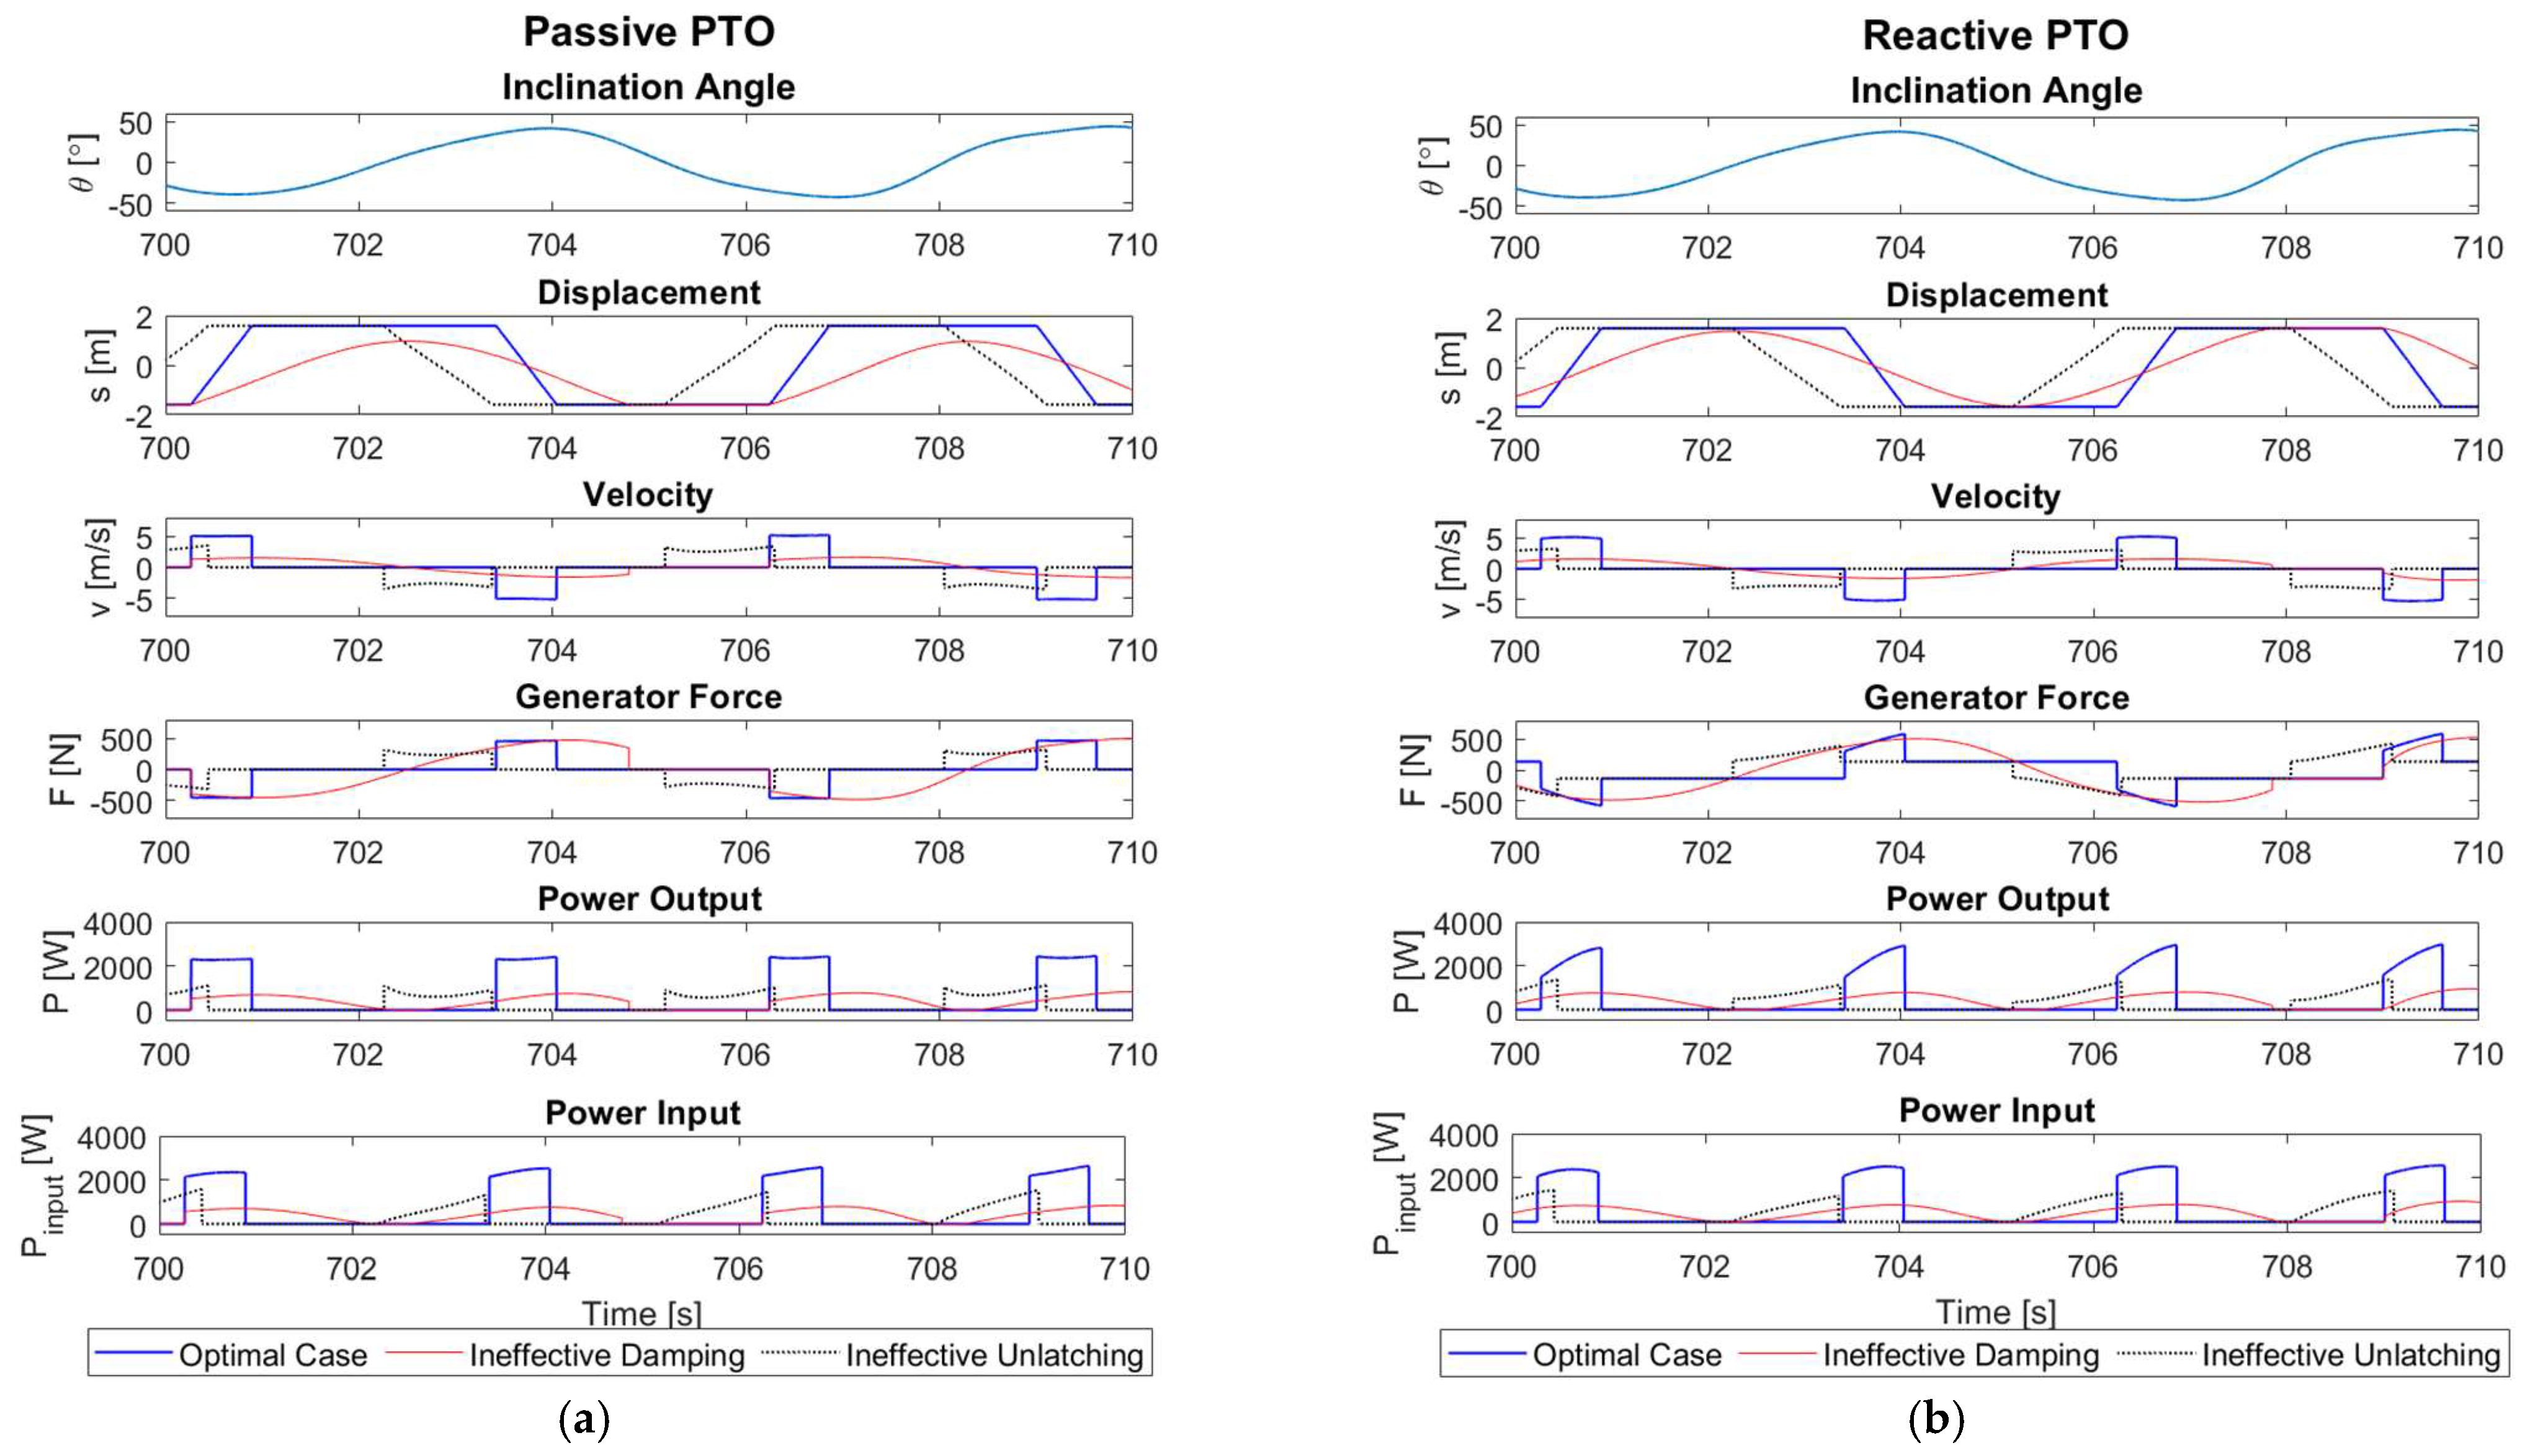
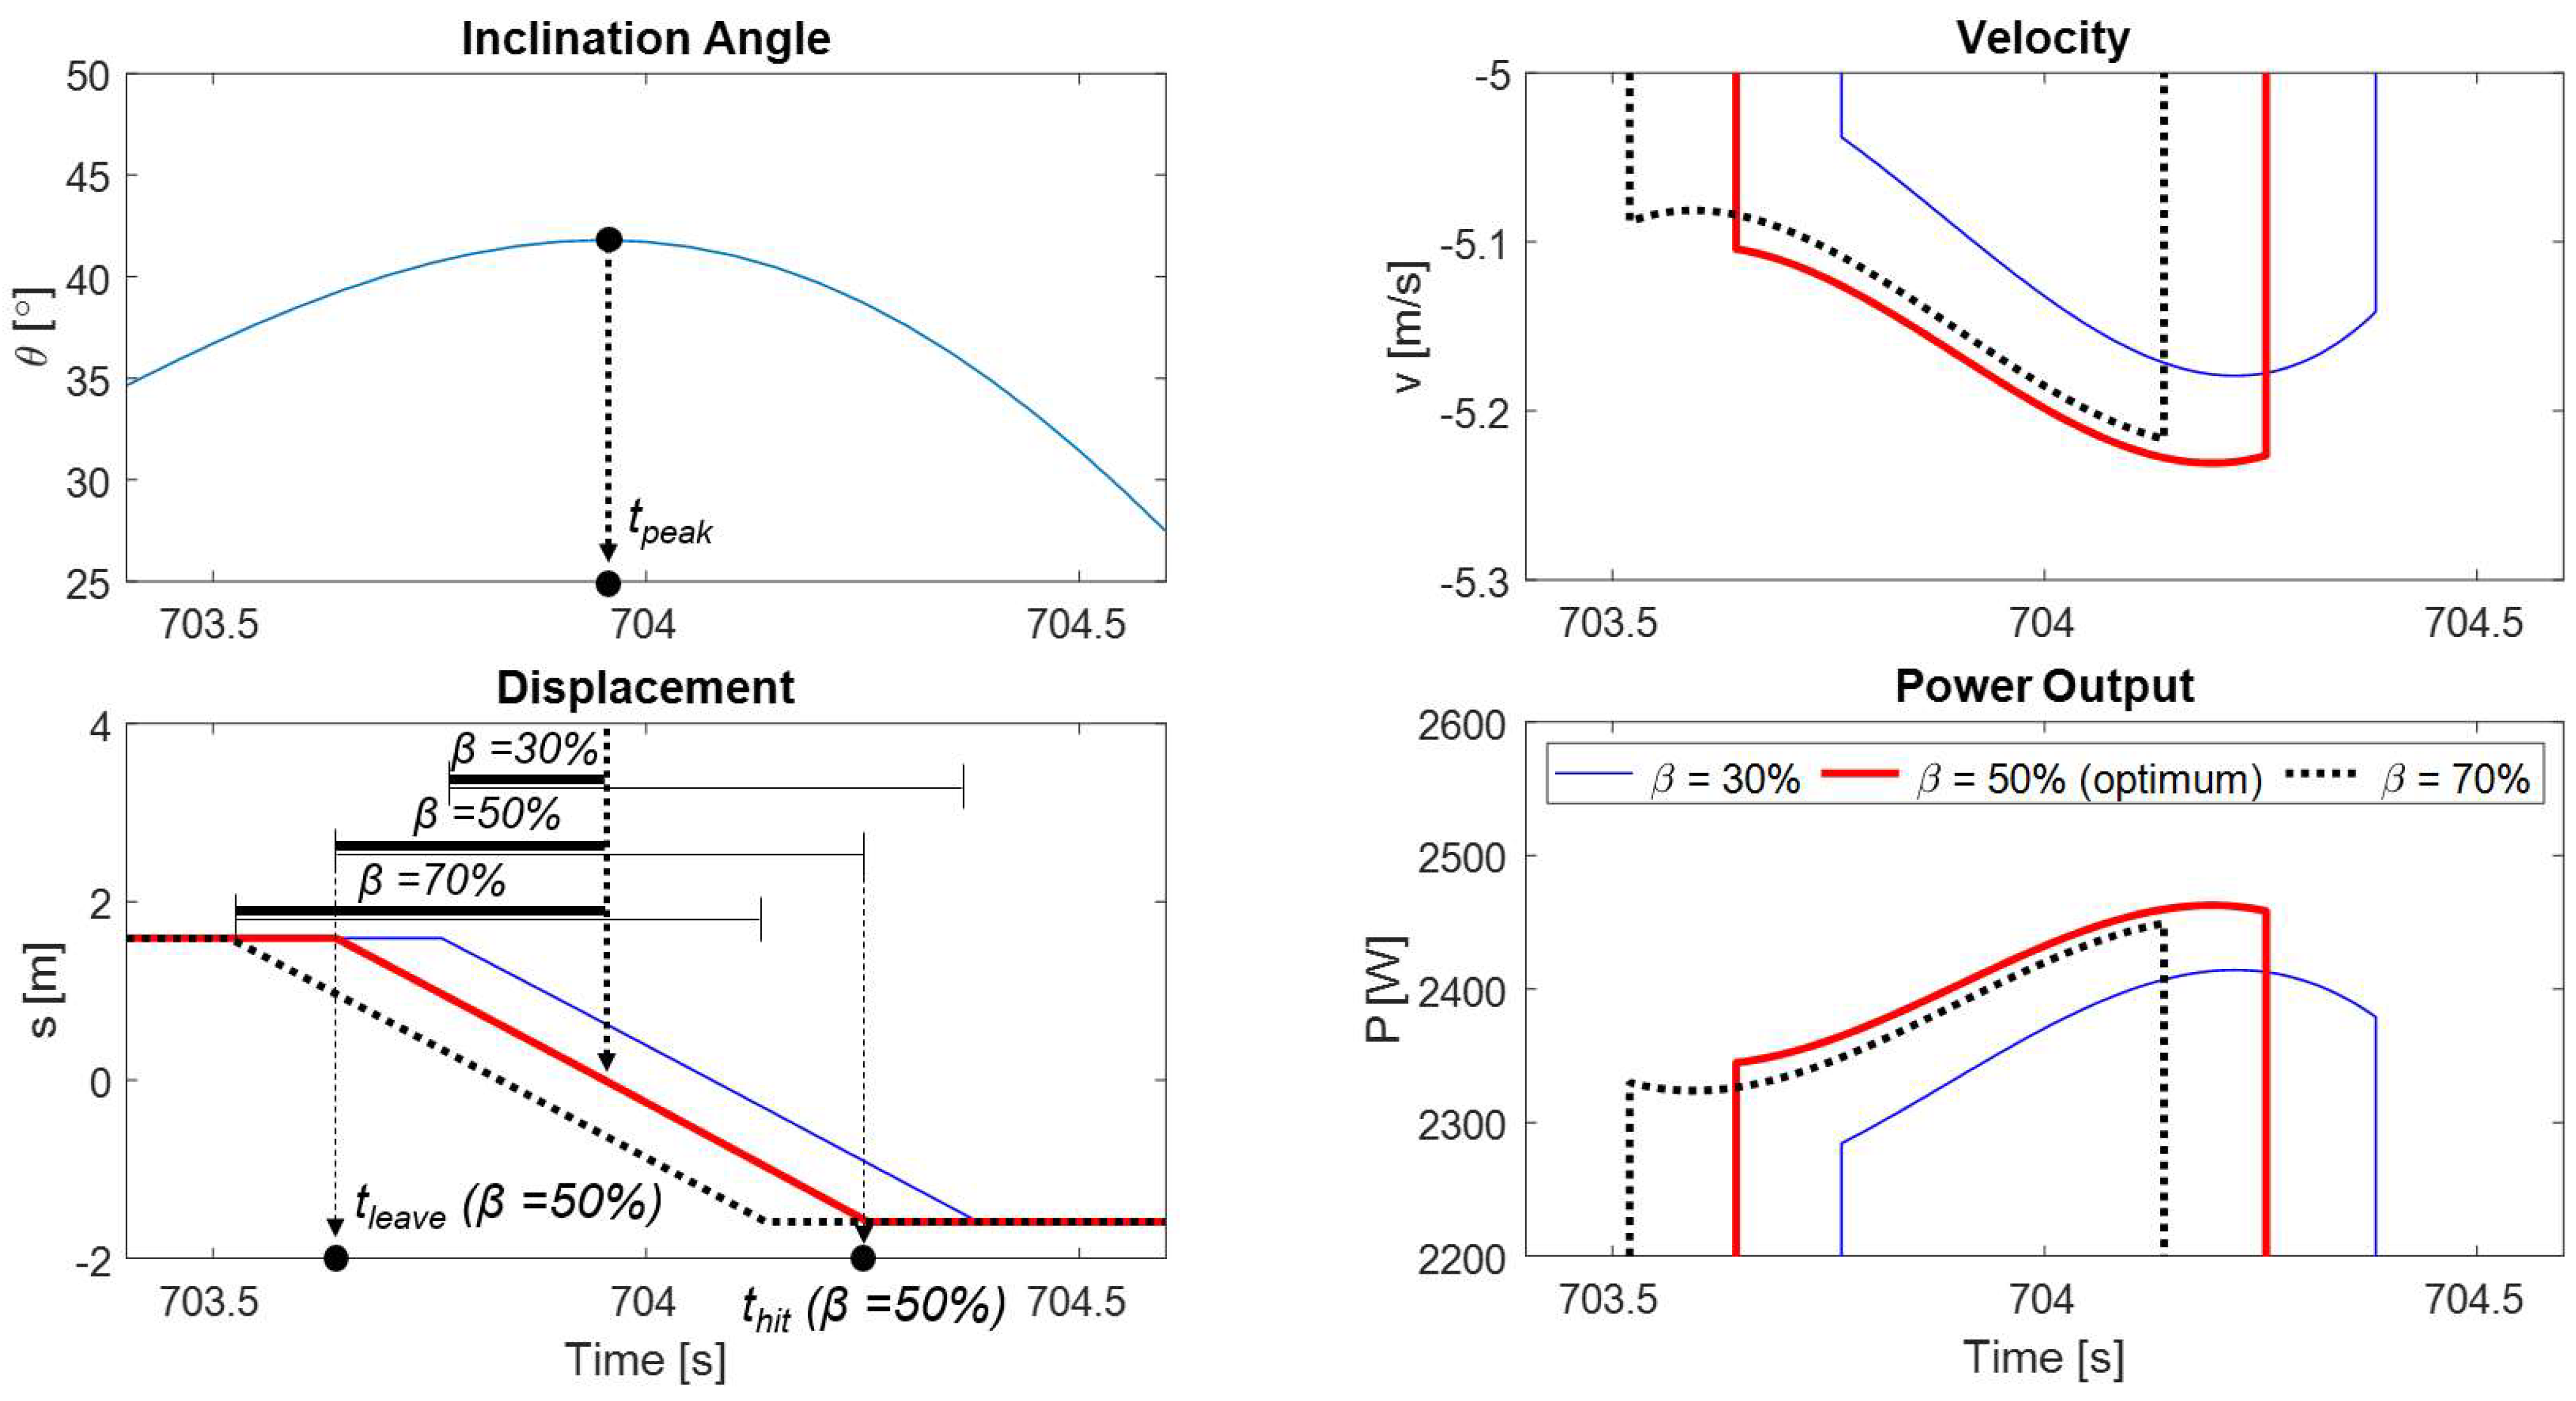
4.2. Phase Relations under Optimal Latching

In general, a smaller optimal c P T O generates a lower current, meaning less loss. In formulating sliding parameters, we confirm that sliding velocity is directly related to the damping coefficient, and it is critical in achieving the optimal power under latching control. This explains why the optimal damping has shifted from 200 N-s/m without end springs to 90 N-s/m (power and force limits) with end springs. We also identify a phase relation between the excitation and the magnet sliding for the optimal latching control. T s l i d e and v ¯ s l i d e are the travel time ( = t h i t t l e a v e ) from one end ( t l e a v e ) to the other end ( t h i t ) and the average speed during the slide, respectively. We define the relative position of the peak of excitation (or inclination angle) during each sliding as β = t p e a k t l e a v e t h i t t l e a v e × 100   [ % ] , where t p e a k represents the time when the excitation (or the inclination angle) reaches its peak value within the corresponding oscillation.
Our extensive numerical simulations revealed that the optimal unlatching coincided with the peak angle at the middle of the travel displacement for the cases with end springs. This alignment also corresponds to β 50 % . This means that the best unlatching time is slightly before the pitch angle reaches its maximum. When the maximum angle occurs in the middle of the travel distance or time, it allows for the largest slide angles to be maintained throughout the full slide. This case offers the best unlatching time and produces the maximum average power output. Figure 17 illustrates the above discussion in more detail. In Figure 17a, the travel time and average velocity of the end spring cases are plotted for the PTO damping 200 N-s/m and 90 N-s/m. The green circles on the graphs correspond to the best unlatching angles for each case. We have the best case when both the sliding velocity and travel time become adequate, which corresponds to the case of β 50%.
To verify the new phase matching concept of β 50%, we additionally applied the desired phase matching instant as an unlatching instant strategy in the passive PTO control cases under non-limiting power and force conditions, which we refer to as target unlatching. To achieve the desired peak inclination angle during each magnet sliding occurrence, the unlatching instant t l e a v e is adjusted for every oscillation, respectively. By varying β t a r g e t as a simulation input for each test, the resulting parameters including average power P a v g are compared in Table 5. The actual resulting parameter β is also quantified for the verification of the target matching. The 50% target unlatching case produced the best power outcomes as expected, as shown in Figure 18.

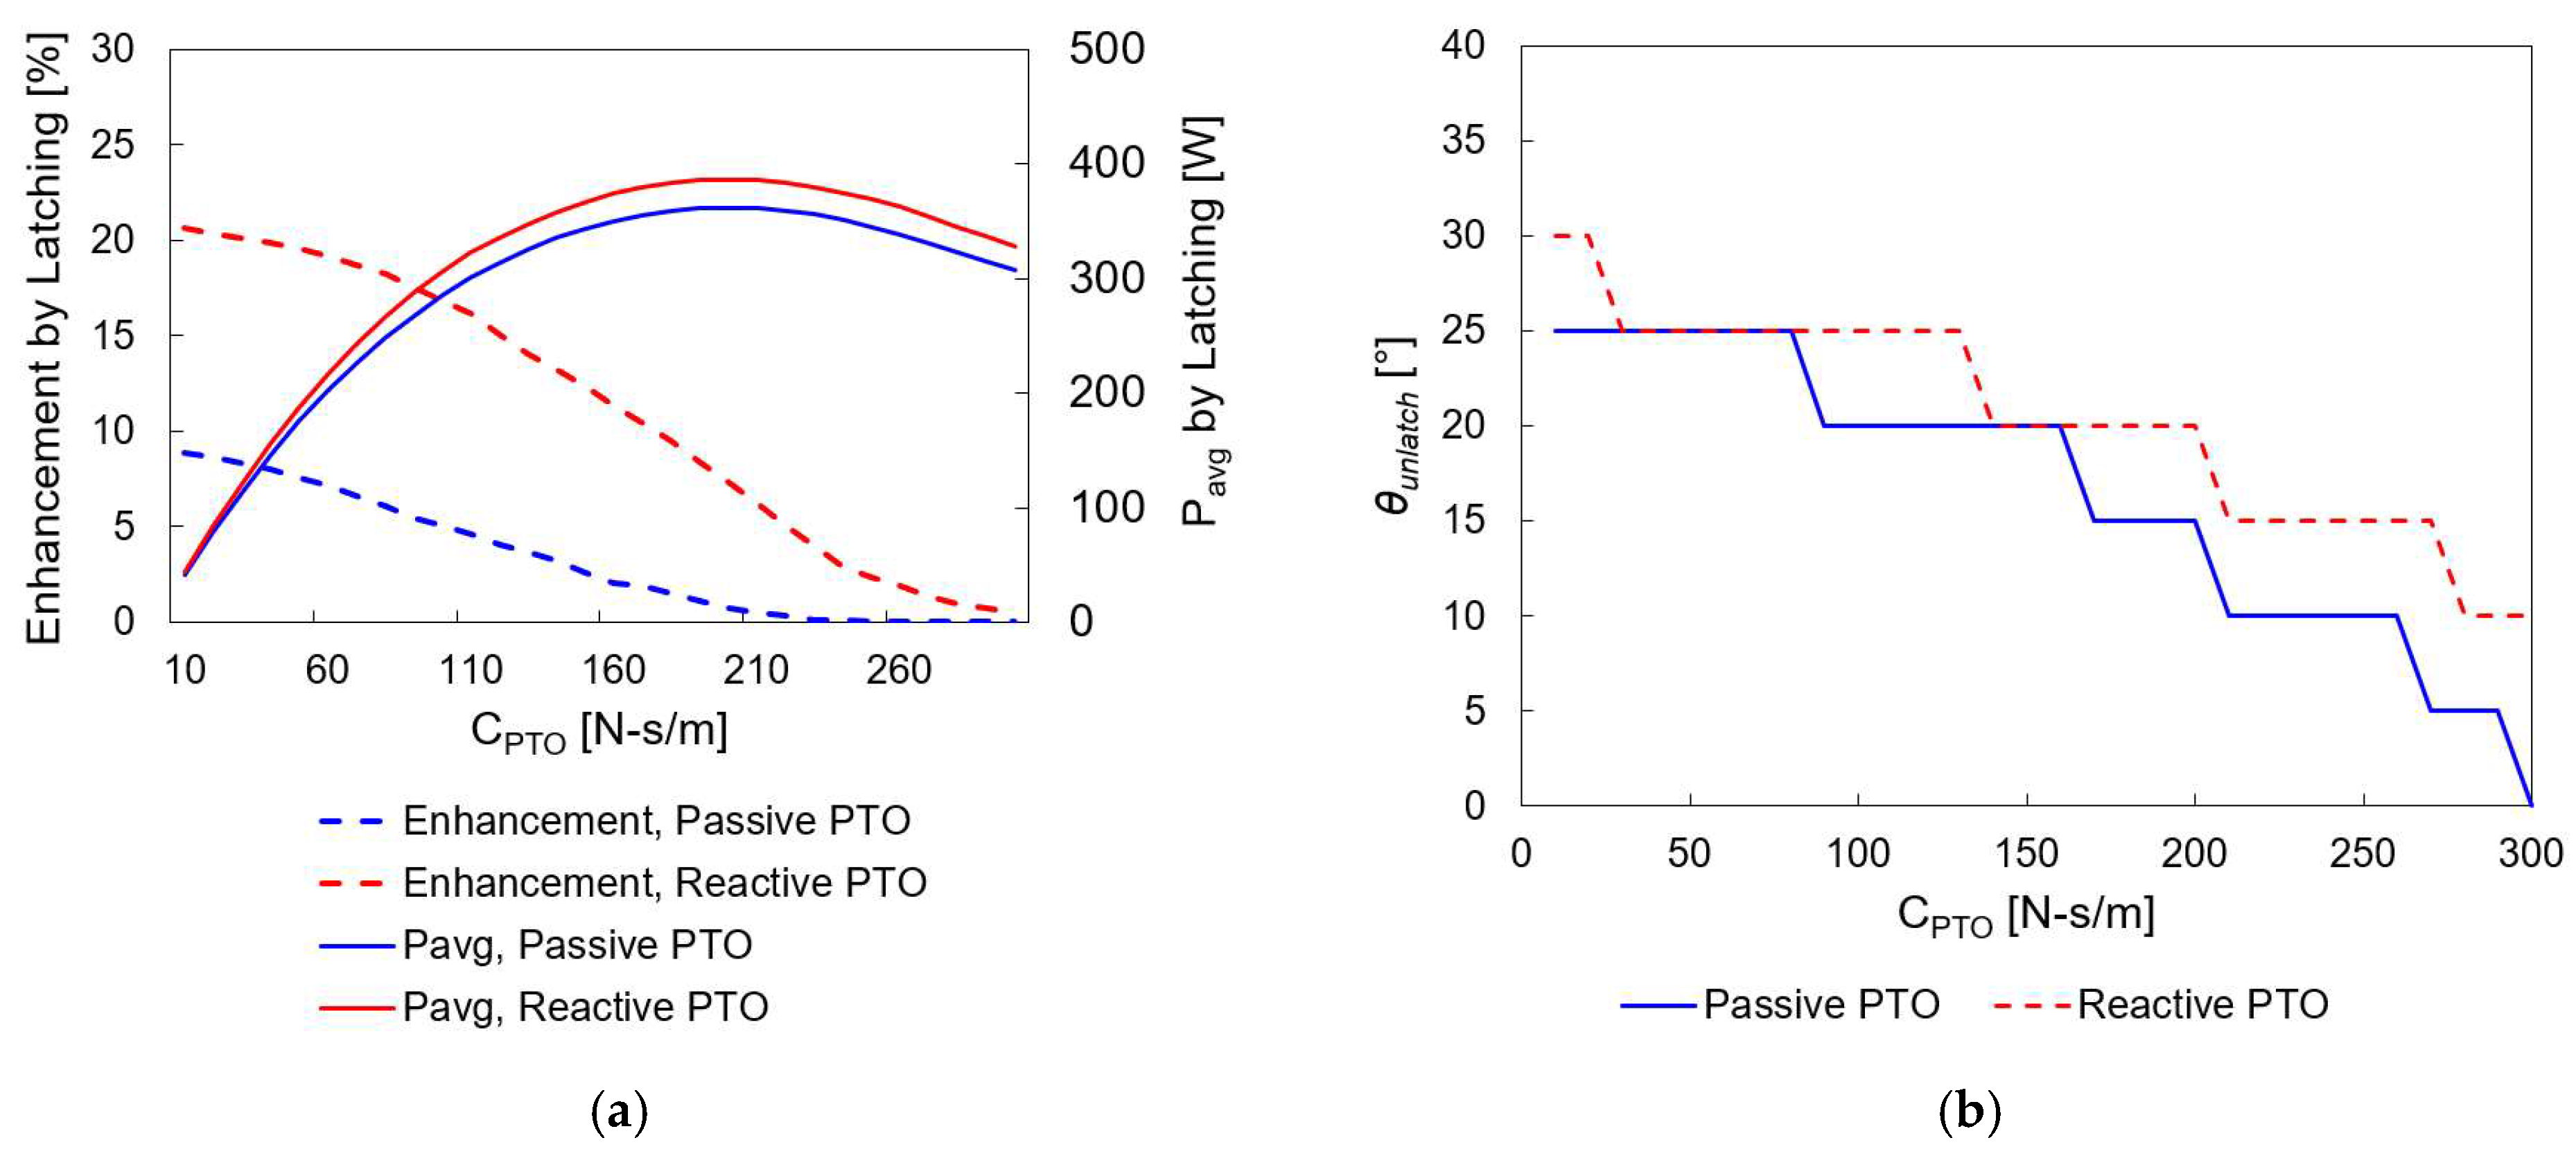
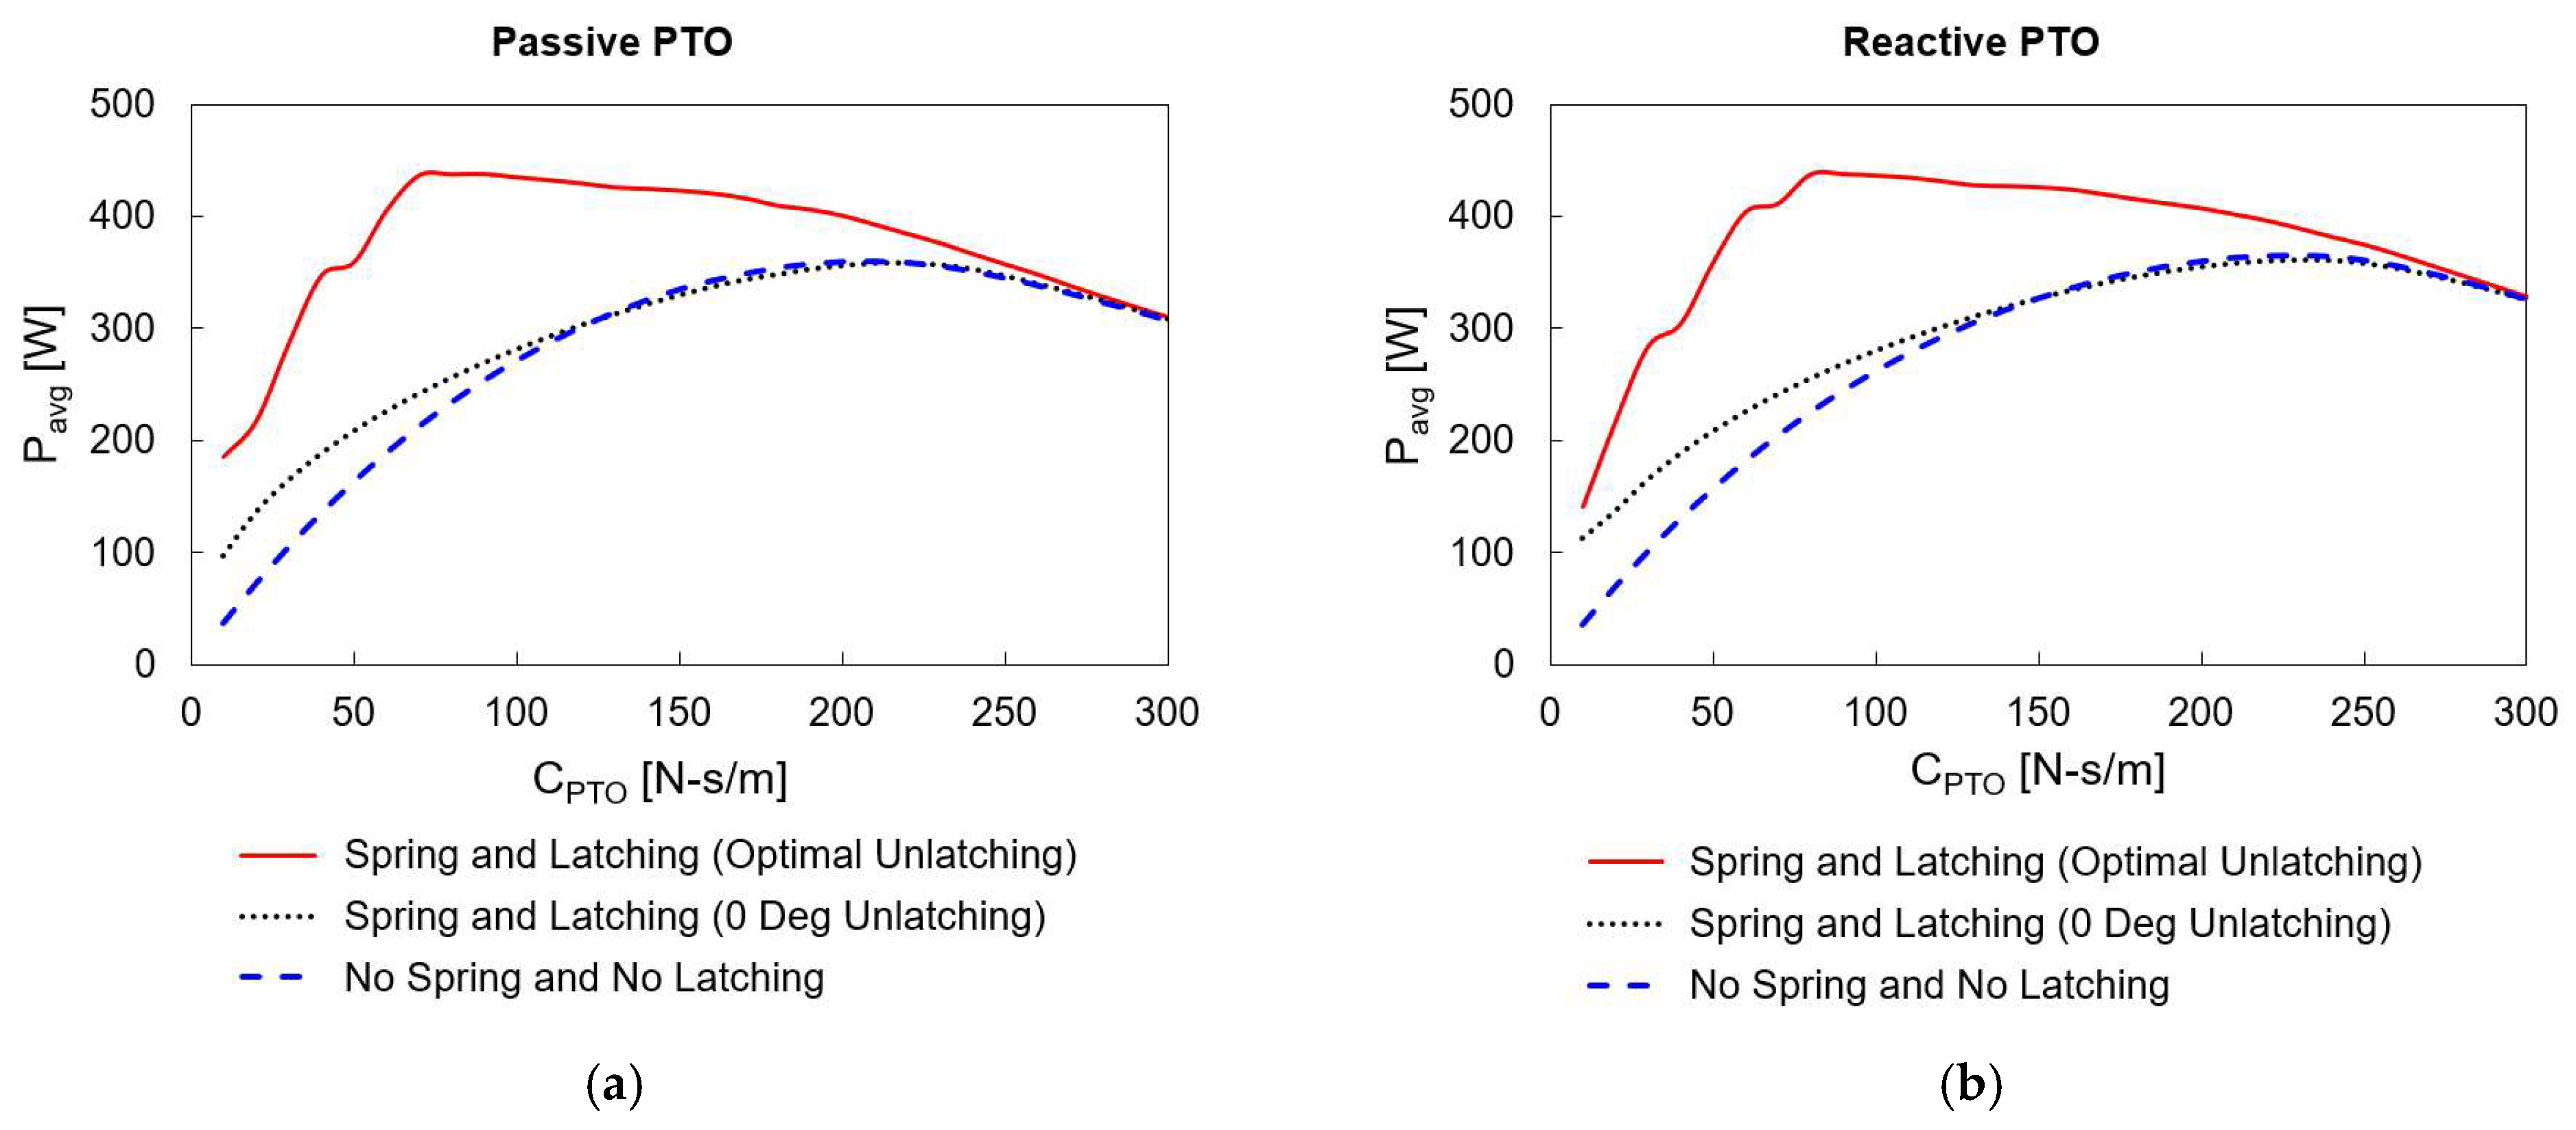
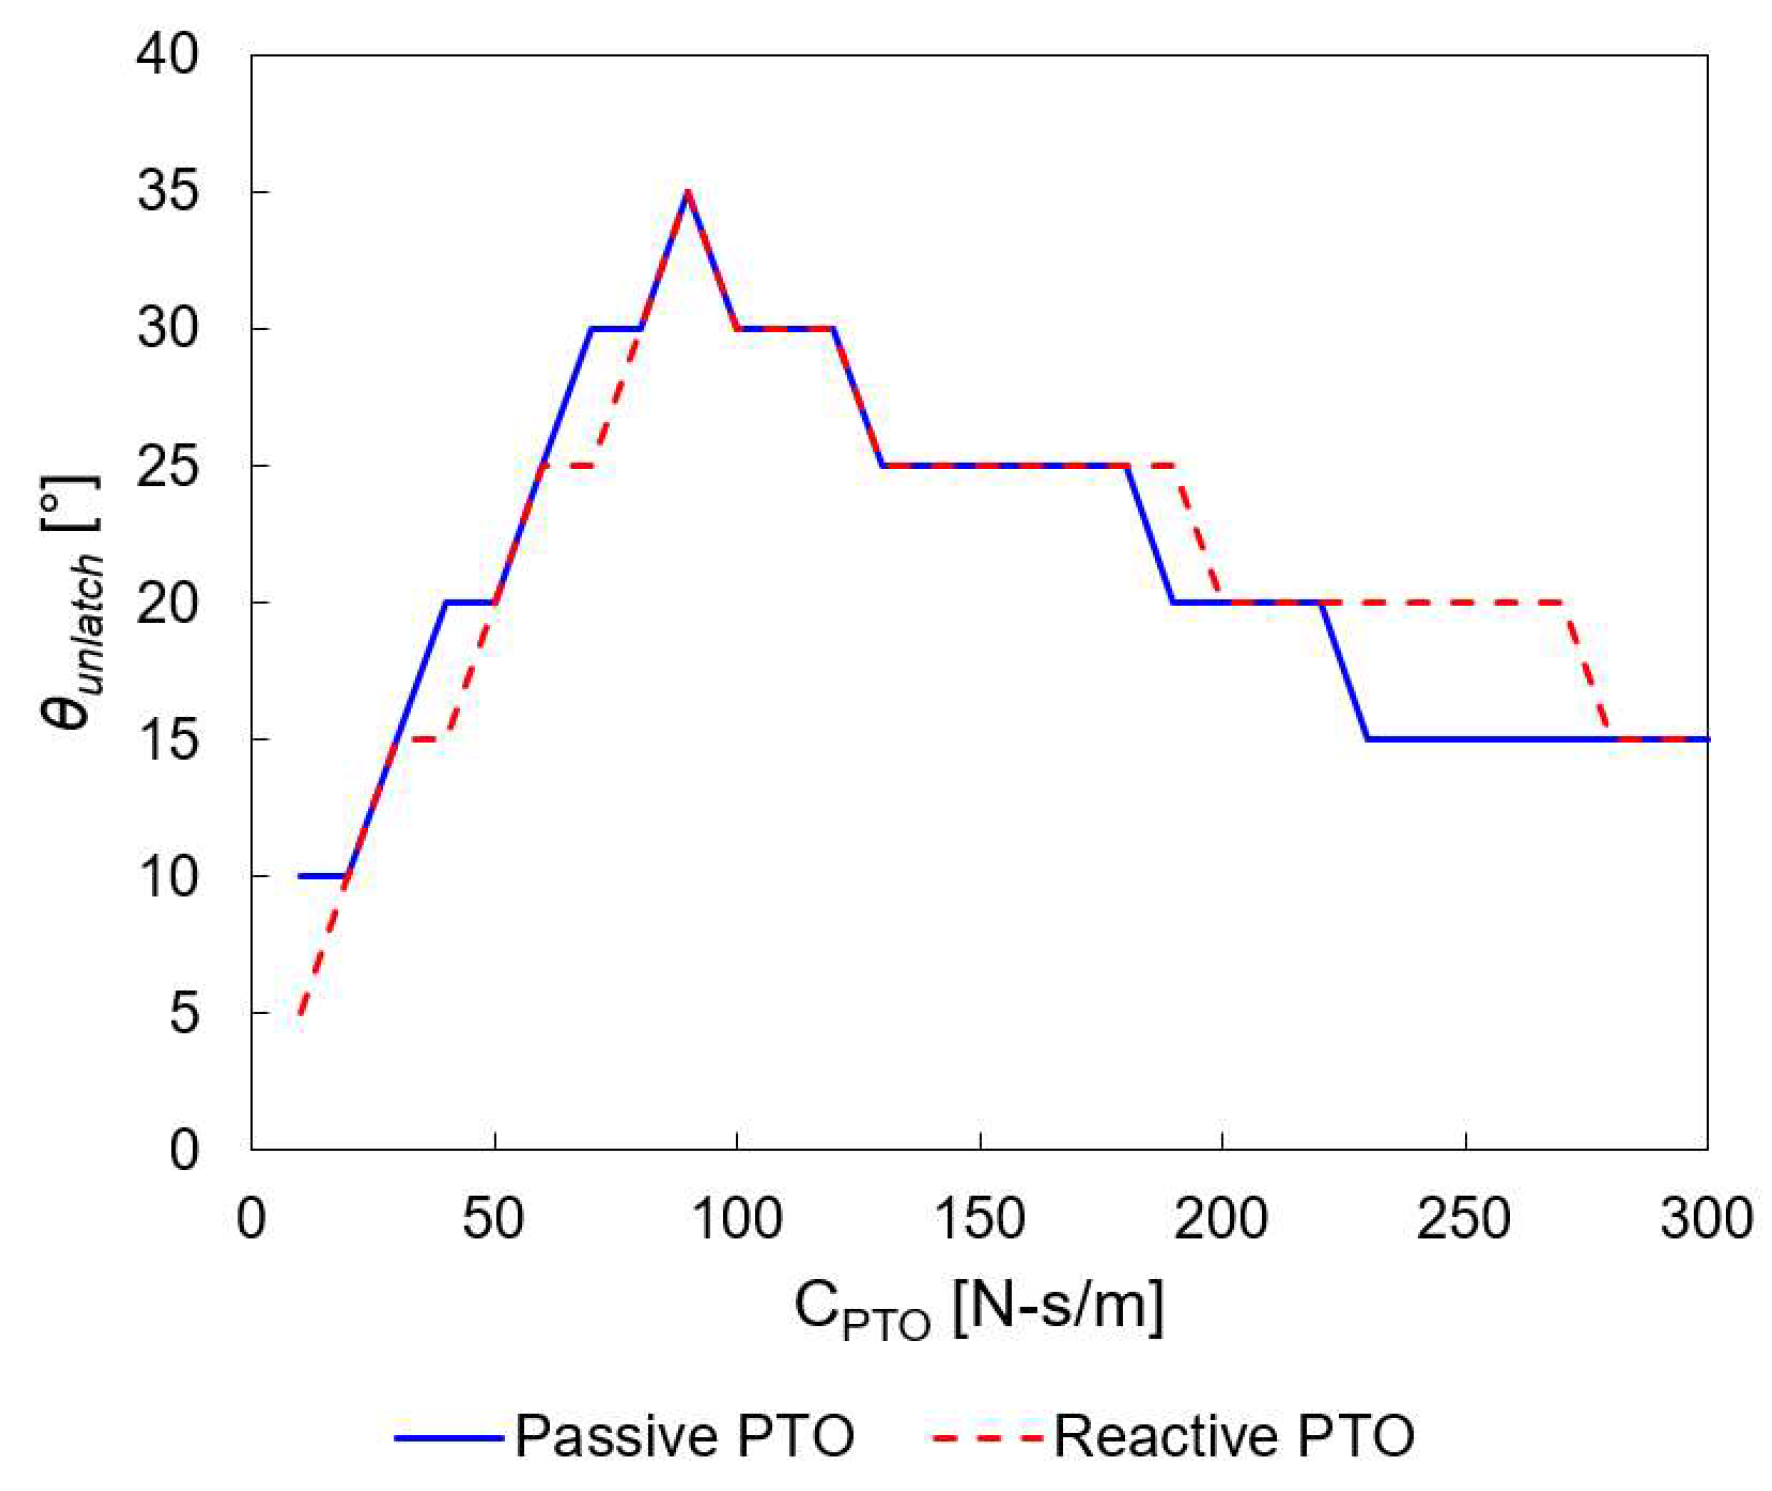
4.3. Latching Control with Variable-Angle Criteria

The target unlatching 50% scheme is ideal for power production. However, from a practical standpoint, achieving real-time operation that satisfies 50% unlatching per respective oscillation is complex and not straightforward. We propose a simple variable-angle unlatching control, assuming that the time series of the pitch angle is known. In this regard, a parametric study of the variable unlatching instant is conducted by varying the relative angle before each local peak (maximum or minimum) inclination angle. The optimal damping coefficient of 90 N-s/m found in Section 4.1 is used as an example case study with end springs. Table 6, Table 7, Table 8 and Table 9 show the resulting power production with and without power and force limits for passive and reactive PTO controls, respectively. For each case, simulations were performed with relative angles of 0°, 3°, 6°, and 9°.
When comparing Table 6 and Table 7 with Table 8 and Table 9, we observe that the produced average powers are significantly reduced when power and force limits are set, which is consistent with previous observations. In the tables, the peak-to-average power ratio is expressed as k. According to the parametric study, opting for the 3° variable unlatching produced the best average powers of 462.1 W and 462.7 W for the passive and reactive controls, respectively. These values are 24.5 W and 24.7 W higher than the best values by the constant unlatching angle set at 35° (see Table 4). The average power outputs between the two PTO controls are similar, but the peak power of the reactive PTO control is about 20% higher than that of the passive control. This implies that the passive PTO control functions better with the variable-angle unlatching control. For example, with a 3550 W power limit (slightly higher than the previous limit of 3000 W), an average power of 462.1 W can be achieved in the present example.
It is important to note that the resulting parameters for the variable unlatching criteria aligned closely with the ideal β t a r g e t = 50% target unlatching case. For example, the resulting β value was 56.4% and P a v g was 462.1 W, which can be compared to 463.4 W from the β t a r g e t 50% case presented in Table 5. It can be concluded that the variable-angle unlatching criterion is a practical and effective method to achieve optimal power production under irregular sea conditions.

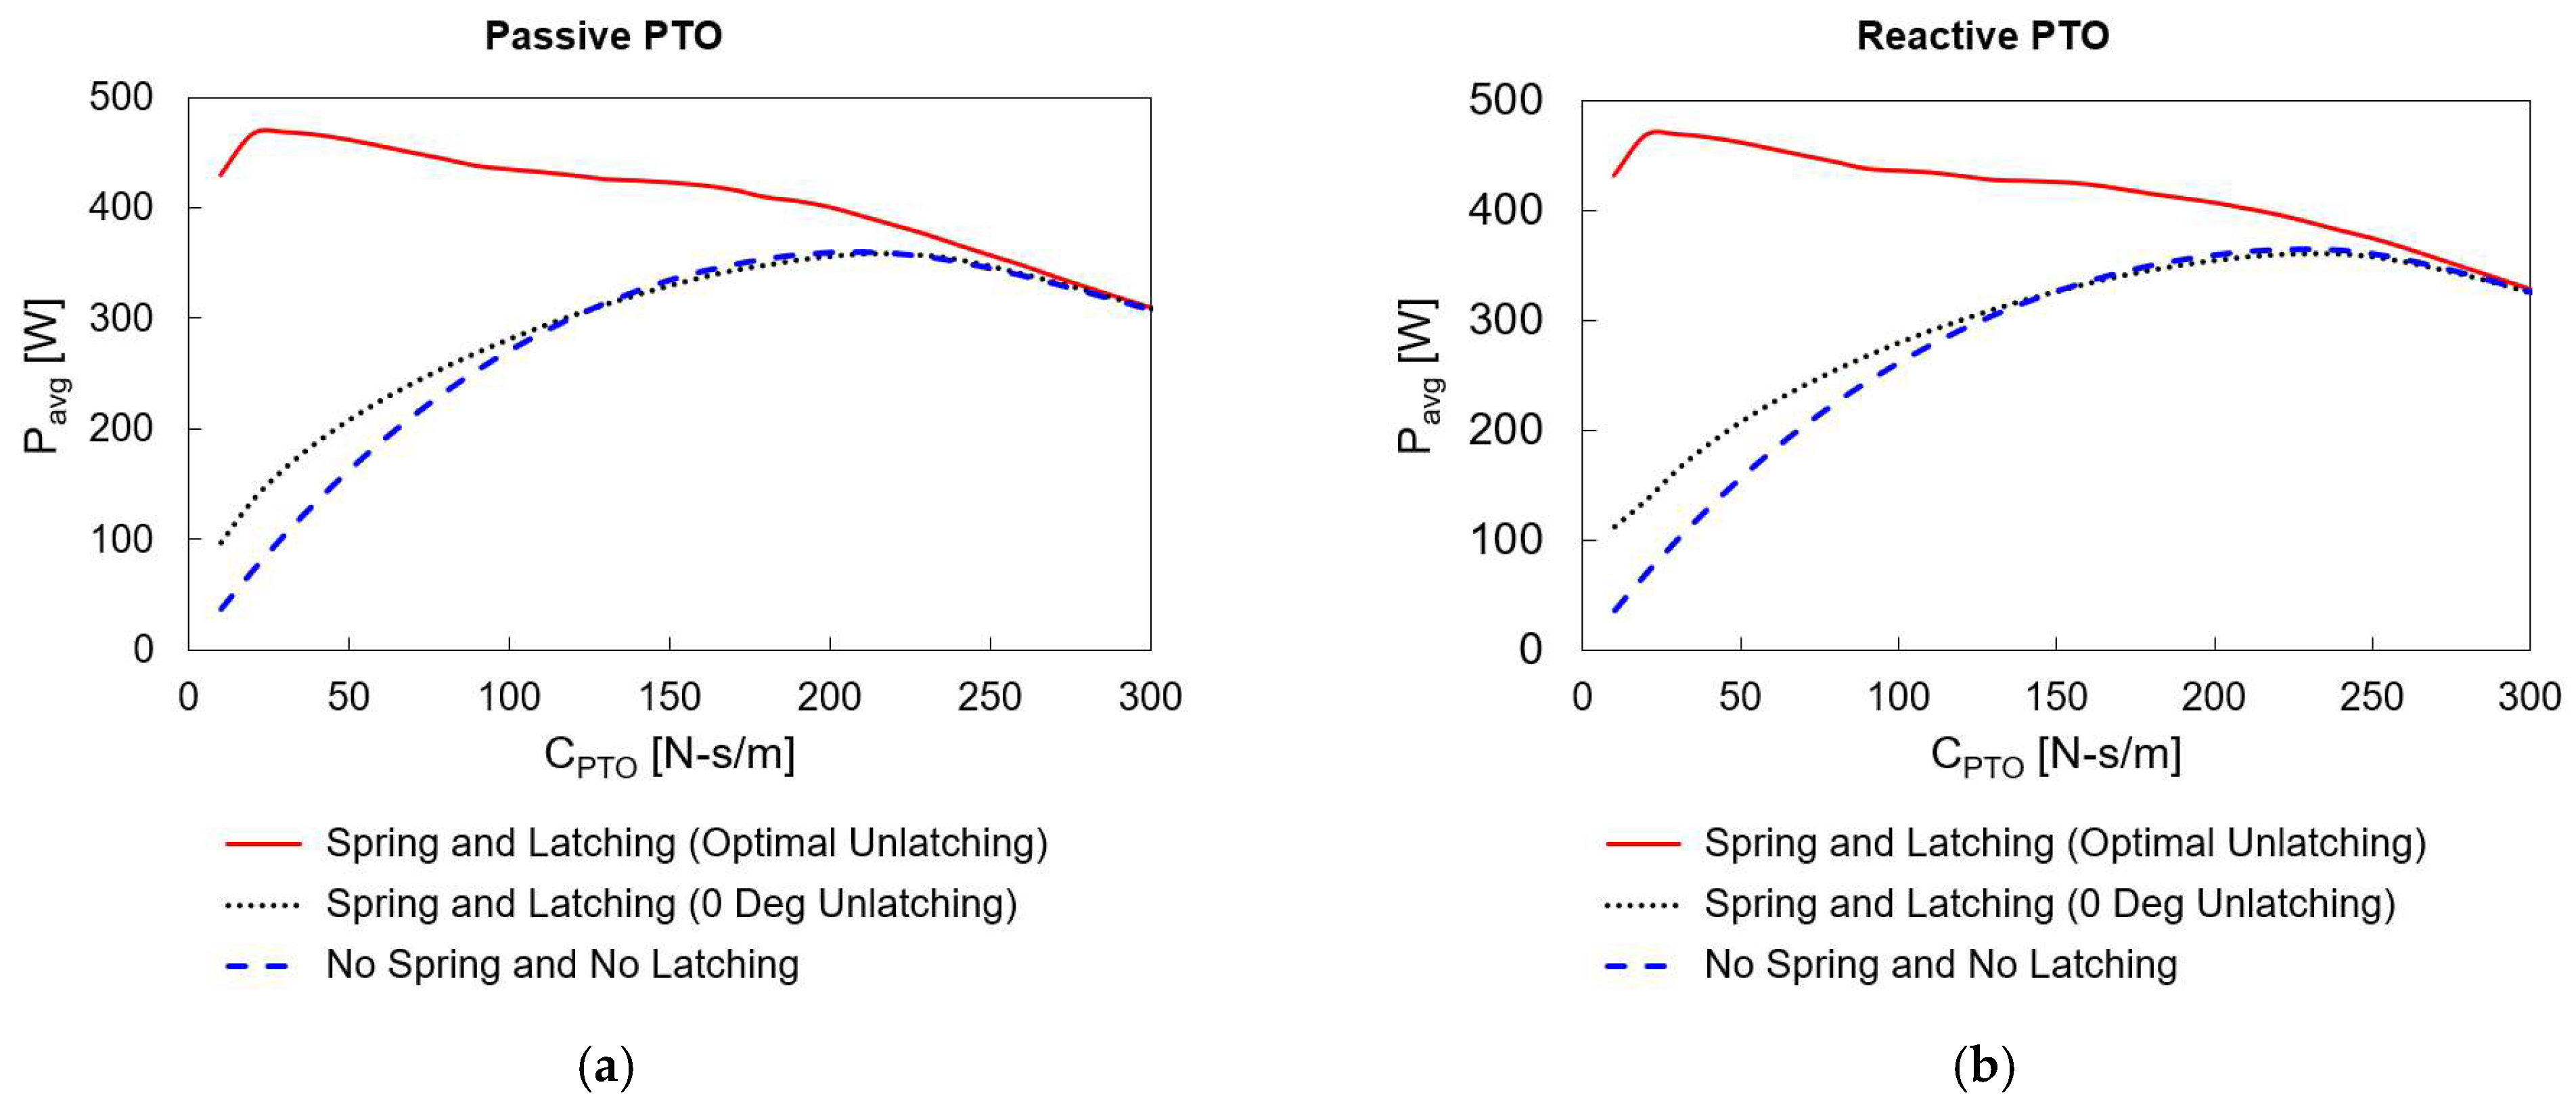
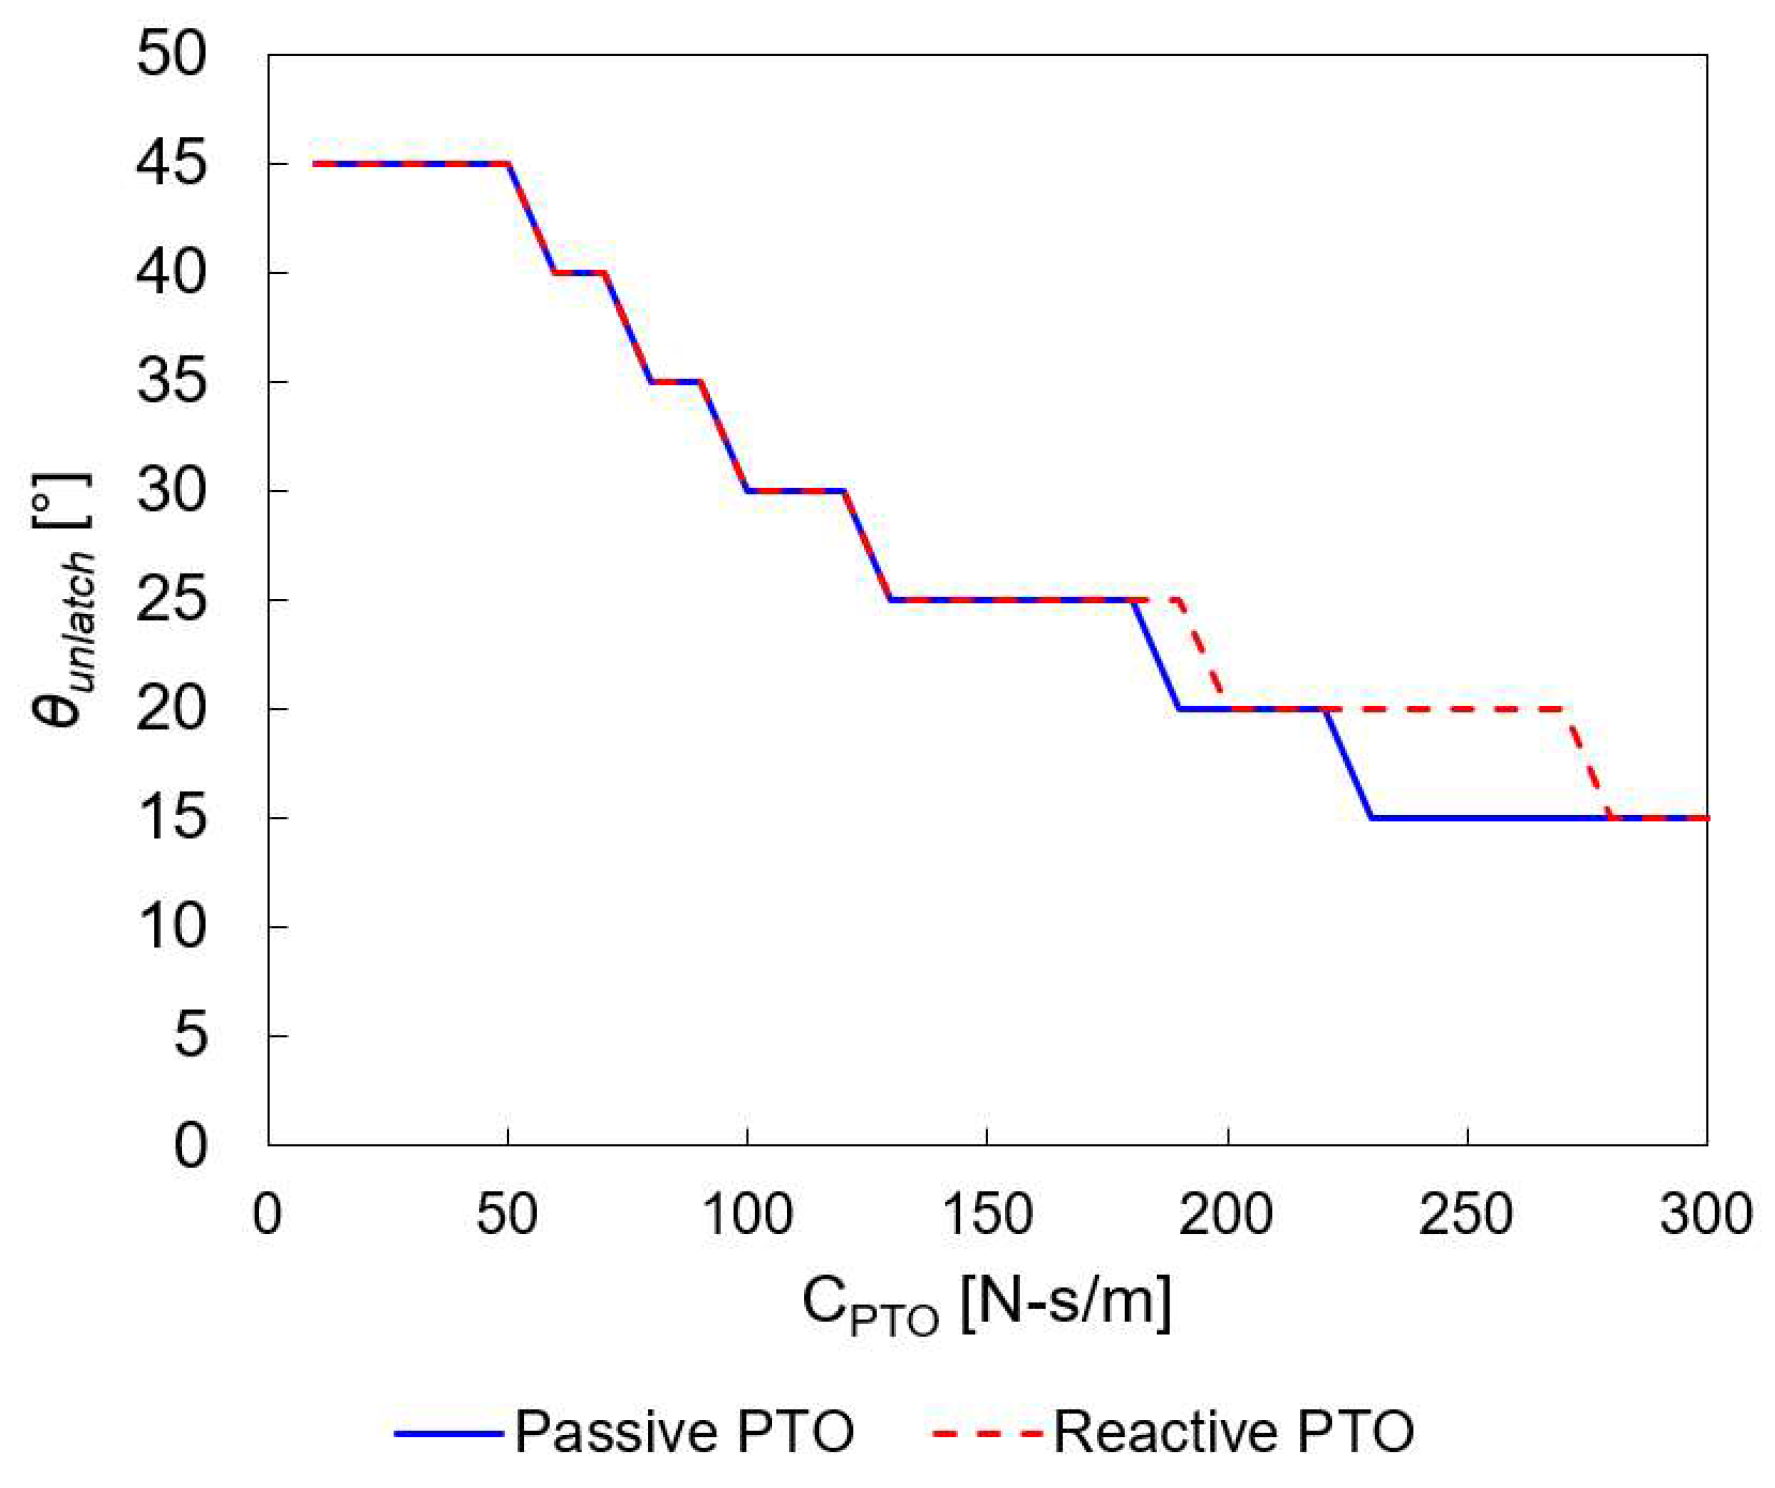
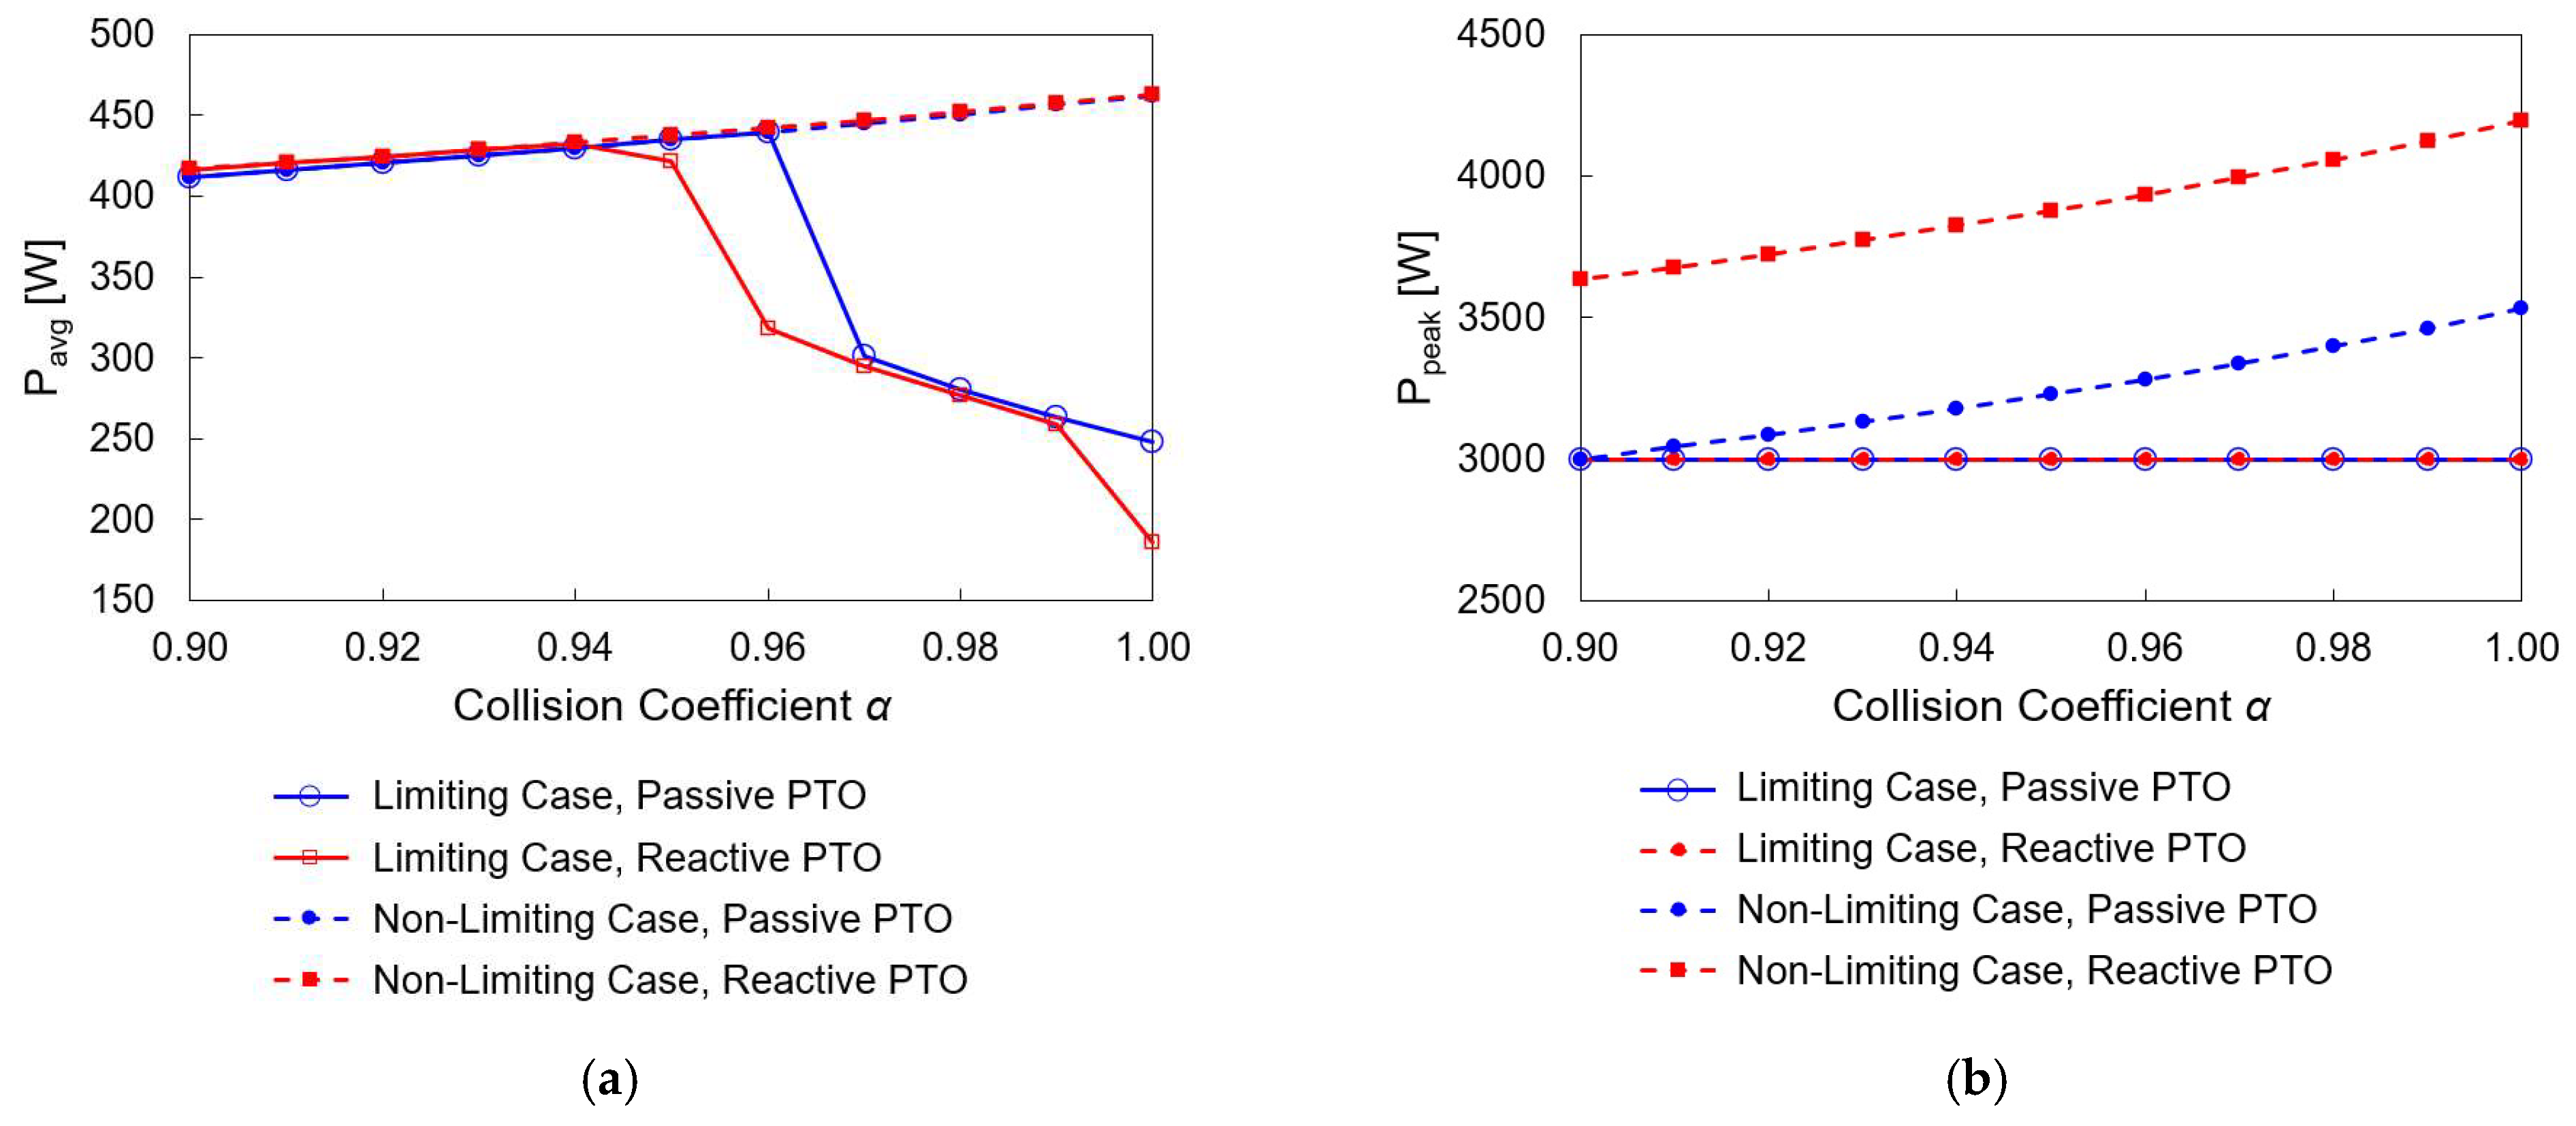
4.4. Effect of Collision Coefficient

So far, we have analyzed all the cases based on the assumption of a collision coefficient α = 1.0. However, in reality, there will be a small amount of energy loss during the magnet–spring–plate collision. To account for this, we conduct an additional parametric study by varying α for the 3° variable unlatching case discussed in Section 4.3. Since α values less than 1.0 reduce the rebounding velocity as formulated in Equation (17), the resulting power production is expected to be lower. On the other hand, the reduced rebounding velocity may lessen the detrimental effect of energy leak by decreasing excessive peak power, which increases with α .
Figure 19 presents the results of this parametric study. Without limiting power, the average power monotonically increases with increasing α values. With the power limit, the average power drops significantly when α is greater than 0.95, due to the limitation of excessive power peaks. For all α values, the peak powers of reactive control are higher than those of passive control, consistent with the findings from previous sections.
Table 10 summarizes the results for three selected cases with the largest available average powers under the power-limiting condition. The table also illustrates the improvements compared to cases without latching control, highlighting the enhancements achieved under the same damping coefficient of 90 N-s/m. Under practical conditions (a power limit of 3000 W and consideration of collision coefficient), the efficiency of latching control can reach up to 60–80%. In all cases considered, variable-angle unlatching controls perform better than constant-angle unlatching controls.

5. Conclusions

The PTO control and latching control methodologies were developed and tested to enhance the power production of the Surface-Riding Wave Energy Converter (SR-WEC) in irregular waves. The latching control, which holds the moving magnet at the end of the tube and releases it at a favorable buoy inclination angle, has been implemented as a mechanical control mechanism. The performance of two PTO controls (passive and reactive) was also systematically analyzed and compared. While the SR-WEC exhibits resonating pitch motions due to the optimized floater design, there is no resonance for the magnet’s sliding motion within a finite travel length. Therefore, its latching and PTO controls differ significantly from other resonance-type WECs with published control methods. However, overall, latching controls improved the power production performance of the SR-WEC using a similar phase delay concept, resulting in a much better output with an application of end spring at the end of the tube.
It was shown that the end spring can store the residual kinetic energy of the magnet sliding motion, resulting in a larger rebounding velocity and faster magnet sliding. Consequently, the average power was significantly increased with a proper unlatching angle and optimal PTO damping. Without latching or end springs, the magnet sliding motion was slower, necessitating a larger optimal PTO damping (200 N-s/m). However, with latching and end springs, the magnet sliding motion was faster, and smaller damping (90 N-s/m) was found to be optimal, leading to appreciably larger average powers. Nonetheless, the higher magnet velocity also resulted in larger peak powers, necessitating the imposition of a power-limiting condition, which in turn caused energy leakage and reduced average power.
The performances of constant-angle unlatching and variable-angle unlatching were systematically compared, and the latter performed better in average power production. Further investigations of phase relation revealed the optimal power generation condition. The optimal cases corresponded to β 50% in which the maximum buoy inclinations coincided with the middle of the magnet slide. This finding was instrumental in verifying a variable-angle unlatching strategy as a practical one. Tests with the reactive PTO, along with latching and end springs, showed only a marginal increase in average power compared to the passive control with them, even though the reactive PTO exhibited better efficiency than the passive PTO in relation to phase delay when latching was used without end springs. Additionally, when there is energy loss during the collision of the magnet and spring plate, it might mitigate the detrimental effect of energy leakage by reducing excessive peaked power.
The present optimal control design of SR-WEC was tailored for a target irregular wave condition of a specific deployment site. The investigation can be repeated for other wave conditions to develop a more comprehensive database and broader proactive control strategy, which may be combined with AI (artificial intelligence). An experimental study on the suggested latching mechanics and control, extending the earlier experimental validation of the performance of the SR-WEC without latching by authors (Jin et al. [3]), is considered the next study.

Author Contributions

Conceptualization, Y.L. and M.K.; Methodology, Y.L. and H.K.; Software, Y.L.; Formal Analysis, Y.L. and H.K.; Validation, Y.L. and H.K.; Writing—Original Draft, Y.L. and H.K.; Writing—Review and Editing, Y.L. and M.K.; Supervision, H.K. and M.K.; Project Administration, H.K.; Funding Acquisition, H.K. and M.K. All authors have read and agreed to the published version of the manuscript.

Funding

This research is supported by a U.S. Department of Energy’s Water Power Technologies Office project, DE-EE0008630.

Institutional Review Board Statement

Not applicable.

Informed Consent Statement

Not applicable.

Data Availability Statement

The numerical data presented in this study are available upon request from the corresponding author at the author’s discretion.

Acknowledgments

The authors are grateful to Chungkuk Jin for sharing the pitch motion time history of the SR-WEC. The authors also thank Matthew C. Gardner for providing a sample code for the time integration of the PTO sliding motion and Hamid A. Toliyat and Shrikesh Sheshaprasad for sharing their concept and algorithm related to power and force limits, as well as their general reactive control application on the SR-WEC.

Conflicts of Interest

The authors declare no conflict of interest.

References

  1. Lehmann, M.; Karimpour, F.; Goudey, C.A.; Jacobson, P.T.; Alam, M.R. Ocean wave energy in the United States: Current status and future perspectives. Renew. Sustain. Energy Rev. 2017, 74, 1300–1313. [Google Scholar] [CrossRef]
  2. Kim, C.K.; Toft, J.E.; Papenfus, M.; Verutes, G.; Guerry, A.D.; Ruckelshaus, M.H.; Arkema, K.K.; Guannel, G.; Wood, S.A.; Bernhardt, J.R.; et al. Catching the right wave: Evaluating wave energy resources and potential compatibility with existing marine and coastal uses. PLoS ONE 2012, 7, e47598. [Google Scholar] [CrossRef] [PubMed]
  3. Jin, C.; Kang, H.Y.; Kim, M.H.; Bakti, F.P. Performance evaluation of surface riding wave energy converter with linear electric generator. Ocean Eng. 2020, 218, 108141. [Google Scholar] [CrossRef]
  4. Hals, J.; Falnes, J.; Moan, T. A comparison of selected strategies for adaptive control of wave energy converters. J. Offshore Mech. Arct. Eng. 2011, 133, 031101. [Google Scholar] [CrossRef]
  5. Maria-Arenas, A.; Garrido, A.J.; Rusu, E.; Garrido, I. Control strategies applied to wave energy converters: State of the art. Energies 2019, 12, 3115. [Google Scholar] [CrossRef]
  6. Mei, C.C. Power extraction from water waves. J. Ship Res. 1976, 20, 63–66. [Google Scholar] [CrossRef]
  7. Budal, K.; Falnes, J. Interacting point absorbers with controlled motion. In Proceedings of the Power from Sea Waves, Edinburgh, UK, 26 June 1979; pp. 381–399. [Google Scholar]
  8. Budal, K.; Falnes, J. Wave power conversion by point absorbers: A Norwegian project. Int. J. Ambient Energy 1982, 3, 59–67. [Google Scholar] [CrossRef]
  9. Greenhow, M.; Rosen, J.H.; Reed, M. Control strategies for the clam wave energy device. Appl. Ocean Res. 1984, 6, 197–206. [Google Scholar] [CrossRef]
  10. Korde, U.A. Latching control of deep water wave energy devices using an active reference. Ocean Eng. 2002, 29, 1343–1355. [Google Scholar] [CrossRef]
  11. Babarit, A.; Clément, A.H. Optimal latching control of a wave energy device in regular and irregular waves. Appl. Ocean Res. 2006, 28, 77–91. [Google Scholar] [CrossRef]
  12. Falcão, A.F.O. Modelling and control of oscillating-body wave energy converters with hydraulic power take-off and gas accumulator. Ocean Eng. 2007, 34, 2021–2032. [Google Scholar] [CrossRef]
  13. Falcão, A.F.O. Phase control through load control of oscillating-body wave energy converters with hydraulic PTO system. Ocean Eng. 2008, 35, 358–366. [Google Scholar] [CrossRef]
  14. Henriques, J.C.C.; Lopes, M.F.P.; Gomes, R.P.F.; Gato, L.M.C.; Falcão, A.F.O. On the annual wave energy absorption by two-body heaving WECs with latching control. Renew. Energy J. 2012, 45, 31–40. [Google Scholar] [CrossRef]
  15. Henriques, J.C.C.; Gato, L.M.C.; Falcão, A.F.O.; Robles, E.; Faÿ, F.X. Latching control of a floating oscillating-water-column wave energy converter. Renew. Energy J. 2016, 90, 229–241. [Google Scholar] [CrossRef]
  16. Sheng, W.; Alcorn, R.; Lewis, A. On improving wave energy conversion, part I: Optimal and control technologies. Renew. Energy J. 2015, 75, 922–934. [Google Scholar] [CrossRef]
  17. Sheng, W.; Alcorn, R.; Lewis, A. On improving wave energy conversion, part II: Development of latching control technologies. Renew. Energy J. 2015, 75, 935–944. [Google Scholar] [CrossRef]
  18. Shadman, M.; Avalos, G.O.G.; Estefen, S.F. On the power performance of a wave energy converter with a direct mechanical drive power take-off system controlled by latching. Renew. Energy J. 2021, 169, 157–177. [Google Scholar] [CrossRef]
  19. Wu, J.; Yao, Y.; Zhou, L.; Göteman, M. Real-time latching control strategies for the solo Duck wave energy converter in irregular waves. Appl. Energy 2018, 222, 717–728. [Google Scholar] [CrossRef]
  20. Thomas, S.; Eriksson, M.; Göteman, M.; Hann, M.; Isberg, J.; Engström, J. Experimental and numerical collaborative latching control of wave energy converter arrays. Energies 2018, 11, 3036. [Google Scholar] [CrossRef]
  21. Tedeschi, E.; Carraro, M.; Molinas, M.; Mattavelli, P. Effect of control strategies and power take-off efficiency on the power capture from sea waves. IEEE Trans. Energy Convers. 2011, 26, 1088–1098. [Google Scholar] [CrossRef]
  22. Sheshaprasad, S.; Naghavi, F.; Hasanpour, S.; Albader, M.; Gardner, M.C.; Kang, H.Y.; Toliyat, H.A. Optimal Electric Power Take-off Strategy for Surface Riding Wave Energy Converter. In Proceedings of the 2022 IEEE Energy Conversion Congress and Exposition (ECCE), Detroit, MI, USA, 9–13 October 2022; pp. 1–7. [Google Scholar]
  23. Naghavi, F.; Sheshaprasad, S.; Gardner, M.C.; Meduri, A.; Kang, H.Y.; Toliyat, H.A. Permanent Magnet Linear Generator Design for Surface Riding Wave Energy Converters. In Proceedings of the 2021 IEEE Energy Conversion Congress and Exposition (ECCE), Vancouver, BC, Canada, 10–14 October 2021; pp. 4369–4375. [Google Scholar]
  24. Hals, J.; Falnes, J.; Moan, T. Constrained optimal control of a heaving buoy wave-energy converter. J. Offshore Mech. Arct. Eng. 2011, 133, 011401. [Google Scholar] [CrossRef]
  25. Ma, Y. Machine Learning in Ocean Applications: Wave Prediction for Advanced Controls of Renewable Energy and Modeling Nonlinear Viscous Hydrodynamics. Ph.D. Thesis, Massachusetts Institute of Technology, Cambridge, MA, USA, 2020. [Google Scholar]
Figure 1. Design and sliding mechanism of Surface-Riding Wave Energy Converter (SR-WEC).
Jmse 12 00656 g001
Figure 2. Schematics of end spring system and rebounding velocity.
Jmse 12 00656 g002
Figure 3. Schematics of spring dynamics with an example of impact on the right-side end.
Jmse 12 00656 g003
Figure 4. Time history of the buoy inclination angle.
Jmse 12 00656 g004
Figure 5. Average power without an end spring system for (a) passive power take-off (PTO) control and (b) reactive PTO control. Red lines are powers without the latching control.
Jmse 12 00656 g005
Figure 6. Peak power without an end spring system for (a) passive PTO control and (b) reactive PTO control. Red lines are powers without the latching control.
Jmse 12 00656 g006
Figure 7. Time series plots for latching control without an end spring system under (a) passive PTO control and (b) reactive PTO control.
Jmse 12 00656 g007
Figure 8. (a) Average power and enhancement through latching control and (b) optimal unlatching angles (no end spring case).
Jmse 12 00656 g008
Figure 9. Three-dimensional plots of average power with end springs (upper surface) compared against those without end springs (lower gray surface). Power- and force-limiting cases. (a) passive PTO; (b) reactive PTO.
Jmse 12 00656 g009
Figure 10. Peak power with end springs. Power- and force-limiting cases. (a) passive PTO; (b) reactive PTO.
Jmse 12 00656 g010
Figure 11. Time series plots for latching control with end springs under (a) passive PTO control and (b) reactive PTO control.
Jmse 12 00656 g011
Figure 12. Time series plots for the optimal cases without end springs and with end springs under (a) passive PTO control and (b) reactive PTO control.
Jmse 12 00656 g012
Figure 13. Average power with the latching control combined with the end spring system and comparisons against the no latching control cases for (a) passive PTO control and (b) reactive PTO control. Power- and force-limiting cases.
Jmse 12 00656 g013
Figure 14. Optimal unlatching angles (with end spring case). Power- and force-limiting cases.
Jmse 12 00656 g014
Figure 15. Average power with the latching control combined with the end spring system and comparisons against the no latching control cases for (a) passive PTO control and (b) reactive PTO control. Power- and force-non-limiting cases.
Jmse 12 00656 g015
Figure 16. Optimal unlatching angles (end spring case). Power- and force- non-limiting cases.
Jmse 12 00656 g016
Figure 17. Sliding parameters and average values for passive PTO. (a) T s l i d e and v ¯ s l i d e ; (b) β and P a v g .
Jmse 12 00656 g017
Figure 18. Target unlatching for phase matching with c P T O = 90 N-s/m and passive PTO.
Jmse 12 00656 g018
Figure 19. Effect of the collision coefficient (a) on the average power output and (b) on the maximum peak power.
Jmse 12 00656 g019
Table 1. Collision coefficient.
Collision Coefficient α Spring Plate Mass [kg]
1.000.0
0.963.1
0.944.8
0.926.5
Table 2. Input parameters and dimensions of the SR-WEC.
ComponentItemValueUnit
HullLength3180mm
Diameter564mm
Total WEC mass900kg
Center of gravity from mean water level−376mm
Inner cylinder
and copper plate
Outer diameter220mm
Inner diameter180mm
Magnet assemblyLength120mm
Outer diameter180mm
Inner diameter80mm
Mass75kg
Center rodOuter diameter40mm
Inner diameter20mm
Mass matrix of SR-WEC M 11 , M 22 , M 33 900kg
M 44 55kg·m2
M 55 1352kg·m2
M 66 1336kg·m2
Natural frequencyPitch1.08rad/s
Reactive PTOTarget period5.85s
Table 3. Selected cases without end spring system.
PTOItemUnitOptimal
Case
Ineffective
Damping
Ineffective
Unlatching
Passive c P T O N-s/m20010200
θ u n l a t c h °151545
P a v g W362.139.6197.9
P p e a k W1553.1436.61419.1
η %92989
Reactive c P T O N-s/m20010200
θ u n l a t c h °202045
P a v g W386.242.7246.1
P p e a k W1733.71333.81678.0
η %951094
Table 4. Selected cases with an end spring system under power- and force-limiting conditions.
PTOItemUnitOptimal
Case
Ineffective
Damping
Ineffective
Unlatching
Passive c P T O N-s/m9030090
θ u n l a t c h °35350
P a v g W437.6248.2269.0
P p e a k W3000.01127.41536.6
η %100100100
Reactive c P T O N-s/m9030090
θ u n l a t c h °35350
P a v g W438.0299.0268.4
P p e a k W3000.01276.71882.9
η %100100100
Table 5. Comparison with various target unlatching for cPTO = 90 N-s/m for passive PTO.
Unlatching
Strategies
Constant
Angle
TargetTargetTargetTarget
θ u n l a t c h
or β t a r g e t
θ u n l a t c h
= 35°
β t a r g e t
= 0%
β t a r g e t
= 30%
β t a r g e t
= 50%
β t a r g e t
= 70%
β [%]41.40.129.950.369.6
T s l i d e [s]0.740.760.690.680.69
v ¯ s l i d e [m/s]4.484.344.694.754.69
P a v g [W]437.6423.6458.1463.4458.3
Table 6. Results for variable-angle unlatching criteria for c P T O = 90 N-s/m—Case 1.
θ r e l a t i v e , u n l a t c h [°]Case 1: Passive PTO Control with Power- and Force-Limiting Case
P a v g [W] P p e a k [W]k [-] η [%]
0235.03000.012.7753
3247.73000.012.1155
6250.13000.012.0058
9253.83000.011.8262
Table 7. Results for variable-angle unlatching criteria for c P T O = 90 N-s/m—Case 2.
θ r e l a t i v e , u n l a t c h [°]Case 2: Reactive PTO Control with Power- and Force-Limiting Case
P a v g [W] P p e a k [W]k [-] η [%]
0231.43000.012.9652
3185.63000.016.1741
6246.23000.012.1957
9248.43000.012.0861
Table 8. Results for variable-angle unlatching criteria for c P T O = 90 N-s/m—Case 3.
θ r e l a t i v e , u n l a t c h [°]Case 3: Passive PTO Control with Power- and Force-Non-Limiting Case
P a v g [W] P p e a k [W]k [-] η [%]
0423.63231.57.63100
3462.13533.67.65100
6454.13479.97.66100
9440.43375.87.67100
Table 9. Results for variable-angle unlatching criteria for c P T O = 90 N-s/m—Case 4.
θ r e l a t i v e , u n l a t c h [°]Case 4: Reactive PTO Control with Power- and Force-Non-Limiting Case
P a v g [W] P p e a k [W]k [-] η [%]
0424.23834.09.04100
3462.74195.49.07100
6454.64135.39.10100
9440.94018.79.11100
Table 10. Power and enhancement by the latching control with collision coefficient.
Case Passive   PTO ,   α = 0.96 Passive   PTO ,   α = 0.94 Reactive   PTO ,   α = 0.94
Unlatching CriteriaConstantVariableConstantVariableConstantVariable
P a v g [W]415.7 439.4 406.1429.8409.8432.3
P p e a k [W]2868.8 3000.0 2800.93000.03000.03000.0
k [-]6.906.836.906.987.326.94
Enhancement [%]64.0 73.3 60.269.567.676.8
Disclaimer/Publisher’s Note: The statements, opinions and data contained in all publications are solely those of the individual author(s) and contributor(s) and not of MDPI and/or the editor(s). MDPI and/or the editor(s) disclaim responsibility for any injury to people or property resulting from any ideas, methods, instructions or products referred to in the content.

