Abstract
Due to their ability to buffer and attenuate vibrations, as well as their low cost, rubber-based isolators are widely used in military and civilian vessels. Since these isolators are part of a ship’s structure, the accurate prediction of their static and dynamic performance is essential for overall structural design. In this paper, two kinds of marine shear-compression rubber isolators of different models in the same series are taken as the research objects, and the static and dynamic constitutive models of the rubber materials are obtained through material tests, which are used as inputs to accurately predict the static and dynamic characteristics of the isolators in the three translational directions through numerical calculations. The effects of size and preload force on the dynamic characteristics of the vibration isolators were analyzed as were the reasons for the peaks in the impedance curves. The results show that the preload force increases the amplitudes of the peak transfer impedance in the X direction and decreases it in the Z direction. On the other hand, as the size of the vibration isolator increases, the peak frequency of the transfer impedance in the X direction increases, while in the Y and Z directions, the first-order peak frequency decreases and the second-order peak frequency increases. The peaks of the transfer impedance curves appear due to the resonance of the embedded metal blocks, and the order of appearance of the resonance modes is fixed.
1. Introduction
In the marine industry, reducing the vibration and noise levels in ships has consistently been a focal point of research. The adverse effects of high levels of vibration and noise on ship safety [1,2], crew comfort, and sleep quality [3,4] as well as the quality of life of marine animals [5,6] have been extensively documented in numerous studies. Rubber-based isolators are vulcanized products made of natural rubber or polymer with similar properties combined with metal bearings or embedded metal blocks. Due to their exceptional ability to withstand significant deformation and exhibit high damping characteristics, these isolators are extensively applied in ship vibration and noise reduction [7,8,9].
In the naval field, rubber isolators in military ships serve three primary functions: supporting the weight of onboard equipment, ensuring proper alignment of rotating machinery, and effectively isolating and absorbing both steady-state vibrations and transient shocks [10]. To achieve these functions, it is imperative to accurately predict the static and dynamic characteristics of rubber vibration isolators during the design stage of the vibration isolation device. Calabrese et al. [11] studied the stiffness and stability of fiber-reinforced rubber isolators under combined vertical and transverse loads and discussed the influence of material properties and shape factors. Rahnavard et al. [12] analyzed the influence of different structural forms on the static stiffness and stability of metal–rubber vibration isolators through numerical calculation. Saidou et al. [13] studied the buckling instability and shear tearing of rubber vibration isolators under an ultimate load. On the other hand, the investigation of the dynamic performance of rubber isolators primarily focuses on the dynamic stiffness, transfer rate, and energy dissipation capacity. Gil-Negrete et al. [14] proposed a simplified method for accurately predicting the dynamic stiffness of rubber bushings through simulation research. Thaijaroen and Harrison [15] proposed a six-parameter model to predict the dynamic stiffness of vibration isolators with different shapes, compositions, and deformation modes at different amplitudes and frequencies. Fragasso et al. [8] analyzed the influence of preload on the transmissibility and dynamic stiffness of marine vibration isolators through simulation and four-pole parameter tests, and Modhej et al. [16] studied the energy dissipation capacity of steel–rubber dampers at different amplitudes. Although the above studies have analyzed the static or dynamic performance of rubber vibration isolators, there are few studies on the simultaneous analysis of static and dynamic performance [17,18].
The nonlinear behavior of rubber under static and dynamic loads, respectively, represents the hyperelastic and viscoelastic properties of rubber materials, which must be provided in the numerical analysis of rubber isolators. In order to characterize the static nonlinear behavior of rubber, many scholars have proposed a range of hyperelastic constitutive models. At present, the Mooney–Rivlin model, Neo–Hookean model, Full Polynomial model, Reduced Polynomial model, Yeoh model, Ogden model, and Arruda–Boyce model are widely used in numerical calculation [19,20,21,22,23]. It is often challenging for engineers to make a selection among existing models. Hence, some researchers conducted a comparative analysis of various hyperelastic constitutive models in terms of their ability to accurately replicate the mechanical properties of polymer elastomers using the root-mean-square error as the evaluation criterion. The findings revealed that both the Yeoh model and the 3rd Ogden model demonstrated commendable accuracy across a wide range of deformations. However, limitations were observed with respect to the Mooney–Rivlin model and Neo–Hookean model when dealing with substantial rubber deformations [24,25,26]. These hyperelastic constitutive models all need to be fitted by one or several material deformation test data. The most common material tests include uniaxial tensile, equibiaxial tensile, planar tensile (pure shear), and volumetric compression. Some scholars have also proposed novel tests for fitting hyperelastic models, such as the bulge test [27]. Among the above material deformation tests, the most easy to realize and understand is the uniaxial tensile test. However, it is insufficient to solely rely on this test for fitting a reliable constitutive model, particularly when dealing with rubber members subjected to complex deformation modes as described in this paper [24,28,29]. The dynamic nonlinear behavior of rubber materials is influenced by factors such as frequency, amplitude, and temperature. Numerous scholars have proposed various viscoelastic constitutive models to accurately characterize these behaviors. Although the Maxwell model and the Kelvin model were initially introduced, they failed to precisely capture the frequency–dependent correlation of material behavior [30,31]. To address this limitation, the generalized Maxwell model and the generalized Kelvin model were subsequently developed [32,33]. In order to further consider the relevance of the amplitude, fractional derivative model was proposed [34,35]. To account for the temperature correlation, alternative models have been proposed, including the equivalent standard solid model [36], the three elements and nine parameters model [37], and the equivalent stiffness and damping model [38]. However, the most widely used viscoelastic model is still the generalized Maxwell model in common simulation software. Similar to hyperelastic constitutive models, the fitting of viscoelastic constitutive models also requires experimental data under specific deformation modes, with the shear mode being particularly prevalent [39]. In terms of the static and dynamic characteristics of isolators, the static characteristics can be effectively evaluated using mechanical testing machines, while the dynamic characteristics are primarily assessed through mechanical testing machines or shaking tables. Mechanical testing machines are capable of applying adequate preload to the tested vibration isolator; however, their test frequency range is typically limited to below 700 Hz. On the other hand, vibration tables offer a higher test range but cannot apply preload directly to rubber vibration isolators that bear heavy loads.
Two shear-compression hybrid marine isolators with embedded metal blocks, namely, WH–150 and WH–1200, are investigated in this paper, which are manufactured by Rising Company (Beijing, China). Although they belong to a unified series, they differ in terms of size and carrying capacity. The WH series of rubber isolators are widely used in naval equipment because they exhibit excellent vibration isolation performance over a wide frequency range. Importantly, due to their unique structural design, when subjected to excessive impact loads, the rubber body of the isolator comes into contact with the lower support seat to prevent excessive displacement, thereby safeguarding the equipment it supports. Previous studies [12,40,41] have indicated that the shear stiffness of rubber decreases after undergoing compressive deformation. The studies in references [8,29] indicate that compressive rubber isolators exhibit gradual stiffening characteristics in both static and dynamic performance. The static gradual stiffening is manifested by an increase in the slope of the force-displacement or stress–strain curves with increasing preload. The dynamic gradual stiffening is demonstrated by the resonant peak shifting towards higher frequencies with increasing preload. In this study, both isolators experience simultaneous shear and compression deformations when subjected to preload, thereby reducing their transfer mechanical impedance in the preload direction. This type of vibration isolator under mixed deformation mode has not been previously explored. The constitutive model of the elastomer was derived from static and dynamic mechanical tests, while the finite element method was employed to accurately predict the static and dynamic characteristics of the isolators. Subsequently, by combining numerical results with experimental data, an analysis was conducted on the influence of size and preload on the dynamic characteristics of the isolators as well as identifying the cause behind peak values in transfer impedance curves. With this outlined process, ship designers can effectively anticipate both static and dynamic properties of metal–rubber isolators with complex geometries solely based on material test data.
2. Material Characterization
The rubber isolators in this study are made of 304 stainless steel and EPDM rubber, grade Keltan 9565Q. This grade of EPDM rubber was produced by Lanxess Group (Cologne, Germany). The ultra-high molecular weight of Keltan 9565Q imparts it with exceptional strength and elasticity akin to that of natural rubber. As a saturated polymer, it retains the heat resistance, weather resistance, and ozone resistance properties of EPDM rubber. Consequently, Keltan 9565Q surpasses natural rubber in terms of heat aging, particularly for high dynamic applications while also offering lower processing costs. Marine vibration isolators are commonly employed for isolating vibrations generated by power units in marine power compartments (such as diesel engines). The operation of marine power compartments involves the release of significant amounts of heat and the generation of high levels of dynamic load. Therefore, Keltan 9565Q is considered one of the optimal choices for marine vibration isolators.The properties of 304 stainless steel were obtained from the literature, whereas the properties of Keltan 9565Q were acquired through the tests detailed below. This section provides a comprehensive description of how to obtain these properties. To ensure consistency in mechanical properties between rubber characterization results and specific applications, all rubber samples were manufactured in the same batch as the isolators using identical vulcanization methods.
2.1. Static Characterization
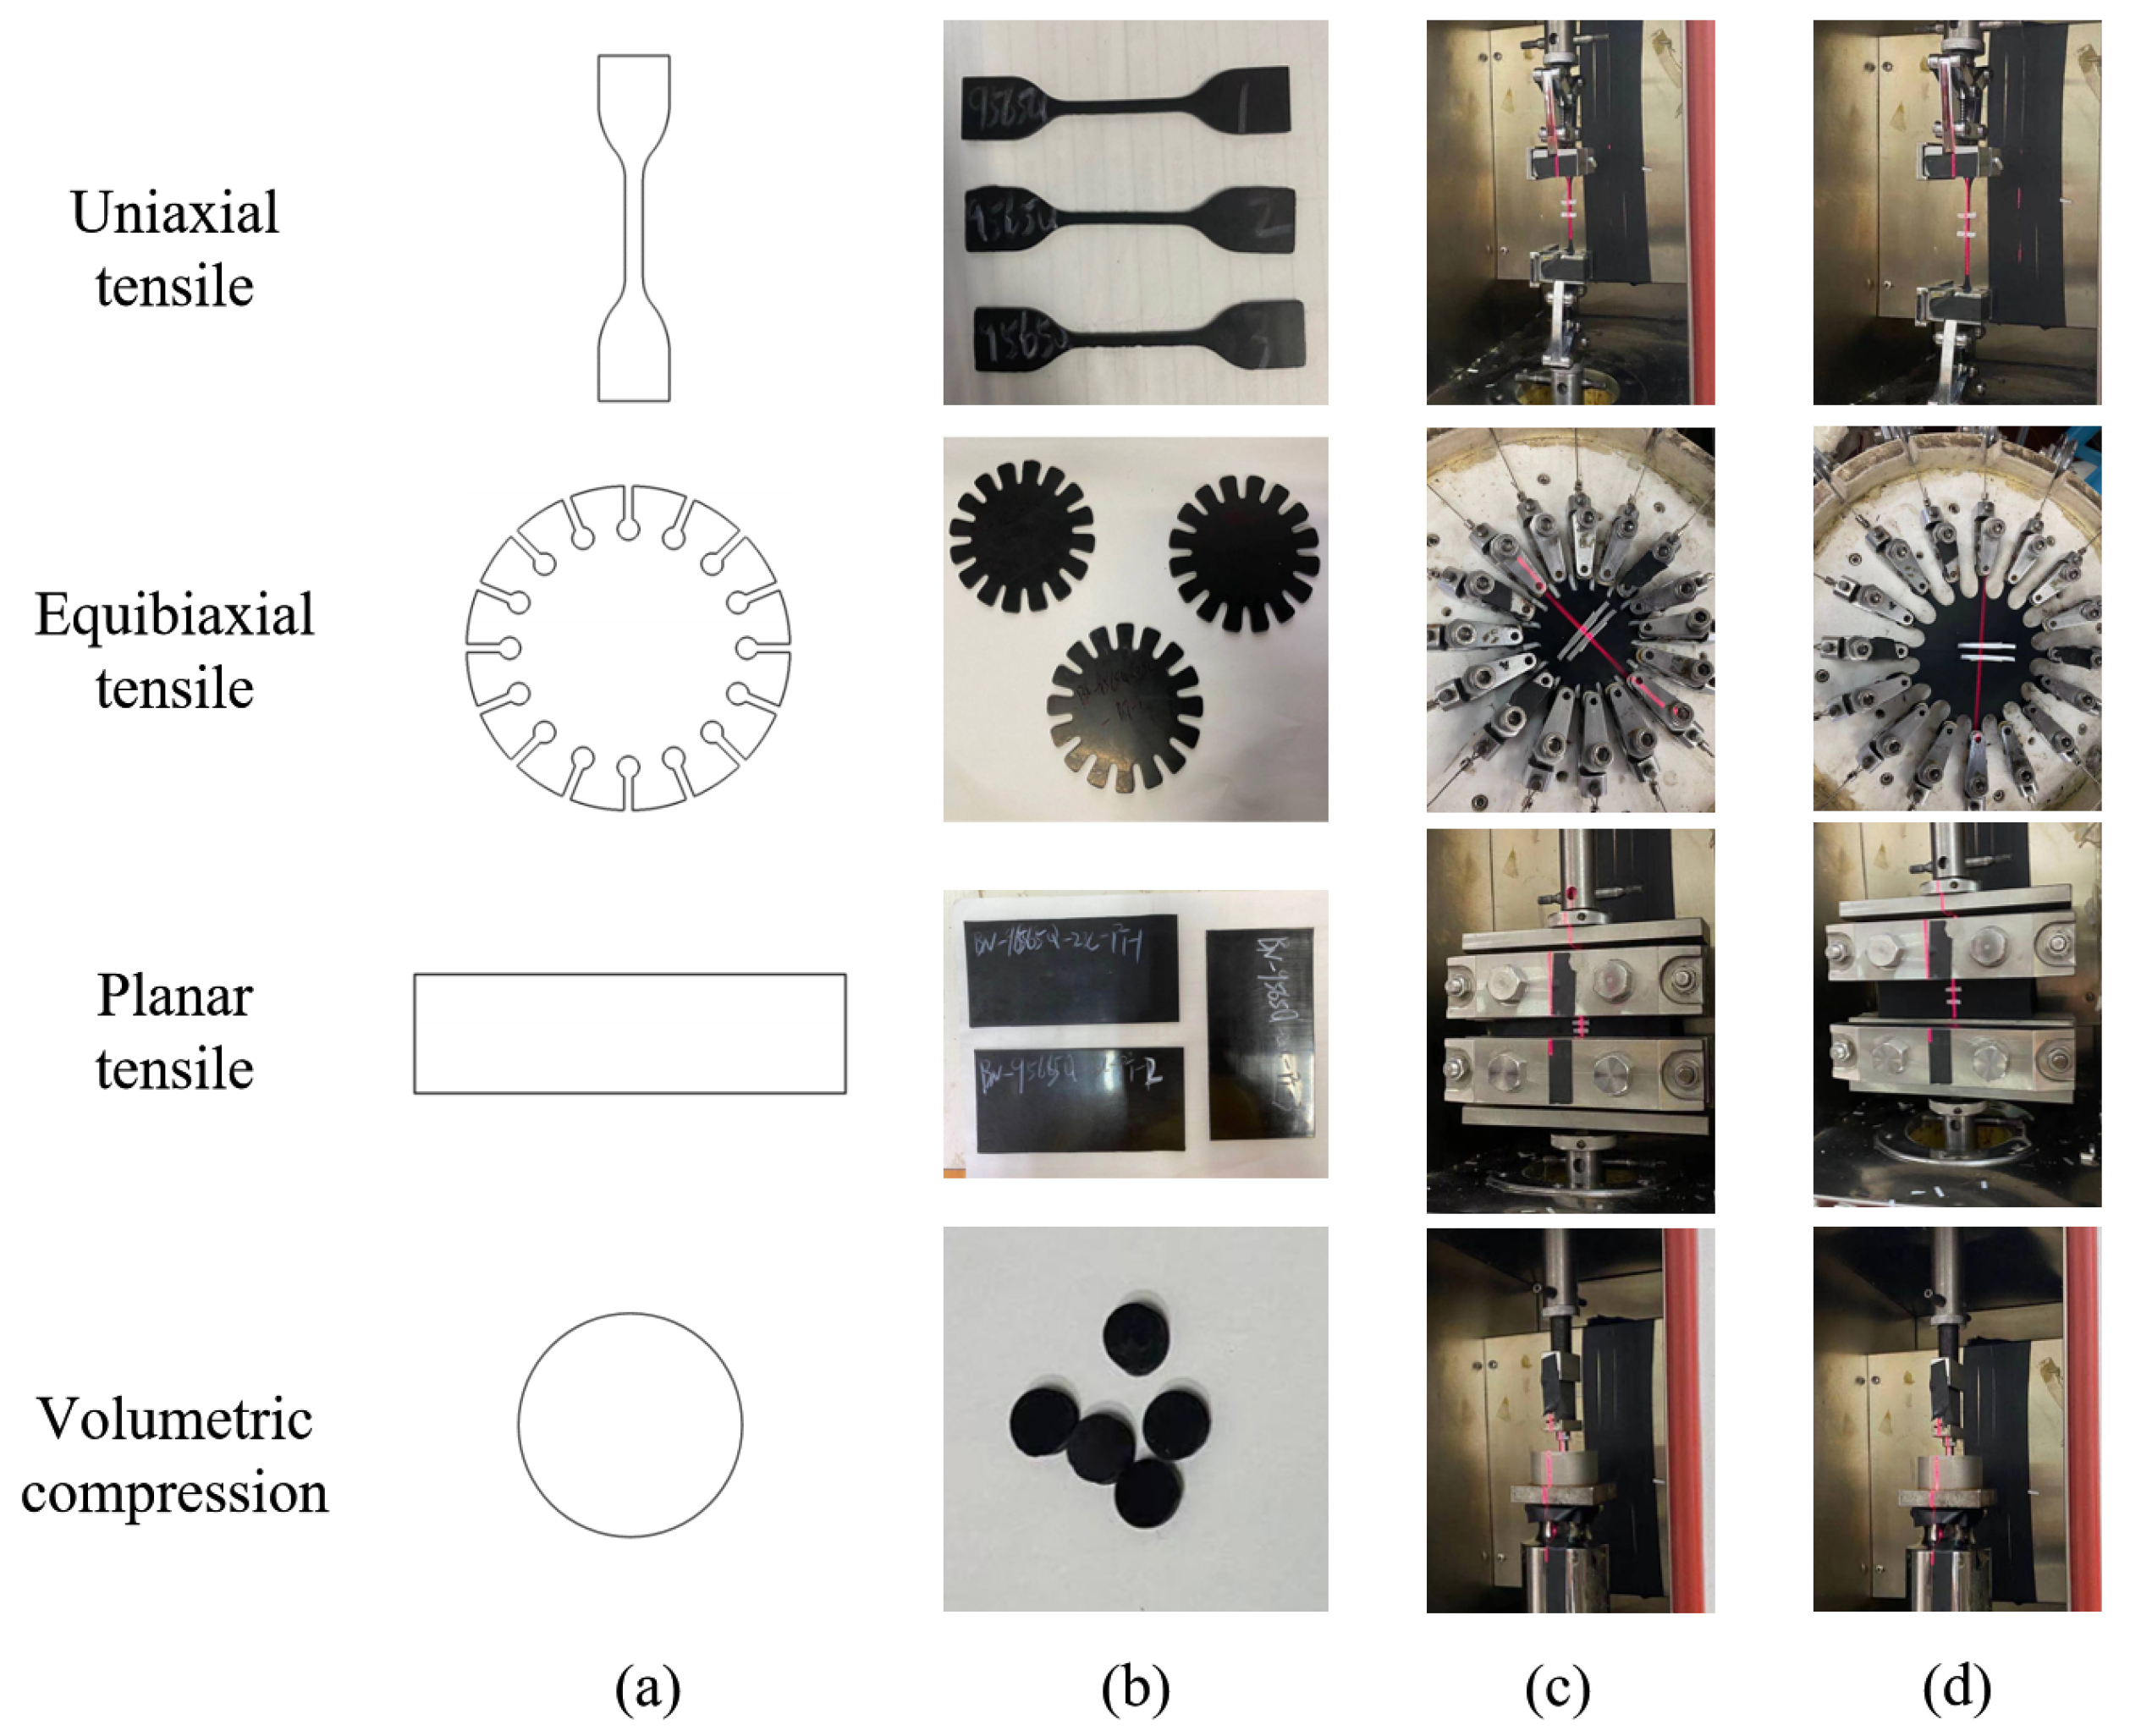
The accurate prediction of the static mechanical properties of rubber under complex deformation patterns necessitates a comprehensive coverage of various types of static tests, as previously mentioned. To precisely characterize the hyperelastic properties of Keltan 9565Q, an array of static tests were conducted, including uniaxial tensile, equibiaxial tensile, planar tensile, and volumetric compression tests. These tests comprehensively address all necessary requirements for fitting the hyperelastic constitutive model.
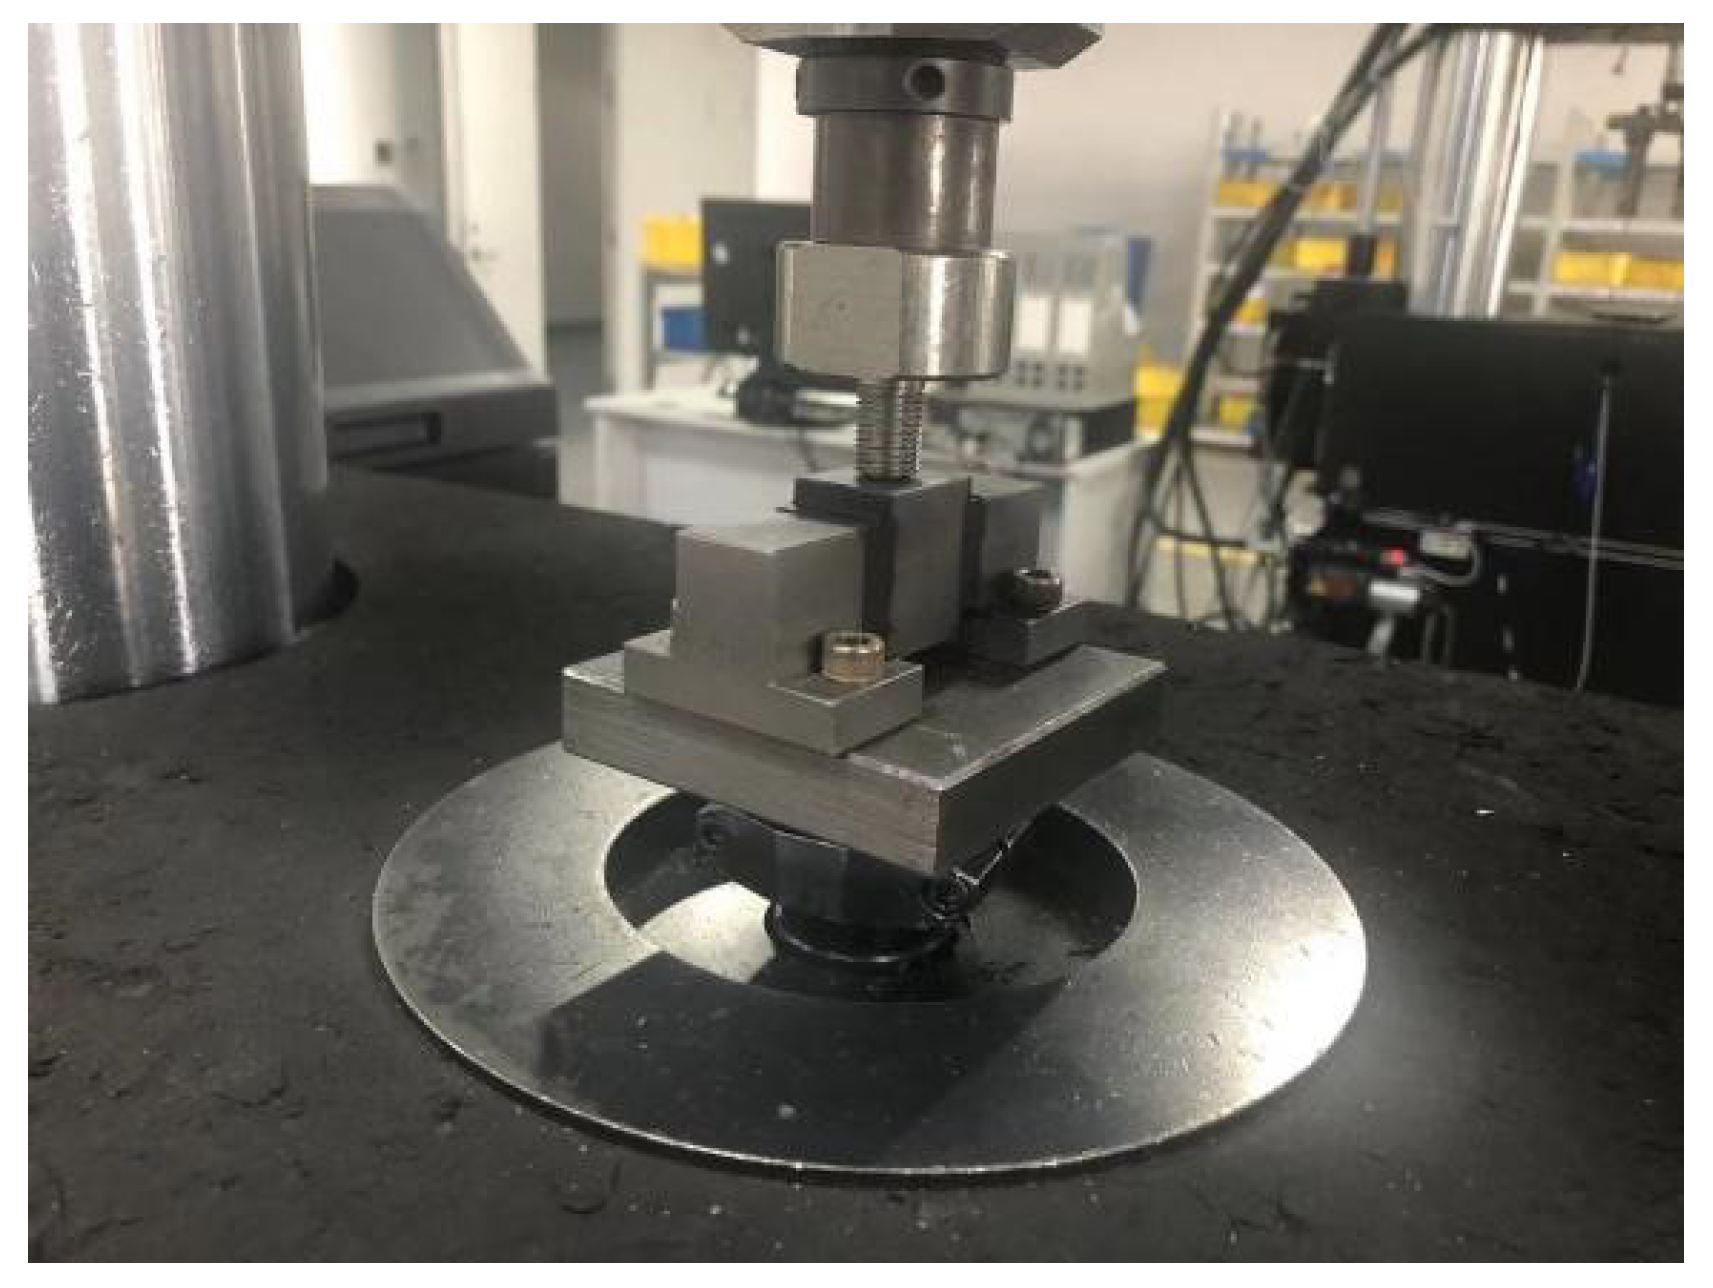
The specimens for the static test were cut from a 2 mm thick rubber test piece using a specialized cutter. The shape of each sample is illustrated in Figure 1. The geometric center of the specimens represents the region with the most significant and uniform deformation; thus, two parallel white marks are positioned at the center of the specimens (in volumetric compression, the marks are on the fixture). Once marking is completed, each specimen is securely mounted on the fixture ensuring consistent clamping force at both ends. Specifically, for uniaxial tensile, planar tensile, and volumetric compression, their respective fixtures can be directly installed on the mechanical testing machine and placed inside a dedicated temperature-controlled chamber. The designated model for this testing machine is WDW-10 with a maximum working load capacity of 10 kN. The equibiaxial tensile test is conducted using a specialized test bench, consisting of a fixture, a fixture actuating device, and a test checking device. Upon installation of the specimen, the initial position of the fixture is adjusted to ensure that there are no pre-stresses in the form of stretching or bending. To maintain consistency among the isolator tests, all material tests were performed at 23 °C.
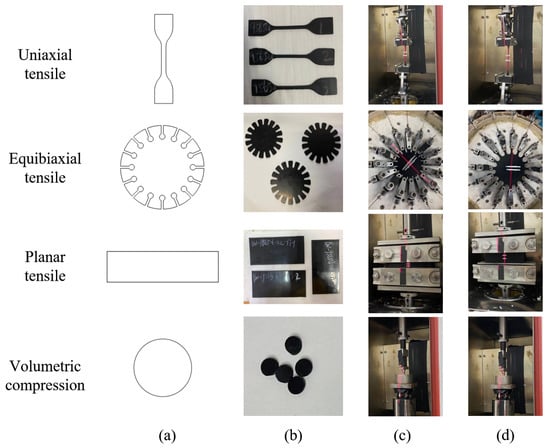
Figure 1.
Static test specimens and test process: (a) Shape of specimen. (b) Photograph of specimen. (c) State before deformation. (d) State after deformation.
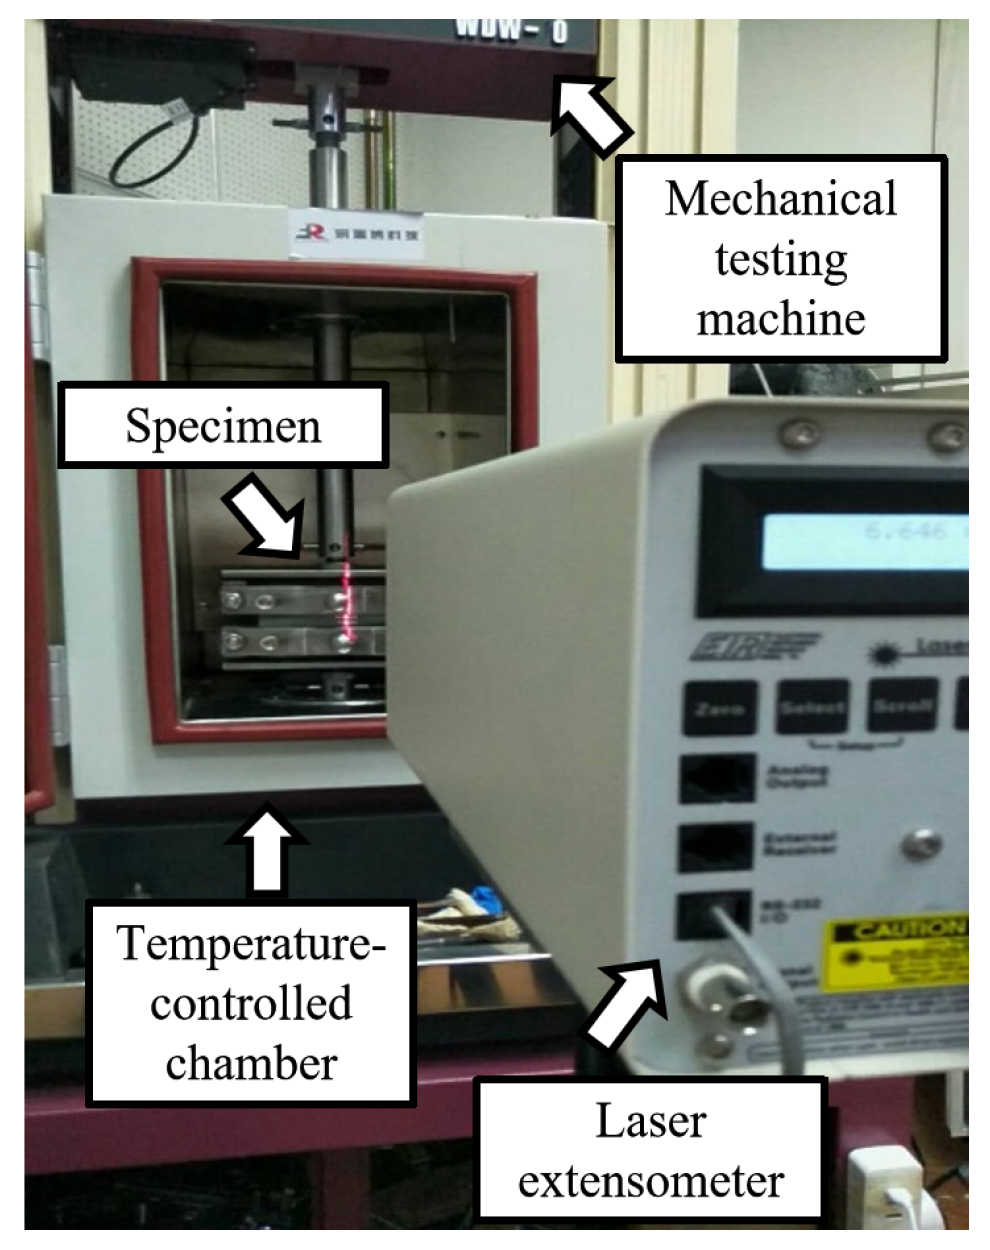
Before the test commences, the initial distance between the white markers is measured and recorded. Subsequently, the parameters of the testing machine are adjusted, and the specimen undergoes a slow cycling process at a strain rate of 0.01 mm/s (the strain rate of volumetric compression is 0.002 mm/s). Loading initiates at a zero stress, progresses to a specified strain level, and then unloads at an equivalent rate until reaching (near) zero stress. A total of 5 cycles are carried out, the loading section of the last cycle is taken as the reference data, and the data for all specimens are averaged. The testing machine directly measures load during the test, while a laser extensometer is used to indirectly capture strain by measuring the relative deformation between the white marks, as depicted in Figure 2. The optical method for measuring strain is particularly suitable in this scenario as it does not interfere with specimen geometry or introduce additional loads.The dimensions and quantities for each specimen are presented in Table 1. The experimental procedures are also illustrated in Figure 1. It should be emphasized that the stresses referred to in this study pertain to engineering stresses and are computed based on a constant undeformed cross-section.
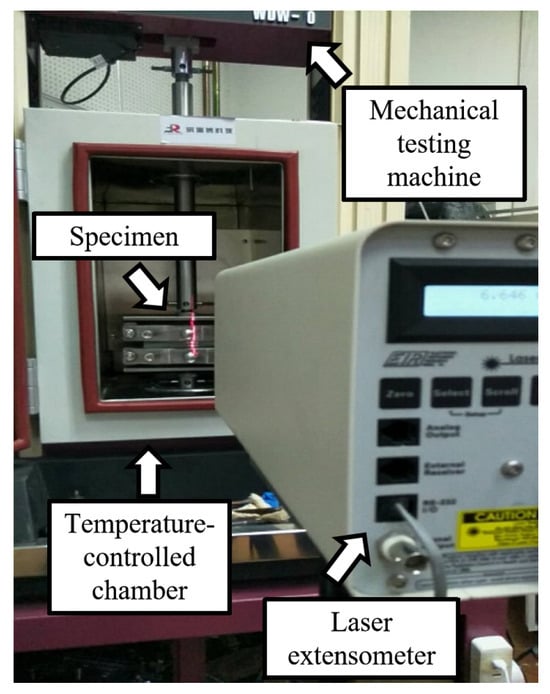
Figure 2.
Optical strain measurement system.

Table 1.
The size and quantity of the specimens for the static test.
In the finite element method, accurately reproducing the mechanical properties of rubber materials requires fitting the aforementioned static material test data to a constitutive model. Currently, the four most commonly employed constitutive models in commercial finite element software are the Mooney–Rivlin model, Neo–Hookean model, Yeoh model, and 3rd Ogden model. The hyperelastic constitutive model is defined by the strain energy function W, which establishes a relationship between material stress and principal strain.
For the Mooney–Rivlin model, the strain energy function is defined as follows:
For the Neo–Hookean model, the strain energy function is defined as follows:
For the Yeoh model, the strain energy function is defined as follows:
For the 3rd Ogden model, the strain energy function is defined as follows:
where is the material constant that controls the shear behavior; is the material constant controlling the compression behavior; , are the temperature-dependent material constants; is the elastic volume ratio; is the strain invariant of the Cauchy–Green deformation tensor; and is the main tensile ratio. These parameters are dimensionless.
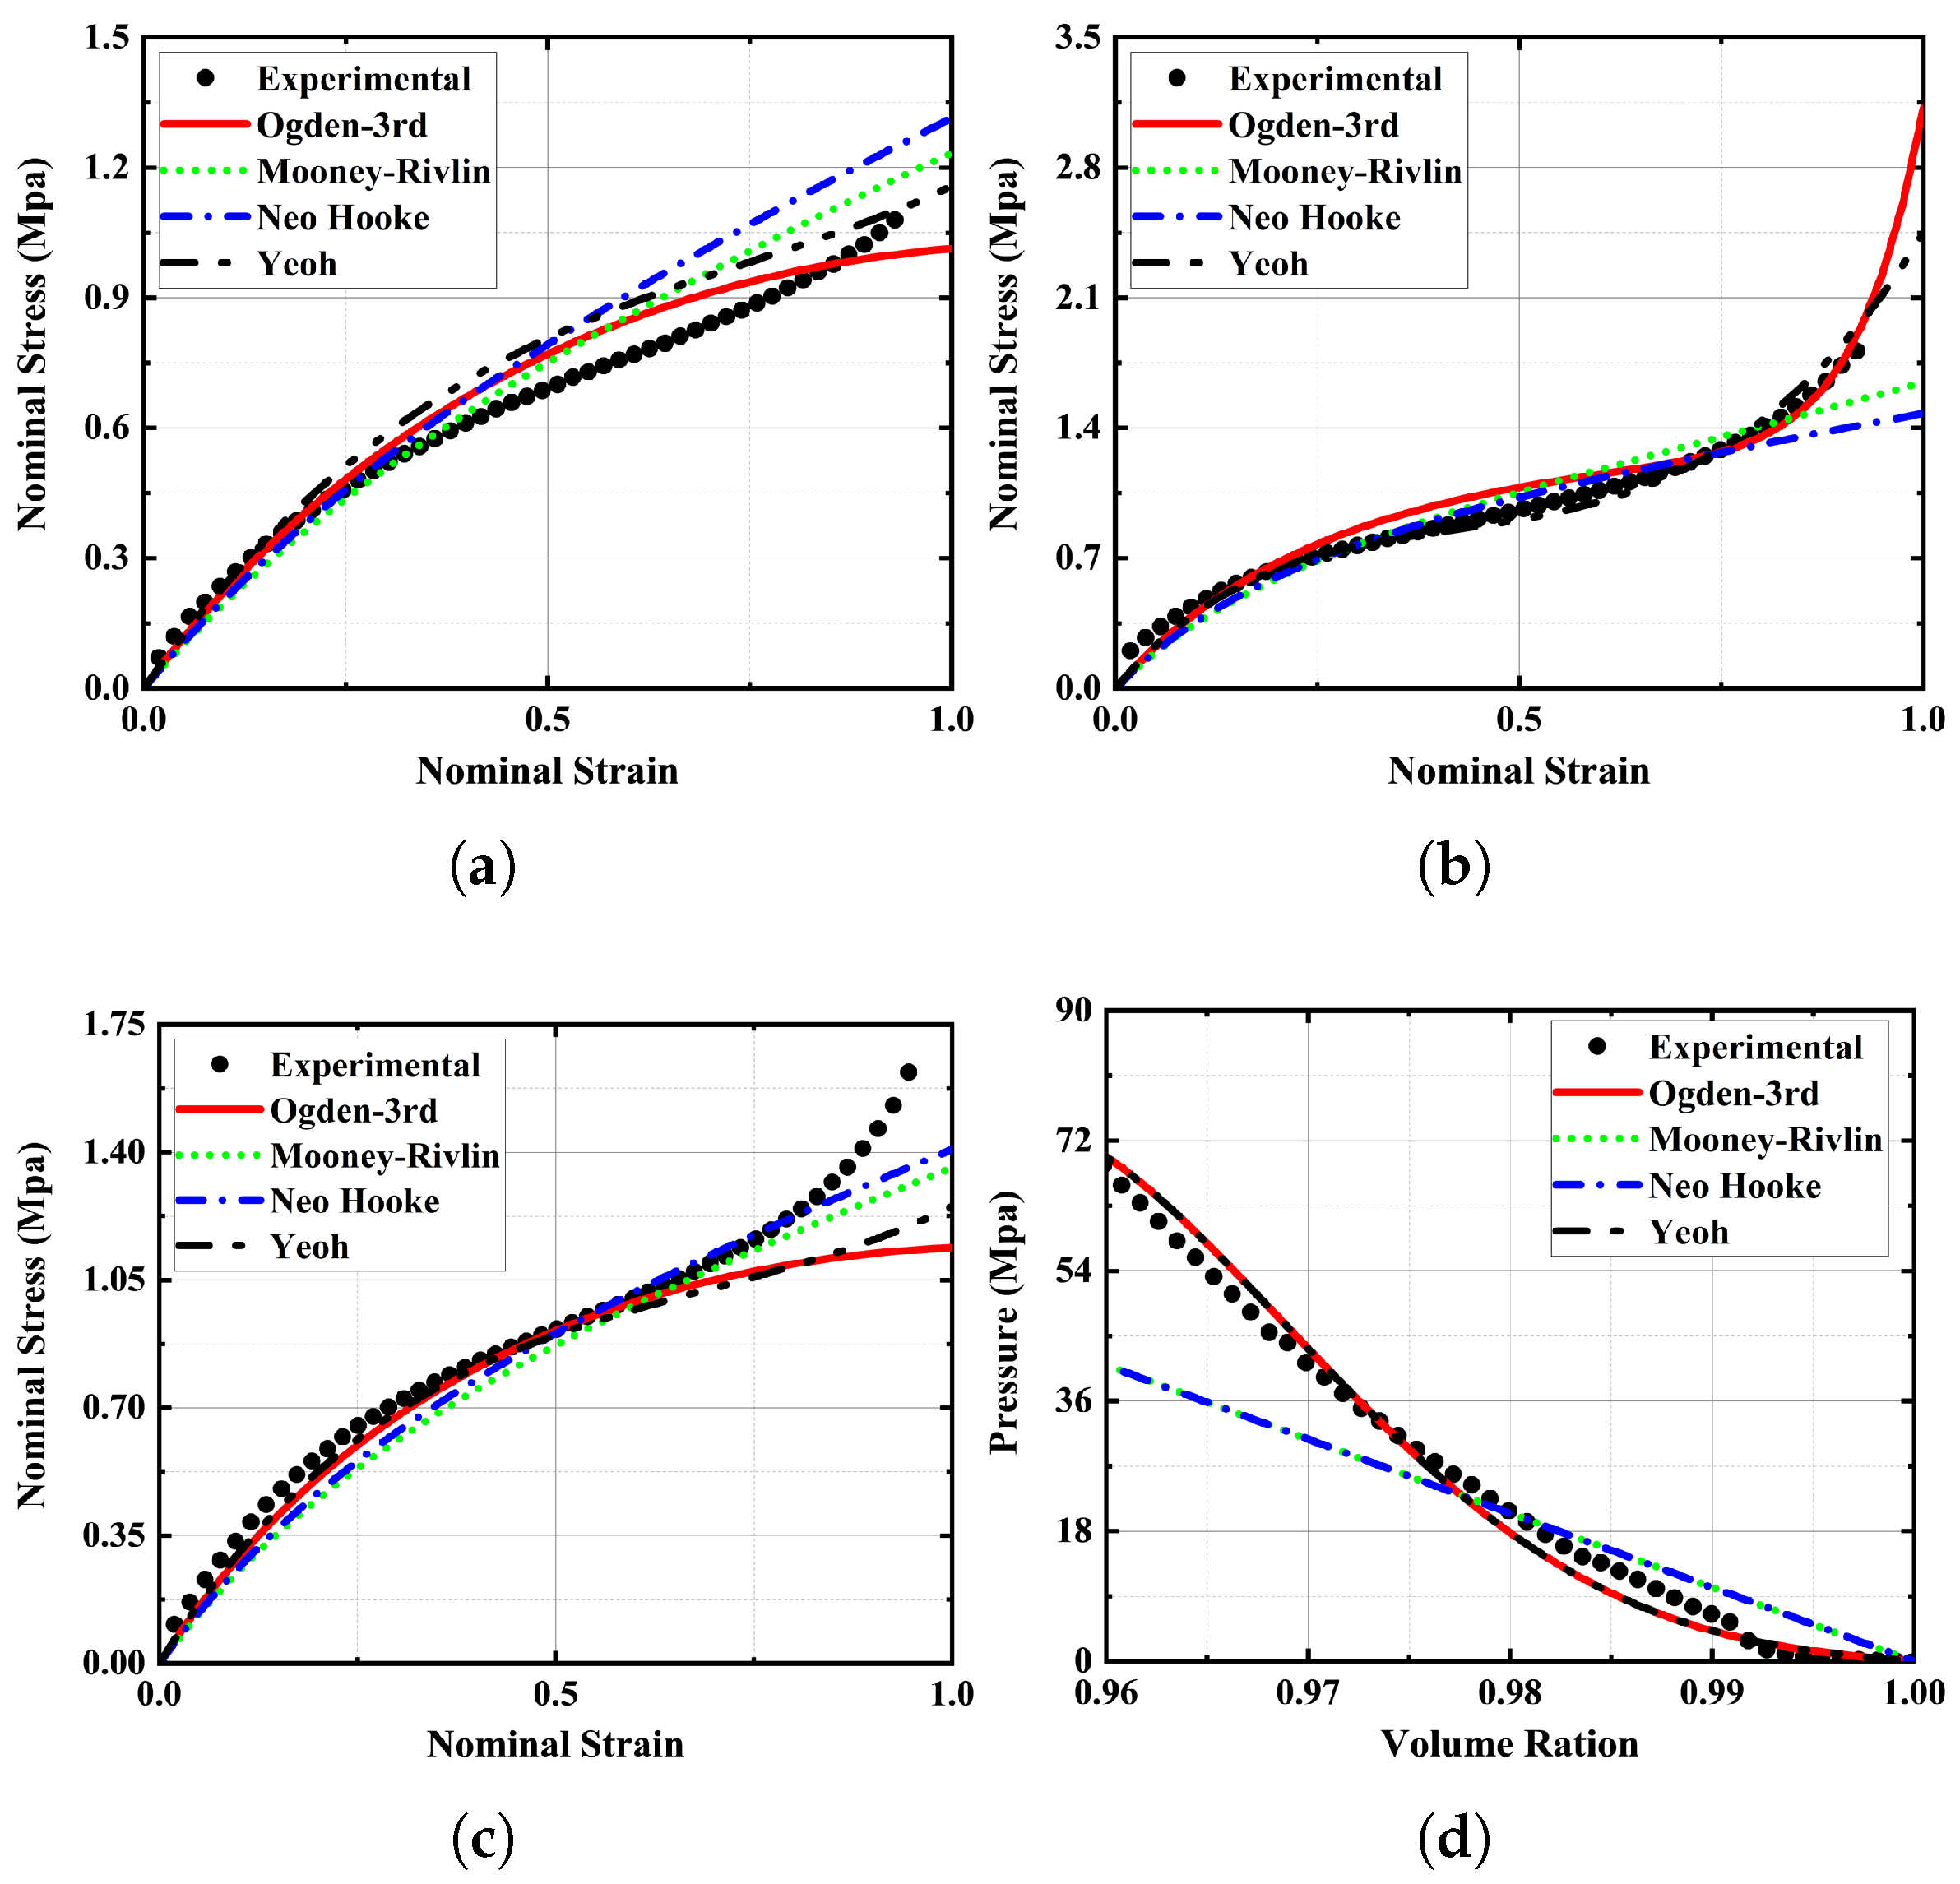
The fitting of constitutive model parameters was completed in Abaqus [42], and the obtained constitutive model parameters are shown in Table 2. Figure 3 shows the static test results and the fitting results of different constitutive models. Since the Mooney–Rivlin model and Neo–Hookean model can only predict the volumetric compression curve linearly, the volumetric compression prediction of the Mooney–Rivlin model and Neo–Hookean model under high static pressure is seriously deviated from the test results, so they are excluded first. The 3rd Ogden model exhibits superior fitting performance in the uniaxial tensile mode, whereas the Yeoh model demonstrates better fitting performance in both the equibiaxial tensile and planar tensile modes. Therefore, the Yeoh model should be selected as the hyperelastic model for Keltan 9565Q.
Table 2.
Parameters of the hyperelastic constitutive model.
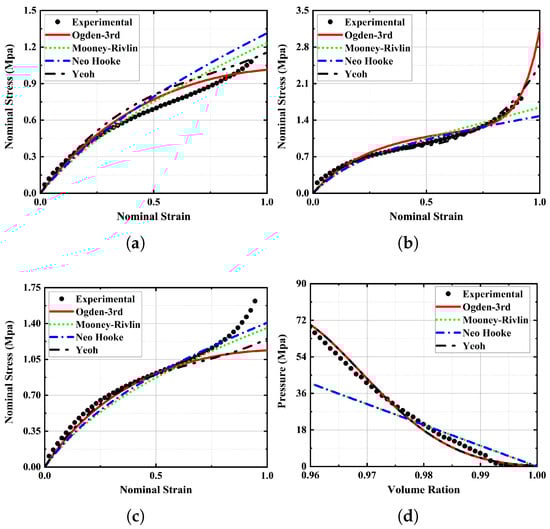
Figure 3.
Static test results and fitting results: (a) Uniaxial tensile. (b) Equibiaxial tensile. (c) Planar tensile. (d) Volumetric compression.
2.2. Dynamic Characterization
The dynamic test, unlike the static test, necessitates the vulcanization and combination of two rubber blocks measuring 20 mm × 20 mm × 5 mm with metal support components to form the dynamic test specimen, as depicted in Figure 4. Essentially, the dynamic specimen resembles a vibration isolator with consistent geometric properties. During the dynamic test, a mechanical testing machine is still employed to stimulate the specimen through sweeping frequencies ranging from 5 Hz to 200 Hz with an amplitude of 0.1 mm. Subsequently, the data processing system directly derives the dynamic stiffness and damping angle of the specimen.
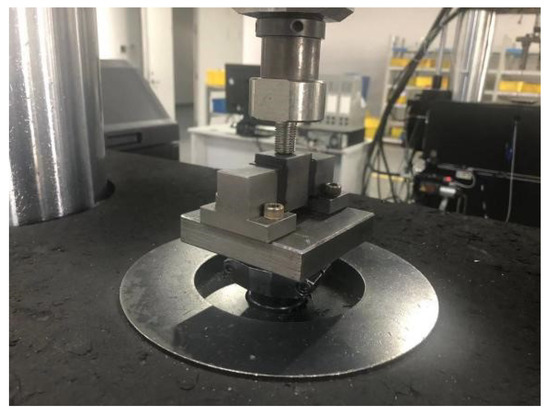
Figure 4.
Dynamic material testing.
The parameters of the viscoelastic constitutive model are determined as follows. Firstly, based on the dynamic stiffness (measured in N/m) and damping angle (measured in degrees) of the specimen, the storage stiffness and loss stiffness can be derived in the following manner:
The storage force and the loss force (measured in N) are, respectively,
where x is the displacement amplitude applied to the specimen, measured in m.
Then, the stored shear stress and the loss shear stress are, respectively,
where is the total shear area of the rubber specimen.
The storage shear modulus and loss shear modulus (measured in Mpa) of the rubber material are
where is the shear strain of the rubber specimen, which is dimensionless.
The normalized shear relaxation function can be utilized in finite element software to represent the viscoelastic behavior of a material in both the real part and imaginary part of the frequency domain:
where is the long-term shear modulus, measured in Mpa.
The normalized shear relaxation function is a description of the dimensionless viscoelastic modulus. It has the advantage that it can be defined independently of elastic material data. Through the above calculation, the normalized shear relaxation function of Keltan 9565Q as shown in Figure 5 is obtained.
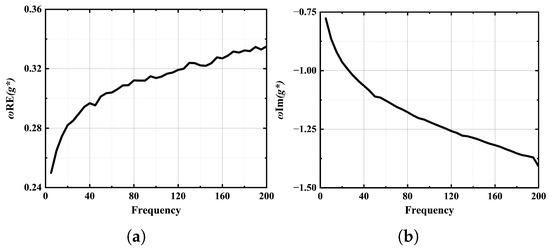
Figure 5.
Normalized shear relaxation function: (a) Real part. (b) Imaginary part.
3. Experimental Setup for Isolator Characteristics
3.1. Static Experiments
The experimental setup utilizes the MTS-370.50 testing machine (MTS Corporation, Eden Prairie, MN, USA) equipped with a 500 kN hydraulic actuating cylinder and operating within a frequency range of 0 Hz to 200 Hz. The testing machine offers a maximum static displacement of 175 mm and a maximum dynamic displacement of 150 mm, providing an effective test space measuring 762 mm × 229 mm. Both the force sensor and displacement sensor exhibit an accuracy level of ±0.5%.
Figure 6 shows the static test process using WH-150 as an example. Among the three directions, achieving the experiment in the Z direction is relatively straightforward. The lower support seat of the isolator is directly connected to the base of the testing machine, and a load is applied from above onto the isolator, as depicted in Figure 6c. For experiments conducted in the X and Y directions, a special fixture is required to connect two face-to-face vibration isolators before installing them on the test machine, as shown in Figure 6a,b. During the static experiment, the isolator is first slowly loaded (at a speed of 0.1 mm/s) from the initial state to a specific load and then restored to the initial state. After two such cycles, the force-displacement curve of the loading section of the third cycle is recorded as the result. It should be noted that when conducting tests along the X and Y directions, due to gravitational effects exerted by the fixtures themselves, initial deformation occurs within the isolators that needs compensation through adjustment of the actuating head’s initial position on the testing machine.
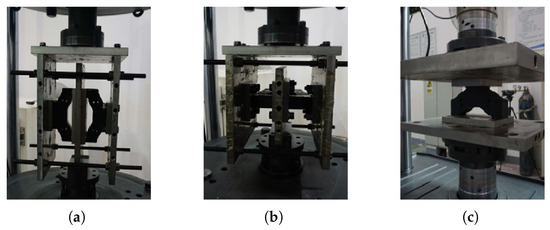
Figure 6.
Static experiments on an isolator: (a) X direction. (b) Y direction. (c) Z direction.
3.2. Dynamic Experiments
As a vibration isolation device, the dynamic characteristics of an isolator can be expressed by the correlation between the vibration and force at the input and output ends. Typically, this correlation is established through a four-pole parameter model [43]:
where and are the dynamic forces at the input and output ends, measured in N; and are the velocities at the input and output ends, measured in m/s; and are the input mechanical impedance at the input and output ends, and and are the transfer mechanical impedance, measured in N·m/s. In other words, the input mechanical impedance represents the relationship between the response of the excitation end and the external excitation, while the transfer mechanical impedance represents the relationship between the response of the fixed end and the external excitation.
However, accelerometers are typically employed during experimental procedures. In the frequency domain, the relationship between velocity and acceleration can be mathematically expressed as follows:
where and are the acceleration of the input and output ends, respectively.
By combining Equations (10) and (11), the mechanical impedance of an isolator can be obtained as follows:
However, Equation (12) solely captures the dynamic characteristics of an isolator at a specific translational degree of freedom. In most cases, vibration isolation elements primarily attenuate vibrations in the vertical direction (Z direction), where the vertical component of the excitation force received by the isolator is typically dominant. Consequently, numerous studies have predominantly focused on investigating the vertical dynamic characteristics of vibration isolators [8,44]. However, in vibration prediction, for example, when the vibration response of the structure is predicted by the OPAX method [45] in the transfer path analysis method (TPA), the dynamic characteristics of the isolator in the three translational degrees of freedom must be obtained at least.
The sensors and instruments used in the experiment are shown in Table 3. They have been calibrated before the test and are within the validity period. Among them, the accelerometers are used to measure the acceleration of the input and output ends and are used for a one-dimensional check, the impedance head is used to measure the dynamic force at the input end, the three-axis dynamic force plate is used to measure the dynamic force at the output end, the dynamic force sensor is used to calibrate the force plate, and the electromagnetic excitation system is used to stimulate the input end of the vibration isolator. The data acquisition modules are used to collect the data of the sensor and transmit them to the computer.
Table 3.
Sensors and instruments used in dynamic experiments.
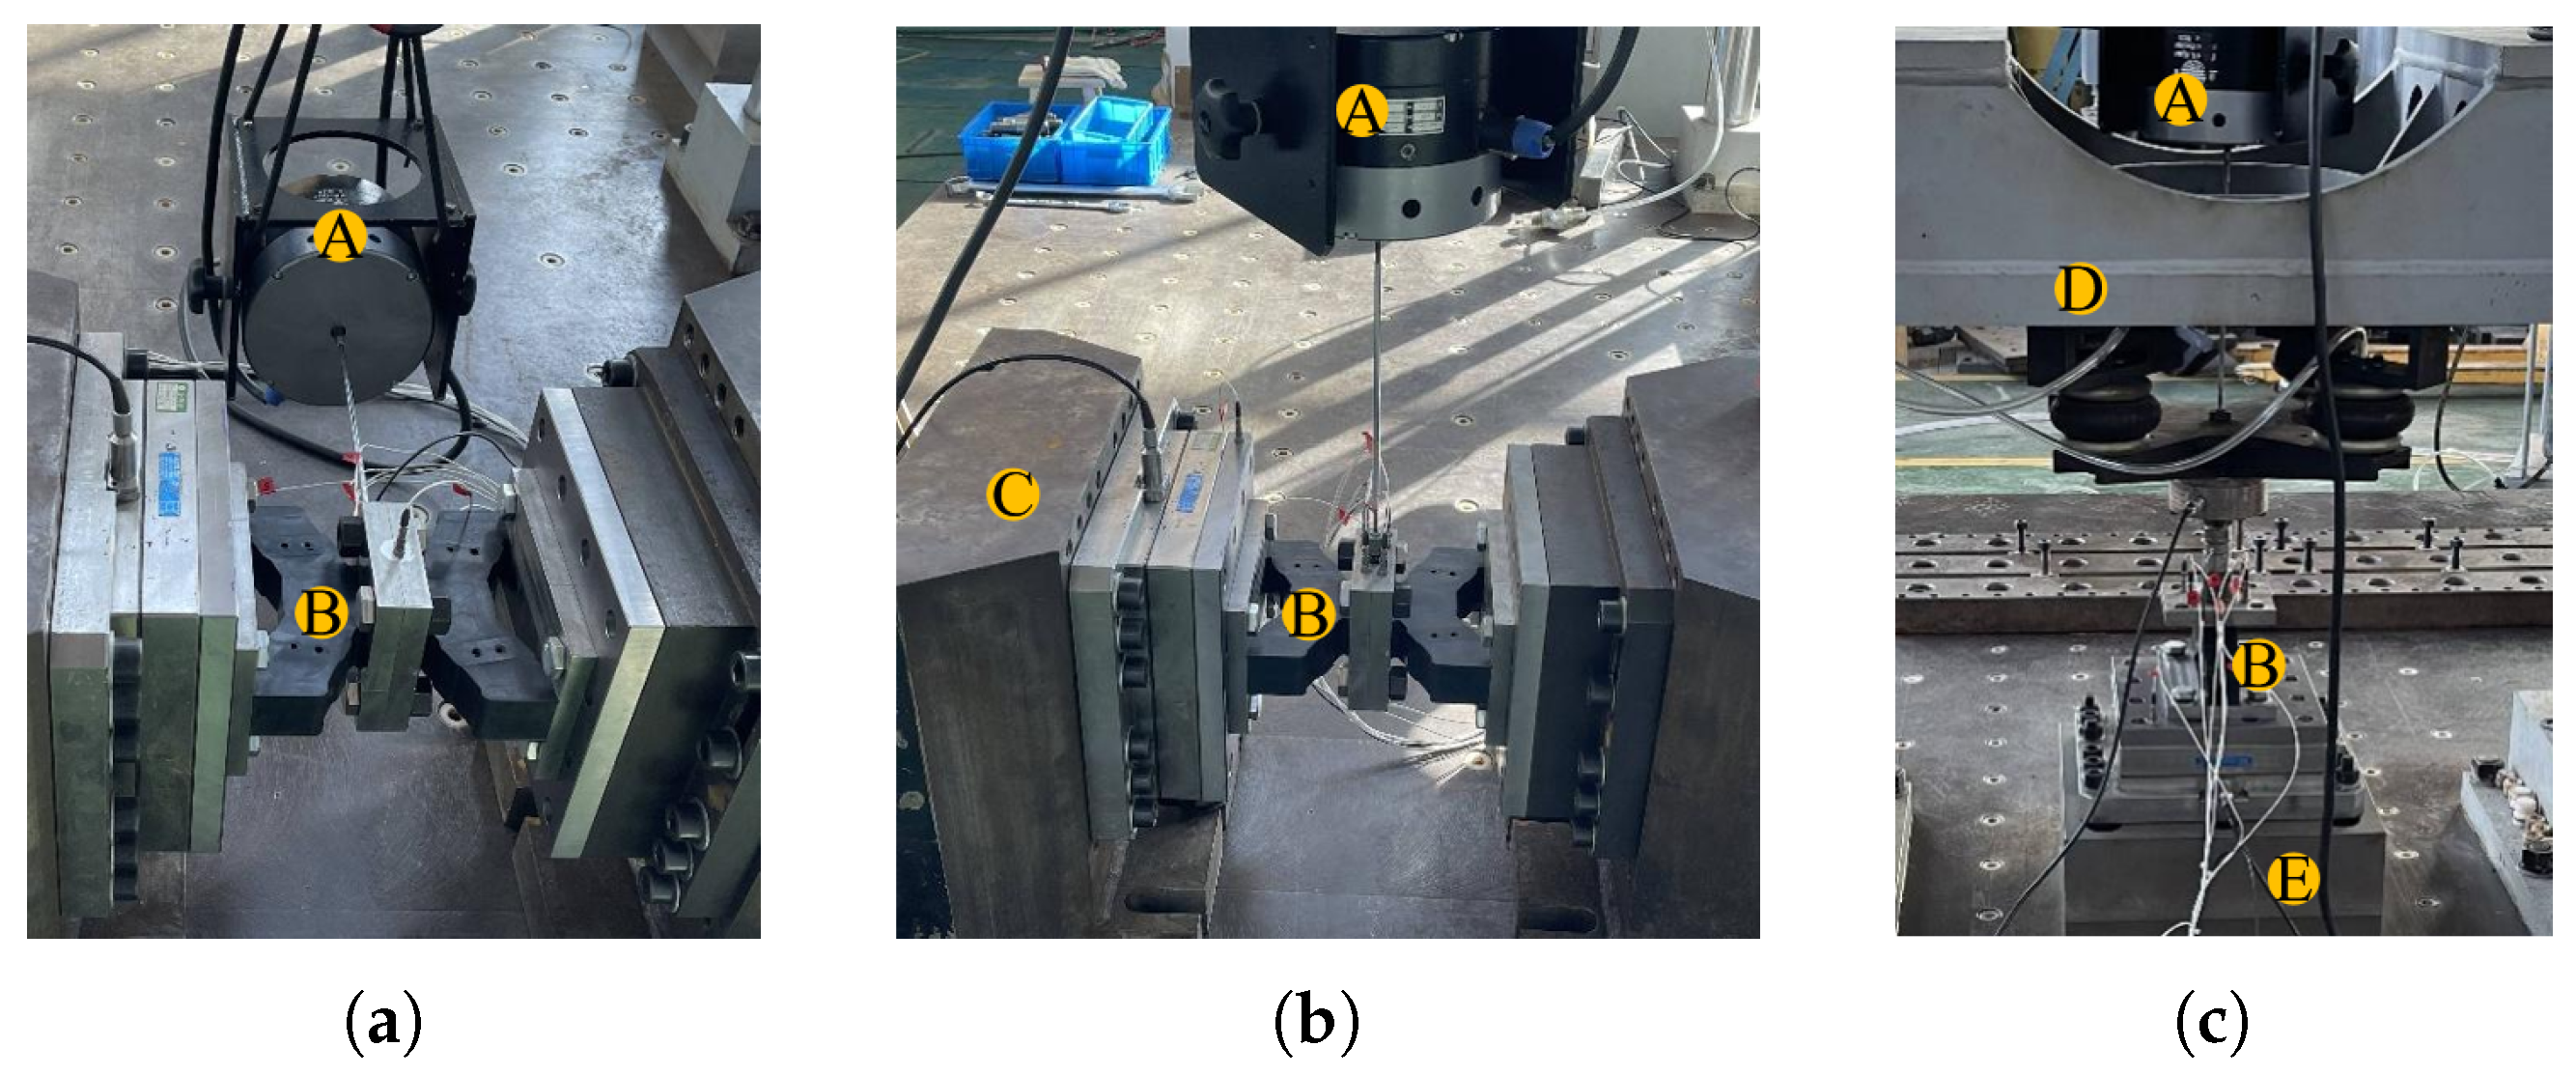
Figure 7 shows the experiment bench with a WH-150 isolator as an example. The horizontal loading mechanism is used to provide the preload along the Z direction of the isolator during the dynamic experiment in the X and Y directions, and the vertical loading mechanism is used to provide the preload during the dynamic experiment in the Z direction. The vertical loading mechanism is equipped with four air bag isolators, which are used as dynamic decoupling devices, and their function is to dynamically decouple the isolator under testing from the mounting frame. Similar to the static experiment, two isolators of the same model are installed face to face during dynamic experiments in the X and Y directions to suppress vibrations in undesirable directions. The bench is designed in accordance with international standards [46], and the bench fulfills the following requirements:
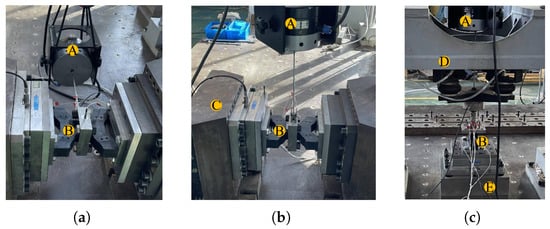
Figure 7.
Dynamic experiments on the isolator: (a) X direction. (b) Y direction. (c) Z direction. Bench components: A: Electromagnetic shaker; B: Isolator under testing; C: Horizontal loading mechanism; D: Vertical loading mechanism; E: Rigid base.
- The installation frequency of the bench system is less than or equal to 0.4 times the lower test frequency;
- The static stiffness of the loading mechanism surpasses that of the tested isolator by at least 10 times;
- The transition element connecting the tested isolator to the impedance head possesses a first natural frequency 1.2 times higher than the upper limit measurement frequency.
In order to exclude the effect of temperature and to ensure that the temperature inside the isolator is the same as the outside world, the isolators are placed at the same 23 °C as the material test environment and kept there for 24 h prior to dynamic testing. Prior to installation of the isolators, 6 cycles of loading and unloading are conducted, with each cycle reaching a peak load that is 1.25 times higher than the rated load. To prevent resonance at specific frequencies within the system, white noise is employed as the excitation signal instead of a sweep signal. The bandwidth range for this excitation signal spans from 10 Hz to 1 kHz, while the data acquisition system operates at a sampling frequency of 8192 Hz. After the completion of the experiment, it is necessary to verify the validity of the data. The data can be considered valid if they satisfy the following conditions:
- The drop in the acceleration vibration level between the input and output end of the isolator exceeds 20 dB in the excitation direction;
- The drop in the acceleration vibration level between the excitation direction at the input end of the isolator and its orthogonal directions exceeds 15 dB;
- The coherence function between the excitation force at the input end and the acceleration at both ends as well as between the dynamic force at the output end and acceleration at the input end exceeds 0.7 across all frequencies.
The test data processing is completed within the signal acquisition software. Firstly, all test signals undergo detrending to eliminate DC noise originating from the sensor. Subsequently, the input acceleration signal is integrated in the frequency domain to derive the velocity signal. Finally, by solving for the transfer function between the velocity and force signals, experimental results for mechanical impedance can be obtained.
4. Numerical Modeling of Isolators
4.1. Model Geometry
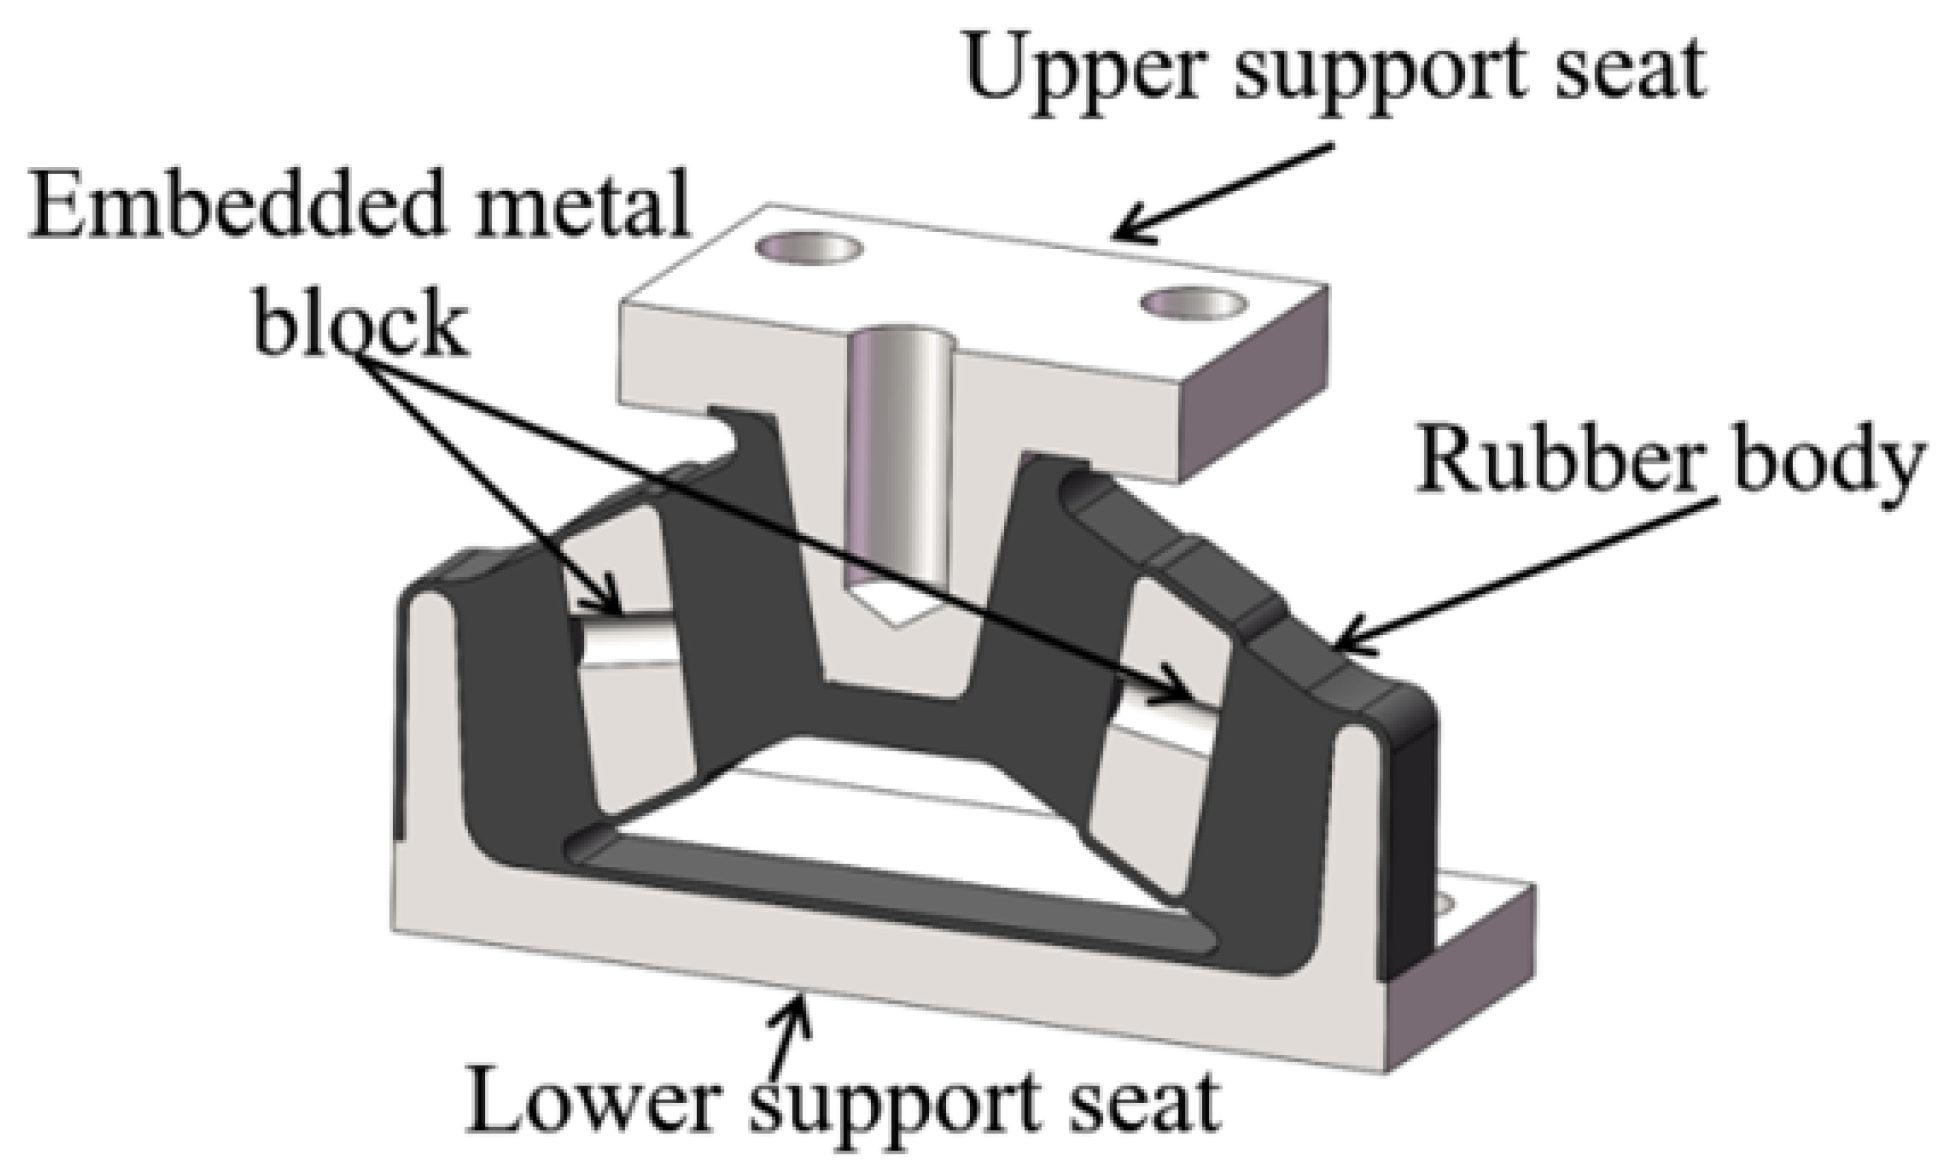
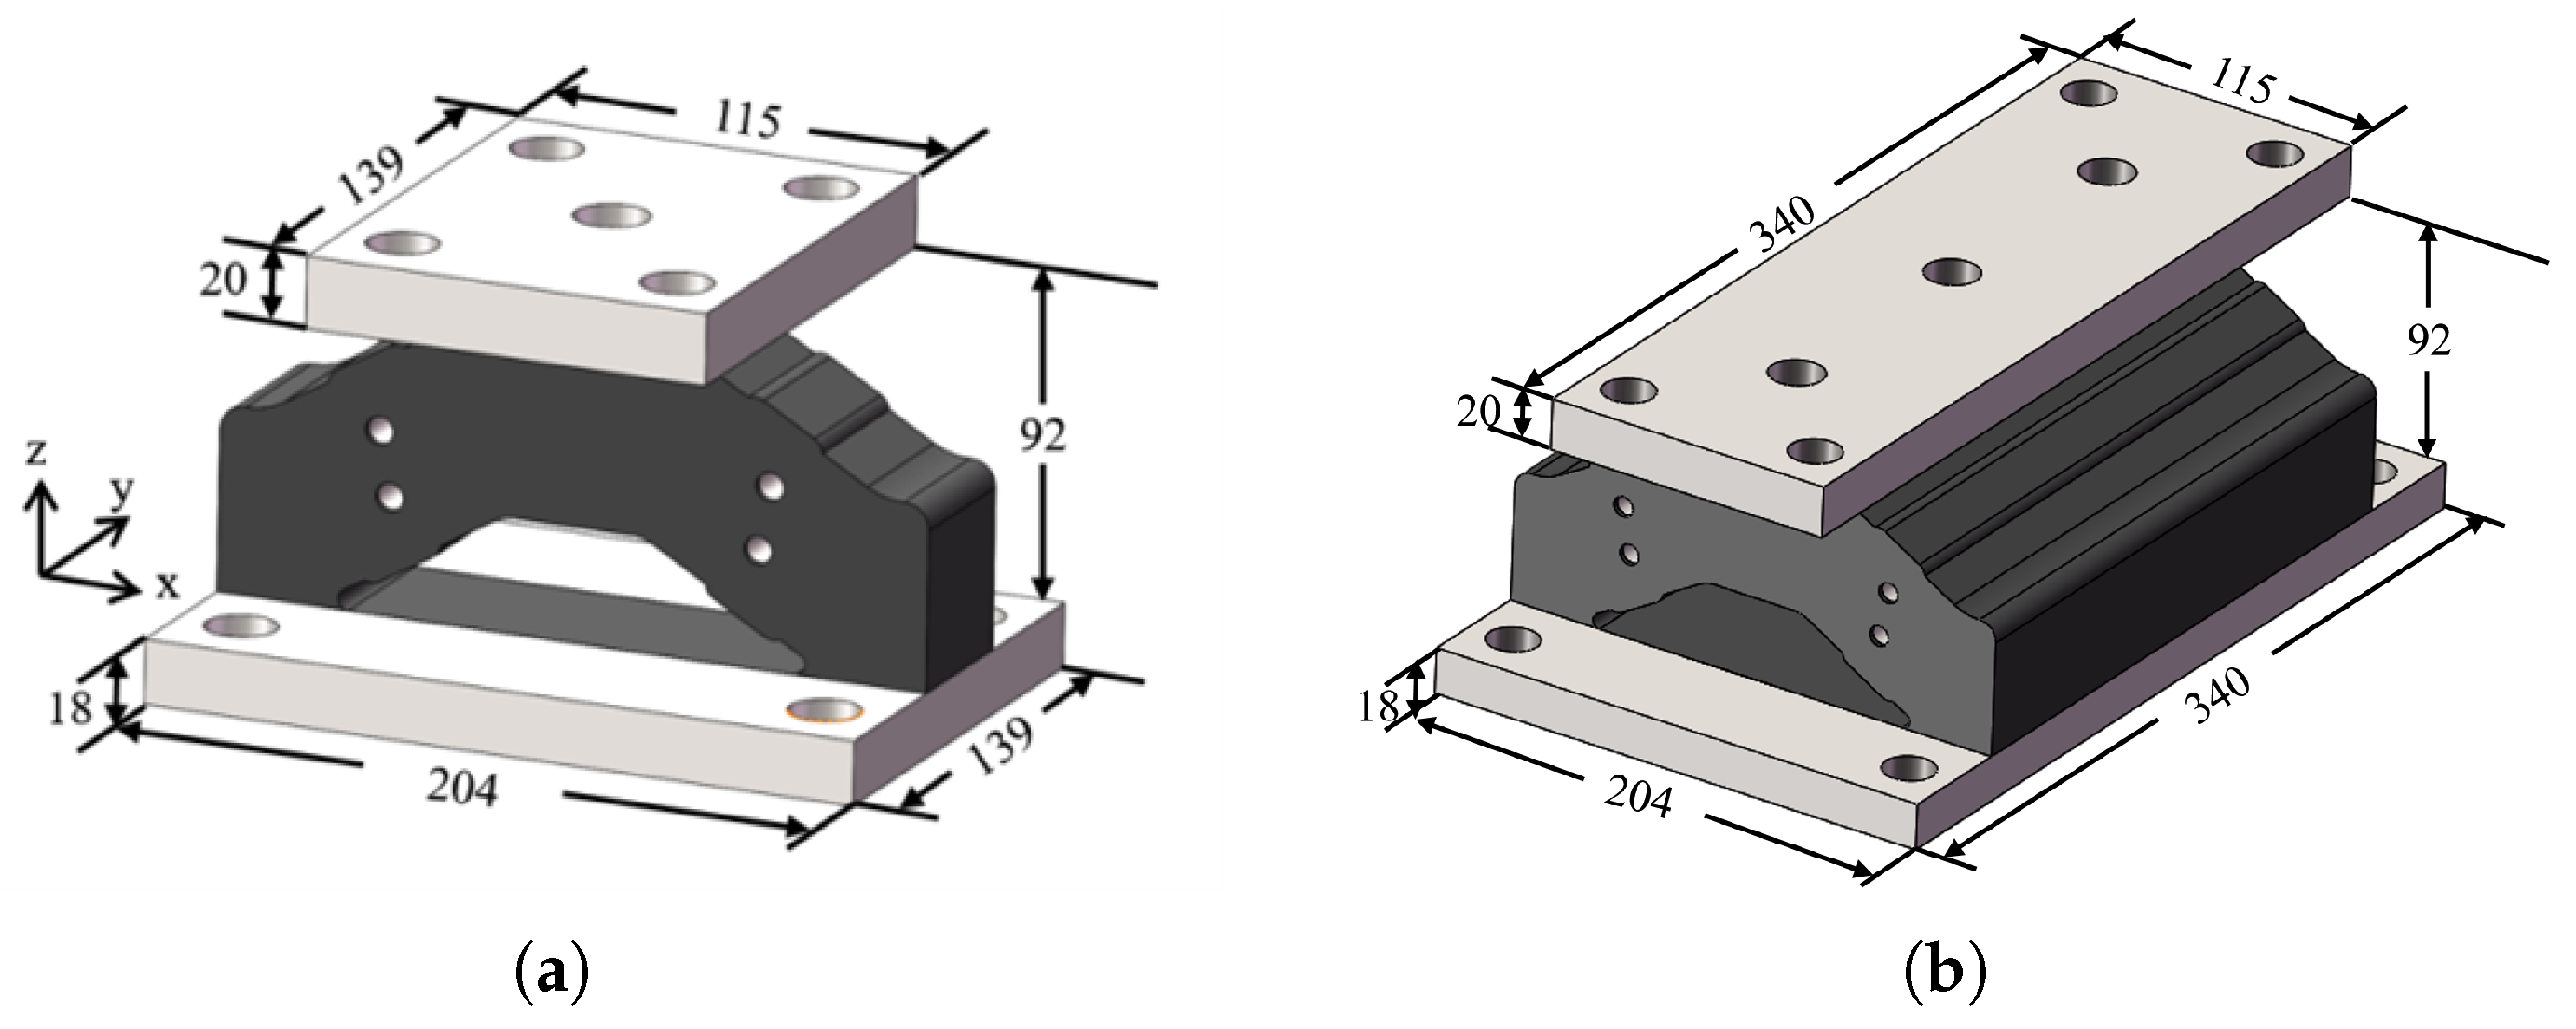
In order to validate the general applicability of the numerical calculation method, this paper selects two different types of isolators from the same series: WH-150 and WH-1200, as mentioned earlier. Here, “WH” represents the molded structure of the isolator, while “150” and “1200” represent their respective rated loads of 150 kg and 1200 kg. The WH series isolators, exemplified by WH-150 in Figure 8, consist of four essential components: the upper support seat, the lower support seat, the embedded metal block, and the rubber body. The upper support seat is utilized for connecting to the power equipment, while the lower support seat is employed for connection to the foundation. The embedded metal blocks serve to enhance the load-bearing capacity of the vibration isolator, whereas the rubber body functions as a means of isolating vibrations. The rubber body is made of Keltan 9565Q, and the rest of the parts are made of 304 stainless steel. The density of 304 stainless steel is 7850 kg/m3, the Young’s modulus is 2.1 × 10⁵ MPa, and the Poisson ratio is 0.3. The dimensions of the two isolators are presented in Figure 9, which also illustrates the provisions for the X, Y, and Z directions for ease of subsequent analysis and description. Both isolator models employ identical materials and possess an identical cross-sectional structure and size along the X-Z direction. The primary distinction lies in the larger Y dimension of the WH-1200 isolator.
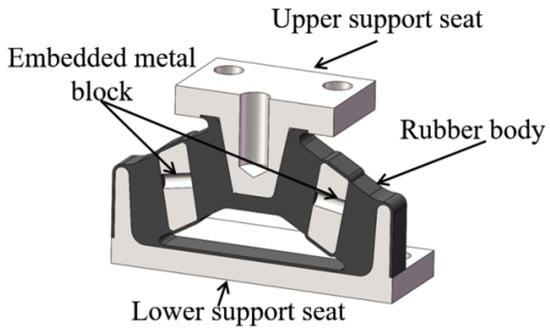
Figure 8.
The structure of the WH series isolators.
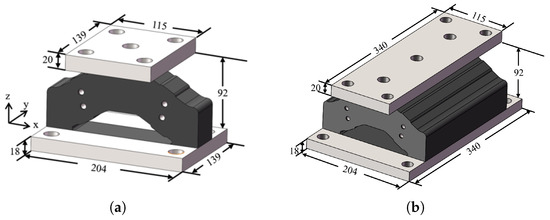
Figure 9.
The main dimensions and directions of the isolators: (a) WH-150. (b) WH-1200.
4.2. Loading and Interaction
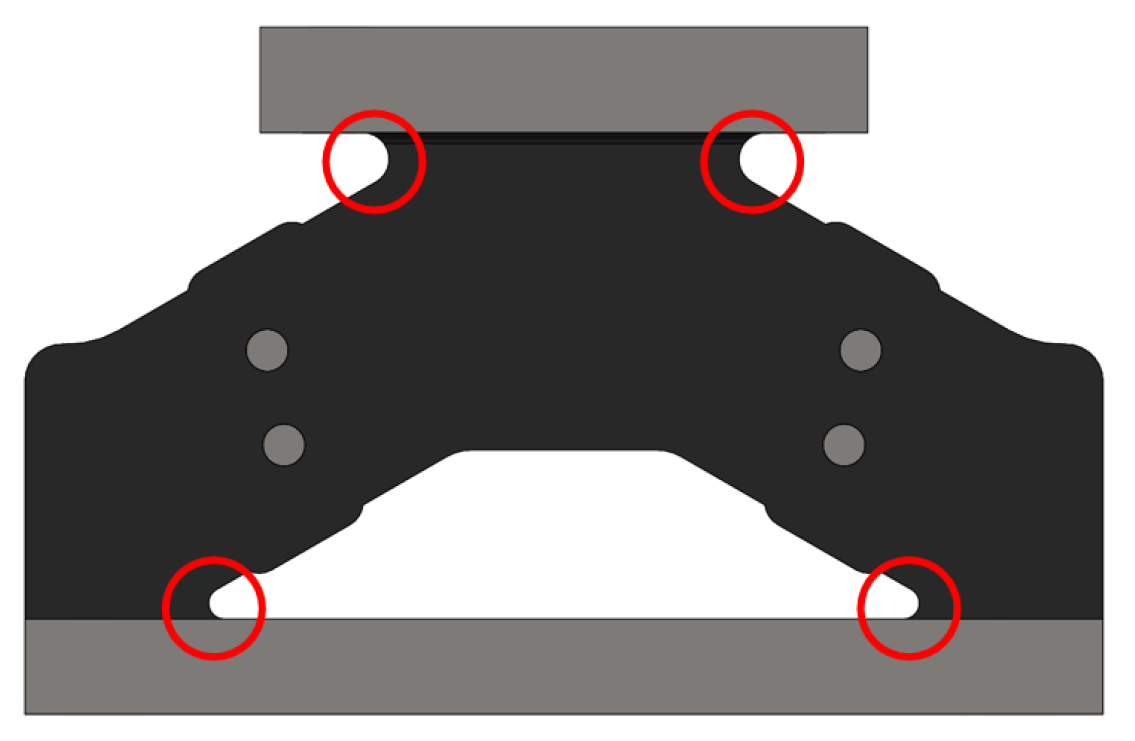
In accordance with the established practice of vibration isolator simulation research [12,47], two reference points are positioned at the midpoints of both the upper and lower surfaces of the vibration isolator to prevent synthesis torque. All six degrees of freedom pertaining to the upper and lower surfaces are then linked to the designated reference points, thereby enabling the motion of the upper reference point to represent that of the upper surface of the vibration isolator. The support reaction force of the lower reference point can effectively signify the resistance force experienced at the fixed end of the isolator. The filleted corners between the rubber body and the support seat undergo significant deformation under the rated load, potentially leading to the self-contact phenomenon. Therefore, it is necessary to designate these areas as self-contact regions, as marked by the red circle in Figure 10. The self-contact properties encompass tangential behavior and normal behavior, with a friction coefficient of 0.8 assigned to tangential behavior and hard contact specified for normal behavior.
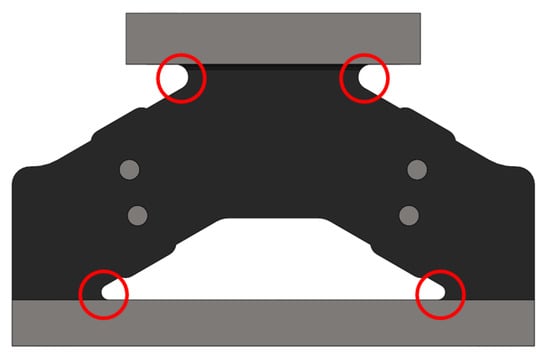
Figure 10.
Self-contact region.
All types of static and dynamic loads are applied to the reference points on the upper surface. In the static characteristic analysis of the Z direction of the isolator, the rated load corresponding to each type is directly applied along the negative direction of the Z-axis. For the analysis of the X and Y directions, a displacement load of 3 mm is applied to the isolator due to unspecified rated loads. The dynamic characteristic analysis is conducted through the harmonic response analysis step, indicating that the system operates in a linear manner. This implies that, at the same frequency, there exists a linear correspondence between the input and output of the system. Consequently, variations in the excitation amplitude do not impact the calculation results of dynamic characteristics, so the amplitude of the dynamic analysis is set to a 1 mm unit excitation. In order to align with the preload actual application scenario during calculations of its dynamic characteristics, all preloads are applied in the negative direction along the Z-axis while maintaining an amplitude equivalent to the rated load of the isolator. Additionally, it should be noted that the amplitudes of the preload correspond to the rated loads of the isolators.
4.3. Boundary Condition
In all calculations, a fixed constraint is imposed on the lower reference point of the isolator to ensure that the displacement of the upper reference point accurately represents the absolute displacement of the isolator. Additionally, any movement of the upper reference point in non-exciting directions is restricted to prevent unwanted motion.
4.4. Model Meshing
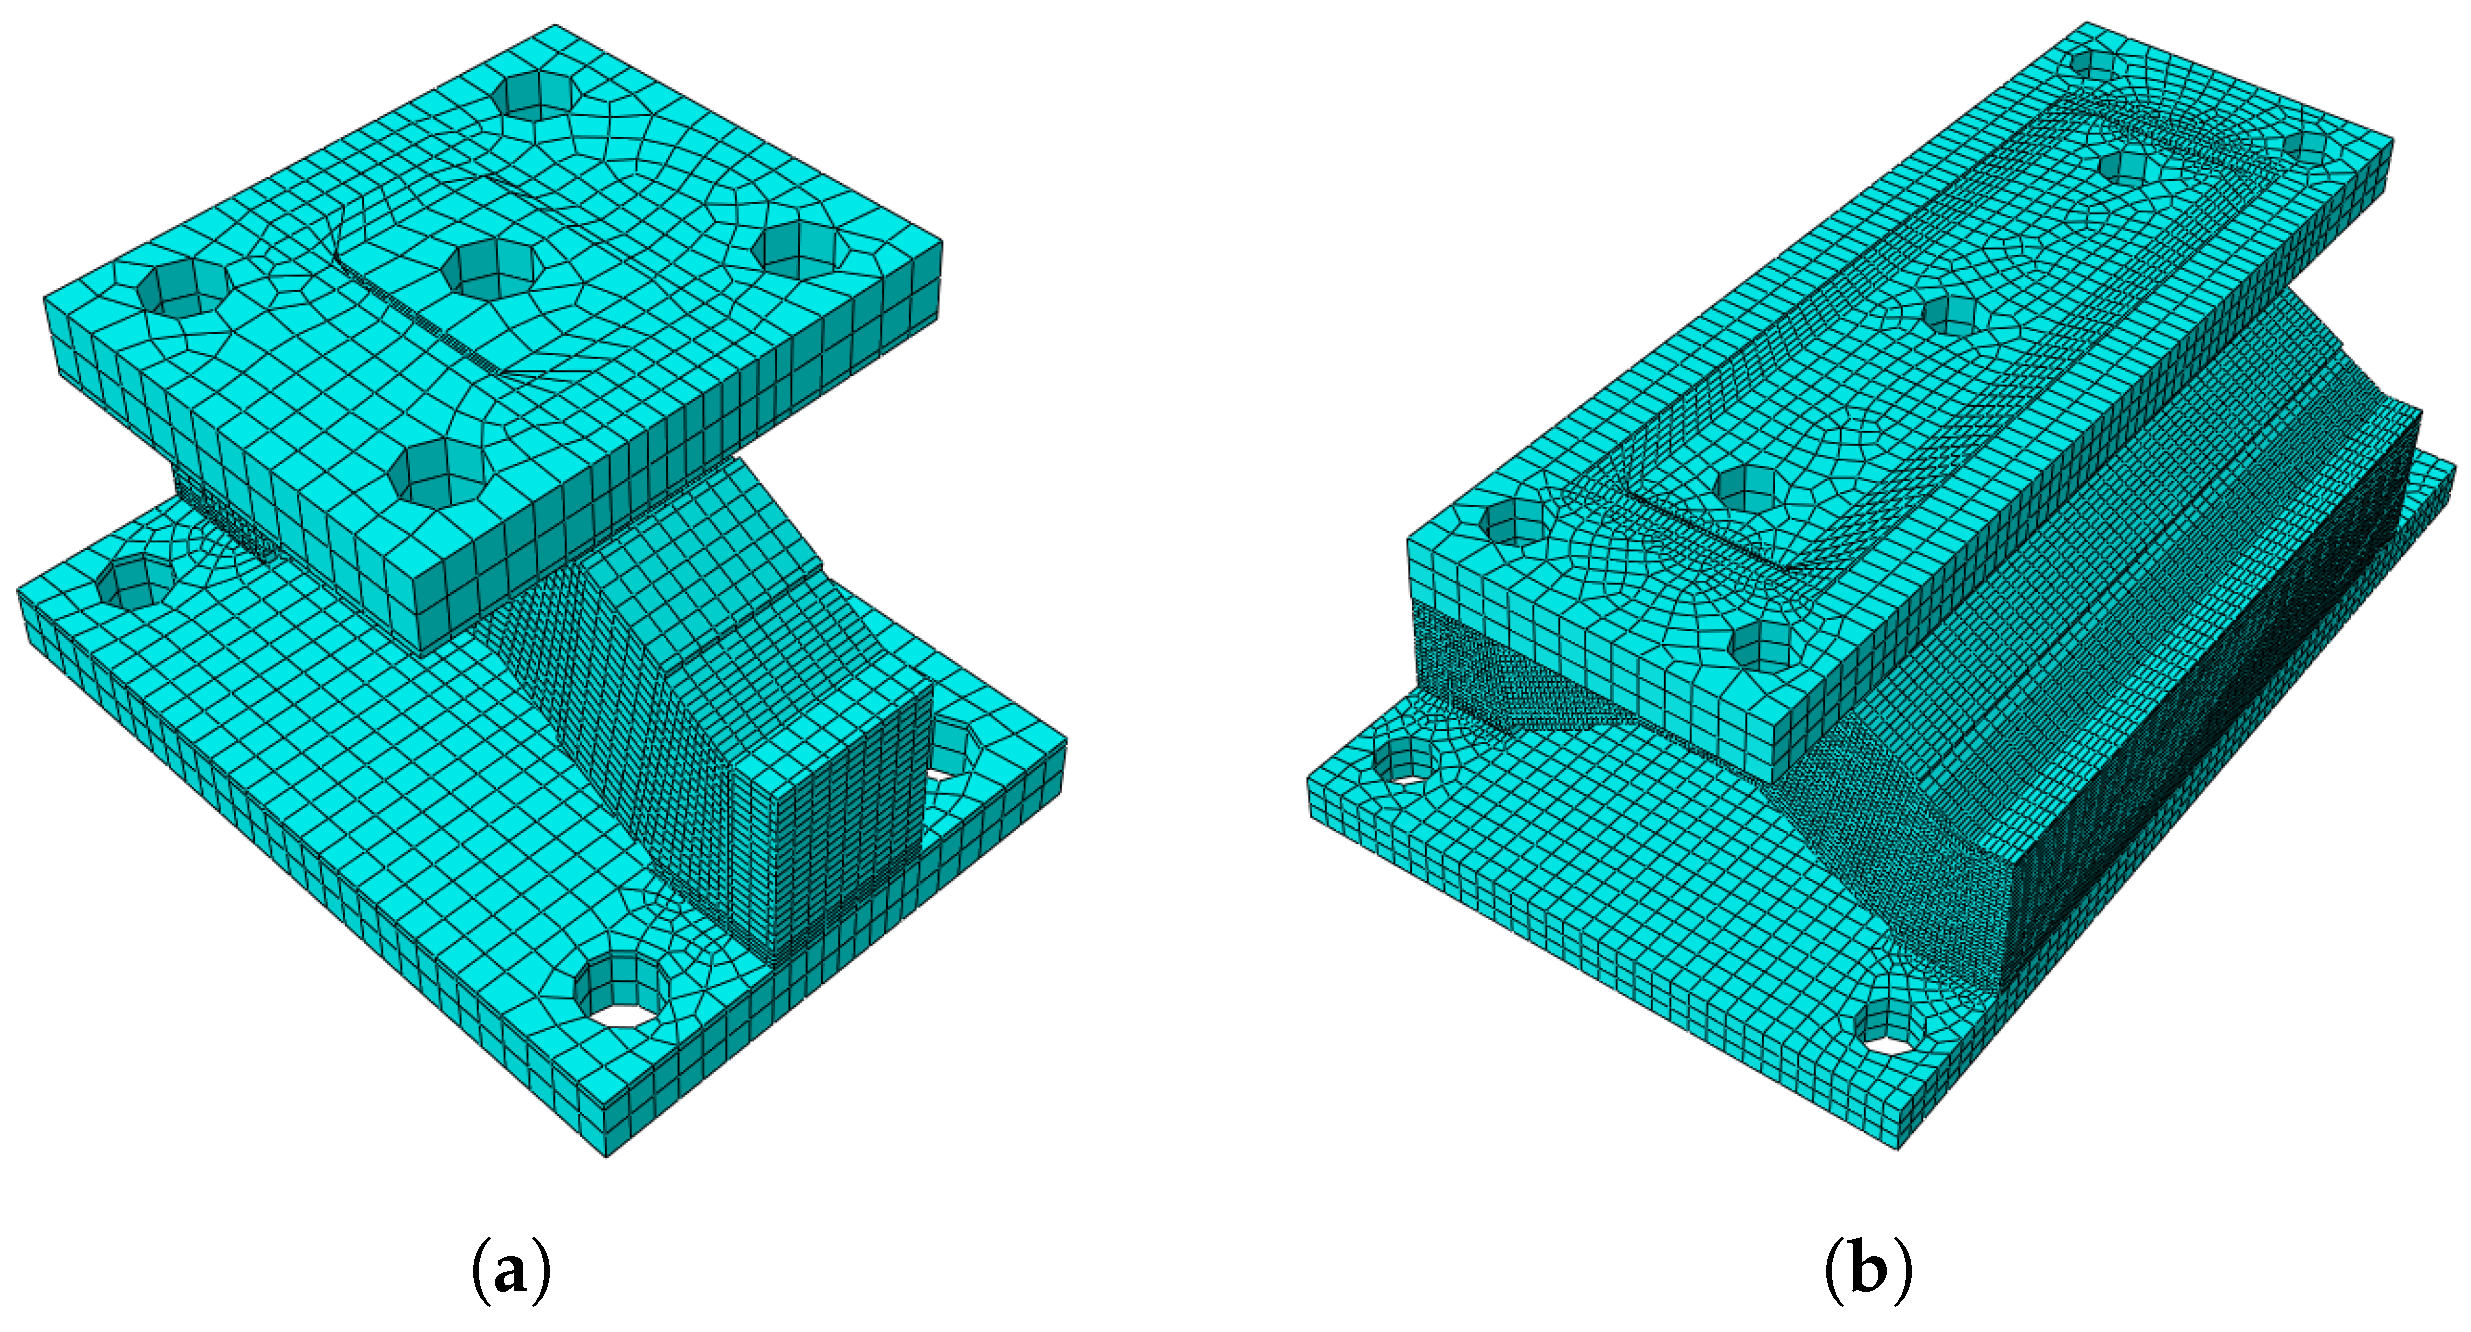
Prior to the meshing, the geometry of the isolator was properly simplified, mainly to simplify the positioning holes of the embedded metal block for holding the position during the vulcanization process, and to simplify some unnecessary filleted corners. As directly stimulated components, the mass of the upper support seats had a great influence on the high-frequency dynamic characteristics of the isolators, so the bolt holes of the upper and lower support seats are preserved at the same time. After completing geometric simplification, the isolators are segmented into as many hexahedral regions as possible. These regions utilize C3D20 elements, which are second-order hexahedral elements with 20 nodes. In regions where C3D20 elements are not applicable, the C3D10 elements, also known as the second-order tetrahedral elements with 10 nodes, are utilized. Both elements’ nodes possess three translational degrees of freedom. The meshing results of the numerical model are shown in Figure 11.
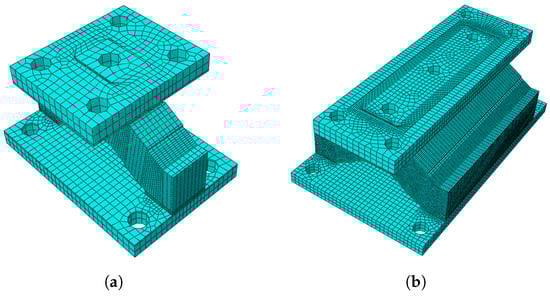
Figure 11.
The model meshing results of the isolator: (a) WH-150. (b) WH-1200.
5. Results and Discussion
5.1. Static Characteristic Comparison
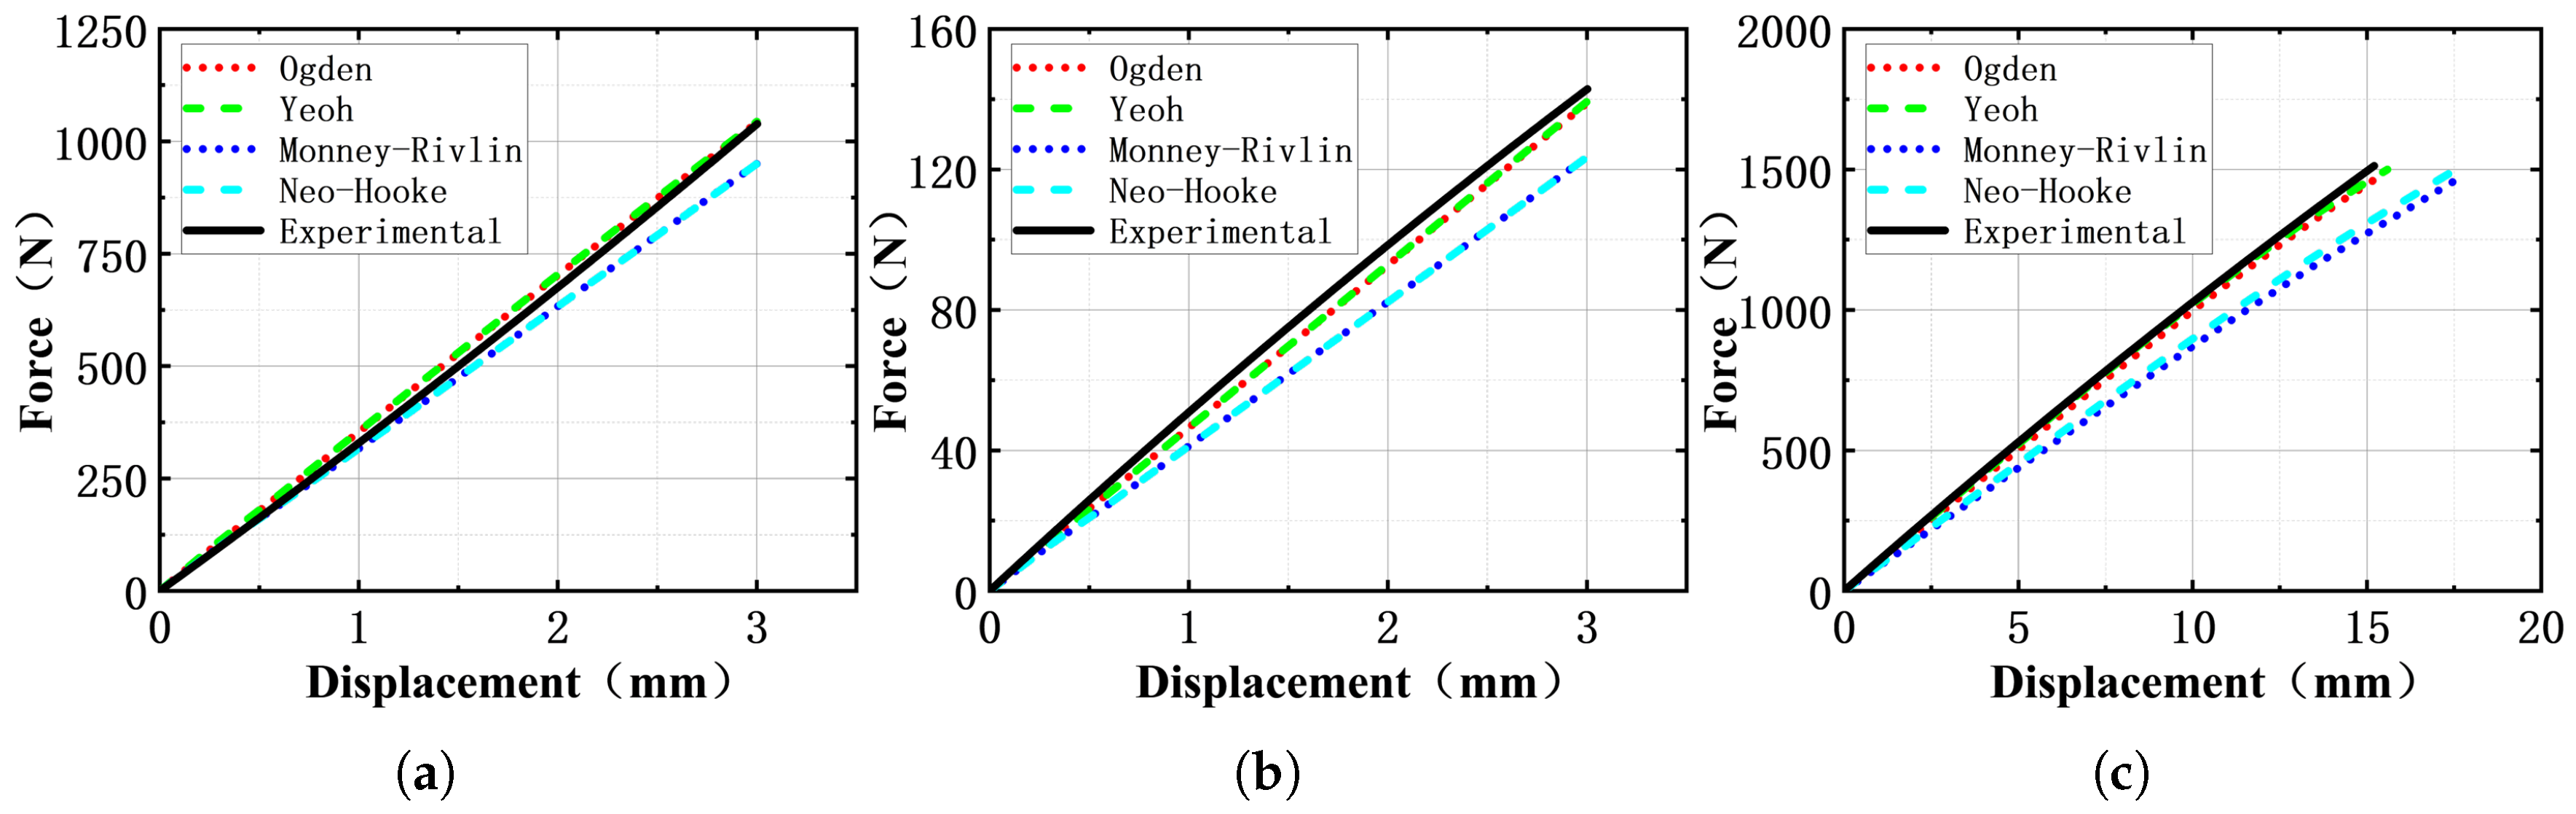
In Section 3.1, the Yeoh model has been identified as the most suitable among all constitutive models for accurately representing the hyperelastic properties of Keltan 9565Q. To substantiate this claim, simulations were conducted using the four aforementioned hyperelastic constitutive models to analyze the static characteristics of the WH-150 isolator. Figure 12 presents both the numerical and experimental results of the force-displacement curves in the three translational directions for the WH-150 isolator. It is evident that both the Mooney–Rivlin model and Neo–Hookean model underestimate the stiffness of the isolator in all three directions. In contrast, predictions from the Yeoh model and 3rd Ogden model closely align with the experimental results, with a smaller error between the curve obtained by the Yeoh model and the experimental curve in the Z direction.
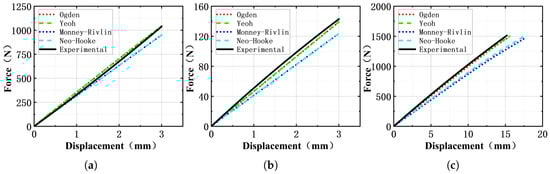
Figure 12.
Force-displacement curve of WH-150: (a) X direction. (b) Y direction. (c) Z direction.
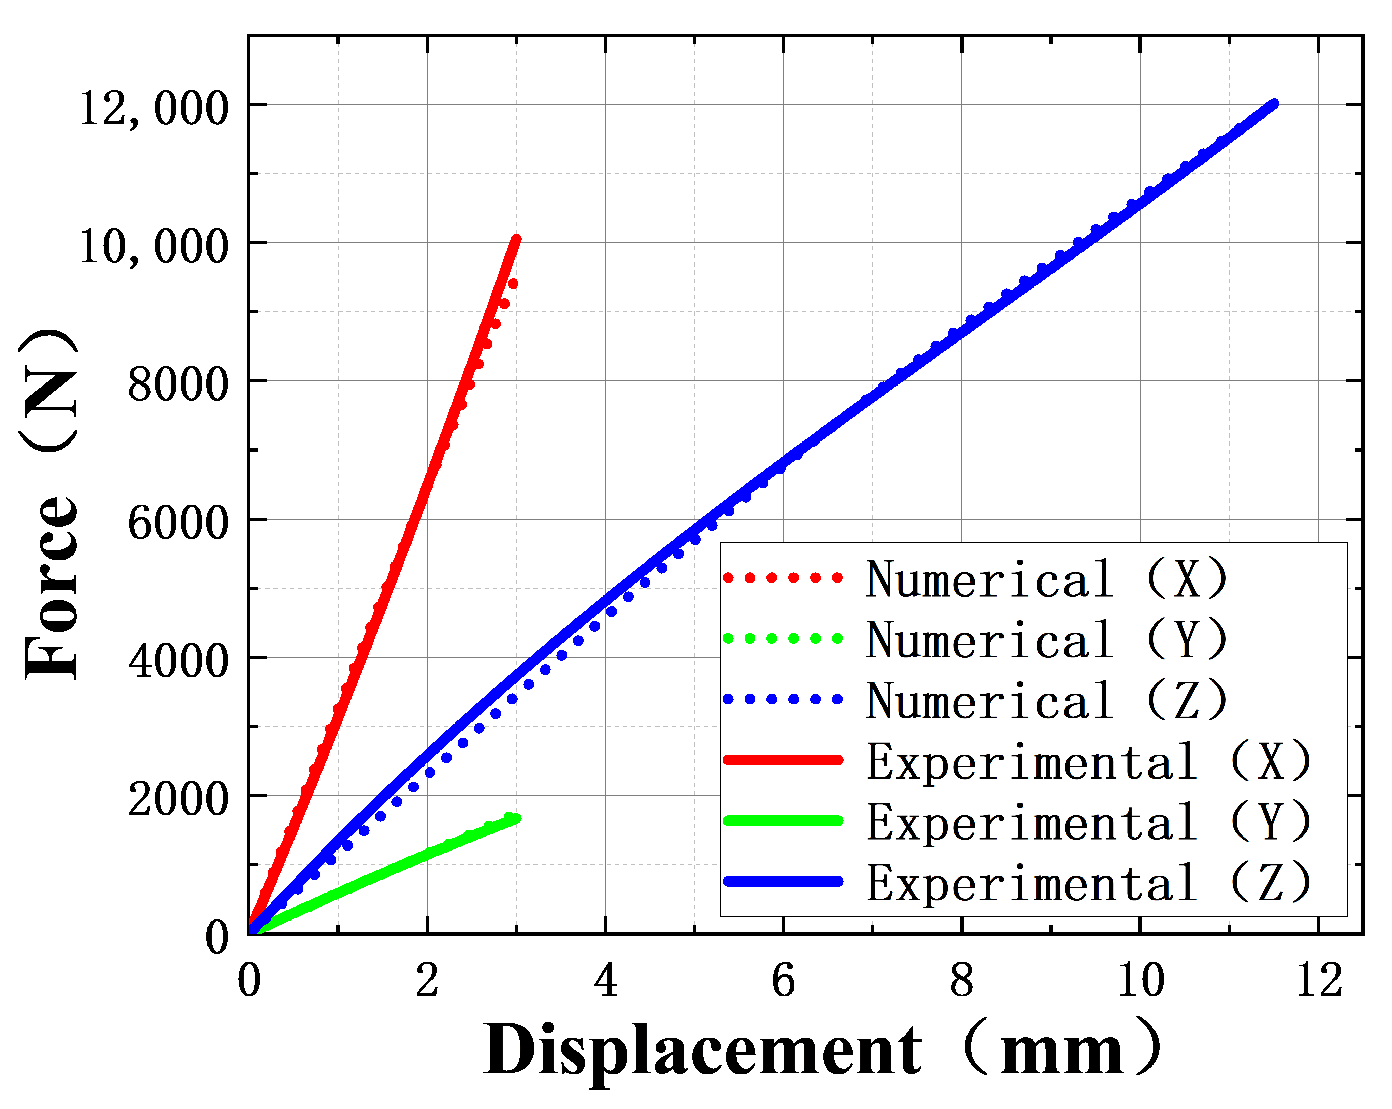
Figure 13 displays the numerical results of the force-displacement curve predicted by the Yeoh model for the WH-1200 isolator, demonstrating an almost perfect overlap with the experimental curve in all three directions. While low-order models are commonly utilized in some studies [41,47] to simplify material testing and enhance computational efficiency, the comparison results of static characteristics presented in Figure 12 indicate that for isolators subjected to significant deformation and complex mixed deformation modes, only the high-order model exhibits sufficient prediction accuracy. Although both the Yeoh model and the 3rd Ogden model are higher-order models, the Yeoh model requires identification of only six undetermined parameters and offers higher computational accuracy, whereas the 3rd Ogden model necessitates identification of nine parameters, leading to higher computational costs.
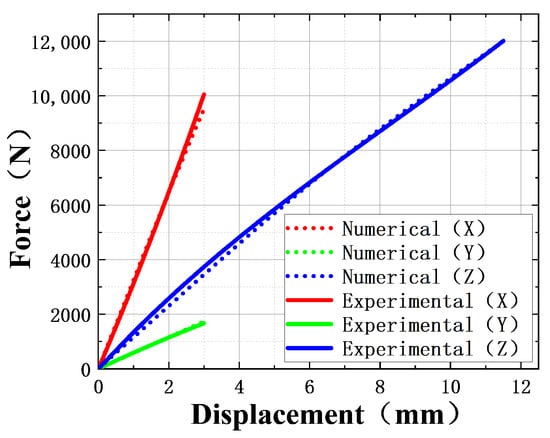
Figure 13.
Force-displacement curve of WH-1200.
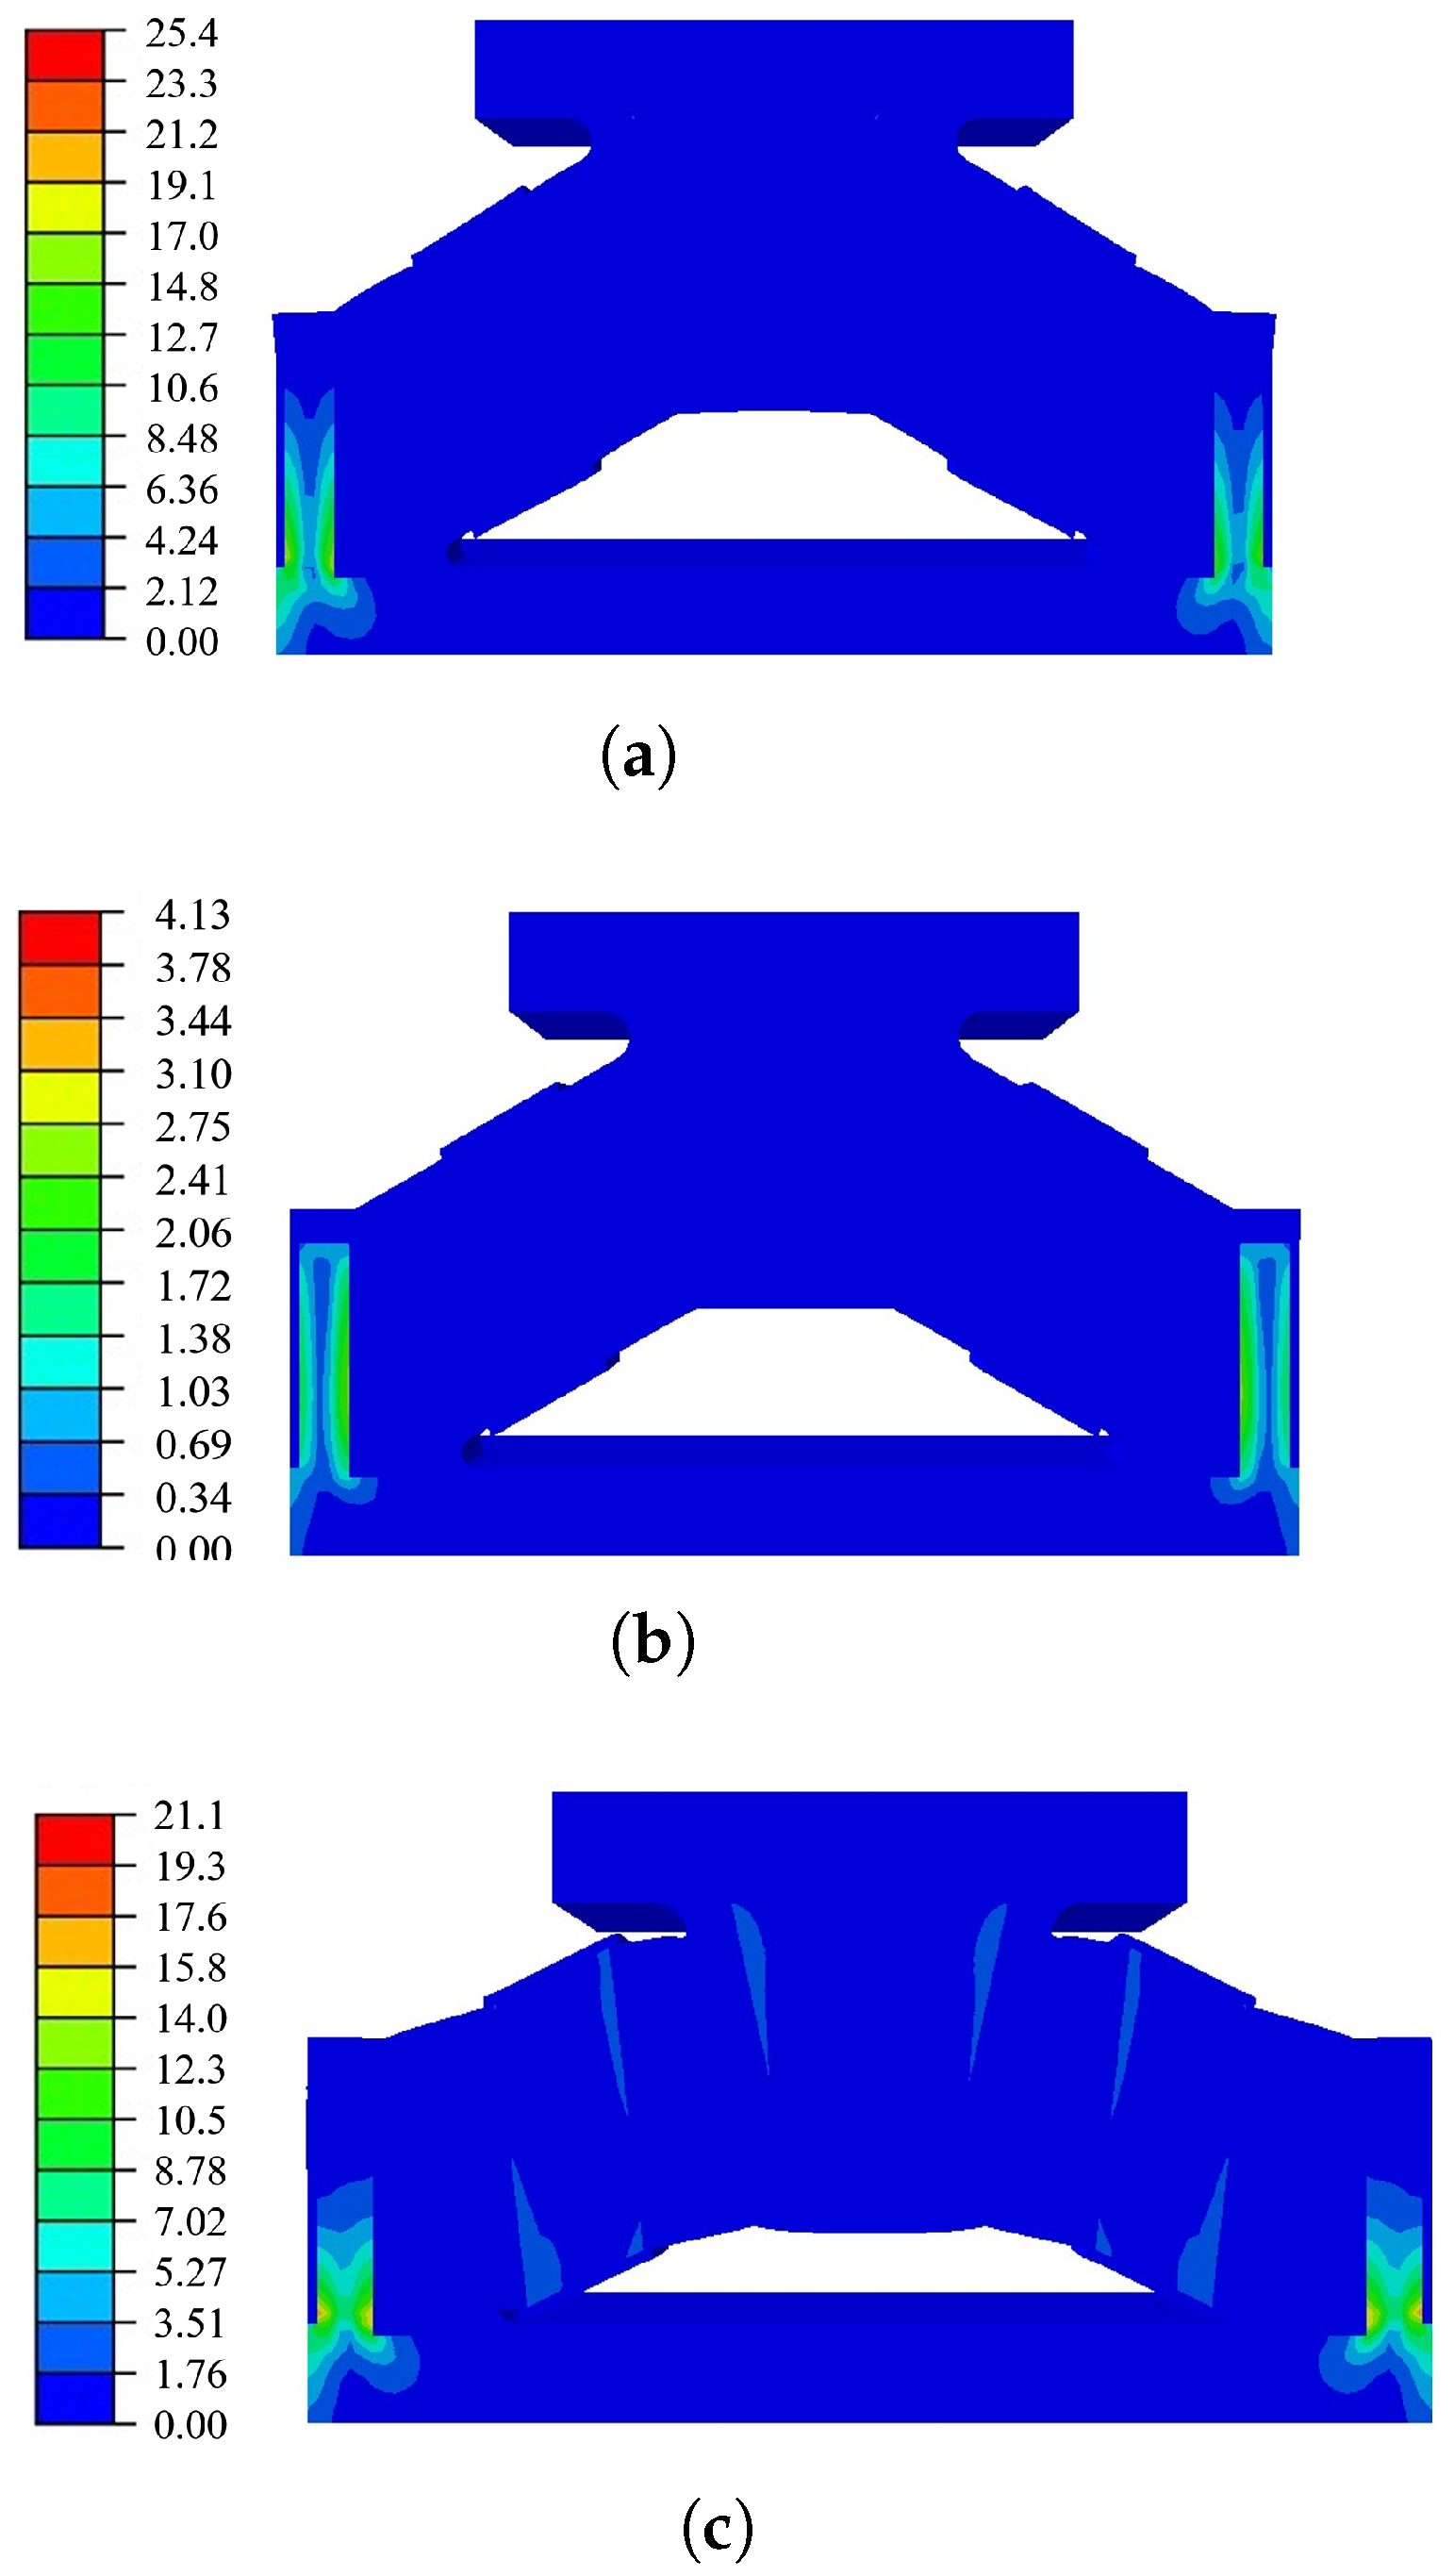
Figure 14 illustrates the Mises stress distribution in the principal section of the XZ plane when the WH-150 isolator is subjected to a maximum load in three different directions. It is observed that although the stress distribution and maximum value vary slightly with the load applied in different directions and amplitudes, the stress tends to concentrate near the two vertical support plates of the lower support seat.

Figure 14.
Mises stress distribution of the WH-150 vibration isolator under different loads. Direction of load: (a) X direction. (b) Y direction. (c) Z direction.
5.2. Dynamic Characteristic Comparison
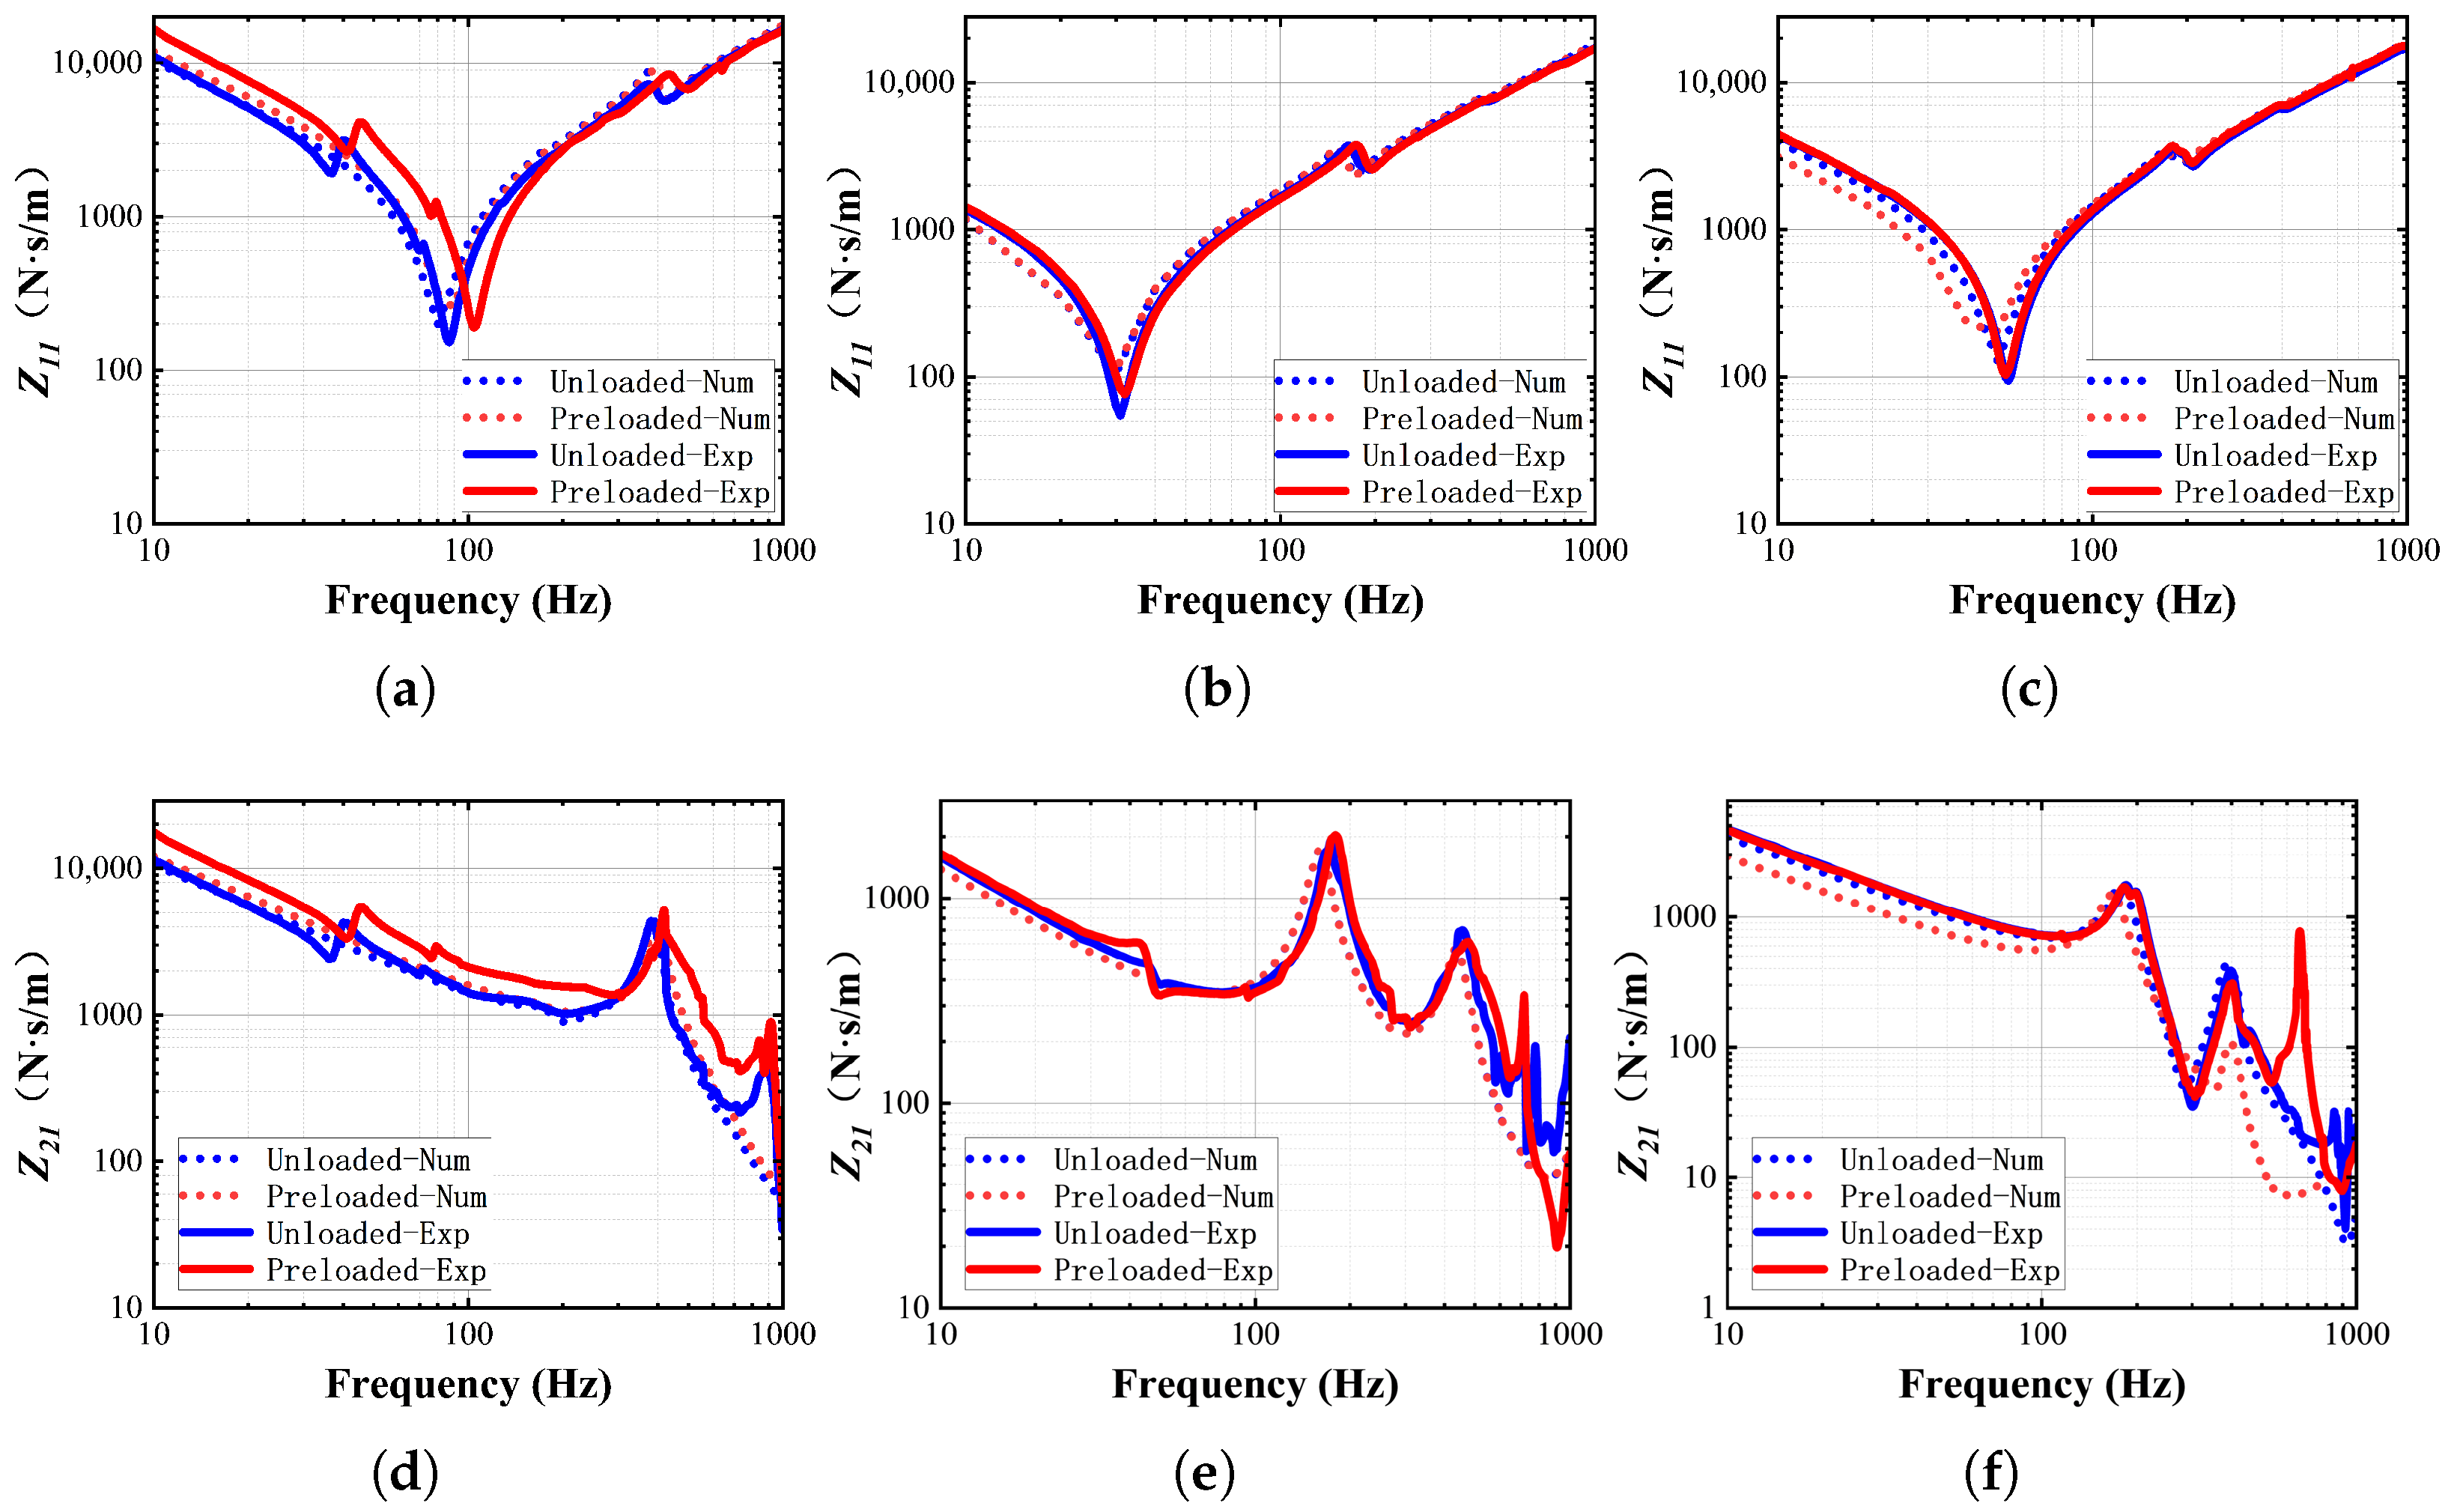
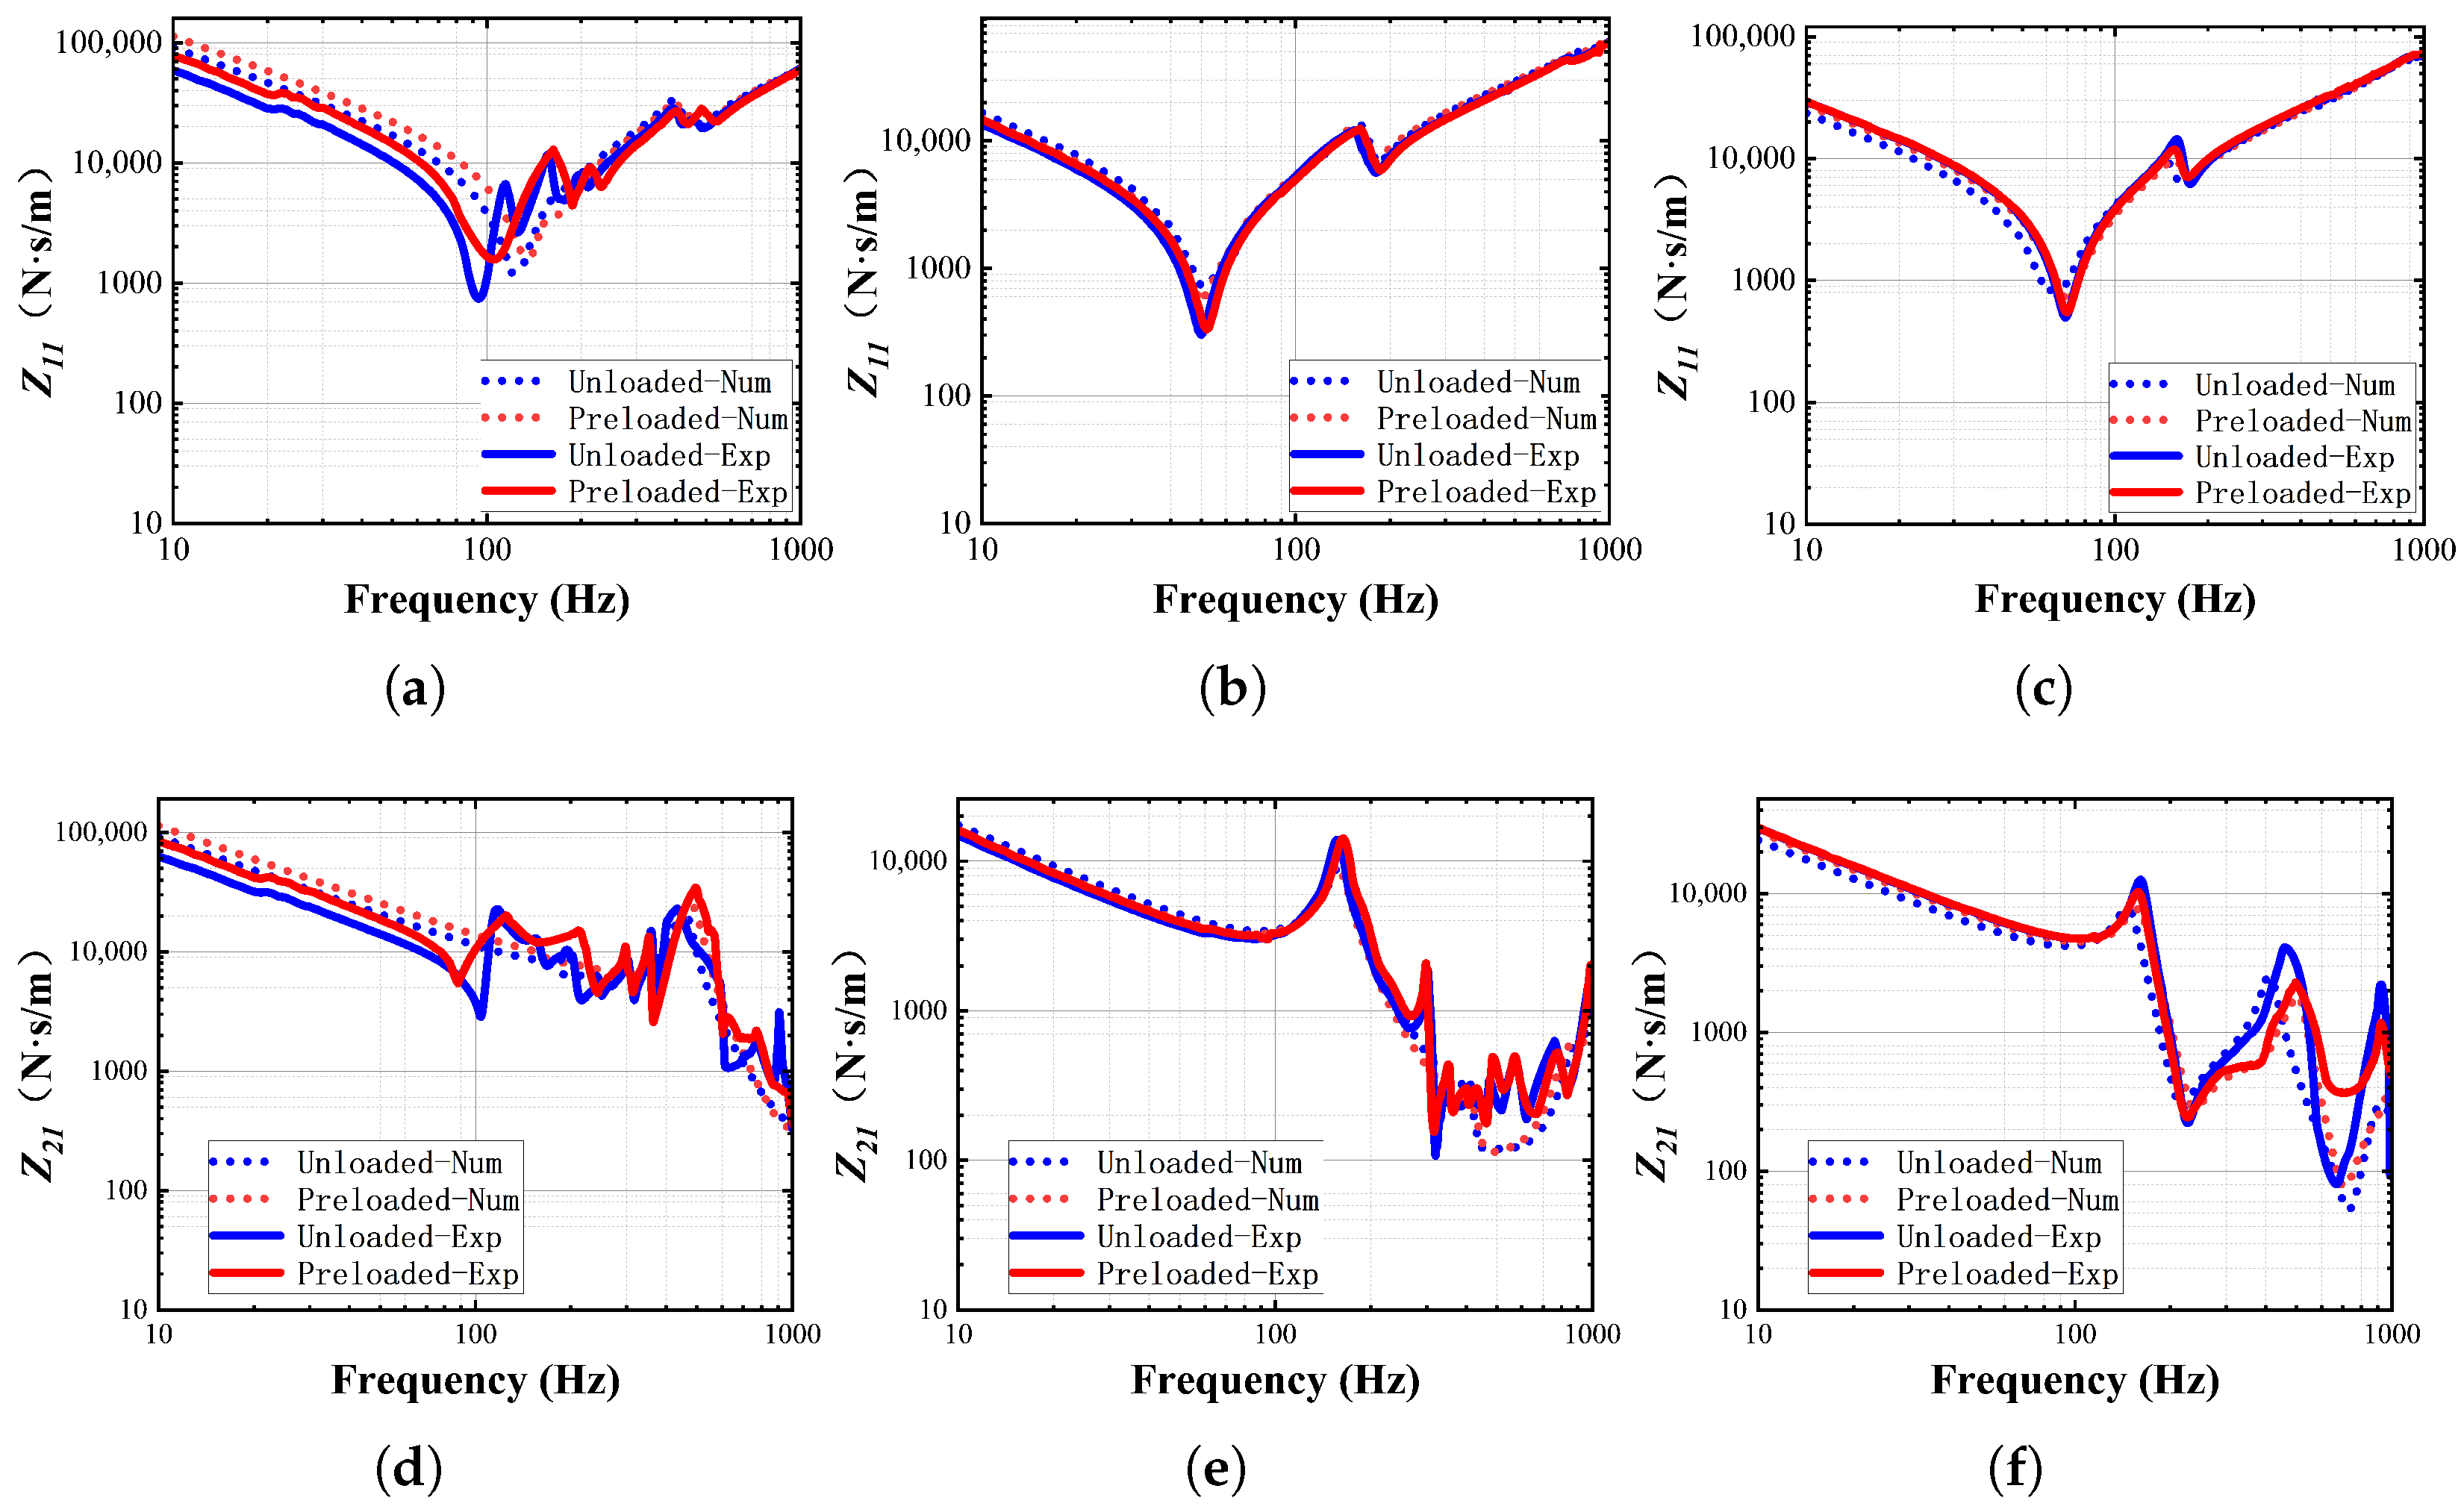
This section includes a comparison between the numerical and experimental results of the mechanical impedance of the aforementioned isolators, along with an analysis of the cause behind the peak value observed in the transfer impedance curve. Figure 15 and Figure 16 depict the mechanical impedance curves of the WH-150 and WH-1200 isolators, respectively.
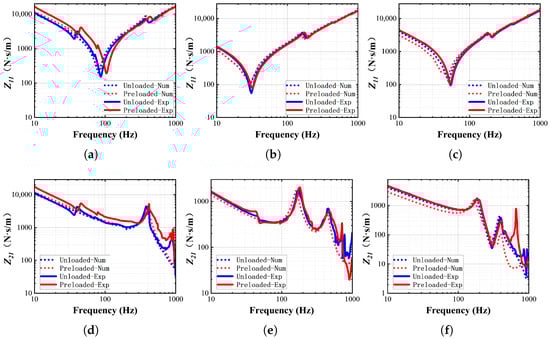
Figure 15.
Mechanical impedance curves of WH-150: (a) -X. (b) -Y. (c) -Z. (d) -X. (e) -Y. (f) -Z.
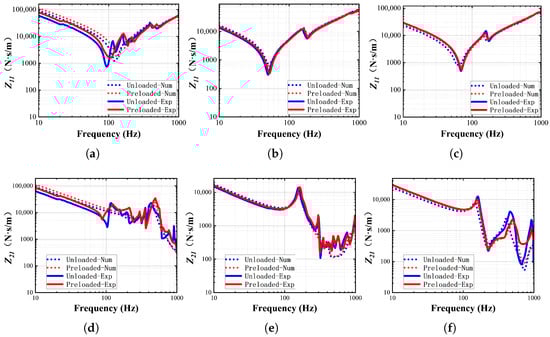
Figure 16.
Mechanical impedance curves of WH-1200: (a) -X. (b) -Y. (c) -Z. (d) -X. (e) -Y. (f) -Z.
To study the overall frequency range variation in the mechanical impedance of the isolators while minimizing computational costs, a frequency step size of 10 Hz was employed for numerical simulation calculations, while a frequency resolution of 1 Hz was achieved through data processing to obtain experimental curves. It is noted that predictions for input impedance across different models and directions are more accurate, although there is a larger prediction deviation for transfer impedance at high frequencies primarily due to a smaller high-frequency response during testing and greater influence from noise interference. Nonetheless, in general, simulation curves effectively reflect both peak values and trends observed in experimental curves. The correlation coefficient, denoted by r, is commonly used to quantify the degree of linear association between two datasets or curves. In this investigation, the correlation coefficient between the numerical and experimental outcomes was computed using the following equation:
where n represents the number of sample data points, represents the numerical result of mechanical impedance, and represents the experimental result of impedance calculation.
The calculation results of correlation coefficients are presented in Table 4. A higher correlation coefficient indicates a closer match between the numerical and experimental results. Out of the 24 sets of mechanical impedance curves, only two sets exhibit correlation coefficients below 90%, demonstrating the accurate predictive capability of the proposed method for the dynamic characteristics of the isolators.
Table 4.
Correlation coefficient between numerical and experimental results.
In practical applications, more attention is typically focused on the transfer impedance of the isolator as it reflects the vibration transmission characteristics of the isolator as a vibration isolation element. Within the studied frequency range, all three directions exhibit at least one peak in their transfer impedance curves. Table 5 compares the peak frequencies of the two types of isolators. It is noted that preload increases the first-order peak frequency in the X direction, has almost no effect on the peak frequency in the Y direction, and decreases the first-order peak frequency in the Z direction while increasing the second-order peak frequency. Comparing the peak frequency of the two types, with the increase in the size of the isolator in the Y direction, the peak frequency in the X direction increases significantly, the second-order peak value in the Y direction disappears, the first-order peak value in the Z direction decreases, and the second-order peak value increases.
Table 5.
Numerical results of the peak frequency of the transfer impedance of the isolators.
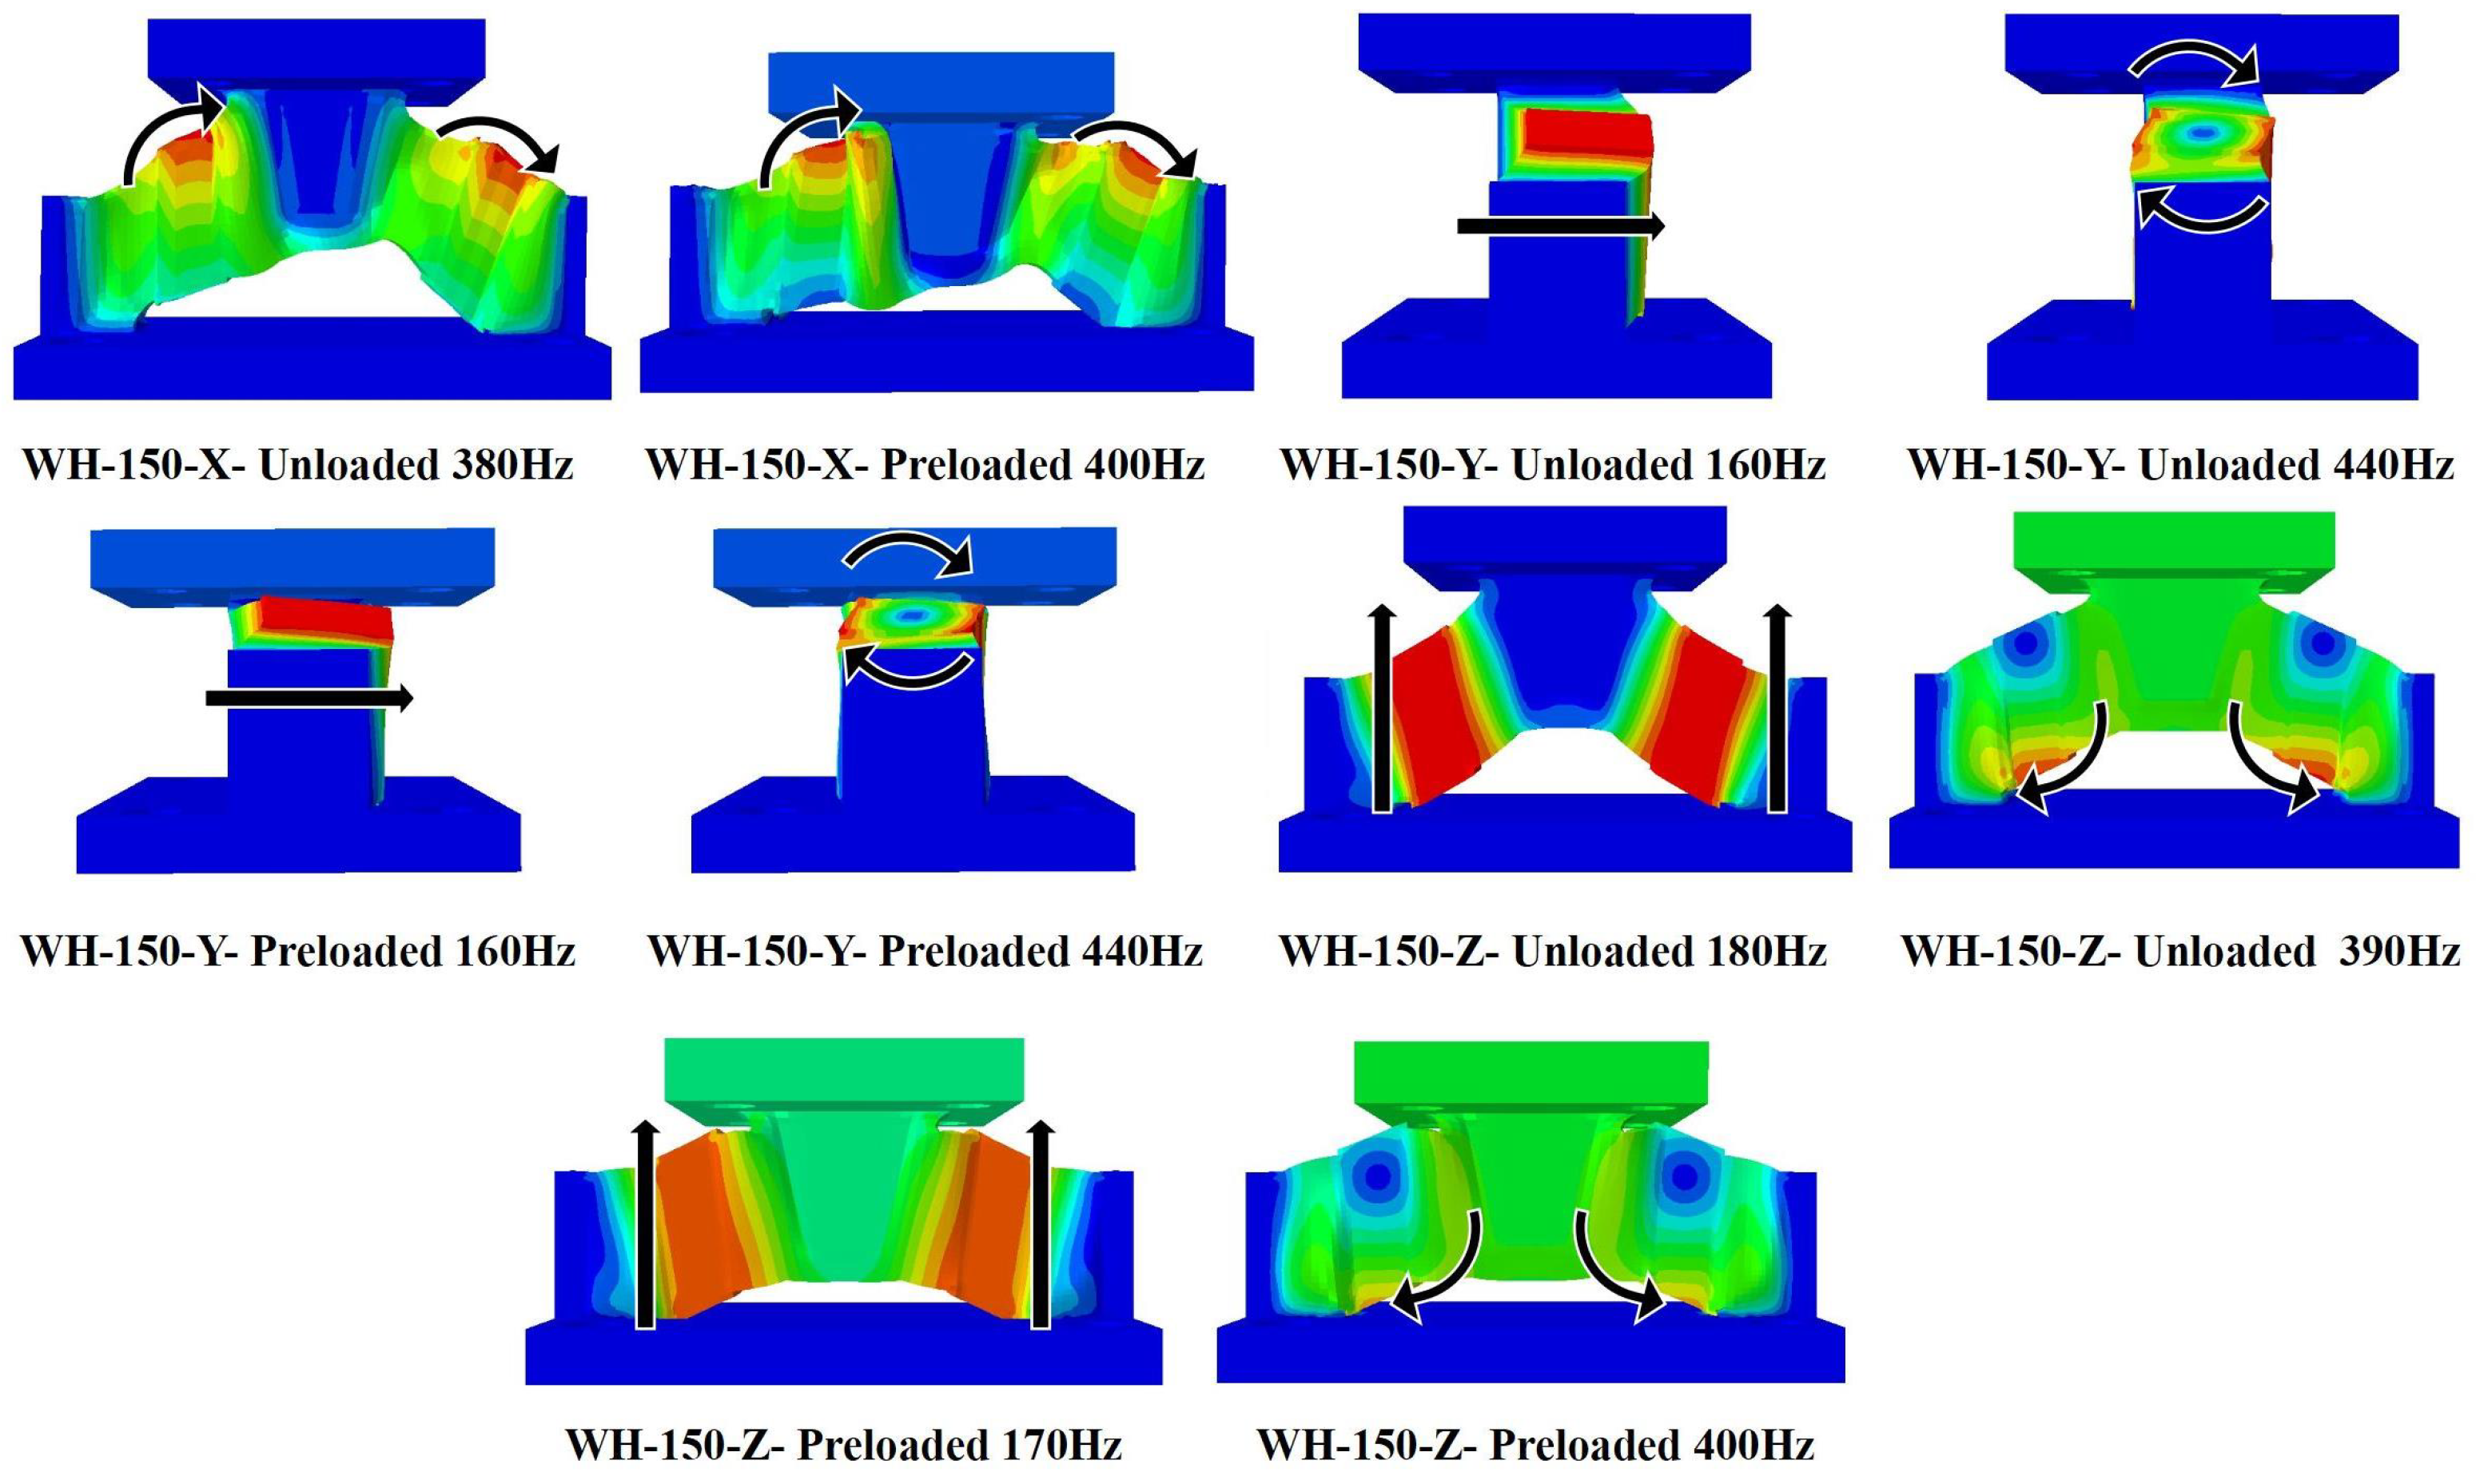
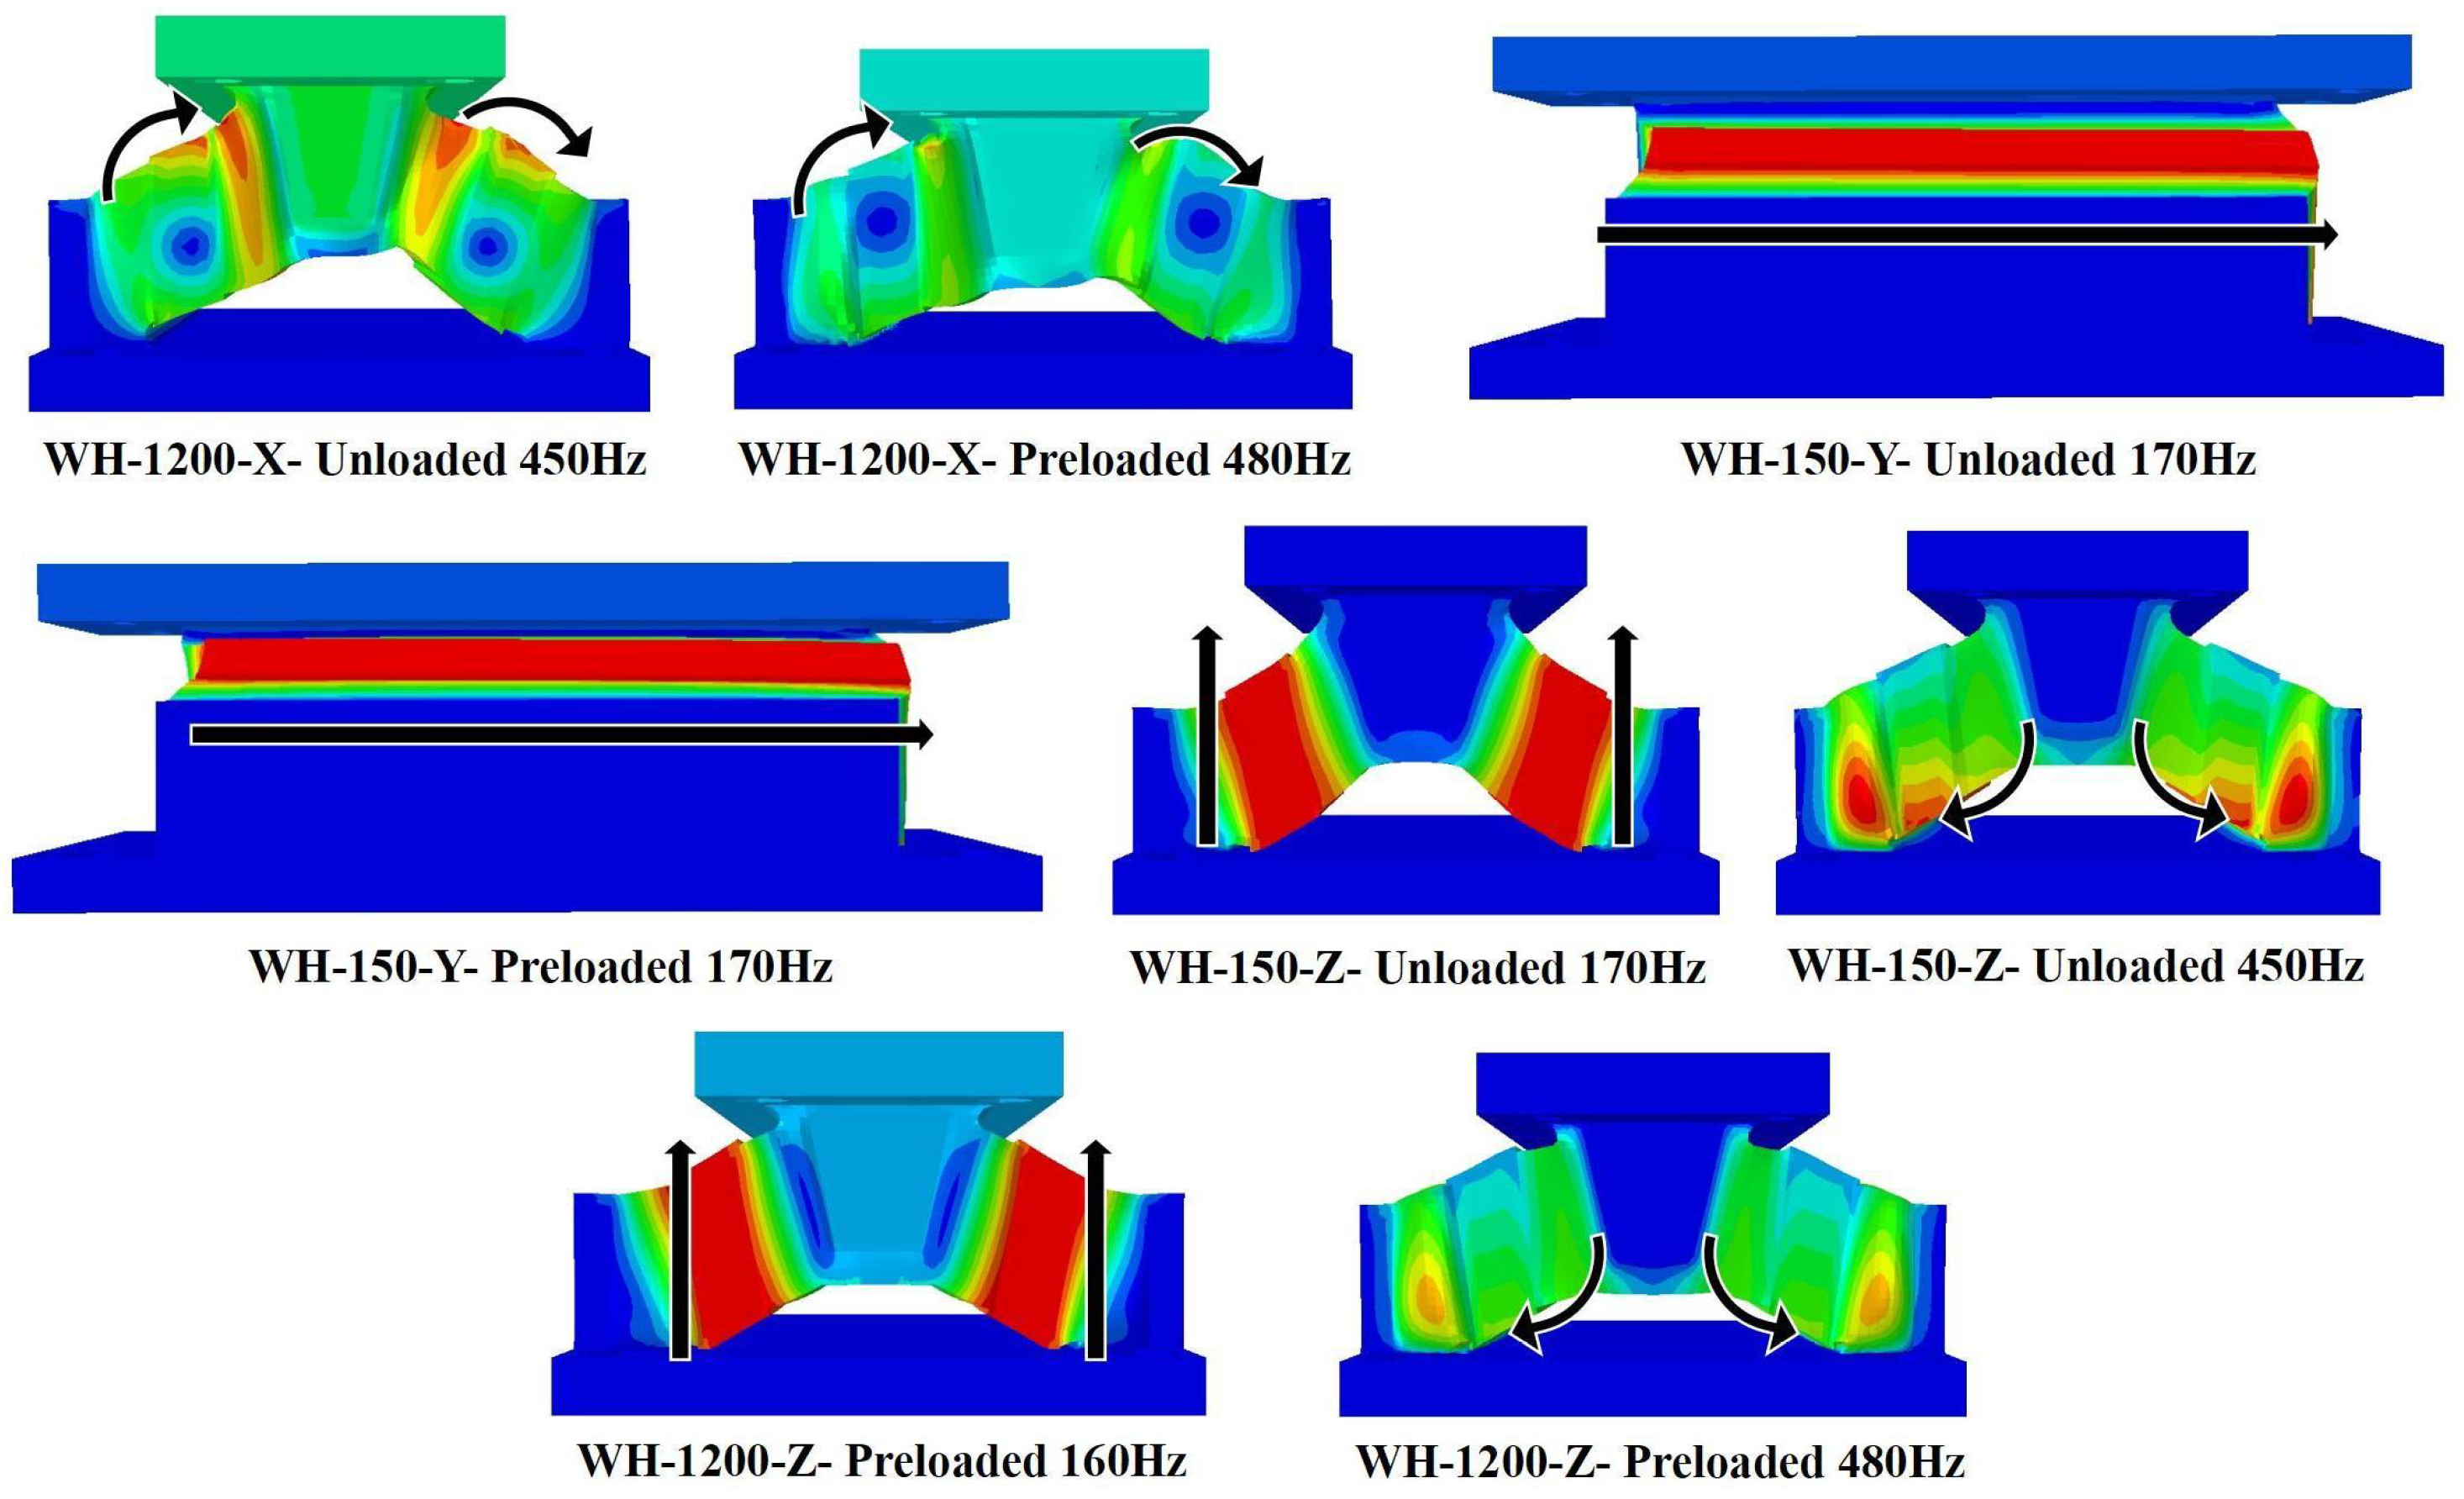
The cause of the peak value of the transfer impedance cannot be determined through experimental research. Therefore, numerical calculations are employed to analyze the motion modes of the isolators at the peak frequency, as depicted in Figure 17 and Figure 18, where the arrows in the figures represent the directions of motion of the embedded metal blocks. The peak values of each transfer impedance are caused by the resonance of the embedded metal blocks. It is observed that the resonance modes of the same order in the same direction are identical, irrespective of the presence of preload and the type of isolator. By comparing the peak frequencies of different types of isolators, it is noted that the size has minimal influence on the peak frequency of metal blocks in translational resonance mode. However, for metal blocks in rotational resonance mode, the size significantly affects the peak frequency. For instance, WH-1200 exhibits no second-order peak in the Y direction in the calculated frequency band.
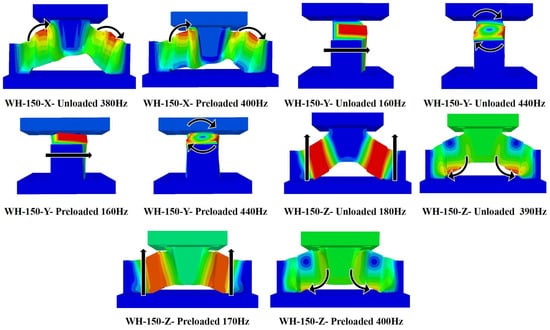
Figure 17.
Resonance mode at the peak frequency of the transfer impedance of WH-150.

Figure 18.
Resonance mode at the peak frequency of the transfer impedance of WH-1200.
6. Conclusions
The nonlinear constitutive model parameters of the rubber material were obtained through material testing in this study and were subsequently utilized as input for finite element calculations. The numerical calculations successfully predicted the static and dynamic characteristics of the isolator in mixed deformation mode as well as the influence of preload and size on its performance. Additionally, the reason behind the peak value of transfer impedance was determined. The research findings indicate the following:
- (1)
- The prediction method presented in this paper for the static and dynamic characteristics of isolators with rubber as the primary vibration absorption material is applicable regardless of the size and shape of the isolators;
- (2)
- Regarding static characteristics, accurate predictions are achieved for the three translational direction force-displacement curves of the isolators, revealing that the Yeoh model is the most suitable hyperelastic constitutive model for simulating rubber undergoing large deformation and mixed deformation;
- (3)
- Regarding dynamic characteristics, numerical results successfully capture peak values on mechanical impedance curves and enable more precise predictions for input and transfer mechanical curves of the isolator. The prediction of the dynamic characteristics of the vibration isolators in [8,17] is achieved through extensive optimization of the damping parameters of the rubber material. In contrast, this study directly determines the dynamic parameters of the rubber material through dynamic shear testing, thereby enabling accurate prediction of the isolators’ dynamic characteristics;
- (4)
- Numerical analysis confirms that the resonance of embedded metal blocks causes peak values in transfer mechanical impedance. The influence of preload on isolator impedance depends on the rubber deformation mode (shear or compression), while the influence of isolator size depends on the resonance modes (translation or rotation) of embedded metal blocks;
- (5)
- The mixed deformation mode isolators in this study exhibit gradual softening characteristics in their primary working direction (Z direction). This implies that in the static force-displacement curve, the slope decreases gradually with increasing load. Furthermore, in dynamic response, with the application of preload, the first-order resonance frequency shifts towards lower frequencies, and the peak of the mechanical impedance decreases. In practical applications, isolators are typically installed at the bottom of power equipment to attenuate vibrations transmitted to the foundation, which necessitates the application of preload. In comparison to the compressive isolators displaying gradual stiffening characteristics [8,29], it is evident that the isolators in this paper are more suitable for such scenarios.
Author Contributions
Conceptualization, B.Z. and Y.Z.; methodology, B.Z.; software, B.Z.; validation, J.Y.; formal analysis, B.Z.; investigation, B.Z.; resources, Y.Z.; data curation, B.Z.; writing—original draft preparation, B.Z.; writing—review and editing, J.Y.; visualization, B.Z.; supervision, Y.Z.; project administration, Y.Z.; funding acquisition, Y.Z. All authors have read and agreed to the published version of the manuscript.
Funding
This study was supported by the Fund for National Natural Science Foundation of China (No. 52077218) and the Key Basic Research Projects of Basic Strengthening Program (No. 2020-JCJQ-ZD-222).
Institutional Review Board Statement
Not applicable.
Data Availability Statement
The data presented in this study are available on request from the corresponding author. The data are not publicly available due to military attributes of our universit.
Conflicts of Interest
The authors declare no conflicts of interest.
References
- Neitzel, R.L.; Berna, B.E.; Seixas, N.S. Noise exposures aboard catcher/processor fishing vessels. Am. J. Ind. Med. 2006, 49, 624–633. [Google Scholar] [CrossRef] [PubMed]
- Burella, G.; Moro, L.; Colbourne, B. Noise sources and hazardous noise levels on fishing vessels: The case of Newfoundland and Labrador’s fleet. Ocean Eng. 2019, 173, 116–130. [Google Scholar] [CrossRef]
- Wilcove, G.L.; Schwerin, M.J. Shipboard habitability in the US Navy. Mil. Psychol. 2008, 20, 115–133. [Google Scholar] [CrossRef]
- Sunde, E.; Bratveit, M.; Pallesen, S.; Moen, B.E. Noise and sleep on board vessels in the Royal Norwegian Navy. Noise Health 2016, 18, 85–92. [Google Scholar] [CrossRef]
- Kellett, P.; Turan, O.; Incecik, A. A study of numerical ship underwater noise prediction. Ocean Eng. 2013, 66, 113–120. [Google Scholar] [CrossRef]
- Weilgart, L.S. A brief review of known effects of noise on marine mammals. Int. J. Comp. Psychol. 2007, 20, 159–168. [Google Scholar] [CrossRef]
- Wen, H.; Li, Y.; Zhang, K.; Liu, Y.; Chang, C. Vibration performance improvement of D/G-set employing inerter-rubber vibration isolator. J. Mar. Eng. Technol. 2021, 20, 243–253. [Google Scholar] [CrossRef]
- Fragasso, J.; Moro, L. Structure-borne noise of marine diesel engines: Dynamic characterization of resilient mounts. Ocean Eng. 2022, 261, 112116. [Google Scholar] [CrossRef]
- Jin, Z.; Zhao, Y.l.; Yang, X. A Study on Fatigue Life of Marine Isolation Rubber Based on Crack Initiation Method. J. Fail. Anal. Prev. 2022, 22, 2288–2294. [Google Scholar] [CrossRef]
- Kluczyk, M.; Grządziela, A.; Pająk, M.; Muślewski, Ł.; Szeleziński, A. The fatigue wear process of rubber-metal shock absorbers. Polymers 2022, 14, 1186. [Google Scholar] [CrossRef] [PubMed]
- Calabrese, A.; Spizzuoco, M.; Galano, S.; Tran, N.; Strano, S.; Terzo, M. A parametric study on the stability of fiber reinforced rubber bearings under combined axial and shear loads. Eng. Struct. 2021, 227, 111441. [Google Scholar] [CrossRef]
- Rahnavard, R.; Thomas, R.J. Numerical evaluation of steel-rubber isolator with single and multiple rubber cores. Eng. Struct. 2019, 198, 109532. [Google Scholar] [CrossRef]
- Saidou, A.; Gauron, O.; Busson, A.; Paultre, P. High-order finite element model of bridge rubber bearings for the prediction of buckling and shear failure. Eng. Struct. 2021, 240, 112314. [Google Scholar] [CrossRef]
- Gil-Negrete, N.; Vinolas, J.; Kari, L. A simplified methodology to predict the dynamic stiffness of carbon-black filled rubber isolators using a finite element code. J. Sound Vib. 2006, 296, 757–776. [Google Scholar] [CrossRef]
- Thaijaroen, W.; Harrison, A. Nonlinear dynamic modelling of rubber isolators using six parameters based on parabolic spring, springpot, and smooth-slip friction element. Polym. Test. 2010, 29, 857–865. [Google Scholar] [CrossRef]
- Modhej, A.; Zahrai, S.M. Numerical study of visco-hyperelastic damper with high axial damping rubber subjected to harmonic loading. Structures 2021, 29, 1550–1561. [Google Scholar] [CrossRef]
- Somanath, S.; Marimuthu, R.; Krishnapillai, S. Frequency domain analysis of pre-stressed elastomeric vibration isolators. Def. Technol. 2023, 25, 33–47. [Google Scholar] [CrossRef]
- Rahnavard, R.; Craveiro, H.D.; Napolitano, R. Static and dynamic stability analysis of a steel-rubber isolator with rubber cores. Structures 2020, 26, 441–455. [Google Scholar] [CrossRef]
- Mooney, M. A theory of large elastic deformation. J. Appl. Phys. 1940, 11, 582–592. [Google Scholar] [CrossRef]
- Rivlin, R. Large elastic deformations of isotropic materials. I. Fundamental concepts. Philos. Trans. R. Soc. Lond. Ser. Math. Phys. Sci. 1948, 240, 459–490. [Google Scholar]
- Yeoh, O.H. Some forms of the strain energy function for rubber. Rubber Chem. Technol. 1993, 66, 754–771. [Google Scholar] [CrossRef]
- Ogden, R.W. Large deformation isotropic elasticity–on the correlation of theory and experiment for incompressible rubberlike solids. Proc. R. Soc. Lond. Math. Phys. Sci. 1972, 326, 565–584. [Google Scholar] [CrossRef]
- Arruda, E.M.; Boyce, M.C. A three-dimensional constitutive model for the large stretch behavior of rubber elastic materials. J. Mech. Phys. Solids 1993, 41, 389–412. [Google Scholar] [CrossRef]
- Shahzad, M.; Kamran, A.; Siddiqui, M.Z.; Farhan, M. Mechanical characterization and FE modelling of a hyperelastic material. Mater. Res. 2015, 18, 918–924. [Google Scholar] [CrossRef]
- Kim, B.; Lee, S.B.; Lee, J.; Cho, S.; Park, H.; Yeom, S.; Park, S.H. A comparison among Neo-Hookean model, Mooney-Rivlin model, and Ogden model for chloroprene rubber. Int. J. Precis. Eng. Manuf. 2012, 13, 759–764. [Google Scholar] [CrossRef]
- Martins, P.; Natal Jorge, R.; Ferreira, A. A comparative study of several material models for prediction of hyperelastic properties: Application to silicone-rubber and soft tissues. Strain 2006, 42, 135–147. [Google Scholar] [CrossRef]
- Sasso, M.; Palmieri, G.; Chiappini, G.; Amodio, D. Characterization of hyperelastic rubber-like materials by biaxial and uniaxial stretching tests based on optical methods. Polym. Test. 2008, 27, 995–1004. [Google Scholar] [CrossRef]
- Van den Bogert, P.; De Borst, R. On the behaviour of rubberlike materials in compression and shear. Arch. Appl. Mech. 1994, 64, 136–146. [Google Scholar] [CrossRef]
- Amin, A.; Alam, M.; Okui, Y. An improved hyperelasticity relation in modeling viscoelasticity response of natural and high damping rubbers in compression: Experiments, parameter identification and numerical verification. Mech. Mater. 2002, 34, 75–95. [Google Scholar] [CrossRef]
- Shukla, A.; Datta, T. Optimal use of viscoelastic dampers in building frames for seismic force. J. Struct. Eng. 1999, 125, 401–409. [Google Scholar] [CrossRef]
- Singh, M.P.; Moreschi, L.M. Optimal placement of dampers for passive response control. Earthq. Eng. Struct. Dyn. 2002, 31, 955–976. [Google Scholar] [CrossRef]
- Singh, M.; Chang, T.S. Seismic analysis of structures with viscoelastic dampers. J. Eng. Mech. 2009, 135, 571–580. [Google Scholar] [CrossRef]
- Park, S. Analytical modeling of viscoelastic dampers for structural and vibration control. Int. J. Solids Struct. 2001, 38, 8065–8092. [Google Scholar] [CrossRef]
- Schiessel, H.; Metzler, R.; Blumen, A.; Nonnenmacher, T. Generalized viscoelastic models: Their fractional equations with solutions. J. Phys. Math. Gen. 1995, 28, 6567. [Google Scholar] [CrossRef]
- Pritz, T. Five-parameter fractional derivative model for polymeric damping materials. J. Sound Vib. 2003, 265, 935–952. [Google Scholar] [CrossRef]
- Xu, Z.D. Earthquake mitigation study on viscoelastic dampers for reinforced concrete structures. J. Vib. Control 2007, 13, 29–43. [Google Scholar] [CrossRef]
- Zhou, Y.; Chen, P.; Gong, S. Mechanical model of a hybrid non-linear viscoelastic material damping device with its verifications. Front. Mater. 2019, 6, 33. [Google Scholar] [CrossRef]
- Chang, K.; Lai, M.; Soong, T.T.; Hao, D.; Yeh, Y. Seismic Behavior and Design Guidelines for Steel Frame Structures with Added Viscoelastic Dampers; National Center for Earthquake Engineering Research: Buffalo, NY, USA, 1993. [Google Scholar]
- Shu, Z.; You, R.; Zhou, Y. Viscoelastic materials for structural dampers: A review. Constr. Build. Mater. 2022, 342, 127955. [Google Scholar] [CrossRef]
- Kalfas, K.N.; Mitoulis, S.A. Performance of steel-laminated rubber bearings subjected to combinations of axial loads and shear strains. Procedia Eng. 2017, 199, 2979–2984. [Google Scholar] [CrossRef]
- Orfeo, A.; Tubaldi, E.; Muhr, A.H.; Losanno, D. Mechanical behaviour of rubber bearings with low shape factor. Eng. Struct. 2022, 266, 114532. [Google Scholar] [CrossRef]
- Systemes, D. ABAQUS/CAE 6.13 User’s Manual. Online Documentation. 2014. Available online: https://www.3ds.com/products/simulia/abaqus (accessed on 28 February 2024).
- Molloy, C. Use of Four-Pole Parameters in Vibration Calculations. J. Acoust. Soc. Am. 1957, 29, 842–853. [Google Scholar] [CrossRef]
- Moro, L. Structure Borne Noise Due to Marine Diesel Engines: Experimental Study and Numerical Simulation for the Prediction of the Dynamic Behaviour of Resilient Mounts. Ph.D. Thesis, Università degli studi di Trieste, Trieste, Italy, 2015. [Google Scholar]
- Janssens, K.; Gajdatsy, P.; Gielen, L.; Mas, P.; Britte, L.; Desmet, W.; Van der Auweraer, H. OPAX: A new transfer path analysis method based on parametric load models. Mech. Syst. Signal Process. 2011, 25, 1321–1338. [Google Scholar] [CrossRef]
- ISO 10846-3:2002; Acoustics and Vibration—Laboratory Measurement of the Vibro-Acoustic Properties of Resilient Elements—Part 3: Indirect Method for Determination of the Dynamic Stiffness of Resilient Supports for Translatory Motion. 2002. Available online: https://www.iso.org/standard/34560.html (accessed on 28 February 2024).
- Sheikhi, J.; Fathi, M.; Rahnavard, R.; Napolitano, R. Numerical analysis of natural rubber bearing equipped with steel and shape memory alloys dampers. Structures 2021, 32, 1839–1855. [Google Scholar] [CrossRef]


Disclaimer/Publisher’s Note: The statements, opinions and data contained in all publications are solely those of the individual author(s) and contributor(s) and not of MDPI and/or the editor(s). MDPI and/or the editor(s) disclaim responsibility for any injury to people or property resulting from any ideas, methods, instructions or products referred to in the content. |
© 2024 by the authors. Licensee MDPI, Basel, Switzerland. This article is an open access article distributed under the terms and conditions of the Creative Commons Attribution (CC BY) license (https://creativecommons.org/licenses/by/4.0/).