Abstract
This study presents the first data on a 2018–2021 campaign to monitor polycyclic aromatic hydrocarbon levels, PAHs, in the final stretch of the Hooghly River in West Bengal, India. The range of sedimentary PAHs was 0–47,366 ng/g, higher than the ranges given by the literature for comparable study areas. The assay reveals an outstanding level of PAHs contamination in the fine sediments of the Hooghly River and Sundarban wetland, where the dominance of 4–6 ring PAHs was 83% of the total. The diagnostic ratios based on molecular ratios of PAHs show that the pollution comes mainly from the combustion of petroleum. The ratio of anthracene relative to anthracene plus phenanthrene, ANT/(ANT + PHE), was >0.30, which is higher than the reference discriminant ratio of >0.10, suggesting that PAHs were from the combustion source. In the meantime, fluoranthene over the sum of fluoranthene plus pyrene, FLT/(FLT + PYR), was >0.5 and indicated coal combustion, in agreement with the literature. The mean level of carcinogenic hydrocarbons was at 18% of the total measured PAH, with a peak of 91%, revealing significant potential risk for humans and ecosystems. The toxicity equivalence factors, TEF, of the individual PAHs and the total BaP equivalent toxicity, TEQ, were adopted as a comparison reference of sediment quality. At most sites, toxic effect ranges were classified as high and very high. The results of this research call for public authorities to remedy a situation of severe ecological risk.
1. Introduction
Coastal environments and estuaries are under the effects of tides, waves, saline, brackish, and fresh waters and the input of littoral sediments from the mainland. These processes cause these transition environments to be sensitive to pollution [1] from different sources such as industry, agriculture, and urban settlements. Discharges of effluents, fossil fuel burning, mining, groundwater use, physical and chemical weathering, and the mobilization of historically contaminated sediments severely affect the health state of these areas [2]. Lentic flow in the mouth section and seawater intrusion favor the deposition of contaminants that the river has received upstream. Under such intensive flows, sediments become loaded with plastics, pesticides, furans, dioxins, polycyclic aromatic hydrocarbons (PAHs), polychlorinated biphenyls (PCBs), radionuclides, hydrocarbons, phenols, rare earth elements (REEs), and heavy metals (HMs) [3,4,5]. India hosts one of the most polluted river estuaries, the Hooghly River, HRE, which crosses a highly urbanized and industrialized area. This river, representing the first deltaic output of the Gange River, can be defined as an engineered river or a techno river, similar to the techno coast definition adopted for geomorphic units affected by massive anthropogenic pressure [6].
The last stretch of the HRE in Figure 1 also reveals the heavy presence of factories, especially nearby Kolkata, mainly jute and secondarily paper and pulp mills. In addition to the high anthropogenic pressure, the area is also affected by the Indian Summer Monsoon in June–September, with heavy rainfall and runoff, leading to the movement and remixing of conspicuous masses of sediments [7]. The alternation of the wet and dry seasons results in intensive physico-chemical weathering, erosion, and detritus deposition [8]. The HRE is also part of the tide-dominated delta of the Sundarbans mangrove wetland, SMW, Figure 1, an area of worldwide consideration under the Ramsar Convention. The SMW is a UNESCO World Heritage site representing one of the most significant mangrove forests on the Earth [9]. The wetland has an overall area of 9600 km2 and is affected by multiple degradation sources such as heavy maritime and port traffic, the loss of forests, and intensive agricultural and aquaculture activities. The wetland is also sensitive to pollutant transport by intense meteorological precipitations over the monsoon seasons, which trigger massive siltation, flooding, erosion, and dry and wet deposition. All these factors lead to a deterioration in the water quality of the HRE with a consequent impact on the fishiness of water bodies and the obstruction of mouths and tributaries with consequential loss of biodiversity [10]. Among xenobiotics, PAHs represent a severe issue for accumulation in HRE environments due to their high persistence, potential bioavailability, and wide distribution in water, atmosphere, soil, and sediments [10,11,12,13,14,15]. Aquatic organisms are sensitive to PAHs depending on their metabolism and photo-oxidation, with increasing harmfulness with ultraviolet radiation exposure. Szatylowicz and Hawrylik [16] report several examples of PAHs’ phototoxicity to benthic species and emphasize how phototoxicity is species dependent.
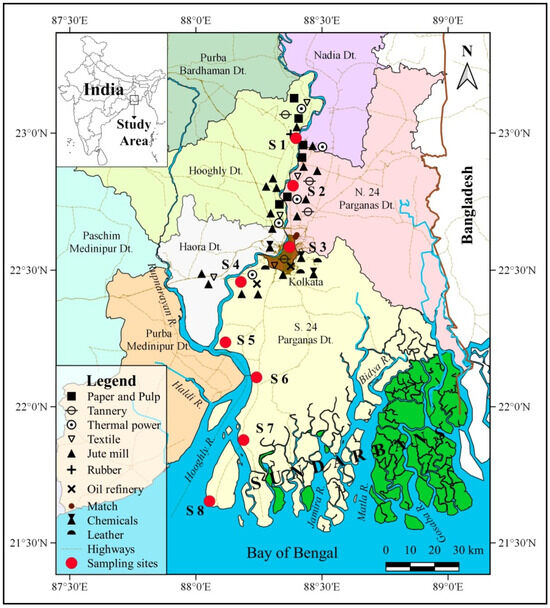
Figure 1.
Location of the sampling sites, river network, and multiple industries along the Hooghly River estuary. The geographic coordinate system is WGS84.
PAHs are divided into two main groups, and this grouping is based essentially on their molecular weights: (i) low molecular weight (LMW), having two to three benzene rings and dominating in water bodies, and (ii) high molecular weight (HMW), with four to six benzene rings, abundant in sediments [17]. An example of a light PAH is phenanthrene, which is often detected in the gas phase, whereas one of the heavier PAHs, benzo[a] pyrene B[a]P, loads mainly onto solid particles [18]. The US Environmental Protection Agency (EPA) classifies PAHs as priority pollutants, and 16 PAHs are considered the riskiest significant compounds for the environment. This pool of compounds is used in routine tests on the risk of environmental monitoring and risk assessment [19]. PAHs can come from petrogenic, pyrogenic, and biological sources. The petrogenic route regards petroleum extraction and subsequent processing transformation activities in different commercial products. It also comes from accidental spills during transportation, intentional spills, or the natural seepage of petroleum or coal deposits. PAH loading in crude oil varies from a few mg to ~5 g per kg, and naphthalene is the dominating compound, with a mean percentual load of 60.5% and up to a maximum of ~78% relative to the total PAHs [19]. The biological source encompasses plants, fungi, and bacteria activities, with the formation of naphthalene, phenanthrene, and perylene [20]. The pyrogenic source regards mainly the production of electric power, incineration of wastes, auto vehicle emissions, residential heating, processing of coke, carbon black, coal tar, coal gasification, liquefying plants, asphalt use, and forest fires or volcanic activities [18,21]. They form during the incomplete combustion of coal, oil, petrol, and wood. PAHs disperse in the ambient air in the gas phase and as a complement to aerosols, where processes are usually driven by hydrophobicity [22,23] or, in the case of shallow water sediments, storm surges and re-suspension flows [21]. Each source produces characteristic PAHs patterns that are useful for identification processes [18,21].
Few reports on PAHs contamination of HRE and SMW exist in the literature [9,11,24,25]. The study of PAHs levels in the sediments of HRE and SMW consists of three distinct phases, of which only the first one is reported in the current study. The novelty of this research is (1) having considered a long period of sampling covering four years and (2) having highlighted the influence of the monsoon seasons on the ecological status of the last segment of HRE, LS-HRE, and SMW. The study assayed the levels of 16 PAHs in LS-HRE sediments and identified their source, either natural or anthropogenic, through selected molecular PAHs ratios. The second and third phases will aim to study the spatial and temporal PAHs accumulation over monsoons.
2. Materials and Methods
2.1. Study Area
The HRE, located at 87°55′01″ N to 88°48′04″ N latitude and 21°29′02″ E to 22°09′00″ E longitude, has a shallow depth, with an average of ~6 m, and drains a catchment area of 6 × 10⁴ km2 [26,27] with many large cities developed on its banks [28] (Figure 1). The HRE is on the east side of the delta of SMW and was developed through alluvial deposits supplied from the Ganga and Brahmaputra Rivers. Currently, the estuary is reworked offshore by large (2–4 m) semidiurnal tides and onshore by seasonal sea level surges due to monsoons and tropical cyclones, which regularly form in the Bay of Bengal [29].
2.2. Sampling Procedure
A total of 176 sediment samples were collected from November 2018 to May 2021 along the ~175 km long stretch of the river at eight locations, four of which were fluvial freshwater sites, sensitive to flood events: Tribeni, S1; Barrackpore, S2; Babughat, S3; and Budge Budge, S4. Two were located further down the Hooghly River, subject to both flood and tidal events with brackish waters: Nurpur, S5; and Diamond Harbor, S6. The final two were typically marine, subject only to storm and tidal events: Lot 8, S7; and Gangasagar, S8. The site locations are depicted in Figure 1. The selected sites show a wide range of salinity from 0.13–0.3 psu at the freshwater sites up to 7.5–22.5 psu at the marine locations [30]. Surface sediments, down to 10 cm below ground level, were collected by a Van Veen grab and placed in plastic bags using a plastic spatula in triplicate from the intertidal regions [4,5]. Samples were stored in acid-rinsed polyethylene bags and temporarily preserved in a cooler box with ice packs at 4 °C. The sediments were warehoused at −20 °C until further analyses. Sediments were oven dried at 40 °C to a constant weight and gently grinded.
2.3. Analytical Procedure
Dry sediment of ≤2 mm was analyzed for granulometric and morphoscopic parameters, organic carbon (OC), carbonate, and PAHs. Granulometry and morphoscopy characteristics of the surfaces of quartz and silicate (K-feldspar and Na-plagioclase) granules were determined; sediments were washed with distilled water, oven dried at 80 °C for 72 h, mechanically quartered, weighed with a digital balance, and sieved by a series of ASTM stacked sieves from 2000 up to 63 µm with 1/2 ϕ class interval in a Ro-Tap sieve shaker machine for 15 min [4,18,28,30]. Fractions < 63 µm were analyzed through sedimentation in one liter of distilled water with 10% sodium oxalate at laboratory-specific temperatures following the Belloni procedure [31]. The granulometric fraction percentages, sediment classification, and statistical parameters, according to the graphic method [32], are shown in Table 1. The organic carbon was determined as TOC on ≤2000 μm sediment aliquots of 0.5 g. The samples were placed in ceramic vessels and analyzed by a total organic carbon analyzer Skalar (Breda, The Netherlands). Carbonate levels were determined using the methods outlined by Jackson [33].

Table 1.
Geographical data and quality parameters. The ranges of variation of each parameter are in parentheses.
The micromorphology of sediments is shown in Table 1 and was visualized using histograms and semi-logarithmic cumulative curves according to the approach of Blott and Pye [34] using Gradistat v.9.1 software. Table 1 reports the mean size (Mz), mode (MO), median (D50), standard deviation (σI, sorting), skewness (SkI, asymmetry coefficient), and kurtosis (KG, appointment coefficient). A Leica MZ16 optical stereomicroscope coupled with TriPlot 1.4.2 software was adopted to detect the quartz shape and silicate granules in the 384–177 µm range [35,36].
The chemical assessment of PAHs was carried out by considering the sixteen more dangerous PAH compounds, as proposed by the Environmental Protection Agency (EPA). The assayed compounds were naphthalene (NAP), acenaphthylene (ACY), acenaphtene (ACE), fluorine (FLR), phenanthrene (PHE), anthracene (ANT), fluoranthene (FLT), pyrene (PYR), benzo(a)anthracene (BaA), chrysene (CHR), benzo(b)fluoranthene (BbF), benzo(k)fluoranthene (BkF), benzo(a)pyrene (BaP), dibenzo(ah)anthracene (DhA), indeno[1,2,3-cd] pyrene (IP), benzo(ghi)perylene (BgP). There is a group of compounds, and in the specific benzo(a)anthracene (BaA), benzo(a)pyrene (BaP), benzo(b) fluoranthene (BbF), benzo(k) fluoranthene (BkF), chrysene (Chry), dibenzo(a)anthracene (DBA), and indeno (1,2,3-c,d) pyrene (IP). To quantify the carcinogenic effects, among these compounds, BaP is taken as an indicator of carcinogenicity because of its highly negative toxic effect [37]. PAHs were determined following the method proposed by IRSA CNR 25. The method was modified by replacing cyclohexane with acetone/n-hexane 1:1 v/v. The samples were sonicated for 3 h by a Brason (Brookfield, CT, USA) ultrasonic disruptor apparatus, 300 W, in pulser mode [20]. The analysis was performed by a gas chromatograph (Shimadzu 2010 Plus, Kyoto, Japan) and a mass spectrometer (MS-TQ8030-, Shimadzu, Japan) equipped with a fused silica HP5-MS capillary column, 30 m × 0.25 mm i.d., thickness 0.25 μm (Agilent Technologies, Santa Clara, CA, USA). Mass quantification was at a m/z 50 to 300 range, and GC Solution software, vers.2.53, was adopted for data processing. The peak identity of each compound was obtained by external calibration using PAH standards (Aldrich, St. Louis, MO, USA). The sediment specimens of the eight sampled sites were assayed in three replicates. To calculate the rate of recovery of each investigated compound, a certified material, CRM104, from Supelco, Bellefonte, PA, USA, was used. The mean percentage values varied between 75–115%. For individual compounds, the detection limit (LOD) and limit of quantification (LOQ) were computed by the range method of prediction to 95% of linear regressions. The calculated average values of LOD and LOQ were 0.1 and 0.3 μg/g, respectively. Analytical results quality was assessed by participation in ring tests. Statistical analysis consisted of skewness and kurtosis statistical tests [38].
3. Results
3.1. Chemical Features of Sediments
Table 1 summarizes the main geochemical features of sediments. Overall, the mean pH data reveal a certain tendency toward alkalinity moving from the inland freshwater area of the river, with a mean pH of 7.33, to the estuary, with a mean of 7.45, a maximum peak of 8.11 at S5, and a minimum value of 6.77 at S3. On one hand, these values are due to the decomposition of the organic litter and the release of organic acids [39]. On the other hand, they are also due to the effects of seawater, which has a pH interval of 8.08 to 8.33 [40]. The percent content of carbon, Corg%, was 0.34–0.51% in the freshwater area, 0.39–0.47% in the brackish sites, and 0.42–0.43% in the estuary waters. The higher carbon loads in the freshwater location also revealed a peak of 1.14% at S3. This is likely governed by different processes, such as how sediments deposit onto the river bed, the tide variability, the microbial decomposition of organic matter [41], and pollutant sorption on sediment surfaces [42,43]. CaCO3 mean values decreased toward the estuary, from 12.46% at S1 to 9–98% at S8, and this may be due to the higher fluvial carbonate content and flood debris deposition, which are common in the monsoonal environment [44].
Regarding the sedimentological nature, sediments are silty-sandy clay [32], except samples collected at S8, which are sandy-silty clay, as shown in Table 2 and Figure 2. The abundance of clay is evident in the medium part of the HRE, at 59.0%, and in the upper moiety, at 49.7%. Clay reaches a minimum load of 37.7% at S8 at the merging of the Hooghly River and the Bay of Bengal. Here, currents remove and remix the finest particles. Silt displays a narrower variation interval, ranging from 28.4 to 35.2%, with enrichments determined in the freshwater locations. The Mz in surface sediments ranges from 4.602 (S1) to 4.482 ϕ (S4) with a peak of 4.691 ϕ (S2) in the inner river, freshwater zone; in the brackish zone (S5–S6), Mz is constant around 4.85 ϕ; finally, in the estuarine zone (S7–S8) it increases up to 3.478 ϕ. The gradual increase from the mainland to the sea is due to the high hydrodynamics of the river mouth system. The sorting, σI, except for the poorly sorted S1, moderately sorted S2, and moderately well-sorted S3–S4 in the freshwater zone, is mainly moderately sorted (S5–S8) in the estuarine zone. Grain size distribution, SkI, results range from very fine (S1 and S5–S8) to fine skewed (S2–S4). Kurtosis, KG, shows that all samples, except the mesokurtic S7 in the estuarine zone, are leptokurtic [45] and unimodal, indicating an almost good selection.
Table 2.
Granulometry and main statistical indices of HRE sediments. The intervals of variation of each parameter are shown in parentheses.
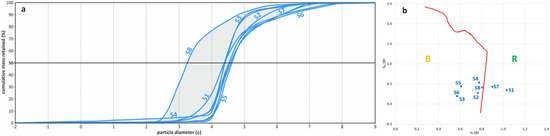
Figure 2.
(a) Granulometric spindle (grey area) representing the hydrodynamic energy that deposited the sediments and groups the cumulative frequency curves; (b) Friedman’s diagram [46] of the genetic–depositional environment based on the skewness (SkI) and sorting (σI) relation. B, bank; R, river.
The mean concentrations and ranges of PAHs are summarized in Table 3.
Table 3.
Mean, minimum, and maximum levels of PAHs in sediments. Concentrations are in ng/g.
Among the individual PAHs, the level of ANT was four-fold higher, at 190 vs. 45 ng/g, as reported by Arienzo et al. [21] for the Mediterranean coastal sediments. FLT mean concentration was four-fold higher, at 431 vs. 110 ng/g; mean loads of BbF and BkF were three-fold higher, at 116 vs. 40 ng/g and 66.0 vs. 20 ng/g, respectively, whereas IP and BgP surpassed the same quality standards by about two-fold, at 125 vs. 70 ng/g and 107 vs. 55 ng/g. Thus, the overall PAH levels appeared outstandingly high. Therefore, except NAP, mean hydrocarbon levels were two- to three-fold higher than the limits of the law, revealing high loads of individual and total PAD PAHs. The ranges of sedimentary PAHs were in the range of 0–47,366 ng/g and higher than ranges given by literature, such as the following: Brisbane River in Australia, 148–3079 ng/g [47]; Chongqing River in China, 221–3205 ng/g [48]; Rizhao coastal area in China, 79–853 ng/g [49]; west coast of Tunis, 1295 ng/g [50]; Bizerte lagoon, 83–447 ng/g [51,52]; and Ghar El Melh lagoon in Tunisia, 40 to 655 ng/g [53]. This is to say that the current literature displays limited data on PAHs’ presence along the course of the HRE, and most of the studies regard the SMW. A comparison with a total PAHs Sundarban survey, performed in 2020 by Balu et al. [9], revealed how the total PAHs range is significantly higher that previously reported, at 4880–20,000 ng/g. Our detected total PAHs range was also considerably higher than those reported in the Bangladesh and Bengal Sundarban by Zuloaga et al. in 2013 [24]: sediments of the Martaja estuary in Bangladesh revealed a range of 208–4687 ng/g, whereas those of the HRE in India reveal a range of 208–12,993 ng/g. Our peak data reveal three- to ten-fold higher PAH levels at the sites surveyed in the 2013 sampling. A much higher and more significant increase was also observed when we compared our range with that reported in 2010 by Dominguez et al. [12] in the SMW, which was 132–2938 ng/g. Moreover, our maximum detected PAHs peak, 47,366 ng/g, was also significantly higher than that of 30,000 ng/g reported by Baumard et al. [54] for the harbor of Kiel in Germany.
The literature reports different classes of PAHs sediment pollution depending on the contaminant loads [55]: low, 0–100 ng/g; moderate, 100–1000 ng/g; high, 1001–5000 ng/g; and highly contaminated, >5000 ng/g. Thus, the HRE sediments appeared to be highly polluted and deserve urgent action from the public to contain such significant pollution loads. The temporal variation in the mean PAHs levels reveals that, except FLT, PYR, BaA, and CHR, there was an evident decrease in the absolute hydrocarbon loads from 2018 to 2021, especially for PHE, BbF, IP, and BgP, with a maximum peak in total PAHs recorded in 2019
The individual percentage contribution by molecular weight revealed how the sum of the two- to three-ring PAHs amounted to 17.4%, whereas that of the four- to six-ring PAH compounds significantly dominated and amounted to 82.6%. Factors sustaining elevated loads and persistence of HMWs in aquatic environments compared to LMWs are likely low water solubility and volatility [55]. The principal sources and causes of PAHs accumulation are assessed based on diagnostic ratios and statistical analyses that help to distinguish between petrogenic and pyrogenic sources. One of the main indexes for distinguishing between combustion and petroleum sources is ANT/(ANT + PHE), as reported by Yunker et al. [56]. Our estimated calculated ratio was >0.30 and higher than the reference discriminant ratio of >0.10, suggesting that PAHs were from a combustion source. Also, the ratio FLT/(FLT + PYR), proposed by Yunker et al. [56] as an indicator of coal combustions, was higher than the threshold of 0.5.
Figure 3 compares the average composition of individual PAHs in crude oil [57] with that of the studied sediment samples. Differences were marked, revealing a clear dominance of HMW compounds, especially PHE, at 25.5%. Once emitted into the atmosphere, PAHs, LMW, and HMW separate with the former fraction as more volatile, so having extended permanence in the atmosphere. HMW, being a less polar aggregate, interacts with particulate and precipitates with depositions. The sorption of PAHs by sediments makes these compounds less sensitive to the degradation process [58].
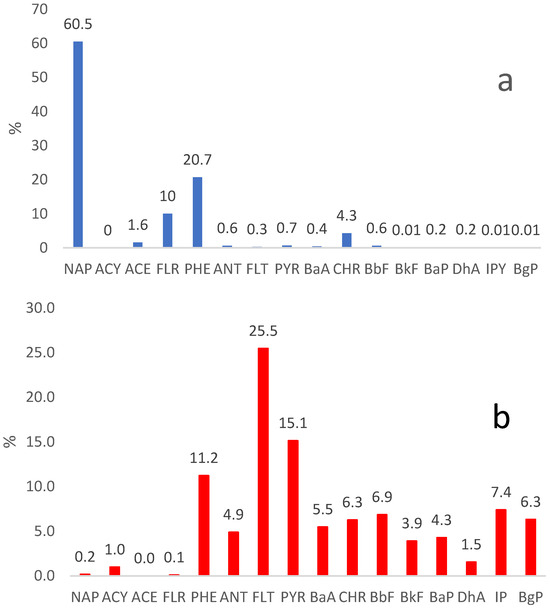
Figure 3.
Comparison of the PAHs’ mean compositions in crude oil (a) (average of 48 different crude oils), [57] and sediments (b) of our study.
3.2. Toxicity Assessment of PAHs
The toxicity of contaminants is normally determined by several Standard Quality Guidelines, SQGs, as Effects Range-Low, ERL, Effects Range-Median, ERM, Threshod Effects Levels, TEL, and Probable Effects Levels (PEL) [59]. In this study, we assayed the toxicity by calculating BaP equivalents of the entire pool of PAHs. BaP is considered a group 1 carcinogen by several authors [60,61]. These authors believe that BaP, as well as being mutagenic, has metabolites that impede DNA replication. According to these indications, there is a procedure measuring the overall carcinogenic potency of a PAHs mixture for humans. At this scope, the toxicity equivalence factor (TEF) of each PAH was assayed relative to BaP using US EPA standards (1993) adapted for PAH compounds [62]. From this parameter, the overall BaP equivalent toxicity (TEQ) can be calculated as the sum of the products of the individual carcinogenic concentrations and the respective toxicity equivalence factors, as reported here:
In this formula, Ci is the concentration of the ith PAH. The output of PAHs screening is in Table 4, which reports TEQ, the mutagenic equivalent (MEQ), and the carcinogenic equivalent (CEQ) calculated as linear combinations of PAH levels and relative equivalence factors. Moreover, the ratio between the overall loads of carcinogenic PAH (ΣPAHcarc) [63] and the 16 determined PAHs (ΣPAH) was calculated. The data indicate that, on average, ~18% of PAHs are carcinogenic, with a wide interval of 0–91%. Mean values of TEQ and MEQ were 245 and 184 µg/g, with ranges of 0–10,902 and 0–9041 ng/g, respectively. These data were significantly higher than those reported by the literature for low ecological risk environments [59] or moderately polluted areas [64,65], showing a very worrying scenario. The calculated mean TEQ of 245 was comparable to those estimated by Zuloaga [23] for Indian and Bangladesh Sundarban, at 358 and 221 ng/g. However, the maximum peak was 10,902 ng/g and, hence, about ten-fold the peak values of 2450 and 1014 ng/g for the Sundarban investigated area of the two states.
Table 4.
Values of TEQ, MEQ, and CEQ (ng/g) and share of carcinogenic PAH in ΣPAH for sediments of Hooghly River.
4. Conclusions
This study showed a significant and worrying load of PAH levels along the entire final stretch of the HRE with mean individual PAHs above legal limits and literature references, and with a worsening scenario compared to past screenings. Compared with SQGs, PAHs are present at high levels. Source discrimination by molecular indices reveals how pollution is driven mainly by different anthropogenic pollution inputs, comprising emissions by vehicle combustion, the burning of biomass, and domestic and industrial coal combustion. This preliminary data set will provide usable background information for designing recovery, remediation, rehabilitation, and adaptive strategies by governmental institutions and environmental agencies, with significant improvement for the mitigation of ecological issues and the connectivity of river and adjacent wetland ecosystems. The estimation of toxicity reveals that most of the river’s low valley and mouth sediments are at high toxicity risk, and sources of input urgently need to be mitigated. Further research will show the effects of monsoon cycling on PAHs’ spatial distribution in different segments of the HRE and SMW, as well as on the temporal evolution of pollutant loads.
Author Contributions
Writing—original draft preparation, M.A. and M.T. (Maria Toscanesi); writing—review and editing, L.F., M.T. (Marco Trifuoggi), C.D., S.K.S., J.M.P., P.M. and G.N. All authors have read and agreed to the published version of the manuscript.
Funding
This research received no external funding.
Institutional Review Board Statement
Not applicable.
Informed Consent Statement
Not applicable.
Data Availability Statement
Data are contained within the article.
Acknowledgments
Author Priyanka Mondal is grateful to the Department of Science and Technology (DST) for awarding her a research fellowship under the “Innovation in Science Pursuit for Inspired Research (INSPIRE)” program.
Conflicts of Interest
The authors declare no conflicts of interest.
References
- McLusky, D.S.; Elliott, M. The Estuarine Ecosystem: Ecology, Threats and Management, 3rd ed.; Oxford Academic: Oxford, UK, 2004. [Google Scholar] [CrossRef]
- Bai, J.; Jia, J.; Zhang, G.; Zhao, Q.; Lu, Q.; Cui, B.; Liu, X. Spatial and temporal dynamics of heavy metal pollution and source identification in sediment cores from the short–term flooding riparian wetlands in a Chinese delta. Environ. Pollut. 2016, 219, 379–388. [Google Scholar] [CrossRef]
- Trifuoggi, M.; Donadio, C.; Ferrara, L.; Stanislao, C.; Toscanesi, M.; Arienzo, M. Levels of pollution of rare earth elements in the surface sediments from the Gulf of Pozzuoli (Campania, Italy). Mar. Pollut. Bull. 2018, 136, 374–384. [Google Scholar] [CrossRef]
- Arienzo, M.; Bolinesi, F.; Aiello, G.; Barra, D.; Donadio, C.; Stanislao, C.; Ferrara, L.; Mangoni, O.; Toscanesi, M.; Giarra, A.; et al. The environmental assessment of an estuarine transitional environment, southern Italy. J. Mar. Sci. Eng. 2020, 8, 628. [Google Scholar] [CrossRef]
- Arienzo, M.; Ferrara, L.; Toscanesi, M.; Giarra, A.; Donadio, C.; Trifuoggi, M. Sediment contamination by heavy metals and ecological risk assessment: The case of Gulf of Pozzuoli, Naples, Italy. Mar. Pollut. Bull. 2020, 155, 111149. [Google Scholar] [CrossRef]
- De Pippo, T.; Donadio, C.; Pennetta, M.; Petrosino, C.; Terlizzi, F.; Valente, A. Coastal hazard assessment and mapping in Northern Campania, Italy. Geomorphology 2008, 97, 451–466. [Google Scholar] [CrossRef]
- Shetye, S.R. Indian estuaries: Dynamics, ecosystems, and threats. Natl. Acad. Sci. Lett. 2011, 34, 229–237. [Google Scholar]
- Garzanti, E.; Andò, S.; Vezzoli, G. Grain-size dependence of sediment composition and environmental bias in provenance studies. Earth Planet. Sci. Lett. 2009, 277, 422–432. [Google Scholar] [CrossRef]
- Balu, S.; Bhunia, S.; Gachhui, R.; Mukherjee, J. Assessment of polycyclic aromatic hydrocarbon contamination in the Sundarbans, the world’s largest tidal mangrove forest and indigenous microbial mixed biofilm-based removal of the contaminants. Environ. Poll. 2020, 266, 115270. [Google Scholar] [CrossRef]
- Bhattacharya, A. The morphodynamic setting in substrate behavior of Sunderban Mangrove wetland, India. ENVIS Newsl. Wetl. Ecosyst. 2008, 4, 2–9. [Google Scholar]
- Binelli, A.; Sarkar, S.K.; Chatterjee, M.; Riva, C.; Parolini, M.; Bhattacharya, B.; Bhattacharya, A.K.; Satpathy, K.K. A comparison of sediment quality guidelines for toxicity assessment in the Sunderban Wetlands (Bay of Bengal, India). Chemosphere 2008, 73, 1129–1137. [Google Scholar] [CrossRef]
- Dominguez, C.; Sarkar, S.K.; Bhattacharya, A.; Chatterjee, M.; Bhattacharya, B.D.; Jover, E.; Albaiges, J.; Bayona, J.M.; Alam, M.A.; Satpathy, K.K. Quantification and source identification of polycyclic aromatic hydrocarbons in core sediments from Sundarban Mangrove Wetland, India. Arch. Environ. Contam. Toxicol. 2010, 59, 49–61. [Google Scholar] [CrossRef]
- Machado, A.A.S.; Wood, C.M.; Bianchini, A.; Gillis, P.A. Responses of biomarkers in wild freshwater mussels chronically exposed to complex contaminant mixtures. Ecotoxicology 2014, 23, 1345–1358. [Google Scholar] [CrossRef]
- Lee, C.C.; Chen, C.S.; Wang, Z.X.; Tien, C.J. Polycyclic aromatic hydrocarbons in 30 river ecosystems, Taiwan: Sources, and ecological and human health risks. Sci. Total Environ. 2021, 95, 148867. [Google Scholar] [CrossRef]
- Ambade, B.; Sethi, S.S.; Kumar, A.; Sankar, T.K.; Kurwadkar, S. Health risk assessment, composition, and distribution of polycyclic aromatic hydrocarbons (PAHs) in drinking water of Southern Jharkhand, East India. Arch. Environ. Contam. Toxicol. 2021, 80, 120–133. [Google Scholar] [CrossRef]
- Szatyłowicz, E.; Hawrylik, E. Assessment of Migration of PAHs Contained in Soot of Solid Fuel Combustion into the Aquatic Environment. Water 2022, 14, 3079. [Google Scholar] [CrossRef]
- Zeng, Q.; Jeppesen, E.; Gu, X.; Mao, Z.; Chen, H. Distribution, fate and risk assessment of PAHs in water and sediments from an aquaculture-and shipping-impacted subtropical lake, China. Chemosphere 2018, 201, 612–620. [Google Scholar] [CrossRef]
- Larsson, M.; Lam, M.M.; Hees, P.V.; Giesy, J.P.; Engwall, M. Occurrence and leachability of polycyclic aromatic compounds in contaminated soils: Chemical and bioanalytical characterization. Sci. Total Environ. 2018, 622–623, 1476–1484. [Google Scholar] [CrossRef]
- Ferrara, L.; Trifuoggi, M.; Toscanesi, M.; Donadio, C.; Barra, D.; Aiello, G.; Arienzo, M. Source identification and eco-risk assessment of polycyclic aromatic hydrocarbons in the sediments of seawaters facing the former steel plant ILVA, Naples, Italy. Reg. Stud. Mar. Sci. 2020, 35, 101097. [Google Scholar] [CrossRef]
- Pampanin, D.M.; Sydnes, M.O. Polycyclic aromatic hydrocarbons a constituent of petroleum: Presence and influence in the aquatic environment. In Hydrocarbon; Kutcherov, V., Kolesnikov, A., Eds.; IntechOpen: London, UK, 2013. [Google Scholar] [CrossRef]
- Krauss, M.; Wilcke, W.; Martius, C.; Bandeira, A.G.; Garcia, M.V.B.; Amelung, W. Atmospheric versus biological sources of polycyclic aromatic hydrocarbons (PAHs) in a tropical rain forest environment. Environ. Pollut. 2005, 135, 143–154. [Google Scholar] [CrossRef]
- Arienzo, M.; Donadio, C.; Mangoni, O.; Bolinesi, F.; Stanislao, C.; Trifuoggi, M.; Toscanesi, M.; Di Natale, G.; Ferrara, L. Characterization and source apportionment of polycyclic aromatic hydrocarbons (PAHs) in the sediments of gulf of Pozzuoli (Campania, Italy). Mar. Pollut. Bull. 2017, 124, 480–487. [Google Scholar] [CrossRef]
- Abdel-Shafy, H.I.; Mansour, M.S.M. A review on polycyclic aromatic hydrocarbons: Source, environmental impact, effect on human health and remediation. Egypt. J. Pet. 2016, 25, 107–123. [Google Scholar] [CrossRef]
- Guigue, C.; Tedetti, M.; HuyDang, D.; Mullot, J.; Garnier, C.; Goutxet, M. Remobilization of polycyclic aromatic hydrocarbons and organic matter in seawater during sediment resuspension experiments from a polluted coastal environment: Insights from Toulon Bay (France). Environ. Pollut. 2017, 229, 627–638. [Google Scholar] [CrossRef] [PubMed]
- Zuloaga, O.; Prieto, A.; Ahmed, K.; Sarkar, S.K.; Bhattacharya, A.; Chatterjee, M.; Bhattacharya, B.D.; Satpathy, K.K. Distribution of polycyclic aromatic hydrocarbons in recent sediments of Sundarban mangrove wetland of India and Bangladesh: A comparative approach. Environ. Earth Sci. 2013, 68, 355–367. [Google Scholar] [CrossRef]
- Zanardi-Lamardo, E.; Mitra, S.; Vieira-Campos, A.A.; TakeshiYogui, G.; Sarkar, S.K.; Biswas, J.K.; Godhantaraman, N. Distribution and sources of organic contaminants in surface sediments of Hooghly River estuary and Sundarban mangrove, eastern coast of India. Mar. Pollut. Bull. 2019, 146, 9–49. [Google Scholar] [CrossRef] [PubMed]
- Sadhuram, Y.; Sarma, V.V.; Ramana Murthy, T.V.; Rao, B.P. Seasonal variability of physico–chemical characteristics of the Haldia channel of Hooghly estuary, India. J. Earth Syst. Sci. 2005, 114, 37–49. [Google Scholar] [CrossRef]
- Mitra, S.; Ghosh, S.; Satpathy, K.K.; Bhattacharya, B.D.; Sarkar, S.K.; Mishra, P.; Raja, P. Water quality assessment of the ecologically stressed Hooghly River Estuary, India: A multivariate approach. Mar. Pollut. Bull. 2017, 126, 592–599. [Google Scholar] [CrossRef] [PubMed]
- Mondal, P.; de Alcântara, M.R.; Jonathan, M.P.; Biswas, J.K.; Murugan, K.; Sarkar, S.K. Seasonal assessment of trace element contamination in intertidal sediments of the meso-macrotidal Hooghly (Ganges) River Estuary with a note on mercury speciation. Mar. Pollut. Bull. 2018, 127, 117–130. [Google Scholar] [CrossRef]
- Rogers, K.G.; Goodbred, S.L.; Mondal, D.R. Monsoon sedimentation on the “abandoned” tide influenced Ganges-Brahmaputra Delta plain. Est. Coast. Shelf Sci. 2013, 131, 297–309. [Google Scholar] [CrossRef]
- Belloni, S. Una tabella universale per eseguire granulometrie col metodo della sedimentazione unica o col metodo del densimetro di Casagrande modificato. Geol. Tecton. 1969, 16, 1281–1289. [Google Scholar]
- Folk, R.L.; Ward, W.C. Brazos River bar: A study in the significance of grain size parameters. J. Sediment. Petrol. 1957, 27, 3–26. [Google Scholar] [CrossRef]
- Jackson, M.L. Soil Chemical Analysis; Prentice Hall of India Pvt. Ltd.: New Delhi, India, 1971; p. 498. [Google Scholar]
- Blott, S.J.; Pye, K. GRADISTAT: A particle size distribution and statistics package for the analysis of unconsolidated sediments. Earth Surf. Process. Landf. 2001, 26, 1237–1248. [Google Scholar] [CrossRef]
- Graham, D.; Midgley, N.G. Graphical representation of particle shape using triangular diagrams: An excel spreadsheet method. Earth Surf. Process. Landf. 2000, 25, 1473–1477. [Google Scholar] [CrossRef]
- Angelucci, A.; Palmerini, V. Studio sedimentologico delle sabbie rosse di Piverno (Lazio sud-occidentale). Geol. Romana 1964, 3, 203–226. [Google Scholar]
- IARC. Overall Evaluations of Carcinogenicity: An Updating of IARC Monographs Volumes 1 to 42. In IARC Monographs on the Evaluation of Carcinogenic Risks to Humans; International Agency for Research on Cancer: Lyon, France, 1987; Volume Supplement 7. [Google Scholar]
- Zhang, Y.; Guo, F.; Meng, W.; Wang, X.Q. Water quality assessment and source identification of Daliao river basin using multivariate statistical methods. Environ. Monit. Assess. 2009, 152, 105–121. [Google Scholar] [CrossRef] [PubMed]
- Liao, J.F. The chemical properties of the mangrove Solonchak in the northeast part of Hainan Island. Acta Sci. Nat. Univ. Sunyatseni 1990, 9, 67–72. [Google Scholar]
- Marion, G.M.; Millero, F.J.; Feistel, R. Precipitation of solid phase calcium carbonates and their effect on application of seawater SA-T-P models. Ocean Sci. 2009, 5, 285–291. [Google Scholar] [CrossRef]
- Antizar-Ladislao, B.; Mondal, P.; Mitra, S.; Sarkar, S.K. Assessment of trace metal contamination level and toxicity in sediments from coastal regions of West Bengal, eastern part of India. Mar. Pollut. Bull. 2015, 101, 886–894. [Google Scholar] [CrossRef] [PubMed]
- Sarkar, S.K.; Bilinski, S.F.; Bhattacharya, A.; Saha, M.; Bilinski, H. Levels of elements in the surficial estuarine sediments of the Hugli River, northeast India and their environmental implications. Environ. Int. 2004, 30, 1089–1098. [Google Scholar] [CrossRef]
- Chatterjee, M.; Silva Filho, E.V.; Sarkar, S.K.; Sella, S.M.; Bhattacharya, A.; Satpathy, K.K. Distribution and possible source of trace elements in the sediment cores of a tropical macrotidal estuary and their ecotoxicological significance. Environ. Int. 2007, 33, 346–356. [Google Scholar] [CrossRef]
- Carthew, K.D.; Taylor, M.P.; Drysdale, R.N. Are current models of tufa sedimentary environments applicable to tropical systems? A case study from the Gregory River. Sediment. Geol. 2003, 162, 199–221. [Google Scholar] [CrossRef]
- Arienzo, M.; Trifuoggi, M.; Ferrara, L.; Donadio, C.; Mondal, P.; Ponniah, J.M.; Sarkar, S.K.; Toscanesi, M. Influence of monsoon season on heavy metal composition of Hooghly River estuary sediments, West Bengal, India. J. Geochem. Explor. 2023, 248, 107181. [Google Scholar] [CrossRef]
- Friedman, G.M. Dynamic Processes and Statistical Parameters Compared for Size Frequency Distribution of Beach and River Sands. J. Sediment. Petrol. 1967, 37, 327–354. [Google Scholar]
- Duodu, G.O.; Ogogo, K.N.; Mummullage, S.; Harden, F.; Goonetilleke, A.; Ayoko, G.A. Source apportionment and risk assessment of PAHs in Brisbane River sediment, Australia. Ecol. Indic. 2017, 73, 784–799. [Google Scholar] [CrossRef]
- Lei, P.; Pan, K.; Zhang, H.; Bi, J. Pollution and risk of PAHs in surface sediments from the tributaries and their relation to anthropogenic activities, in the main urban districts of Chongqing city, Southwest China. Bull. Environ. Contam. Toxicol. 2019, 103, 28–33. [Google Scholar] [CrossRef]
- Chen, H.Y.; Teng, Y.G.; Wang, J.S. Source apportionment of polycyclic aromatic hydrocarbons (PAHs) in surface sediments of the Rizhao coastal area (China) using diagnostic ratios and factor analysis with nonnegative constraints. Sci. Total Environ. 2012, 414, 293–300. [Google Scholar] [CrossRef] [PubMed]
- Mzoughi, N.; Chouba, L. Distribution and partitioning of aliphatic hydrocarbons and polycyclic aromatic hydrocarbons between water, suspended particulate matter, and sediment in harbours of the West coastal of the Gulf of Tunis (Tunisia). J. Environ. Monit. 2011, 13, 689–698. [Google Scholar] [CrossRef] [PubMed]
- Trabelsi, S.; Driss, M.R. Polycyclic aromatic hydrocarbons in superficial coastal sediments from Bizerte Lagoon, Tunisia. Mar. Pollut. Bull. 2005, 50, 344–348. [Google Scholar] [CrossRef] [PubMed]
- Barhoumi, B.; LeMenach, K.; Devier, M.H.; Ameur, W.B.; Etcheber, H.; Budzinski, H.; Cachot, J.; Driss, M.R. Polycyclic aromatic hydrocarbons (PAHs) in surface sediments from the Bizerte Lagoon, Tunisia: Levels, sources, and toxicological significance. Environ. Monit. Assess. 2014, 186, 2653–2669. [Google Scholar] [CrossRef] [PubMed]
- Ameur, W.B.; Trabelsi, S.; Driss, M.R. Polycyclic aromatic hydrocarbons in superficial sediments from Ghar El Melh Lagoon, Tunisia. Bull. Environ. Contam. Toxicol. 2010, 85, 184–189. [Google Scholar] [CrossRef]
- Baumard, P.; Budzinski, H.; Garrigues, P.H.; Sorbe, J.C.; Burgeot, T.; Bellocq, J. Concentrations of PAHs (polycyclic aromatic hydrocarbons) in various marine organisms in relation to those in sediments and to trophic level. Mar. Pollut. Bull. 1998, 36, 951–960. [Google Scholar] [CrossRef]
- Zakaria, M.P.; Takada, H.; Tsutsumi, S.; Ohno, K.; Yamada, J.; Kouno, E.; Kumata, H. Distribution of polycyclic aromatic hydrocarbons (PAHs) in rivers and estuaries in Malaysia: A widespread input of petrogenic PAHs. Environ. Sci. Technol. 2002, 36, 1907–1918. [Google Scholar] [CrossRef] [PubMed]
- Yunker, M.B.; Macdonald, R.W.; Vingarzan, R.; Mitchell, R.H.; Goyette, D.; Sylvestre, S. PAHs in the Fraser River basin: A critical appraisal of PAH ratios as indicators of PAH source and composition. Org. Geochem. 2002, 33, 489–515. [Google Scholar] [CrossRef]
- Kerr, J.M.; Melton, H.R.; McMillen, S.J.; Magaw, R.I.; Naughton, G.; Little, G.N. Polyaromatic hydrocarbon content in crude oils around the world. In Proceedings of the 1999 SPE/EPA Exploration and Production Environmental Conference, Austin, TX, USA, 28 February–3 March 1999. [Google Scholar]
- Guzzella, L.; Depaolis, A. Polycyclic aromatic hydrocarbons in sediments of the Adriatic Sea. Mar. Pollut. Bull. 1994, 28, 159–165. [Google Scholar] [CrossRef]
- Long, E.R.; MacDonald, D.D. Recommended uses of empirically derived, sediment quality guidelines for marine and estuarine ecosystems. Hum. Ecol. Risk Assess. 1998, 4, 1019–1039. [Google Scholar] [CrossRef]
- Mumtaz, M.; George, J. Toxicological Profile for Polycyclic Aromatic Hydrocarbons; U.S. Department of Health and Human Services, Agency for Toxic Substances and Disease Registry: Atlanta, GA, USA, 1995. [Google Scholar]
- Obini, U.; Okafor, C.O.; Afuikwu, J.N. Determination of level of polycyclic aromatic hydrocarbon in soil contaminated with spent motor engine oil in abakaliki auto mechanic village. J. Appl. Sci. Environ. Manag. 2013, 17, 169–175. [Google Scholar] [CrossRef]
- Nisbet, I.C.T.; LaGoy, P.K.I. Toxic equivalency factors (TEFs) for polycyclic aromatic hydrocarbons (PAHs). Regul. Toxicol. Pharmacol. 1992, 16, 290–300. [Google Scholar] [CrossRef] [PubMed]
- US EPA. Polycyclic Aromatic Hydrocarbons (PAHs)—EPA Fact Sheet; National Center for Environmental Assessment, Office of Research and Development: Washington, DC, USA, 2008. [Google Scholar]
- Li, G.L.; Lang, Y.H.; Gao, M.S.; Yang, W.; Peng, P.; Wang, X.M. Carcinogenic and mutagenic potencies for different PAHs sources in coastal sediments of Shandong Peninsula. Mar. Pollut. Bull. 2014, 84, 418–423. [Google Scholar] [CrossRef]
- Adeniji, A.O.; Okoh, O.O.; Okoh, A.I. Distribution pattern and health risk assessment of polycyclic aromatic hydrocarbons in the water and sediment of Algoa Bay, South Africa. Environ. Geochem. Health 2019, 41, 1303–1320. [Google Scholar] [CrossRef]


Disclaimer/Publisher’s Note: The statements, opinions and data contained in all publications are solely those of the individual author(s) and contributor(s) and not of MDPI and/or the editor(s). MDPI and/or the editor(s) disclaim responsibility for any injury to people or property resulting from any ideas, methods, instructions or products referred to in the content. |
© 2024 by the authors. Licensee MDPI, Basel, Switzerland. This article is an open access article distributed under the terms and conditions of the Creative Commons Attribution (CC BY) license (https://creativecommons.org/licenses/by/4.0/).