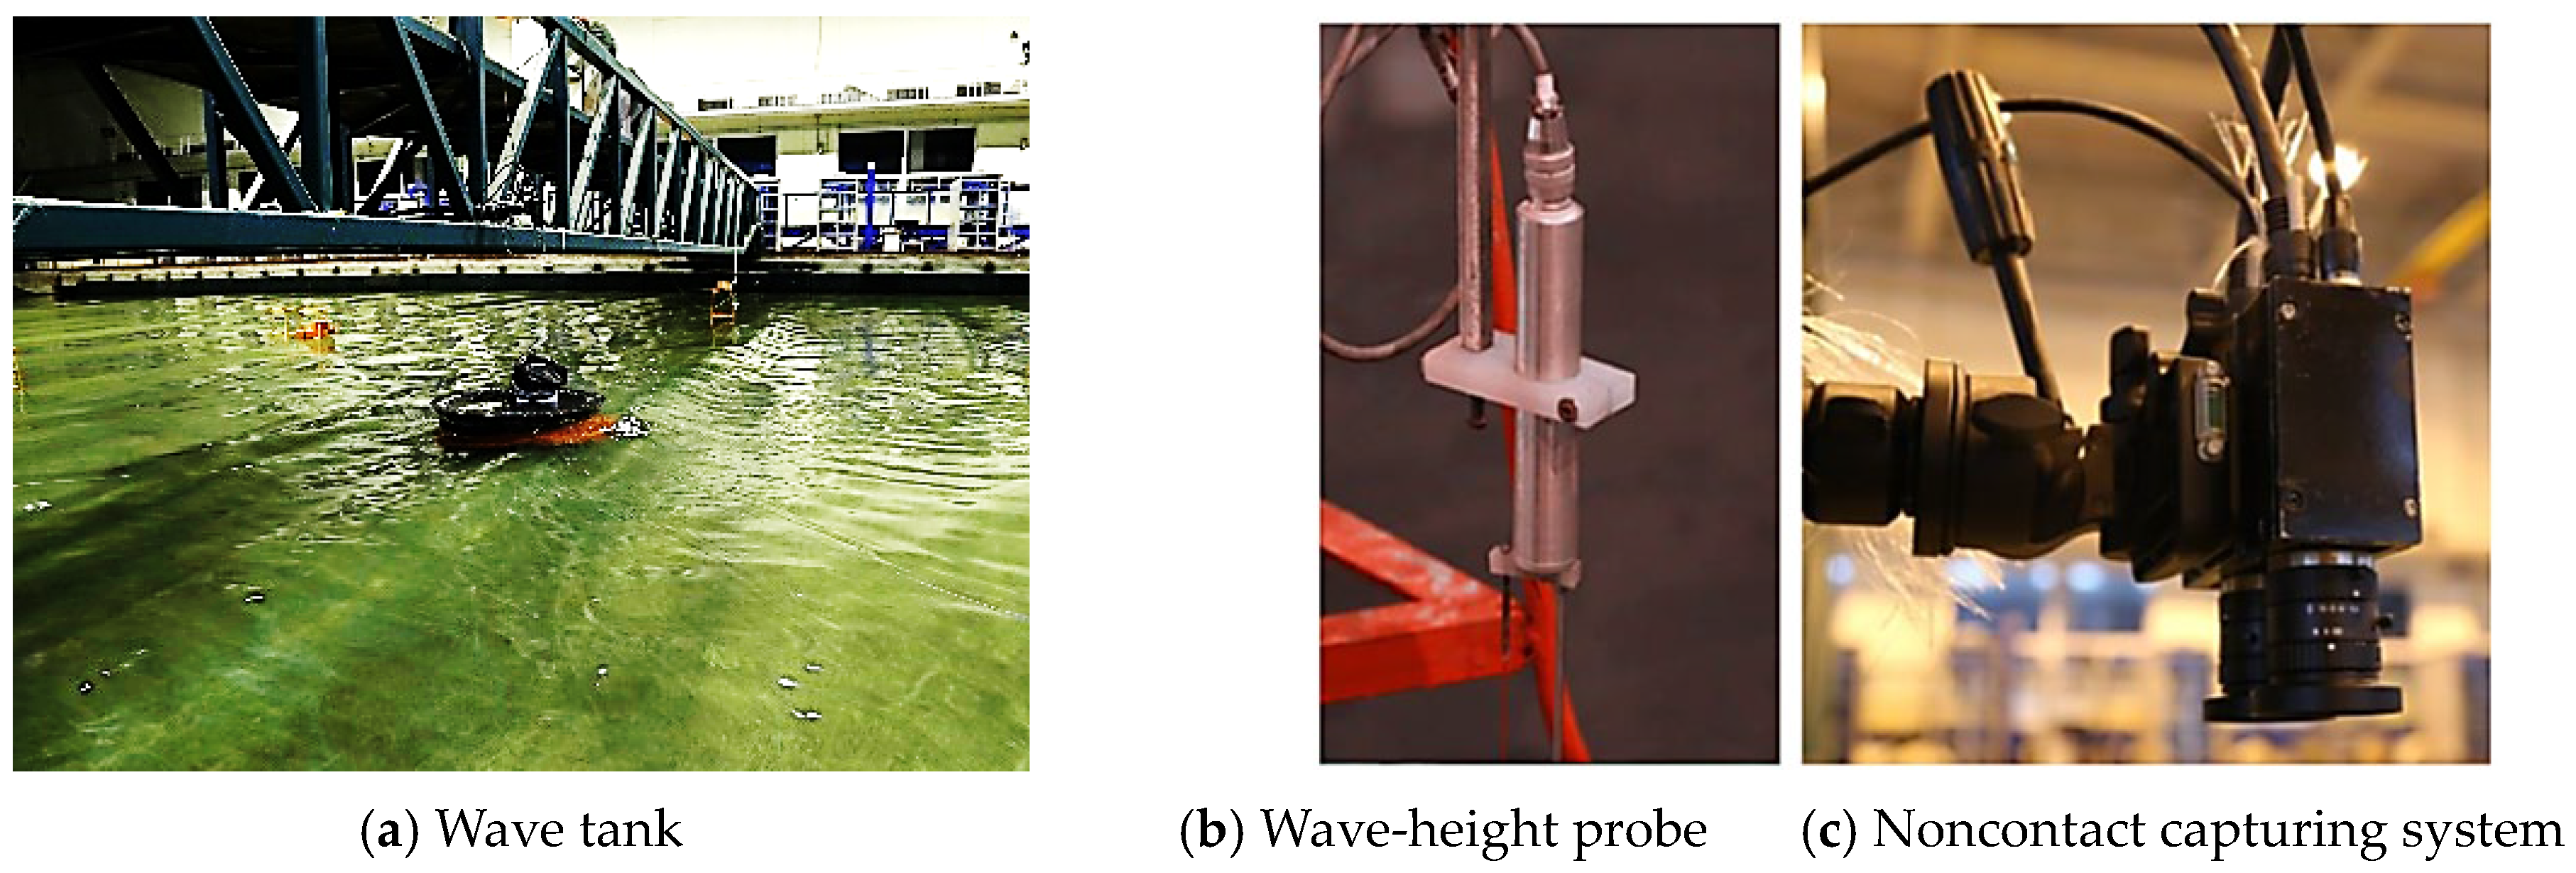
Figure 1.
Experimental wave tank and equipment.
Figure 1.
Experimental wave tank and equipment.
Figure 2.
Computational domain and numerical meshes for the sandglass-type floating body.
Figure 2.
Computational domain and numerical meshes for the sandglass-type floating body.
Figure 3.
Time-history curves of heave and pitch motions of the sandglass-type model obtained by two methods.
Figure 3.
Time-history curves of heave and pitch motions of the sandglass-type model obtained by two methods.
Figure 4.
Free surface and velocity contour of wave slamming on the front side of sandglass-type model.
Figure 4.
Free surface and velocity contour of wave slamming on the front side of sandglass-type model.
Figure 5.
Free surface and velocity contour of wave convergence at the rear end of sandglass-type model.
Figure 5.
Free surface and velocity contour of wave convergence at the rear end of sandglass-type model.
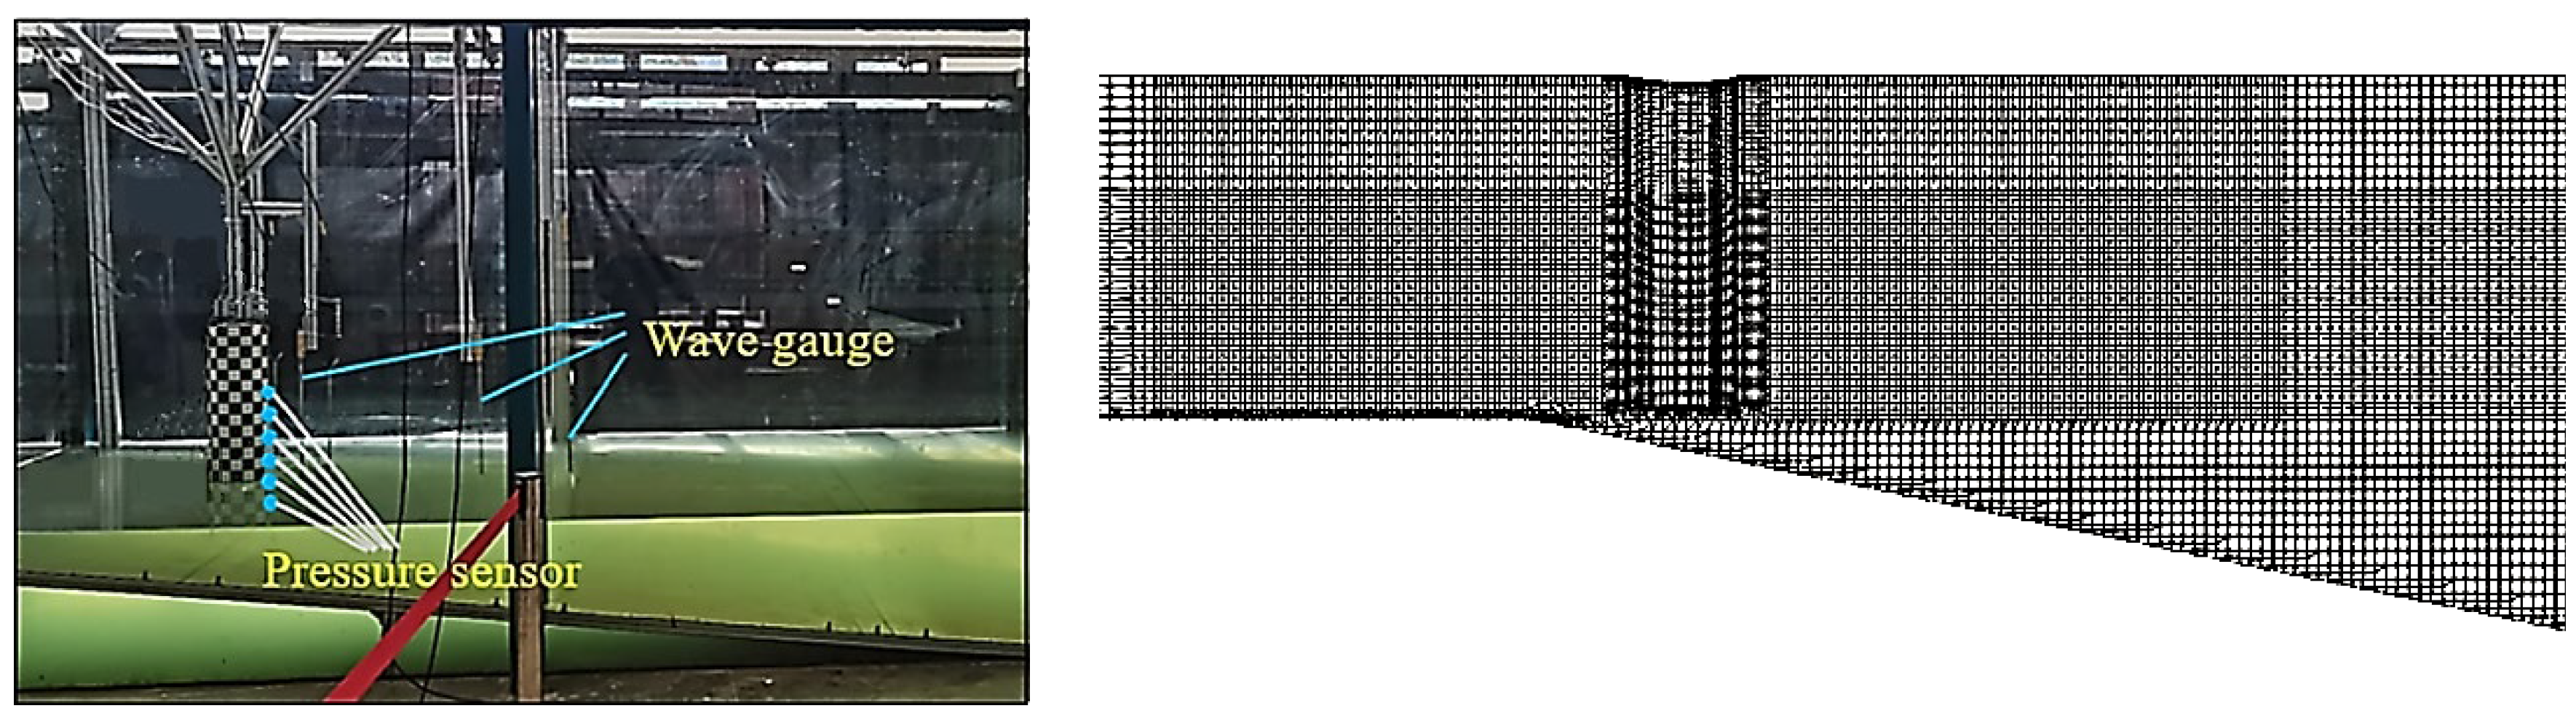
Figure 6.
Experimental setup and numerical meshes.
Figure 6.
Experimental setup and numerical meshes.
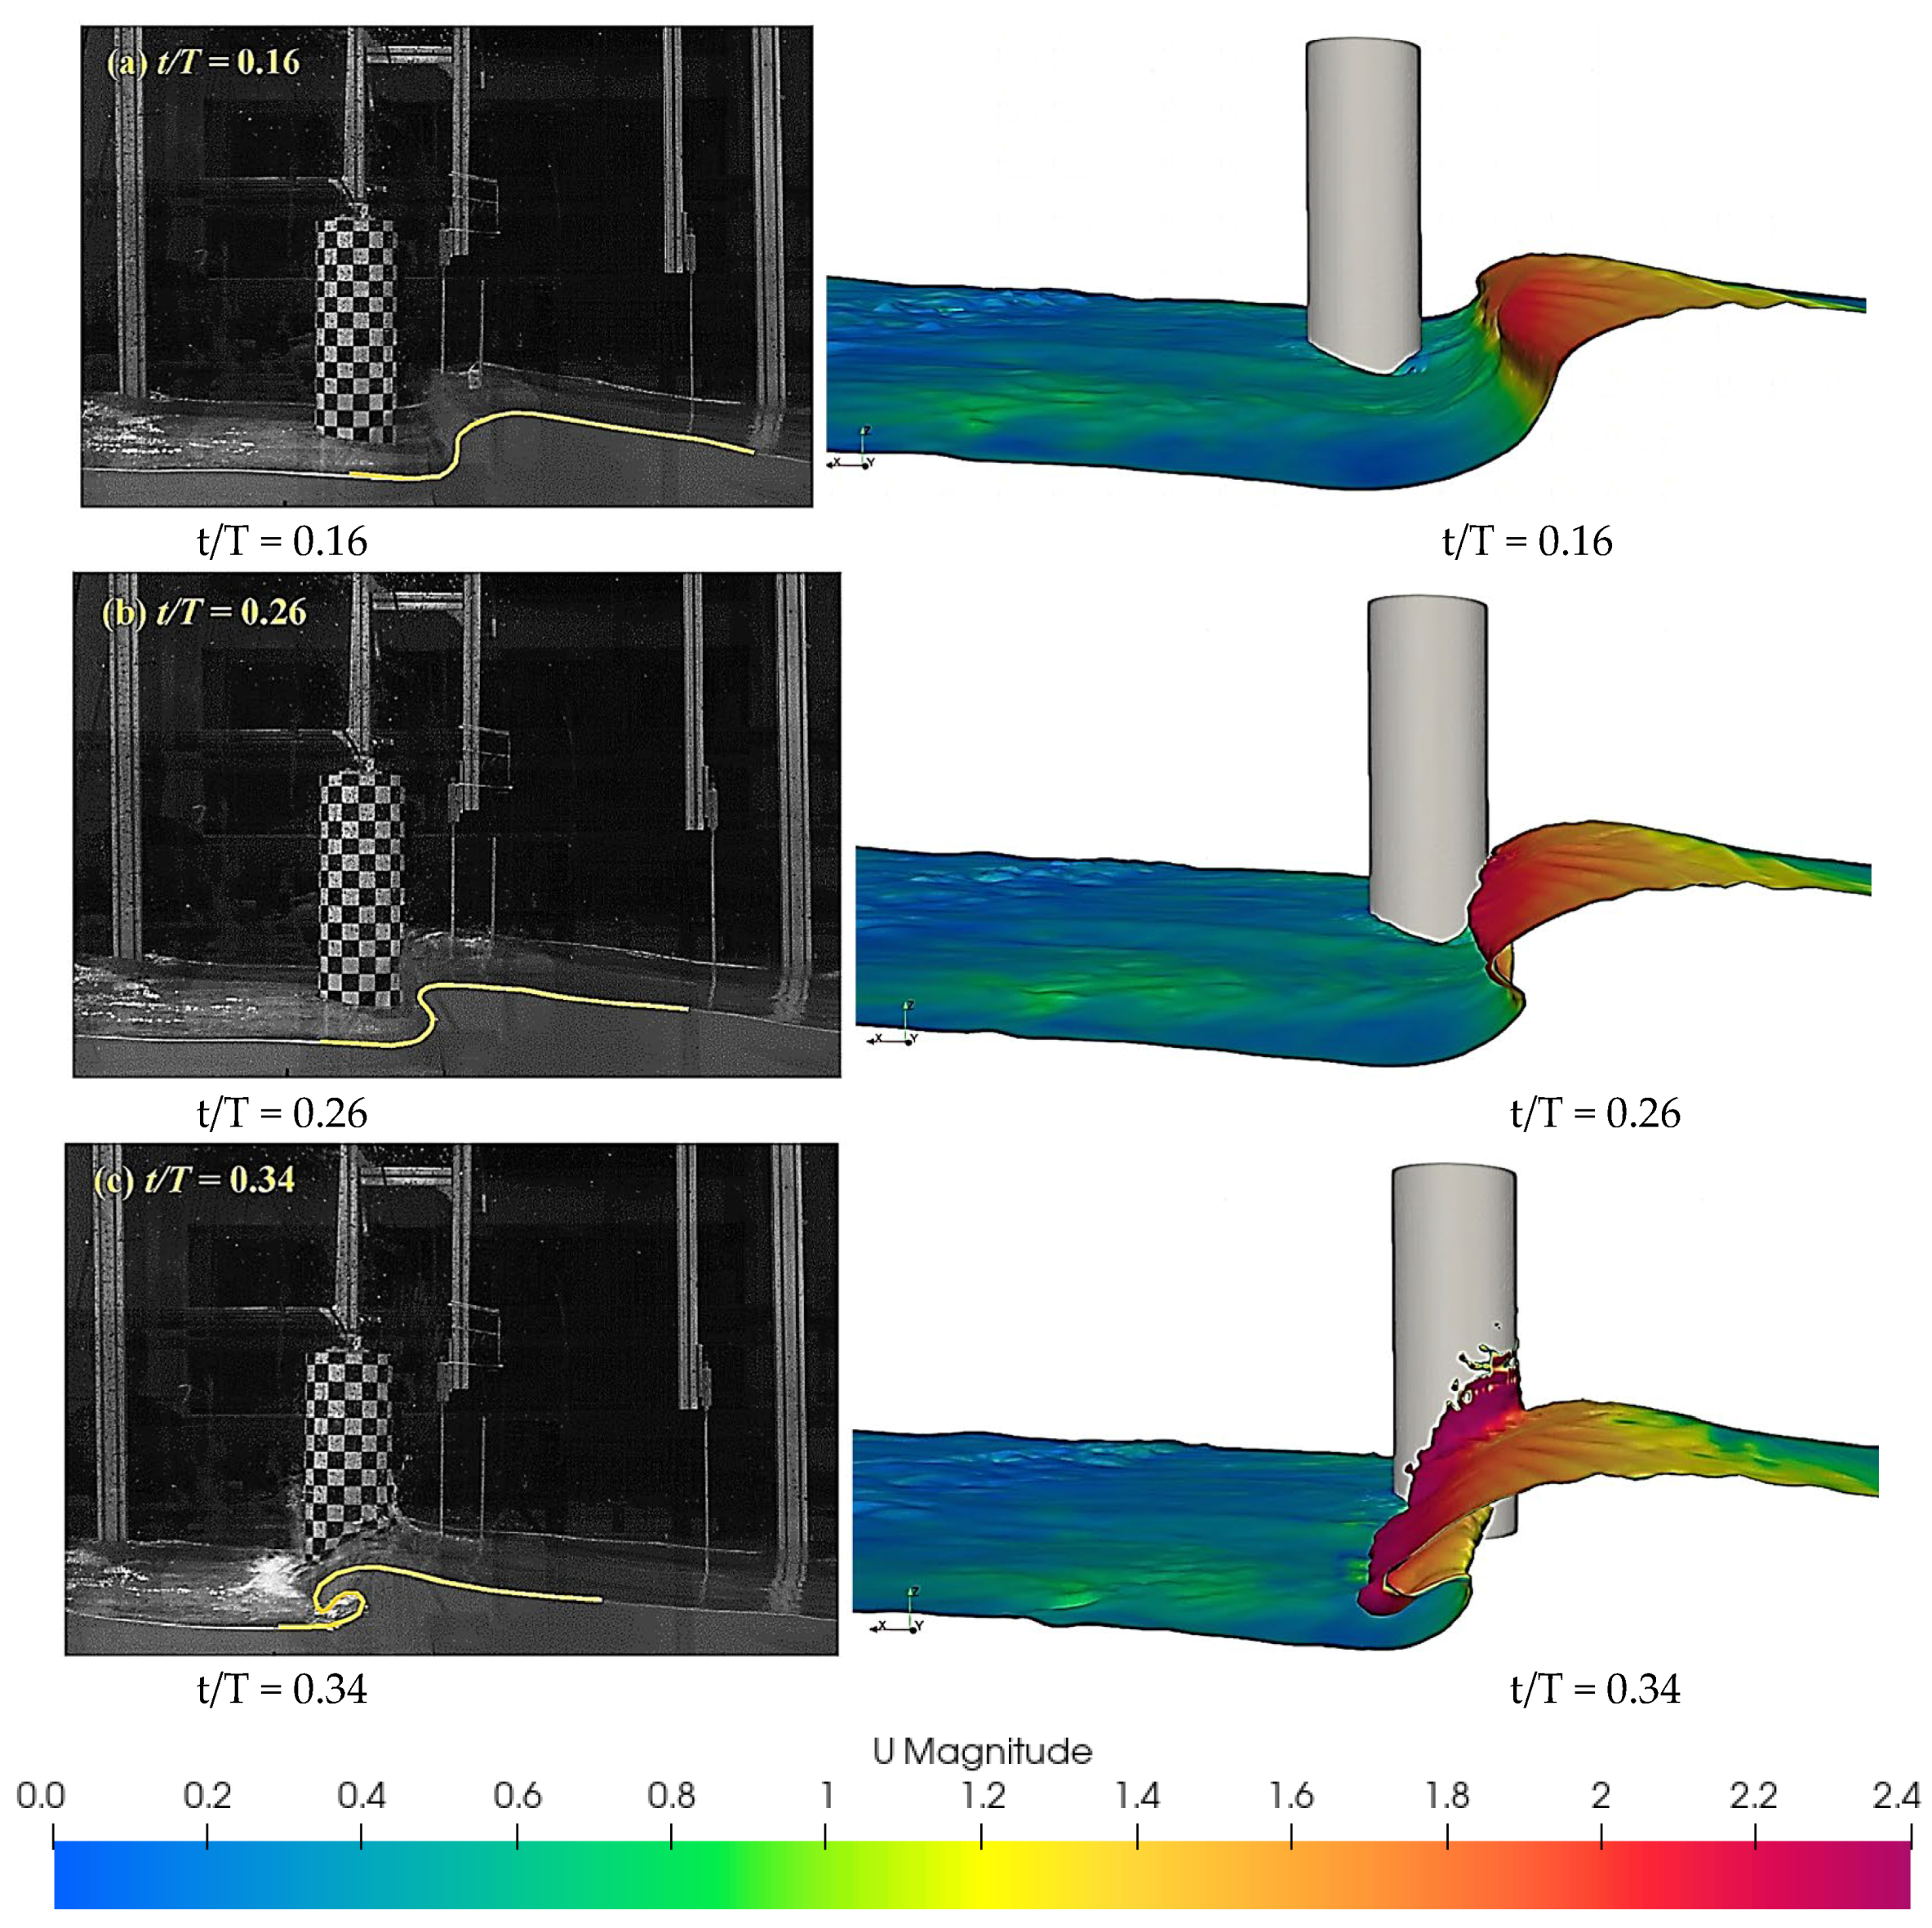
Figure 7.
Free surface velocity contour by experimental and numerical methods during wave slamming.
Figure 7.
Free surface velocity contour by experimental and numerical methods during wave slamming.
Figure 8.
Slamming pressures by numerical and experimental methods.
Figure 8.
Slamming pressures by numerical and experimental methods.
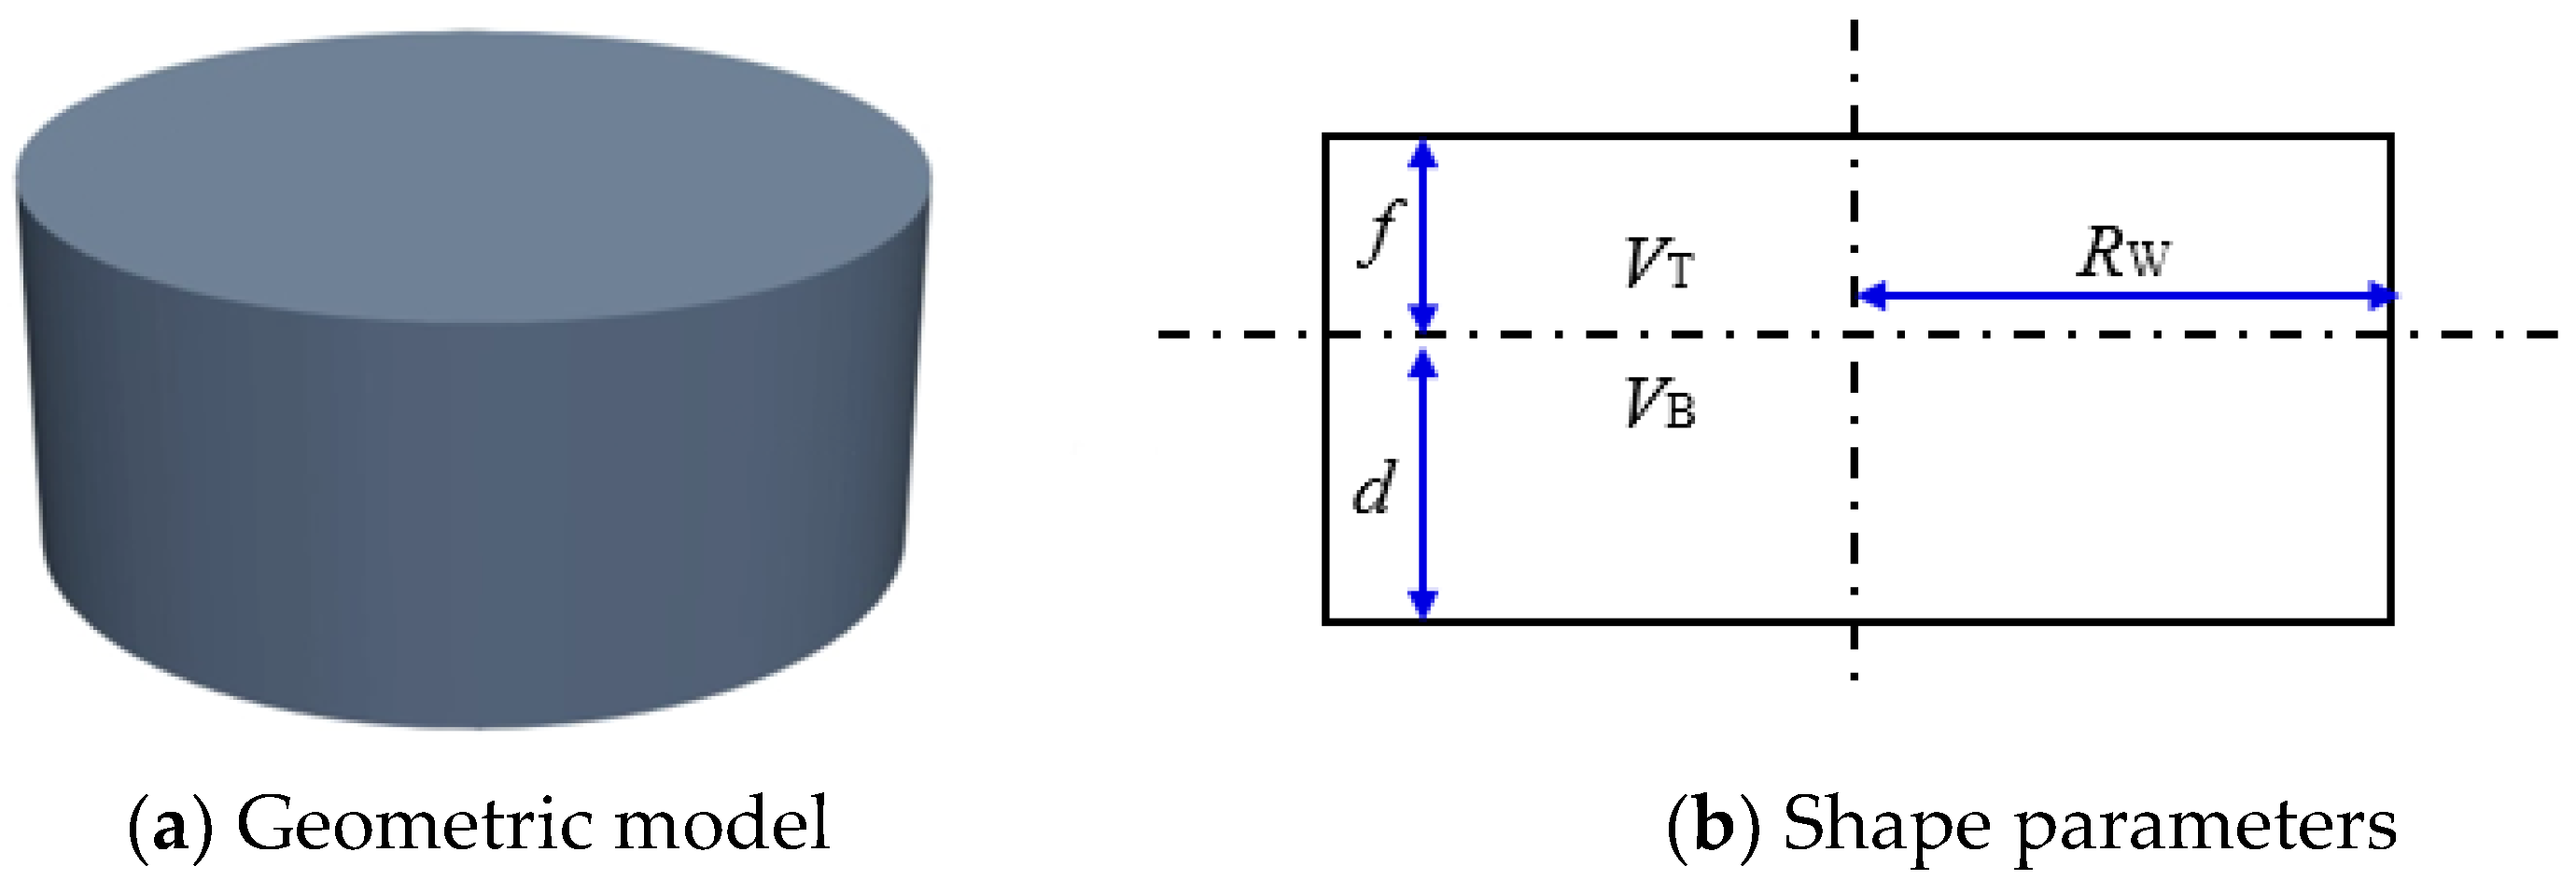
Figure 9.
Geometric model and shape parameters of the sandglass-type floating body.
Figure 9.
Geometric model and shape parameters of the sandglass-type floating body.
Figure 10.
Computational domain and numerical meshes of the sandglass-type model.
Figure 10.
Computational domain and numerical meshes of the sandglass-type model.
Figure 11.
Geometric model and shape parameters of the cylindrical model.
Figure 11.
Geometric model and shape parameters of the cylindrical model.
Figure 12.
Computational domain and numerical meshes of the cylindrical model.
Figure 12.
Computational domain and numerical meshes of the cylindrical model.
Figure 13.
Time histories of slamming pressure versus different meshes.
Figure 13.
Time histories of slamming pressure versus different meshes.
Figure 14.
Free surface velocity contour at classic moments for the sandglass-type model.
Figure 14.
Free surface velocity contour at classic moments for the sandglass-type model.
Figure 15.
Free surface velocity contour at classic moments for the cylindrical model.
Figure 15.
Free surface velocity contour at classic moments for the cylindrical model.
Figure 16.
Velocity vector along the central longitudinal plane at classic moments for the sandglass-type model.
Figure 16.
Velocity vector along the central longitudinal plane at classic moments for the sandglass-type model.
Figure 17.
Velocity vector along the central longitudinal plane at classic moments for the cylindrical model.
Figure 17.
Velocity vector along the central longitudinal plane at classic moments for the cylindrical model.
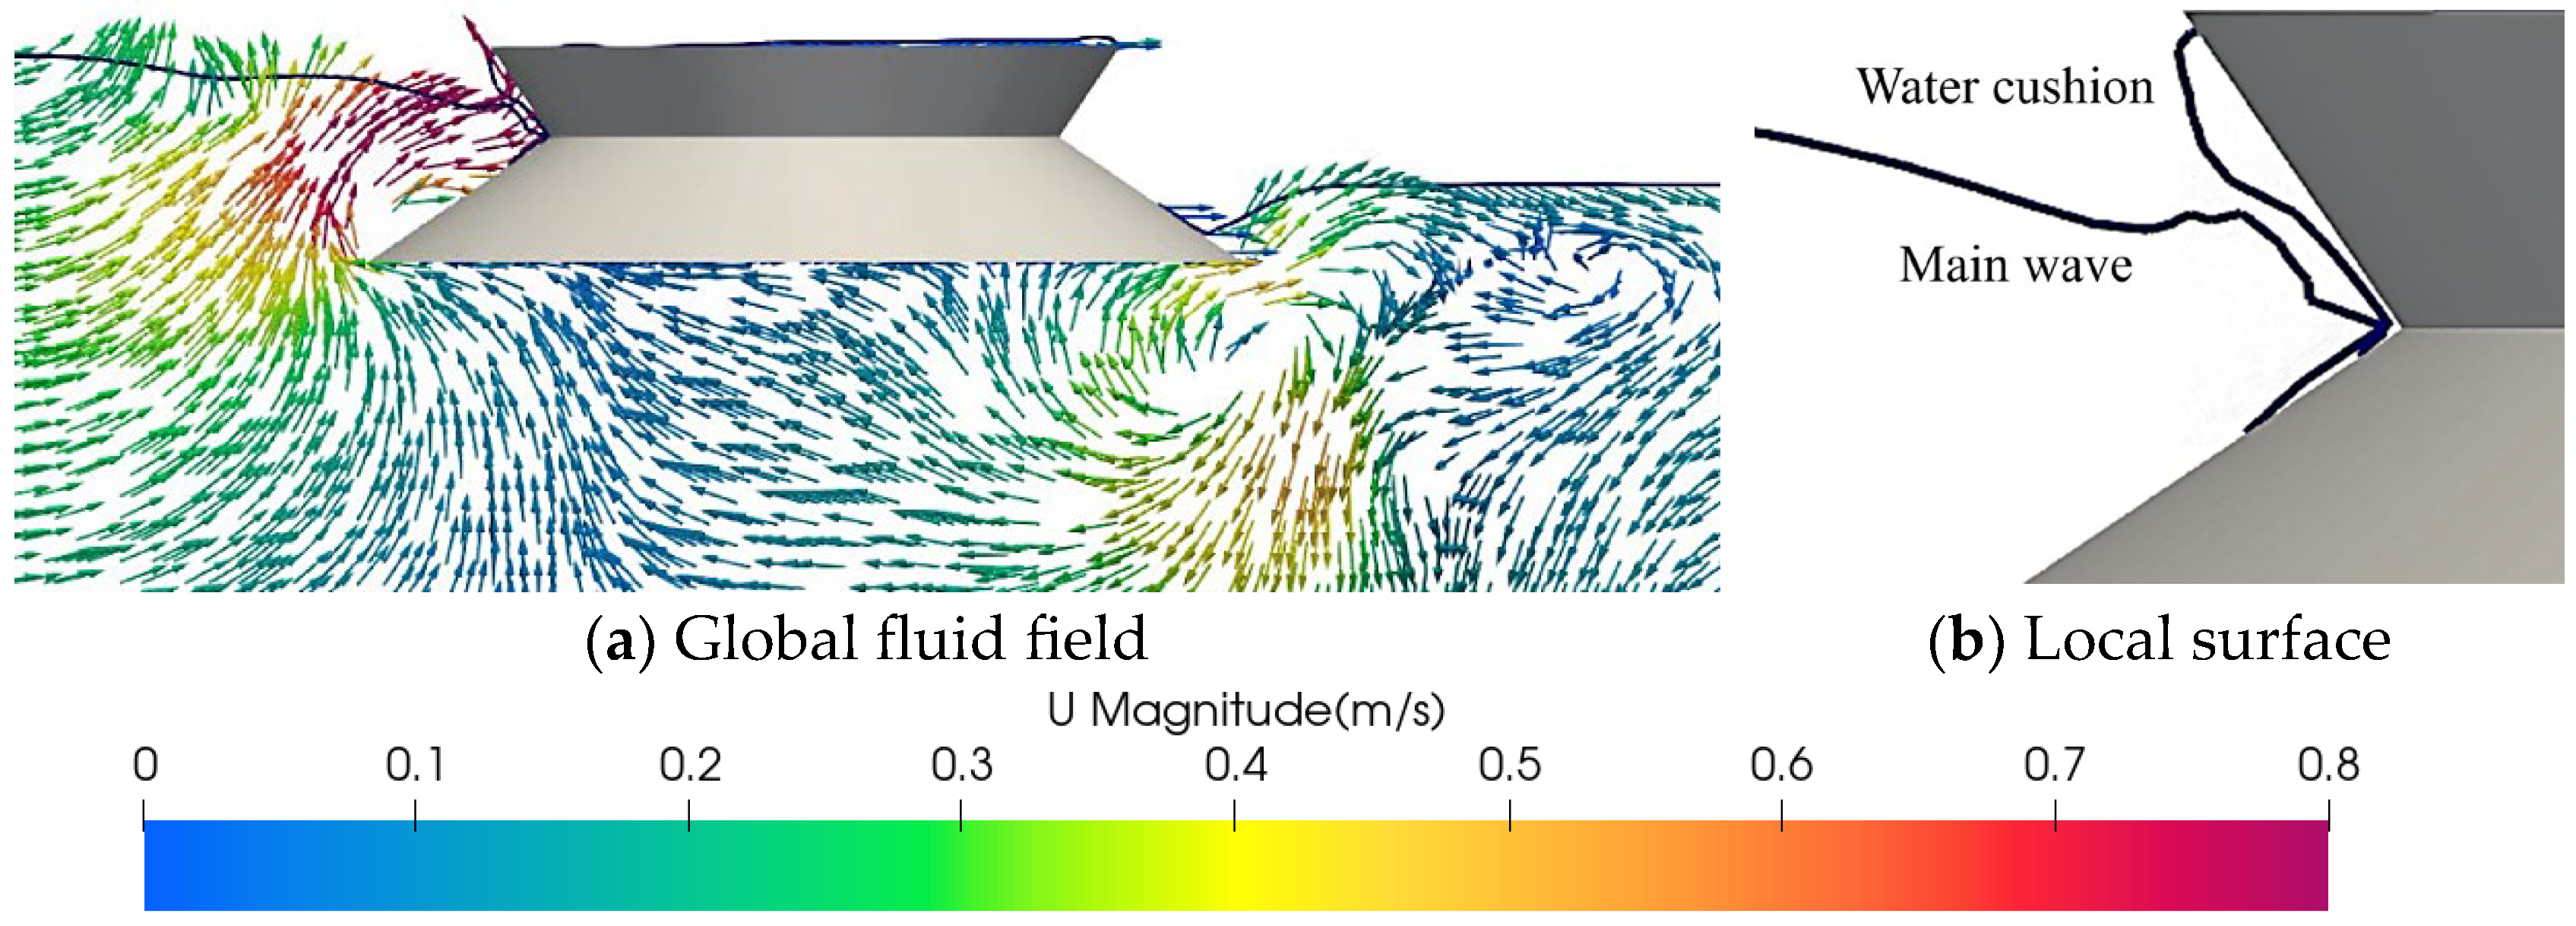
Figure 18.
Velocity vector along the central longitudinal plane and local wave surface including water cushion.
Figure 18.
Velocity vector along the central longitudinal plane and local wave surface including water cushion.
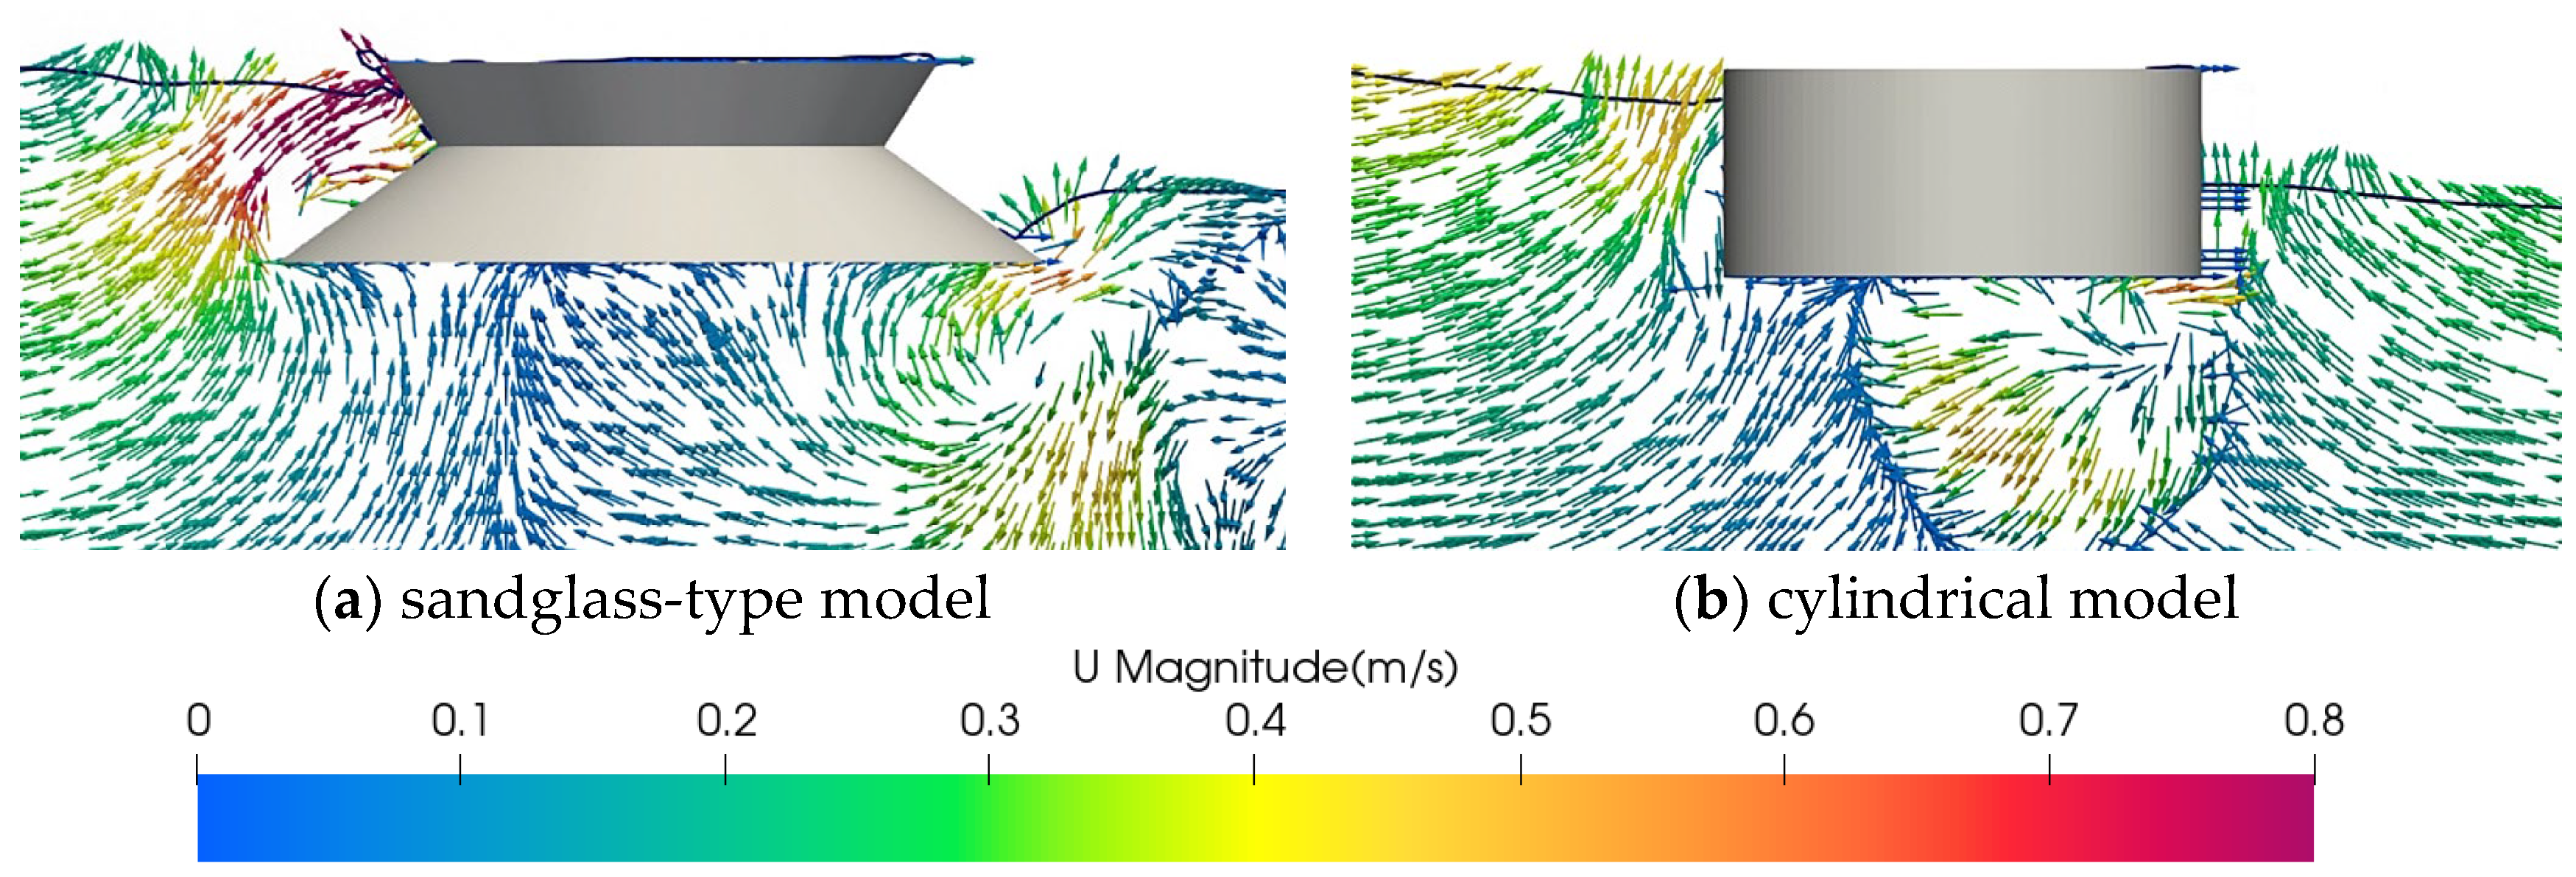
Figure 19.
Velocity vector along the central longitudinal plane during the slamming of main wave for two models.
Figure 19.
Velocity vector along the central longitudinal plane during the slamming of main wave for two models.
Figure 20.
Wave contour and velocity vector during wave reflection and diffraction for the sandglass-type model.
Figure 20.
Wave contour and velocity vector during wave reflection and diffraction for the sandglass-type model.
Figure 21.
Wave contour and velocity vector during wave reflection and diffraction for the cylindrical model.
Figure 21.
Wave contour and velocity vector during wave reflection and diffraction for the cylindrical model.
Figure 22.
Phenomenon of rooster tail caused by the wave convergence for the sandglass-type model.
Figure 22.
Phenomenon of rooster tail caused by the wave convergence for the sandglass-type model.
Figure 23.
Phenomenon of side wave due to the gravity for the sandglass-type model.
Figure 23.
Phenomenon of side wave due to the gravity for the sandglass-type model.
Figure 24.
Phenomenon of rooster tail caused by the wave convergence for the cylindrical model.
Figure 24.
Phenomenon of rooster tail caused by the wave convergence for the cylindrical model.
Figure 25.
Phenomenon of side wave due to the gravity for the cylindrical model.
Figure 25.
Phenomenon of side wave due to the gravity for the cylindrical model.
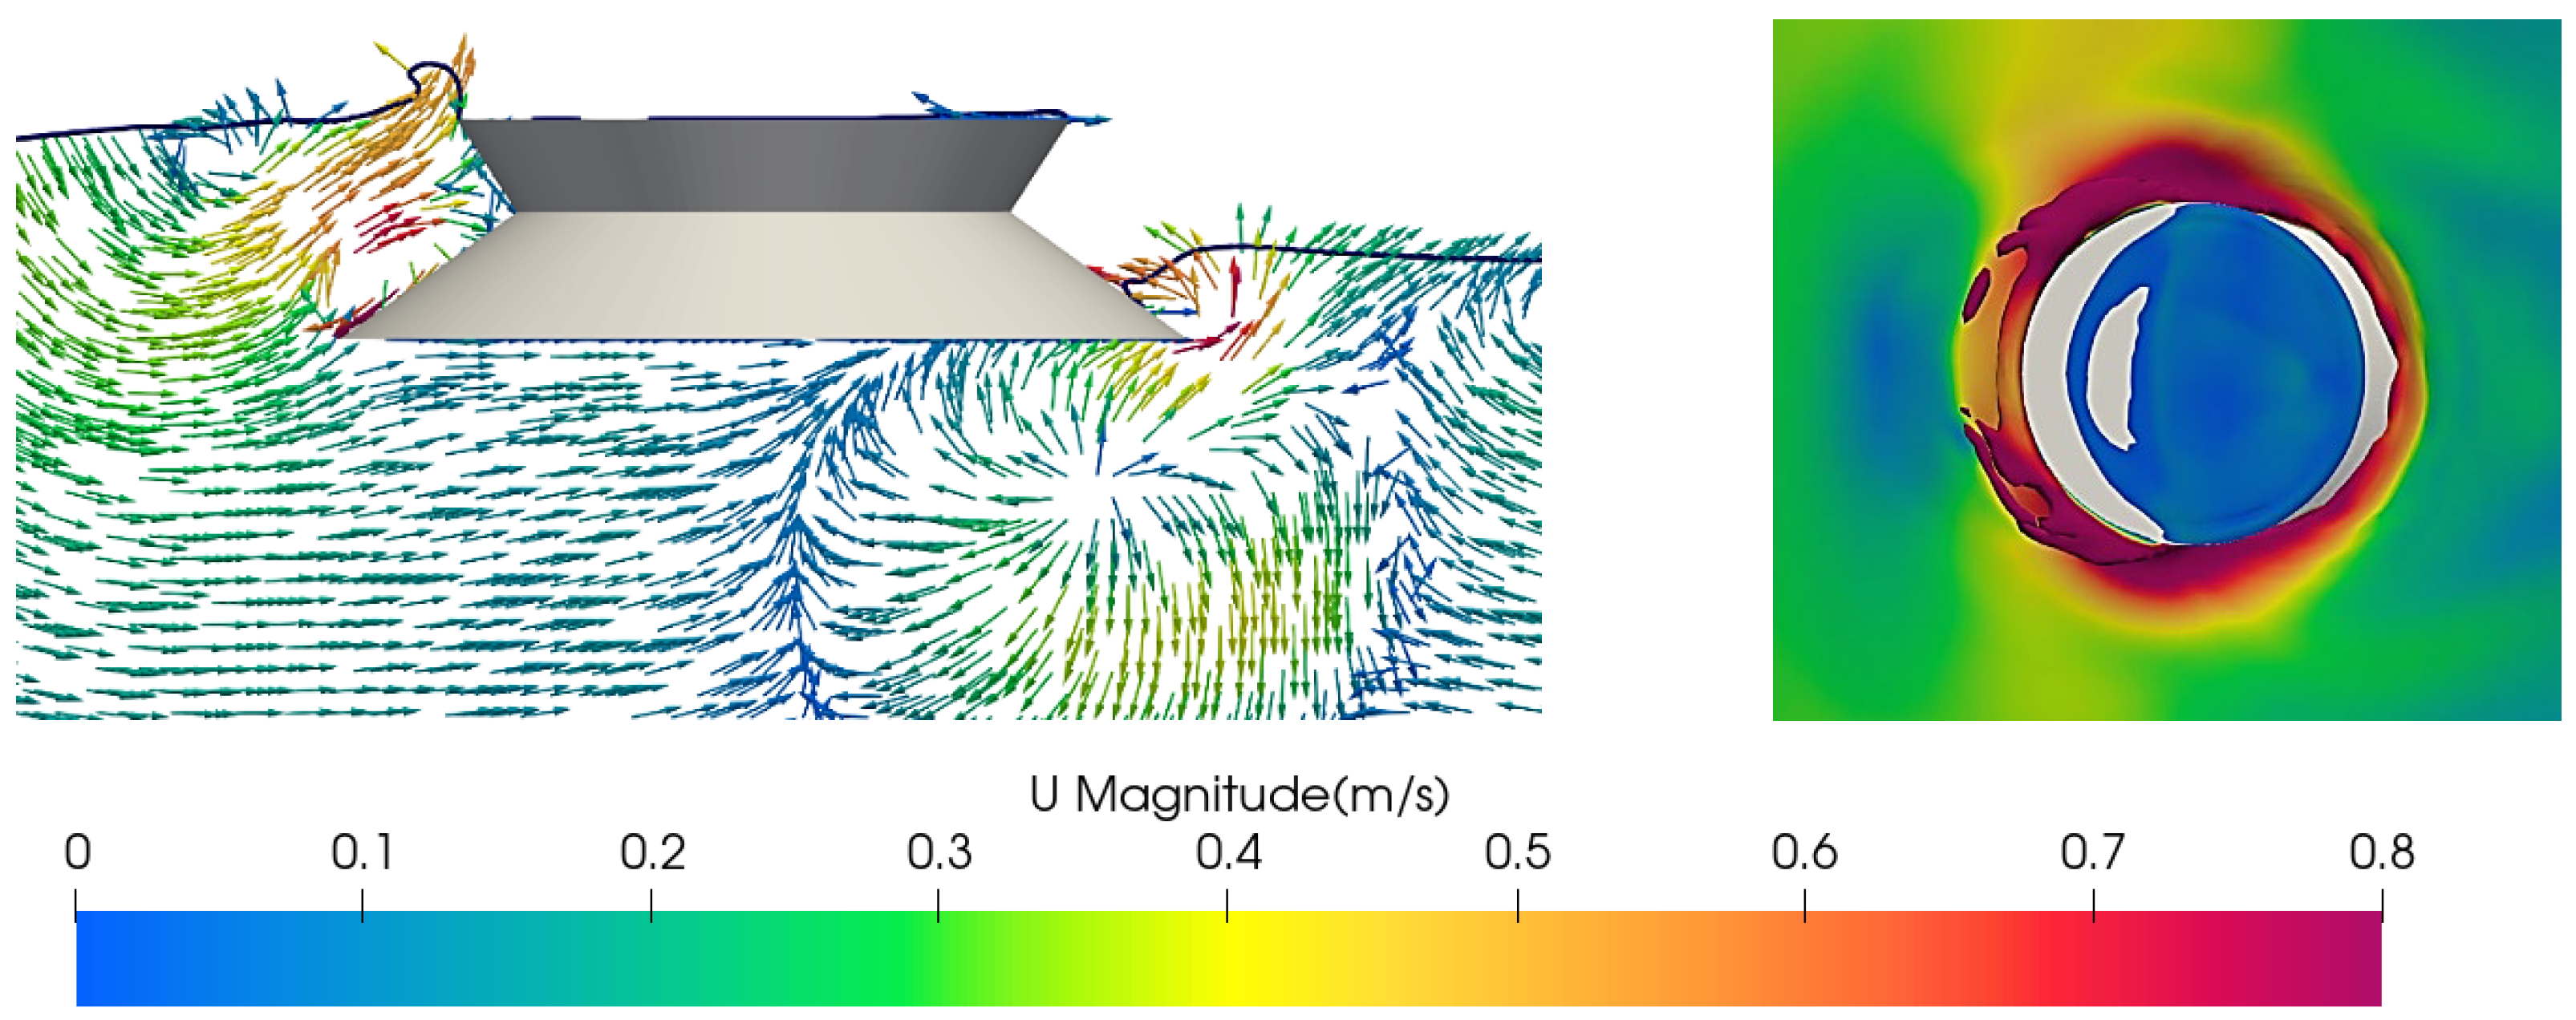
Figure 26.
Reflux along bottom and wave lifting for the sandglass-type model.
Figure 26.
Reflux along bottom and wave lifting for the sandglass-type model.
Figure 27.
Reflux along lower side and water tongue for the sandglass-type model.
Figure 27.
Reflux along lower side and water tongue for the sandglass-type model.
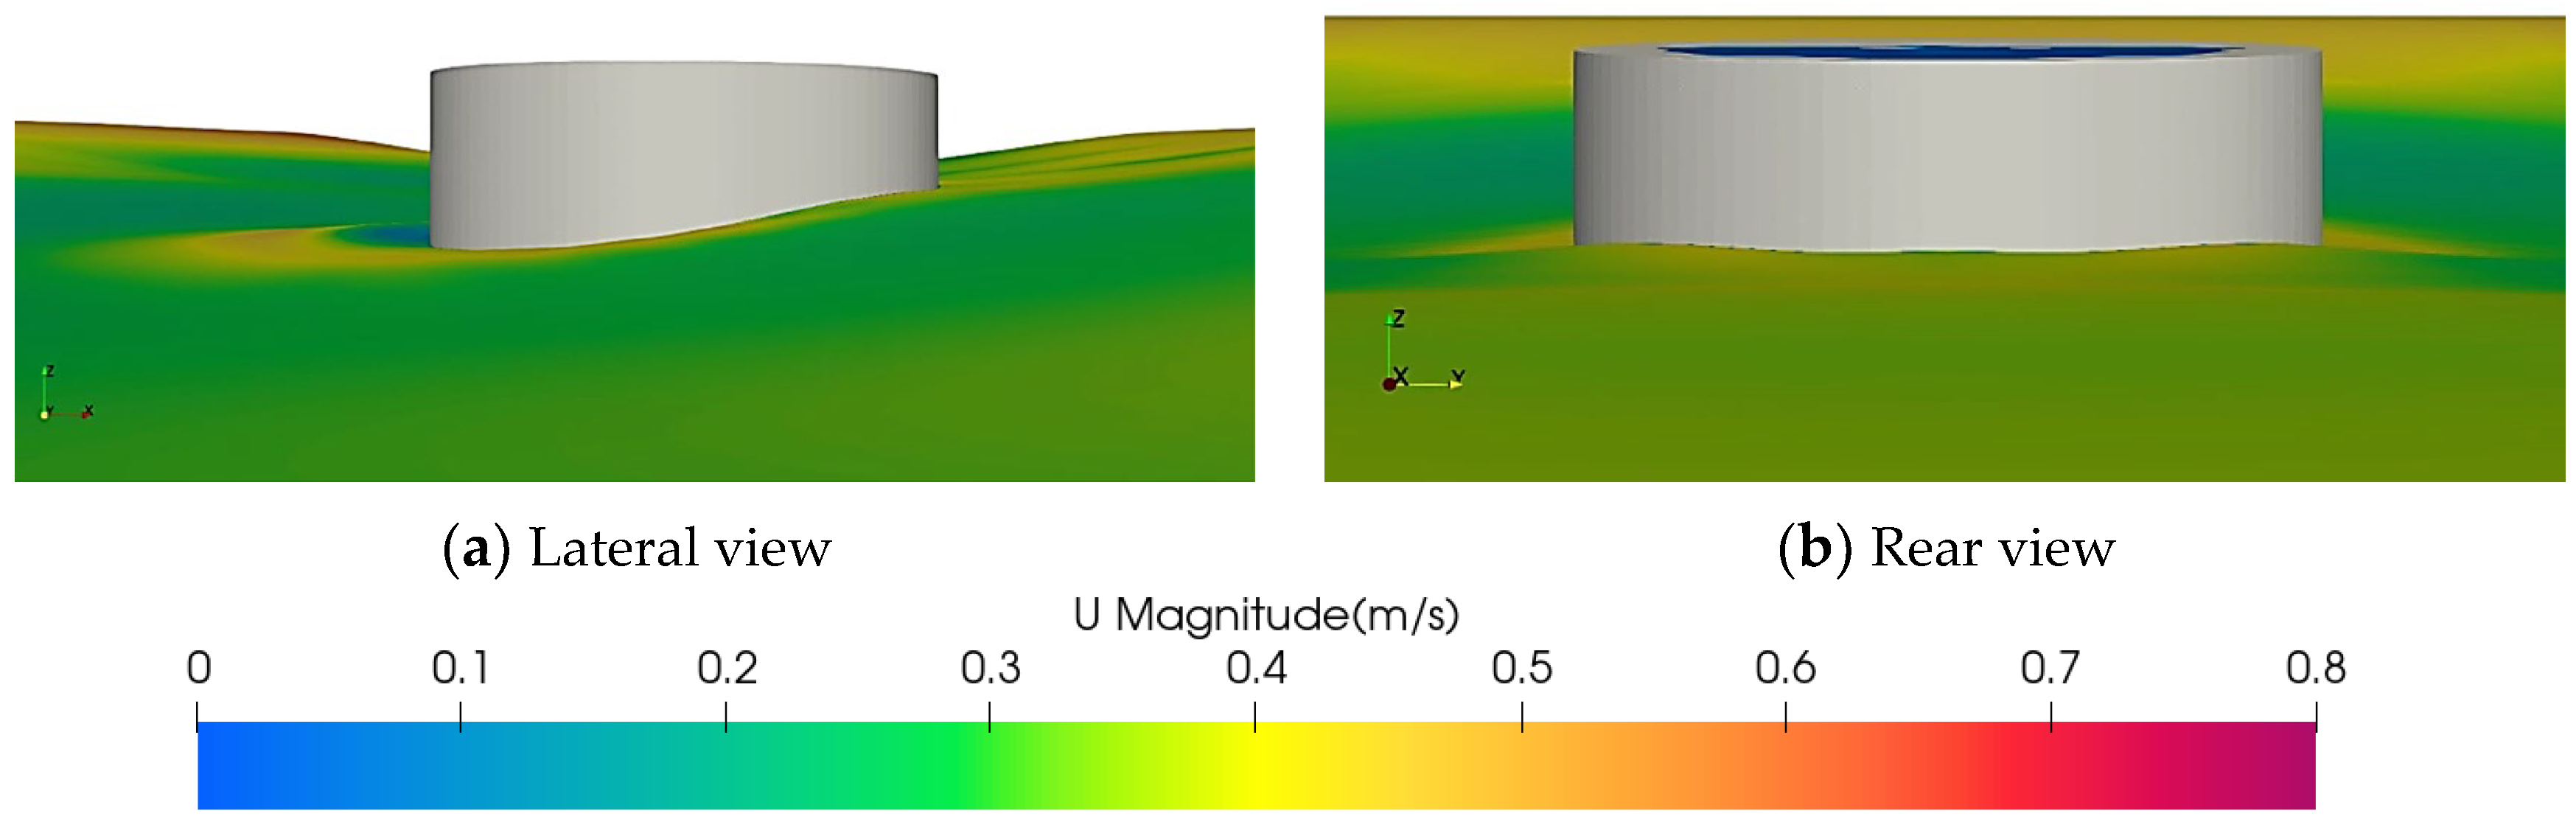
Figure 28.
Reflux along bottom and wave lifting for the cylindrical model.
Figure 28.
Reflux along bottom and wave lifting for the cylindrical model.
Figure 29.
Evolution of pressure distribution during wave slamming for the sandglass-type model, at the front view.
Figure 29.
Evolution of pressure distribution during wave slamming for the sandglass-type model, at the front view.
Figure 30.
Evolution of pressure distribution during wave slamming for the cylindrical model, at the front view.
Figure 30.
Evolution of pressure distribution during wave slamming for the cylindrical model, at the front view.
Figure 31.
Arrangement of the monitoring points and the related coordinates for the sandglass-type model.
Figure 31.
Arrangement of the monitoring points and the related coordinates for the sandglass-type model.
Figure 32.
Arrangement of the monitoring points and the related coordinates for the cylindrical model.
Figure 32.
Arrangement of the monitoring points and the related coordinates for the cylindrical model.
Figure 33.
Time histories of slamming pressure on various monitoring points for the sandglass-type model.
Figure 33.
Time histories of slamming pressure on various monitoring points for the sandglass-type model.
Figure 34.
Velocity vector and wave shape along the central longitudinal plane at different moments.
Figure 34.
Velocity vector and wave shape along the central longitudinal plane at different moments.
Figure 35.
Flow characteristic at the moment corresponding to the negative pressure at probe 6.
Figure 35.
Flow characteristic at the moment corresponding to the negative pressure at probe 6.
Figure 36.
Time histories of slamming pressure on various monitoring points for the cylindrical model.
Figure 36.
Time histories of slamming pressure on various monitoring points for the cylindrical model.
Figure 37.
Time-variant characteristic of classic slamming pressure for the sandglass-type model.
Figure 37.
Time-variant characteristic of classic slamming pressure for the sandglass-type model.
Figure 38.
Time histories of slamming pressure at probe 1 under the short-wave condition.
Figure 38.
Time histories of slamming pressure at probe 1 under the short-wave condition.
Figure 39.
Wave surface at classic moments under the short-wave condition.
Figure 39.
Wave surface at classic moments under the short-wave condition.
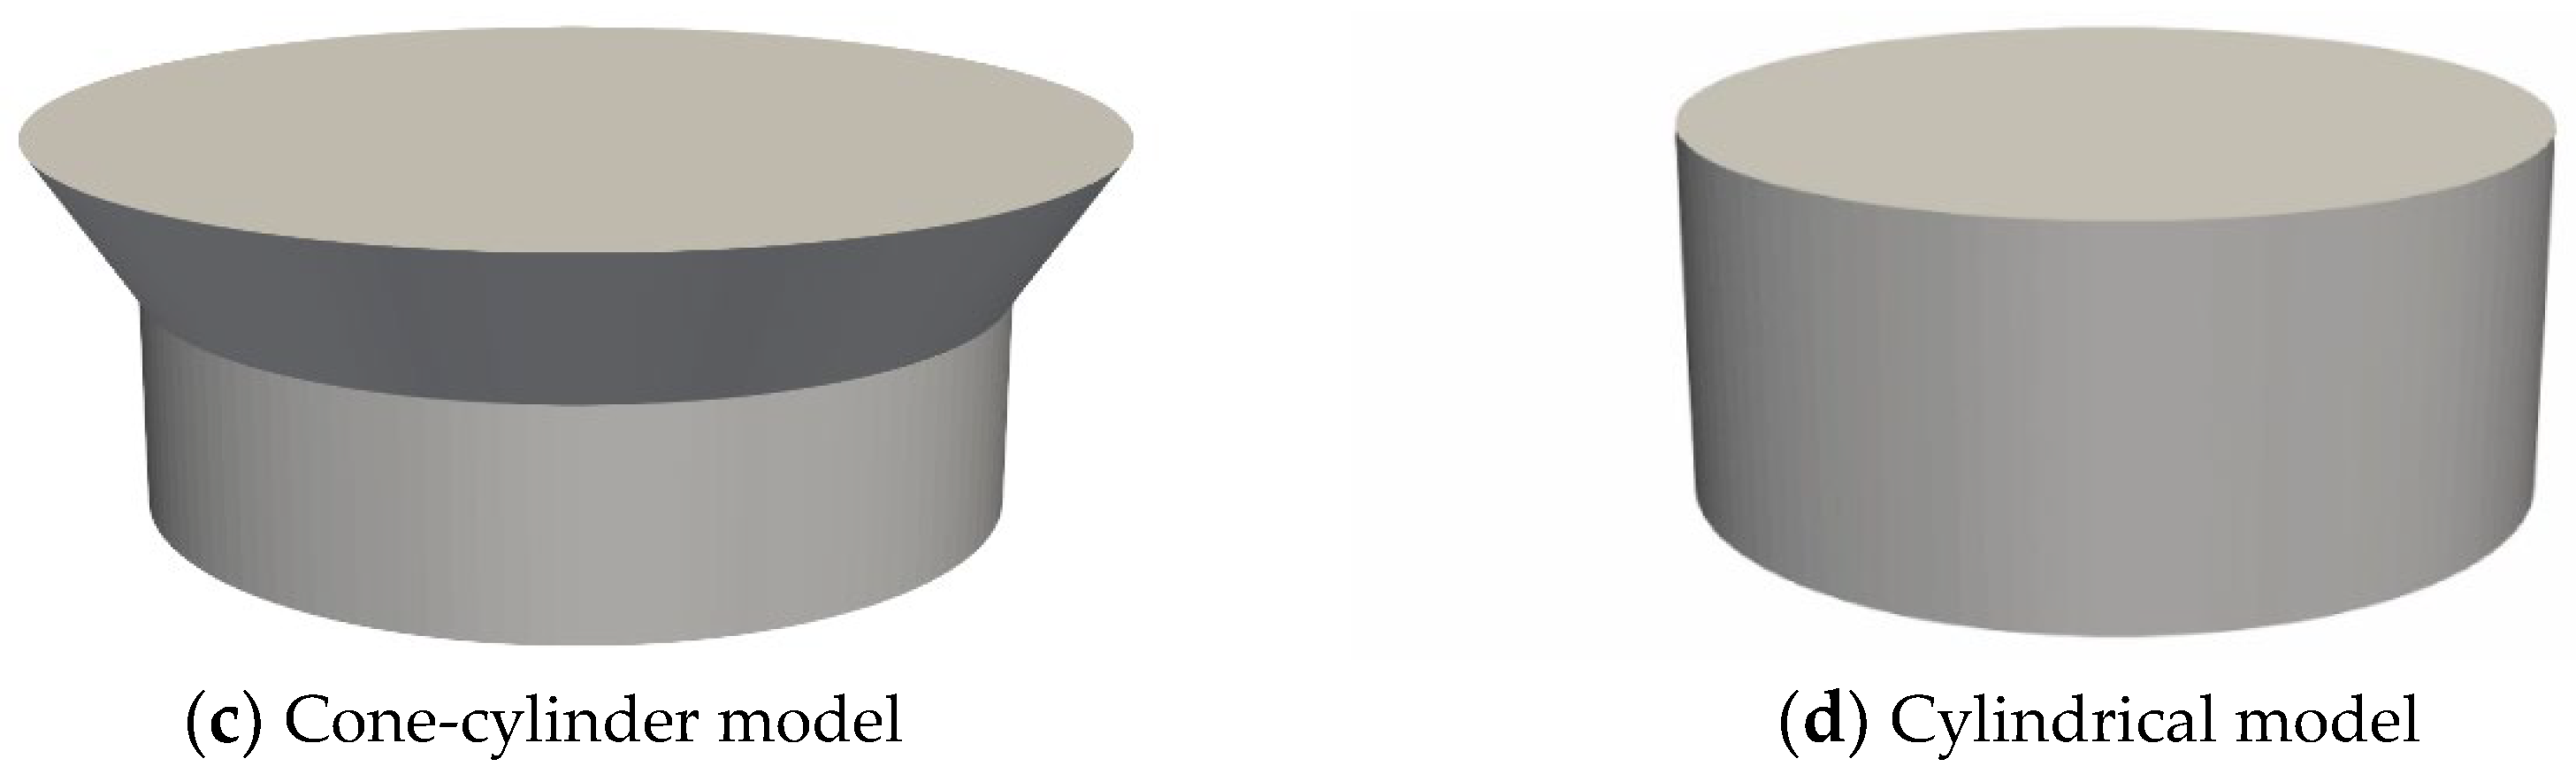
Figure 40.
Geometrical model of four classic floating models.
Figure 40.
Geometrical model of four classic floating models.
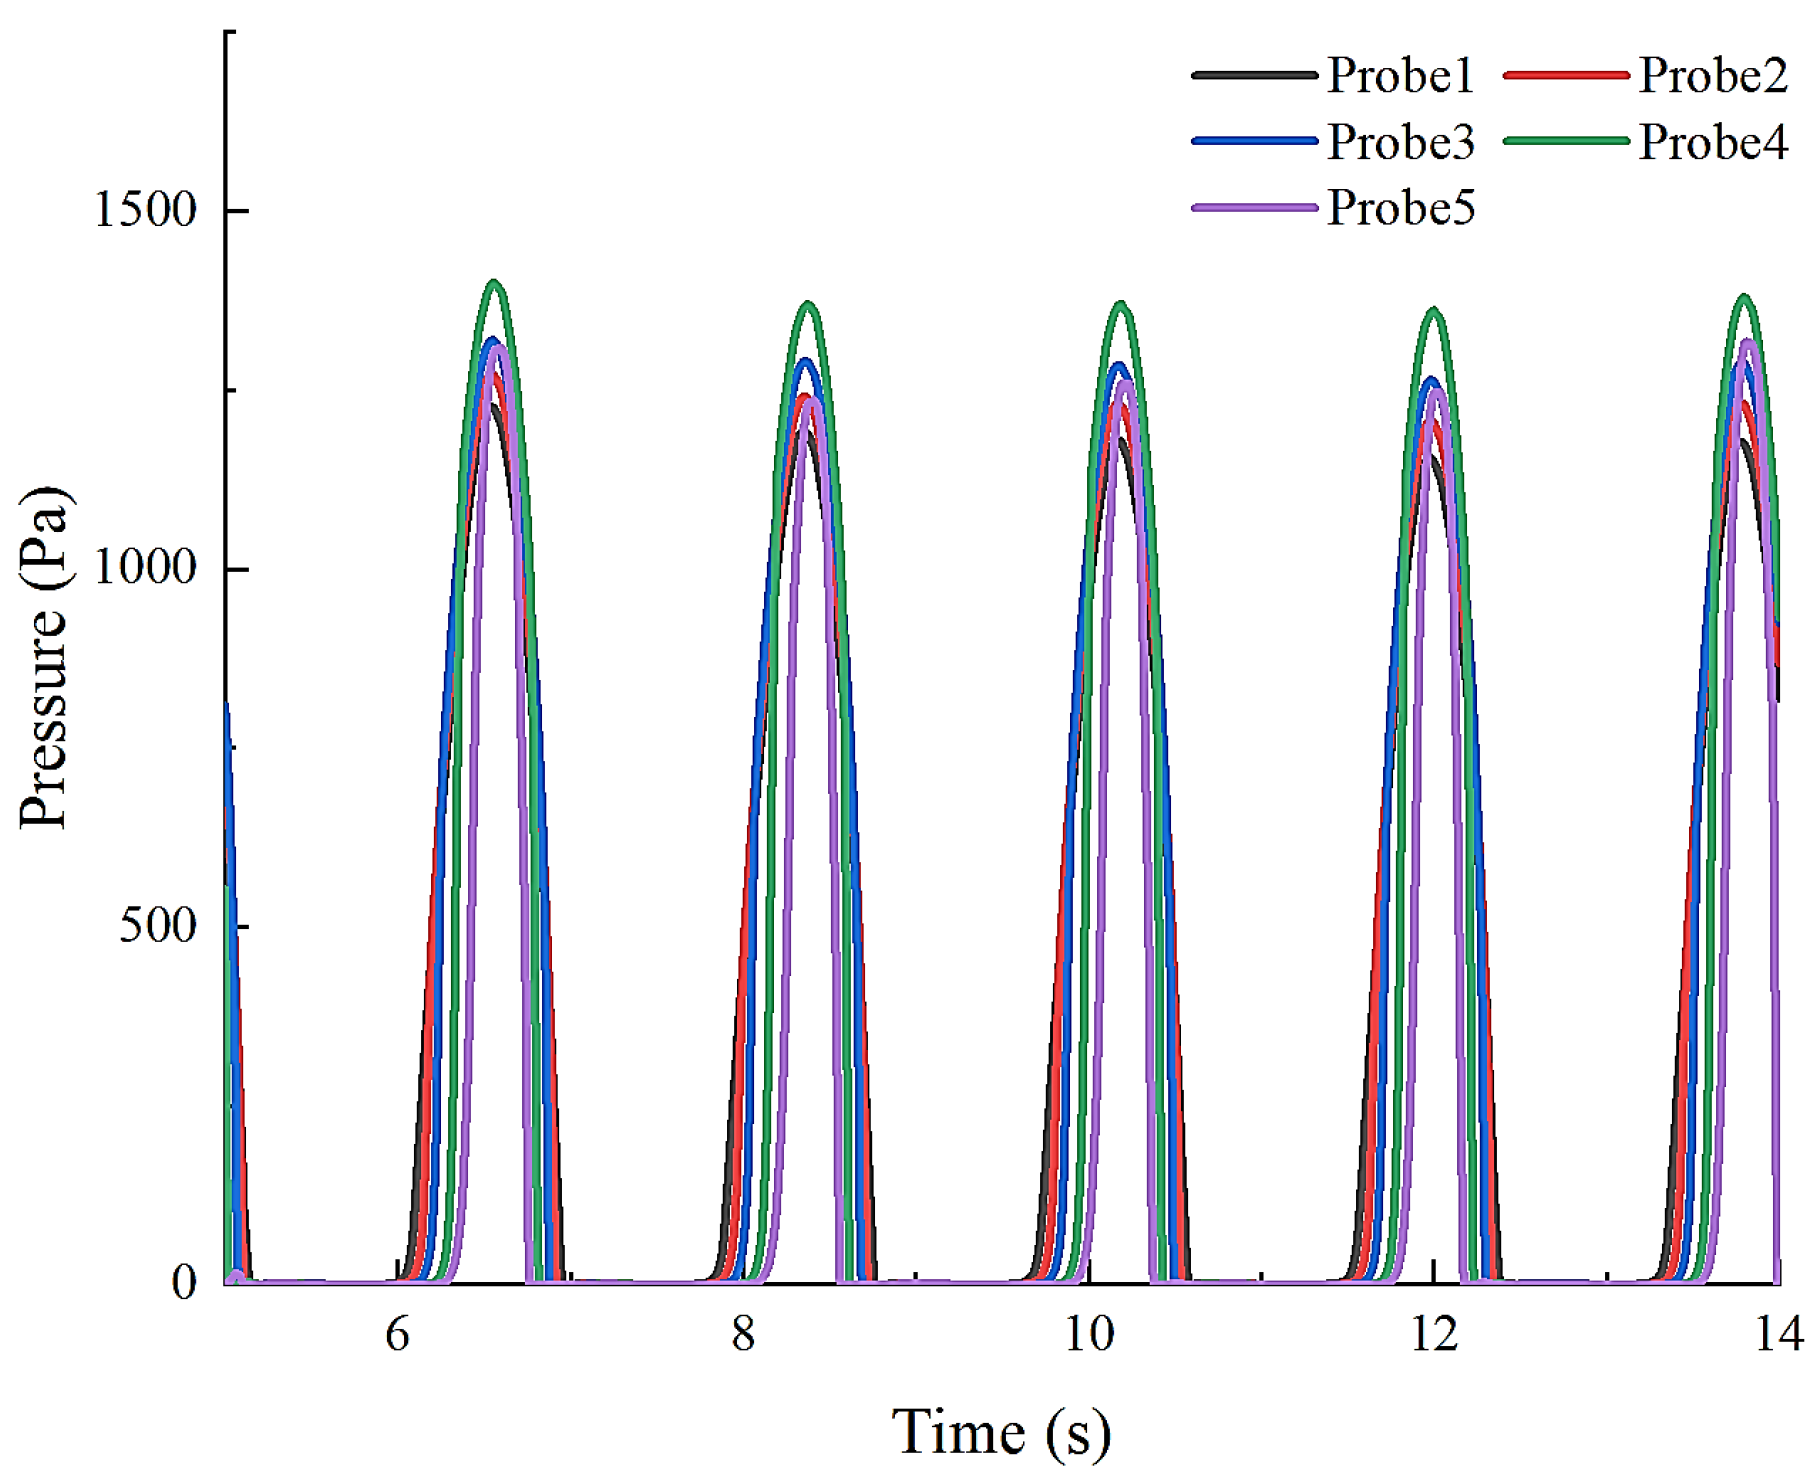
Figure 41.
Time histories of slamming pressure at probe 1 under different shapes.
Figure 41.
Time histories of slamming pressure at probe 1 under different shapes.
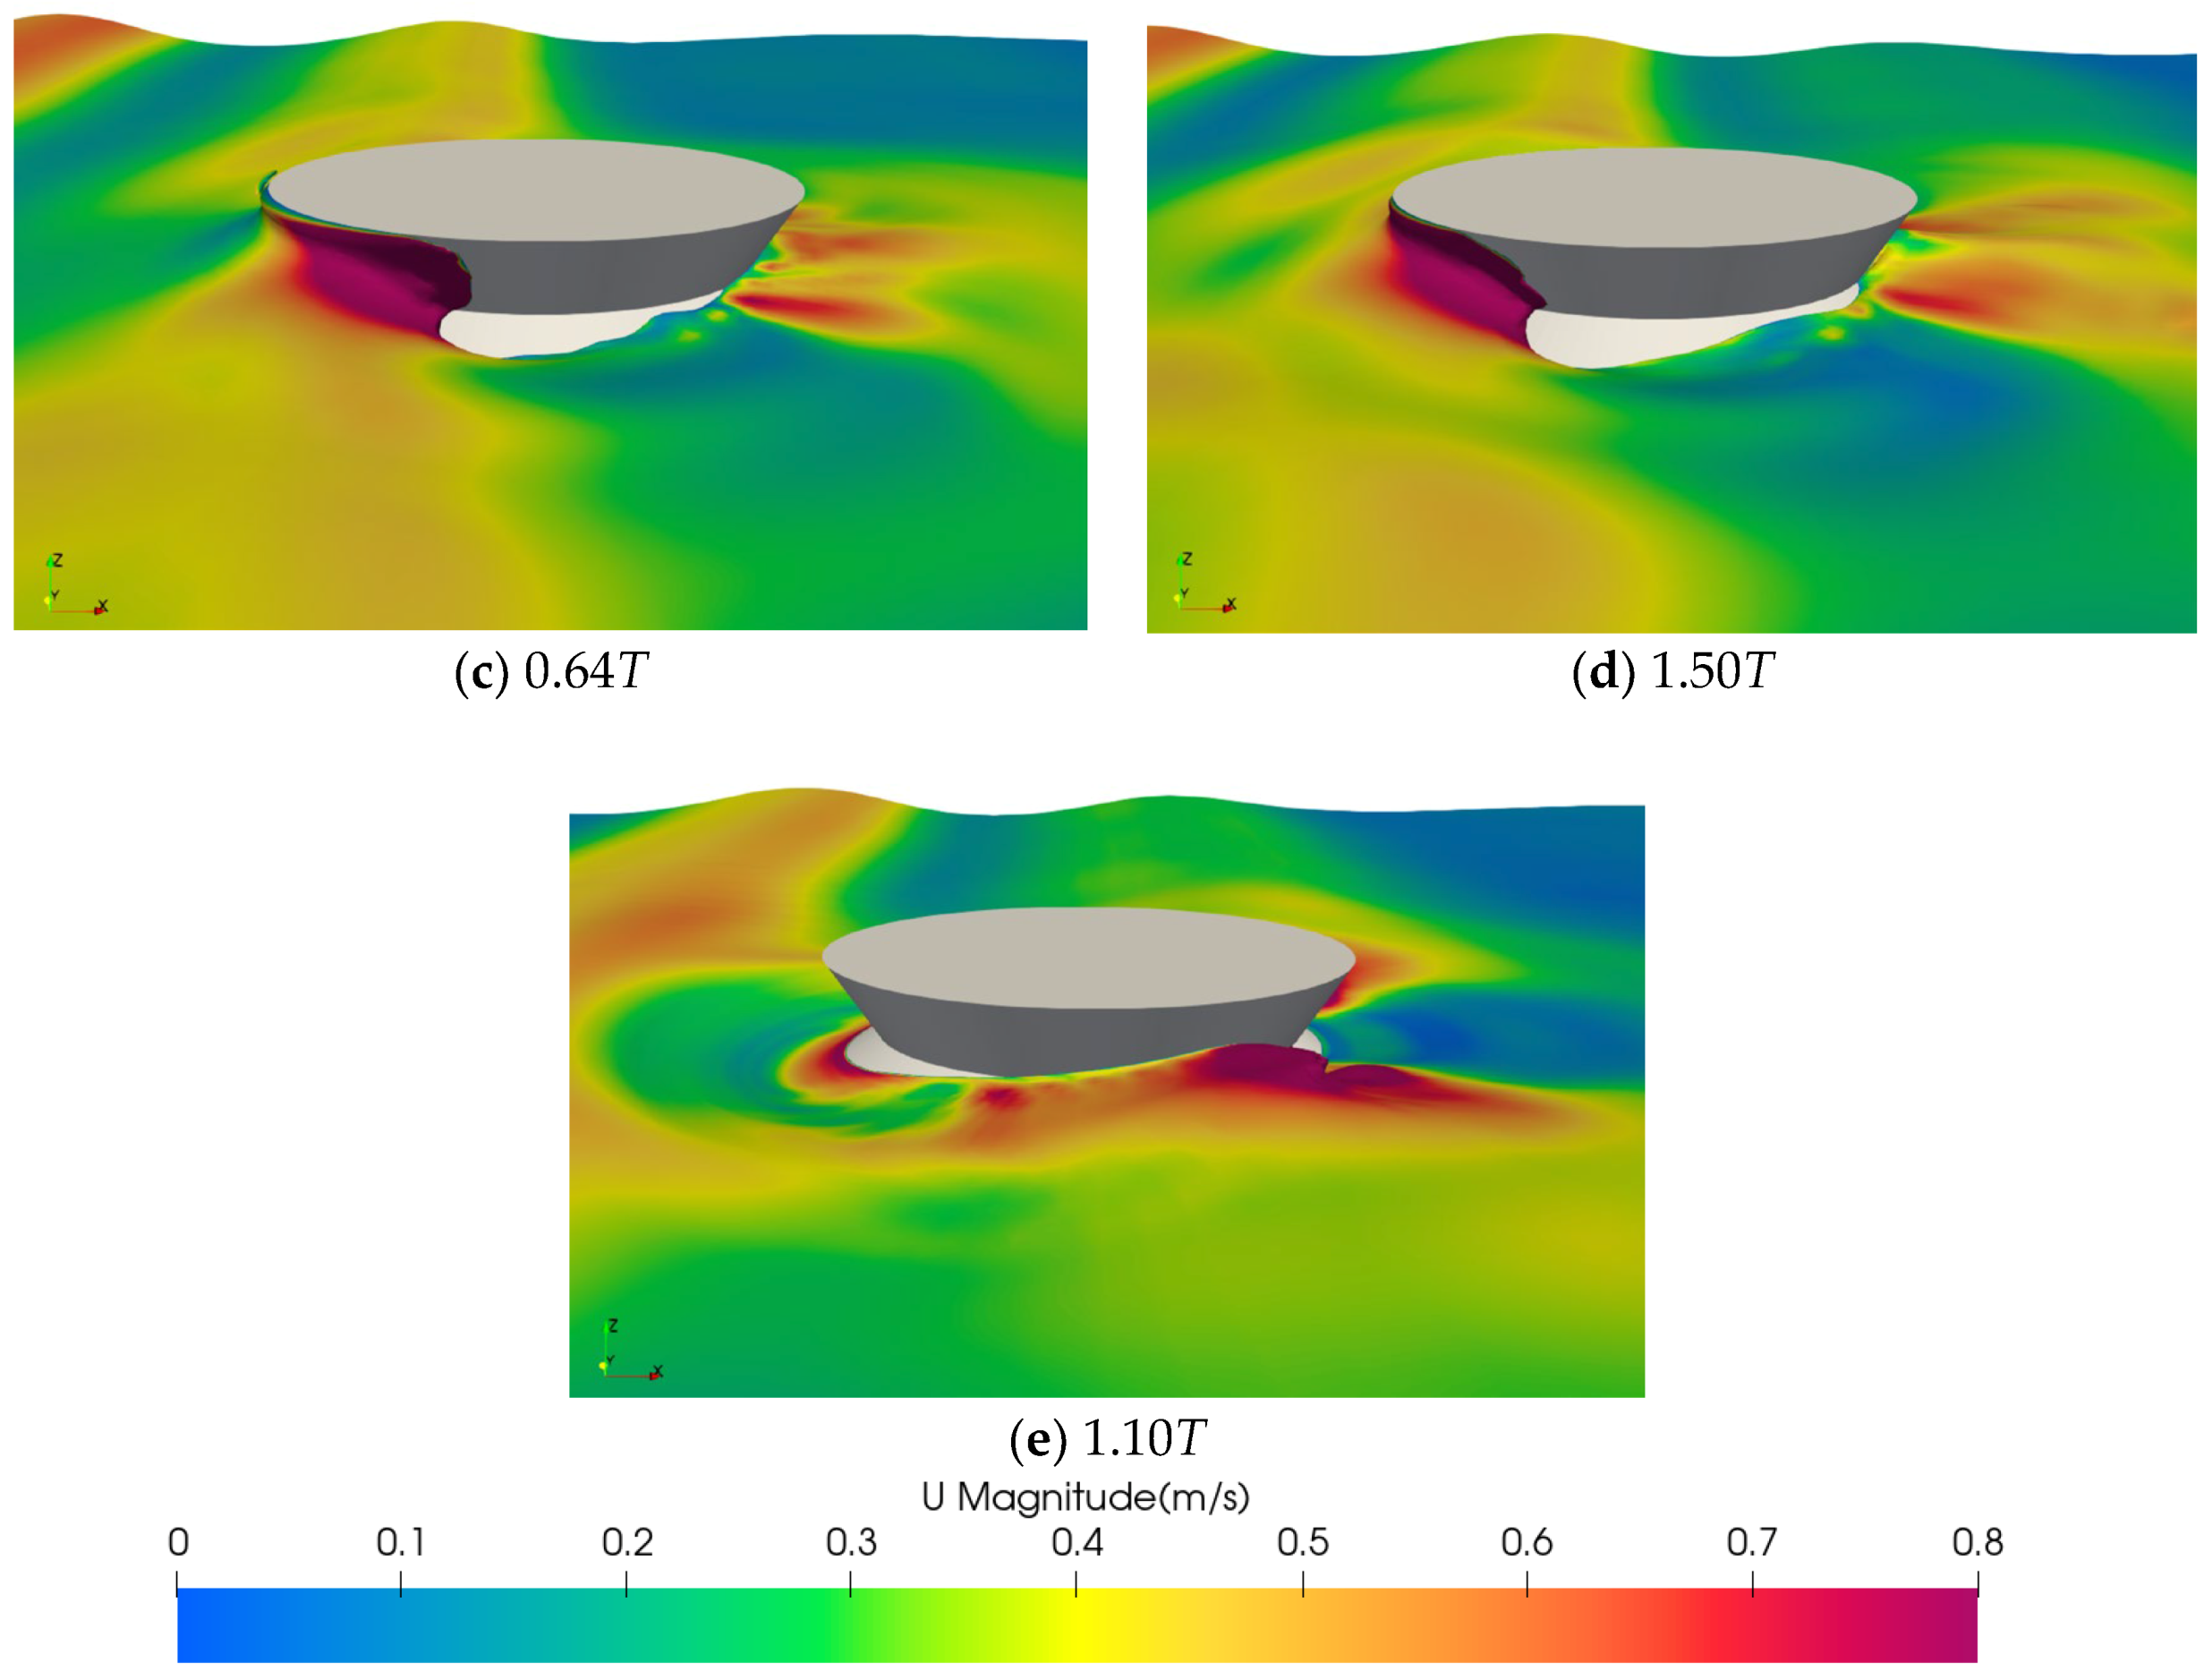
Figure 42.
Free surface and velocity contour at classic moments for the cone-cylinder model.
Figure 42.
Free surface and velocity contour at classic moments for the cone-cylinder model.
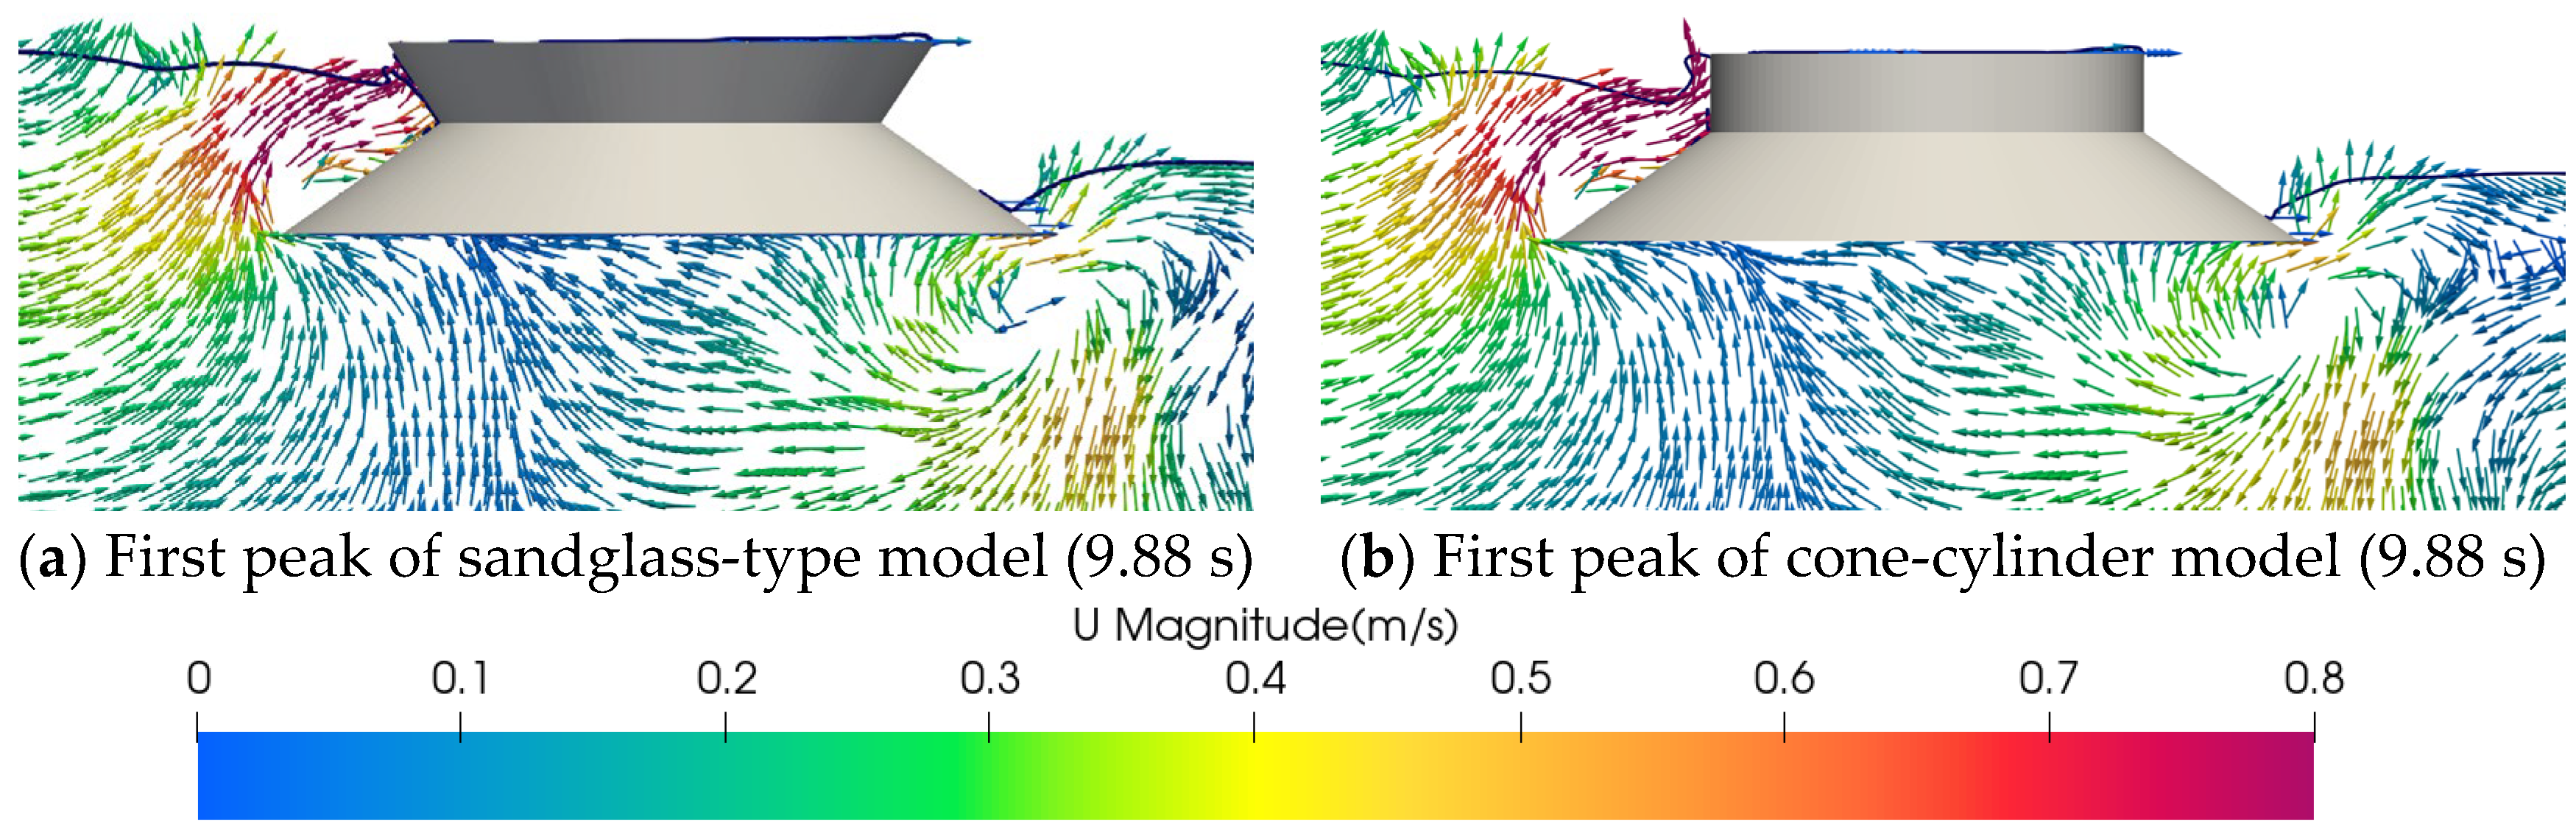
Figure 43.
Velocity vector along the central longitudinal plane at first peak of the sandglass-type and cone-cylinder floating bodies.
Figure 43.
Velocity vector along the central longitudinal plane at first peak of the sandglass-type and cone-cylinder floating bodies.
Figure 44.
Free surface velocity contour at second peak of the sandglass-type model and cone-cylinder model.
Figure 44.
Free surface velocity contour at second peak of the sandglass-type model and cone-cylinder model.
Table 1.
Main dimensions of the experimental sandglass-type model.
Table 1.
Main dimensions of the experimental sandglass-type model.
| | Unit | Value |
|---|
| Radius of upper deck | mm | 563.31 |
| Freeboard | mm | 285.71 |
| Radius of waterline plane | mm | 374.29 |
| Draught | mm | 188.11 |
| Radius of lower bottom | mm | 642.94 |
| Height between COG and bottom | mm | 120.00 |
Table 2.
Mesh information in convergence study of Case 1.
Table 2.
Mesh information in convergence study of Case 1.
| Mesh | N | Δx (m) | Δy (m) | Δz (m) |
|---|
| Coarse | 509,518 | 0.022 | 0.022 | 0.021 |
| Medium | 1,139,400 | 0.017 | 0.017 | 0.016 |
| Fine | 2,284,200 | 0.013 | 0.013 | 0.013 |
Table 3.
Average peak response of the model with different meshes.
Table 3.
Average peak response of the model with different meshes.
| Mesh | Heave (m) | Relative Difference | Pitch (Deg) | Relative Difference |
|---|
| Coarse | 2.88 | 5.57% | 880. | 12% |
| Medium | 3.11 | 1.97% | 0.97 | 3% |
| Fine | 3.05 | - | 1.00 | - |
Table 4.
Comparison of heave motion responses between two methods (Unit: mm).
Table 4.
Comparison of heave motion responses between two methods (Unit: mm).
| Numerical Method | Model Test |
|---|
| First crest | 2.34 | First trough | −3.28 | First crest | 3.20 | First trough | −3.29 |
| Second crest | 2.96 | Second trough | −3.37 | Second crest | 2.71 | Second trough | −3.01 |
| Third crest | 2.90 | Third trough | −3.29 | Third crest | 3.35 | Third trough | −3.61 |
| Fourth crest | 3.18 | Fourth trough | −3.51 | Fourth crest | 3.38 | Fourth trough | −3.68 |
| Fifth crest | 3.14 | Fifth trough | −3.25 | Fifth crest | 3.34 | Fifth trough | −3.46 |
| Sixth crest | 3.31 | Sixth trough | −3.12 | Sixth crest | 3.26 | Sixth trough | −3.30 |
| - | - | Seventh trough | −2.96 | - | - | Seventh trough | −3.23 |
| Average crest | 2.97 | Average trough | −3.25 | Average crest | 3.21 | Average trough | −3.37 |
| Average motion amplitude: 3.11 | Average motion amplitude: 3.29 |
| Relative error: −5.31% |
Table 5.
Comparison of pitch motion responses between two methods (Unit: deg).
Table 5.
Comparison of pitch motion responses between two methods (Unit: deg).
| Numerical Method | Model Test |
|---|
| First crest | 0.65 | First trough | −1.38 | First crest | 0.76 | First trough | −0.94 |
| Second crest | 1.11 | Second trough | −1.33 | Second crest | 1.06 | Second trough | −1.33 |
| Third crest | 1.11 | Third trough | −0.79 | Third crest | 0.80 | Third trough | −0.64 |
| Fourth crest | 0.85 | Fourth trough | −0.85 | Fourth crest | 1.07 | Fourth trough | −1.21 |
| Fifth crest | 0.73 | Fifth trough | −1.08 | Fifth crest | 0.73 | Fifth trough | −0.84 |
| Sixth crest | 0.91 | Sixth trough | −1.02 | Sixth crest | 1.19 | Sixth trough | −1.24 |
| - | - | Seventh trough | −0.89 | - | - | Seventh trough | −1.07 |
| Average crest | 0.89 | Average trough | −1.05 | Average crest | 0.94 | Average trough | −1.04 |
| Average motion amplitude: 0.97 | Average motion amplitude: 0.99 |
| Relative error: −1.58% |
Table 6.
Mesh information in convergence study of Case 2.
Table 6.
Mesh information in convergence study of Case 2.
| Mesh | N | Δx (m) | Δy (m) | Δz (m) |
|---|
| Coarse | 1,585,122 | 0.013 | 0.013 | 0.013 |
| Medium | 3,095,942 | 0.010 | 0.010 | 0.010 |
| Fine | 6,028,780 | 0.008 | 0.008 | 0.008 |
Table 7.
Peak slamming pressure from different meshes.
Table 7.
Peak slamming pressure from different meshes.
| Mesh | Peak Slamming Pressure (Pa) | Relative Difference |
|---|
| Coarse | 406.7 | 12.99% |
| Medium | 451.5 | 3.40% |
| Fine | 467.4 | - |
Table 8.
Shape parameters of the sandglass-type model.
Table 8.
Shape parameters of the sandglass-type model.
| Items | Unit | Value |
|---|
| Radius of water-plane (RW) | m | 0.374 |
| Radius of top deck (RT) | m | 0.465 |
| Radius of bottom (RB) | m | 0.643 |
| Draft (d) | m | 0.188 |
| Freeboard (f) | m | 0.137 |
| Up angle (β) | ° | 56.432 |
| Down angle (α) | ° | 35.000 |
| Displacement volume (VB) | m3 | 0.156 |
Table 9.
Shape parameters of the cylindrical model.
Table 9.
Shape parameters of the cylindrical model.
| Items | Unit | Value |
|---|
| Radius of water-plane (RW) | m | 0.374 |
| Radius of top deck (RT) | m | 0.374 |
| Radius of bottom (RB) | m | 0.374 |
| Draft (d) | m | 0.188 |
| Freeboard (f) | m | 0.137 |
| Displacement volume (VB) | m3 | 0.083 |
Table 10.
Wave parameters of the classic regular wave.
Table 10.
Wave parameters of the classic regular wave.
| Typical Regular Wave | Unit | Value |
|---|
| Wave height | m | 15.0 |
| Wave period | s | 15.1 |
| Wave height (1:70) | m | 0.214 |
| Wave period (1:70) | s | 1.805 |
Table 11.
Mesh information in convergence study of the sandglass-type model.
Table 11.
Mesh information in convergence study of the sandglass-type model.
| Mesh | N | Δx (m) | Δy (m) | Δz (m) |
|---|
| Coarse | 1,096,320 | 0.022 | 0.022 | 0.021 |
| Medium | 1,918,560 | 0.017 | 0.017 | 0.016 |
| Fine | 3,315,672 | 0.013 | 0.013 | 0.013 |
Table 12.
Average slamming pressure on the model versus different meshes.
Table 12.
Average slamming pressure on the model versus different meshes.
| Mesh | Average Slamming Pressure (Pa) | Relative Difference |
|---|
| Coarse | 1737.2 | 11.98% |
| Medium | 1991.2 | 0.89% |
| Fine | 1973.6 | - |


