Article

Semidiurnal Internal Tide Interference in the Northern South China Sea

1
Frontiers Science Center for Deep Ocean Multispheres and Earth System (FDOMES) and Physical Oceanography Laboratory, Key Laboratory of Ocean Observation and Information of Hainan Province, Sanya Oceanographic Institution, Ocean University of China, Qingdao 266100/Sanya 572000, China
2
Laoshan Laboratory, Qingdao 266100, China
*
Author to whom correspondence should be addressed.
J. Mar. Sci. Eng. 2024, 12(5), 811; https://doi.org/10.3390/jmse12050811
Submission received: 13 March 2024 / Revised: 9 May 2024 / Accepted: 10 May 2024 / Published: 13 May 2024
(This article belongs to the Special Issue Latest Advances in Physical Oceanography—2nd Edition)

Abstract

:
Multiwave interference plays a crucial role in shaping the spatial variations of internal tides. Based on a combination of in situ mooring and altimeter data, interference of semidiurnal internal tides was investigated in the northern South China Sea. Mooring observations indicate the observed kinetic-to-potential energy ratio and group speed are both relatively lower than the theoretical values of mode-1 semidiurnal internal tides, indicating the presence of partly-standing waves. This is consistent with the altimeter result that the mooring was located at the antinode within the interference pattern formed by the superposition of the westward and southward semidiurnal internal tides from the Luzon Strait and the continental slope of the southern Taiwan Strait. However, the kinetic-to-potential energy ratio and group velocity were notably changed when an anticyclonic eddy passed by the mooring. By employing the ray-tracing method, we identified that mesoscale processes may induce a phase difference in the semidiurnal internal tides between the Luzon Strait and the continental slope of the southern Taiwan Strait. This alteration further leads to changes in the positions of nodes and antinodes within the interference pattern of the semidiurnal internal tides.

1. Introduction

Internal tides are a crucial dynamic process in the ocean [1,2,3]. Their generation is fueled by astronomical tides, with approximately 1 TW of energy converted into internal tide energy through interactions with sloping topography [4]. Once generated in their source regions, internal tides scatter off rough topography until dissipating through wave–wave interactions [5]. In the deep ocean, the interaction between internal tides and steep topography is crucial for enhancing the dissipation of internal tidal energy [6,7]. Mesoscale eddies also play a significant role in transferring energy from low-mode internal tides to high-mode internal tides, eventually leading to their dissipation [8]. Contributing energy through dissipation to deep ocean mixing, internal tides play a vital role in maintaining the global distribution of ocean stratification [9]. Consequently, the study of internal tides holds significant importance for understanding multi-scale ocean dynamic processes.
The superpositions of internal tides from multiple sources or of incident and reflected waves result in a complex interference pattern with significant spatial variations in energy, flux magnitude, and flux direction [10,11,12,13,14]. Most of the phenomena occur in the mode-1 internal tides in the open ocean [15,16,17], away from the source regions [18,19,20,21]. The northern South China Sea (SCS) has been found to exhibit a robust existence of the interference pattern of semidiurnal internal tides [10,21,22]. Multiple branches, including those from the Luzon Strait propagating westward, the branch generated from the continental slope of the southern Taiwan Strait propagating southward, and the weak branch propagating eastward, superimpose to form a multi-wave interference pattern of M2 internal tides in the northern SCS [20]. Within this interference pattern, the M2 internal tide amplitude exhibits distinct half-wavelength characteristics of standing waves, with high values at antinodes and low values at nodes [23]. The strength of interference phenomena can be characterized by the different characteristics of progressive wave and standing wave, including the energy ratio, group velocity, and Greenwich phase [24]. When interference exists, the observed group velocity of the internal tide is significantly lower than the theoretical group velocity [25].
The interference between internal tides from multiple sources forms a spatially non-uniform distribution of the wave field, effecting differences in the distribution of semidiurnal internal tidal kinetic and potential energy in the non-uniform field [25,26]. Changes in the background field can induce variations in the propagation speed of internal tides, thereby altering the spatial distribution of wave nodes and antinodes [18,27] and further amplifying the non-uniformity of the incident and dissipation pathways [28].
In the northern SCS, numerous observational experiments have been conducted on internal tides. These studies indicate that the semidiurnal internal tides have significant seasonal cycles [29,30], which are stronger in spring and autumn compared to other seasons [31,32]. They are highly incoherent with only 10% coherent energy [33]. The incoherent internal tides are essential in transferring tidal energy to smaller-scale processes, ultimately facilitating turbulent mixing [34].
In addition to strong internal tides, the northern SCS also features abundant mesoscale processes. Its modulation effect on the semidiurnal internal tide is evident. Both subtidal current and stratification changes induced by mesoscale eddies have significant impacts on the modal structure and phase speed of the semidiurnal internal tides [35]. In situ mooring experiments have shown that different positions in the eddies exert varying influences on the semidiurnal internal tide. The passage of anticyclonic eddies to the north accelerates the propagation speed of internal tides, while those to the south weaken the propagation speed, particularly when the internal tide propagates westward [36]. Therefore, the superimposed standing wave nodes and antinodes are deflected clockwise under the influence of the eddy-induced background currents. Furthermore, the opposite variations in amplitude are shown on the two sides of the wave node [23]. The internal tidal amplitudes of the eastward velocity and the northward counterpart may also be caused by the intensification of background currents [30]. Regarding seasonal variations, studies on steric height indicate that mesoscale processes contribute more significantly during summer and winter seasons, while the contribution of internal tides is more in spring and autumn [37].
The current velocity and temperature anomaly induced by mesoscale eddies were observed to exhibit significant magnitudes near the surface and main thermocline [38], which may significantly influence the variations of the interference pattern in the northern SCS.
In this study, aiming to investigate the characteristics of semidiurnal internal tide interference, we initially computed the energy and flux of the semidiurnal internal tide and examined the evidence of interference by mooring observations. Furthermore, by using altimeter datasets, we determined the mooring positions between the nodes and antinodes within the interference pattern. Finally, we explored the potential impact of an anticyclonic eddy on the spatial interference pattern of the semidiurnal internal tide based on ray-tracing methods [39].

2. Data and Methods

2.1. In Situ Mooring Data

To examine the interference of semidiurnal internal tides and its temporal variability in the northern SCS, we utilized 5-month data between 1 January and 1 June 2014 from mooring IW4 (118.16° E, 21.01° N, depth ~2020 m, Figure 1). The selection was based on previous studies in the northern SCS using altimeter data and pressure-recording inverted echo sounders (PIESs) to investigate the spatial interference patterns of semidiurnal internal tides [20,24]. The mooring equipped with three Acoustic Doppler Current Profilers (ADCPs) operating at 75-kHz for measuring current velocity over the upper ~1500 m. Additionally, an Aanderaa Seaguard recording current meter (RCM) and a downward-looking 300-kHz ADCP were mounted at ~1700 m and ~1900 m to measure velocity in the deep ocean. The original bin size of the ADCPs is 16 m. Temperature/salinity (T/S) chains were deployed along the mooring to obtain T/S profiles above ~1000 m. Moreover, several conductivity–temperature–depth sensors (CTDs) were installed below ~1000 m to measure T/S in the deep ocean. Further detailed information about the instruments is shown in Table 1.
For the convenience of the following analysis, linear interpolation was applied to create a grid with a vertical resolution of 5 m and a temporal resolution of 30 min. The semidiurnal tidal signals were extracted by applying a bandpass filter with cutoff frequency at [1.74 2.13] cycles per day.

2.2. Altimeter Data

Satellite altimeters provide a wide spatial view of internal tides, which is helpful in interpreting our mooring measurements in the interference fields formed by the superimposed semidiurnal internal tides from multiple sources. We utilized the Multivariate Inversion of Ocean Surface Topography-Internal Tide dataset (MIOST-IT) provided by Archiving Validation and Interpretation of Satellite Oceanography (AVISO; ftp://ftp-access.aviso.altimetry.fr/ (accessed on 7 July 2023)) to assist in examining the interference of semidiurnal internal tides. The dataset comprises surface amplitudes and phases induced by the four main tides (M2, S2, K1, O1) with the spatial resolution of 0.1° × 0.1°. Note that MIOST-IT provides both the mode-1 and mode-2 components. In this study, we simply used the mode-1 M2 internal tides, which were extracted by applying the 2D bandpass filtering method proposed by Zhao et al. (2019) [27].

2.3. Modal Decompositon

Following Zhao et al. (2010) [40], dynamic modal decomposition is applied to extract the baroclinic modal signals of internal tides:
d 2 Φ z d z 2 + N 2 z c n 2 Φ z = 0
where N 2 ( z ) is the squared buoyancy frequency, Φ z is the baroclinic modes for vertical displacement, n denotes the mode number, c n represents the eigenspeed.
The theoretical group speed c g t h e o r y and wave number K can be derived from the eigenspeed c n :
c g t h e o r y = ω 2 f 2 ω c n
K = ω 2 f 2 / c n
where ω denotes M2 frequency, and f is local inertial frequency.

2.4. Energy and Flux of Internal Tides

The calculation of horizontal kinetic energy (HKE), available potential energy (APE), and energy flux for the semidiurnal internal tide refers to Zhao et al. (2010) [40].
H K E = 1 2 ρ 0 H 0 < u 2 z , t > d z
A P E = 1 2 ρ 0 H 0 < N 2 ( z ) η 2 z , t > d z
E = H K E + A P E
F = H 0 < u z , t p z , t > d z
where the bold font represents a vector, ρ 0 represents the reference density (1024 kg m−1), H is the water depth, u denotes the filtered semidiurnal tidal velocity, η is the filtered vertical displacement, E and F represent the total energy and energy flux, p stands for the baroclinic pressure, and < > denotes an average over one tidal period.
The observational estimate of group speed c g c a l c for progressive internal waves can be computed using the method as follows [24,41]:
c g c a l c = F E

2.5. Directional Fourier Filter Method

We also employed the Directional Fourier Filter (DFF) method [42,43] to decompose the altimetric signals induced by internal tides propagating in different directions. This method is suitable for grid-based data, and has been proved to be effective for the MIOST-IT dataset in the SCS [23].

2.6. Ray-Tracing Model

To investigate the variations of interference pattern resulting from the eddy-induced background fields in the northern SCS, we employed the ray-tracing method [40].
d x d s = Q [ S α c o s α + s i n α S θ   θ = α ]
d y d s = Q [ S α s i n α c o s α S θ   θ = α ]
d p x d s = Q S α S x
d p y d s = Q S α S y
Q = [ S 2 α + S θ   θ = α ] 1 2
α = t a n 1 ( p y / p x )
where α denotes the direction of phase velocity, p x and p y represent spatial derivatives of the phase, S ( α ) represents the reciprocal of the phase velocity at direction angle α , ds is the length increment of the ray trajectory in the horizontal coordinate system (x, y), and Q denotes the normalization factor. Note that the propagation speed of internal tides was calculated by solving the modified Taylor–Goldstein equation proposed by Huang et al. (2018) [41].

3. Observation Results and Analysis

3.1. Evidence of Interference Revealed by Mooring Observations and Its Temporal Variations

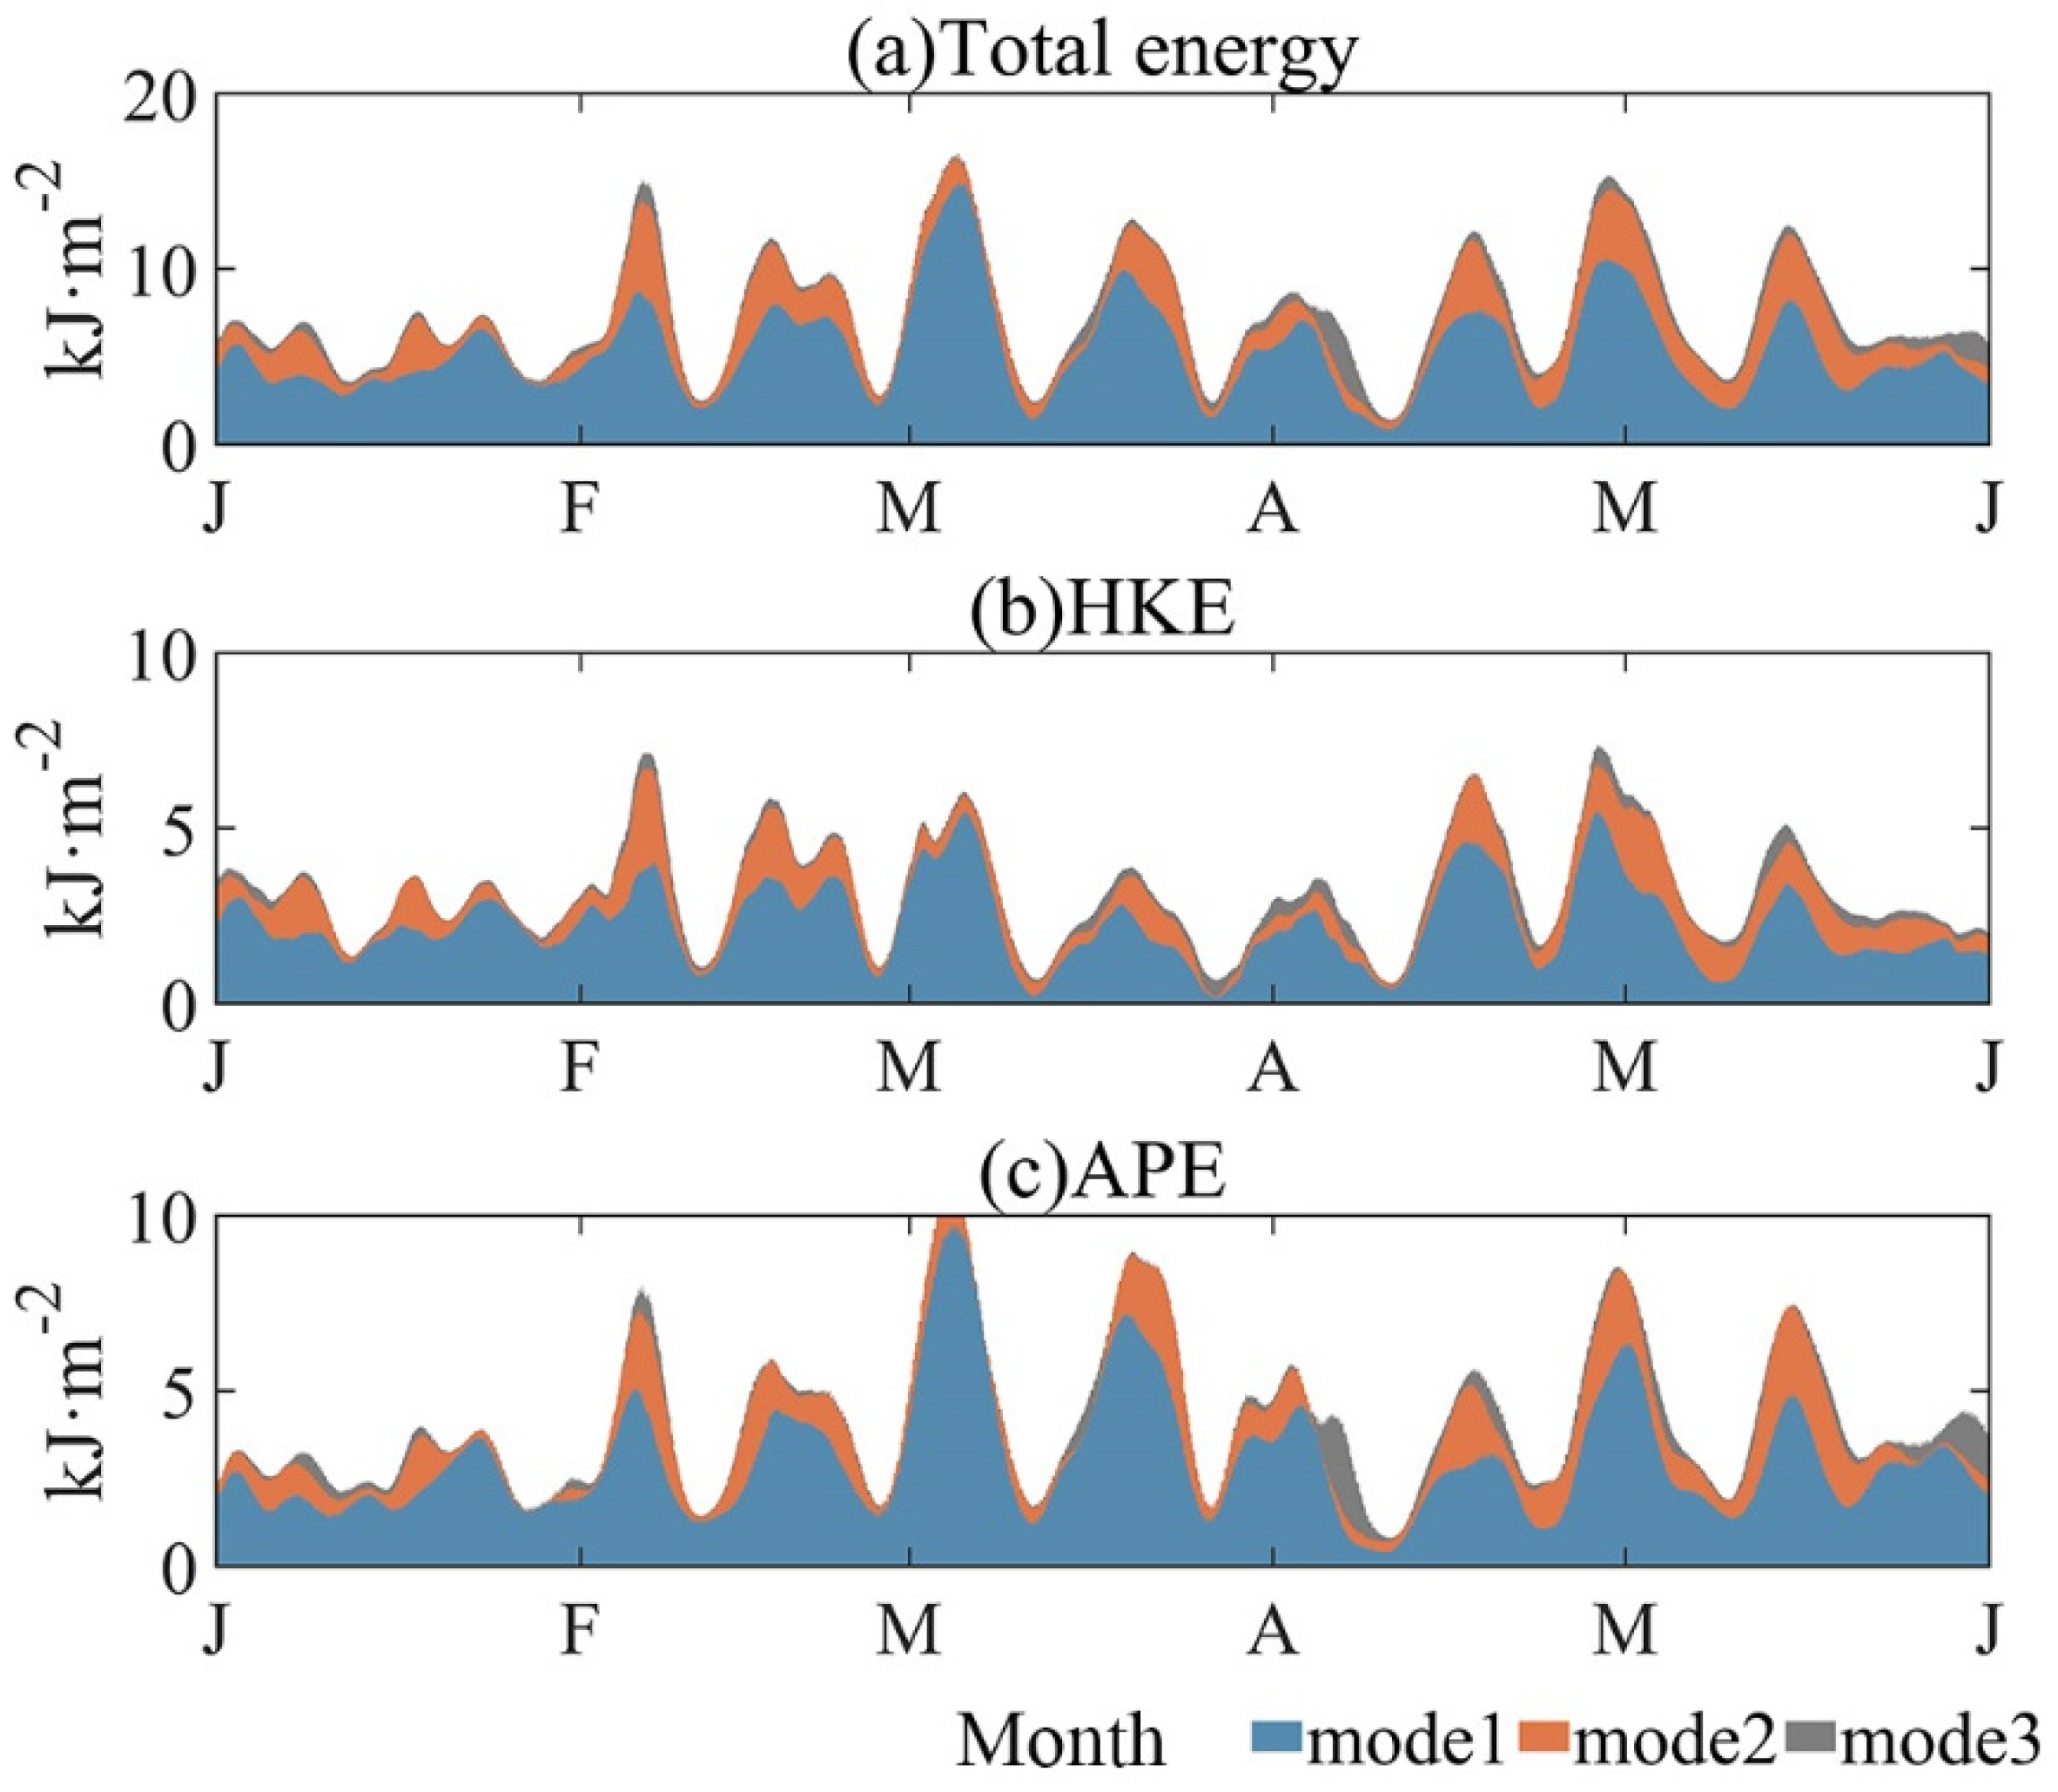
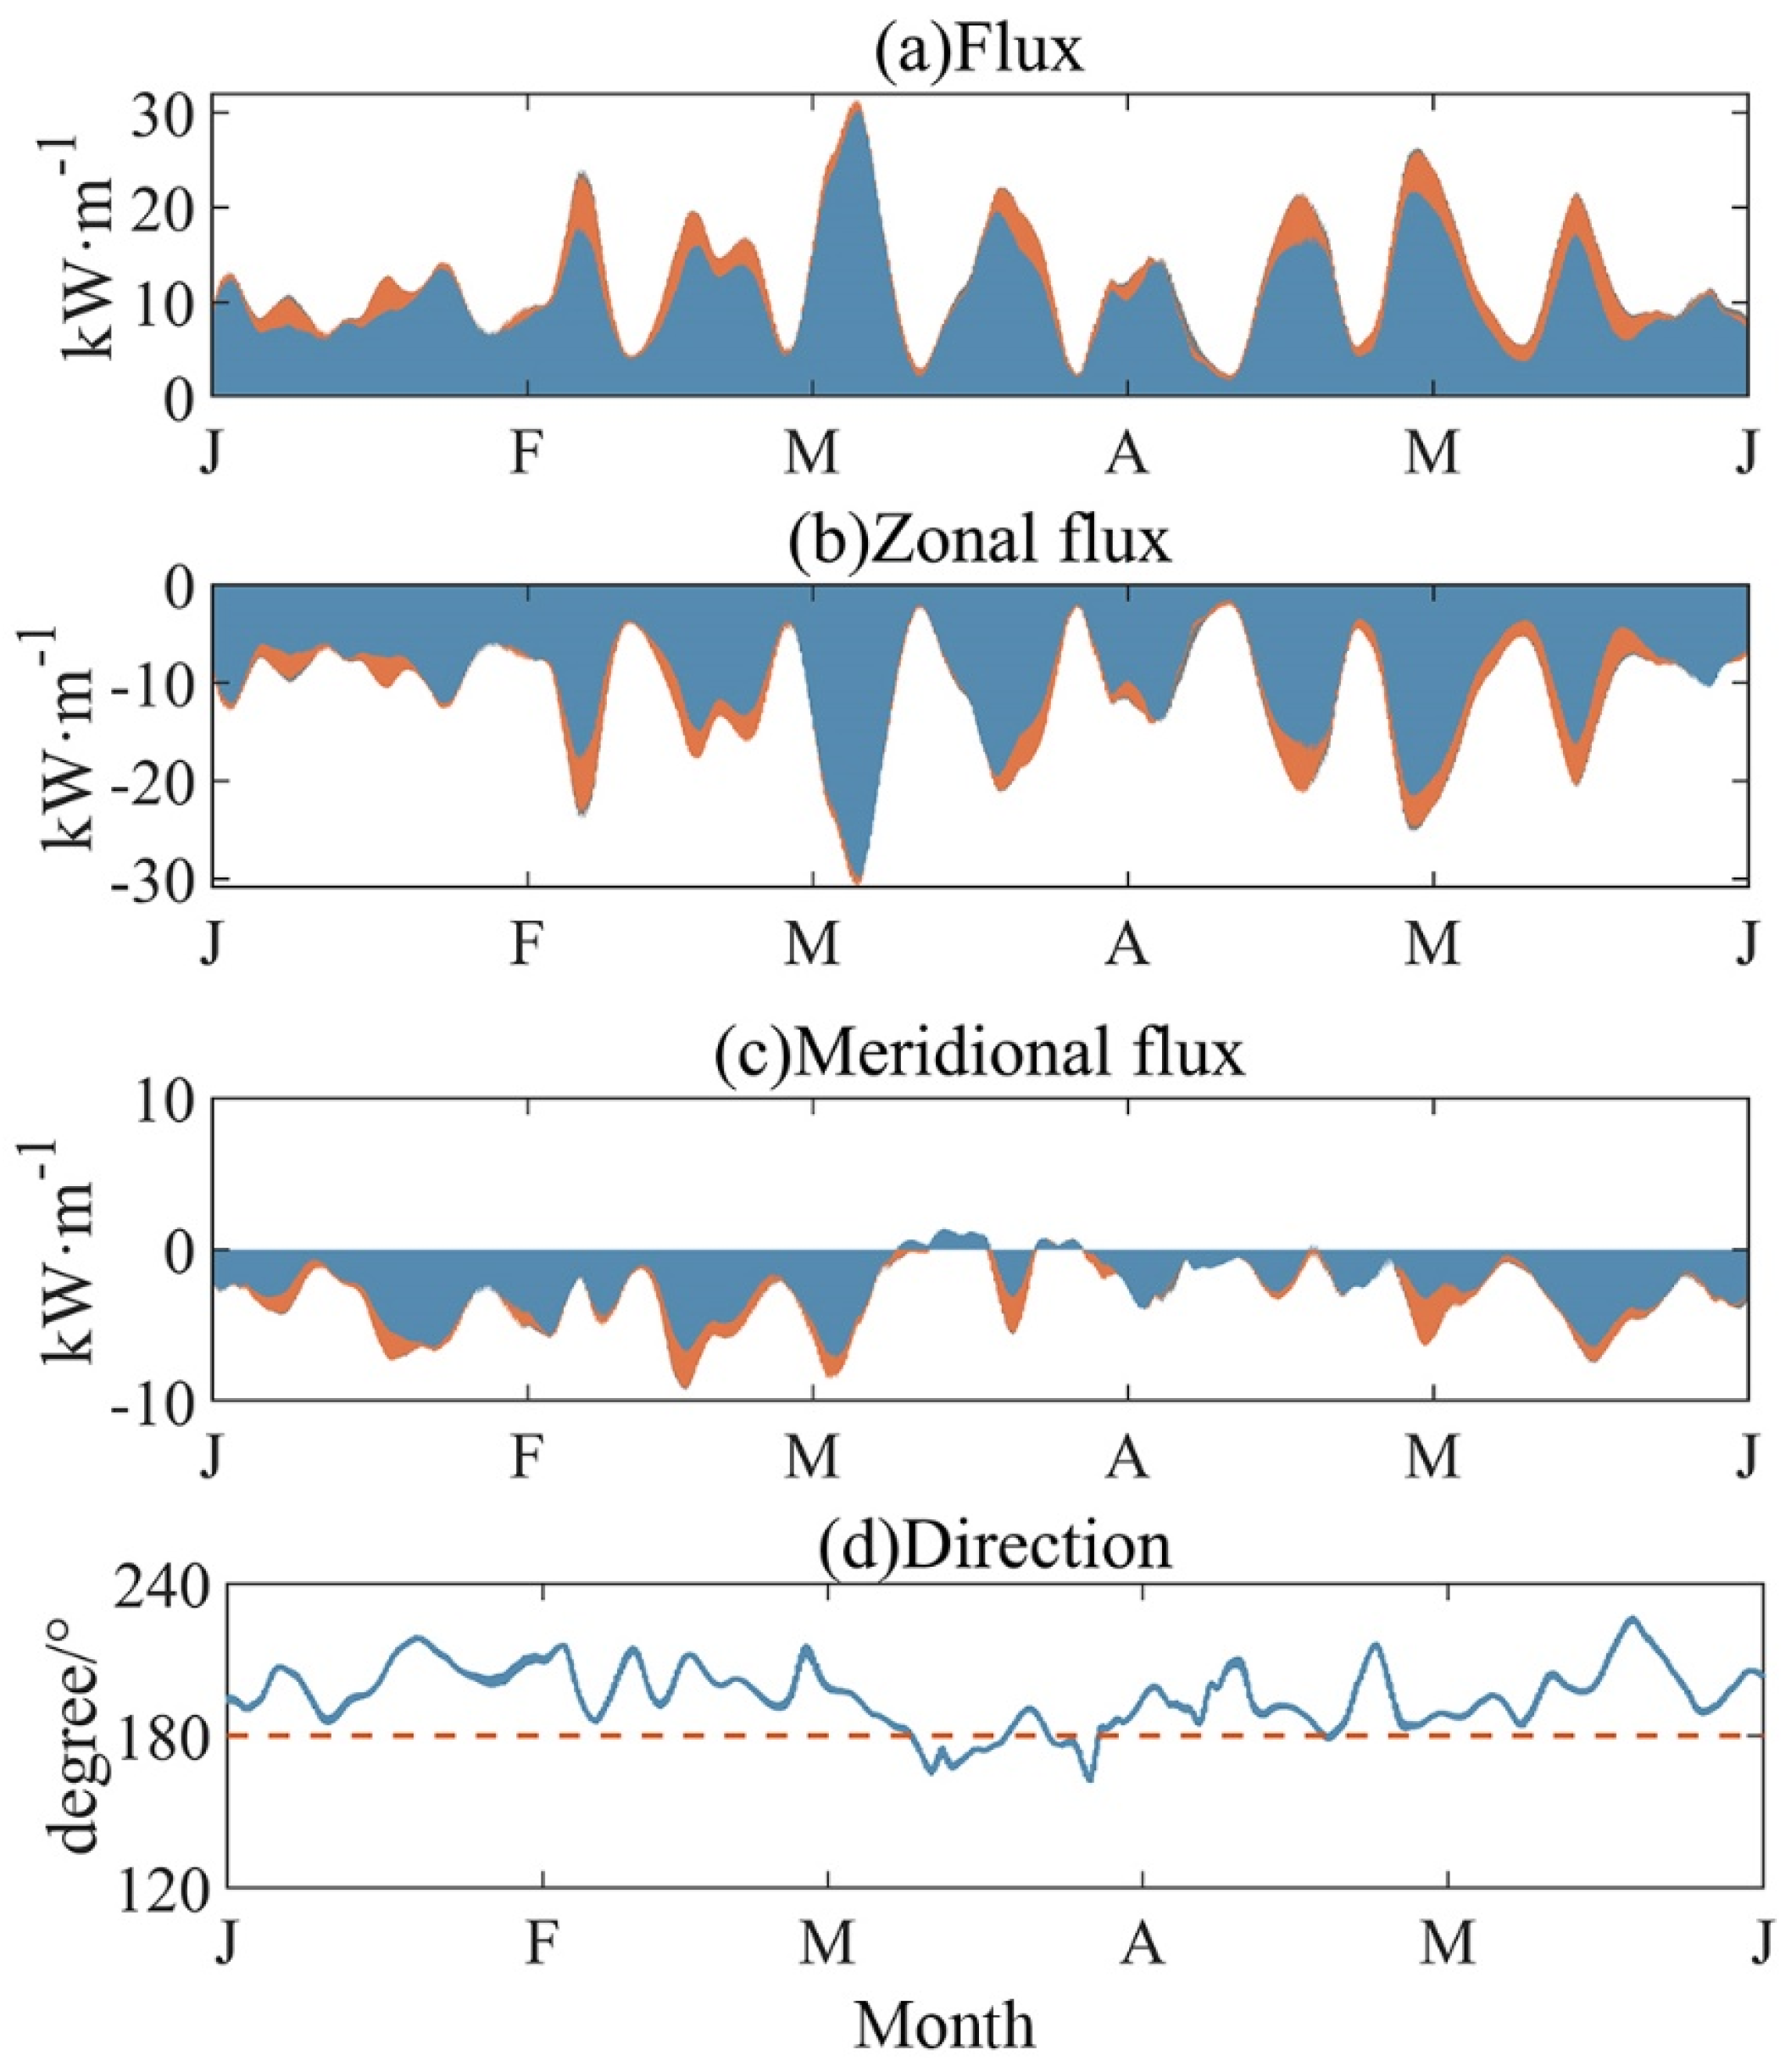
Figure 2 and Figure 3 show depth-integrated semidiurnal energy and flux of the first three modes at IW4 during the whole observational period. The observation reveals a strong internal wave field in the semidiurnal band, with the total energy and flux magnitude up to 16 kJ/m2 and 31 kW/m, respectively (Figure 2a and Figure 3a). In addition, except in January, the energy and flux exhibit clean spring–neap cycles dominated by mode-1. As indicated by dynamic modal decomposition (Figure 2 and Figure 3), the mode-1 semidiurnal internal tide accounts for the majority of the variance of energy and flux. Therefore, we only focus on the mode-1 in the later analysis.
For a single progressive wave, HKE always exceeds APE in a latitude-dependent ratio, satisfying H K E / A P E = ( ω 2 + f 2 ) / ( ω 2 f 2 ) . However, APE dominated over HKE in March, due to the remarkable increase in APE and decrease in HKE, implying partial standing wave patterns. Figure 2b,c exhibited significant variations in mode-1 HKE and APE during March. Specifically, during this period, the magnitudes of mode-1 HKE and APE at spring typically exceeded that at neap by a factor of 10 and 6, respectively, whereas they remained at 3–5 during other periods.
Generally, the mode-1 flux vectors were observed to be southwestward, consistent with the propagation direction of semidiurnal internal tides indicated by altimeter results near IW4 (Figure 1, white arrows). In Figure 3b, the zonal energy flux showed a regular variation over the fortnightly cycles. However, the meridional flux remarkably decreased in March, with the flux direction even towards northwestward at certain times in March (Figure 3c,d).
Figure 4a presents the HKE/APE ratio at IW4. The theoretical ratio for semidiurnal internal tide at this location is 1.32, while the observed mean value is approximately 0.81, about 60% of the theoretical value. This indicates that the position of IW4 was likely near the antinodes within the interference pattern in the mean state. However, the HKE/APE ratio deviates significantly from the mean value, which is probably associated with the varying background fields in the northern SCS. For example, the HKE/APE ratio significantly decreased to 0.14 in late March, while it increased to 2 in middle April.
The ratio between flux magnitude and total energy can also be employed to evaluate the degree of free propagation by comparison with the theoretical group speed c g t h e o r y . In general, the observed group speed c g c a l c in the presence of partly-standing waves is lower than the theoretical group speed c g t h e o r y for a freely-propagating internal tide [26,28]. Figure 4b illustrates the theoretical group speed and the observed group speed for the mode-1 semidiurnal internal tide. The theoretical group speed c g t h e o r y changes with the slowly varying stratification, and c g c a l c is consistently lower than c g t h e o r y during the entire observation period. Importantly, the differences between c g t h e o r y and c g c a l c range from 0.2 to 0.7 m s−1, possibly indicating the variation of the interference pattern. Figure 4a showed that the largest discrepancy occurred in late March, corresponding exactly to the occurrence of the lowest HKE/APE ratio. Figure 4c also show the largest semidiurnal and M2 amplitude change in March. The synchronous changes of HKE/APE ratio, group speed, and amplitude will be discussed later.

3.2. Interference Pattern Formed by Two Dominant Branches

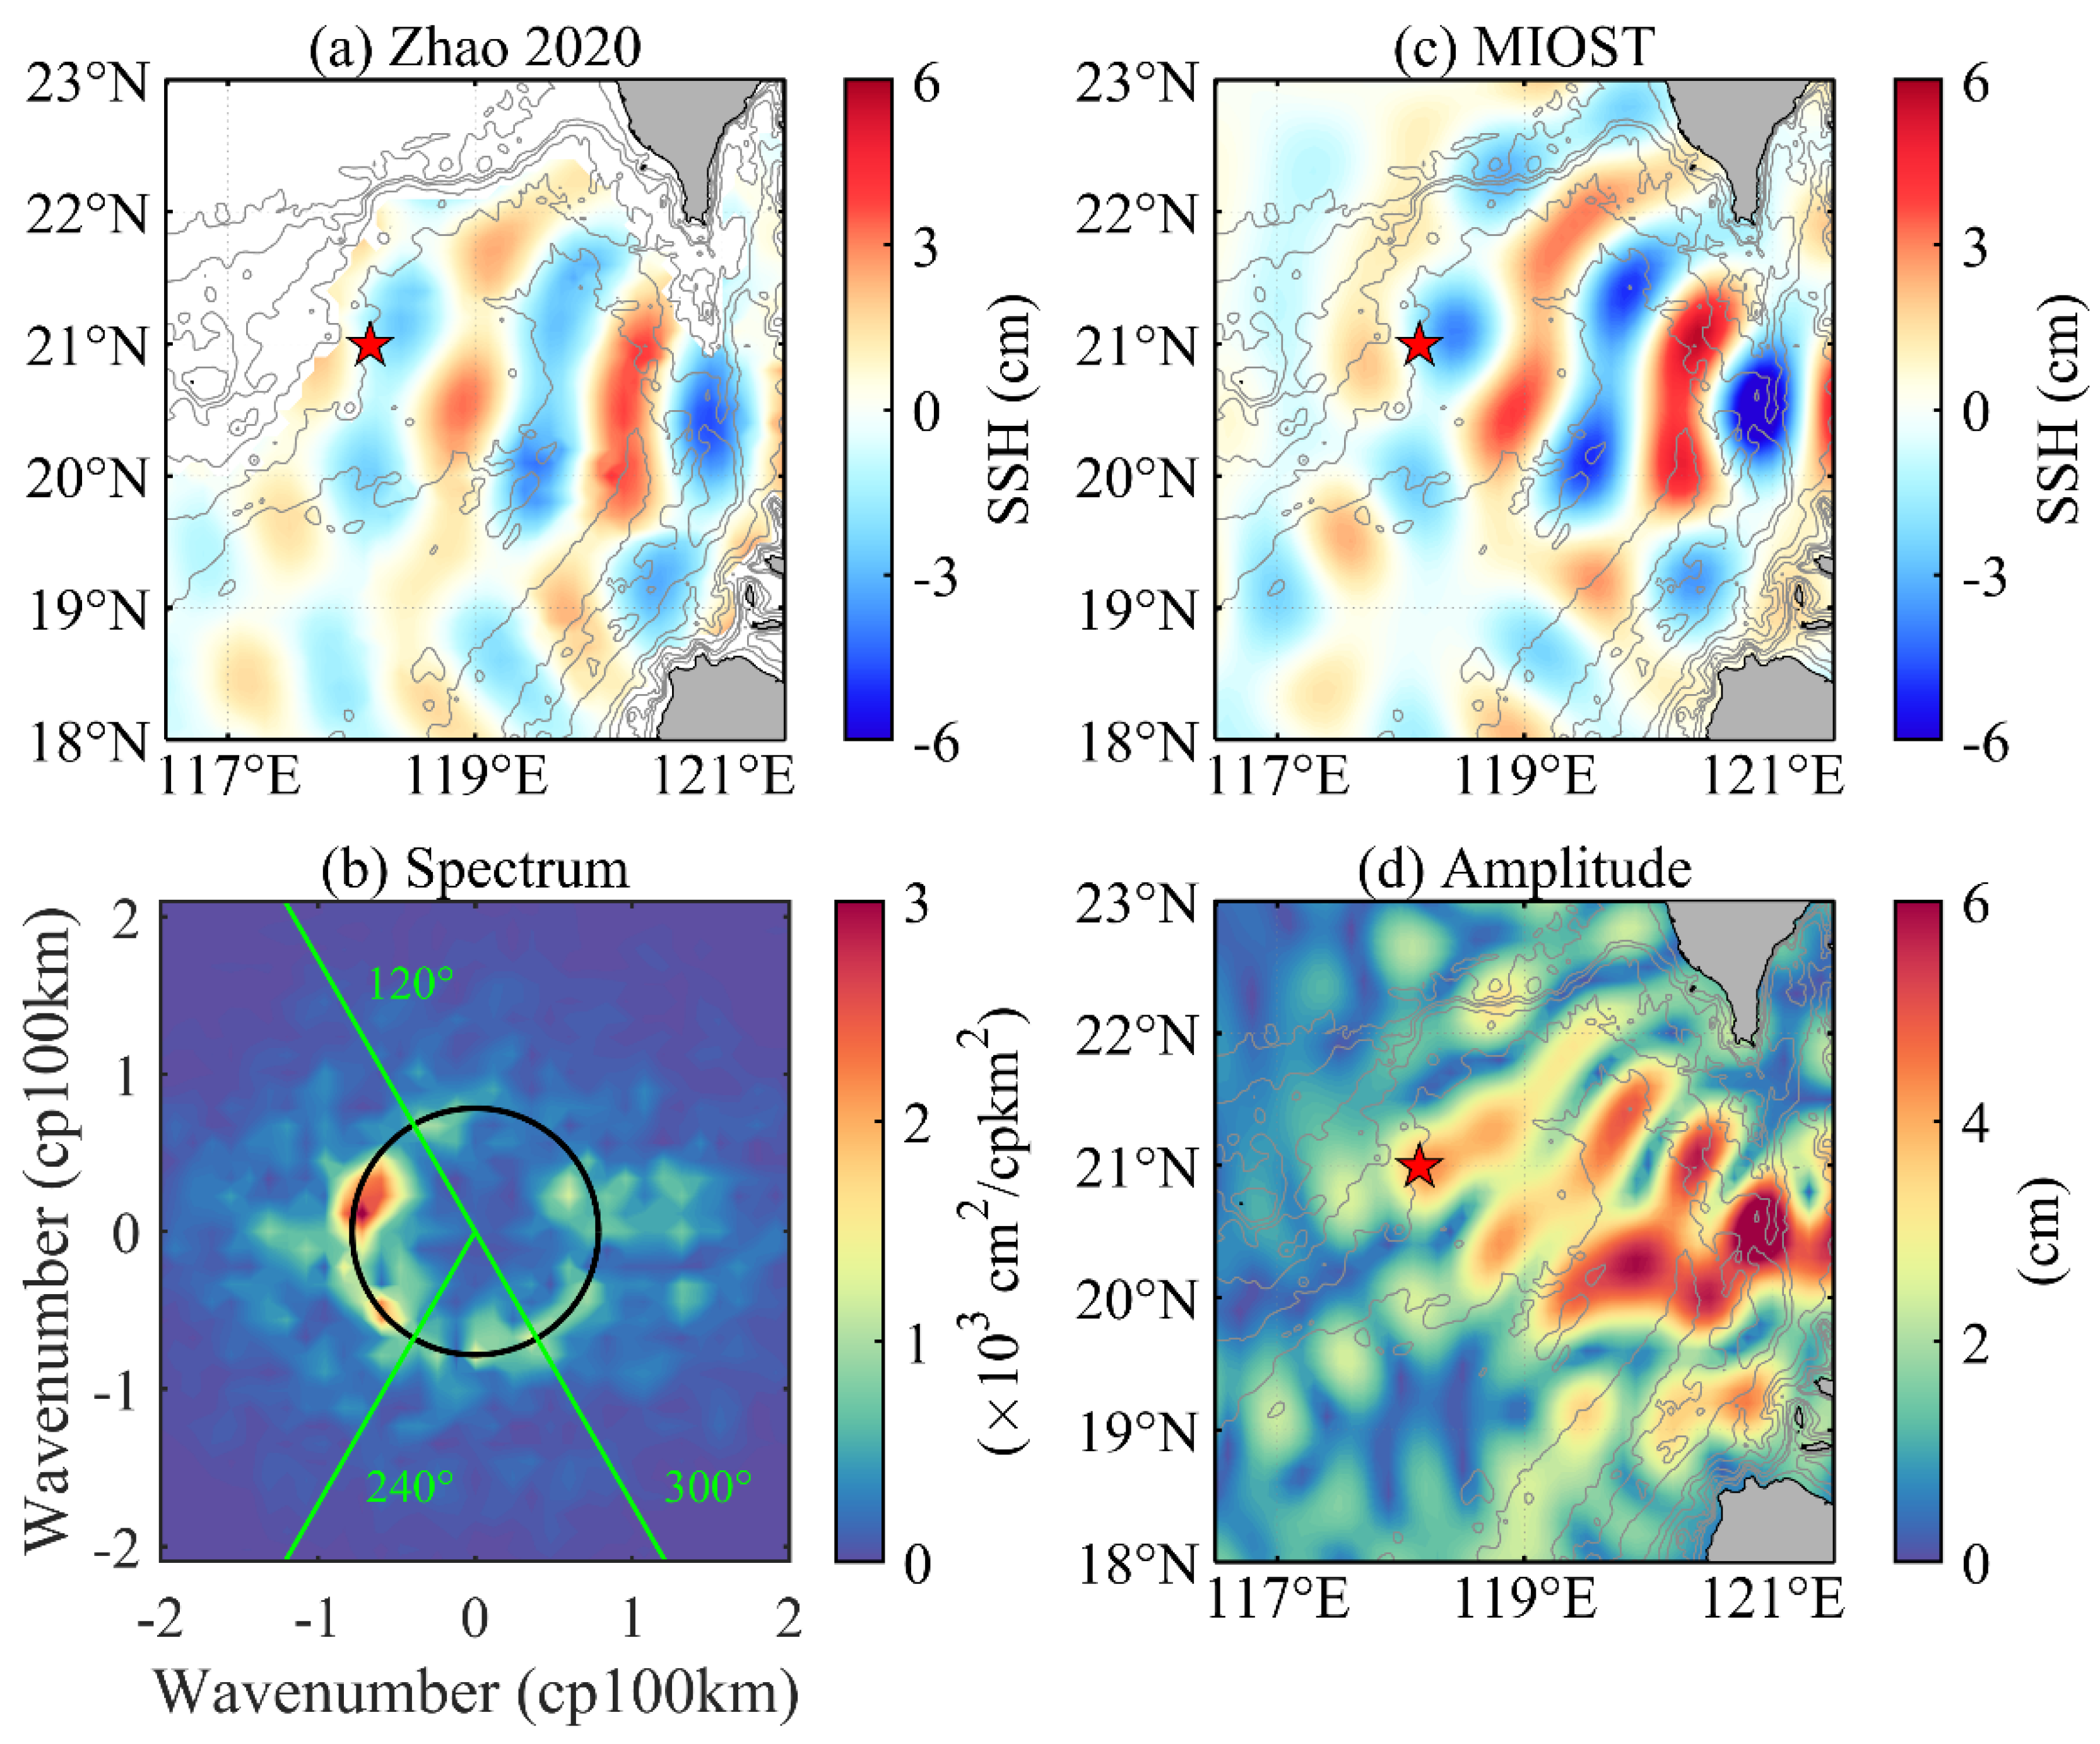
Altimeter observations are effective for validating the spatial distribution of interference patterns in the northern SCS. Mode-1 Sea Surface Height (SSH) induced by M2 internal tides was acquired from the altimetry satellites for the period from 1 January 1993 to 31 August 2017 as provided by MIOST-IT datasets [44]. It was extracted from raw SSH by applying a 2D bandpass filter, with a cutoff band of 0.8 K and 1.25 K. Here, K is the mode-1 wavenumber calculated through Equation (3) and is about 7.8 × 10⁻³ km−1 at IW4. The mode-1 M2 internal tides derived from MIOST-IT are shown in Figure 5c, which display almost the same spatial pattern with the altimeter results from 1992 to 2018 in Zhao (2020) [20] (Figure 5a). Nonetheless, there are some differences in the magnitude of the SSH and the pattern of the southwestward branch from the Luzon Strait between them.
As shown in Figure 5b, the wavenumber spectrum shows obviously multidirectional and anisotropic internal wave fields. The westward-propagating branch (120–240°) is dominant, and the southward branch (240–300°) is relatively strong. Furthermore, the surface amplitude showed a banded periodic structure, with the average distance between two adjacent high-value stripes about 65 km, which is about half of the mode-1 wavelength (~127 km) in this area. This half-wavelength modulation has also been observed in the central North Pacific and verified as the consequence of two superposed waves [23]. Notably, IW4 is located within the high-value stripe of amplitude (i.e., antinode), consistent with the observed mean HKE/APE ratio being lower than the theoretical value.
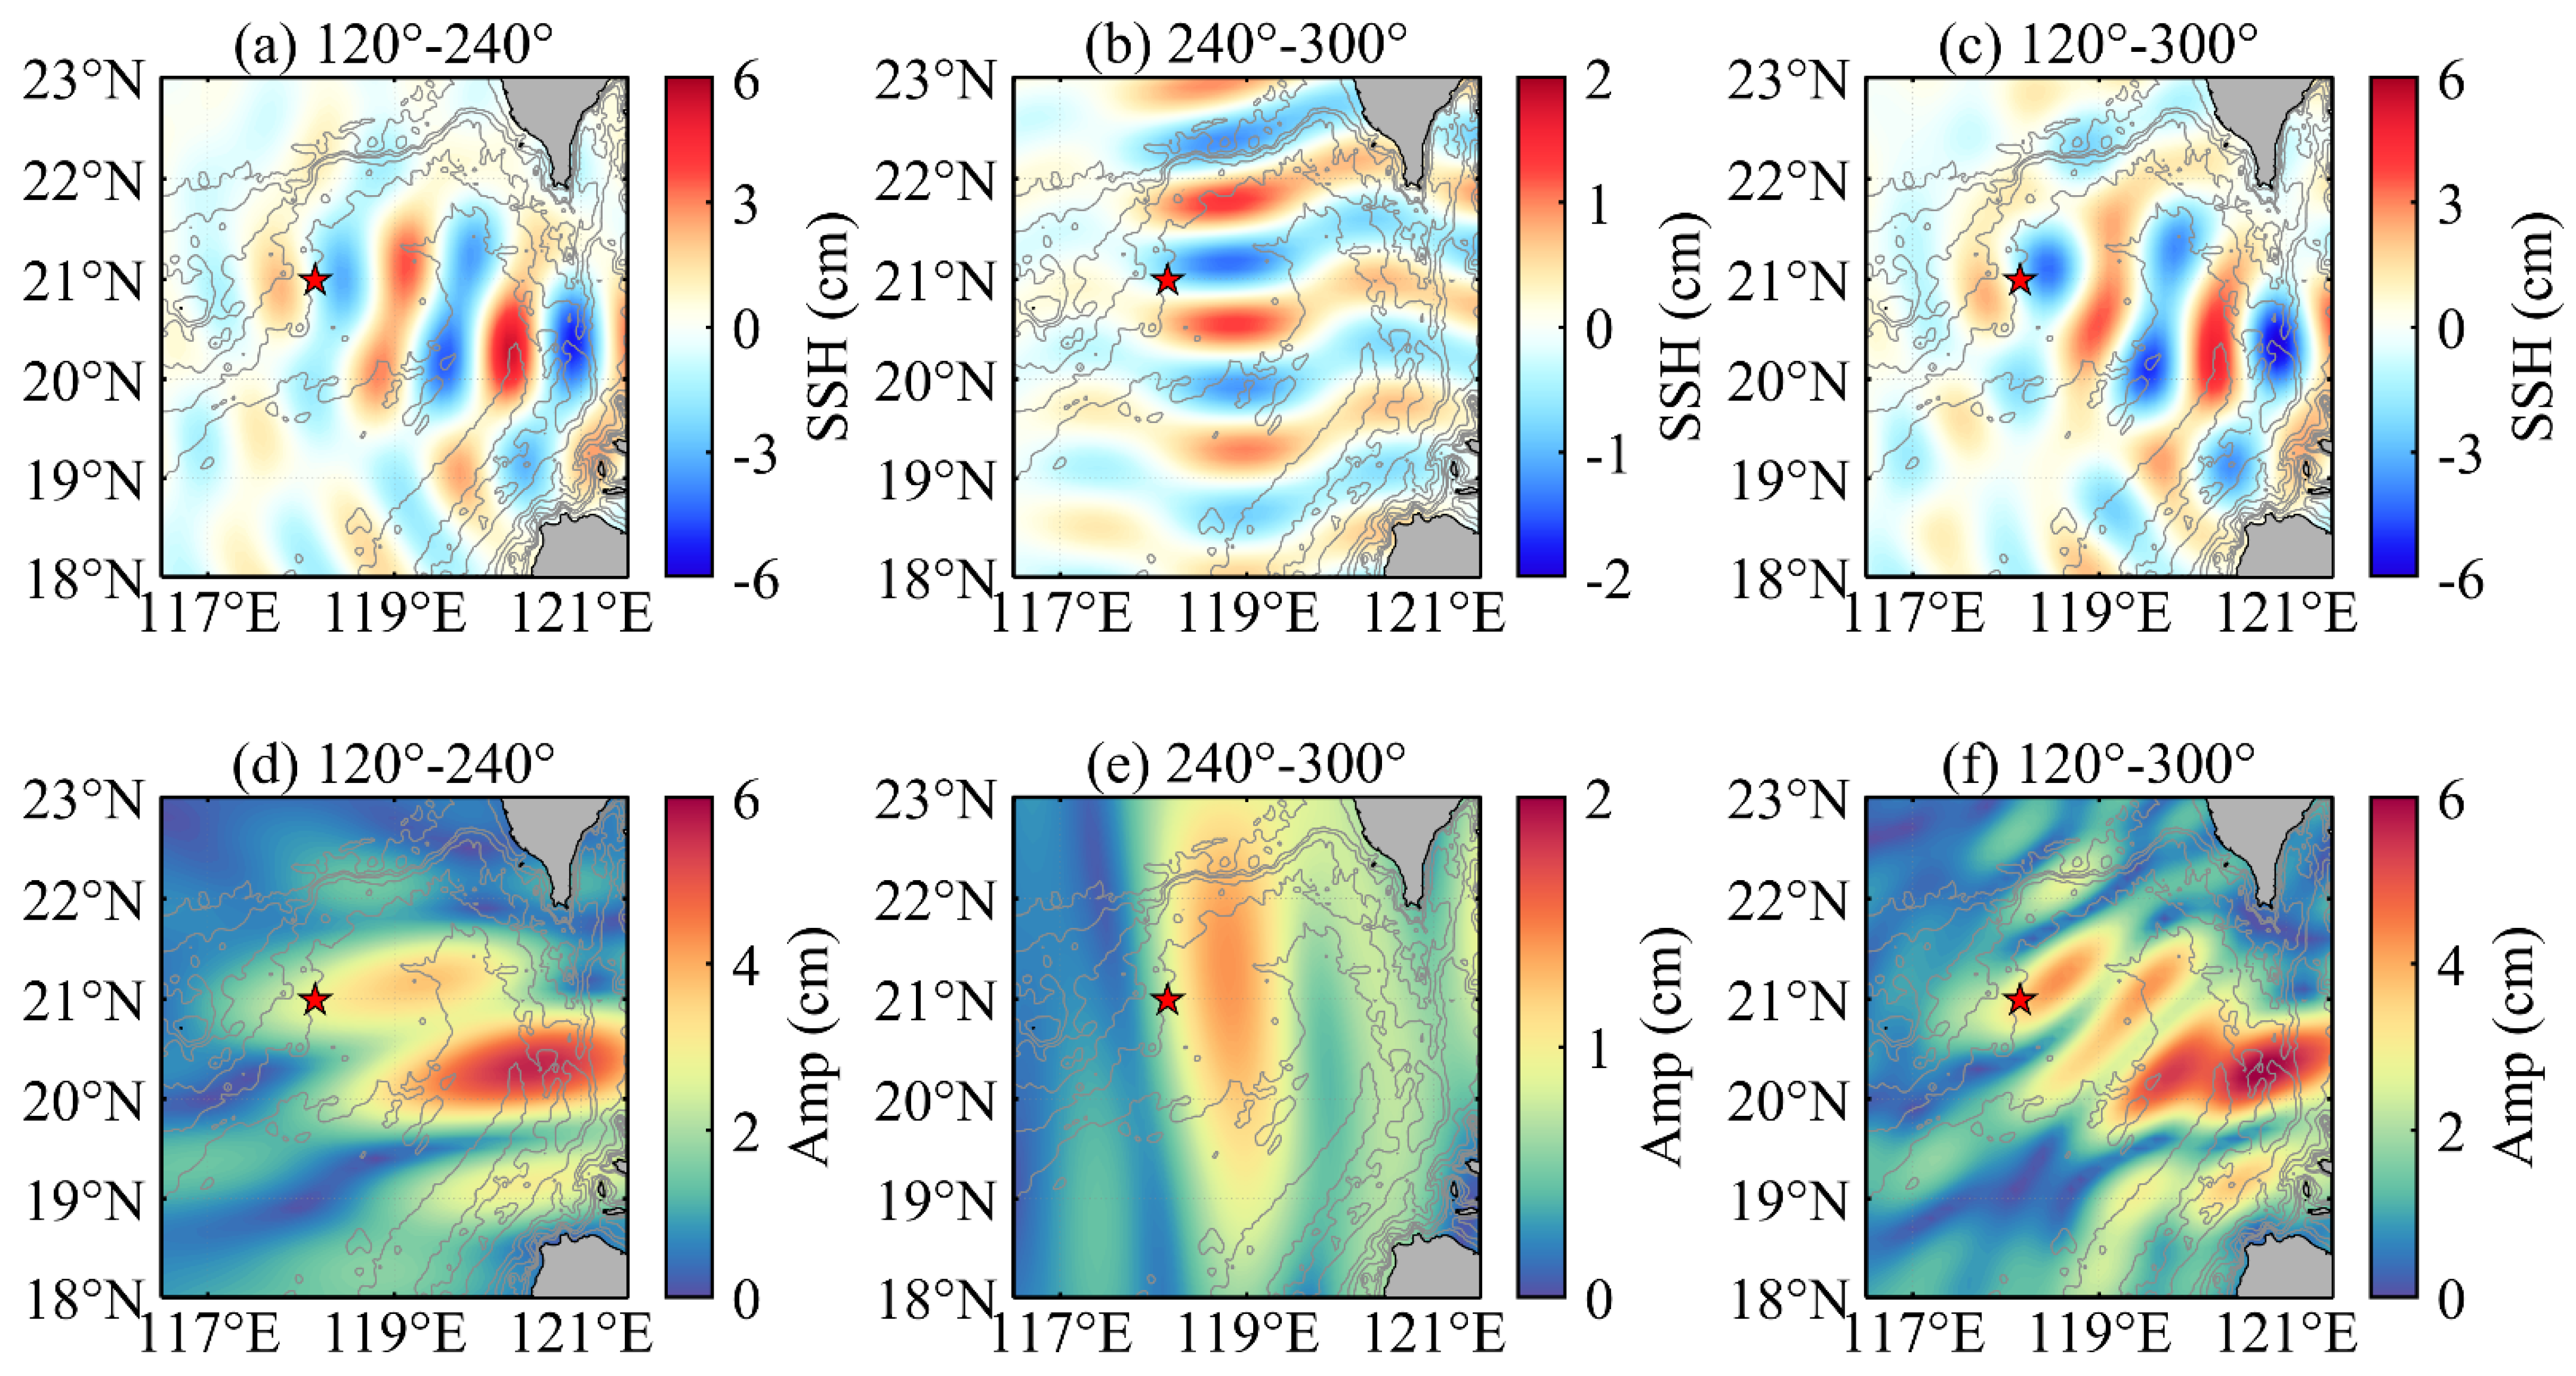
To separate the internal tides from multiple sources, the DFF method was employed according to the wavenumber spectrum. The westward (120–240°) and southward (240–300°) branches, respectively, were extracted from the mode-1 internal tide. It is obvious that the separated westward branch originates from the Luzon Strait, while the weaker southward-propagating branch is mainly generated from the continental slope of the southern Taiwan Strait (Figure 6a,b). Both of the two branches become weaker as they radiate away from their generation sites, and IW4 is basically located in their propagation paths (Figure 6d,e).
The superposition of the two branches (120–300°) shows a similar spatial pattern of SSH as the individual westward branch, except along the main propagation of the southward branch (Figure 6c). However, this superposition results in a banded pattern of the amplitude (Figure 6f), generally consistent with the mode-1 amplitude extracted from MIOST-IT, especially in the area around IW4. This suggests that the observed interference at IW4 is mainly caused by the superimposition of the westward branch originating from the Luzon Strait and southward branch emanating from the continental slope of the southern Taiwan Strait.

3.3. Influence of an Anticyclonic Eddy on the Interference Variation

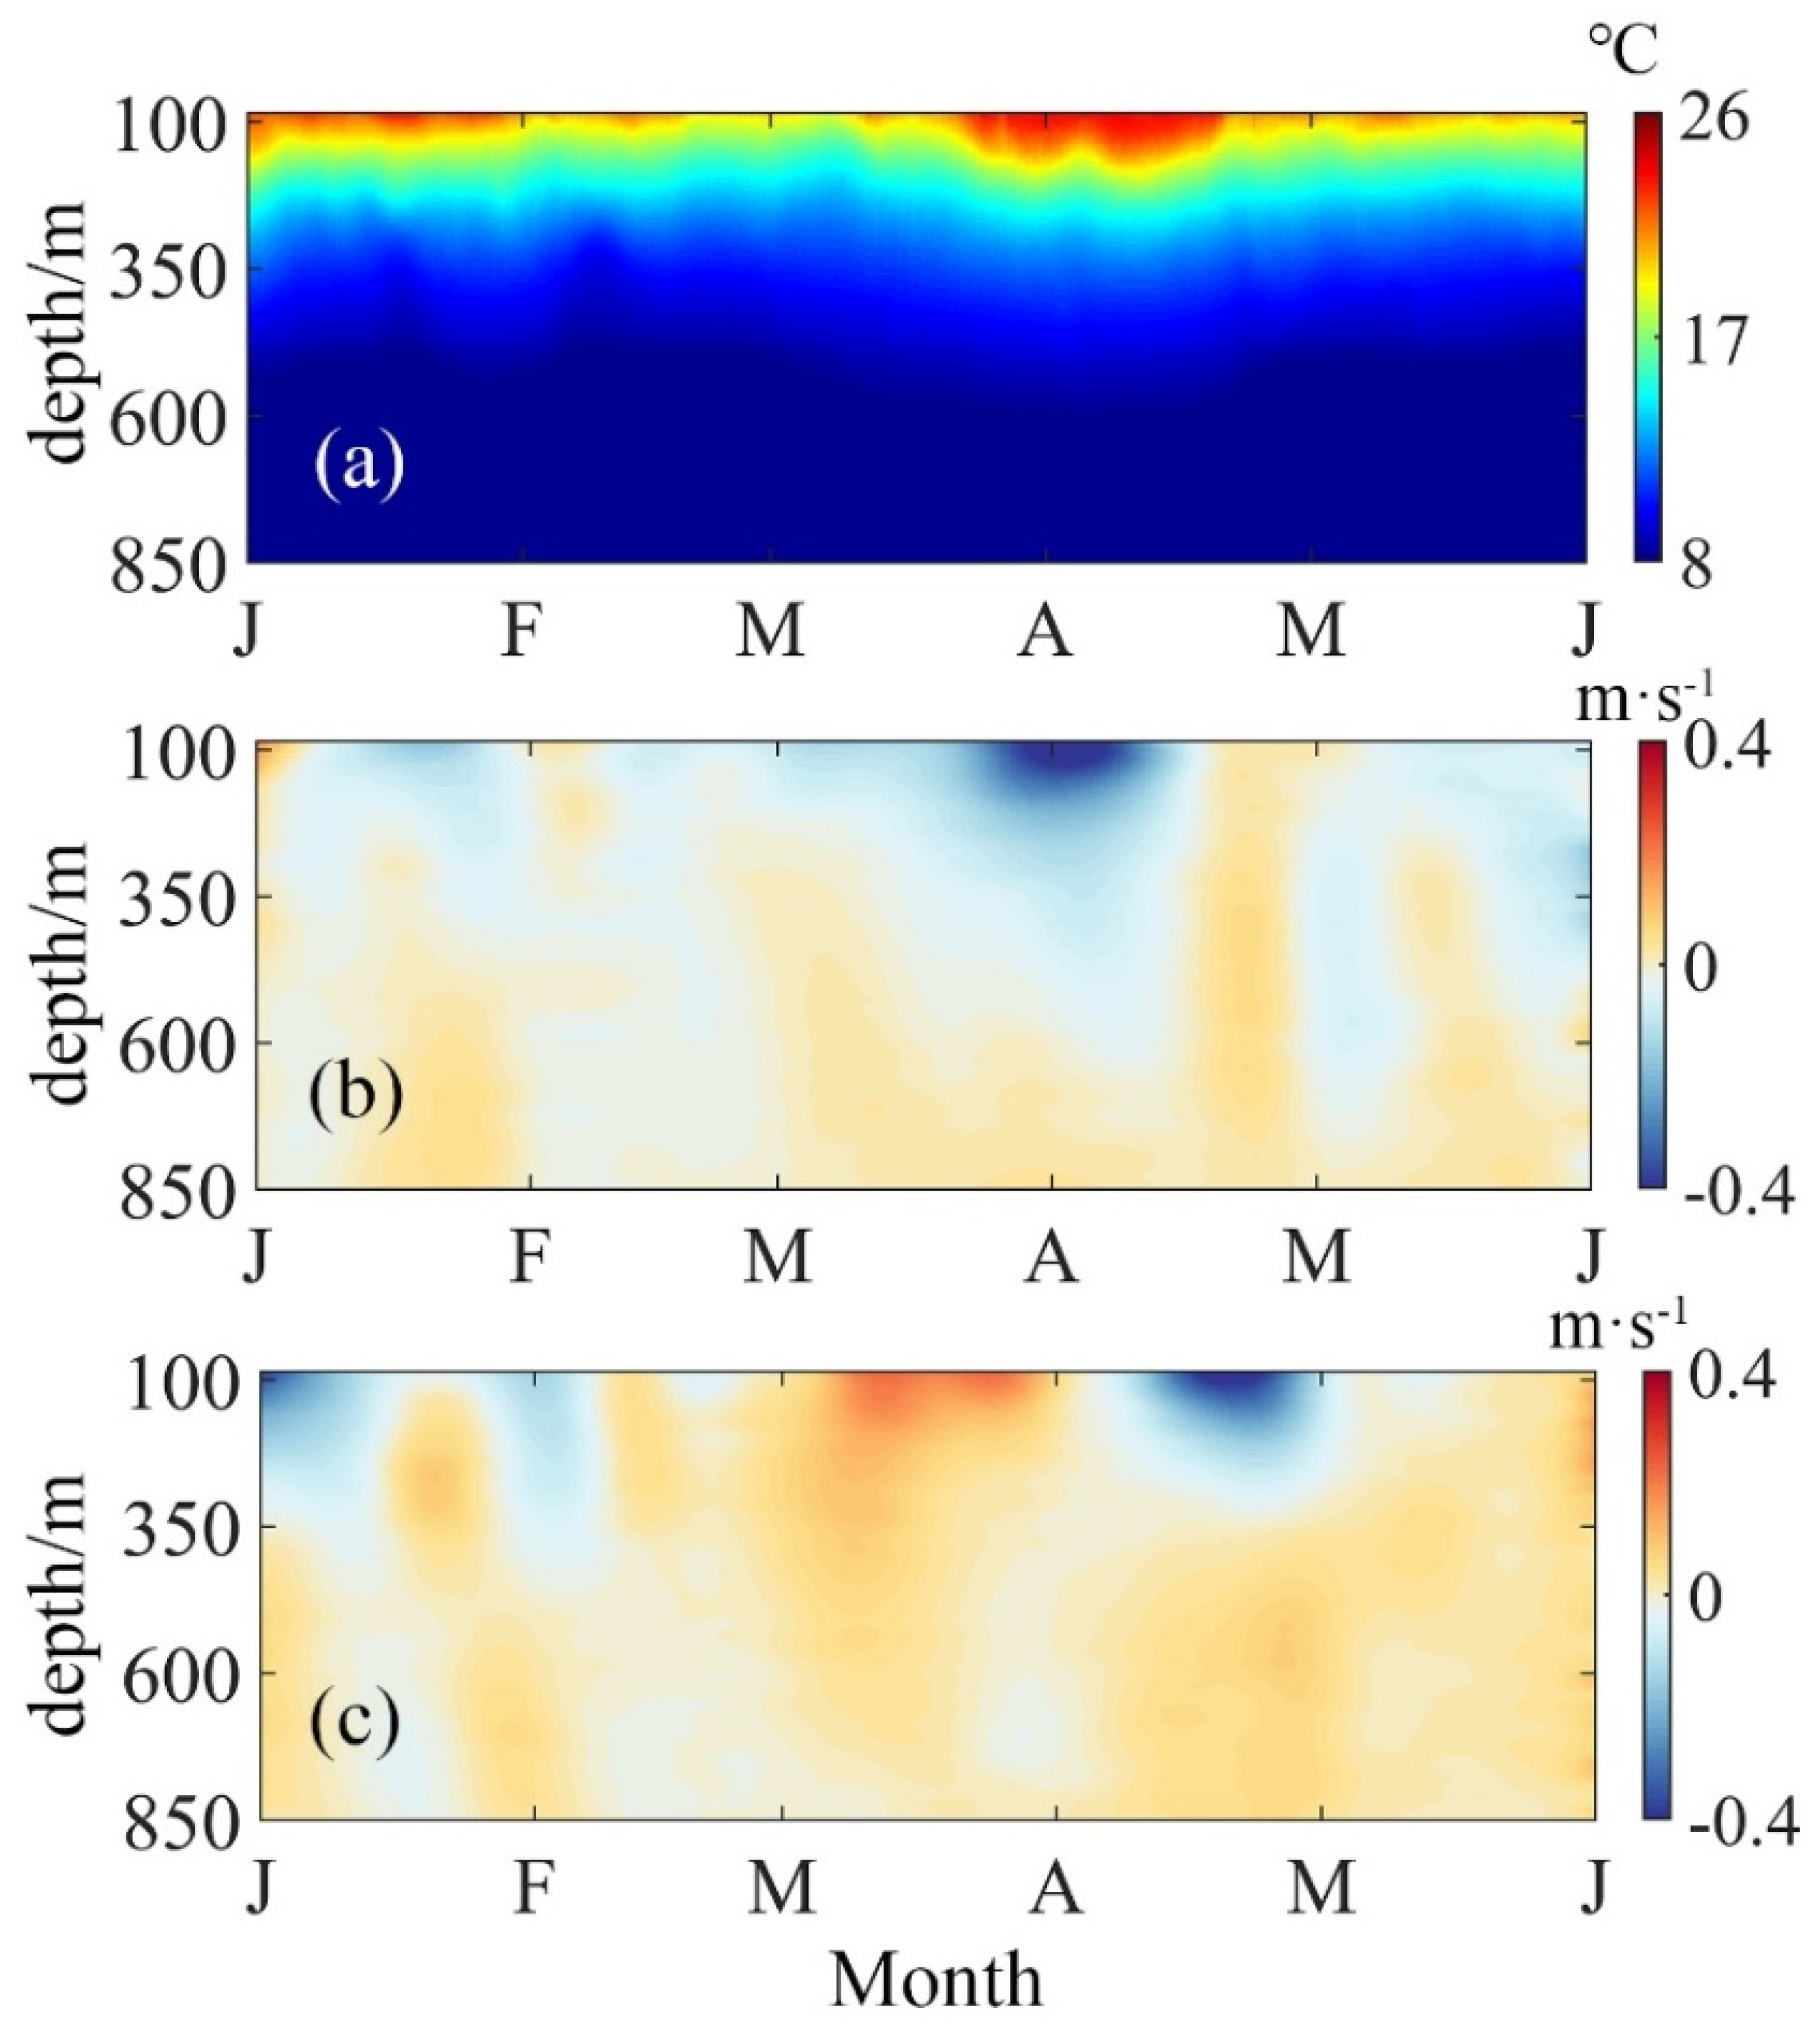
As mentioned in Section 3.1, both the HKE/APE ratio and the difference between observed and theoretical group speed experienced significant changes in late March. Figure 7 shows the background temperature and currents at IW4. Notably, the thermocline extended 30–50 m deeper in the upper ocean when an anticyclonic eddy passed by IW4 in late March (Figure 7a). Meanwhile, the subtidal current velocity reached a maximum of more than 0.4 m s−1 (Figure 7b,c). Therefore, we supposed the synchronous changes of HKE/APE ratio and group speed are likely connected to the varied background fields associated with the anticyclonic eddy. To verify this, internal tidal rays are, respectively, set to begin at the Luzon Strait and the continental slope of the southern Taiwan Strait according to the DFF results. The ray-tracing results on 27 March were compared with those in the mean state.
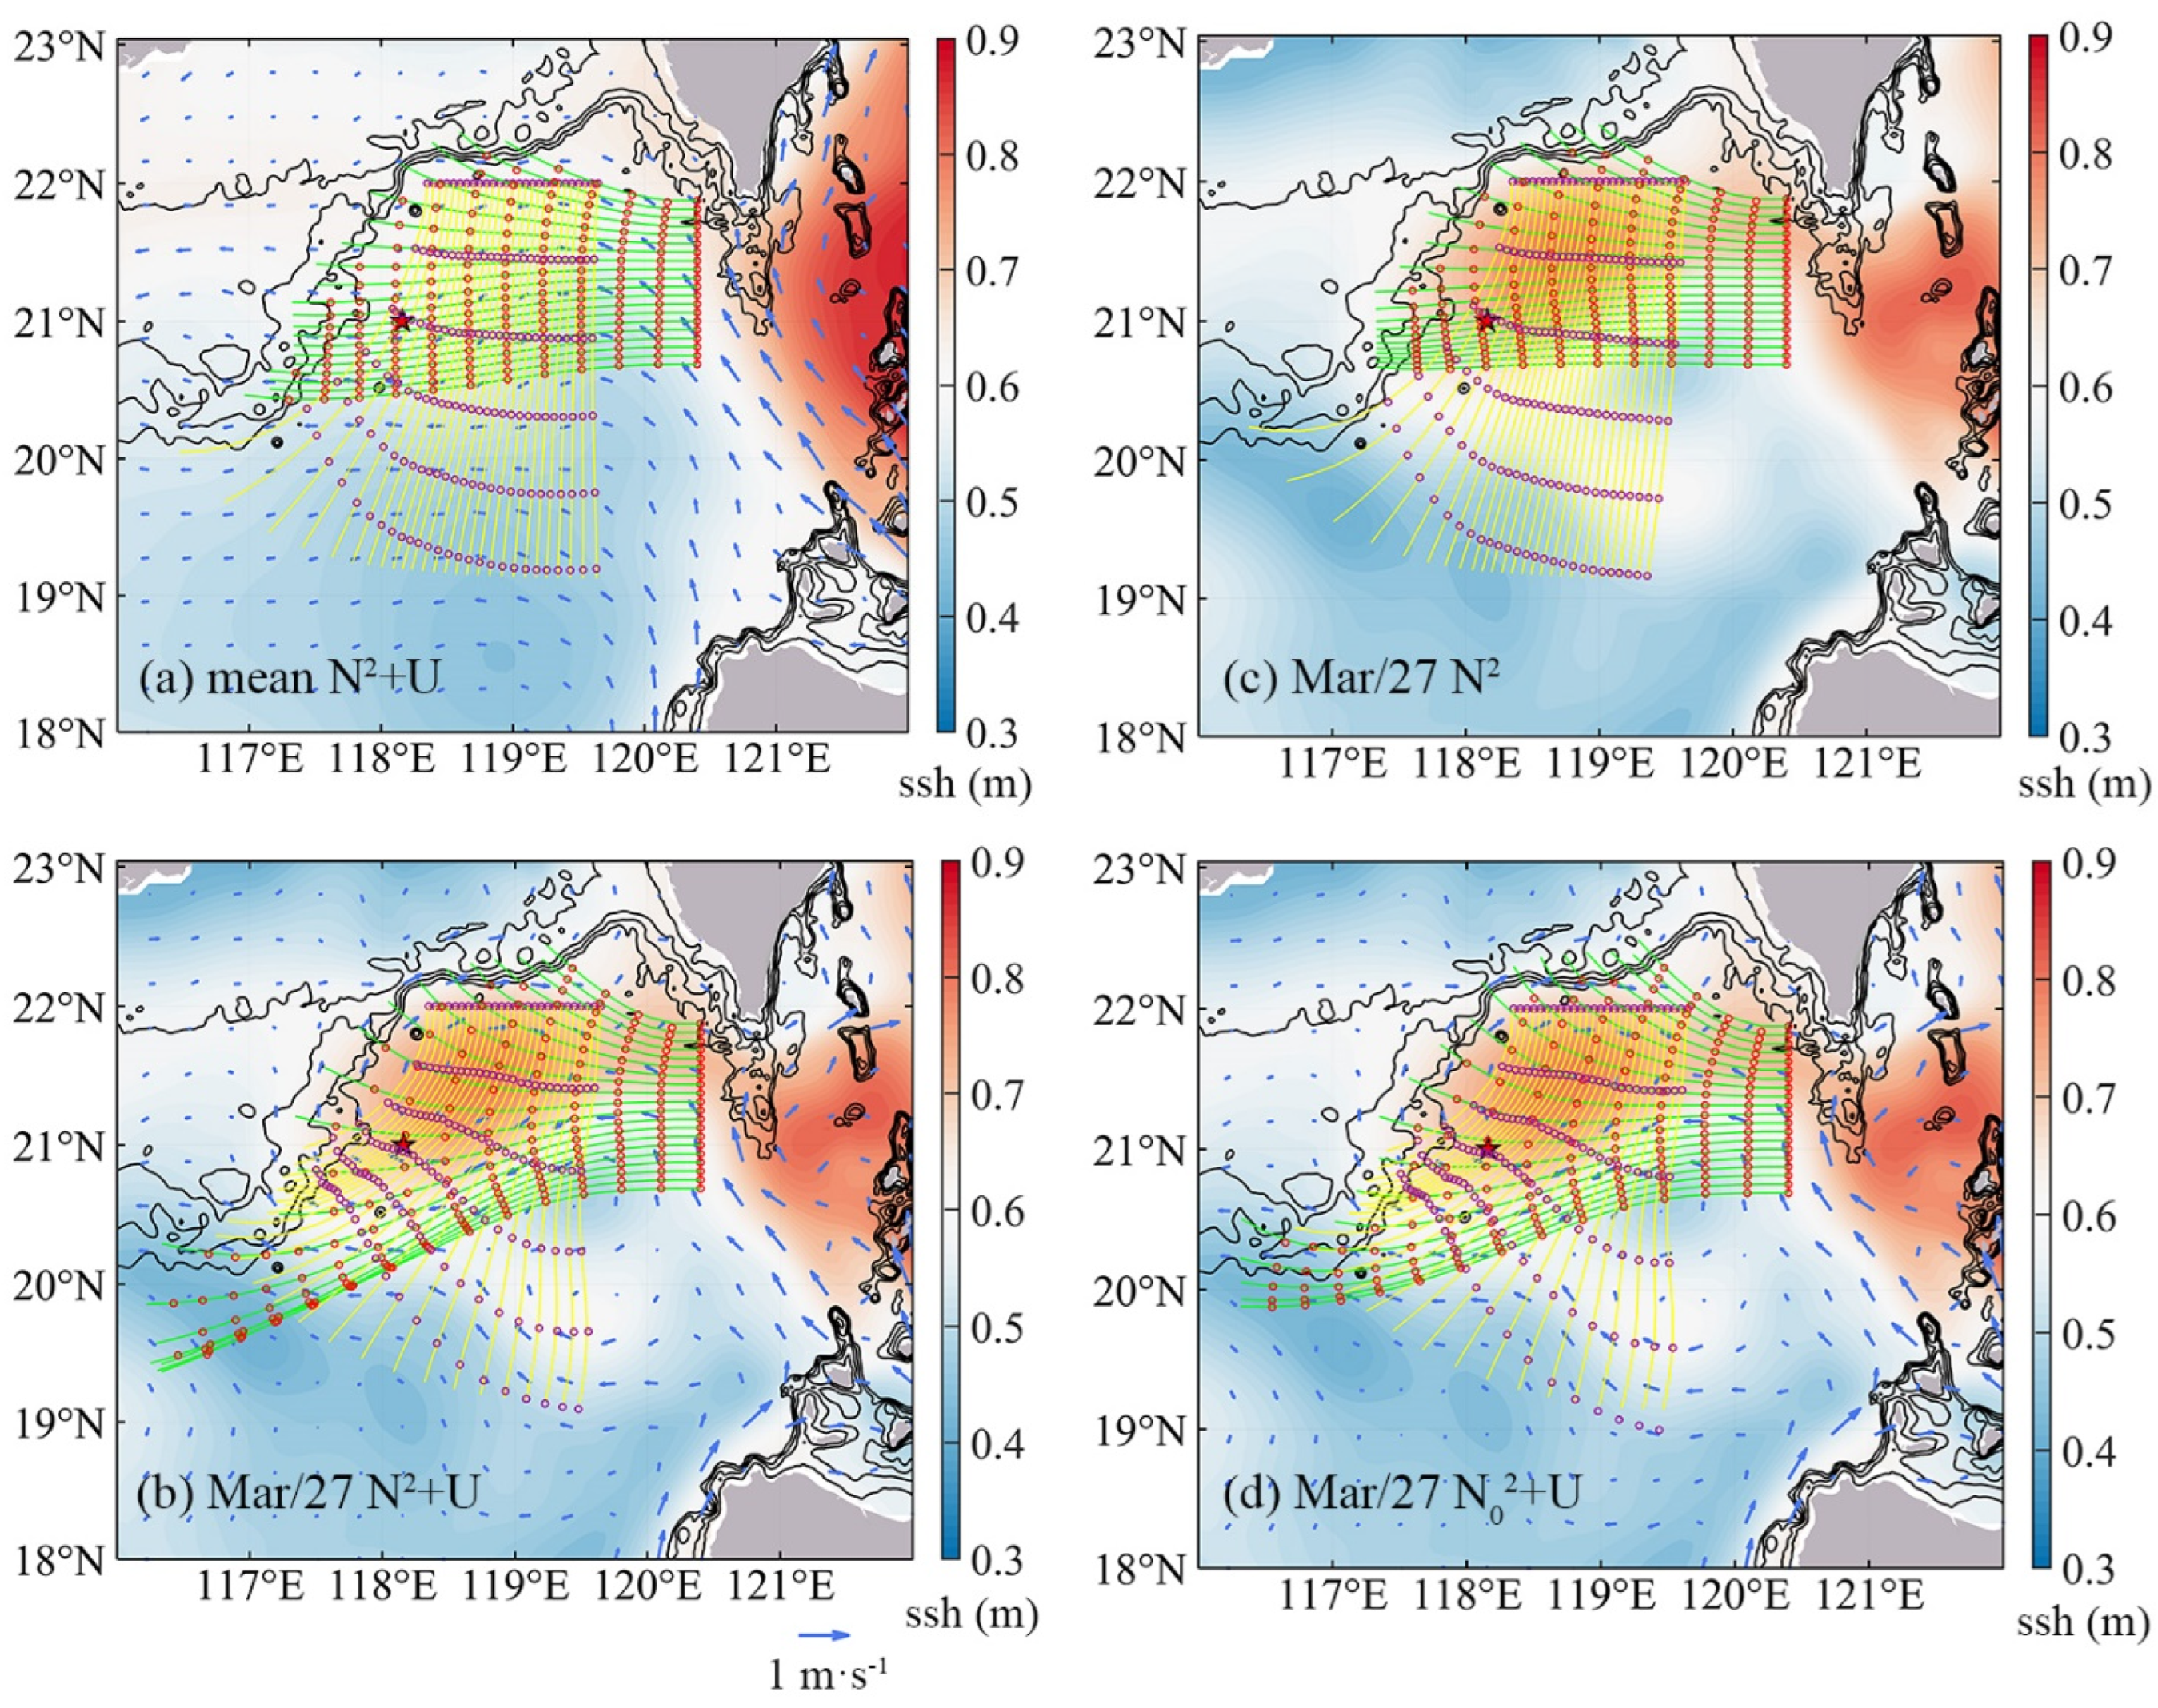
Figure 8a shows the ray trajectories of the mode-1 M2 internal tide in the mean state. Note that IW4 was located to the southwest of the anticyclonic eddy core (Figure 8b). When the anticyclonic eddy passed through IW4 on March 27, the westward-propagating branch accelerated due to the westward currents within the southern part of the eddy, reaching IW4 approximately 3 h earlier compared to the case in the mean state. Meanwhile, the southward-propagating branch of the M2 internal tide slowed down owing to the northward background flows, arriving at IW4 approximately 3 h later compared to the case of the mean state. Taken together, because of the influence of eddy-induced background fields on the variations of the propagation speed of internal tides, the phase difference between the westward and southward branches of mode-1 M2 internal tides changed by nearly 1/2π. Additionally, the crests of the two branches were both twisted due to the refraction within the anticyclonic eddy. Therefore, the antinodes and nodes within the interference pattern were shifted, and IW4 was more likely to be located closer to the antinode, resulting in the remarkable decrease in HKE/APE ratio in late March. The largely enhanced difference between c g c a l c and c g t h e o r y in late March also agrees with the theoretical results that the minimum of group speed occurred at antinodes or nodes when two mode-1 internal tides propagated in opposite directions [25].
Two sets of sensitivity experiments were conducted during the passage of the anticyclonic eddy on 27 March 2014. The first set considered only the variation in ray paths due to changes in stratification without accounting for background flow (Figure 8c). The second set examined ray paths under uniform stratification which was calculated by the average of the whole area in Figure 8d and variable background flow. Comparing with Figure 8b, it is evident that during the passage of the anticyclonic eddy, the phase difference induced solely by the varying background flow is more significant than that induced solely by the changing stratification (Figure 8c,d).

4. Discussion

In the long-term in situ mooring observations in the northern SCS, the mooring selected in this study builds upon previous research on the semidiurnal internal tide observations [20,32]. Satellite observations indicate that the mooring was positioned at the antinode of the interference field. Building on the findings of Zhao et al. (2012) [24], we further investigated the energy, group velocity, and amplitude variations of the semidiurnal internal tide at the antinode in the presence of interference phenomena. At the mooring position, there is a significant deviation between the HKE/APE ratio and the observed group velocity compared to theoretical values over a six-month period. Specifically, in March, the deviation of the HKE/APE ratio and observed group velocity from theoretical values is greater than in other observed months, indicating a more pronounced interference phenomenon during this time. Compared with the PIES observations in Wang et al., 2023 [23], both semidiurnal and M2 internal tide amplitude changed largely in March, which may indicate the influence of the background field on the interference. Based on previous studies [23,34,45], we hypothesize that the intensified interference phenomenon may be attributed to the passage of mesoscale eddies, which increase the phase difference of semidiurnal internal tide propagation from two source regions within the observation area. Therefore, to better verify our hypothesis, we conducted ray-tracing experiments to investigate this phenomenon.
The modulation effect of anticyclonic eddies on the propagation of the semidiurnal internal tide from different source regions in the northern SCS was investigated using numerical modeling. The conclusion that the influence of background flow on the semidiurnal internal tide propagation is greater than that of stratification, as obtained by Guo et al. (2023) [45], is consistent with our findings. It is further concluded that anticyclonic eddy passage accelerates the propagation of the semidiurnal internal tide from the Luzon Strait source region while simultaneously retarding the propagation of the semidiurnal internal tide from the southern Taiwan Strait continental slope region.

5. Conclusions

Based on mooring observations in the northern SCS, we found the existence of standing wave patterns by comparing the observed values of HKE/APE ratio and group speed with the theoretical values for progressive semidiurnal internal tides. The observed-mean HKE/APE ratio (~0.81) was relatively lower than the theoretical value (~1.32), indicating the mooring was located near the antinode rather than the node. Mode-1 M2 internal tides were then extracted from the MIOST-IT products that were derived from altimeter data from 1992 to 2017. The position of the mooring was expectedly located near the antinode in the mean state. Two branches of internal tides that result in the interference pattern were separated by using the DFF method. One of the branches is generated from the Luzon Strait and propagates westward, and the other is the southward branch that radiates from the continental slope of the southern Taiwan Strait.
In late March, a strong anticyclonic eddy passed by the mooring, and the HKE/APE ratio reached a minimum of about 0.14, probably suggesting that the antinodes within the interference pattern were shifted closer to the mooring. Meanwhile, observational estimate of the mode-1 group speed deviated from the theoretical speed by over 0.7 m s−1. The phase difference between the westward and southward branches when they arrived at the mooring was found to be changed by 1/2π on 27 March compared to the mean state. Furthermore, the crests of internal tides were distorted due to the influence of the anticyclonic eddy-induced background fields. The variations of the phase difference and crest shape act together to the shifting of the antinodes and nodes and the spatial distribution of the interference pattern. The sensitivity experiments indicate that varying background flow causes greater phase differences compared to stratifications.
We elucidate the variations in semidiurnal internal tide interference using an individual mooring. By analyzing the data from a single mooring, one can obtain the vertical structure and temporal variation of internal tides. In fact, due to its limited spatial coverage, the temporal variability of the spatial distribution of the interference pattern in the northern SCS cannot be directly obtained. In the future, a combination of mooring observations and altimeter data from the Surface Water and Ocean Topography mission will be employed to analyze the spatiotemporal characteristics of the interference pattern and its effects on internal tidal energy distribution.

Author Contributions

Conceptualization, X.H., W.W. and J.L.; methodology, W.W. and J.L.; software, W.W. and J.L.; validation, W.W. and J.L.; formal analysis, W.W.; investigation, W.W., J.L. and X.H.; resources, X.H.; data curation, W.W.; writing—original draft preparation, W.W.; writing—review and editing, J.L. and X.H.; visualization, W.W.; supervision, X.H.; project administration, X.H.; funding acquisition, X.H. All authors have read and agreed to the published version of the manuscript.

Funding

This study was supported by the Hainan Provincial NanHaiXinXing Project (Grant NHXXRCXM202364), National Natural Science Foundation of China (Grants 91976008, 92258301 and 91958205), Hainan Provincial Joint Project of Sanya Yazhou Bay Science and Technology City (Grant 120LH018).

Institutional Review Board Statement

Not applicable.

Informed Consent Statement

Not applicable.

Data Availability Statement

The MIOST-IT data were obtained from Aviso (ftp://ftp-access.aviso.altimetry.fr/, accessed on 7 July 2023). The HYCOM data were obtained from the HYCOM data server (https://www.hycom.org/dataserver, accessed on 1 July 2023). The internal tidal dataset provided by Zhao (2020) is accessible online (https://doi.org/10.6084/m9.figshare.12811586, accessed on 1 February 2024).

Acknowledgments

We appreciate the institutions or organizations mentioned in the Data Availability Statement.

Conflicts of Interest

The authors declare no conflicts of interest.

References

  1. Zhao, Z. Internal tide radiation from the Luzon Strait. J. Geophys. Res. Oceans 2014, 119, 5434–5448. [Google Scholar] [CrossRef]
  2. Zhao, Z. The global mode-2 M2 internal tide. J. Geophys. Res. Oceans 2018, 123, 7725–7746. [Google Scholar] [CrossRef]
  3. Arbic, B.K. Incorporating tides and internal gravity waves within global ocean general circulation models: A review. Prog. Oceanogr. 2022, 206, 102824. [Google Scholar] [CrossRef]
  4. Egbert, G.D.; Ray, R.D. Estimates of M2 tidal energy dissipation from TOPEX/Poseidon altimeter data. J. Geophys. Res. Oceans 2001, 106, 22475–22502. [Google Scholar] [CrossRef]
  5. MacKinnon, J.A.; Zhao, Z.; Whalen, C.B.; Waterhouse, A.F.; Trossman, D.S.; Sun, O.M.; Laurent, L.S.; Simmons, H.L.; Polzin, K.; Pinkel, R.; et al. Climate process team on internal wave–driven ocean mixing. Bull. Am. Meteorol. Soc. 2017, 98, 2429–2454. [Google Scholar] [CrossRef]
  6. Jayne, S.R.; St. Laurent, L.C. Parameterizing tidal dissipation over rough topography. Geophys. Res. Lett. 2001, 28, 811–814. [Google Scholar] [CrossRef]
  7. Johnston, T.M.S.; Merrifield, M.A. Internal tide scattering at seamounts, ridges, and islands. J. Geophys. Res. Oceans 2003, 108, C6. [Google Scholar] [CrossRef]
  8. Wang, Y.; Legg, S. Enhanced Dissipation of Internal Tides in a Mesoscale Baroclinic Eddy. J. Phys. Oceanogr. 2023, 53, 2293–2316. [Google Scholar] [CrossRef]
  9. Floor, J.W.; Auclair, F.; Marsaleix, P. Energy transfers in internal tide generation, propagation and dissipation in the deep ocean. Ocean Model. 2011, 38, 22–40. [Google Scholar] [CrossRef]
  10. Xu, Z.; Liu, K.; Yin, B.; Zhao, Z.; Wang, Y.; Li, Q. Long-range propagation and associated variability of internal tides in the South China Sea. J. Geophys. Res. Oceans 2016, 121, 8268–8286. [Google Scholar] [CrossRef]
  11. De Lavergne, C.; Falahat, S.; Madec, G.; Roquet, F.; Nycander, J.; Vic, C. Toward global maps of internal tide energy sinks. Ocean Model. 2019, 137, 52–75. [Google Scholar] [CrossRef]
  12. Guo, Z.; Cao, A.; Wang, S. Influence of Remote Internal Tides on the Locally Generated Internal Tides upon the Continental Slope in the South China Sea. J. Mar. Sci. Eng. 2021, 9, 1268. [Google Scholar] [CrossRef]
  13. Zhang, P.; Xu, Z.; You, J.; Hao, Z.; Yin, B.; Hou, Y.; Robertson, R. Satellite observed multisource internal tide radiation and interference in the Banda Sea. J. Geophys. Res. Oceans 2023, 128, e2022JC019383. [Google Scholar] [CrossRef]
  14. Rayson, M.D.; Jones, N.L.; Ivey, G.N.; Gong, Y. A seasonal harmonic model for internal tide amplitude prediction. J. Geophys. Res. Oceans 2021, 126, e2021JC017570. [Google Scholar] [CrossRef]
  15. Buijsman, M.C.; Legg, S.; Klymak, J. Double-ridge internal tide interference and its effect on dissipation in Luzon Strait. J. Phys. Oceanogr. 2012, 42, 1337–1356. [Google Scholar] [CrossRef]
  16. Buijsman, M.C.; Klymak, J.M.; Legg, S.; Alford, M.H.; Farmer, D.; MacKinnon, J.A.; Nash, J.D.; Park, J.-H.; Pickering, A.; Simmons, H. Three-dimensional double-ridge internal tide resonance in Luzon Strait. J. Phys. Oceanogr. 2014, 44, 850–869. [Google Scholar] [CrossRef]
  17. Rainville, L.; Johnston, T.M.S.; Carter, G.S.; Merrifield, M.A.; Pinkel, R.; Worcester, P.F.; Dushaw, B.D. Interference pattern and propagation of the M2 internal tide south of the Hawaiian Ridge. J. Phys. Oceanogr. 2010, 40, 311–325. [Google Scholar] [CrossRef]
  18. Zhao, Z. The global mode-1 S2 internal tide. J. Geophys. Res. Oceans 2017, 122, 8794–8812. [Google Scholar] [CrossRef]
  19. Zhao, Z.; Alford, M.H.; Simmons, H.L.; Brazhnikov, D.; Pinkel, R. Satellite investigation of the M2 internal tide in the Tasman Sea. J. Phys. Oceanogr. 2018, 48, 687–703. [Google Scholar] [CrossRef]
  20. Zhao, Z. Southward internal tides in the northeastern South China Sea. J. Geophys. Res. Oceans 2020, 125, e2020JC016554. [Google Scholar] [CrossRef]
  21. Wang, Y.; Xu, Z.; Hibiya, T.; Yin, B.; Wang, F. Radiation path of diurnal internal tides in the Northwestern pacific controlled by refraction and interference. J. Geophys. Res. Oceans 2021, 126, e2020JC016972. [Google Scholar] [CrossRef]
  22. Wang, Y.; Xu, Z.; Yin, B.; Hou, Y.; Chang, H. Long-range radiation and interference pattern of multisource M2 internal tides in the Philippine Sea. J. Geophys. Res. Oceans 2018, 123, 5091–5112. [Google Scholar] [CrossRef]
  23. Wang, M.; Zhu, X.H.; Zheng, H.; Chen, J.; Liu, Z.J.; Ren, Q.; Liu, Y.; Nan, F.; Yu, F.; Li, Q. Direct evidence of standing internal tide west of the Luzon Strait observed by a large-scale observation array. J. Phys. Oceanogr. 2023, 53, 2263–2280. [Google Scholar] [CrossRef]
  24. Zhao, Z.; Alford, M.H.; Lien, R.C.; Gregg, M.C.; Carter, G.S. Internal tides and mixing in a submarine canyon with time-varying stratification. J. Phys. Oceanogr. 2012, 42, 2121–2142. [Google Scholar] [CrossRef]
  25. Martini, K.I.; Alford, M.H.; Nash, J.D.; Kunze, E.; Merrifield, M.A. Diagnosing a partly standing internal wave in Mamala Bay, Oahu. Geophys. Res. Lett. 2007, 34, 17. [Google Scholar] [CrossRef]
  26. Johnston TM, S.; Rudnick, D.L.; Kelly, S.M. Standing internal tides in the Tasman Sea observed by gliders. J. Phys. Oceanogr. 2015, 45, 2715–2737. [Google Scholar] [CrossRef]
  27. Alford, M.H.; Simmons, H.L.; Marques, O.B.; Girton, J.B. Internal tide attenuation in the North Pacific. Geophys. Res. Lett. 2019, 46, 8205–8213. [Google Scholar] [CrossRef]
  28. Zhao, Z.; Wang, J.; Menemenlis, D.; Fu, L.L.; Chen, S.; Qiu, B. Decomposition of the multimodal multidirectional M2 internal tide field. J. Atmos. Ocean. Technol. 2019, 36, 1157–1173. [Google Scholar] [CrossRef]
  29. Pan, H.; Li, B.; Xu, T.; Wei, Z. Subseasonal tidal variability in the Gulf of Tonkin observed by multi-satellite altimeters and tide gauges. Remote Sens. 2023, 15, 466. [Google Scholar] [CrossRef]
  30. Li, B.; Wei, Z.; Wang, Y.; Guo, X.; Xu, T.; Lv, X. Application of S_TIDE in exploration of seasonal variations of internal tidal amplitudes in the northern South China Sea. J. Atmos. Ocean. Technol. 2021, 38, 1425–1438. [Google Scholar] [CrossRef]
  31. Cao, A.; Guo, Z.; Lv, X.; Song, J.; Zhang, J. Coherent and incoherent features, seasonal behaviors and spatial variations of internal tides in the northern South China Sea. J. Mar. Sci. Eng. 2017, 172, 75–83. [Google Scholar] [CrossRef]
  32. Guo, Z.; Cao, A.; Lü, X. Seasonal variation and modal content of internal tides in the northern South China Sea. J. Oceanol. Limnol. 2018, 36, 651–662. [Google Scholar] [CrossRef]
  33. Xu, Z.; Yin, B.; Hou, Y.; Xu, Y. Variability of internal tides and near-inertial waves on the continental slope of the northwestern South China Sea. J. Geophys. Res. Oceans 2013, 118, 197–211. [Google Scholar] [CrossRef]
  34. Li, B.; Wei, Z.; Wang, X.; Fu, Y.; Fu, Q.; Li, J.; Lv, X. Variability of coherent and incoherent features of internal tides in the north South China Sea. Sci. Rep. 2020, 10, 12904. [Google Scholar] [CrossRef] [PubMed]
  35. Wang, Z.; Huang, X.; Yang, Y.; Zhang, Z.; Zhou, C.; Zhao, W.; Tian, J. Impacts of subtidal motions and the earth rotation on modal characteristics of the semidiurnal internal tide. J. Oceanogr. 2020, 76, 15–27. [Google Scholar] [CrossRef]
  36. Huang, X.; Wang, Z.; Zhang, Z.; Yang, Y.; Zhou, C.; Yang, Q.; Zhao, W.; Tian, J. Role of mesoscale eddies in modulating the semidiurnal internal tide: Observation results in the northern South China Sea. J. Phys. Oceanogr. 2018, 48, 1749–1770. [Google Scholar] [CrossRef]
  37. Miao, M.; Zhang, Z.; Qiu, B.; Liu, Z.; Zhang, X.; Zhou, C.; Guan, S.; Huang, X.; Zhao, W.; Tian, J. On contributions of multiscale dynamic processes to the steric height in the northeastern South China Sea as revealed by moored observations. Geophys. Res. Lett. 2021, 48, e2021GL093829. [Google Scholar] [CrossRef]
  38. Zhang, Z.; Zhao, W.; Tian, J.; Liang, X. A mesoscale eddy pair southwest of Taiwan and its influence on deep circulation. J. Geophys. Res. Oceans 2013, 118, 6479–6494. [Google Scholar] [CrossRef]
  39. Duda, T.F.; Lin, Y.T.; Buijsman, M.; Newhall, A.E. Internal tidal modal ray refraction and energy ducting in baroclinic Gulf Stream currents. J. Phys. Oceanogr. 2018, 48, 1969–1993. [Google Scholar] [CrossRef]
  40. Zhao, Z.; Alford, M.H.; MacKinnon, J.A.; Pinkel, R. Long-range propagation of the semidiurnal internal tide from the Hawaiian Ridge. J. Phys. Oceanogr. 2010, 40, 713–736. [Google Scholar] [CrossRef]
  41. Alford, M.H.; Zhao, Z. Global patterns of low-mode internal-wave propagation. Part II: Group speed. J. Phys. Oceanogr. 2007, 37, 1849–1858. [Google Scholar] [CrossRef]
  42. Gong, Y.; Rayson, M.D.; Jones, N.L.; Ivey, G.N. Directional decomposition of internal tides propagating from multiple generation sites. Ocean Model. 2021, 162, 101801. [Google Scholar] [CrossRef]
  43. Gong, Y.; Xie, J.; Xu, J.; Chen, Z.; He, Y.; Cai, S. A directional decomposition method to estimate the reflection and transmission of nonlinear internal waves over a slope. J. Geophys. Res. Oceans 2022, 127, e2022JC018598. [Google Scholar] [CrossRef]
  44. Ubelmann, C.; Carrere, L.; Durand, C.; Dibarboure, G.; Faugère, Y.; Ballarotta, M.; Briol, F.; Lyard, F. Simultaneous estimation of ocean mesoscale and coherent internal tide sea surface height signatures from the global altimetry record. Ocean Sci. Discuss. 2021, 2021, 1–19. [Google Scholar] [CrossRef]
  45. Guo, Z.; Wang, S.; Cao, A.; Xie, J.; Song, J.; Guo, X. Refraction of the M2 internal tides by mesoscale eddies in the South China Sea. Deep. Sea Res. Part I Oceanogr. Res. Pap. 2023, 192, 103946. [Google Scholar] [CrossRef]
Figure 1. Map of the northern SCS. The background color indicates the topography. The white arrows denote the flux vectors of mode-1 M2 internal tides supplied by Zhao (2020) [20]. The red pentagram indicates the location of the mooring IW4.
Jmse 12 00811 g001
Figure 2. Depth-integrated (a) total energy, (b) HKE, and (c) APE of semidiurnal internal tides in modes 1–3.
Jmse 12 00811 g002
Figure 3. Semidiurnal energy flux at IW4: (a) flux magnitude, (b) zonal flux, (c) meridional flux, and (d) mode-1 flux direction (blue). The orange dashed line denotes the westward direction. The propagation direction anticlockwise rotated between 0° and 360° from due east.
Jmse 12 00811 g003
Figure 4. (a) Mode-1 HKE/APE ratio. The purple shading and cyan dashed line indicate the observed and theoretical values, respectively. The yellow dashed line represents the mean ratio between HKE and APE during the observation period. (b) The ratio of flux magnitude to total energy of mode-1 M2 internal tides c g t h e o r y , which is estimated from mooring measurements. The theoretical group velocity c g c a l c varies with the time-varying stratification. (c) The red line indicates the amplitude of semidiurnal internal tide from harmonic analysis with a 3-day window. The blue line indicates the amplitude of M2 internal tide from harmonic analysis with a 28-day window.
Jmse 12 00811 g004
Figure 5. (a) The Sea Surface Height (SSH) induced by M2 internal tides supplied by Zhao (2020) [17]. The red star denotes the position of IW4. The gray lines denote the isobaths. (b) Two-dimensional horizontal wavenumber spectrum of raw SSH of MIOST-IT. (c,d) The SSH at UTC 09:00 on 27 March 2014 and amplitude induced by mode-1 M2 internal tides extracted from MIOST-IT.
Jmse 12 00811 g005
Figure 6. The DFF method to resolve the multiple M2 internal tides of Figure 5c. (a) The westward component (120°–240°). (b) The southward component (240°–300°). (c) The superposed SSH of the westward and southward components. (df) The same as (ac) but for the amplitude.
Jmse 12 00811 g006
Figure 7. Low-passed (a) temperature, (b) eastward, and (c) northward velocity at IW4 with a 10-day sliding window.
Jmse 12 00811 g007
Figure 8. Mode-1 M2 internal tidal rays. The green curves and yellow curves represent the ray trajectories from the Luzon Strait and continental slope of the southern Taiwan Strait. The background colors and blue vectors represent the SSH and geostrophic currents provided by HYCOM. The red and purple circles are plotted every 3 h to indicate the wave crests. The red star represents mooring IW4. (a) Rays of the background fields averaged over the whole mooring observation period. (b) Rays on 27 March 2014. (c) is the same as (b) but without background flow. (d) is the same as (b) but for a horizontal uniform stratification.
Jmse 12 00811 g008
Table 1. Detailed configuration of mooring IW4.
Mooring InstrumentInstrument Depth (m)Range Depth (m)Sample Interval (min)
75-kHz
ADCP (up)
49250-4623
75-kHz
ADCP (dn)
492, 996522–972, 996–14763
300-kHz
ADCP (dn)
19001930–20203
CTD87, 287, 497, 1001, 1705, 1905*2
T/S chains**65–465, 465–665, 665–9653
RCM1700**30
* indicates that the instrument observes only single-layer data. ** indicates that the bin size for the T/S chains is 20, 50, and 100 m at 65–465, 465–665, and 665–965 m, respectively.
Disclaimer/Publisher’s Note: The statements, opinions and data contained in all publications are solely those of the individual author(s) and contributor(s) and not of MDPI and/or the editor(s). MDPI and/or the editor(s) disclaim responsibility for any injury to people or property resulting from any ideas, methods, instructions or products referred to in the content.