Abstract
This study examines the impact of the spacing parameter on the efficacy of an array of hybrid modules functioning as both floating breakwaters and wave energy converters. The dual functionality is ensured by the ability of the device to autoadjust its submergence. The behavior of multiple 1:40 scaled modules was tested in the wave tank of the University of Campania “Luigi Vanvitelli”. The objective was to assess the hydraulic performance of the array by analyzing transmission, reflection, and dissipation coefficients under different wave conditions. Specifically, the transmission coefficient ranges between 0.85 and 0.51, depending on the relative wavelength and wave steepness, while the reflection and dissipation coefficients vary, respectively, between 0.70–0.20 and 0.55–0.3. In any case, the results underscore the critical importance of the spacing parameter.
1. Introduction
The growing interest in offshore and maritime activities in recent years, driven by the rapidly increasing size of ships and the expansion of the offshore wind and marine renewable energy sector, has emphasized the importance of floating breakwaters. These structures are used to temporarily attenuate waves or even permanently reduce wave loads [1]. Furthermore, as various concepts for offshore areas aimed at exploiting marine natural resources and colocating maritime activities such as aquaculture [2] and offshore wind farms [3,4] are emerging [5], there is a rising interest in incorporating wave energy extraction features into traditional dissipating floating breakwaters. This integration aims to share construction, installation, operation, and maintenance costs [6]. In this context, an innovative hybrid floating breakwater–wave energy converter has recently been proposed through a joint venture between the University of Campania “Luigi Vanvitelli” and the Institute of Marine Engineering (INM) of the National Research Council (CNR) of Italy [7].
The main idea is to provide offshore defense for the “energy archipelago” conceived by INM-CNR, representing a multiuse energy hub for exploiting marine renewable energy with combined and/or colocated solutions to reduce power output variability, among other benefits [8,9]. The archipelago is expected to host several devices for energy conversion, marine aquaculture, and green shipping, hence necessitating the creation of an offshore calm area protected against storms. To fulfill both functions (carbon-free energy generation and wave defense), the external floating dike is designed to be almost fully submerged in extreme and severe sea states, guaranteeing the creation of a protected sea area. In milder sea states, it is properly drafted to resonate with waves, producing energy to supply offshore activities. Achieving both purposes requires a specific spatial layout, including multiple modules on the same row and a supplementary row of staggered modules.
Most investigations of hybrid FB-WEC, both experimental and numerical, refer to a single module [10,11]. However, as demonstrated for fixed hybrid structures [12,13,14], when waves impact a breakwater, part is absorbed (thus, liable for conversion into electricity), part is reflected, and part is dissipated. As a result, the wave height decreases on the sheltered side [15,16], which is particularly notable when examining a collective arrangement such as a farm [17], showcasing its role as a cohesive structure effectively mitigating wave impacts [18].
The significance of spatial layout on the efficacy of arrays of floating breakwaters has been investigated in several studies, underscoring its crucial importance [19,20], particularly in coastal protection contexts [21]. And it is in these contexts that integrating the energy production function into the classic breakwater function gained interest among researchers [22,23]. This dual purpose introduces additional complexities, especially when considering multiple integrated devices [24,25]. In this paper, experimental tests conducted at the Maritime Hydraulic Laboratory within the Engineering Department of the University of Campania “Luigi Vanvitelli”, using a 1:40 Froude-scaled model compared with the actual structure, are described and analyzed.
The focus was on investigating multiple layouts of the hybrid device, with a submergence level of 95%, as shown in Figure 1a. This level was chosen to fulfill the breakwater function, as an increased submerged volume enhances stability. Particularly, each layout comprehended nine hybrid modules, arranged in two staggered rows, as shown in Figure 1b. The spacing between the two rows represented the main parameter investigated in this paper.
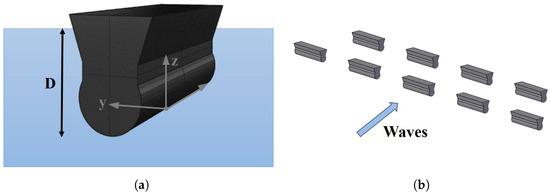
Figure 1.
(a) Origin of the reference system with the tested draft D and (b) sketch of the layout.
The tests analyzed herein build upon results obtained from a 1:10 Froude-scaled model of the same FB-WEC, discussed in [26]. The larger scale aimed to evaluate the device’s dynamic behavior, mooring loads, and hydraulic performances under milder wave conditions, i.e., during WEC operation. To protect installations within the archipelago, it is crucial to evaluate the hydraulic performance of an array of FB-WEC modules under storm conditions, considering both wave transmission to ensure relatively low wave agitation inside the sheltered area and wave reflection. The 1:40 scale ensures suitable conditions for extreme analysis.
Section 2 furnishes thorough explanations of the physical model, encompassing both the device and the experimental arrangement. Following this, Section 3 delineates the principal findings regarding dynamic and hydrodynamic performance, while Section 4 delves into the impact of spacing on these findings and explores the potential for the module to serve as a breakwater and alternatively as a wave energy converter, contingent upon its draft. Lastly, Section 5 presents the concluding remarks.
2. Materials and Methods
This section is organized as follows: Section 2.1 delineates the hybrid module’s geometry and characteristics, and Section 2.2 then furnishes a concise description of the physical model, elucidating the floater and mooring’s properties and layout. Section 2.3 presents details regarding the wave tank, the instrumentation, and the generation–acquisition system. Finally, a summary of the experimental test program is provided in Section 2.4.
2.1. The Device
The innovative hybrid system investigated in this study, which builds upon existing solutions integrating wave energy devices and floating breakwater technologies, was initially introduced in [27]. However, several modifications were necessary to enhance its assembly and functionality [28]. The distinguishing characteristic of this device lies in its adjustable draft, which allows for dual functionality as alternatively a breakwater and a wave energy converter. The draft of the floater can be altered by pumping water inside the module, depending on the sea-state conditions to optimize production or stability. When in severe and extreme conditions, the module functions as a breakwater, protecting the structures placed inside the archipelago by absorbing and attenuating waves. On the other hand, when the floating device stands in the more frequent mild sea states, it works as a wave energy harvester, augmenting the energy output of the hub.
The floating breakwater–wave energy converter (FB-WEC) design comprises a longitudinally extending truncated lower cylinder connected to an upper trapezoid. The reference system originates on the keel line and is centered along its length (see Figure 1a). The free surface is intended to be tangent to the keel; a variation in the draft determines the device’s movement along the negative z-axis.
The stability is represented by the transverse metacentric height ; this parameter indicates the distance between the metacenter and the center of gravity [29]. The metacenter, denoted by , is a fictitious point intersecting the line passing from the center of buoyancy, B, and the center of gravity, G. For the breakwater use of the module, the metacentric height was chosen to be equal to 0.6 m. Knowing , using Equation (1), the center of gravity is derived:
In this equation, , known as the metacentric radius, represents the distance from the center of buoyancy to the metacenter; indicates the distance between the center of buoyancy and the keel line, and indicates the distance from the keel line to the center of gravity. These parameters are strongly dependent on hull shape and on the weight distribution; in fact, when adjusting the draft, D, they change due to variations in weight and submerged volume (hereinafter displacement ∇). The main geometrical parameters constituting the full-scale module in its breakwater function are reported in Table 1.

Table 1.
Geometric properties in full-scale.
2.2. Experimental Set-Up
The model construction involved aluminum sheets for the main profile and 0.5 mm thick PVC for the side and upper profiles. Additionally, eyelets were fixed on the side sheets to serve as connection points for the anchoring system (Figure 2a). To properly identify the attenuation behavior of the device, depending on the spacing between modules, multiple Froude-scaled 1:40 of these were tested in the tank, arranged in different layouts (Figure 2b). Each model was tethered with four lines (two in front and two in the rear) using rubber bands adjusted to achieve the appropriate stiffness (refer to Figure 2c). The gravity anchors comprised two heavy steel bars for each row to which, respectively, the front and rear moorings of each device line were connected (Figure 2d).
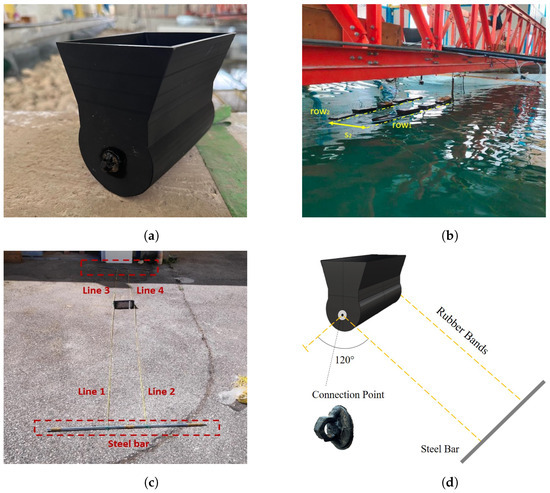
Figure 2.
(a) Single model, (b) array under regular wave testing, (c) mooring lines arrangement, and (d) sketch of the anchoring system.
Table 2 provides an overview of the essential geometric and inertial properties of the floating platform for a single 1:40 model. Meanwhile, Table 3 outlines the components of the mooring system.
Table 2.
Properties of the platform in model scale.
Table 3.
Properties of the mooring line system in model scale.
2.3. Facility, Instrumentation, and Measurements
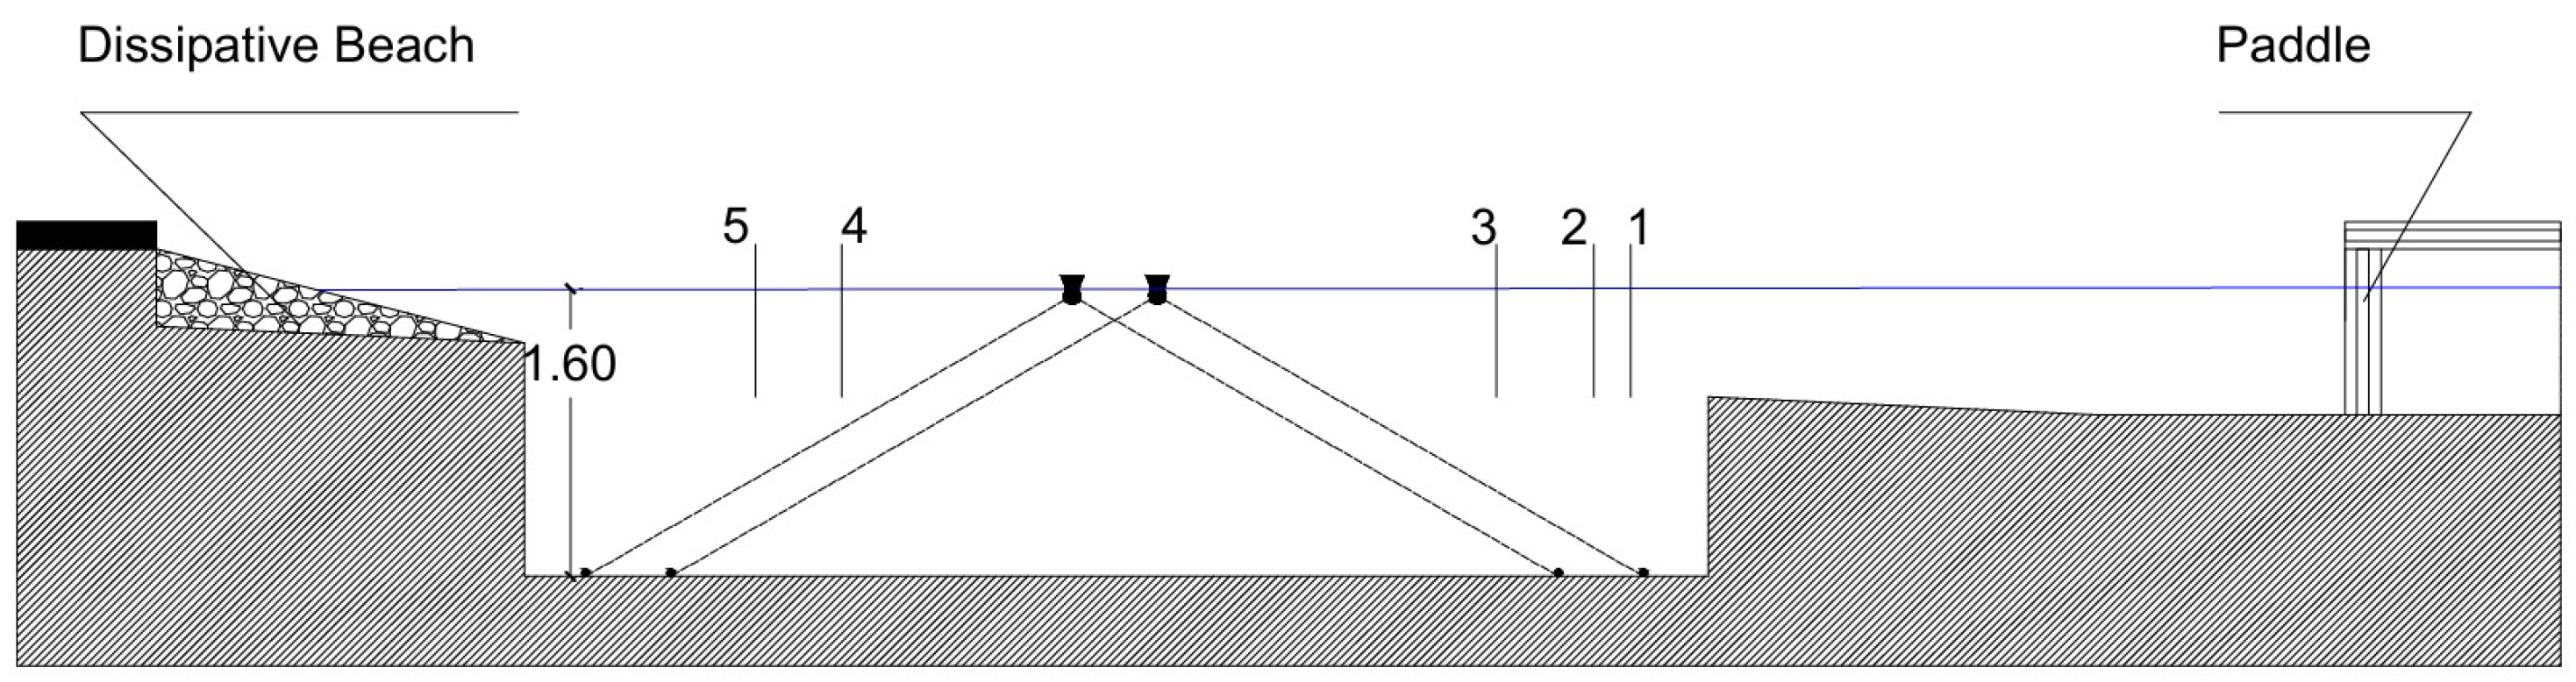
The experimental study occurred in the wave tank within the Department of Engineering at the University of Campania “L. Vanvitelli”, whose section is illustrated in Figure 3. The tank dimensions measured 16 m in length along the wave paddle and 12 m in width perpendicular to it, featuring variable depths ranging from 0.9 m to 0.43 m. Toward the end of the tank, a dissipative beach was constructed, while a deeper section was established in the center, measuring 5.50 m by 6.50 m parallel and perpendicular to the wavefront, respectively, with depths ranging from 1 m to 1.30 m. When filled with water, the tank maintained an average depth of 1.4–1.8 m.
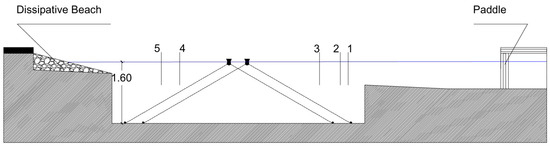
Figure 3.
Cross-section of the wave basin.
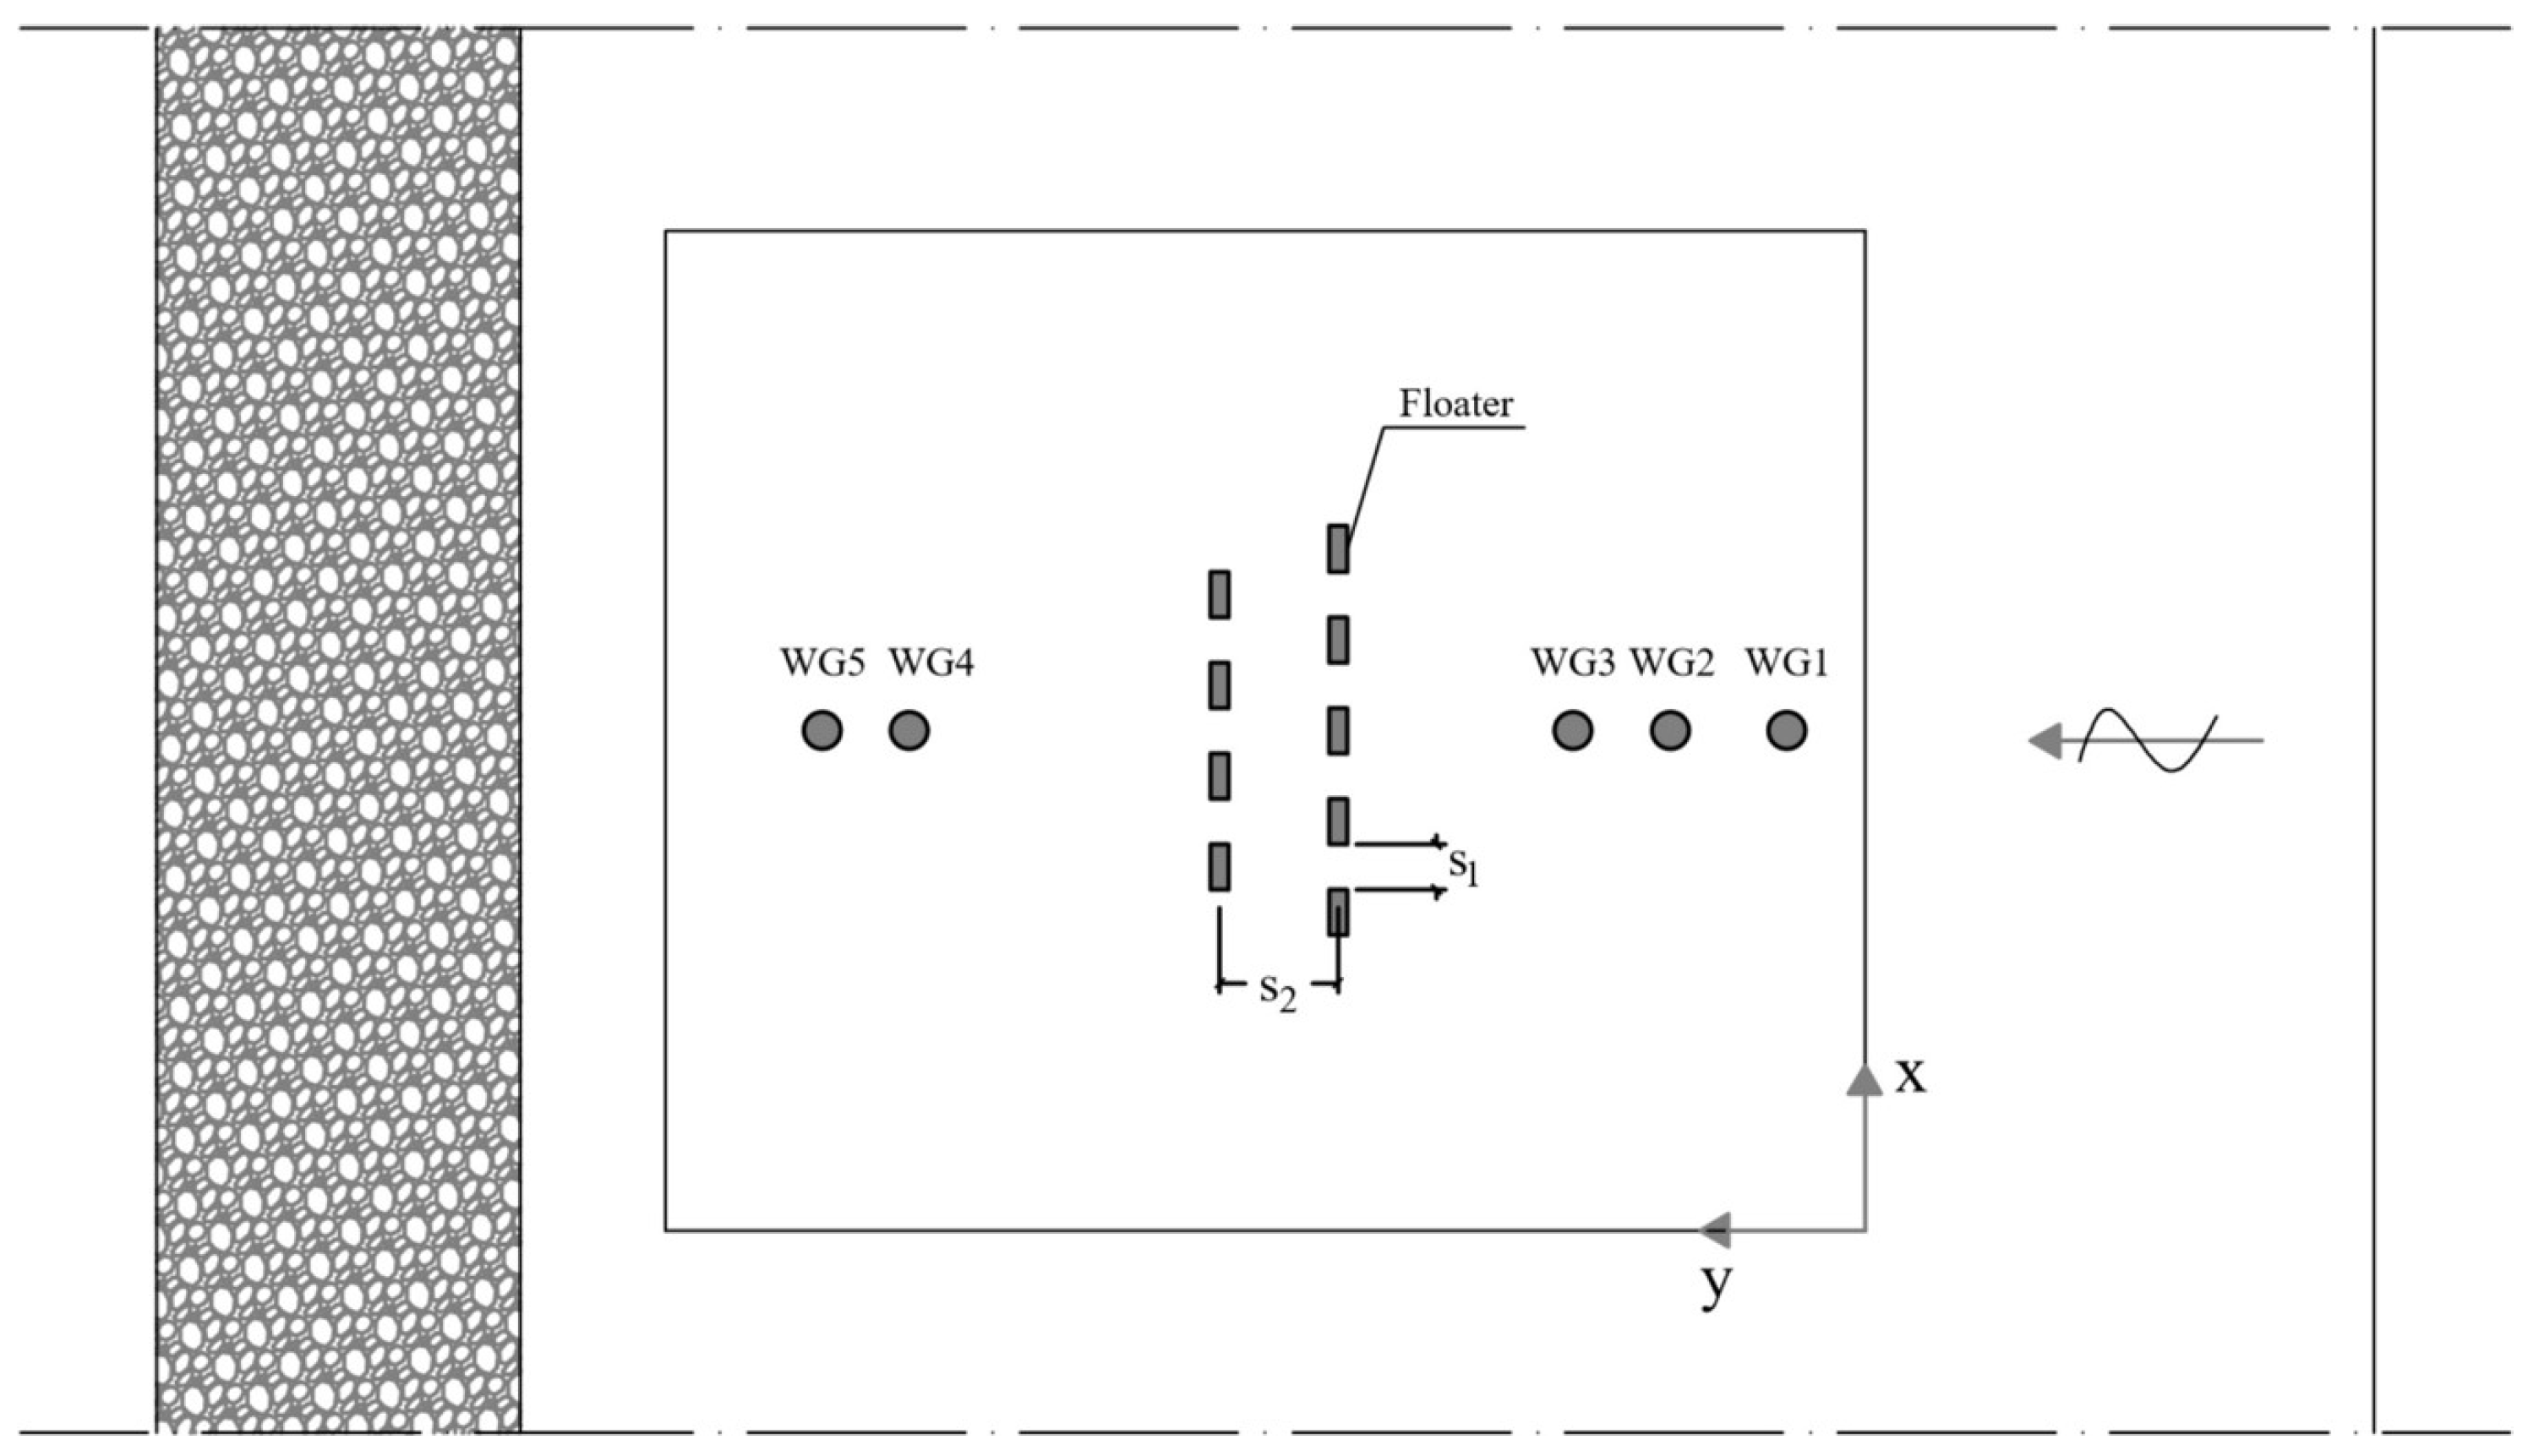
The experimental campaign’s main objectives were evaluating the device’s dynamic behavior and assessing its hydraulic performance in waves. For the first purpose, an inertial measurement unit (IMU) measuring angular velocities, accelerations, and inclinations along the three axes, with a sampling rate of 20 Hz, was used [30]. The hydrodynamics around the device, instead, were investigated by measuring the wave profile using five aligned resistive wave gauges (WGs), with three located in front of the models to measure wave reflection based on the Mansard and Funke method [31] and two placed behind the models to measure wave transmission. The coordinates of the five WGs are reported in Table 4, considering the origin aligned with the down-right corner of the pit (as in Figure 4), with y representing the direction of the wave propagation. The AwaSys software (version 5), developed at the Hydraulics and Coastal Engineering Laboratory of the University of Aalborg in Denmark [32], was employed to generate regular waves. Wave profile elevations, sampled at 20 Hz, were recorded through the software “WaveLab” (version 2) [33], then processed and analyzed using MATLAB (version 2022b).
Table 4.
Coordinates of the wave gauges, starting from the bottom-left corner of the pit.
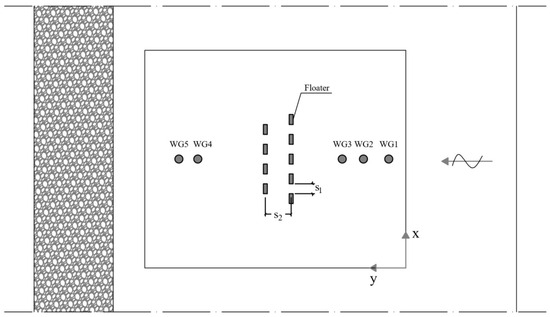
Figure 4.
Sketch of the modules’ positioning.
2.4. Experimental Test Program
The experimental test program was divided into two main parts and is described in Section 2.4.1 and Section 2.4.2, respectively, concerning the calibration of the single module and the hydrodynamics of different layouts under waves.
2.4.1. Model Calibration
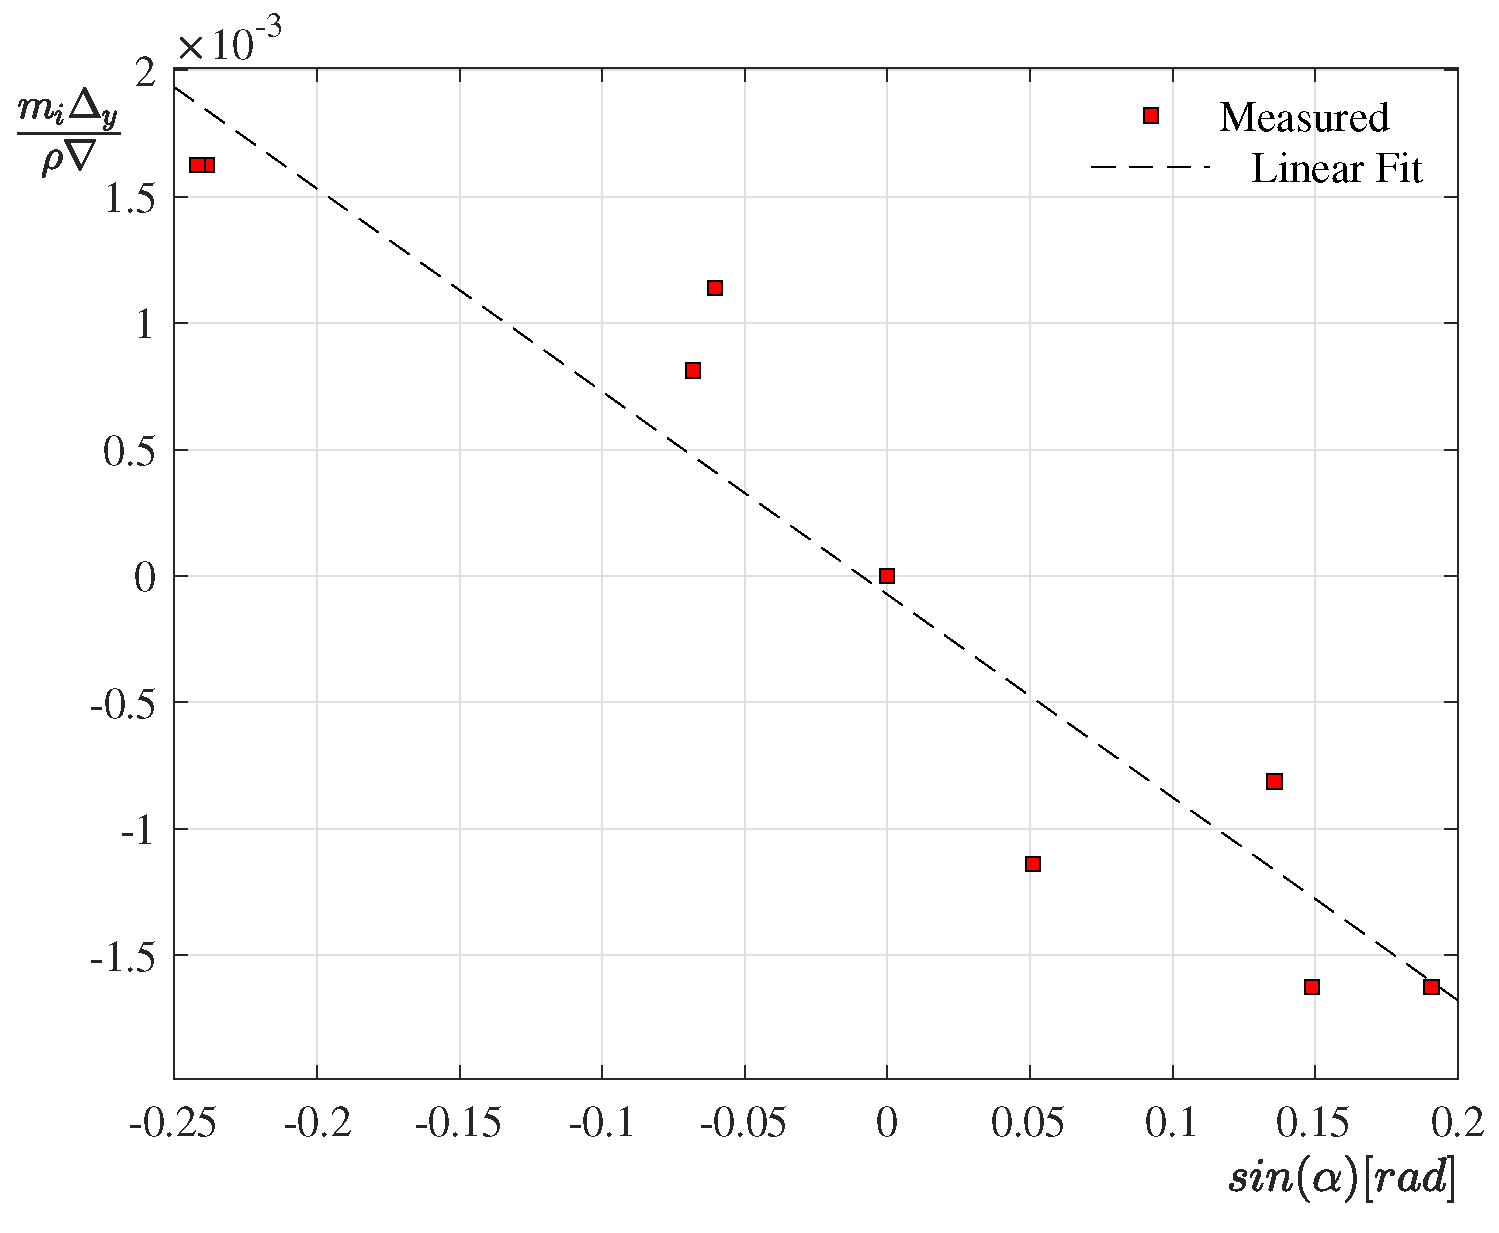
The initial phase of the experimental campaign focused on calibrating a single model to precisely determine its mass and inertial properties, as well as its draft, trim, and heel. Achieving the design characteristics of the model required successive steps. Firstly, the model was weighed without ballast, to determine its center of gravity and its roll and pitch natural periods. Following that, initial trials were carried out in water to verify the characteristics of the model, such as its static draft, trim, and heel. To determine the transverse metacentric height , inclining tests were then executed. Specifically, these tests involved measuring the angle of inclination while moving a specified mass m in various known positions . The stability parameter was then calculated by solving Equation (2). After attaining the desired static draft, trim, heel, and design weight values, the model underwent evaluation of its roll inertia by measuring the angular frequency in water and using Equation (3) [34].
The single-moored model was finally subjected to decay tests, across the six DoFs (the degrees of freedom are the three motions, surge, sway, and heave, and the three rotations, roll, pitch, and yaw), with particular emphasis on the roll rotations. These tests were aimed at determining the natural periods and damping coefficients of the model. Specifically, for each DoF, the natural period was determined by averaging the decay cycles observed by the device over multiple n-th iterations (Equation (4)).
2.4.2. Response under Wave Loads
Once the single model was correctly identified, its response to wave loads could be analyzed dynamically using response amplitude operators, and its hydrodynamic performances could be assessed in terms of transmission, reflection, and dissipation coefficients. However, a single module was unable to properly attenuate waves due to the small scale compared with the wave characteristics.
For this reason, an array of nine devices, organized in two rows were tested. Particularly, as seen in Figure 4, the first-row facing wave is composed of five devices, while the second row was composed of four devices, staggered with respect to the first line. The distance between adjacent modules, named , was imposed to be half of the length of the device. The second row was tested for three values of the distance : being, respectively, five times, three and half times, and two times the waterline beam ( = 5· = 3.5· = 2·).
The different layouts of models were tested in regular and irregular waves to determine their dynamic response and hydraulic behavior.
In particular, the first one was defined by the response amplitude operators () of the motions, whose general form is provided in Equation (5). In this equation, represents the j-th DoF, dependent on the angular frequency , and a indicates the wave amplitude.
Hydrodynamic performances were appraised through the transmission, reflection, and dissipation coefficients, respectively, , , and . These coefficients are derived from Equations (6)–(8) where , , and represent, respectively, the transmitted, reflected, and incident wave heights.
Presented in Table 5 is a summary of the test matrix for the models’ regular wave experiments, encompassing three different values indicating wave steepness. Furthermore, Table 6 details extreme tests carried out for specific 1:40 configurations. Each regular wave test consisted of 100 waves.
Table 5.
Regular wave conditions.
Table 6.
Extreme wave tests.
Moreover, in order to clarify the impact of draft variation on the interaction between waves and the module, the single module underwent testing under the same irregular wave conditions. These irregular waves were produced utilizing a JONSWAP spectrum [35] with parameters set to a peak enhancement factor of 3.3, a spectral wave height of 0.14 m, and a peak wave period of 1.6 s. Irregular wave tests comprised 1000 waves.
3. Results
3.1. Model Calibration
Initially, the model in air enabled the measurements of its mass, resulting in a value of 1.42 kg, and of its inertia moments. Following this, the floater underwent appropriate ballasting to attain the design draft and center of gravity, while maintaining trim and heel at zero. Once in the water, the stability parameter was determined. Figure 5 illustrates the results; particularly, the slope of the line interpolating the single results identifies the transverse metacentric height. This parameter was found to be 0.0075 m, which is half of the target value of 0.015 m. Achieving the target proved to be an extremely challenging task due to the small size of the model. Finally, the single device’s natural periods were identified by conducting free decay tests across the six DoFs with the module in calm water; results are summarized in Table 7.
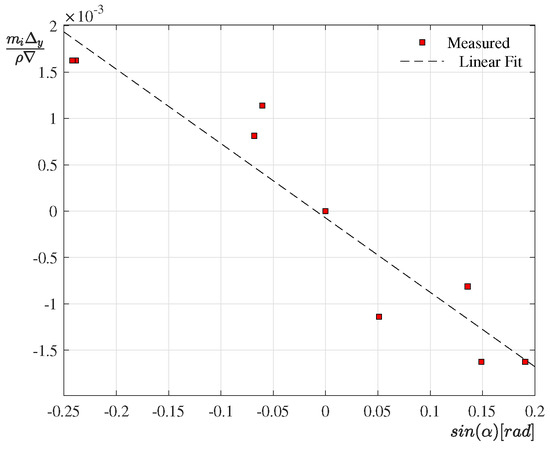
Figure 5.
Derivation of the transverse metacentric height.
Table 7.
Natural Periods in the six DoFs.
3.2. Response under Wave Loads
The dynamic behavior of the model was investigated by evaluating the response amplitude operators () of the motions; hydrodynamic performances instead were assessed through the examination of transmission, reflection, and dissipation coefficients.
3.2.1. Dynamic Response
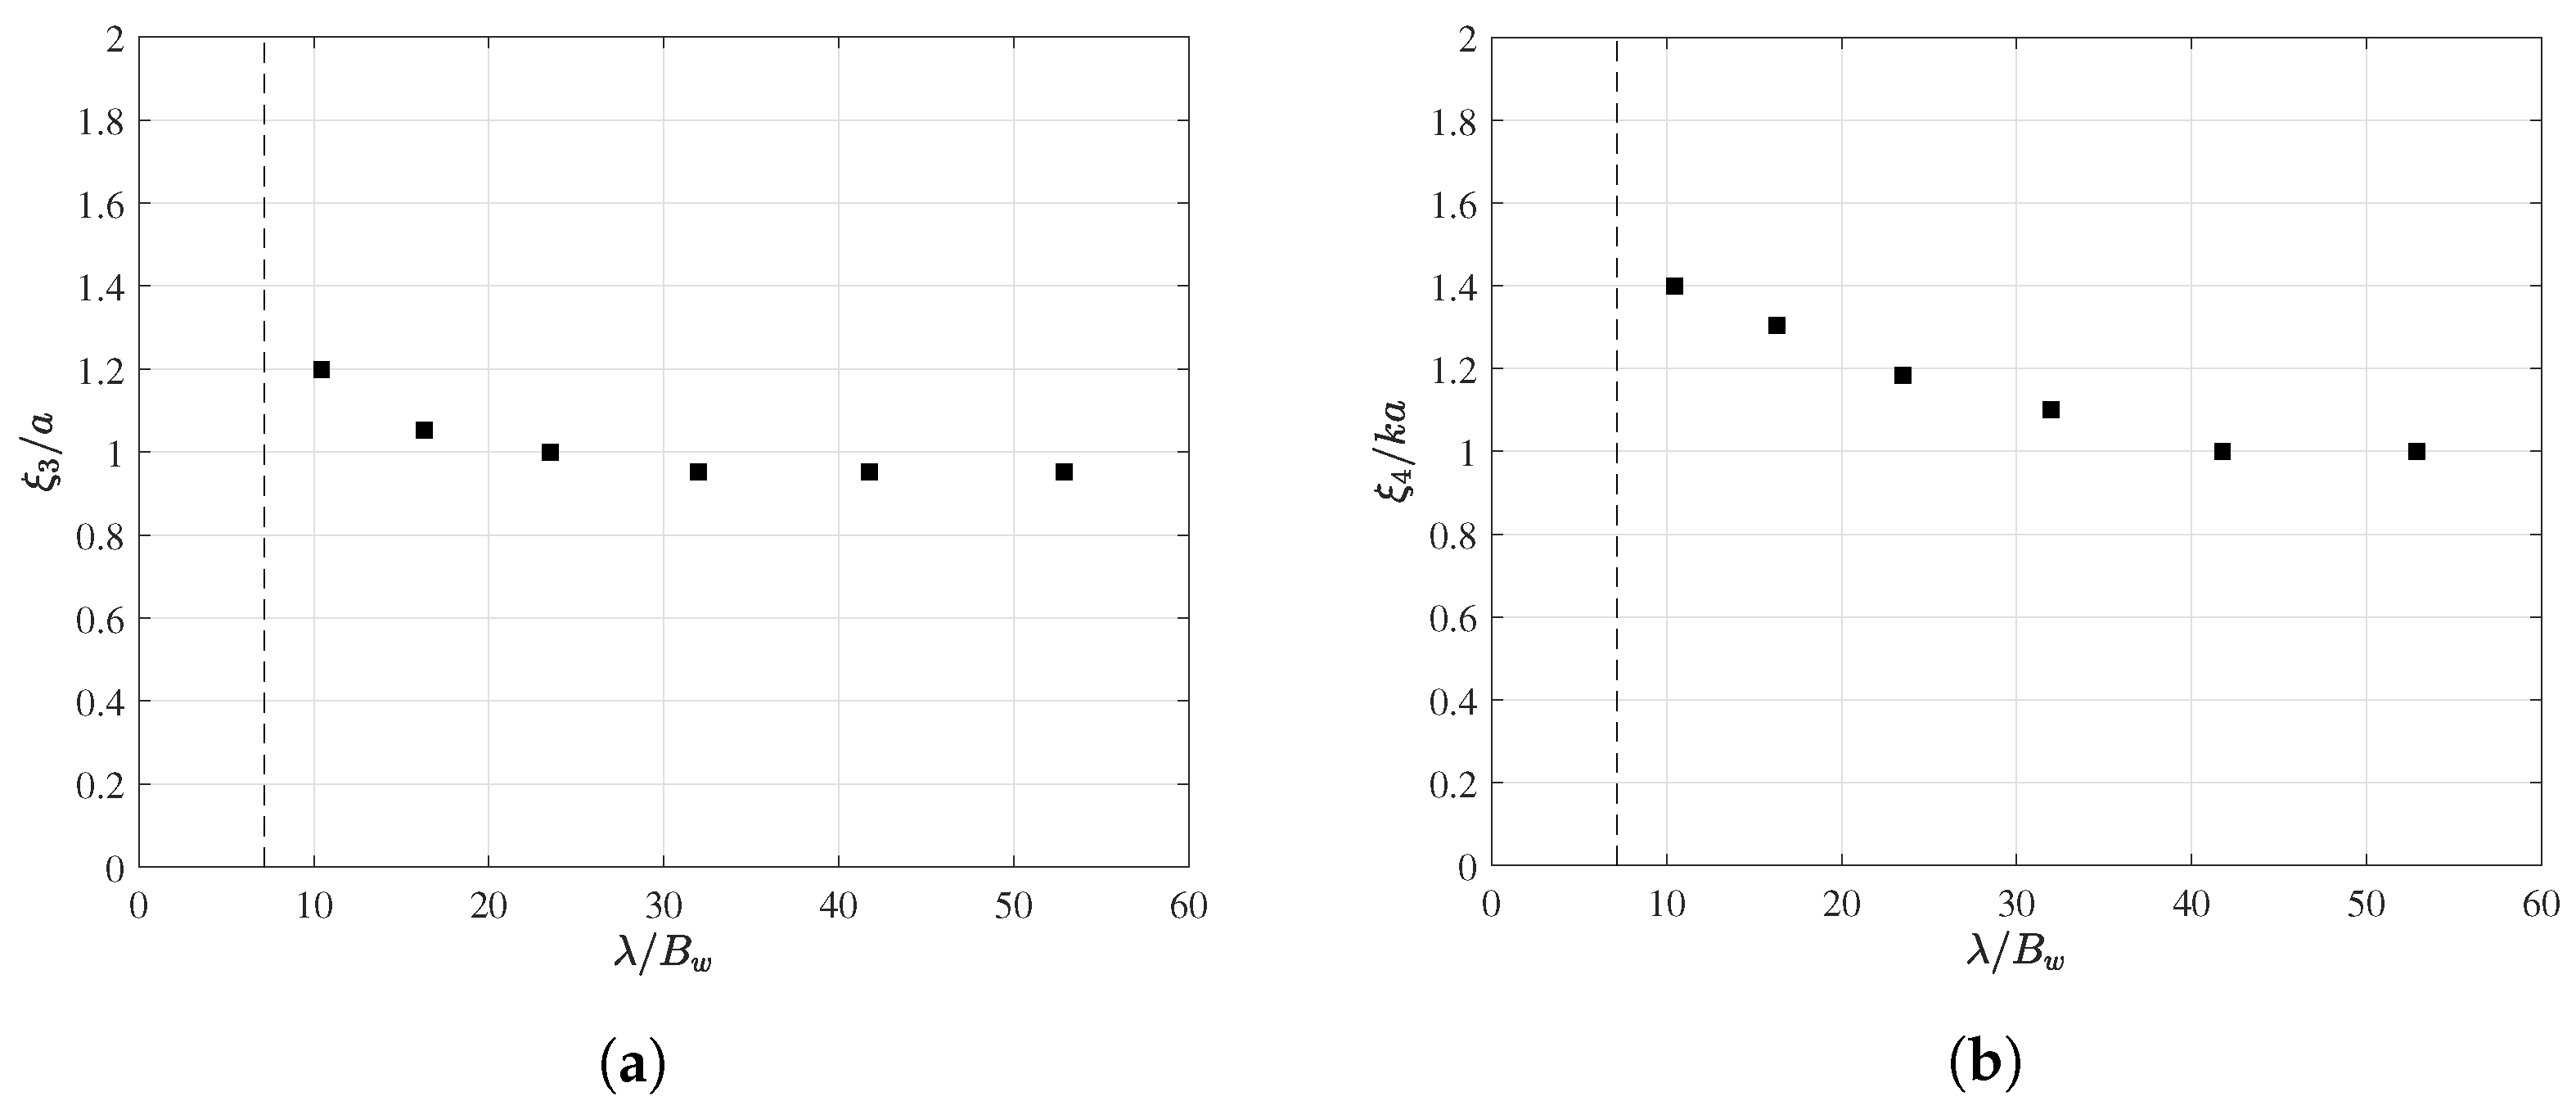
In Figure 6, the response amplitude operators of the floating device, for, respectively, heave and roll DoFs, are represented as a function of the relative wavelength . They were evaluated by analyzing the device motions in constant steepness regular waves, considering the tests of Table 5 with ( = 0.075). It is evident that the response peak aligns with wave periods close to the structure’s natural periods, denoted by a dashed line specifically reported for heave and roll.
Figure 6.
(a) Heave and (b) roll response amplitude operators of the single model.
3.2.2. Transmission, Reflection, and Dissipation Coefficients
The transmission coefficient is the first and most crucial parameter to evaluate for the module’s purpose, as it directly influences the level of protection for devices placed inside the archipelago. For this reason, the response under all wave conditions with varying steepnesses from Table 5 are analyzed.
Evaluating the transmission coefficient by considering a single module standing in the middle of the pit would have been pointless. On one side, the beam of the model compared with the wavelength was very small, while on the other side, diffraction effects around the module would have been incredibly large due to the small length of the module. These arguments remain valid when considering a row composed of only a few modules. However, some representative tests were conducted to confirm this hypothesis, which was completely satisfied as the for all cases was equal to one.
The transmission coefficient was evaluated by considering two rows of staggered models, with five in the first row and four in the second row, with different spacing , that represents, respectively, five times the waterline beam, three and half times the waterline beam, and twice the waterline beam.
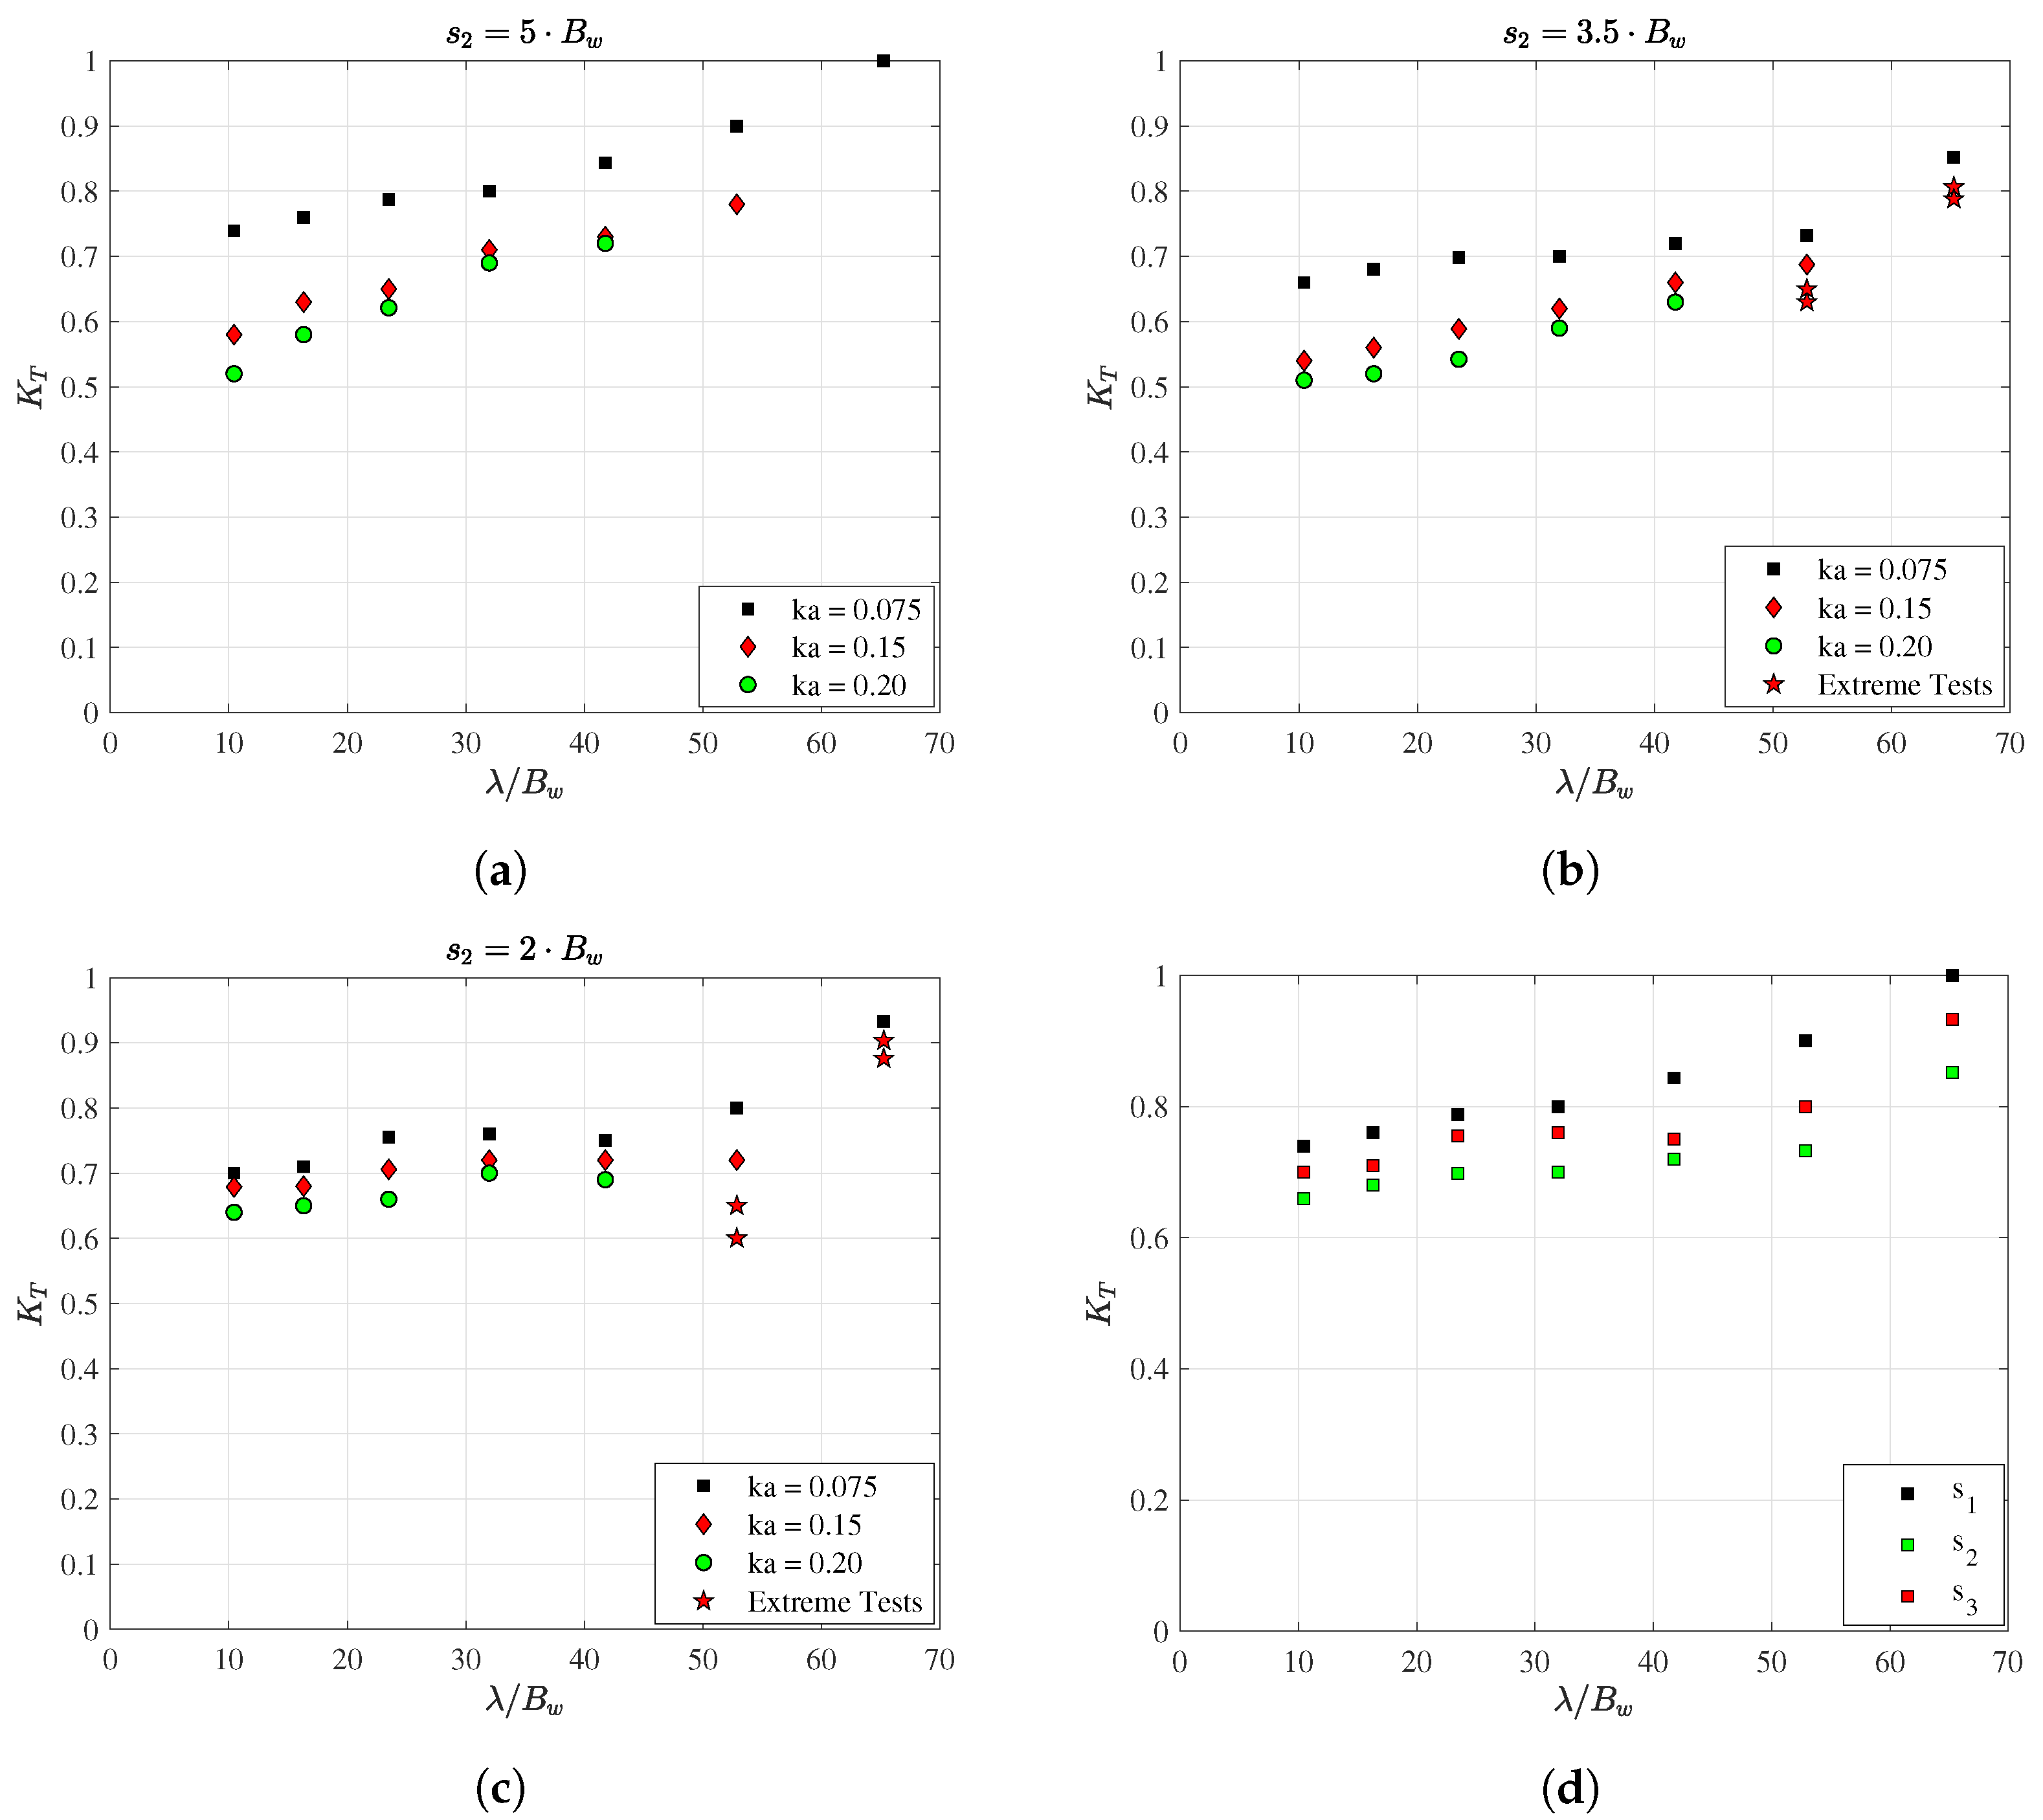
The results for varying wave steepnesses (as in Table 5) are reported in Figure 7. In general, it can be observed that the transmission coefficient is higher for each spacing with the smallest steepness ( = 0.075), followed by the intermediate wave steepness, for which results are not so different compared with the lowest values observed for = 0.2. However, discrepancies in decrease when increasing the wavelength. For = 3.5· and = 2· values, additional extreme tests characterized by even higher steepness were performed, confirming the influence of the increasing steepness in reducing the transmission coefficient.
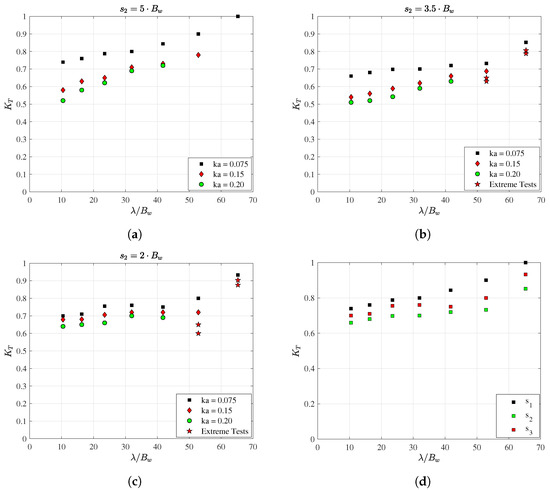
Figure 7.
Transmission coefficient for each spacing: (a) = 5·, (b) = 3.5·, (c) = 2·. In (d) transmission coefficients are reported for the three spacings with constant = 0.075.
When comparing the obtained for, respectively, = 5· = 3.5·, and = 2· with the same wave steepness, which for simplicity were chosen as = 0.075 (Figure 7d), it can be noticed that lower values occur at the intermediate spacing, while the highest ones at = 5·. Clearly, the behavior is the same at increasing steepnesses.
The transmission coefficient is minimum when the spacing between two rows is = 3.5·, ranging utmost linearly from 0.66 to 0.85 when the wavelength over the waterline beam moved from 10 to 53, in the case of = 0.075. When increasing the steepness, reduces to values from 0.51 to 0.63, varying in the same wavelength range.
For this reason, it can be assessed that the wave height behind the module could be reduced by a maximum of 50% to a minimum of 20% for extremely long waves.
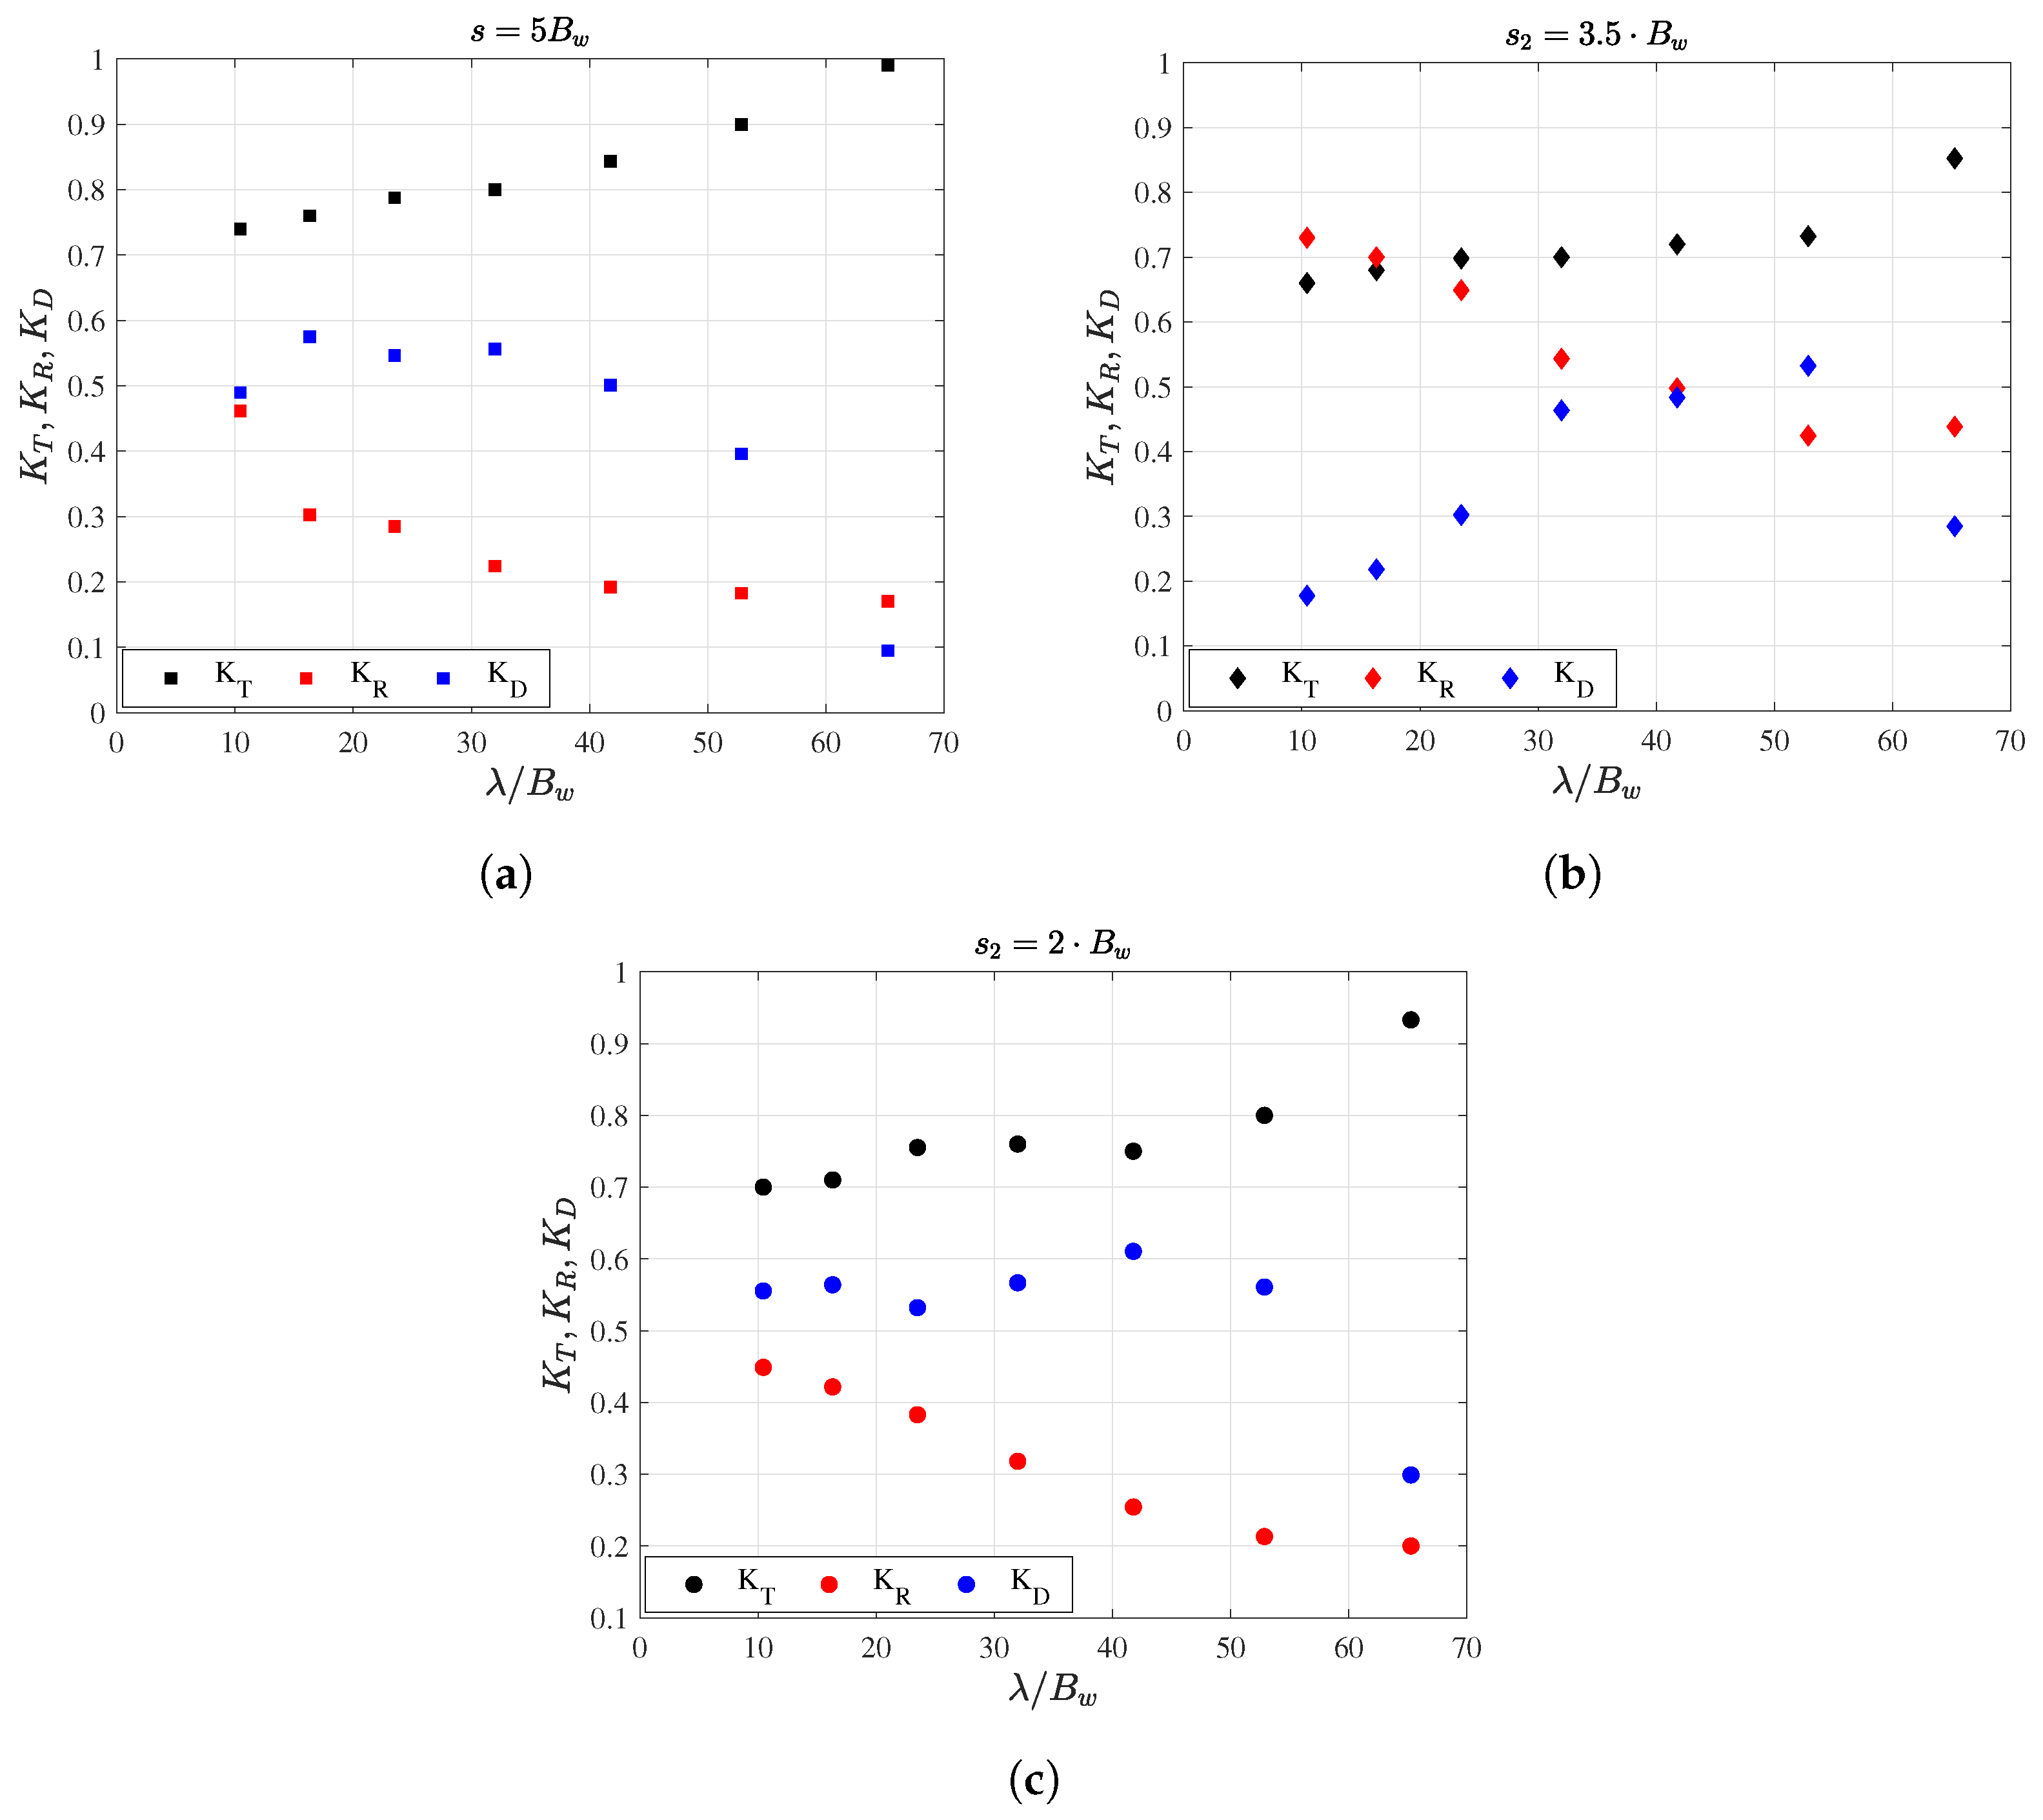
A constant steepness = 0.075, together with the transmission, reflection, and dissipation coefficients, is depicted in Figure 8. Each subfigure represents a particular value of the spacing, moving from = 5· to = 2·.
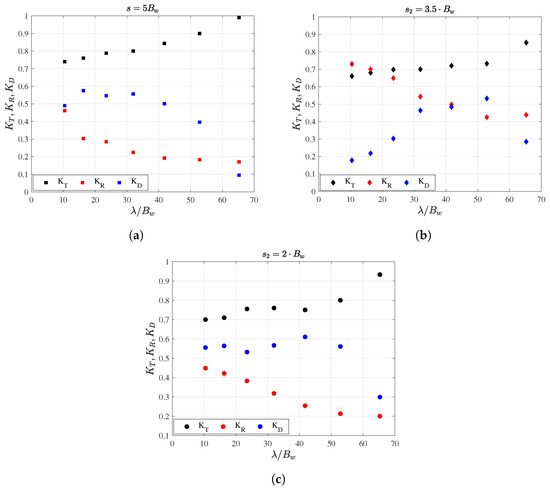
Figure 8.
Transmission, reflection, and dissipation coefficients, respectively, for (a) = 5·, (b) = 3.5·, (c) = 2·.
In general, the reflection coefficient, evaluated according to Equation (7), decreases with the increasing wavelength, showing similar values for = 5· and = 2·, where it ranges between 0.45 and 0.2. Higher values and higher variability are instead observable for = 3.5·, where they vary between 0.70 and 0.40.
A similar behavior can be found for the dissipation coefficient, derived from Equation (8). It assumes intermediate values, being higher than reflection and lower than transmission coefficients, for both = 5· and = 2·. Moreover, until a certain value of , approximately equal to 40, keeps a low variation; after that x-axis value, it significantly decreases, reaching a minimum of 0.18 and 0.3, respectively, for = 5· and = 2·.
According to what was found for , also shows the opposite behavior when considering = 3.5·. In fact, moving from = 10 up to = 30, rapidly increases from 0.20 to 0.48, and then the value attenuates, reaching a maximum of 0.55 for = 53.
4. Discussions
The results of the experimental campaign analyzed in this article are primarily focused on investigating the influence of different spacing values between two rows of floating modules. In this section, two aspects related to the spacing effect on the dynamic and hydrodynamic performances of the modules are discussed. The first one concerns the effect on the dynamic between the two lines, which determined a significant variation in the transmission coefficient. The second aspect identifies a relation between the spacing, transmission, and reflection coefficient. Moreover, in the third part of this section, a comparison between the dynamic response of a single 1:40 scaled module, as described in Section 2.2, and a single 1:10 scaled module, found in the previous campaign [26], is conducted with the intent of assessing the draft variation as a parameter determining the operational range of functioning: wave energy converter and breakwater. Finally, in the last part of the section, a screening of the existing wave energy conversion mechanism is provided, with the aim of identifying the most suitable solutions for the hybrid FB-WEC under examination.
4.1. Spacing Effect on Dynamic and Transmission Coefficient
The results show that the transmission coefficient reaches its minimum value with the lines spaced = 3.5·. This behavior can be addressed to some interaction phenomena occurring between the two rows composing the system: the frontal one, facing the waves, and the second row, immediately behind it (see Figure 9a). To clarify this aspect, a comparison between the roll rotation of the two central modules, one placed in the frontal row (indicated with module number 1 in Figure 9a) and the other in the back row (indicated with module number 2 Figure 9a), is shown in Figure 9b–d, where the black line identifies module 1 and the blue line the module 2. Specifically, tests for the same wave condition, characterized by ( = 0.05 m and T = 1.2 s), were performed for the three values of the spacing = 5· , = 3.5·, = 2· , which are reported, respectively, in Figure 9b–d.
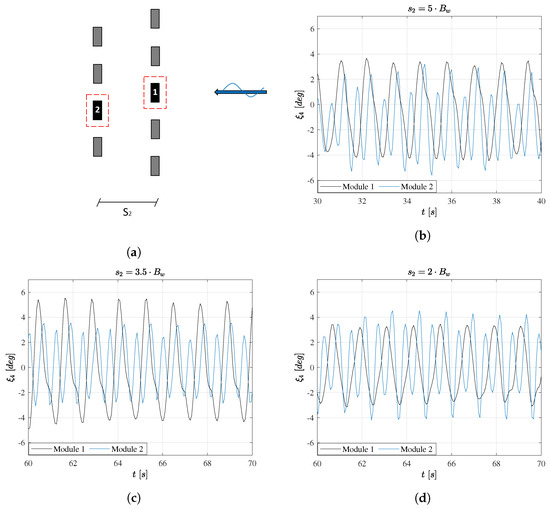
Figure 9.
(a) Module 1 and Module 2 identification and roll rotation for Module 1 (black line) and Module 2 (blue line), respectively, for (b) = 5·, (c) = 3.5·, (d) = 2·.
It can be noticed that the first module facing the waves (Module 1—black line) oscillates with the wave frequency; the module behind it instead (Module 2—blue line) presents another frequency component that is smaller in amplitude. A heuristic explanation could be that this component is associated with the interaction with the motion of the first module. In particular, the discrepancies between the first and the second harmonic are lower in the case of = 3.5·, which could indicate a major interaction between modules. Initially, one may think that this result could be addressed to the Bragg reflection phenomenon [36]; however, it generally occurs when the relative spacing between breakwater ranges in 0.99 < 2s/ < 1.29 [37]. For the investigated case instead, the same parameter ranges between 0.16 < 2s/ < 0.42; this is a possible range in which trapping modes can occur, as shown by Chatjigeorgiou and Katsardi in 2018 [38], where, among others, geometric configurations similar to those tested in this work can be found. This phenomenon, inducing continuous reflections of the incoming waves and giving rise to complicated hydrodynamic behaviour, depends on the number, the arrangement, and the orientation and size of the bodies. For this reason, a more in-depth study on this aspect is needed to better clarify this result.
4.2. Spacing Effect on Transmission and Reflection Coefficients
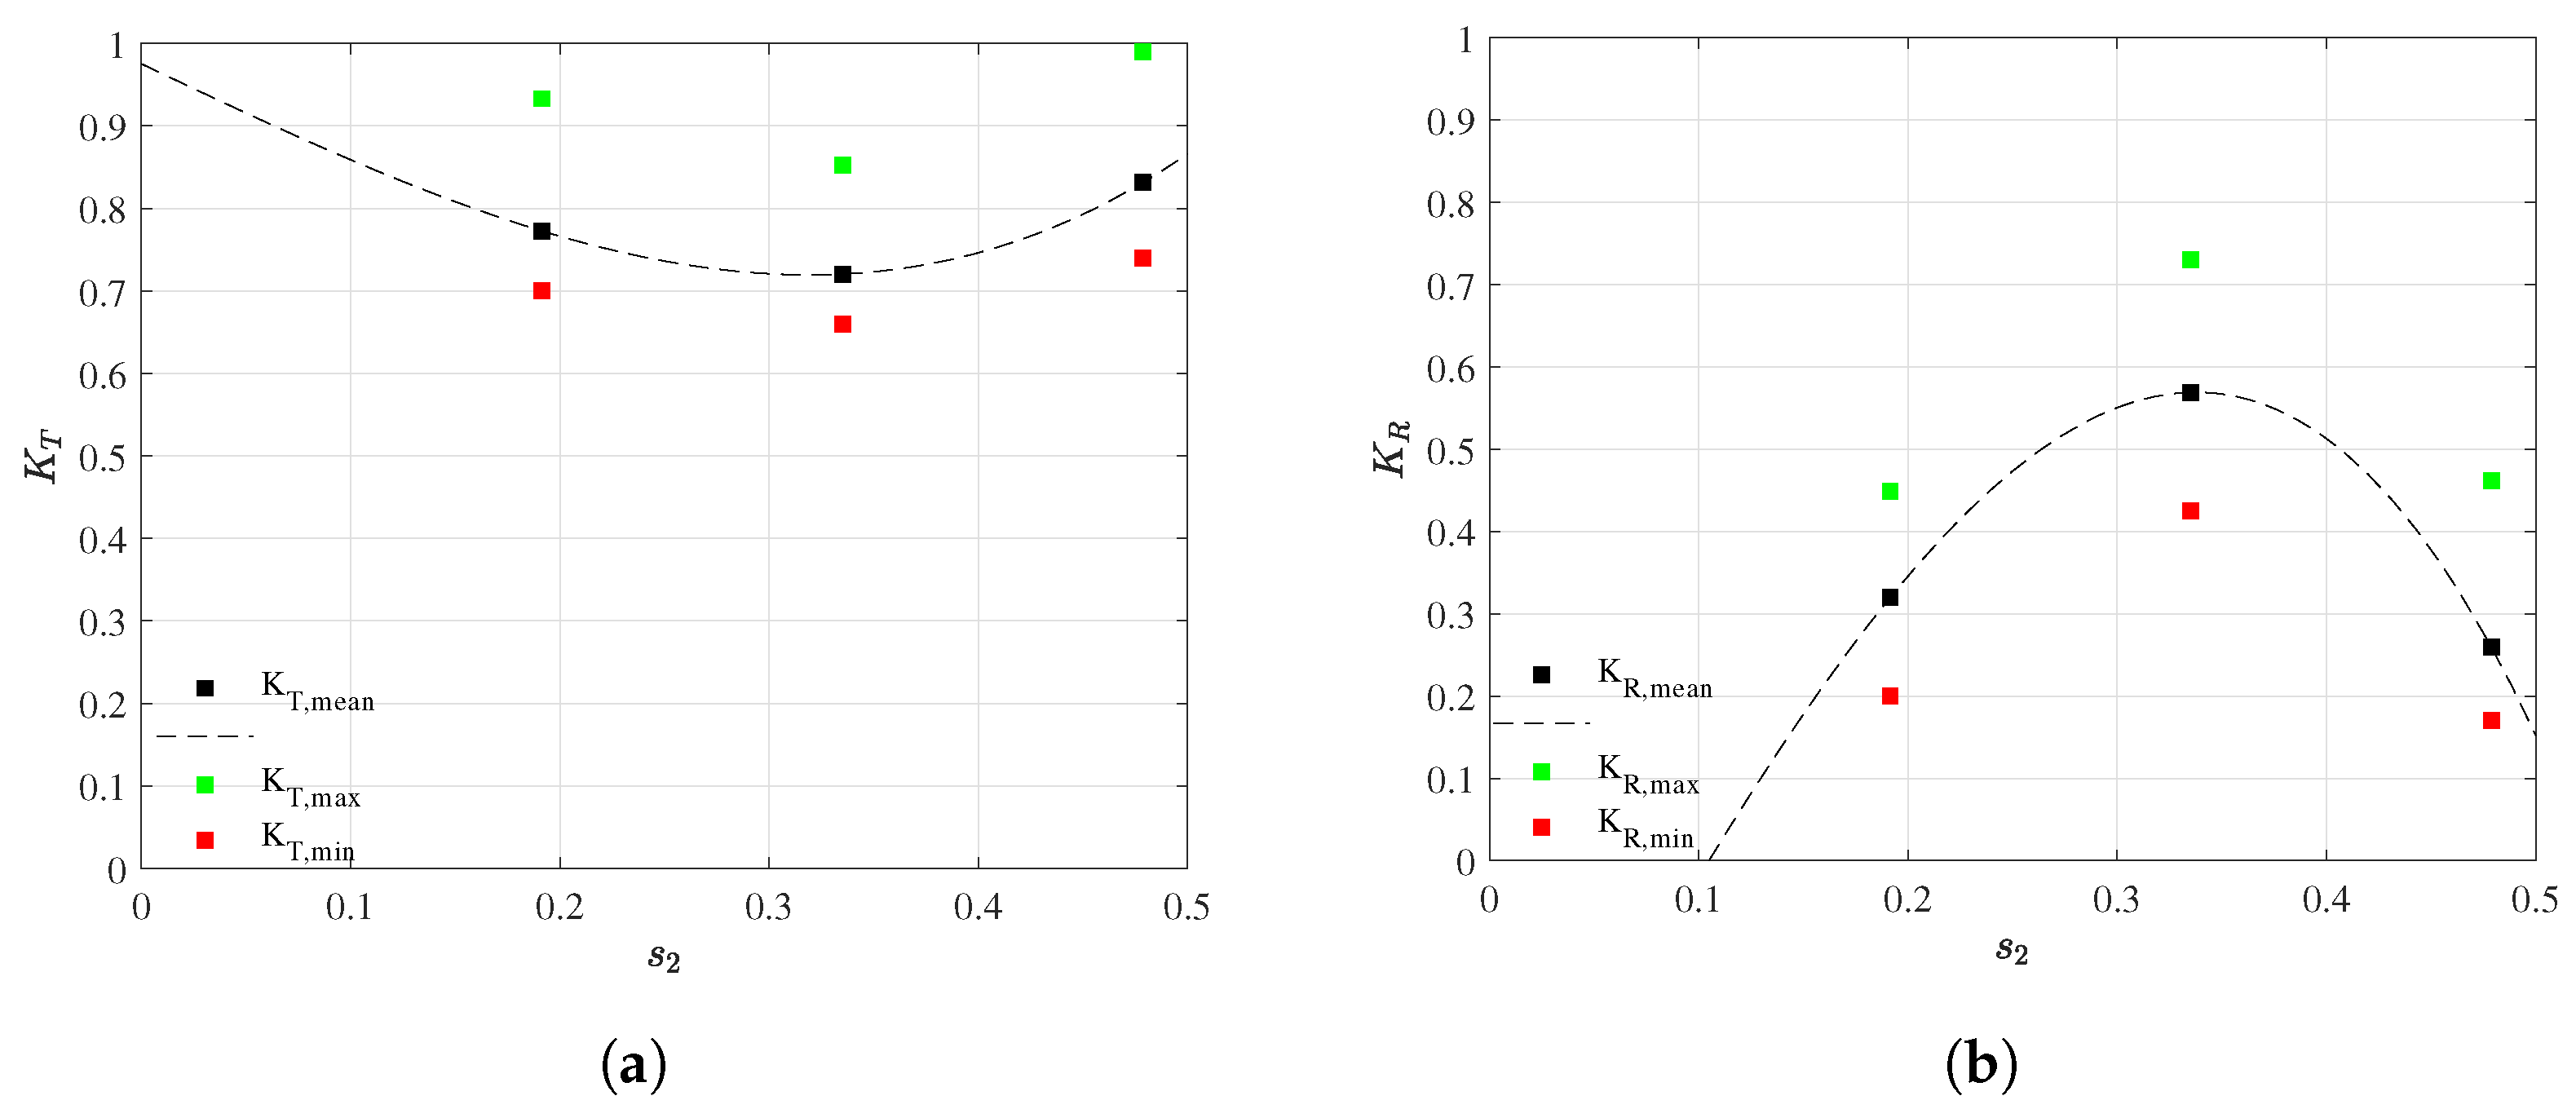
The spacing effect on transmission and reflection coefficients is evaluated by comparing the maximum, mean, and minimum values obtained for the three spacings considered in the experimental campaign. Particularly, the mean values were obtained by averaging, for each spacing , the transmission and reflection coefficients evaluated for all the regular waves with = 0.075 (see Table 8); the maximum and minimum values were found considering the same results. Specifically, as shown in Figure 10, two opposite trends are obtained for and : the first coefficient follows a convex function, that for the mean values is described by the cubic Equation (9), while follows a concave function, described by Equation (10).
Table 8.
Wave characteristics in full scale.
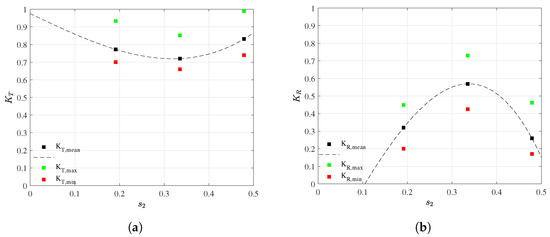
Figure 10.
(a) Transmission and (b) Reflection Coefficients as a function of the spacing.
4.3. Draft Effect on Dual-Functioning Feasibility
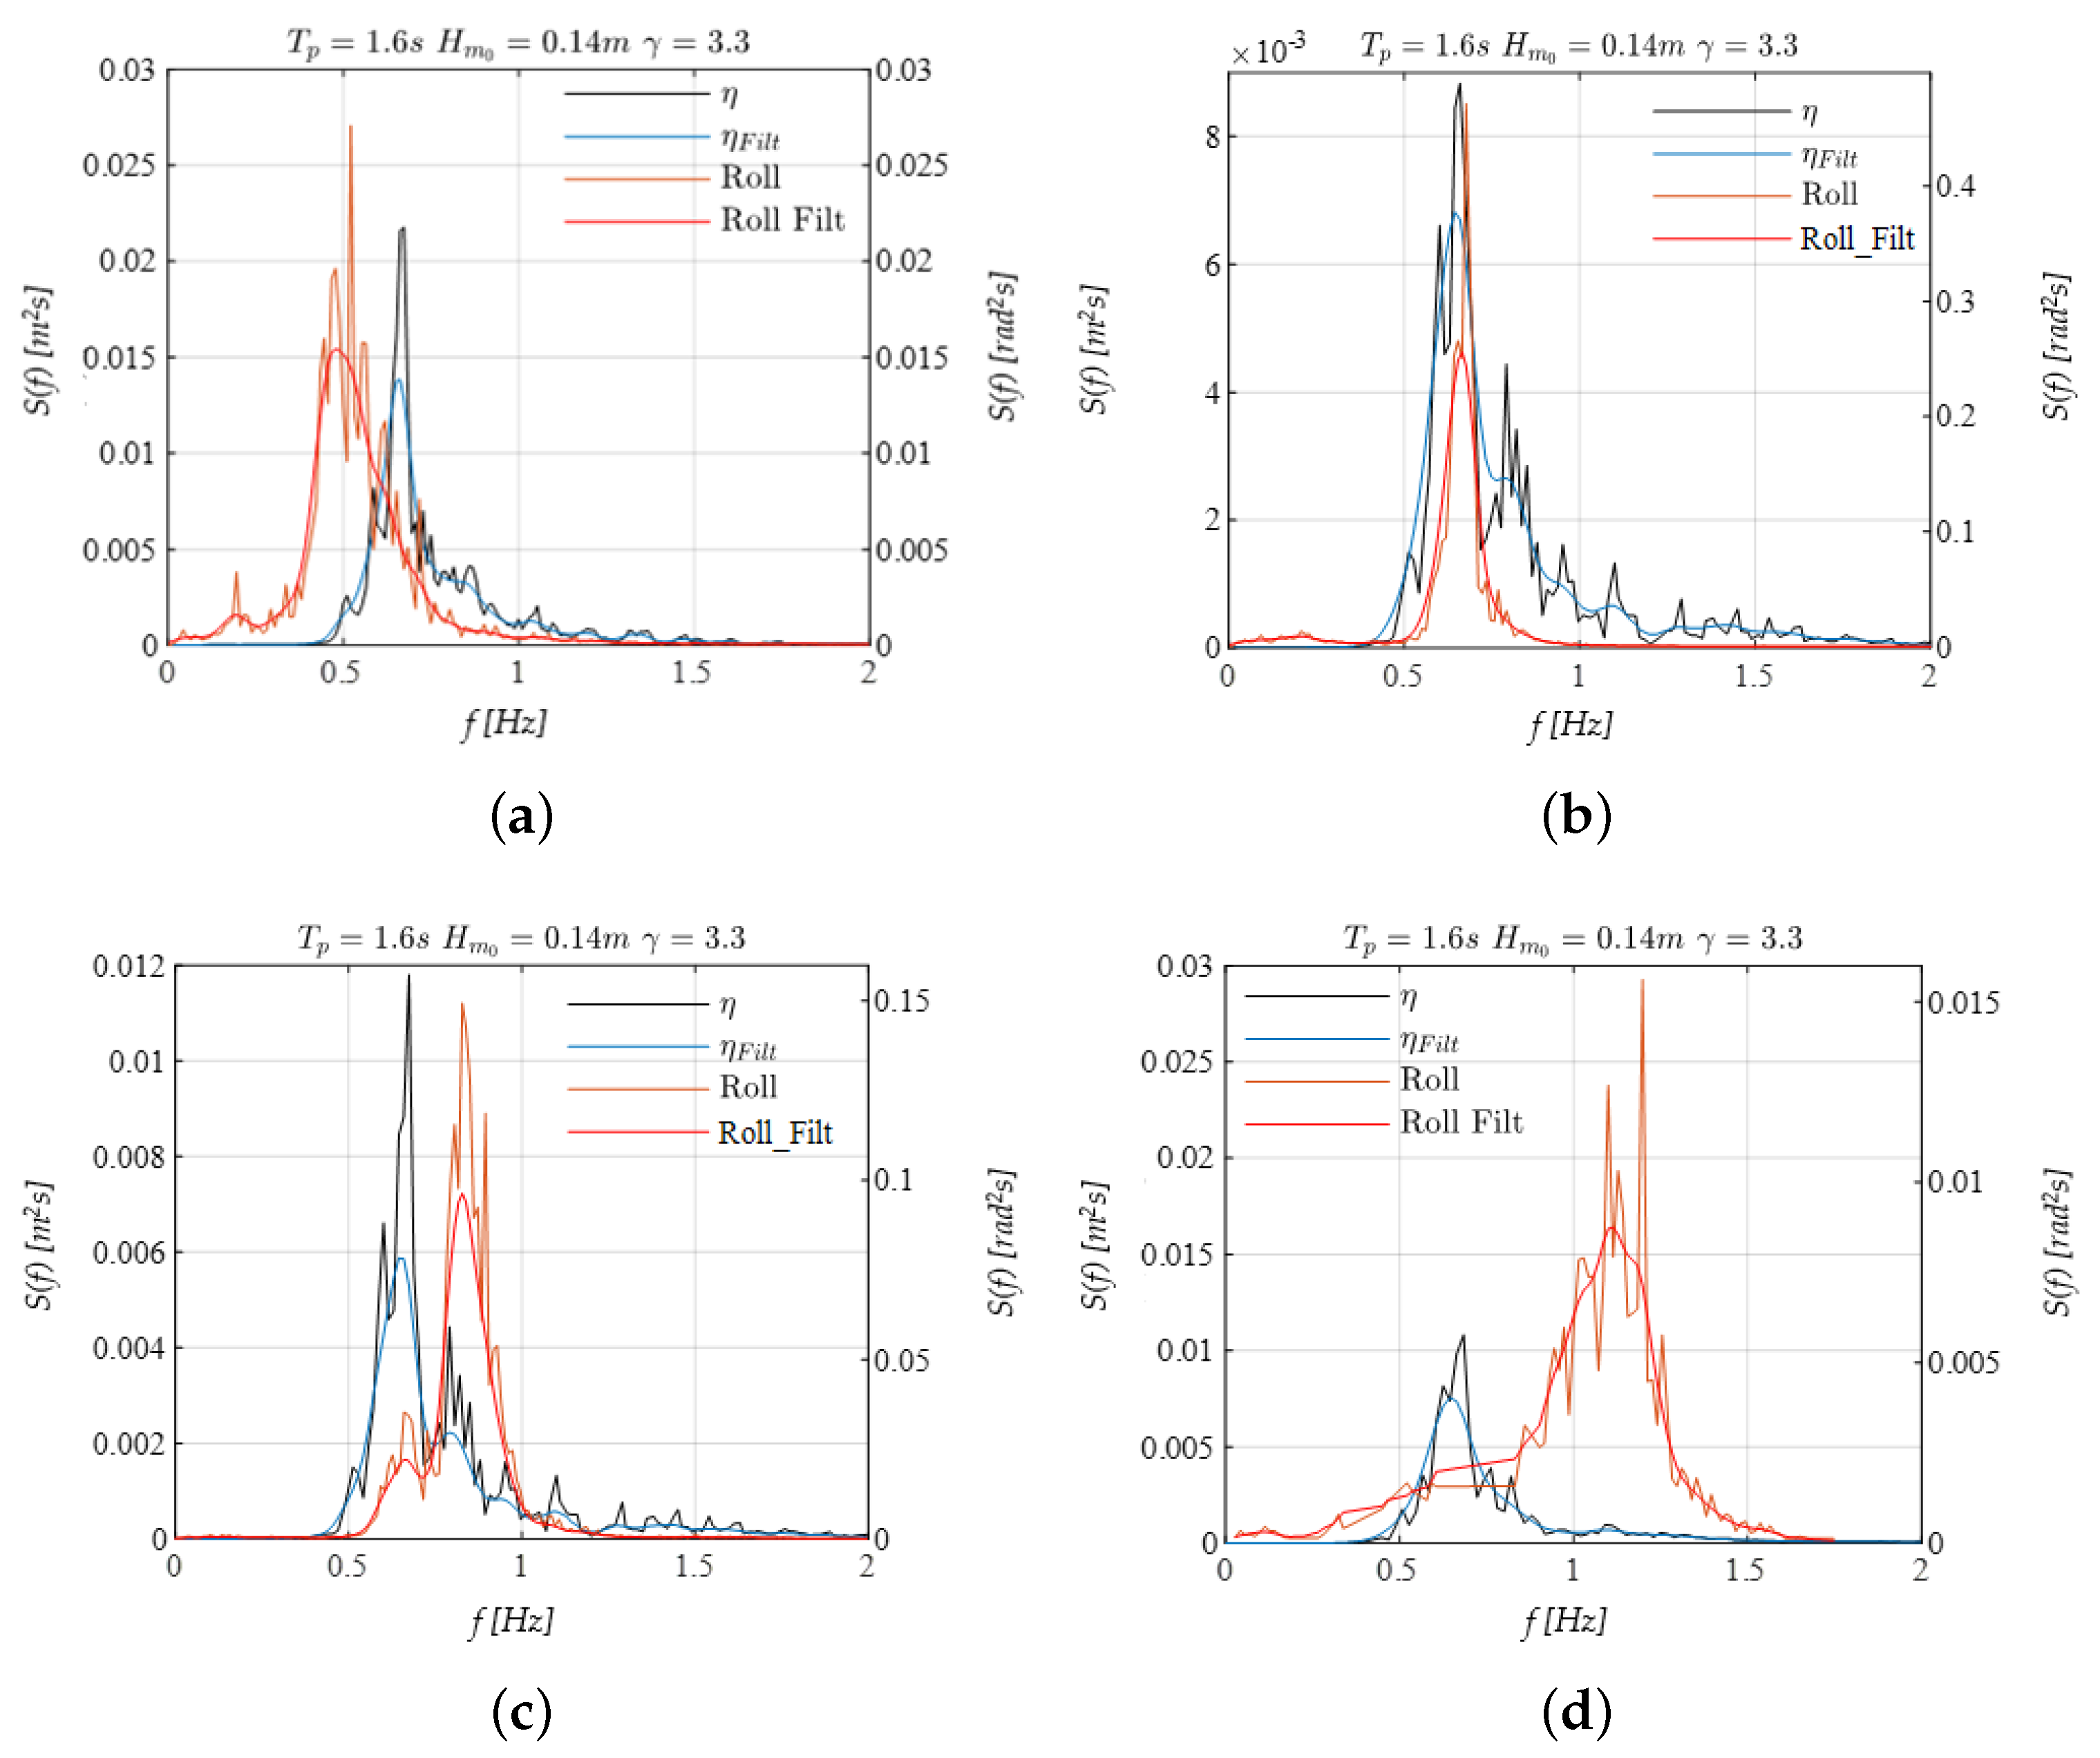
To evaluate the viability of the hybrid FB-WEC module’s dual functionality based on the draft value, the results obtained from the experimental campaign described in this article are compared with those obtained in [26], where a single 1:10 scaled module was investigated under various drafts. In particular, one of the most important points that emerged from this comparison is the effectiveness of the draft in determining the dual functioning. To clarify the wave–module interaction, the same irregular wave condition following a JONSWAP spectrum ( = 3.3, = 0.14 m, and = 1.6 s) was investigated on the single module and for each draft. The first three drafts, tested with the 1:10 modules, in full scale correspond to = 1.25 m, = 2.5 m, = 3.5 m, while the fourth value belongs to the 1:40 module, in full scale being = 4.75 m. The wave spectrum is reported in Figure 11, together with the roll spectra of the four drafts, as the roll was identified as the rotation to be exploited to produce energy.
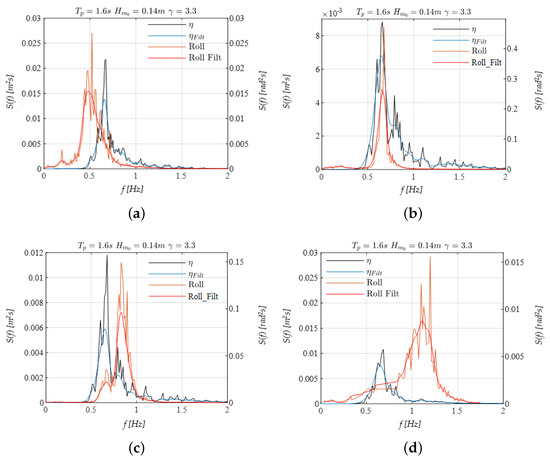
Figure 11.
Wave–structure interaction under irregular waves ( = 0.14 m and = 1.6 s), for the four values of the draft: (a) , (b) , (c) in 1:10 scale and (d) in 1:40 scale.
It can be noticed that the interaction between the waves and the motion of the structure is maximum in the condition (i.e., WEC function), where the spectra are completely overlapped. On the contrary, in the condition (i.e., breakwater function), the interaction is minimal. If reporting the results in full scale, as in Table 8, it can be seen that the analyzed wave condition is representative:
- In the case of the 1:10 model of a mild sea state for the Mediterranean Sea, thus confirming—especially for —the WEC functioning;
- In the case of the 1:40 model of an extreme sea state, confirming the breakwater functioning in long waves.
In general, the behavior of the module could be defined for two ranges of functioning: for up to 40 m, it should work as WEC; for higher values (at least up to 160 m), it could increase its draft and work as a breakwater. This result gives clearer information on the double functioning of the device, highlighting the influence of the draft. However, a deeper investigation of the interaction with waves is required to understand the module response in a wide range of operations.
4.4. Possible Energy Conversion Mechanism
The experimental campaign presented in this work primarily focuses on the hydrodynamic performance of the hybrid device in its breakwater configuration. However, as shown in Section 4.3, a variation in the draft can make it effective as a wave energy converter. For this reason, an initial guess on the choice of Power Take Off (PTO) mechanism is extremely important since, depending on the energy conversion mechanism, the device’s dynamics could vary significantly. The analysis of the efficiency and operating mechanism of the various existing PTO systems seems to favor the use of a gyroscopic system, a pendulum system, or a rotating mass system, as well as the use of an integrated sloshing/OWC system.
There are recent concepts like ISWEC [39], which uses a gyroscope, PEWEC, which utilizes a pendulum [40], and the Penguin by Wello [41], which is based on a rotating mass. Moreover, several concepts coupling the motion of the body with an internal sloshing system are being developed. This is the case with the ResonantTunable patent [42], designed to be used inside the ISWEC device, the Seaturns WEC [43], and the so-called “S-WEC” (Sloshing-WEC) [44,45]. The development phase of these concepts is briefly described in the following, in order to define the most suitable and advanced for the purposes.
The Inertial Sea Wave Energy Converter (ISWEC) converts energy using a gyroscope rotating on an axis orthogonal to the pitching rotation excited by waves, producing a third motion, perpendicular to both, that generates electricity [46]. With a nominal power of 100 KW, a full-scale prototype was installed in Pantelleria in 2015 [47,48]. In collaboration with Eni, a 1:2 scale model was installed in the Adriatic Sea in 2018, connected to an offshore platform [49]. PeWEC, an acronym for Pendulum Wave Energy Converter, is a pendulum-based wave energy converter currently at TRL5. It mainly consists of a floating hull moored to the seabed and a pendulum connected to the shaft of an electrical generator integrated with the hull structure. After its first presentation in 2015 [50], it was improved following tests on a 1:25 scale model. Currently, a full-scale PEWEC (15 m long, 23 m wide, and 7.5 m high, with a displacement of over 1000 tons) is under construction [51]. The Penguin device by Wello instead captures rotational energy generated by the movement of its asymmetrically shaped hull in roll, heave, and pitch. An electric generator, which generates electricity to be exported via a subsea cable, is driven by these motions that accelerate and maintain the revolutions of a spinning flywheel inside the hull. The 500 W device is approximately 44 m long, 9 m high, and has a 7m draft, with a displacement of 1600 tons. It was first tested at sea in 2012; the second testing occurred in 2017, and since 2019, the device has been operational [52].
A separate mention goes to pitching devices coupled with sloshing-OWC systems. The Seaturns device is a cylindrical floater that pitches due to the mooring system converting surge motion. Its rotation, together with the water pendulum at the bottom of the device connected to two air chambers at the top, induces cycles of high and low pressure, which rotate turbines [53]. In May–June 2021, a 1:10 model was tested in IH Cantabria, while in October 2023, Seaturns began sea trials on a 1:4 scale demonstrator installed at Ifremer’s sea trials site in Sainte-Anne du Portzic near Brest, France. The resonant tunable system, consisting of water-sloshing U-shaped tanks (U-Tank), aims to increase the dynamic response bandwidth of a system for harvesting wave energy by actively controlling the tank [54]. The S-WEC consists of a “dry room” containing machinery and electric devices for energy conversion and a “wet room” containing water, gas (e.g., nitrogen), and floating buoys that slide along tank-side tracks driving the PTO system for electricity [55]. S-WEC is an isolated unit that can be installed on or within a floating structure, such as floating breakwaters [56].
5. Conclusions
This study analyzes the spacing effect on the hydrodynamic of several innovative hybrid floating breakwater–wave energy converters, tested in the wave basin of the Department of Engineering of the University of Campania “Luigi Vanvitelli”. The innovative aspect of this hybrid device is its capacity to alternatively work as a wave energy harvester and a floating breakwater, optimizing each function through draft adjustment. In fact, although hybrid floating breakwaters have demonstrated some capacity to generate electricity from wave energy, their main emphasis remains on protecting against storm waves. On the contrary, a handful of wave energy converters (WECs) have been evaluated for their ability to reduce wave intensity, primarily for coastal defense purposes; in this case, the breakwater function acts as an added attribute. The effectiveness of the proposed device in creating a sheltered sea area directly impacts the establishment of an offshore energy hub, namely where to install multiple devices for marine renewable energy exploitation. On the other hand, during more common mild sea conditions, it is anticipated that the floating module will function as a WEC, thereby contributing to the energy generation of the archipelago.
Following an initial experimental campaign on a 1:10 scale model, which aimed to assess the device’s dynamic and mooring response, together with hydraulic performance under mild wave conditions, several 1:40 scale models arranged in two staggered lines were tested and analyzed in this study to evaluate the module’s attenuation performance in extreme conditions. This configuration was deemed necessary because, as anticipated, a single 1:40 module, as well as five models placed on the same line, exhibited a transmission coefficient of 1 due to the diffraction phenomenon.
Particularly, three spacing values between the two lines have been identified, namely = 5·, = 3.5·, and = 2·. The transmission coefficient reaches its minimum for the intermediate configuration, ranging linearly from 0.66 to 0.85 for relative wavelengths ranging from 10 to 53, in the case of lower steepness ( = 0.075). As the steepness increases, decreases from 0.51 to 0.63 within the same range of relative wavelengths. This finding underscores the critical importance of the spacing parameter. In general, similar results were observed for the DEXA device, a wave-activated body WEC, where both device efficiency and inshore wave transmission were investigated [57]. Despite its coastal protection application, these parameters were found to be dependent on wave height, period, and obliquity [58]. Specifically, the transmission coefficient derived from 3D wave experiments on a single 1:30 scaled device was consistently lower than that obtained for three 1:60 scaled models arranged on two lines, although their trends were quite similar, increasing with wavelength [59].
Reflection and dissipation coefficients are also analyzed, exhibiting variations of 0.70 to 0.20 and 0.55 to 0.30, respectively, for the smallest value of steepness, further highlighting the impact of the spacing between the two lines. This effect is further explored in the discussion section, initially examining the relative dynamics variation between the two lines and identifying a specific frequency for further investigation. This behavior leads to a significant alteration in the transmission coefficient, which reaches its minimum at = 3.5·. Transmission and reflection coefficients are then found to be related to the spacing through two cubic equations, with the first coefficient being represented by a convex equation and the second concave one.
Additional discussions on the feasibility of the module to alternatively function as a floating breakwater or as a wave energy converter, highlighting the influence of the draft, are provided. Specifically, by comparing the roll response under the same irregular wave test for the four draft values, the first three on a 1:10 scale model and the last on a 1:40 scale model, the interaction between the waves and the structure was investigated. Results show that the interaction is maximal in the condition (e.g., WEC function) and minimal in the condition (e.g., breakwater function). In full scale, the analyzed wave condition is representative of a mild sea state for the Mediterranean Sea in the case of the 1:10 scale model ( m), confirming the WEC functioning, especially for , and of an extreme sea state, in the case of 1:40 model, confirming the breakwater functioning in long waves ( m). In general, the behavior of the module could be defined for two ranges of functioning: for up to 40 m, it should work as WEC as the module moves close to resonance, hence the energy harvesting is maximum [60], and for higher values (at least up to 160 m), it could increase its draft and work as a breakwater. Moreover, the most suitable solutions to harvest energy when the module behaves as a WEC are identified and result in gyroscopic pendulum-rotating mass systems or integrated sloshing/OWC systems. To conclude, this study underscores the substantial promise of the novel floating breakwater-WEC in safeguarding versatile offshore platforms, lessening wave loads on individual elements, and generating electricity through wave energy capture. It accentuates the critical importance of spacing in maximizing system efficacy.
Author Contributions
S.R. and C.L., conceptualization and methodology; S.R. and P.C., investigation; S.R., P.C. and C.L., writing—original draft preparation, review, and editing; C.L. and D.V., supervision, draft reviewing, and editing. All authors have read and agreed to the published version of the manuscript.
Funding
The authors acknowledge the financial support from the “Ricerca di Sistema” project (RSE, 1.8 “Energia elettrica dal mare”), by Ministry of the Environment and Energy Safety (MASE), CUP B53C22008560001. C.L also acknowledges the financial support by: -Project funded under the National Recovery and Resilience Plan (NRRP), Italy, Mission 4 Component 2 Investment 1.3-Call for tender No. 1561 of 11.10.2022 of Ministero dell’ Università e della Ricerca (MUR); funded by the European Union–NextGenerationEU. Award Number: Project code PE0000021, Concession Decree No. 1561 of 11.10.2022 adopted by Ministero dell’Università e della Ricerca (MUR), Italy, CUP, Italy B53C22004060006, Project title “Network 4 Energy Sustainable Transition–NEST”. -MUR-FOE-STRIVE “STRIVE-La scienza per le transizioni industriali, verde, energetica” funded by Ministry of University and Research (CUP B53C22010110001).
Data Availability Statement
The experimental data used in this study are available from the corresponding author upon reasonable request.
Conflicts of Interest
The authors declare no conflict of interest.
References
- Wang, C.M.; Nguyen, H.P. Floating Breakwaters: Sustainable Solution for Creating Sheltered Sea Space. In Proceedings of the ICSCEA 2021: Second International Conference on Sustainable Civil Engineering and Architecture, Ho Chi Minh City, Vietnam, 30 October 2021; Springer Nature Singapore: Singapore, 2022; pp. 3–20. [Google Scholar]
- Bao, L.; Wang, Y.; Jiang, C.; Chen, J.; Li, H.; Wang, S. Research on Wave and Energy Reduction Performance of Floating Breakwater Based on S-Shaped Runner. Energies 2022, 15, 5148. [Google Scholar] [CrossRef]
- Weiss, C.V.; Ondiviela, B.; Guinda, X.; del Jesus, F.; González, J.; Guanche, R.; Juanes, J.A. Co-location opportunities for renewable energies and aquaculture facilities in the Canary Archipelago. Ocean. Coast. Manag. 2018, 166, 62–71. [Google Scholar] [CrossRef]
- Russo, S.; Contestabile, P.; Bardazzi, A.; Leone, E.; Iglesias, G.; Tomasicchio, G.R.; Vicinanza, D. Dynamic loads and response of a spar buoy wind turbine with pitch-controlled rotating blades: An experimental study. Energies 2021, 14, 3598. [Google Scholar] [CrossRef]
- Contestabile, P.; Russo, S.; Azzellino, A.; Cascetta, F.; Vicinanza, D. Combination of local sea winds/land breezes and nearshore wave energy resource: Case study at MaRELab (Naples, Italy). Energy Convers. Manag. 2022, 257, 115356. [Google Scholar] [CrossRef]
- Dai, J.; Wang, C.M.; Utsunomiya, T.; Duan, W. Review of recent research and developments on floating breakwaters. Ocean Eng. 2018, 158, 132–151. [Google Scholar] [CrossRef]
- Contestabile, P.; Russo, S.; Azzellino, A.; Cascetta, F.; Vicinanza, D. Operating and Extreme weather conditions for testing Offshore Devices at Marine Renewable Energy Lab (MaRELab). In Proceedings of the European Wave and Tidal Energy Conference, Bilbao, Spain, 3–7 September 2023; Volume 15. [Google Scholar] [CrossRef]
- Azzellino, A.; Lanfredi, C.; Contestabile, P.; Ferrante, V.; Vicinanza, D. Strategic environmental assessment to evaluate WEC projects in the perspective of the environmental cost-benefit analysis. In ISOPE International Ocean and Polar Engineering Conference; ISOPE: Mountain View, CA, USA, 2011; p. ISOPE-I. [Google Scholar]
- Azzellino, A.; Lanfredi, C.; Riefolo, L.; De Santis, V.; Contestabile, P.; Vicinanza, D. Combined Exploitation of Offshore Wind and Wave Energy in the Italian Seas: A Spatial Planning Approach. Front. Energy Res. 2019, 7, 42. [Google Scholar] [CrossRef]
- Zhao, X.L.; Ning, D.Z.; Zou, Q.P.; Qiao, D.S.; Cai, S.Q. Hybrid floating breakwater-WEC system: A review. Ocean. Eng. 2019, 186, 106126. [Google Scholar] [CrossRef]
- He, F.; Zhang, H.; Zhao, J.; Zheng, S.; Iglesias, G. Hydrodynamic performance of a pile-supported OWC breakwater: An analytical study. Appl. Ocean. Res. 2019, 88, 326–340. [Google Scholar] [CrossRef]
- Contestabile, P.; Crispino, G.; Russo, S.; Gisonni, C.; Cascetta, F.; Vicinanza, D. Crown wall modifications as response to wave overtopping under a future sea level scenario: An experimental parametric study for an innovative composite seawall. Appl. Sci. 2020, 10, 2227. [Google Scholar] [CrossRef]
- Koutrouveli, T.I.; Di Lauro, E.; das Neves, L.; Calheiros-Cabral, T.; Rosa-Santos, P.; Taveira-Pinto, F. Proof of concept of a breakwater-integrated hybrid wave energy converter using a composite modelling approach. J. Mar. Sci. Eng. 2021, 9, 226. [Google Scholar] [CrossRef]
- Calheiros-Cabral, T.; Clemente, D.; Rosa-Santos, P.; Taveira-Pinto, F.; Ramos, V.; Morais, T.; Cestaro, H. Evaluation of the annual electricity production of a hybrid breakwater-integrated wave energy converter. Energy 2020, 213, 118845. [Google Scholar] [CrossRef]
- Carballo, R.; Iglesias, G. Wave farm impact based on realistic wave-WEC interaction. Energy 2013, 51, 216–229. [Google Scholar] [CrossRef]
- Iglesias, G.; Carballo, R. Choosing the site for the first wave farm in a region: A case study in the Galician Southwest (Spain). Energy 2011, 36, 5525–5531. [Google Scholar] [CrossRef]
- McNatt, J.C.; Venugopal, V.; Foreh, D. A novel method for deriving the diffraction transfer matrix and its application to multi-body interactions in water waves. Ocean. Eng. 2015, 94, 173–185. [Google Scholar] [CrossRef]
- Bozzi, S.; Giassi, M.; Miquel, A.M.; Antonini, A.; Bizzozero, F.; Gruosso, G.; Archetti, R.; Passoni, G. Wave energy farm design in real wave climates: The Italian offshore. Energy 2017, 122, 378–389. [Google Scholar] [CrossRef]
- Martinelli, L.; Ruol, P.; Zanuttigh, B. Wave basin experiments on floating breakwaters with different layouts. Appl. Ocean. Res. 2008, 30, 199–207. [Google Scholar] [CrossRef]
- Martinelli, L.; Zanuttigh, B.; Ruol, P. Effect of layout on floating breakwater performance: Results of wave basin experiments. In Coastal Structures 2007; World Scientific Publishing: Singapore, 2009; Volume 2, pp. 363–374. [Google Scholar]
- Zhang, C.; Magee, A.R. Effectiveness of floating breakwater in special configurations for protecting nearshore infrastructures. J. Mar. Sci. Eng. 2021, 9, 785. [Google Scholar] [CrossRef]
- Zanuttigh, B.; Angelelli, E. Experimental investigation of floating wave energy converters for coastal protection purpose. Coast. Eng. 2013, 80, 148–159. [Google Scholar] [CrossRef]
- Zheng, S.; Zhang, Y.; Iglesias, G. Coast/breakwater-integrated OWC: A theoretical model. Mar. Struct. 2019, 66, 121–135. [Google Scholar] [CrossRef]
- Zheng, S.; Michele, S.; Liang, H.; Iglesias, G.; Greaves, D. Wave power extraction from a wave farm of tubular structure integrated oscillating water columns. Renew. Energy 2024, 150, 342–355. [Google Scholar] [CrossRef]
- Martinelli, L.; Capovilla, G.; Volpato, M.; Ruol, P.; Favaretto, C.; Loukogeorgaki, E.; Andriollo, M. Experimental Investigation of a Hybrid Device Combining a Wave Energy Converter and a Floating Breakwater in a Wave Flume Equipped with a Controllable Actuator. Energies 2023, 17, 40. [Google Scholar] [CrossRef]
- Russo, S.; Contestabile, P.; Vicinanza, D.; Lugni, C. Laboratory Investigation on the Hydrodynamic Response of a Draft Varying Floating Breakwater (and Wave Energy Converter). Water 2024, 16, 445. [Google Scholar] [CrossRef]
- Russo, S.; Lugni, C.; Contestabile, P.; Vicinanza, D. A Preliminary Design for a novel concept of Floating breakwater (… and WEC). In Proceedings of the 14th European Wave and Tidal Energy Conference, Plymouth, UK, 5–9 September 2021. ISSN 2309–1983. [Google Scholar]
- Russo, S.; Lugni, C.; Contestabile, P.; Vicinanza, D. A Novel Hybrid Floating Breakwater-Wave Energy Converter Device: Preliminary Experimental Investigations. In Proceedings of the European Wave and Tidal Energy Conference, Bilbao, Spain, 3–7 September 2023; Volume 15. [Google Scholar] [CrossRef]
- Techet, A.H. Hydrodynamics for Ocean Engineers; MITPRESS: Cambridge, MA, USA, 2004. [Google Scholar]
- WitMotion Shenzhen Co. Inertial Measurement Unit. Available online: https://www.wit-motion.com/proztsz/43.html (accessed on 26 November 2021).
- Mansard, E.P.; Funke, E.R. The measurement of incident and reflected spectra using a least squares method. Coast. Eng. Proc. 1980, 1980, 154–172. [Google Scholar]
- Meinert, P.; Andersen, T.L.; Frigaard, P. AwaSys 6 User Manual; Department of Civil Engineering, Aalborg University: Copenhagen, Denmark, 2011. [Google Scholar]
- Frigaard, P.; Andersen, T.L. Analysis of Waves: Technical Documentation for Wavelab 3; Department of Civil Engineering, Aalborg University: Copenhagen, Denmark, 2014. [Google Scholar]
- Faltinsen, O. Sea Loads on Ships and Offshore Structures (Vol. 1); Cambridge University Press: Cambridge, UK, 1990. [Google Scholar]
- Hasselmann, K.; Barnett, T.P.; Bouws, E.; Carlson, H.; Carwright, D.E.; Enke, K.; Ewing, J.A.; Gienapp, H.; Hasselmann, D.E.; Kruseman, P.; et al. Measurements of wind-wave growth and swell decay during the Joint North Sea Wave Project (JONSWAP). Dtsch. Hydrogr. Z. 1973, 8, 1–95. [Google Scholar]
- Gao, J.; Ma, X.; Dong, G.; Chen, H.; Liu, Q.; Zang, J. Investigation on the effects of Bragg reflection on harbor oscillations. Coast. Eng. 2021, 170, 103977. [Google Scholar] [CrossRef]
- Ouyang, H.T.; Chen, K.H.; Tsai, C.M. Investigation on Bragg reflection of surface water waves induced by a train of fixed floating pontoon breakwaters. Int. J. Nav. Archit. Ocean. Eng. 2015, 7, 951–963. [Google Scholar] [CrossRef]
- Chatjigeorgiou, I.K.; Katsardi, V. Hydrodynamics and near trapping effects in arrays of multiple elliptical cylinders in waves. Ocean. Eng. 2018, 157, 121–139. [Google Scholar] [CrossRef]
- ISWEC. Available online: http://www.morenergylab.polito.it/iswec/ (accessed on 6 September 2022).
- PeWEC. Available online: http://www.morenergylab.polito.it/pewec (accessed on 6 September 2022).
- The Penguin 2. Available online: https://wello.eu/the-penguin-2/ (accessed on 17 September 2022).
- System Able to Adapt the Resonance Frequency of a Device Exposed to Different Wave Conditions. Patent No. 2017WO-IB57680, 2016.
- Seaturns. Available online: https://www.seaturns.com/ (accessed on 23 September 2022).
- Crowley, S.H.; Porter, R.; Evans, D.V. A submerged cylinder wave energy converter with internal sloshing power take off. Eur. J. Mech.-B/Fluids 2014, 47, 108–123. [Google Scholar] [CrossRef]
- Chen, H.M.; DelBalzo, D.R. Eccentric rotating wave energy converter. In Proceedings of the 2019 IEEE Underwater Technology (UT), Kaohsiung, Taiwan, 16–19 April 2019; pp. 1–5. [Google Scholar]
- Mattiazzo, G. State of the art and perspectives of wave energy in the Mediterranean sea: Backstage of ISWEC. Front. Energy Res. 2019, 7, 114. [Google Scholar] [CrossRef]
- Cagninei, A.; Raffero, M.; Bracco, G.; Giorcelli, E.; Mattiazzo, G.; Poggi, D. Productivity analysis of the full scale inertial sea wave energy converter prototype: Ocean Engineering 229 (2021) 108879 31 A test case in Pantelleria island. J. Renew. Sustain. Energy 2015, 7, 061703. [Google Scholar] [CrossRef]
- Vissio, G. ISWEC toward the Sea. Ph.D. Thesis, Politecnico di Torino, Turin, Italy, 2017. [Google Scholar]
- Khedkar, K.; Nangia, N.; Thirumalaisamy, R.; Bhalla, A.P.S. The inertial sea wave energy converter (ISWEC) technology: Device-physics, multiphase modeling and simulations. Ocean. Eng. 2021, 229, 108879. [Google Scholar] [CrossRef]
- Nicola, P.; Giovanni, B.; Biagio, P.; Antonello, S.S.; Giacomo, V.; Giuliana, M.; Gianmaria, S. Wave tank testing of a pendulum wave energy converter 1: 12 scale model. Int. J. Appl. Mech. 2017, 9, 1750024. [Google Scholar] [CrossRef]
- Pozzi, N.; Bracco, G.; Passione, B.; Sirigu, S.A.; Mattiazzo, G. PeWEC: Experimental validation of wave to PTO numerical model. Ocean. Eng. 2018, 167, 114–129. [Google Scholar] [CrossRef]
- Wello Penguin at EMEC. Available online: https://tethys.pnnl.gov/project-sites/wello-penguin-emec (accessed on 17 September 2022).
- Pascal, R.C.; Canteins, G.; Tournerie, V.; Têtu, A. An innovative tank testing method to efficiently characterise wave energy converters. In Proceedings of the European Wave and Tidal Energy Conference, Plymouth, UK, 5–9 September 2021; pp. 1–10. [Google Scholar]
- Sirigu, S.A.; Giorgi, G.; Bracco, G. Expanding Operational Bandwidth and Tuning a Wave Energy Converter Using U-shaped Sloshing Tanks. In International Workshop IFToMM for Sustainable Development Goals; Springer International Publishing: Cham, Switzerland, 2021; pp. 78–86. [Google Scholar]
- Zhang, C.; Ding, Z.; Chen, L.; Ning, D. Sloshing dynamics of liquid tank with builtin buoys for wave energy harvesting. J. Fluids Struct. 2022, 113, 103662. [Google Scholar] [CrossRef]
- Fontana, M.; Giorgi, G.; Accardi, M.; Giorcelli, E.; Brizzolara, S.; Sirigu, S.A. Numerical and Experimental Investigation of the Dynamics of a U-Shaped Sloshing Tank to Increase the Performance of Wave Energy Converters. J. Mar. Sci. Eng. 2023, 11, 2339. [Google Scholar] [CrossRef]
- Zanuttigh, B.; Martinelli, L.; Castagnetti, M.; Ruol, P.; Kofoed, J.P.; Frigaard, P. Integration of wave energy converters into coastal protection schemes. In Proceedings of the 3rd International Conference on Ocean Energy, Bilbao, Spain, 6 October 2010. [Google Scholar]
- Ruol, P.; Zanuttigh, B.; Martinelli, L.; Kofoed, J.P.; Frigaard, P. Near-shore floating wave energy converters: Applications for coastal protection. In Proceedings of the 32nd International Conference on Coastal Engineering ICCE 2010, Shanghai, China, 30 June–5 July 2010; Coastal Engineering Research Council: Reston, VA, USA, 2011. [Google Scholar]
- Zanuttigh, B.; Angelelli, E.; Castagnetti, M.; Kofoed, J.P.; Martinelli, L.; Clausen, L. The Wave Field around DEXA Devices and Implications for Coastal Protection. In Proceedings of the 9th ewtec 2011: 9th European Wave and Tidal Conference, Southampton, UK, 5–9 September 2011. [Google Scholar]
- Falnes, J. A review of wave-energy extraction. Mar. Struct. 2007, 20, 185–201. [Google Scholar] [CrossRef]


Disclaimer/Publisher’s Note: The statements, opinions and data contained in all publications are solely those of the individual author(s) and contributor(s) and not of MDPI and/or the editor(s). MDPI and/or the editor(s) disclaim responsibility for any injury to people or property resulting from any ideas, methods, instructions or products referred to in the content. |
© 2024 by the authors. Licensee MDPI, Basel, Switzerland. This article is an open access article distributed under the terms and conditions of the Creative Commons Attribution (CC BY) license (https://creativecommons.org/licenses/by/4.0/).