
Immediate Impact of the 2021 Harmful Algal Bloom in Southeast Hokkaido on the Rocky Intertidal Benthic Community and Its Spatial Variation


Abstract
1. Introduction
2. Material and Methods
2.1. Study Area
2.2. Census Design
2.3. Species Selection
2.4. Calculation of Cell Density of HAB Species
2.5. Statistical Analysis
3. Results
3.1. Effect of HAB on Population Sizes of Different Species and Functional Groups
3.2. The Relationship between Effect Size and Cell Density of Karenia spp.
4. Discussion
5. Conclusions
Supplementary Materials
Author Contributions
Funding
Data Availability Statement
Acknowledgments
Conflicts of Interest
References
- Anderson, D.M.; Hoagland, P.; Kaortj, Y.; White, A.W. Estimated Annual Technical Report Economic Impacts from Harmful Algal Blooms (HABs) In the United States; National Oceanic and Atmospheric Administration: Washington, DC, USA, 2000.
- Sanseverino, I.; Conduto, D.; Pozzoli, L.; Dobricic, S.; Lettieri, T. Algal Bloom and Its Economic Impact; European Union: Luxembourg, 2016. [Google Scholar]
- Sakamoto, S.; Lim, W.A.; Lu, D.; Dai, X.; Orlova, T.; Iwataki, M. Harmful Algal Blooms and Associated Fisheries Damage in East Asia: Current Status and Trends in China, Japan, Korea and Russia. Harmful Algae 2021, 102, 101787. [Google Scholar] [CrossRef] [PubMed]
- Wainger, L.; Mazzotta, M. Realizing the Potential of Ecosystem Services: A Framework for Relating Ecological Changes to Economic Benefits. Environ. Manag. 2011, 48, 710–733. [Google Scholar] [CrossRef] [PubMed]
- Ohgaki, S.-I.; Kato, T.; Kobayashi, N.; Tanase, H.; Kumagai, N.H.; Ishida, S.; Nakano, T.; Wada, Y.; Yusa, Y. Effects of Temperature and Red Tides on Sea Urchin Abundance and Species Richness over 45 Years in Southern Japan. Ecol. Indic. 2019, 96, 684–693. [Google Scholar] [CrossRef]
- Trottet, A.; George, C.; Drillet, G.; Lauro, F.M. Aquaculture in Coastal Urbanized Areas: A Comparative Review of the Challenges Posed by Harmful Algal Blooms. Crit. Rev. Environ. Sci. Technol. 2022, 52, 2888–2929. [Google Scholar] [CrossRef]
- Landsberg, J.H. The Effects of Harmful Algal Blooms on Aquatic Organisms. Rev. Fish. Sci. 2002, 10, 113–390. [Google Scholar] [CrossRef]
- Gobler, C.J.; Boneillo, G.E.; Debenham, C.J.; Caron, D.A. Nutrient Limitation, Organic Matter Cycling, and Plankton Dynamics during an Aureococcus Anophagefferens Bloom. Aquat. Microb. Ecol. 2004, 35, 31–43. [Google Scholar] [CrossRef]
- Spilmont, N.; Denis, L.; Artigas, L.F.; Caloin, F.; Courcot, L.; Créach, A.; Desroy, N.; Gevaert, F.; Hacquebart, P.; Hubas, C.; et al. Impact of the Phaeocystis Globosa Spring Bloom on the Intertidal Benthic Compartment in the Eastern English Channel: A Synthesis. Mar. Pollut. Bull. 2009, 58, 55–63. [Google Scholar] [CrossRef]
- Simon, J.L.; Dauer, D.M. A Quantitative Evaluation of Red-Tide Induced Mass Mortalities of Benthic Invertebrates in Tampa Bay, Florida. Environ. Lett. 1972, 3, 229–234. [Google Scholar] [CrossRef]
- Wear, R.G.; Gardner, J.P.A. Biological Effects of the Toxic Algal Bloom of February and March 1998 on the Benthos of Wellington Harbour, New Zealand. Mar. Ecol. Prog. Ser. 2001, 218, 63–76. [Google Scholar] [CrossRef]
- Branch, G.M.; Bustamante, R.H.; Robinson, T.B. Impacts of a ‘Black Tide’ Harmful Algal Bloom on Rocky-Shore Intertidal Communities on the West Coast of South Africa. Harmful Algae 2013, 24, 54–64. [Google Scholar] [CrossRef]
- Sale, P.F.; Hanski, I.; Kritzer, J.P. The Merging of Metapopulation Theory and Marine Ecology: Establishing the Historical Context. In Marine Metapopulations; Elsevier: Amsterdam, The Netherlands, 2006; pp. 3–28. [Google Scholar]
- Iwataki, M.; Lum, W.M.; Kuwata, K.; Takahashi, K.; Arima, D.; Kuribayashi, T.; Kosaka, Y.; Hasegawa, N.; Watanabe, T.; Shikata, T.; et al. Morphological Variation and Phylogeny of Karenia selliformis (Gymnodiniales, Dinophyceae) in an Intensive Cold-Water Algal Bloom in Eastern Hokkaido, Japan. Harmful Algae 2022, 114, 102204. [Google Scholar] [CrossRef]
- Kuroda, H.; Taniuchi, Y.; Watanabe, T.; Azumaya, T.; Hasegawa, N. Distribution of Harmful Algae (Karenia spp.) in October 2021 off Southeast Hokkaido, Japan. Front. Mar. Sci. 2022, 9, 841364. [Google Scholar] [CrossRef]
- Kuroda, H.; Azumaya, T.; Setou, T.; Hasegawa, N. Unprecedented Outbreak of Harmful Algae in Pacific Coastal Waters off Southeast Hokkaido, Japan, during Late Summer 2021 after Record-Breaking Marine Heatwaves. J. Mar. Sci. Eng. 2021, 9, 1335. [Google Scholar] [CrossRef]
- Mardones, J.I.; Norambuena, L.; Paredes, J.; Fuenzalida, G.; Dorantes-Aranda, J.J.; Chang, K.J.L.; Guzmán, L.; Krock, B.; Hallegraeff, G. Unraveling the Karenia selliformis Complex with the Description of a Non-Gymnodimine Producing Patagonian Phylotype. Harmful Algae 2020, 98, 101892. [Google Scholar] [CrossRef] [PubMed]
- Crowe, T.P.; Thompson, R.C.; Bray, S.; Hawkins, S.J. Impacts of Anthropogenic Stress on Rocky Intertidal Communities. J. Aquat. Ecosyst. Stress Recovery 2000, 7, 273–297. [Google Scholar] [CrossRef]
- Worm, B.; Lotze, H.K. Effects of Eutrophication, Grazing, and Algal Blooms on Rocky Shores. Limnol. Oceanogr. 2006, 51, 569–579. [Google Scholar] [CrossRef]
- Ji, Y.; Che, Y.; Wright, E.J.; McCarron, P.; Hess, P.; Li, A. Fatty Acid Ester Metabolites of Gymnodimine in Shellfish Collected from China and in Mussels (Mytilus galloprovincialis) Exposed to Karenia selliformis. Harmful Algae 2020, 92, 101774. [Google Scholar] [CrossRef] [PubMed]
- Natsuike, M.; Kanamori, M.; Akino, H.; Sakamoto, S.; Iwataki, M. Lethal Effects of the Harmful Dinoflagellate Karenia selliformis (Gymnodiniales, Dinophyceae) on Two Juvenile Kelp Sporophytes saccharina Japonica and S. sculpera (Laminariales, Phaeophyceae). Reg. Stud. Mar. Sci. 2023, 65, 103094. [Google Scholar] [CrossRef]
- Vellojin, J.P.; Mardones, J.I.; Vargas, V.; Leal, P.P.; Corredor-Acosta, A.; Iriarte, J.L. Potential Effects of Climate Change on the Growth Response of the Toxic Dinoflagellate Karenia selliformis from Patagonian Waters of Chile. Prog. Oceanogr. 2023, 211, 102956. [Google Scholar] [CrossRef]
- Misaka, T.; Ando, Y. Hokkaido Taiheiyo Engan de Hassei Shita Daikibo Akashiwo Ni Tsuite (Huge Red Tide Occurred in Pacific Coast of Hokkaido). Shikenkenkyu Ha Ima 2021, 943. [Google Scholar]
- Iwasaki, A.; Noda, T. A Framework for Quantifying the Relationship between Intensity and Severity of Impact of Disturbance across Types of Events and Species. Sci. Rep. 2018, 8, 795. [Google Scholar] [CrossRef] [PubMed]
- Iwasaki, A.; Fukaya, K.; Noda, T. Quantitative Evaluation of the Impact of the Great East Japan Earthquake and Tsunami on the Rocky Intertidal Community. In Ecological Impacts of Tsunamis on Coastal Ecosystems: Lessons from the Great East Japan Earthquake; Springer: Tokyo, Japan, 2016; pp. 35–46. [Google Scholar]
- Nakaoka, M.; Ito, N.; Yamamoto, T.; Okuda, T.; Noda, T. Similarity of Rocky Intertidal Assemblages along the Pacific Coast of Japan: Effects of Spatial Scales and Geographic Distance. Ecol. Res. 2006, 21, 425–435. [Google Scholar] [CrossRef]
- Kinlan, B.P.; Gaines, S.D. Propagule Dispersal in Marine and Terrestrial Environments: A Community Perspective. Ecology 2003, 84, 2007–2020. [Google Scholar] [CrossRef]
- Tomoyasu, Y. Molluscan Fauna of Akkeshi Marine Station Field Science Center for Northern Biosphere, Hokkaido University Part 1. Intertidal Areas; Northern Shellfish Research Institute of Hokkaido University: Sapporo, Japan, 2011. (In Japanese)
- Noda, T.; Sakaguchi, M.; Iwasaki, A.; Fukaya, K. Influence of the 2011 Tohoku Earthquake on Population Dynamics of a Rocky Intertidal Barnacle: Cause and Consequence of Alternation in Larval Recruitment. Coast. Mar. Sci. 2017, 40, 35–43. [Google Scholar]
- Bueno-Pardo, J.; Nobre, D.; Monteiro, J.N.; Sousa, P.M.; Costa, E.F.S.; Baptista, V.; Ovelheiro, A.; Vieira, V.M.N.C.S.; Chícharo, L.; Gaspar, M.; et al. Climate Change Vulnerability Assessment of the Main Marine Commercial Fish and Invertebrates of Portugal. Sci. Rep. 2021, 11, 2958. [Google Scholar] [CrossRef] [PubMed]
- Ishida, K.; Tachibana, M.; Yao, Y.; Wada, Y.; Noda, T. The Impact of Marine Heatwaves on Rocky Intertidal Communities: Evidence of Accumulative Carryover Effects of Marine Heatwaves. Front. Mar. Sci. 2023, 10, 1146148. [Google Scholar] [CrossRef]
- Gardner, T.A.; Côté, I.M.; Gill, J.A.; Grant, A.; Watkinson, A.R. Hurricanes and Caribbean coral reefs: Impacts, recovery patterns, and role in long-term decline. Ecology 2005, 86, 174–184. [Google Scholar] [CrossRef]
- Borenstein, M.; Hedges, L.; Rothstein, H. Introduction to Meta-Analysis; Wiley: Hoboken, NJ, USA, 2007. [Google Scholar]
- McLeod, L.D.; Cappelleri, J.C.; Hays, R.D. Best (but Oft-Forgotten) Practices: Expressing and Interpreting Associations and Effect Sizes in Clinical Outcome Assessments. Am. J. Clin. Nutr. 2016, 103, 685–693. [Google Scholar] [CrossRef] [PubMed]
- R Core Team. R: A Language and Environment for Statistical Computing; R Foundation for Statistical Computing: Vienna, Austria, 2018. [Google Scholar]
- Thompson, R.C.; Crowe, T.P.; Hawkins, S.J. Rocky Intertidal Communities: Past Environmental Changes, Present Status and Predictions for the next 25 Years. Environ. Conserv. 2002, 29, 168–191. [Google Scholar] [CrossRef]
- Menge, B.A.; Lubchenco, J.; Bracken, M.E.S.; Chan, F.; Foley, M.M.; Freidenburg, T.L.; Gaines, S.D.; Hudson, G.; Krenz, C.; Leslie, H.; et al. Coastal Oceanography Sets the Pace of Rocky Intertidal Community Dynamics. Proc. Natl. Acad. Sci. USA 2003, 100, 12229–12234. [Google Scholar] [CrossRef]
- Arzul, G.; Turki, S.; Hamza, A.; Daniel, P.; Merceron, M. Fish Kills Induced by Phycotoxins. Toxicon 1995, 9, 1119. [Google Scholar] [CrossRef]
- Heil, C.A.; Glibert, P.M.; Al-Sarawi, M.A.; Faraj, M.; Behbehani, M.; Husain, M. First Record of a Fish-Killing Gymnodinium Sp. Bloom in Kuwait Bay, Arabian Sea: Chronology and Potential Causes. Mar. Ecol. Prog. Ser. 2001, 214, 15–23. [Google Scholar] [CrossRef]
- MacKenzie, L. Gymnodimine Contamination of Shellfish in New Zealand. In Harmful Toxic Algal Blooms; National Oceanic and Atmospheric Administration: Washington, DC, USA, 1996; pp. 97–100. [Google Scholar]
- Hasegawa, N.; Watanabe, T.; Unuma, T.; Yokota, T.; Izumida, D.; Nakagawa, T.; Kurokawa, T.; Takagi, S.; Azumaya, T.; Taniuchi, Y.; et al. Repeated Reaching of the Harmful Algal Bloom of Karenia Spp. around the Pacific Shoreline of Kushiro, Eastern Hokkaido, Japan, during Autumn 2021. Fish. Sci. 2022, 88, 787–803. [Google Scholar] [CrossRef]
- Biré, R.; Krys, S.; Frémy, J.-M.; Dragacci, S.; Stirling, D.; Kharrat, R. First Evidence on Occurrence of Gymnodimine in Clams from Tunisia. J. Nat. Toxins 2002, 11, 269–275. [Google Scholar] [PubMed]
- Landsberg, J.H.; Flewelling, L.J.; Naar, J. Karenia brevis Red Tides, Brevetoxins in the Food Web, and Impacts on Natural Resources: Decadal Advancements. Harmful Algae 2009, 8, 598–607. [Google Scholar] [CrossRef]
- Li, X.; Yan, T.; Yu, R.; Zhou, M. A Review of Karenia Mikimotoi: Bloom Events, Physiology, Toxicity and Toxic Mechanism. Harmful Algae 2019, 90, 101702. [Google Scholar] [CrossRef]
- Southward, A.J.; Southward, E.C. Recolonization of Rocky Shores in Cornwall after Use of Toxic Dispersants to Clean up the Torrey Canyon Spill. J. Fish. Board Can. 1978, 35, 682–706. [Google Scholar] [CrossRef]
- Le Hir, M.; Hily, C. First Observations in a High Rocky-Shore Community after the Erika Oil Spill (December 1999, Brittany, France). Mar. Pollut. Bull. 2002, 44, 1243–1252. [Google Scholar] [CrossRef] [PubMed]
- Peterson, C.H.; Rice, S.D.; Short, J.W.; Esler, D.; Bodkin, J.L.; Ballachey, B.E.; Irons, D.B. Long-Term Ecosystem Response to the Exxon Valdez Oil Spill. Science 2003, 302, 2082–2086. [Google Scholar] [CrossRef]
- Horiguchi, T.; Yoshii, H.; Mizuno, S.; Shiraishi, H. Decline in Intertidal Biota after the 2011 Great East Japan Earthquake and Tsunami and the Fukushima Nuclear Disaster: Field Observations. Sci. Rep. 2016, 6, 20416. [Google Scholar] [CrossRef]
- Petzold, W.; Willers, M.T.; Scrosati, R.A. Visual Record of Intertidal Disturbance Caused by Drift Ice in the Spring on the Atlantic Coast of Nova Scotia. F1000Res 2014, 3, 112. [Google Scholar] [CrossRef] [PubMed]
- Chesson, P.; Donahue, M.J.; Melbourne, B.A.; Sears, A.L.W. Scale Transition Theory for Understanding Mechanisms in Metacommunities. In Metacommunities: Spatial Dynamics and Ecological Communities; University of Chicago Press: Chicago, IL, USA, 2005; pp. 279–306. [Google Scholar]
- Chesson, P. Scale Transition Theory: Its Aims, Motivations and Predictions. Ecol. Complex. 2012, 10, 52–68. [Google Scholar] [CrossRef]
- Melbourne, B.A.; Chesson, P. The Scale Transition: Scaling up Population Dynamics with Field Data. Ecology 2006, 87, 1478–1488. [Google Scholar] [CrossRef] [PubMed]
- Yan, T.; Li, X.-D.; Tan, Z.-J.; Yu, R.-C.; Zou, J.-Z. Toxic Effects, Mechanisms, and Ecological Impacts of Harmful Algal Blooms in China. Harmful Algae 2022, 111, 102148. [Google Scholar] [CrossRef] [PubMed]
- Zhang, T.F.; Yan, T.; Zhang, Q.; Li, X.; Zhou, M. Acute Effect of Four Typical Bloom Forming Algae on Abalone Haliotis Discus Hannai and Its Antioxidant Enzymes System. Mar. Environ. Sci 2018, 37, 207–214. [Google Scholar]
- Lubchenco, J.; Gaines, S.D. A Unified Approach to Marine Plant-Herbivore Interactions. I. Populations and Communities. Annu. Rev. Ecol. Syst. 1981, 12, 405–437. [Google Scholar] [CrossRef]
- Menge, B.A. Top-down and Bottom-up Community Regulation in Marine Rocky Intertidal Habitats. J. Exp. Mar. Biol. Ecol. 2000, 250, 257–289. [Google Scholar] [CrossRef]
- Martins, G.M.; Jenkins, S.R.; Hawkins, S.J.; Neto, A.I.; Thompson, R.C. Exploitation of Rocky Intertidal Grazers: Population Status and Potential Impacts on Community Structure and Functioning. Aquat. Biol. 2008, 3, 1–10. [Google Scholar] [CrossRef]
- Whalen, M.A.; Aquilino, K.M.; Stachowicz, J.J. Grazer Diversity Interacts with Biogenic Habitat Heterogeneity to Accelerate Intertidal Algal Succession. Ecology 2016, 97, 2136–2146. [Google Scholar] [CrossRef]
- Moreno, C.A.; Jaramillo, E. The Role of Grazers in the Zonation of Intertidal Macroalgae of the Chilean Coast. Oikos 1983, 41, 73–76. [Google Scholar] [CrossRef]
- Phillips, N.E.; Hutchison, E. Grazer Effects on Algal Assemblages and Mussel Recruitment in Two Different Mid-Intertidal Communities in the Cook Strait, New Zealand. N. Z. J. Mar. Freshw. Res. 2008, 42, 297–306. [Google Scholar] [CrossRef]
- Sahara, R.; Fukaya, K.; Okuda, T.; Hori, M.; Yamamoto, T.; Nakaoka, M.; Noda, T. Larval Dispersal Dampens Population Fluctuation and Shapes the Interspecific Spatial Distribution Patterns of Rocky Intertidal Gastropods. Ecography 2016, 39, 487–495. [Google Scholar] [CrossRef]


| Functional Group | Species | Effect Size | Relative Change |
|---|---|---|---|
| Sessile invertebrate | Chthamalus dalli | 0.84 | 16.87% |
| Macroalgae | Chondrus yendoi | −1.77 | −54.81% |
| Corallina pilulifera | 1.35 | 27.03% | |
| Gloiopeltis furcata | −2.18 * | −43.70% | |
| Heterochordaria abietina | 1.00 | 21.82% | |
| Polysiphonia yendoi | −2.27 * | −70.84% | |
| Molluscan grazer | Littorina sitkana | −2.53 * | −56.25% |
| Lottia cassis | −2.15 * | −78.44% | |
| Lottia sp. | −5.99 * | −85.99% | |
| Molluscan carnivore | Nucella lima | −0.92 | −78.22% |
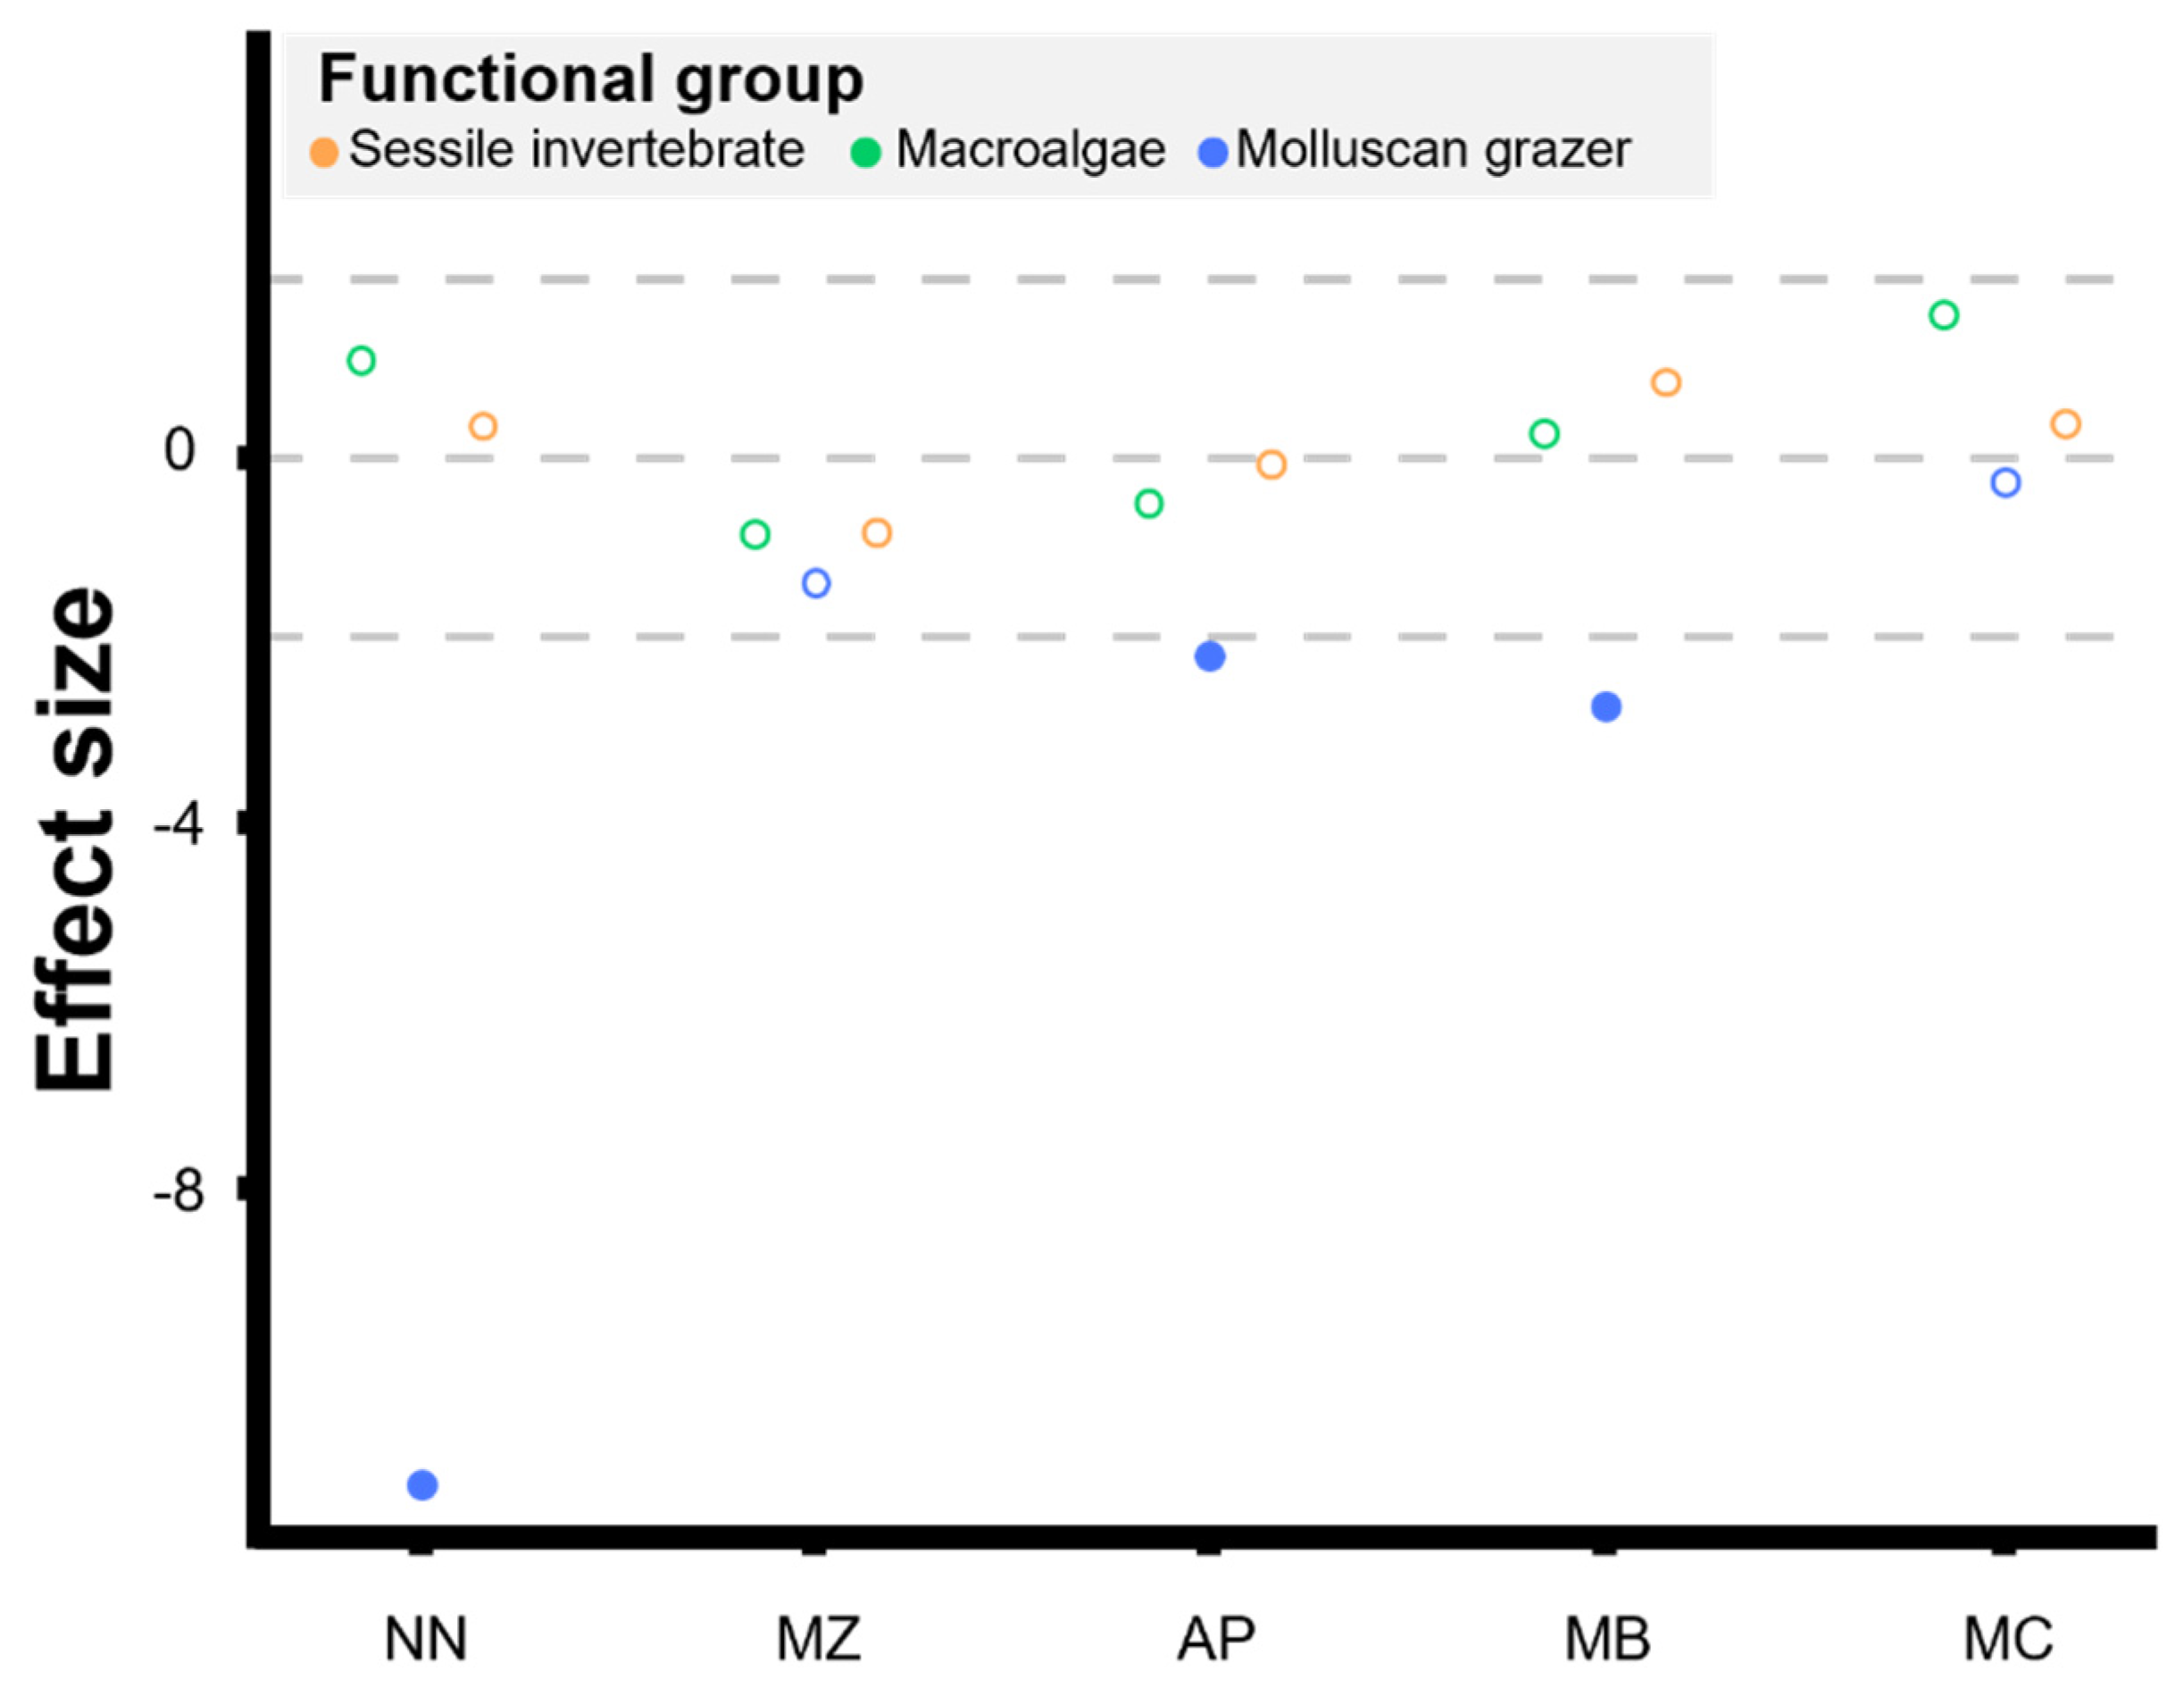
| Shore | Functional Group | Effect Size | Relative Change | |
|---|---|---|---|---|
| Region Scale | / | Macroalgae | −0.34 | −5.59% |
| / | Molluscan grazer | −2.733 * | −58.13% | |
| / | Sessile invertebrate | 0.841 | −16.866% | |
| Local Scale | AP | Macroalgae | −0.505 | −66.99% |
| MB | Macroalgae | 0.259 | −35.44% | |
| MC | Macroalgae | 1.566 | 404.95% | |
| MZ | Macroalgae | −0.851 | −100.00% | |
| NN | Macroalgae | 1.065 | 185.50% | |
| AP | Molluscan grazer | −2.187 * | −55.44% | |
| MB | Molluscan grazer | −2.739 * | −67.80% | |
| MC | Molluscan grazer | −0.28 | −22.29% | |
| MZ | Molluscan grazer | −1.378 | −67.93% | |
| NN | Molluscan grazer | −11.267 * | −97.75% | |
| AP | Sessile invertebrate | −0.078 | −59.93% | |
| MB | Sessile invertebrate | 0.823 | 73.84% | |
| MC | Sessile invertebrate | 0.365 | −16.58% | |
| MZ | Sessile invertebrate | −0.825 | −92.85% | |
| NN | Sessile invertebrate | 0.339 | −1.27% |
Disclaimer/Publisher’s Note: The statements, opinions and data contained in all publications are solely those of the individual author(s) and contributor(s) and not of MDPI and/or the editor(s). MDPI and/or the editor(s) disclaim responsibility for any injury to people or property resulting from any ideas, methods, instructions or products referred to in the content. |
© 2024 by the authors. Licensee MDPI, Basel, Switzerland. This article is an open access article distributed under the terms and conditions of the Creative Commons Attribution (CC BY) license (https://creativecommons.org/licenses/by/4.0/).
Share and Cite
Yao, Y.; Noda, T. Immediate Impact of the 2021 Harmful Algal Bloom in Southeast Hokkaido on the Rocky Intertidal Benthic Community and Its Spatial Variation. J. Mar. Sci. Eng. 2024, 12, 928. https://doi.org/10.3390/jmse12060928
Yao Y, Noda T. Immediate Impact of the 2021 Harmful Algal Bloom in Southeast Hokkaido on the Rocky Intertidal Benthic Community and Its Spatial Variation. Journal of Marine Science and Engineering. 2024; 12(6):928. https://doi.org/10.3390/jmse12060928
Chicago/Turabian StyleYao, Yuan, and Takashi Noda. 2024. "Immediate Impact of the 2021 Harmful Algal Bloom in Southeast Hokkaido on the Rocky Intertidal Benthic Community and Its Spatial Variation" Journal of Marine Science and Engineering 12, no. 6: 928. https://doi.org/10.3390/jmse12060928
APA StyleYao, Y., & Noda, T. (2024). Immediate Impact of the 2021 Harmful Algal Bloom in Southeast Hokkaido on the Rocky Intertidal Benthic Community and Its Spatial Variation. Journal of Marine Science and Engineering, 12(6), 928. https://doi.org/10.3390/jmse12060928