Article

Numerical Study on the Influence of Interceptor and Stern Flap on Ship Resistance and Motion Response in Regular Waves

1
School of Ship and Ocean Engineering, Jiangsu Shipping College, Nantong 226000, China
2
Key Laboratory of High Performance Ship Technology Ministry of Education, Wuhan University of Technology, Wuhan 430063, China
3
School of Naval Architecture, Ocean and Energy Power Engineering, Wuhan University of Technology, Wuhan 430063, China
4
School of Naval Architecture and Ocean Engineering, Jiangsu University of Science and Technology, Zhenjiang 212000, China
*
Author to whom correspondence should be addressed.
J. Mar. Sci. Eng. 2024, 12(6), 929; https://doi.org/10.3390/jmse12060929
Submission received: 1 May 2024 / Revised: 27 May 2024 / Accepted: 29 May 2024 / Published: 31 May 2024
(This article belongs to the Section Ocean Engineering)

Abstract

:
Stern flaps and interceptors are prevalent stern appendages on medium- to high-speed ships, designed to modify the sailing posture of ships and diminish resistance. Using the Reynolds-averaged Navier–Stokes (RANS) method combined with overset mesh technology, this study evaluates the performance of a ship in regular waves before and after interceptor and stern flap installation. The findings indicate that the interceptor and stern flap resistance reduction rates initially declined and then rose with wavelength, typically 1–3% higher than in calm water. For a constant wavelength of 1.5 LPP and when wave steepness ak ≥ 0.05, the interceptor and stern flap resistance reduction rates in regular waves decline as wave steepness increases. The stern appendages have a more prominent impact on ship posture owing to heightened ship motion amplitude in wave conditions compared to calm water. Moreover, after fitting the interceptor and stern flap, the heave and pitch transfer functions of the ship lessen after fitting the interceptor and stern flap, particularly when λ/LPP = 1–2; average reduction rates for TF3 and TF5 are 7.2% and 3.9%, respectively, with a stern flap, and 4.4% and 2.1% after fitting the interceptor. This study offers invaluable insights and practical guidance for designing and applying stern appendages.

1. Introduction

Speed performance remains crucial for ships, particularly military vessels [1]. As ships navigate through dual mediums, water and air resistance considerably affect their swiftness, and optimising ship form is vital to mitigating this resistance. Installing energy-saving appendages can enhance resistance performance for vessels with established forms. Currently, the preferred stern appendages for medium- to high-speed ships include wave stern flaps (SFs) [2] and interceptors [3]. SF, designed to suppress waves at the stern to reduce wave-making resistance, is increasingly used on planing boats, destroyers, frigates, and other military ships. Interceptors, typically mounted vertically downward on the stern transom plate, occupy less space and offer simpler operation and control than SFs, thereby gaining traction over the past decade.
Research on SF and interceptors can be divided into two. The first is stern appendage mechanism analysis based on simplified modelling. Brizzolara [4] and Brizzolara and Salian [5] numerically solved the flow field around a two-dimensional interceptor using a computational fluid dynamics (CFD) solver. The velocity and pressure distributions and other flow field information in the interceptor installation area were analysed to summarise the hydrodynamic mechanism of the interceptor. Deng et al. [6] studied the interceptor mechanism by simplifying the three-dimensional hull into a two-dimensional flat plate and investigating flow details such as velocity, pressure, and vorticity fields under interceptors of different heights. Using Reynolds-averaged Navier–Stokes (RANS) equations, Mansoori et al. [7] simulated the flow field around a fixed plate with an interceptor at different heights and angles of attack and compared the numerical results with the experimental data, demonstrating that the thickness of the boundary layer varies by speed, thereby affecting the efficiency of the interceptor. Jacobi et al. [8] employed particle image velocimetry (PIV) to measure the velocity field in the stern area before and after interceptor installation and reconstructed the pressure load to analyse the blocked flow and high-pressure peak caused by the installation. They reconstructed the three-dimensional flow field by scanning PIV flow field information at multiple sections and analysing the measurement uncertainty and lift change caused by the interceptor.
The second approach involves analysing how appendages such as SFs and interceptors impact resistance and sailing posture in calm waters. Tsai and Hwang [9] examined the effects of interceptor and SF combinations on planing craft resistance, highlighting that well-designed appendages can diminish trim angle and cut resistance by 2–6%. John et al. [10] assessed stern energy-saving devices such as stern wedges, flaps, and interceptors. De Luca and Pensa [11] introduced unconventional SF designs and empirically compared them with conventional designs. Mansoori et al. [12,13,14] extensively explored interceptor use on planing vessels. Using a finite-volume dynamic mesh model, they numerically simulated planing ship models with and without interceptors or combined appendages, demonstrating that the primary purpose of interceptors or combined appendages is to modulate sailing posture and counteract the proposed instability by generating a high-pressure region at the stern. Maki et al. [15] used the DTMB5415 ship model to experimentally and virtually explore the influence of SFs on ship resistance performance, revealing that resistance reduction primarily arises from SF-induced enhancements in the stern flow field. Avci and Barlas [16] experimentally assessed the impact of the lateral positioning of the interceptor on its resistance-reducing capabilities and obtained results supporting this theory. Their findings suggested that the SF can be segmented for individualised control to optimise interceptor efficacy. Deng et al. [17] numerically examined interceptor impact on the viscous flow field of deep-V vessels, focusing on alterations in resistance, lift, and distributions of base pressure and stern velocity. Budiarto et al. [18] numerically probed the effects of the SF on the resistance components of planing vessels and determined that ship and component resistance can be achieved by adjusting the pitch and heavy value of the ship to decrease its displacement.
CFD technology is increasingly applied in seakeeping simulations [19,20]. Sun et al. [21] simulated SWATH vehicles to assess wavelength- and speed-dependent pitch and heave transfer function alterations. Niklas and Pruszko [22] simulated how bow profiles modify resistance and wave-induced motion response in full-scale ships. Gong et al. [23] numerically analysed the added resistance and seakeeping properties of trimarans under various oblique wave circumstances, revealing a motion amplitude trend different from that of monohull ships. Guan et al. [24] auto-optimised the design of ship types using an Excel/STAR-CCM+ platform, focusing on wave-induced resistance and pitch amplitude.
By further assessing the seakeeping capabilities of stern appendages, Day and Cooper [25] analysed interceptor influence on sailing yachts in serene waters and minimal wave conditions, demonstrating reduced resistance under minor wave circumstances. Rijkens et al. [26] modified the interceptor form by adding a substantial circular transition section between the hull’s base and the interceptor and used predictive ship motion software to show that this configuration reduces vertical peak accelerations. Karimi et al. [27] integrated testing and theoretical approaches to evaluate how auto-controlled interceptors could dampen vertical ship motion. Park et al. [28] empirically investigated how controllable interceptors impact high-speed planing craft vertical motions and analysed pitch motion variances in regular and irregular waves. Wang et al. [29] numerically analysed the SF impact on catamaran speedboat single-speed seakeeping traits. Li et al. [30] numerically analysed a trimaran vessel fitted with a T-foil and SF, focusing on wave steepness variation impact on ship motion and the forces exerted on the T-foil.
Reviewing existing research on interceptors and SF reveals numerous studies relating to their mechanisms or analysing resistance reduction effects in calm waters; however, comprehensive comparative studies addressing the resistance and seakeeping performance of these appendages in wave conditions, particularly in semi-displacement vessels, are limited. Based on previous calm-water work by Song et al. [31], we employed numerical simulations across diverse wave conditions to contrast resistance reduction effects under wave conditions and calm waters. By examining the variance in pitch and heave transfer functions relative to wavelength and steepness, we sought to discern the underlying mechanisms affecting ship resistance and movement from a hydrodynamical perspective. Our findings offer invaluable insights and practical guidance for designing and applying stern appendages.

2. Numerical Method and Approach

2.1. Governing Equations and Turbulence Model

The incompressible unsteady RANS equations describing the motions of a fluid are
ρ t + ( ρ u i ) x i = 0
( ρ u i ) t + x j ( ρ u i u j ) = p x j + x j μ ( u i x j ρ u i u j ¯ ) + S i ,
where ui and uj are the time-averaged values (i, j = 1, 2, 3) of the velocity component, p is the time-averaged value of pressure; ρ is the fluid density, μ is the dynamic viscosity coefficient, ρ u i u j ¯ is the Reynolds stress term, and Si is the source term.
This study employed the SST k ω turbulence model. By incorporating both k ω and k ε models in the interior and exterior of the near wall, accurate ship hydrodynamic performance predictions were achieved. The governing equation was discretized by the second-order upwind, with the discretized equations resolved using segregated flow.

2.2. Free Surface Modeling

Accurately simulating the free surface is vital for predicting ship resistance and motion response, as wave-making resistance remains the dominant component of ship resistance in waves. We used the volume of fluid (VOF) model and the high-resolution interface capturing (HRIC) method to simulate the free surface. The volume fraction variable α is defined as
α t + · ( u α ) + · ( α ( 1 α ) u r ) = 0 ,   α = { 0 a i r 1 w a t e r
Here, ur is the interface compression velocity. The water and air phases can be defined throughout the domain as
φ ( x c e l l , t ) = φ w a t e r α ( x c e l l , t ) + φ a i r ( 1 α ( x c e l l , t ) )
Here, φ denotes the predefined fluid properties of the given phases. The density and viscosity of water and air can be expressed as
{ ρ = ρ w a t e r α + ρ a i r ( 1 α ) μ = μ w a t e r α + μ a i r ( 1 α )

2.3. Geometry Model and Simulation Conditions

A semi-displacement ship with a typical V-shaped bow and transom stern equipped with two pairs of fin stabilisers was simulated. Designed to cruise at 18 knots, the corresponding Froude number of the ship was Fr = 0.4. Figure 1 displays the geometric configuration and coordinate system of the vessel. Table 1 outlines the primary model parameters with a scale ratio of 1:16.
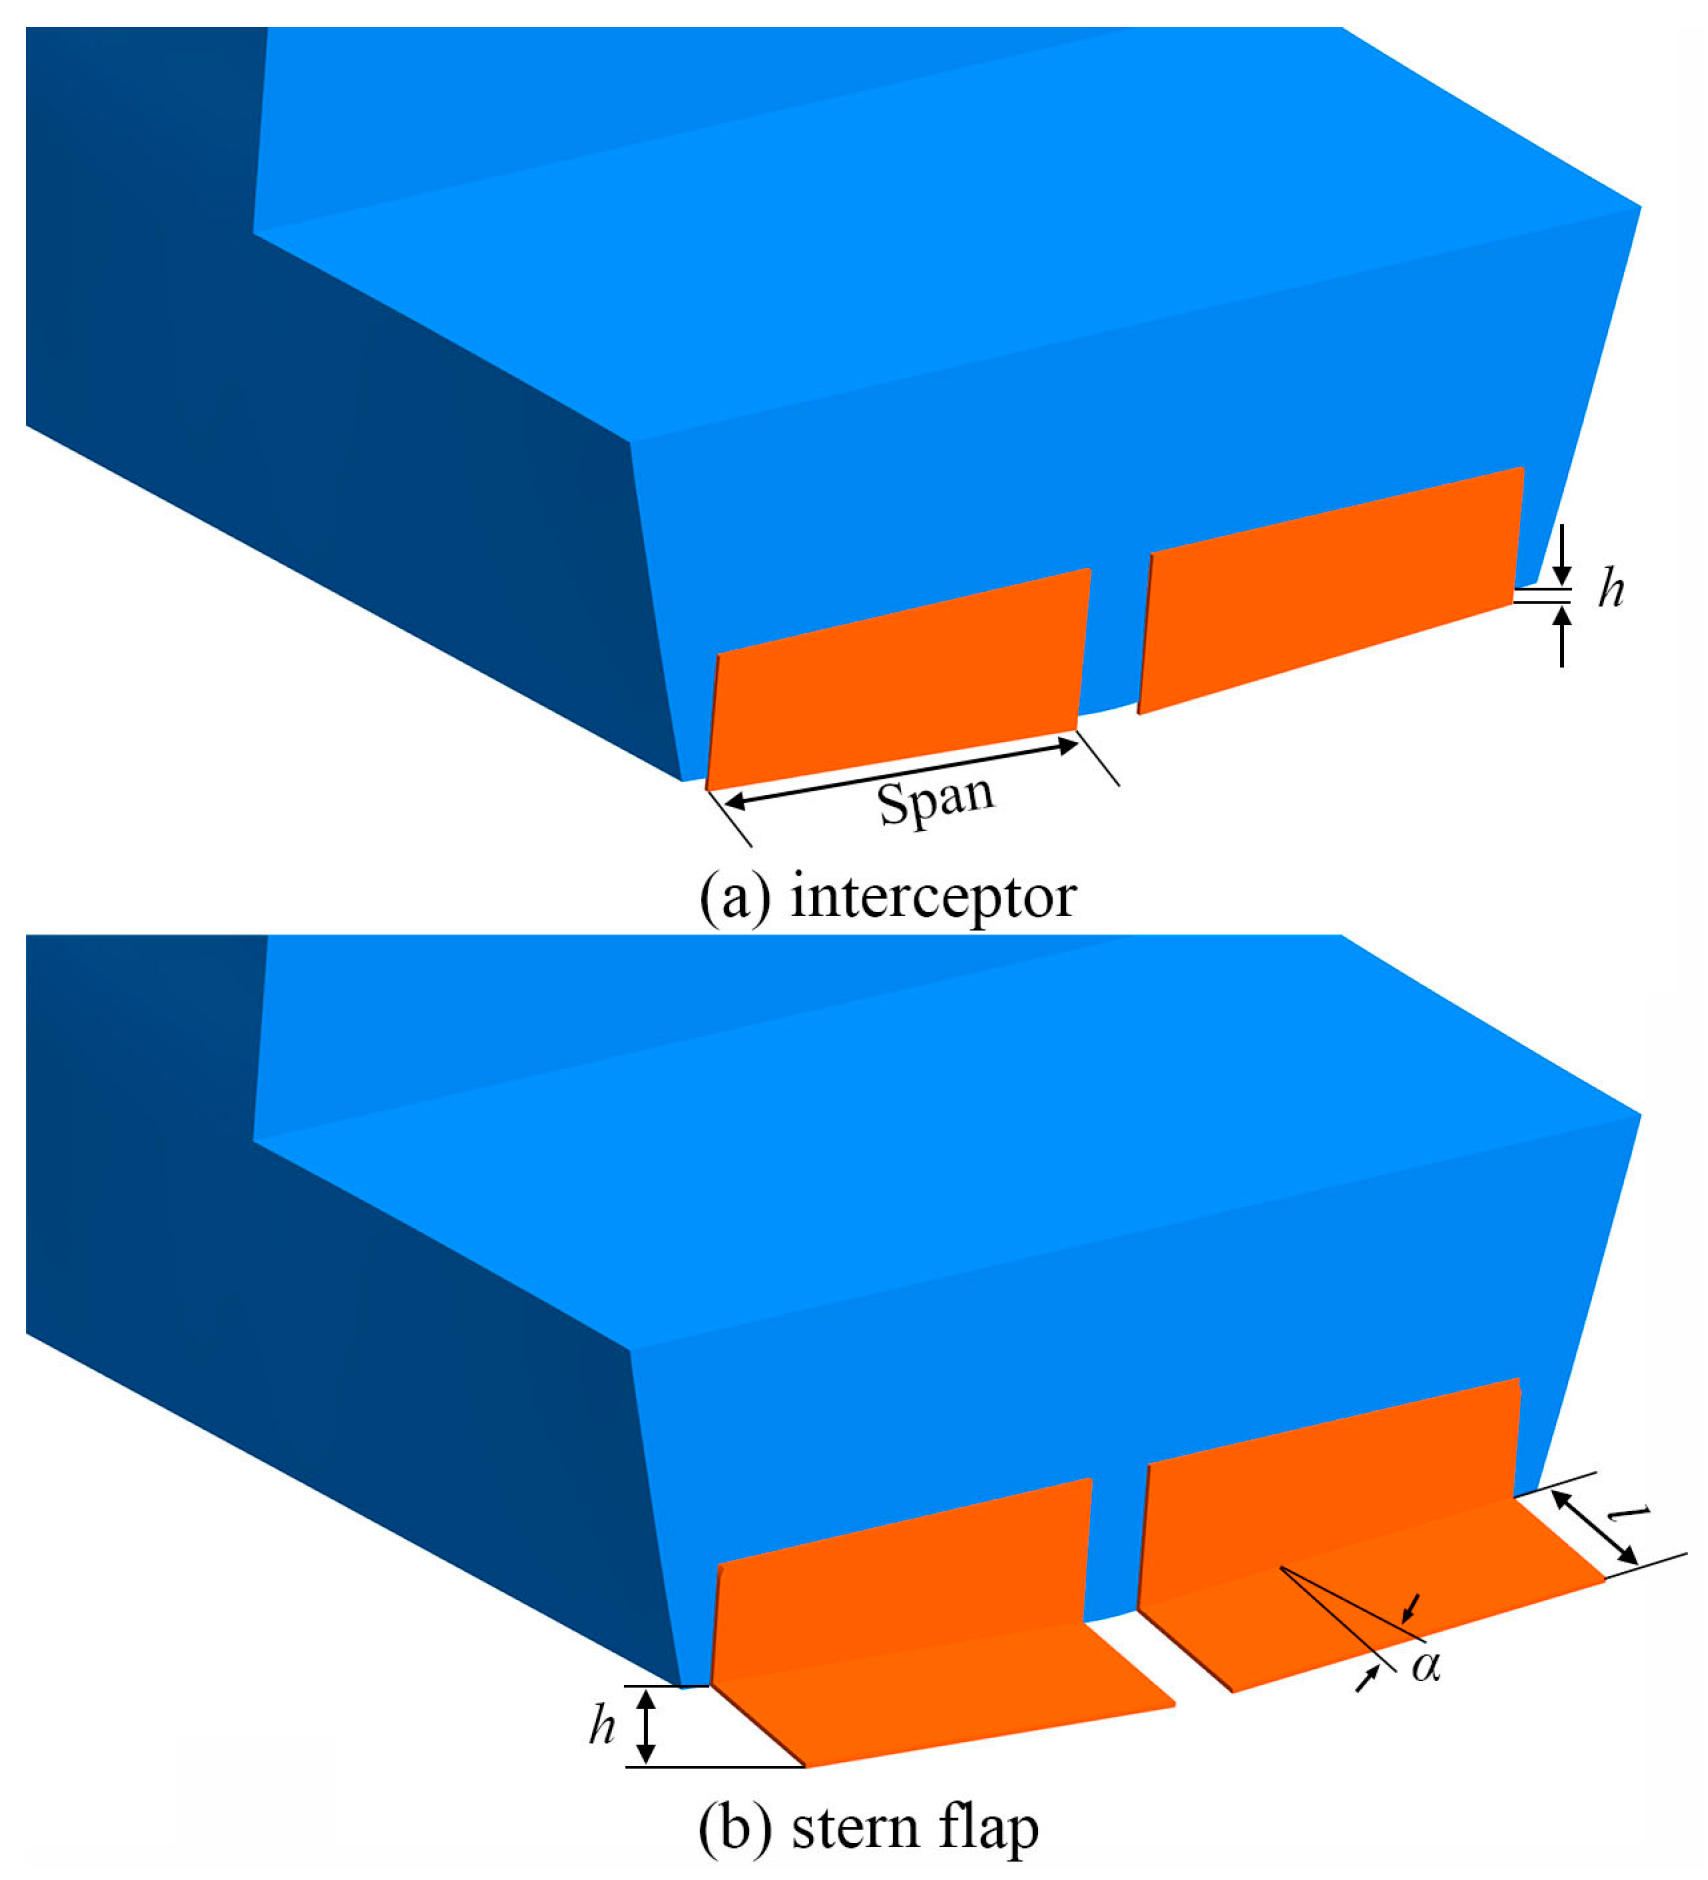
A previous study [31] used model testing and numerical simulations to evaluate the resistance reduction capabilities of interceptors and SFs in calm waters, indicating optimal resistance reduction when the interceptor’s depth was 0.15% LPP. Similarly, an SF at a 10° angle and a chord length, l, of 1.5% LPP, translating to a relative depth, h, of 0.26% LPP, effectively reduces resistance. Consequently, we further explored the impact of these appendages on ship resistance and motion response in regular waves. The installation specifics and parameter definitions of the interceptor and SF are presented in Figure 2. The stern transom plate has a span and bottom edge width of 281 and 648 mm, respectively, and the space between the appendages on either side was 42 mm.
Numerical simulations across varying wave conditions were undertaken for three ship configurations: bare hull (BH), hull with an interceptor (INT), and hull equipped with an SF. As detailed in Table 2, each configuration underwent simulations for 12 distinct regular waves with variable wavelengths and steepness, all at a speed of Fr = 0.4. The study covered the wavelength range λ/LPP = 0.5–2.5, wave steepness range ak = 0.025–0.15, and corresponding wave encounter frequencies fe = 0.500–1.654.

2.4. Numerical Wave Generation and Data Processing

The STAR-CCM+ solver generated regular waves through the inlet and outlet boundary conditions of the computational domain. The position of the free surface at the velocity inlet was [29]
η ( t ) = a cos ( k x ω t + φ ) .
The speed component of the velocity inlet was
u = a ω cosh k ( z + d ) sinh k d sin ( k x ω t + φ )
w = a ω sinh k ( z + d ) sinh k d sin ( k x ω t + φ ) ,
where a represents the wave amplitude, k is the wave number, ω is the natural frequency of the wave, and u and w are the axial and vertical velocities, respectively.
To counteract wave reflection, a wave-damping function was designated at the computational domain’s outlet boundary [32] using the following momentum equation expression [29]:
u t + u u x + v u y = g x 1 ρ p x + v [ 2 u x 2 + 2 u y 2 ] μ ( x ) u
v t + u v x + v v y = g y 1 ρ p y + v [ 2 v x 2 + 2 v y 2 ] μ ( x ) v ,
where μ is the damping coefficient for linear damping in the direction of the incident wave:
μ ( x ) = { a s ( x x 0 ) / L S x > x 0 0           x x 0 } ,
where x0 is the point where wave absorption commences, LS is the length of the damping layer, and as is the wave-extinction strength coefficient. Here, as = 2 and the wave damping range is −3 < X/LPP < −2.
The encounter frequency of the ship during wave motion, fe, is defined as
f e = g 2 π λ + U λ ,
where U is the water velocity.
The resistance coefficient, heave, and pitch values of the simulated ship were processed using a fast Fourier transform (FFT). The zeroth-order amplitude of the resistance coefficient represented the average force in regular waves. The added resistance coefficient, Cad, of the ship is defined by
C a d = C t 0 C t c w ,
where Ct0 represents the zeroth-order amplitude of the resistance coefficient in waves and Ctcw is the resistance coefficient in calm water at the corresponding speed.
The first-order heave and pitch amplitudes were made dimensionless to derive the response amplitude operator (RAO) or transfer function (TF), defined as
T F 3 = z 1 a   ; T F 5 = θ 1 a k ,
where TF3 and TF5 are the heave and pitch transfer functions, respectively, and Z1 and θ1 denote the first-order heave and pitch amplitudes, respectively.

2.5. Computational Domain and Mesh Generation

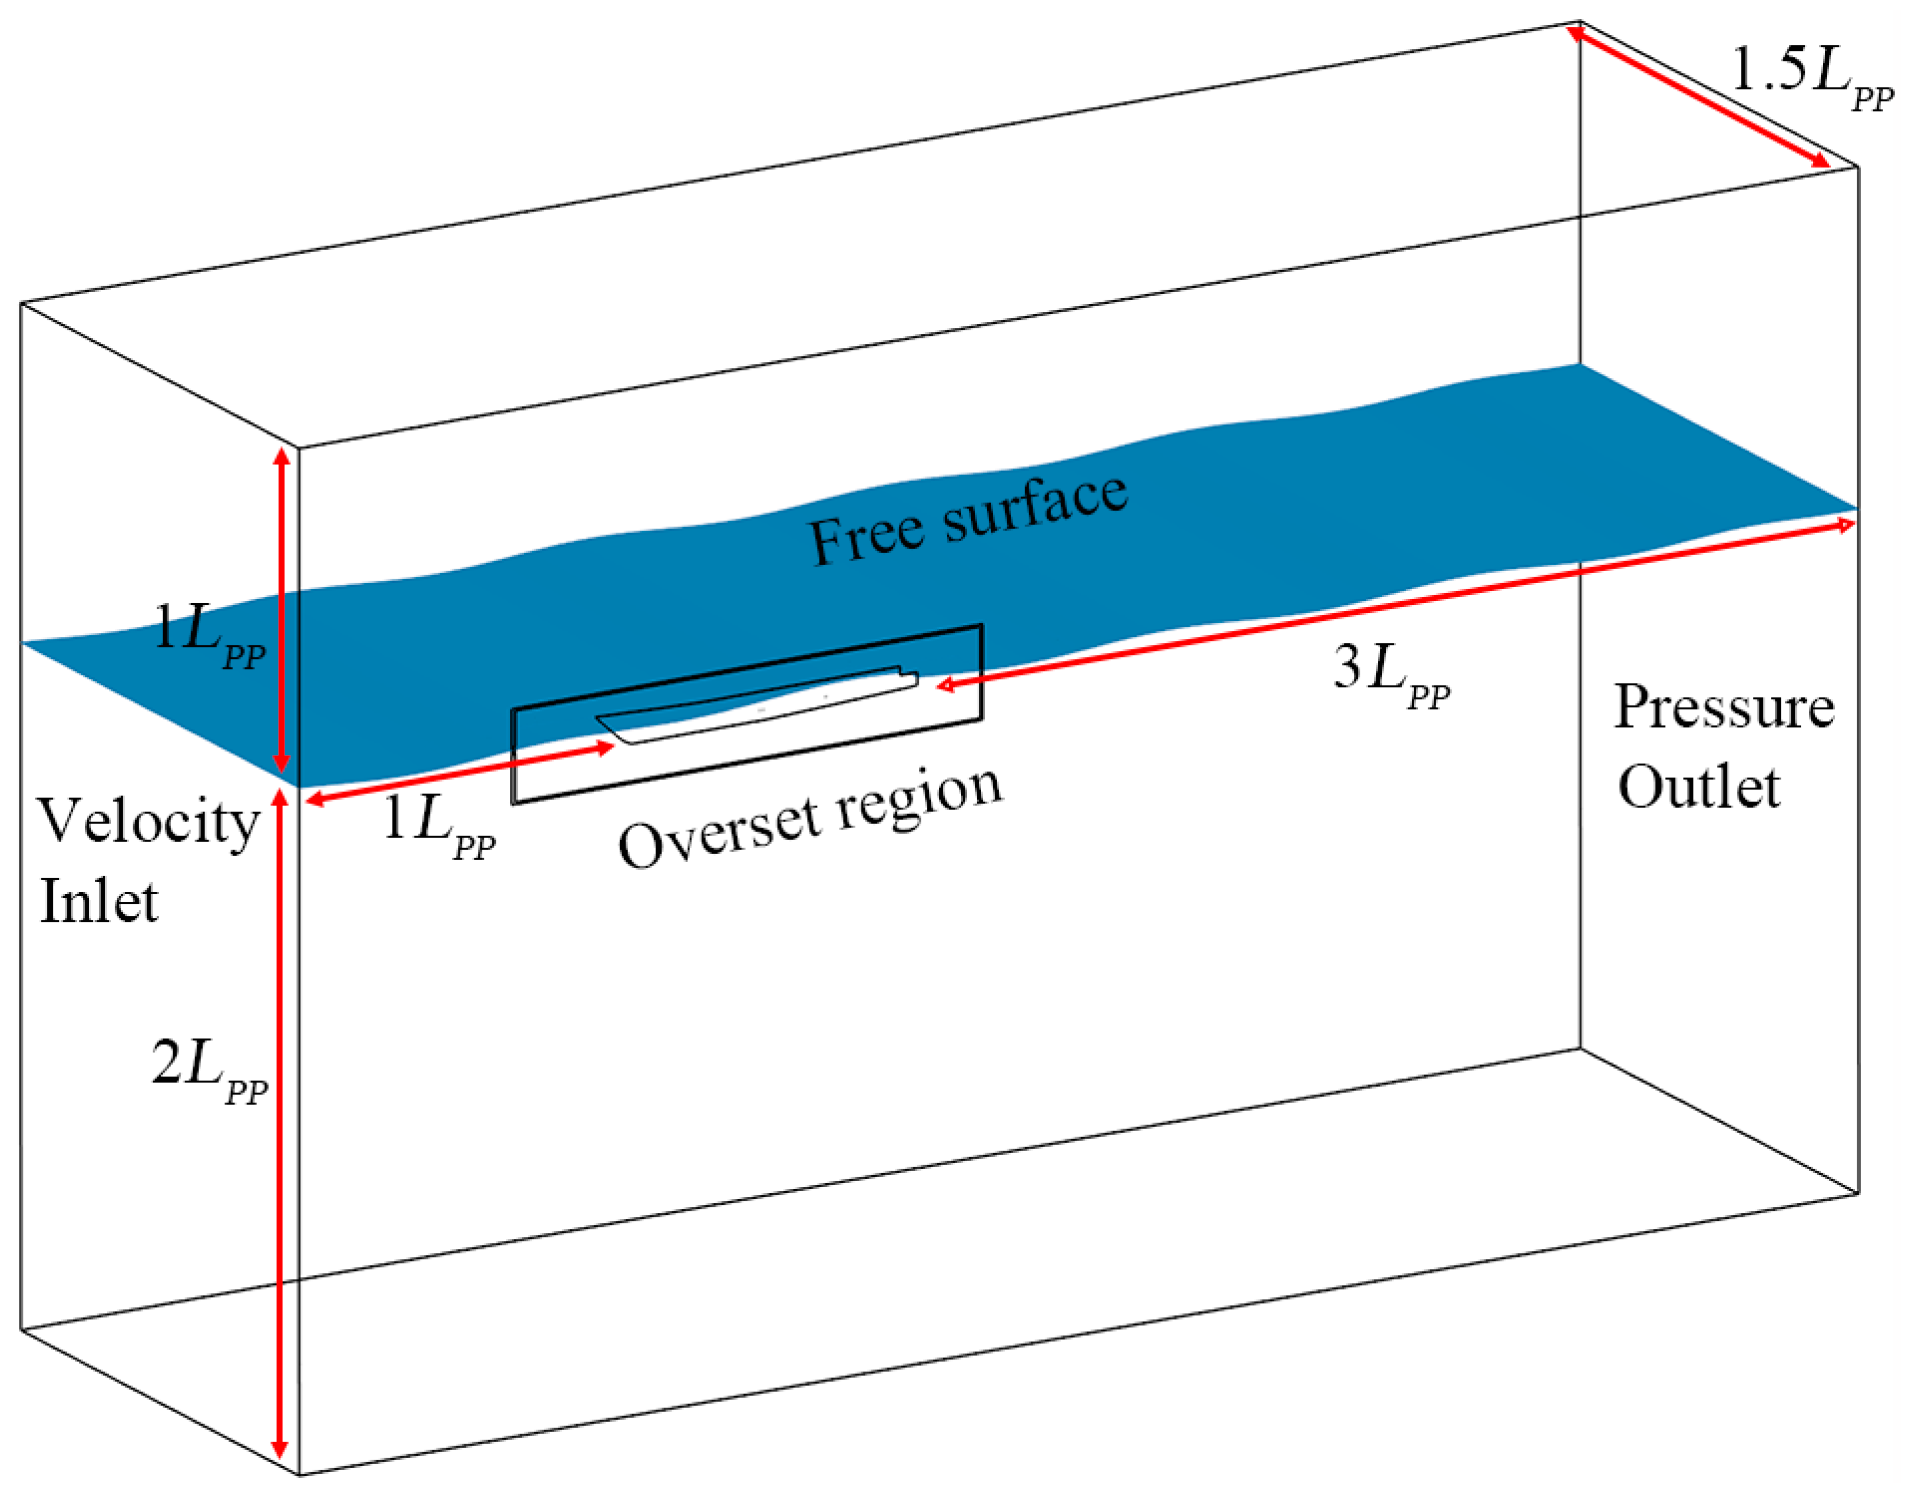
Numerical solutions were applied to a half-side ship model owing to its symmetry. The wave motion of the ship was simulated using overset mesh technology, permitting heave and pitch motions. The computational domain was bifurcated into the background and overset regions. Given the wave-damping function at the outlet, the distance from the stern to the outlet exceeded the computational domain used for calm water resistance simulation. Figure 3 shows the length, width, and height of the background region as: −3 < X/LPP < 2, 0 < Y/LPP < 1, −2 < Z/LPP < 1. The overset region was slightly larger than the hull, with length, width, and height dimensions of 1.5 LPP, 0.15 LPP, and 0.3 LPP, respectively.
The following boundary conditions were set for the computational domain: the inlet, top, and bottom were velocity inlets, with the top and bottom mirroring infinite far-field boundary conditions. The outlet was a pressure outlet, with both sides serving as symmetry planes. The surfaces of the hull and appendages functioned as no-slip walls.
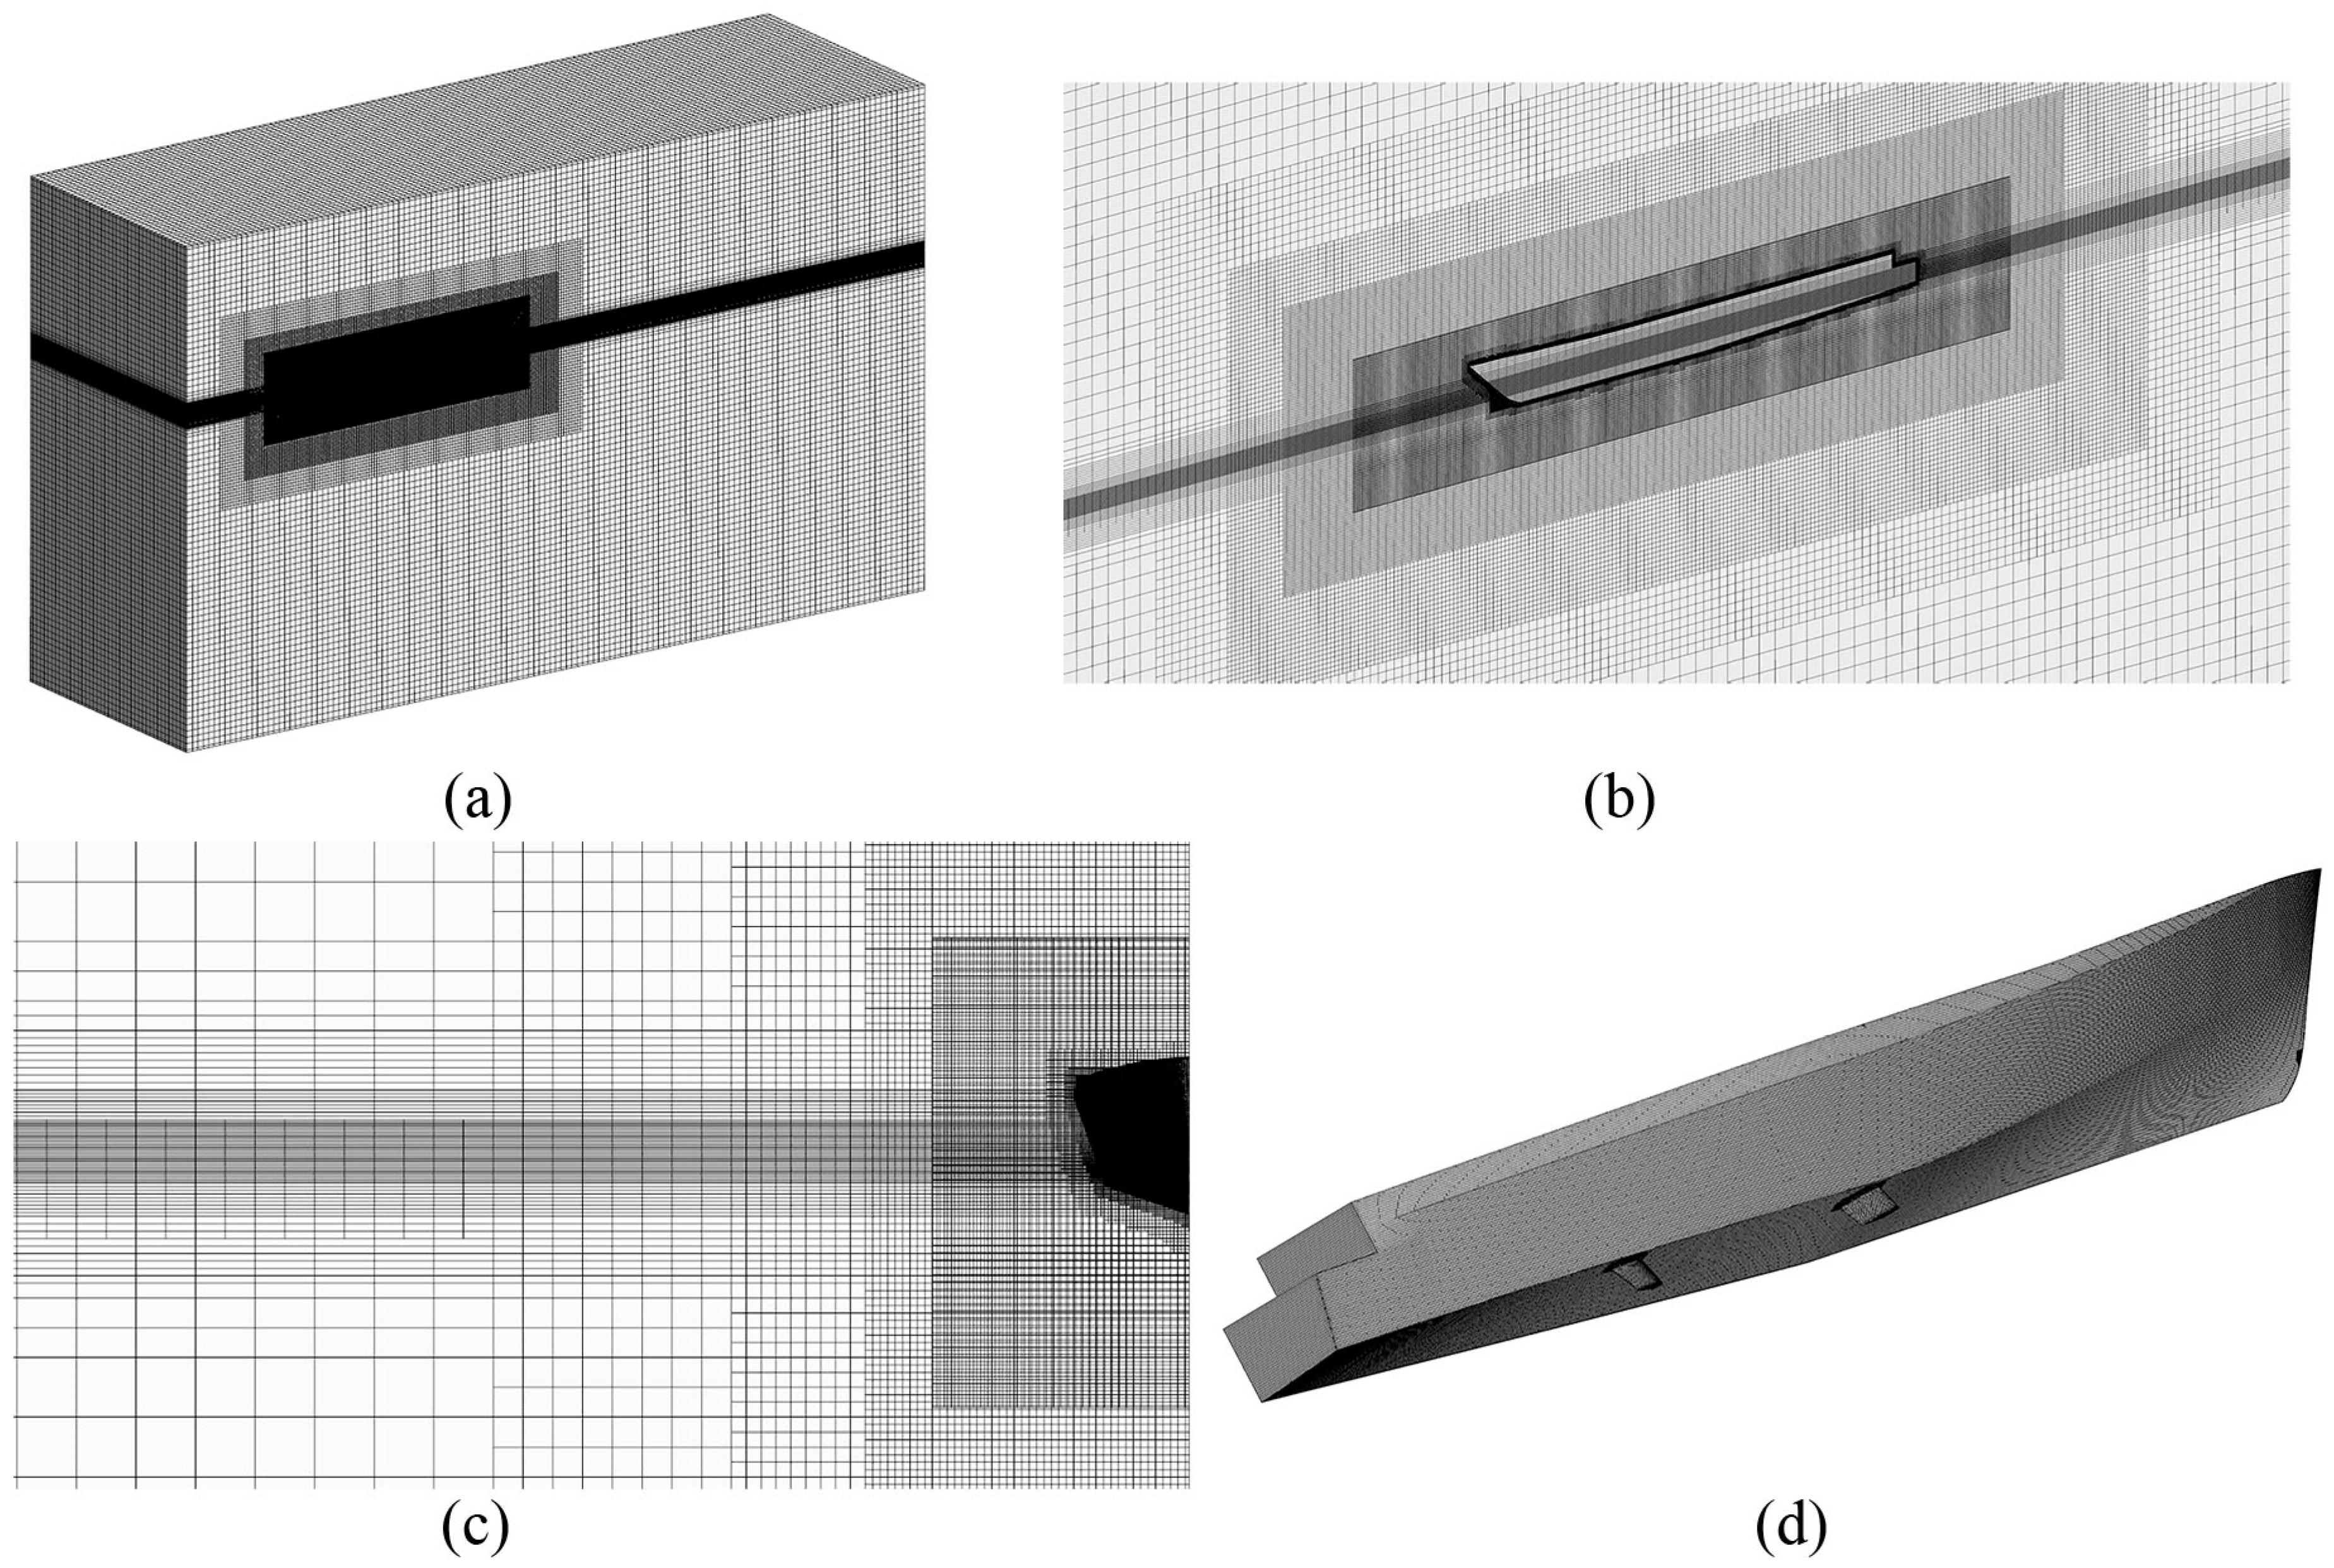
Figure 4 illustrates the grid generation of the computational domain, showcasing the global, symmetry plane, hull, and hull-surrounding meshes. Refining the free surface mesh is crucial to calculating the wave-added resistance and motion performance in regular waves. Adhering to ITTC procedure recommendations [33], a minimum of 40 grid points per wavelength on the free surface and at least 20 grid points vertically were used. Each wavelength and wave height comprised 60 axial and 20 vertical grid points, respectively. The ship’s boundary layer mesh incorporated five layers, with a boundary layer stretch of 1.3. The numerical simulation’s final mesh count was Gf = 7.66 million.

3. Verification and Validation

3.1. Verification of the Mesh and Time Step

Mesh and time-step uncertainty analyses were undertaken based on the Richardson method [34]. A minimum of three mesh sets based on the mesh refinement ratio rG were required to conduct this analysis. The mesh refinement ratio is defined as
r G = ( N fine N coarse ) 1 / 3 ,
where N is the total number of meshes.
Using the Richardson method [34], resistance values were calculated from fine, medium, and coarse meshes, Sf, Sm, and Sc, respectively, to obtain the following convergence ratio:
R G = | S f S m S m S c | .
The estimated order of accuracy was calculated as
P R E = ln ( | S m S c | / | S f S m | ) / ln ( r ) .
The distance metric to the asymmetric range was obtained as
P G = P R E / P t h ,
where Pth = 2 is the theoretical order of accuracy.
The mesh uncertainty was obtained as
U G = { ( 2.45 0.85 P G ) | S f S m r P R E 1 | ,   0 < P G 1 ( 16.4 P G 14.8 ) | S f S m r P R E 1 | ,   P G > 1 ,
For mesh uncertainty assessment, the mesh refinement ratio rG was set to 2 . Three distinct mesh sets—fine (Gf = 7.66 million), medium (Gm = 2.95 million), and coarse meshes (Gc = 1.28 million)—were crafted, keeping the boundary layer mesh topology consistent to maintain wall y+ value consistency.
The 26th ITTC recommends a minimum of 100 time steps per period (T) for simulating ships in regular wave conditions. In the time step uncertainty study, the time step refinement ratio, rT, was set to 2 , with time steps Tf = 0.00413, Tm = 0.00584, and Tc = 0.00826 s, corresponding to 0.4, 0.566, and 0.8% T, respectively, selected. The time step Tf and mesh Gf were selected for respective uncertainty analyses involving a bare hull with wave conditions λ/LPP = 1 and ak = 0.075. Table 3 lists the resistance and transfer function results under varying conditions.
Table 3 indicates minimal resistance and transfer function differences across diverse working conditions. Resistance and transfer function disparities between Gc and Gf remain below 3%; the transfer function variance between Tc and Tf was marginally greater but below 8%. Convergence verification data from the simulations is provided in Table 4. The time step and grid convergence ratios—RT and RG, respectively—were < 1, signifying monotonic convergence. Mesh and time-step uncertainty—UG and UT, respectively—for the resistance and transfer functions remained within 5% of Sf, indicating satisfactory convergence for this mesh topology and time step size.

3.2. Validation of Resistance and Motion in Calm Water

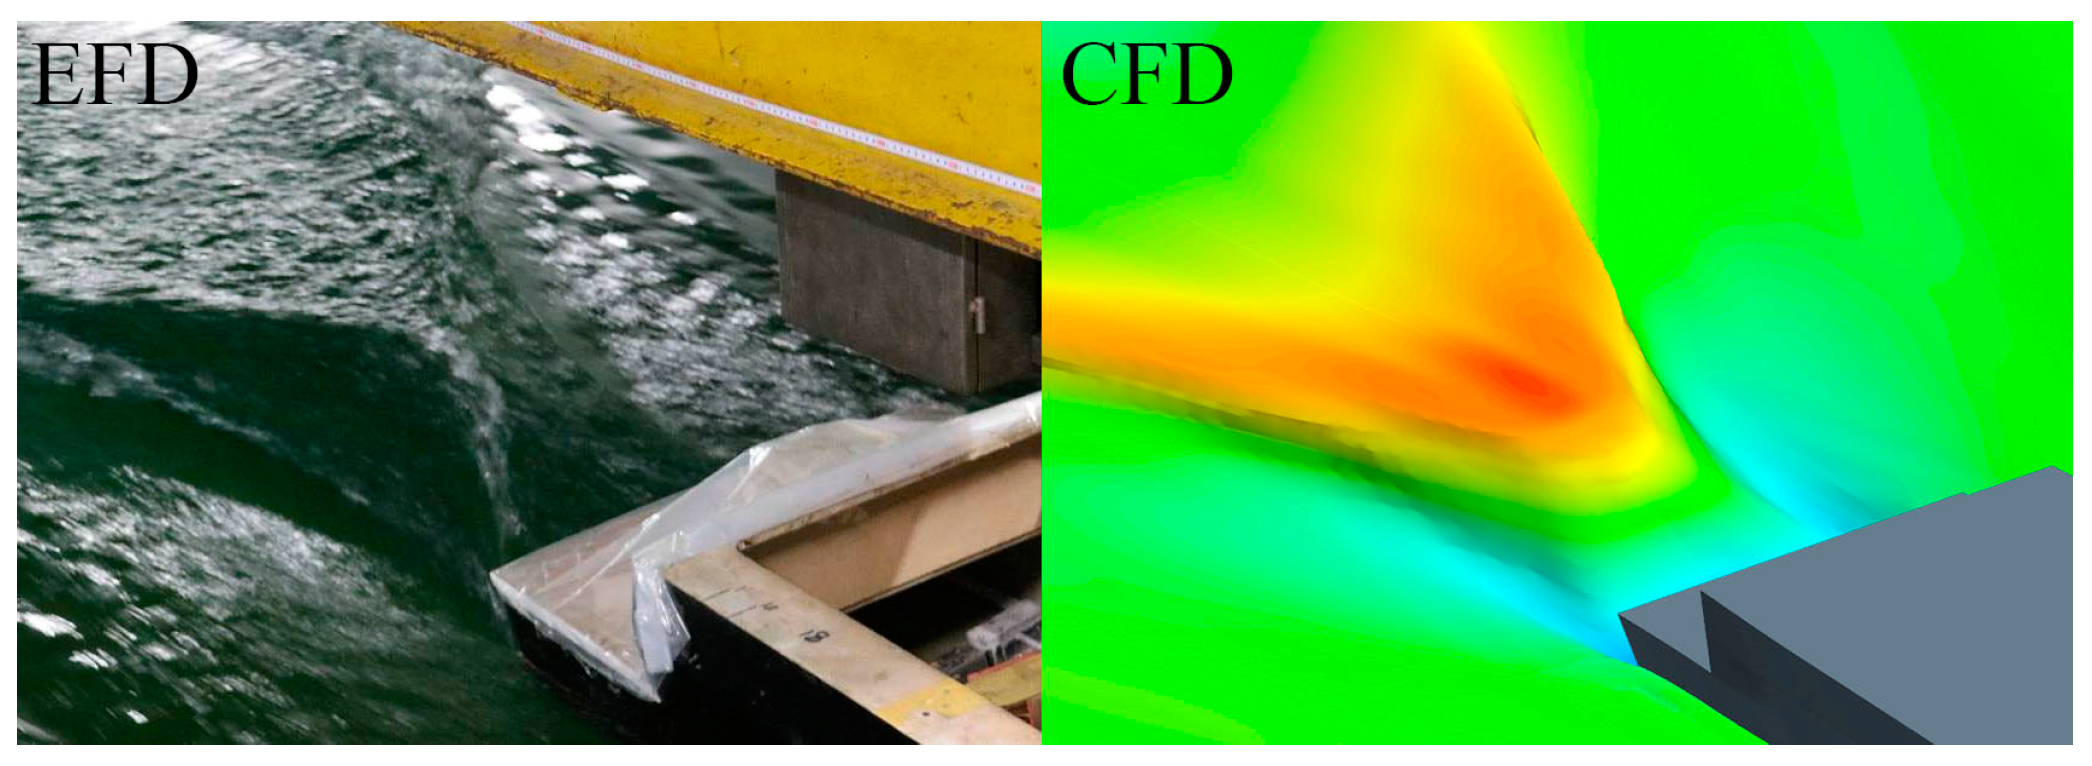
Based on the aforementioned simulation approach, the resistance and attitude of the ship in calm waters were determined and compared with experimental outcomes [31] to validate these parameters in calm conditions. Figure 5 and Table 5 compare the simulation and experimental results for calm water conditions at Fr = 0.4. Here, a positive trim value indicates a bow-trimmed ship, whereas a positive heave value signals ship elevation. Table 5 indicates that the employed numerical simulation approach effectively addresses ship resistance and navigational attitude, with discrepancies generally below 5%. Therefore, all subsequent ship resistance and motion attitude analyses used grid Gf and time step Tf.

4. Results and Discussions

4.1. Influence of Stern Appendages on Ship Resistance

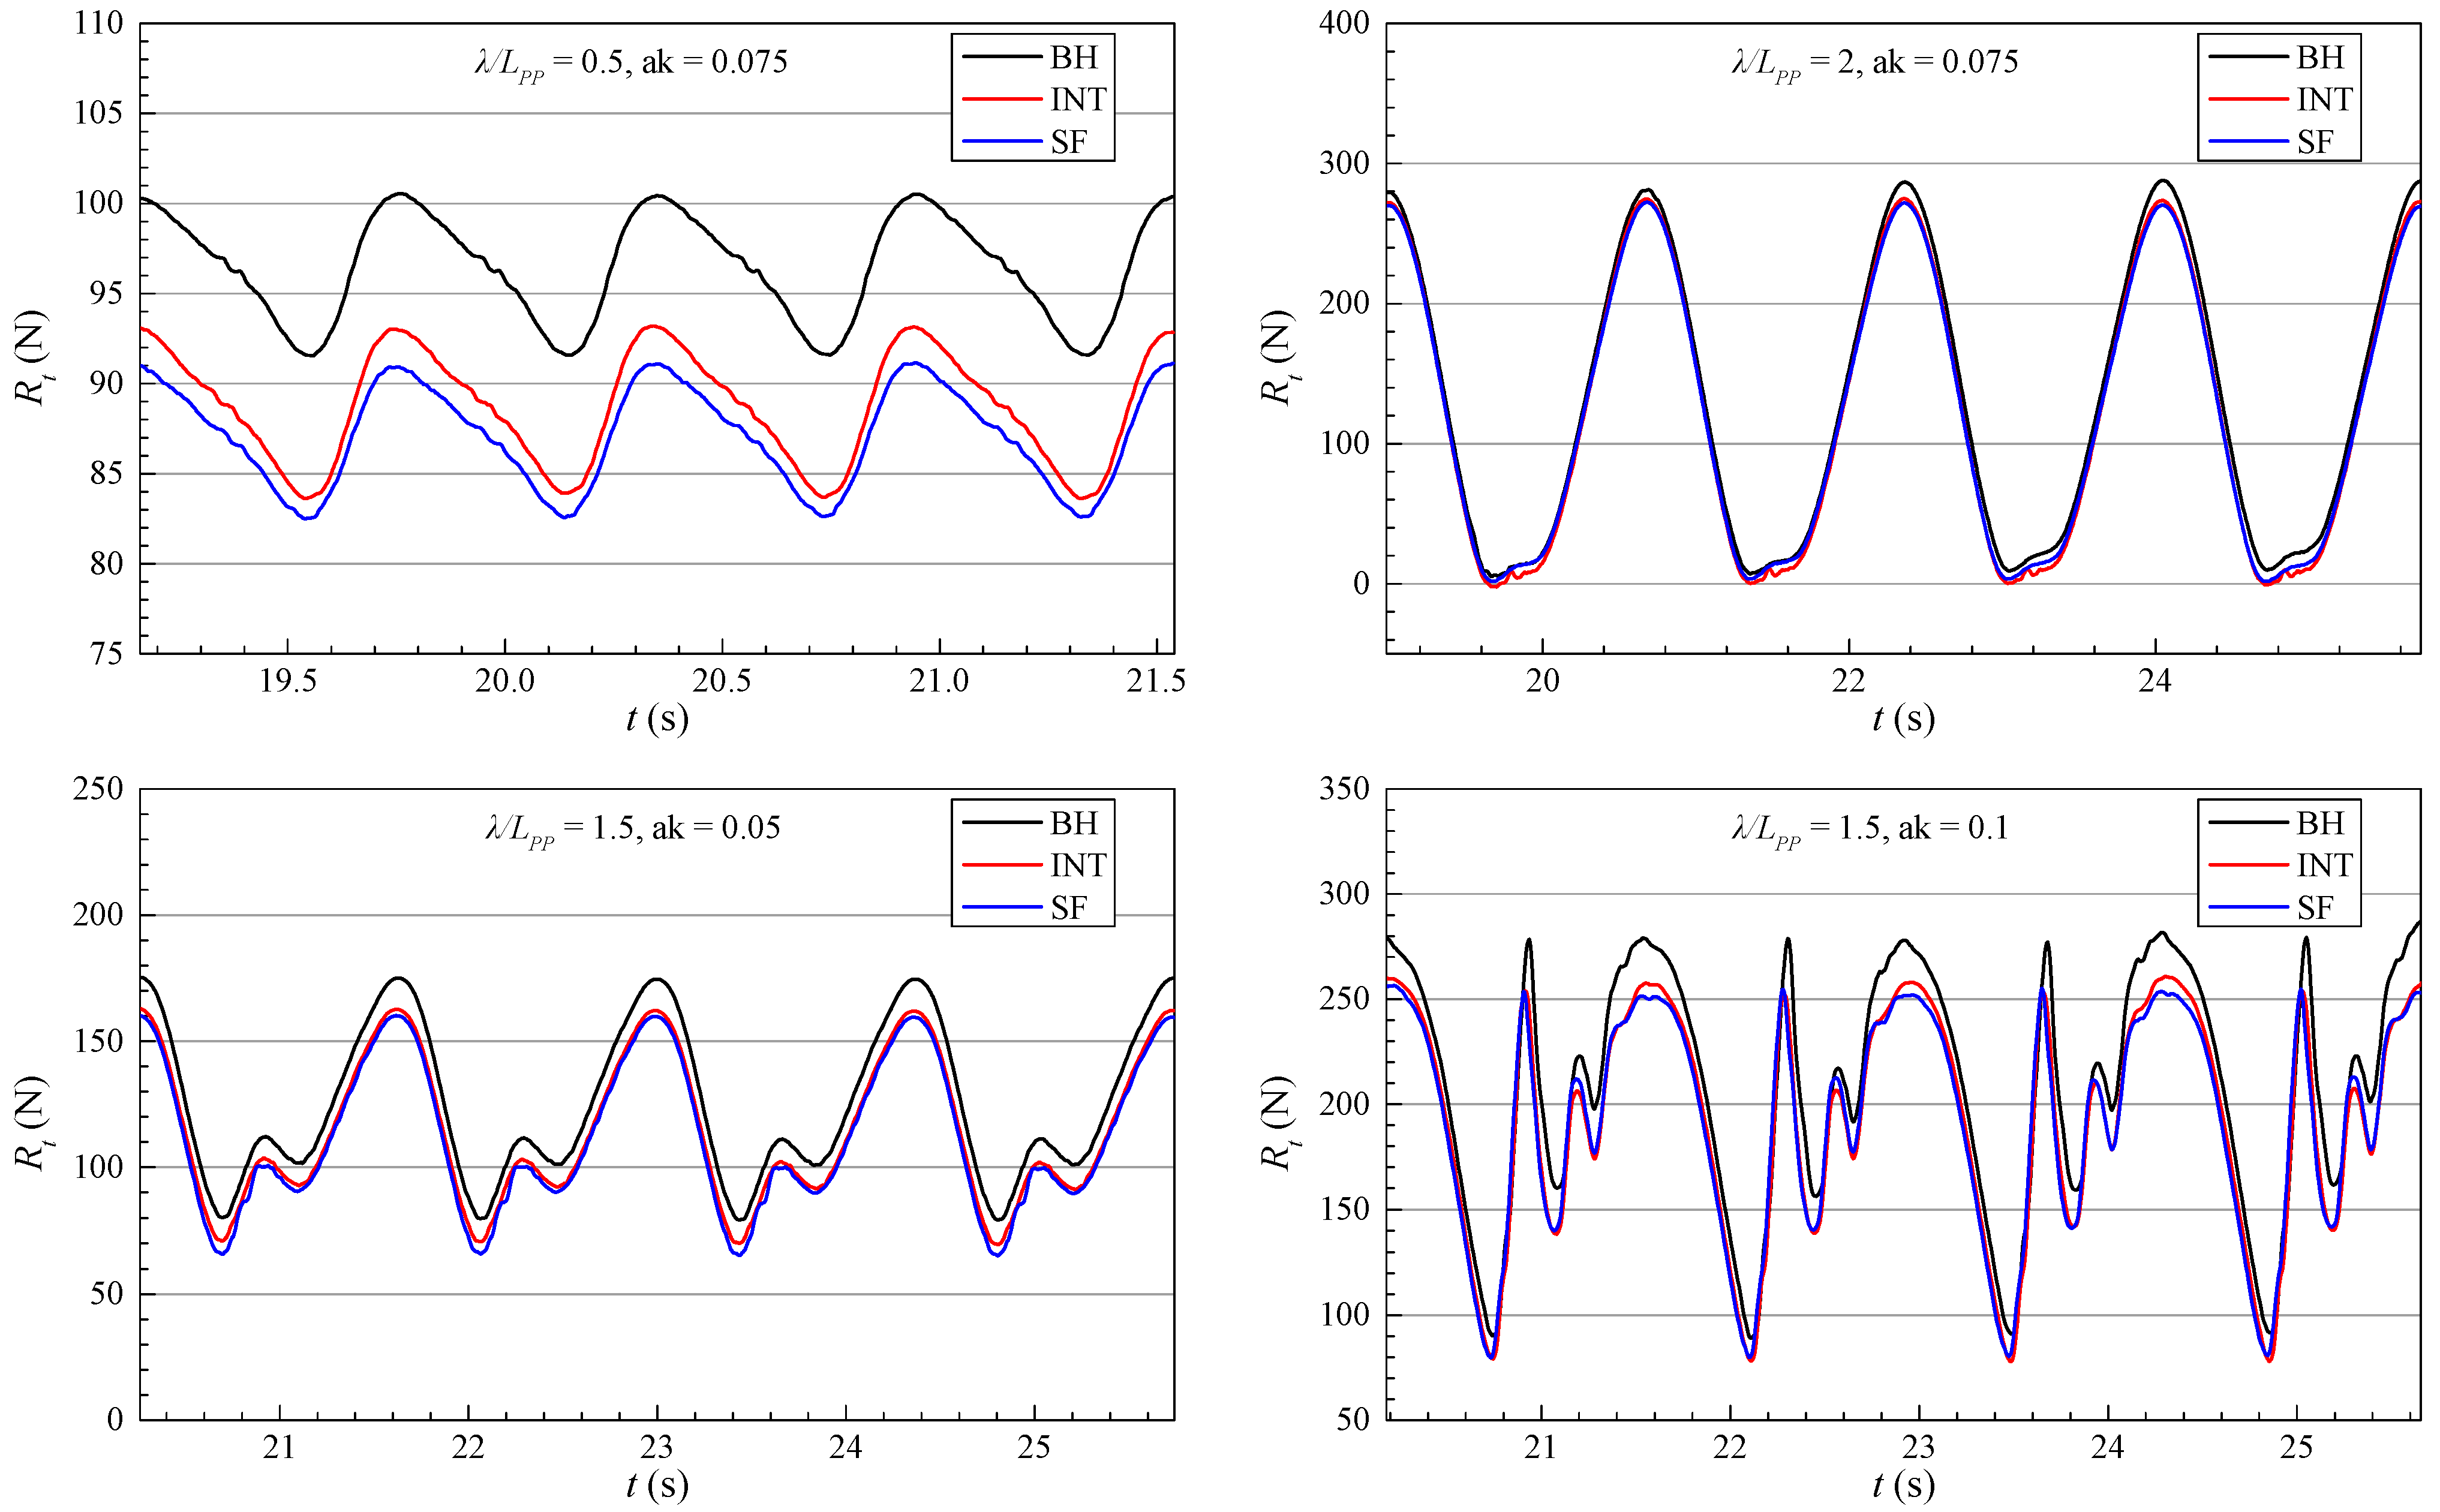
Figure 6 illustrates the resistance fluctuation of the half ship over time under various wave conditions before and after stern appendage installation, revealing that ship resistance in regular waves manifests a pronounced nonlinear characteristic. The installation of the interceptor and SF reduces the resistance, with the extent of this reduction being closely linked to the wavelength and steepness.
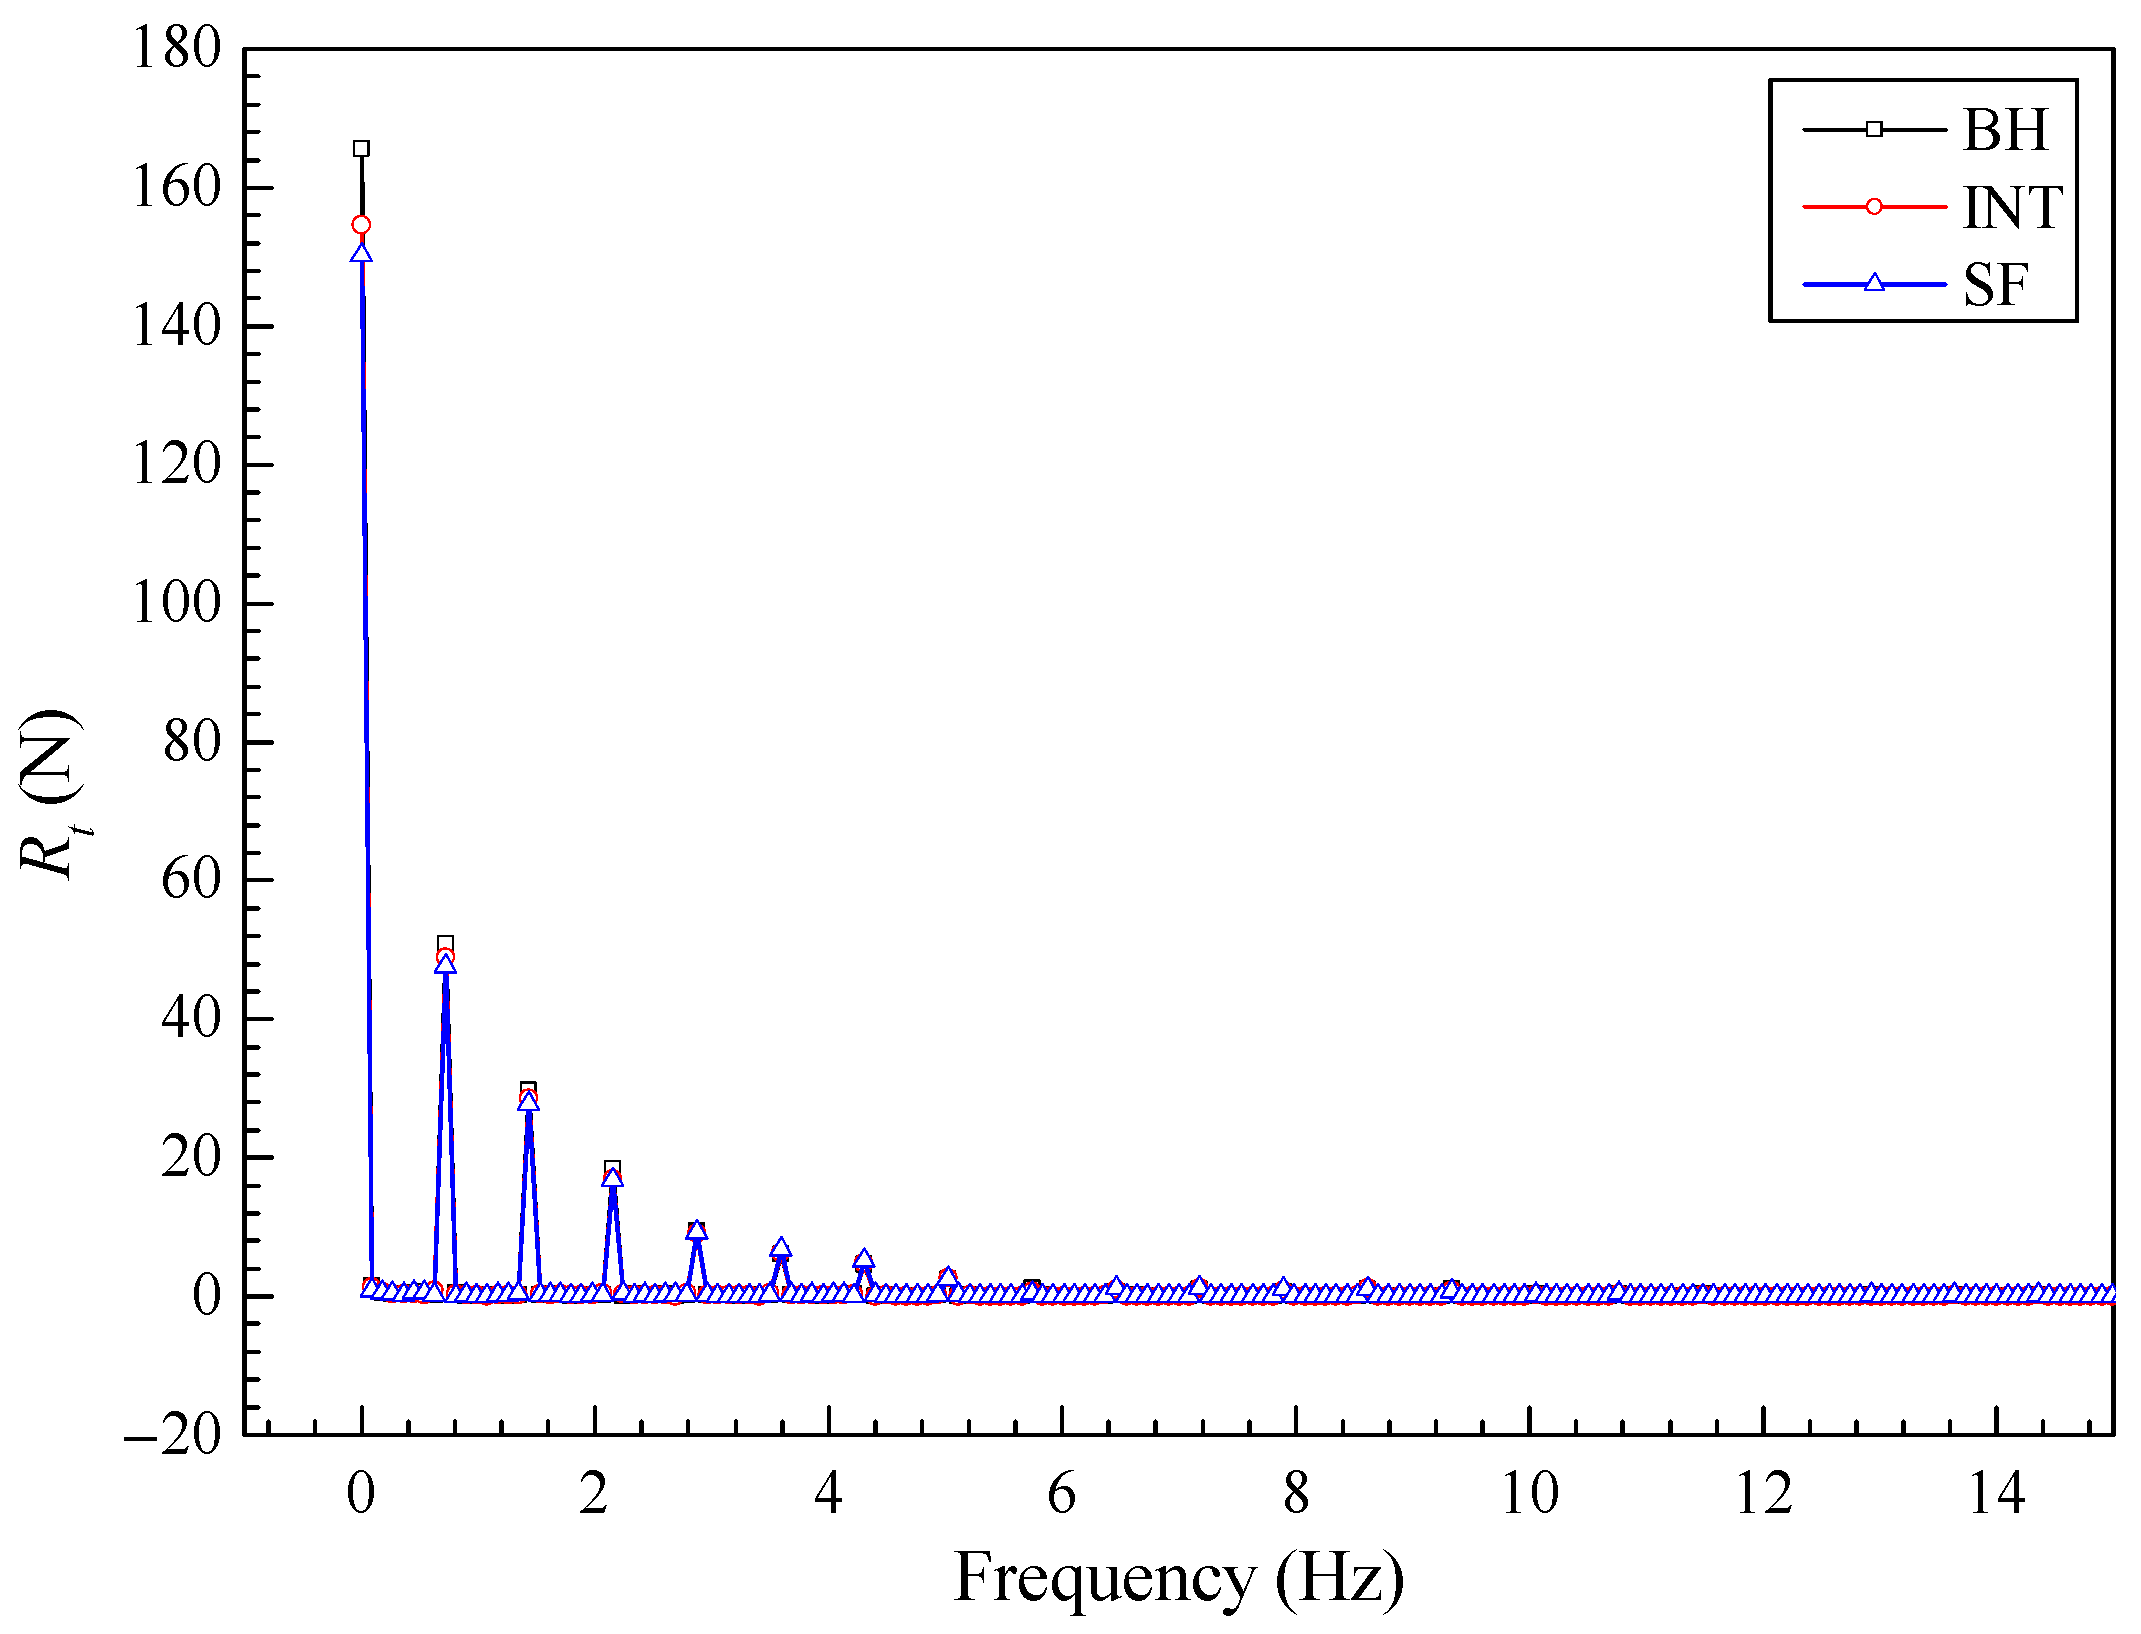
Figure 7 illustrates the FFT ship resistance outcomes when subjected to wave conditions λ/LPP = 1.5, ak = 0.075, revealing prominent resistance amplitudes at positions from the zeroth (0 Hz), first (0.718 Hz, fe), second (1.436 Hz, 2 fe), third (2.154 Hz, 3 fe), up to the sixth order (4.308 Hz, 6 fe). The zeroth-order amplitude dominates, with subsequent-order amplitudes diminishing progressively. A noticeable decline is observed in the resistance amplitude across all orders post-installation of the interceptor and SF, particularly the 0th order.
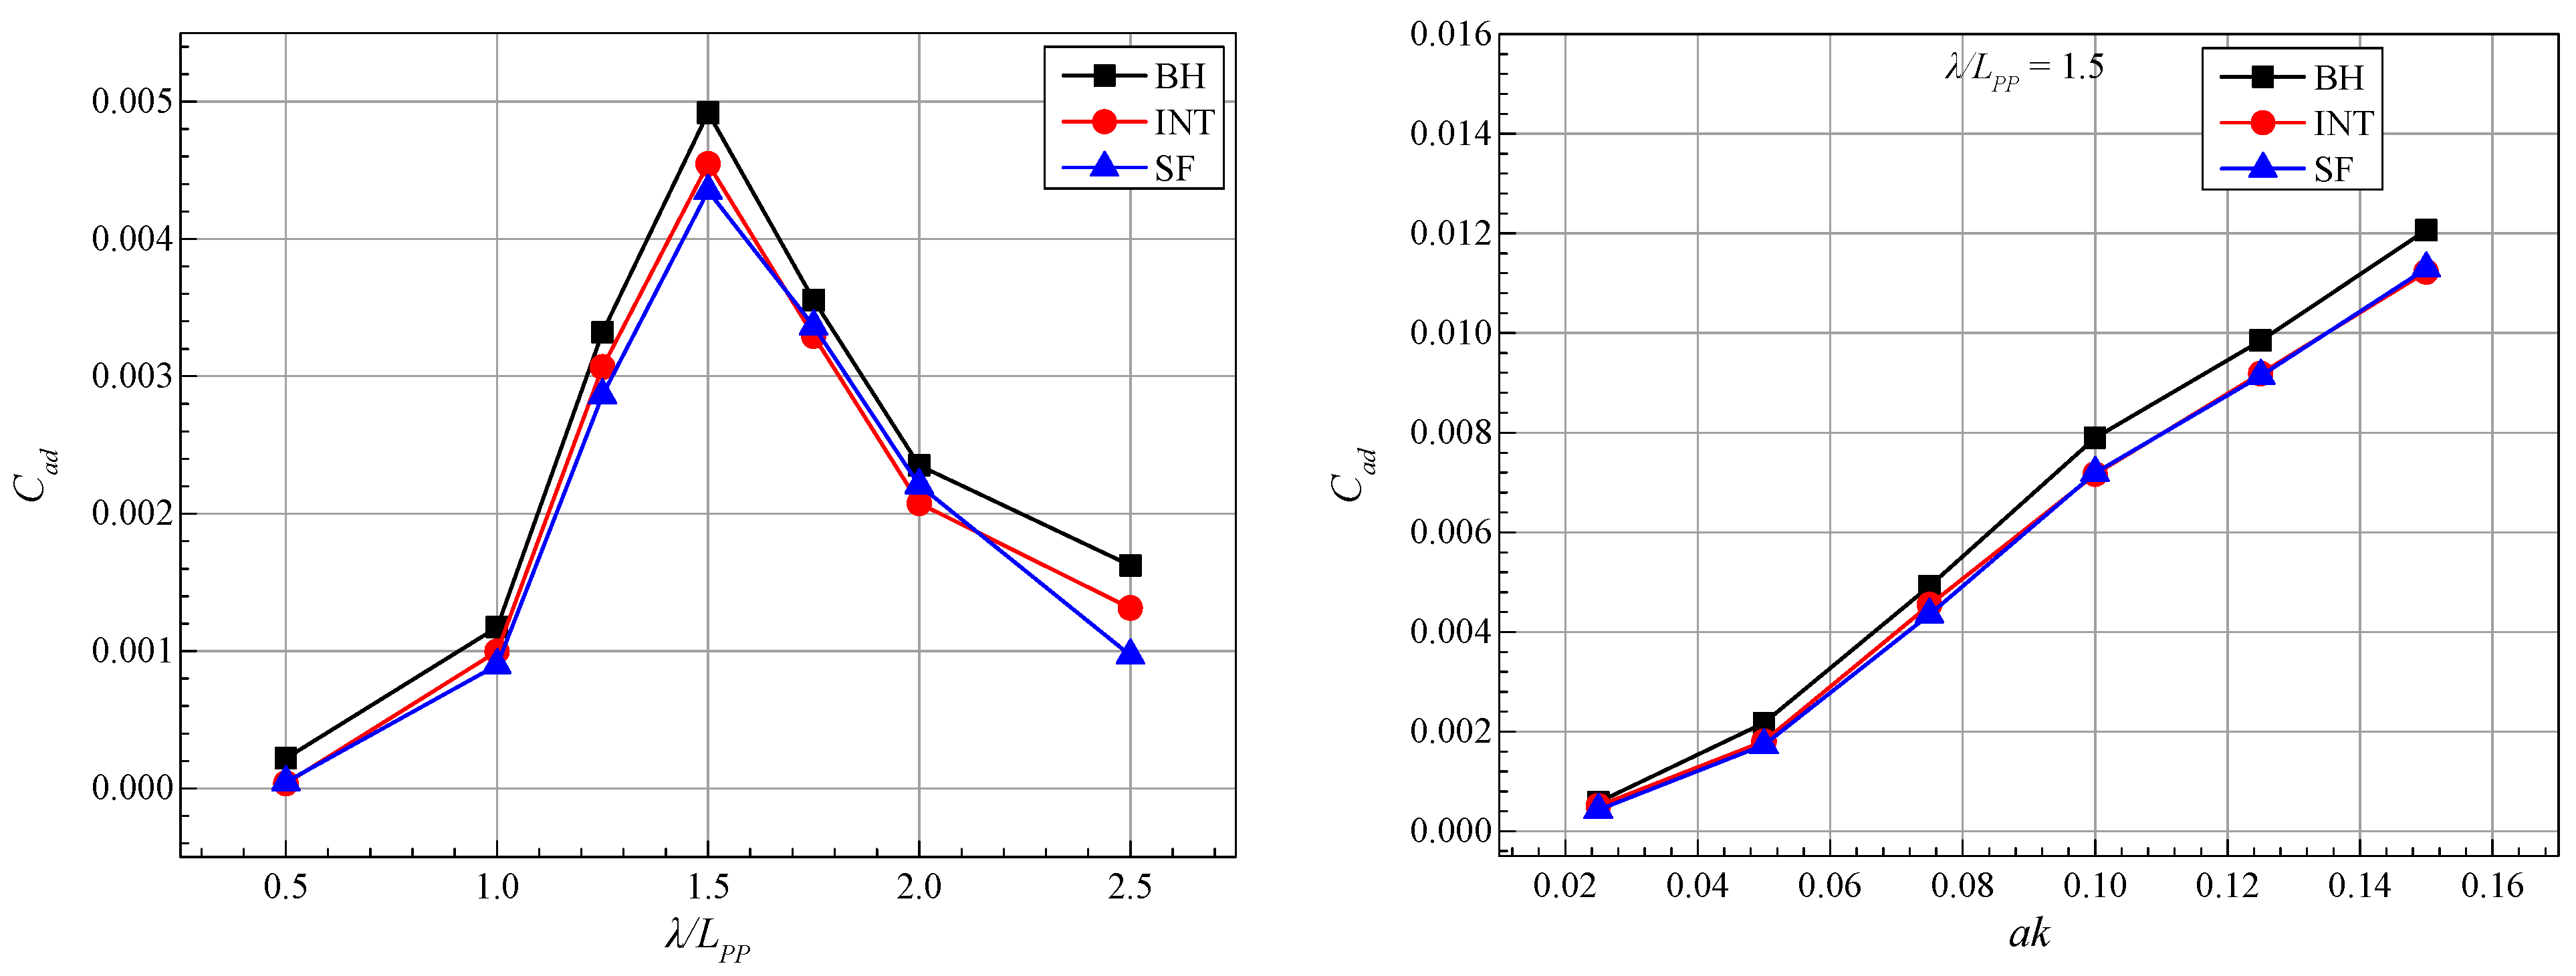
We applied Equation (12) with the 0th-order amplitude resistance coefficient to calculate the wave-added resistance under diverse wave conditions (Figure 8). It is observed that, for ak = 0.075, the added resistance coefficient first increases and then diminishes as the wavelength increases. At λ/LPP = 1.5, the added resistance percentage peaks at 70.6%. At wavelength 1.5 LPP, the added resistance coefficient climbs with wave steepness growth. The introduction of either an interceptor or SF consistently reduces the added resistance coefficient below the bare hull’s coefficient to a degree dependent on both the wavelength and steepness.
Table 6 lists the impacts of the interceptor and SF on ship resistance in calm water conditions. The simulations confirm that, at Fr = 0.4, these appendages reduce ship resistance by 5.65% and 7.52%, respectively. Although these results are slightly below experimental data, they effectively highlight the benefits of energy-saving stern appendages.
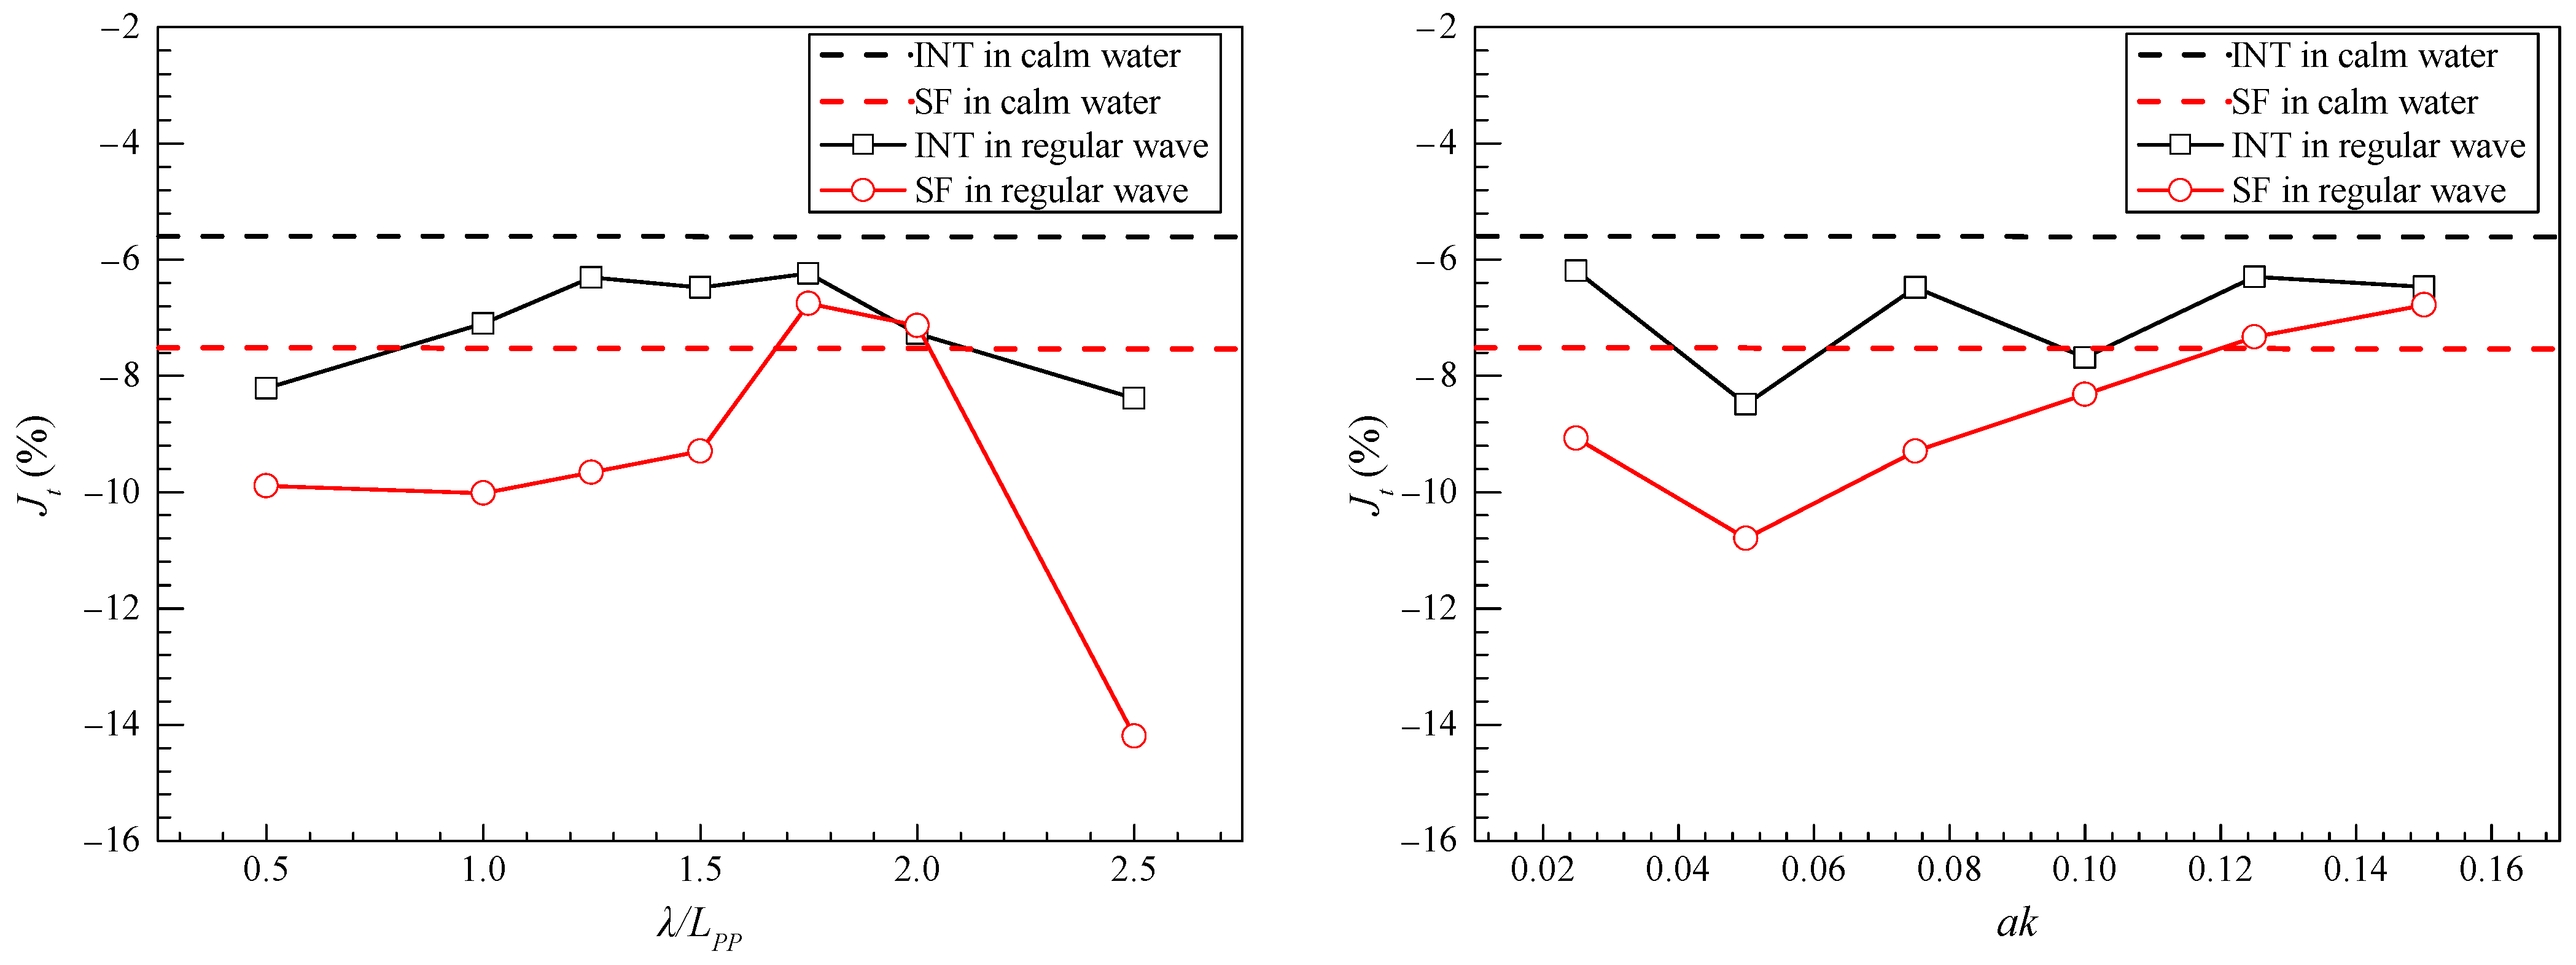
We calculated the resistance reduction rate, Jt, under wave conditions to better analyse the resistance reduction performance of the interceptor and SF in regular waves (Figure 9). Within the wavelength range of λ/LPP = 0.5–2.5, the resistance reduction rates of both appendages initially decrease and then increase with wavelength, generally surpassing their resistance reduction rates in calm waters. For wavelengths λ/LPP ≤ 1 and λ/LPP ≥ 2, the resistance reduction rate of the interceptor in regular waves was 7.09–8.39%, outperforming its rate in calm waters by 1.44–2.74%. For λ/LPP ≤ 1.5, the SF’s drag reduction rate in waves exceeded that in calm waters by 1.78–2.92%. At λ/LPP = 2.5, the resistance reduction rate of the flap was 14.1%, 6.6% above its calm water rate. At a constant wavelength of 1.5 LPP and wave steepness ak ≥ 0.05, the resistance reduction rates of both appendages declined with wave steepness.
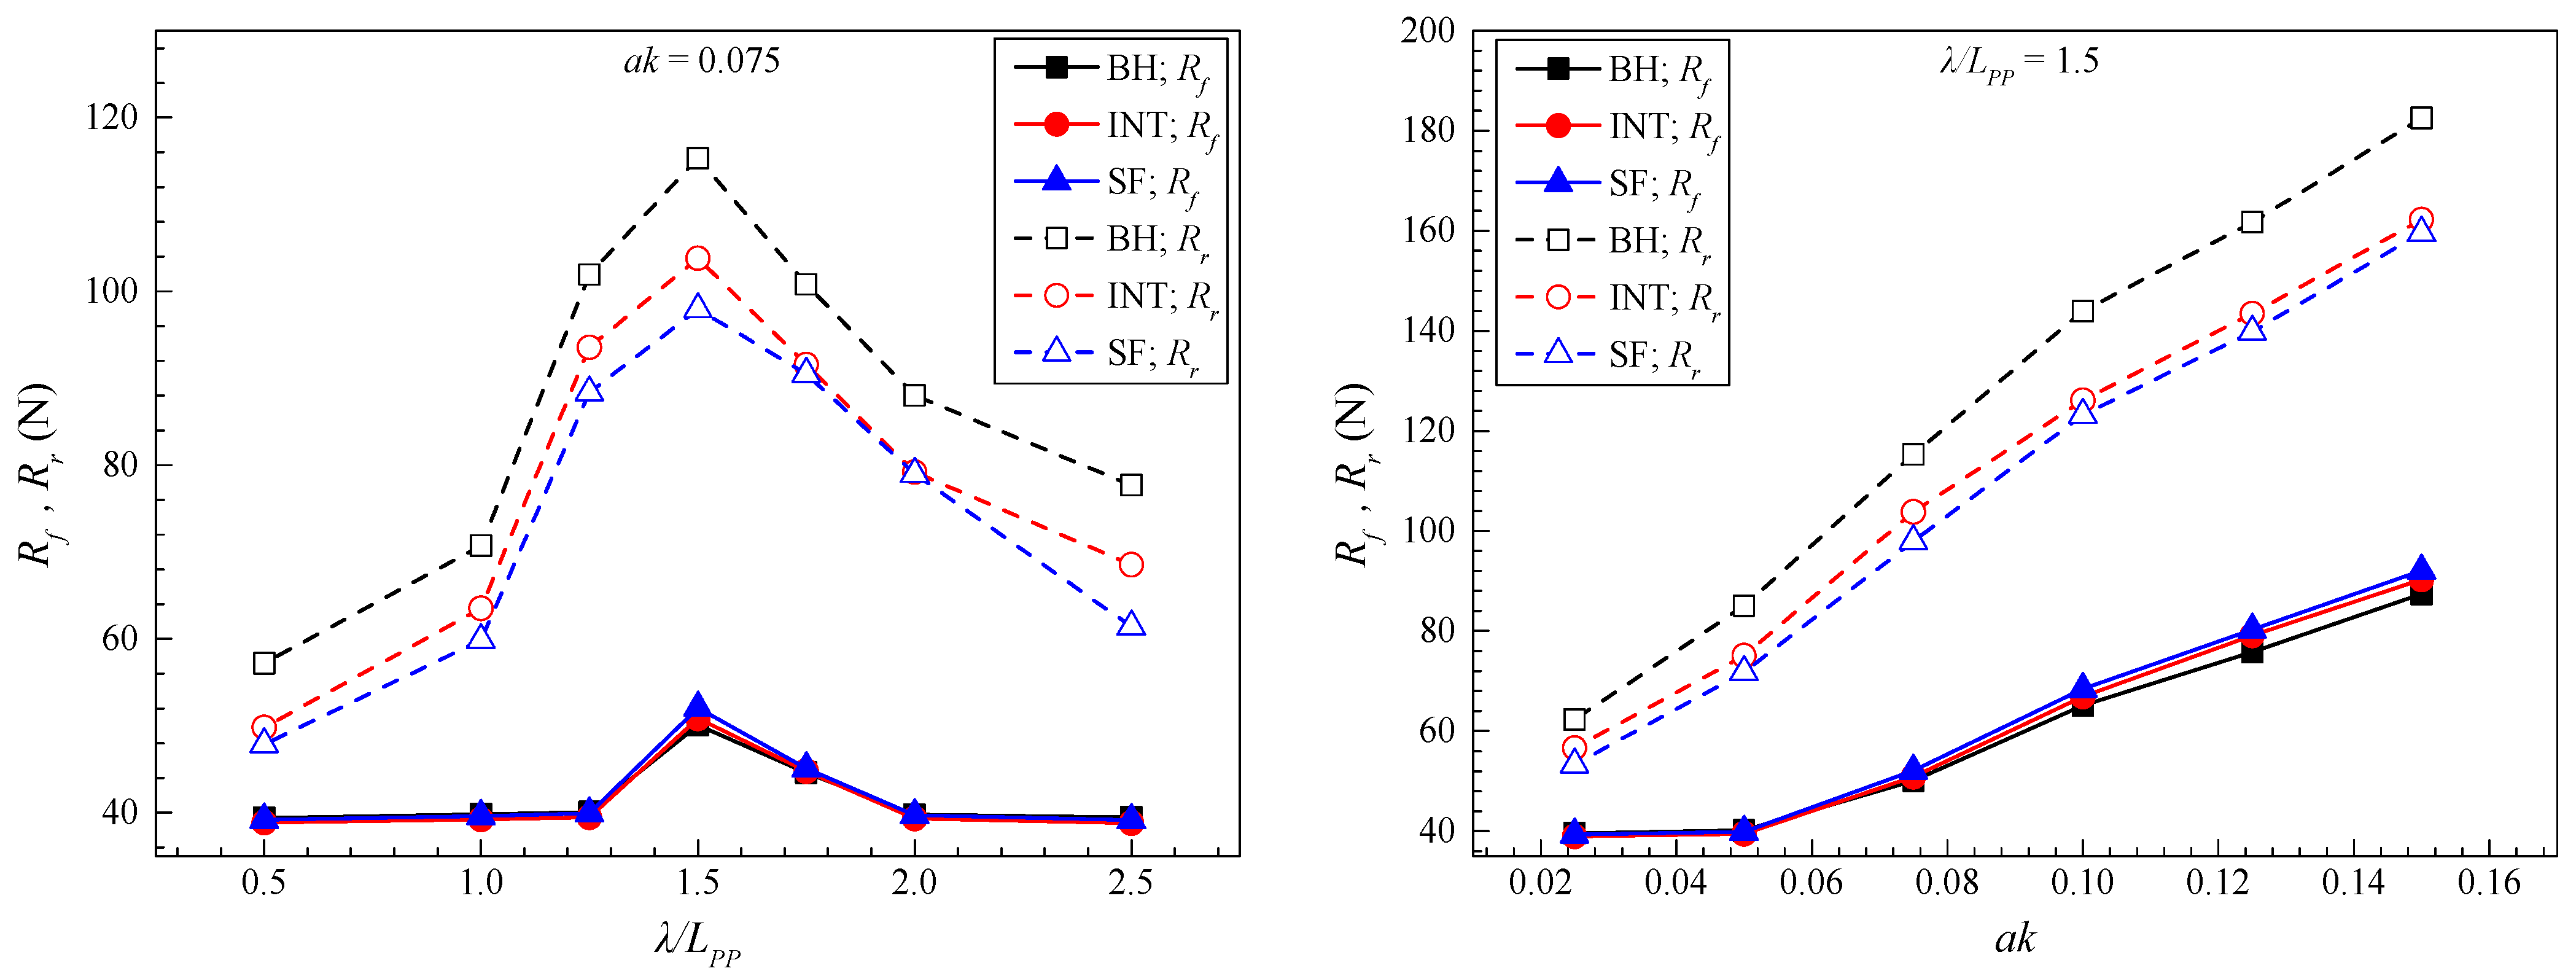
Figure 10 shows that the residual resistance (Rr) and frictional resistance (Rf) initially decrease and then increase with wavelength. The resistance reduction rate at the corresponding wavelength in Figure 9 is relatively high, owing to the low resistance of ships at small and large wavelengths. The numerically derived half-ship resistance components under various wave conditions reveal that adding both appendages significantly trims the residual resistance of the ship; however, it slightly influences the frictional resistance. With ak ≥ 0.075, the frictional resistance increased by only <5%. This dynamic explains why the resistance reduction rates of both stern appendages diminish as wave steepness increases. At λ/LPP = 1.5, ak = 0.075, both frictional and residual resistances increased compared to other conditions, largely owing to green water occurrences on the ship deck.

4.2. Influence of Stern Appendages on Ship Motion

Figure 11 and Figure 12 present the time-domain outcomes for ship heave and pitch under typical wave conditions. Both motion responses display prominent linear characteristics, and the motion amplitude increases with increasing wavelength. Introducing the interceptor and SF reduces the average values for heave and pitch across diverse wave conditions.
FFT was then applied to deduce the first-order heave and pitch pulsation amplitudes under corresponding wave conditions. Figure 13 displays the corresponding results at λ/LPP = 1.5, ak = 0.075 as an example. The heave and pitch exhibit pronounced amplitudes at the zeroth-, first-, and second-order (0; 0.718, fe; and 1.436 Hz, 2 fe, respectively) positions. However, the predominant amplitude was in the first order. For interceptor and SF post-installation, the zeroth-order amplitude for both heave and pitch reduced noticeably; although the first-order heave amplitude also declined, the pitch amplitude remained relatively unchanged.
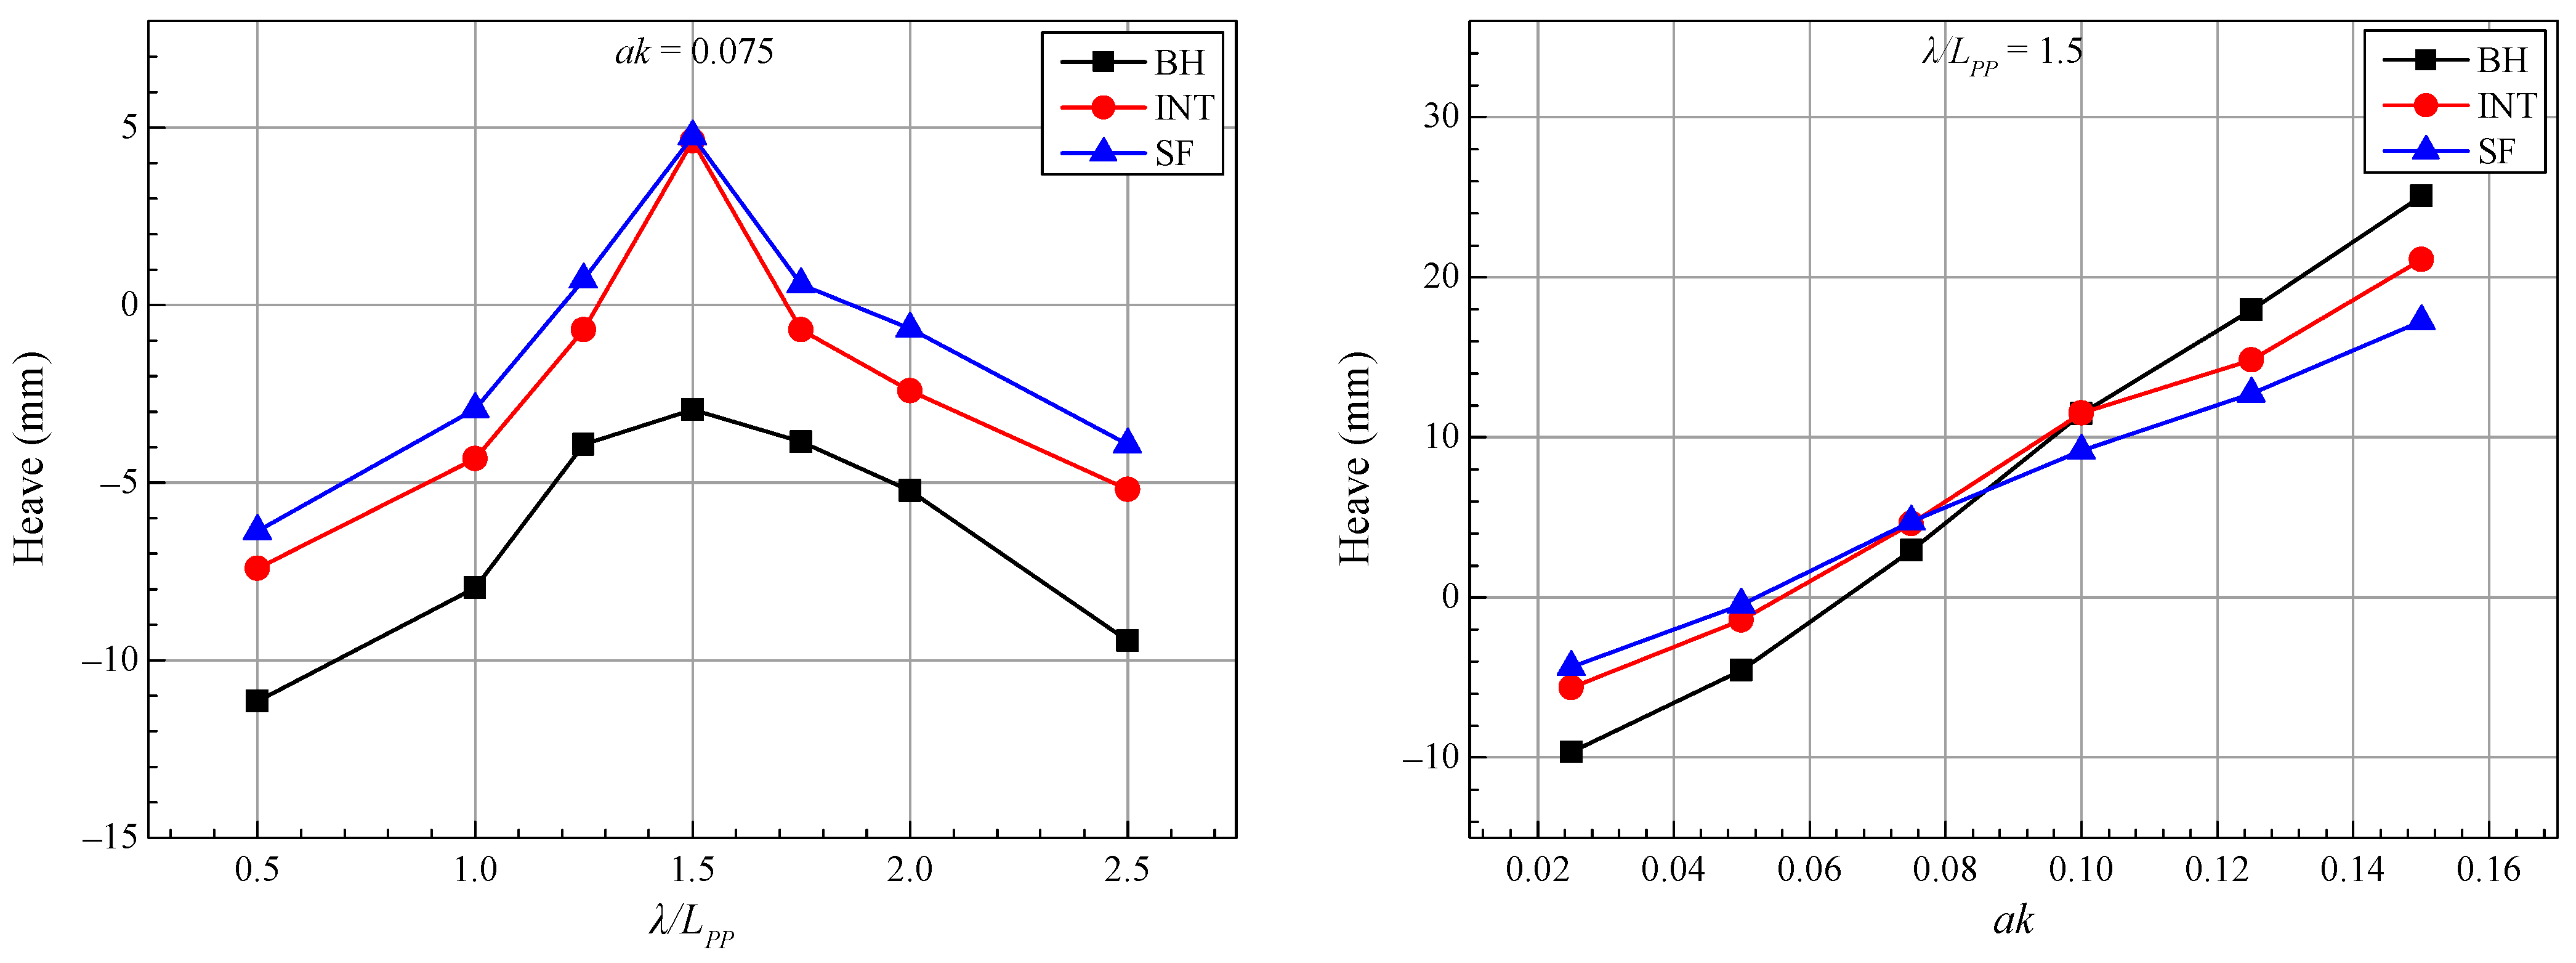
Figure 14 and Figure 15 depict the relationship between the mean heave and pitch values against wavelength and wave steepness, respectively, highlighting an explanatory correlation between the previously discussed-added resistance scenario. Within the λ/LPP = 0.5–2.5 range, the pitch value peaks at λ/LPP = 1.5, concurrent with the highest added resistance. For λ/LPP = 1.5, adding the appendages reduces the pitch across all wave steepness levels and diminishes the heave in the ak = 0.025–0.075 range. For ak ≥ 0.1, the ship exhibited a positive average heave, leading to an overall reduction in its draft. Therefore, adding either appendage slightly increases the draft (see Figure 10) with a rise in frictional resistance and a decline in the resistance reduction rate shown in Figure 9. Furthermore, the enhanced ship motion amplitude under wave conditions enabled the stern appendages to exert more influence on the posture of the ship under wave conditions.
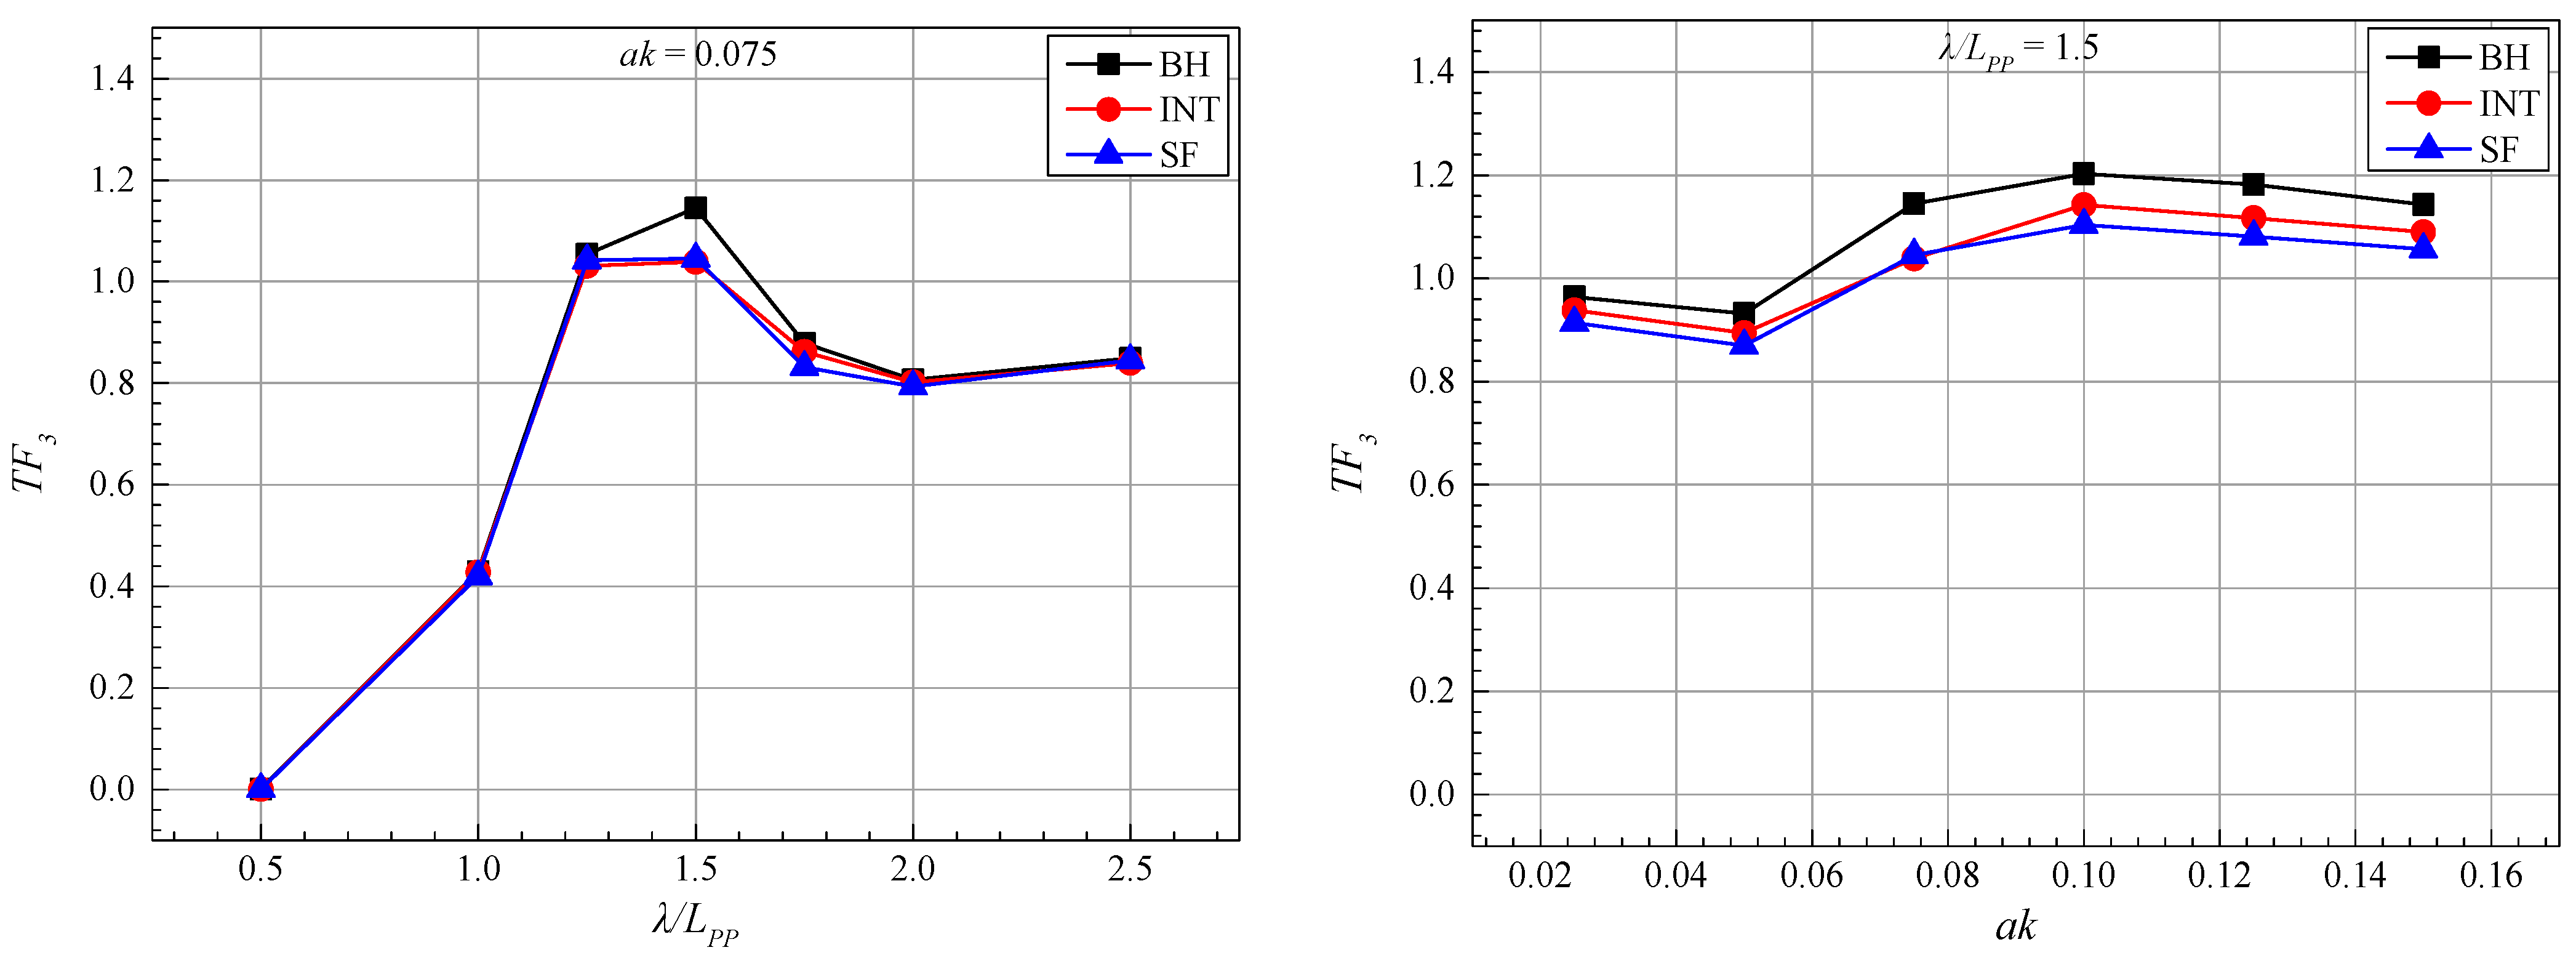
Equation (14) was used to derive the transfer functions for heave (TF3) and pitch (TF5) (Figure 16 and Figure 17, respectively). Increasing the wavelength causes the pitch and heave transfer functions to initially grow and then decline, peaking at λ/LPP = 1.5, suggesting a resonant frequency of approximately 1.5 LPP for the ship. At a constant wavelength, TF3 remained relatively static with wave steepness, whereas TF5 diminished. A discernible reduction in TF3 and TF5 was observed after adding the appendages, particularly within the wavelength span λ/LPP = 1–2. Following SF integration, the average decrease rates were 7.2% and 3.9% for TF3 and TF5, respectively; following interceptor installation, these were 4.4 and 2.1%, respectively.

4.3. Influence of Stern Appendages on the Ship Flow Field

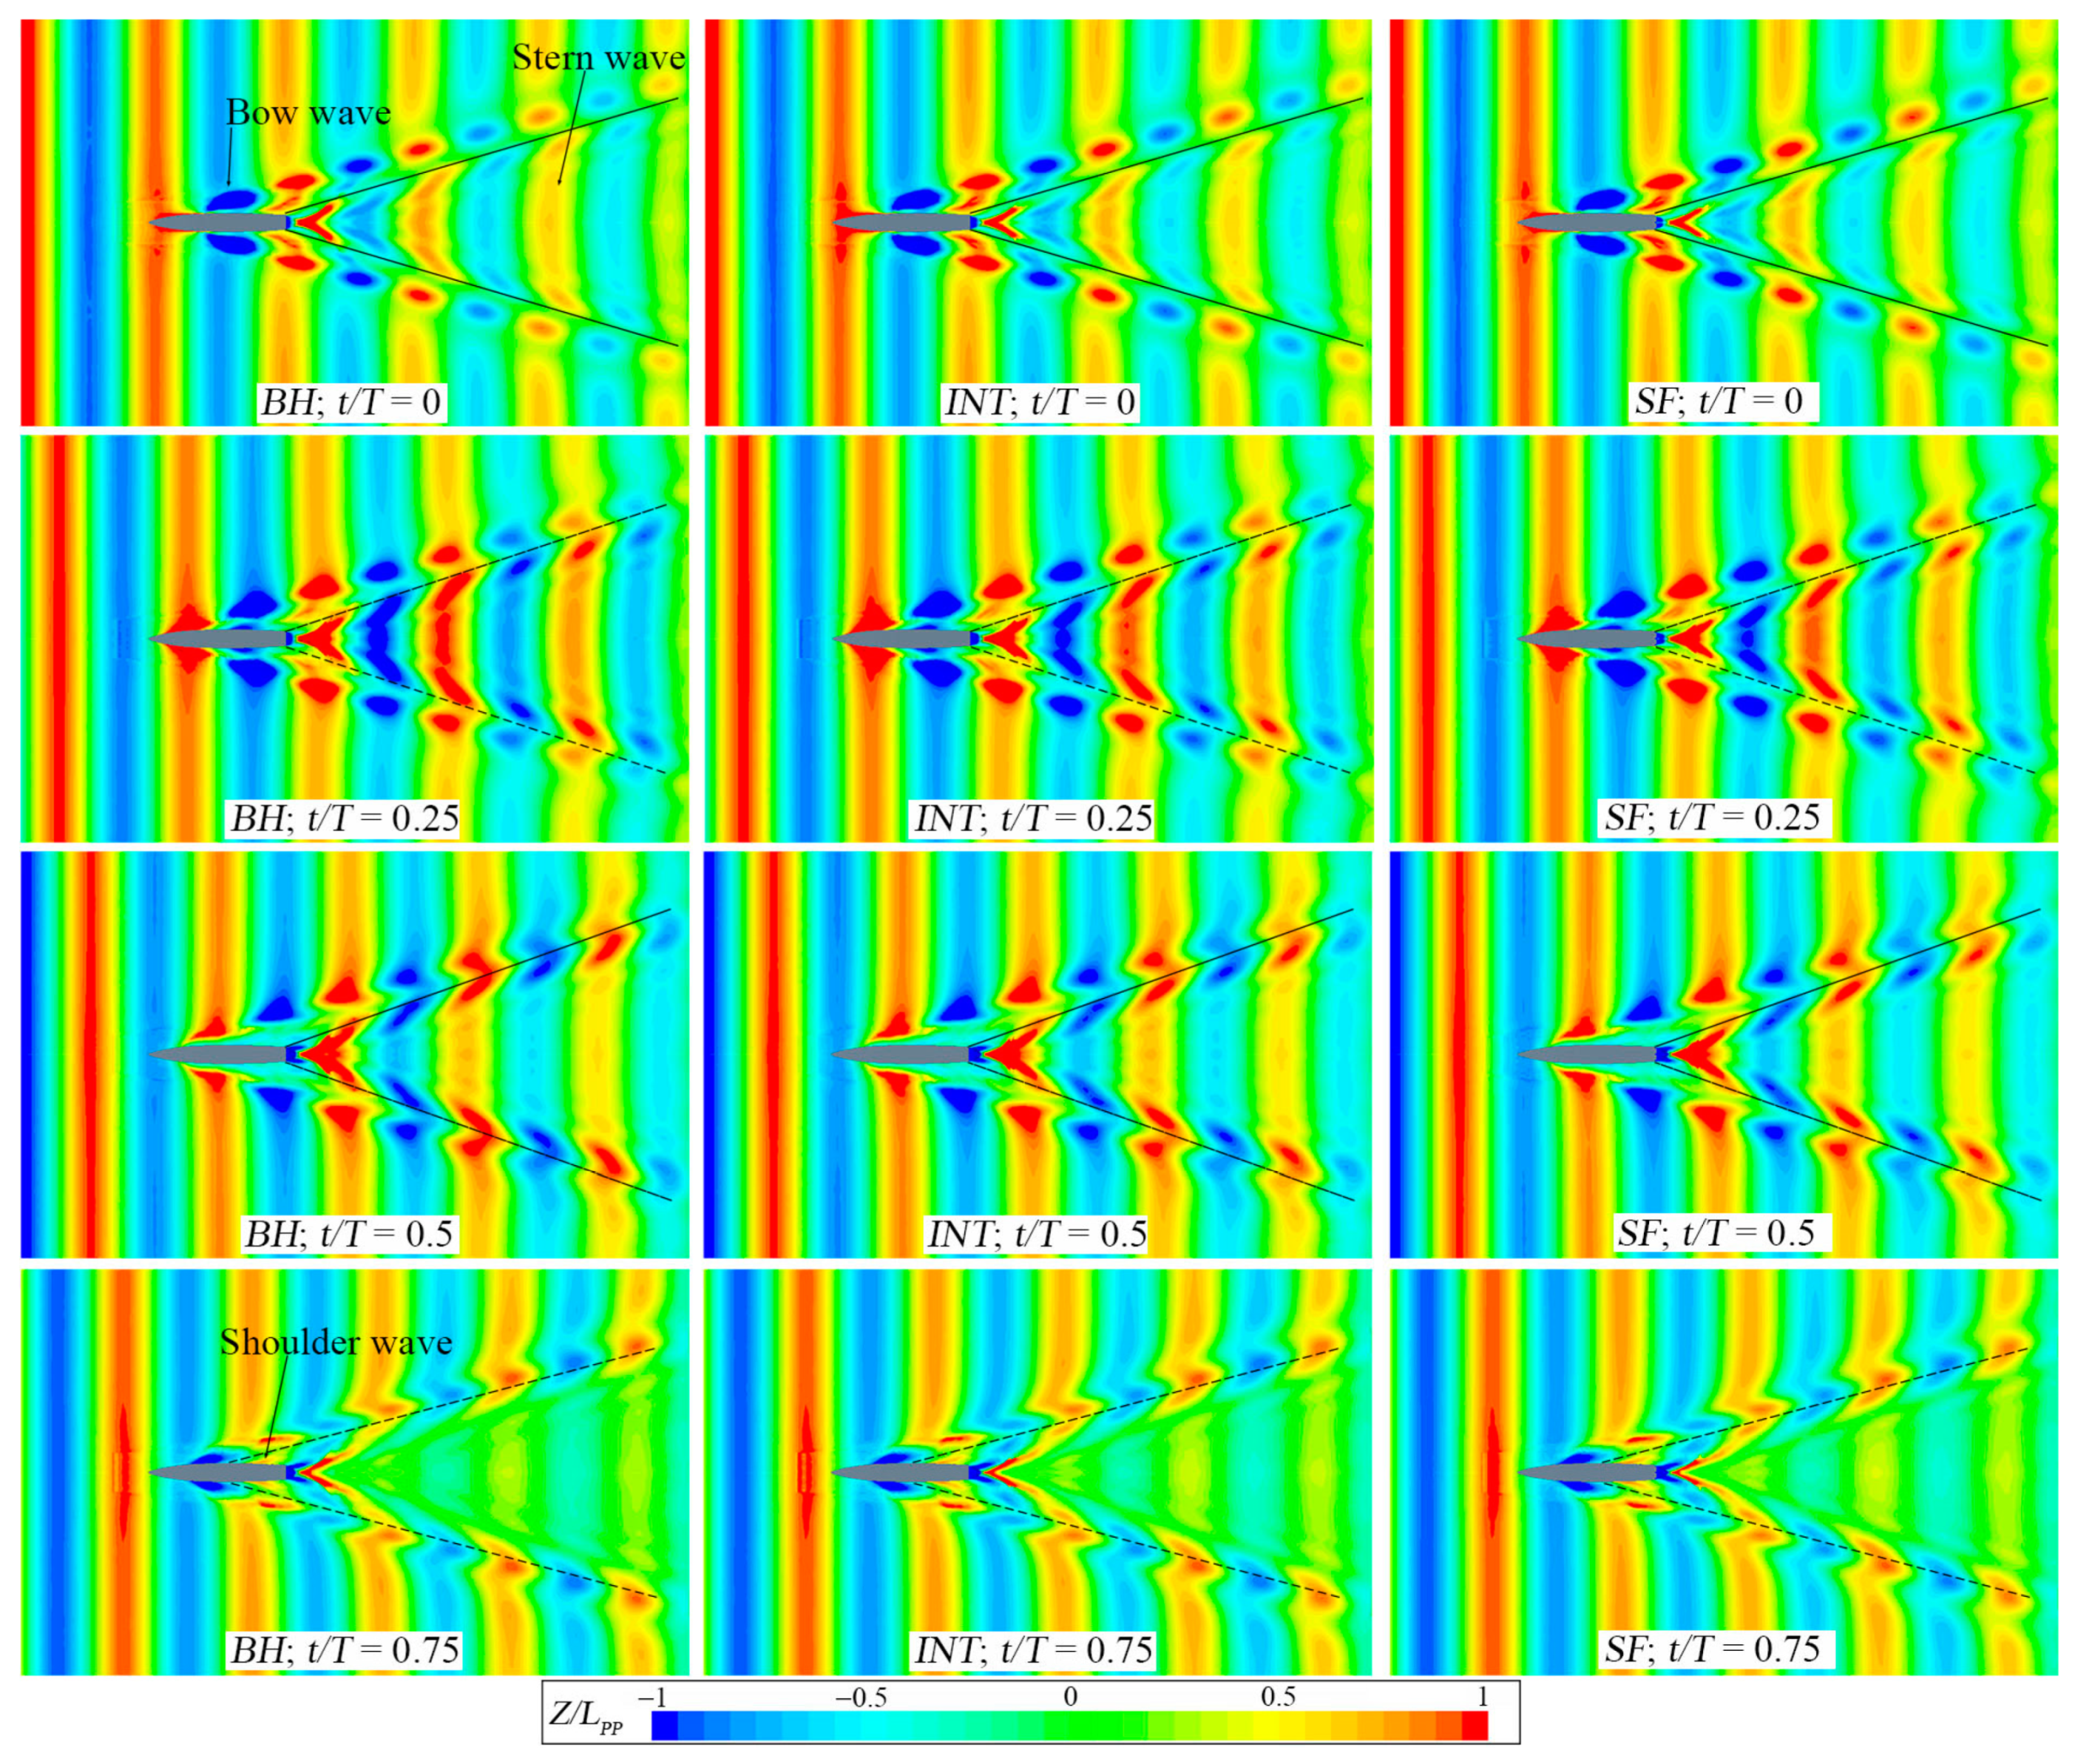
We then analysed variations in the flow field around the ship pre- and post-installation of the stern appendages. Figure 18 shows that the free surface waveform is an amalgamation of a head sea-regular wave and the Kelvin wave system. At t/T = 0, the crest of the wave approached the bow of the ship, causing the ship to pitch forward and inducing an enhanced bow wave break. At t/T = 0.5, the trough of the wave met the bow of the ship, causing an enhanced trim by the stern. Over time, the angle of the stern wave system increased incrementally towards that of the bow wave system. By t/T = 0.75, a shoulder wave system emerged. For post-installation of the interceptor or stern flap, the posture alterations of the ship impacted the amplitudes of different wave systems. Notably, the amplitude of the stern wave system diminished, particularly the wave height in the near-stern flow region, such as the rooster tail flow.
The longitudinal waveforms at the longitudinal section of the ship (Y/LPP = 0) for t/T = 0 and 0.5 were extracted (Figure 19 and Figure 20). Integrating the stern appendages decreases the height of the stern wave system, particularly in the rooster tail area, thus reducing stern flow energy loss and diminishing wave-making resistance. The SF exerts a superior influence on the stern flow and marginally outperforms the interceptor in resistance reduction.
Figure 21 depicts the ship’s axial velocity distribution at the cross-section X/LPP = 0.216 (flow capture section of the waterjet propulsion ship) across an encounter period. Prominent, periodic fluctuations in the pitch and heave within waves caused the nominal wake field to vary considerably over time. For the post-installation of the interceptor and SF, the boundary layer thickness expanded. That is, the inflow velocity of the ship diminished. The impact of the SF on the velocity of the nominal wake field surpassed that of the interceptor.
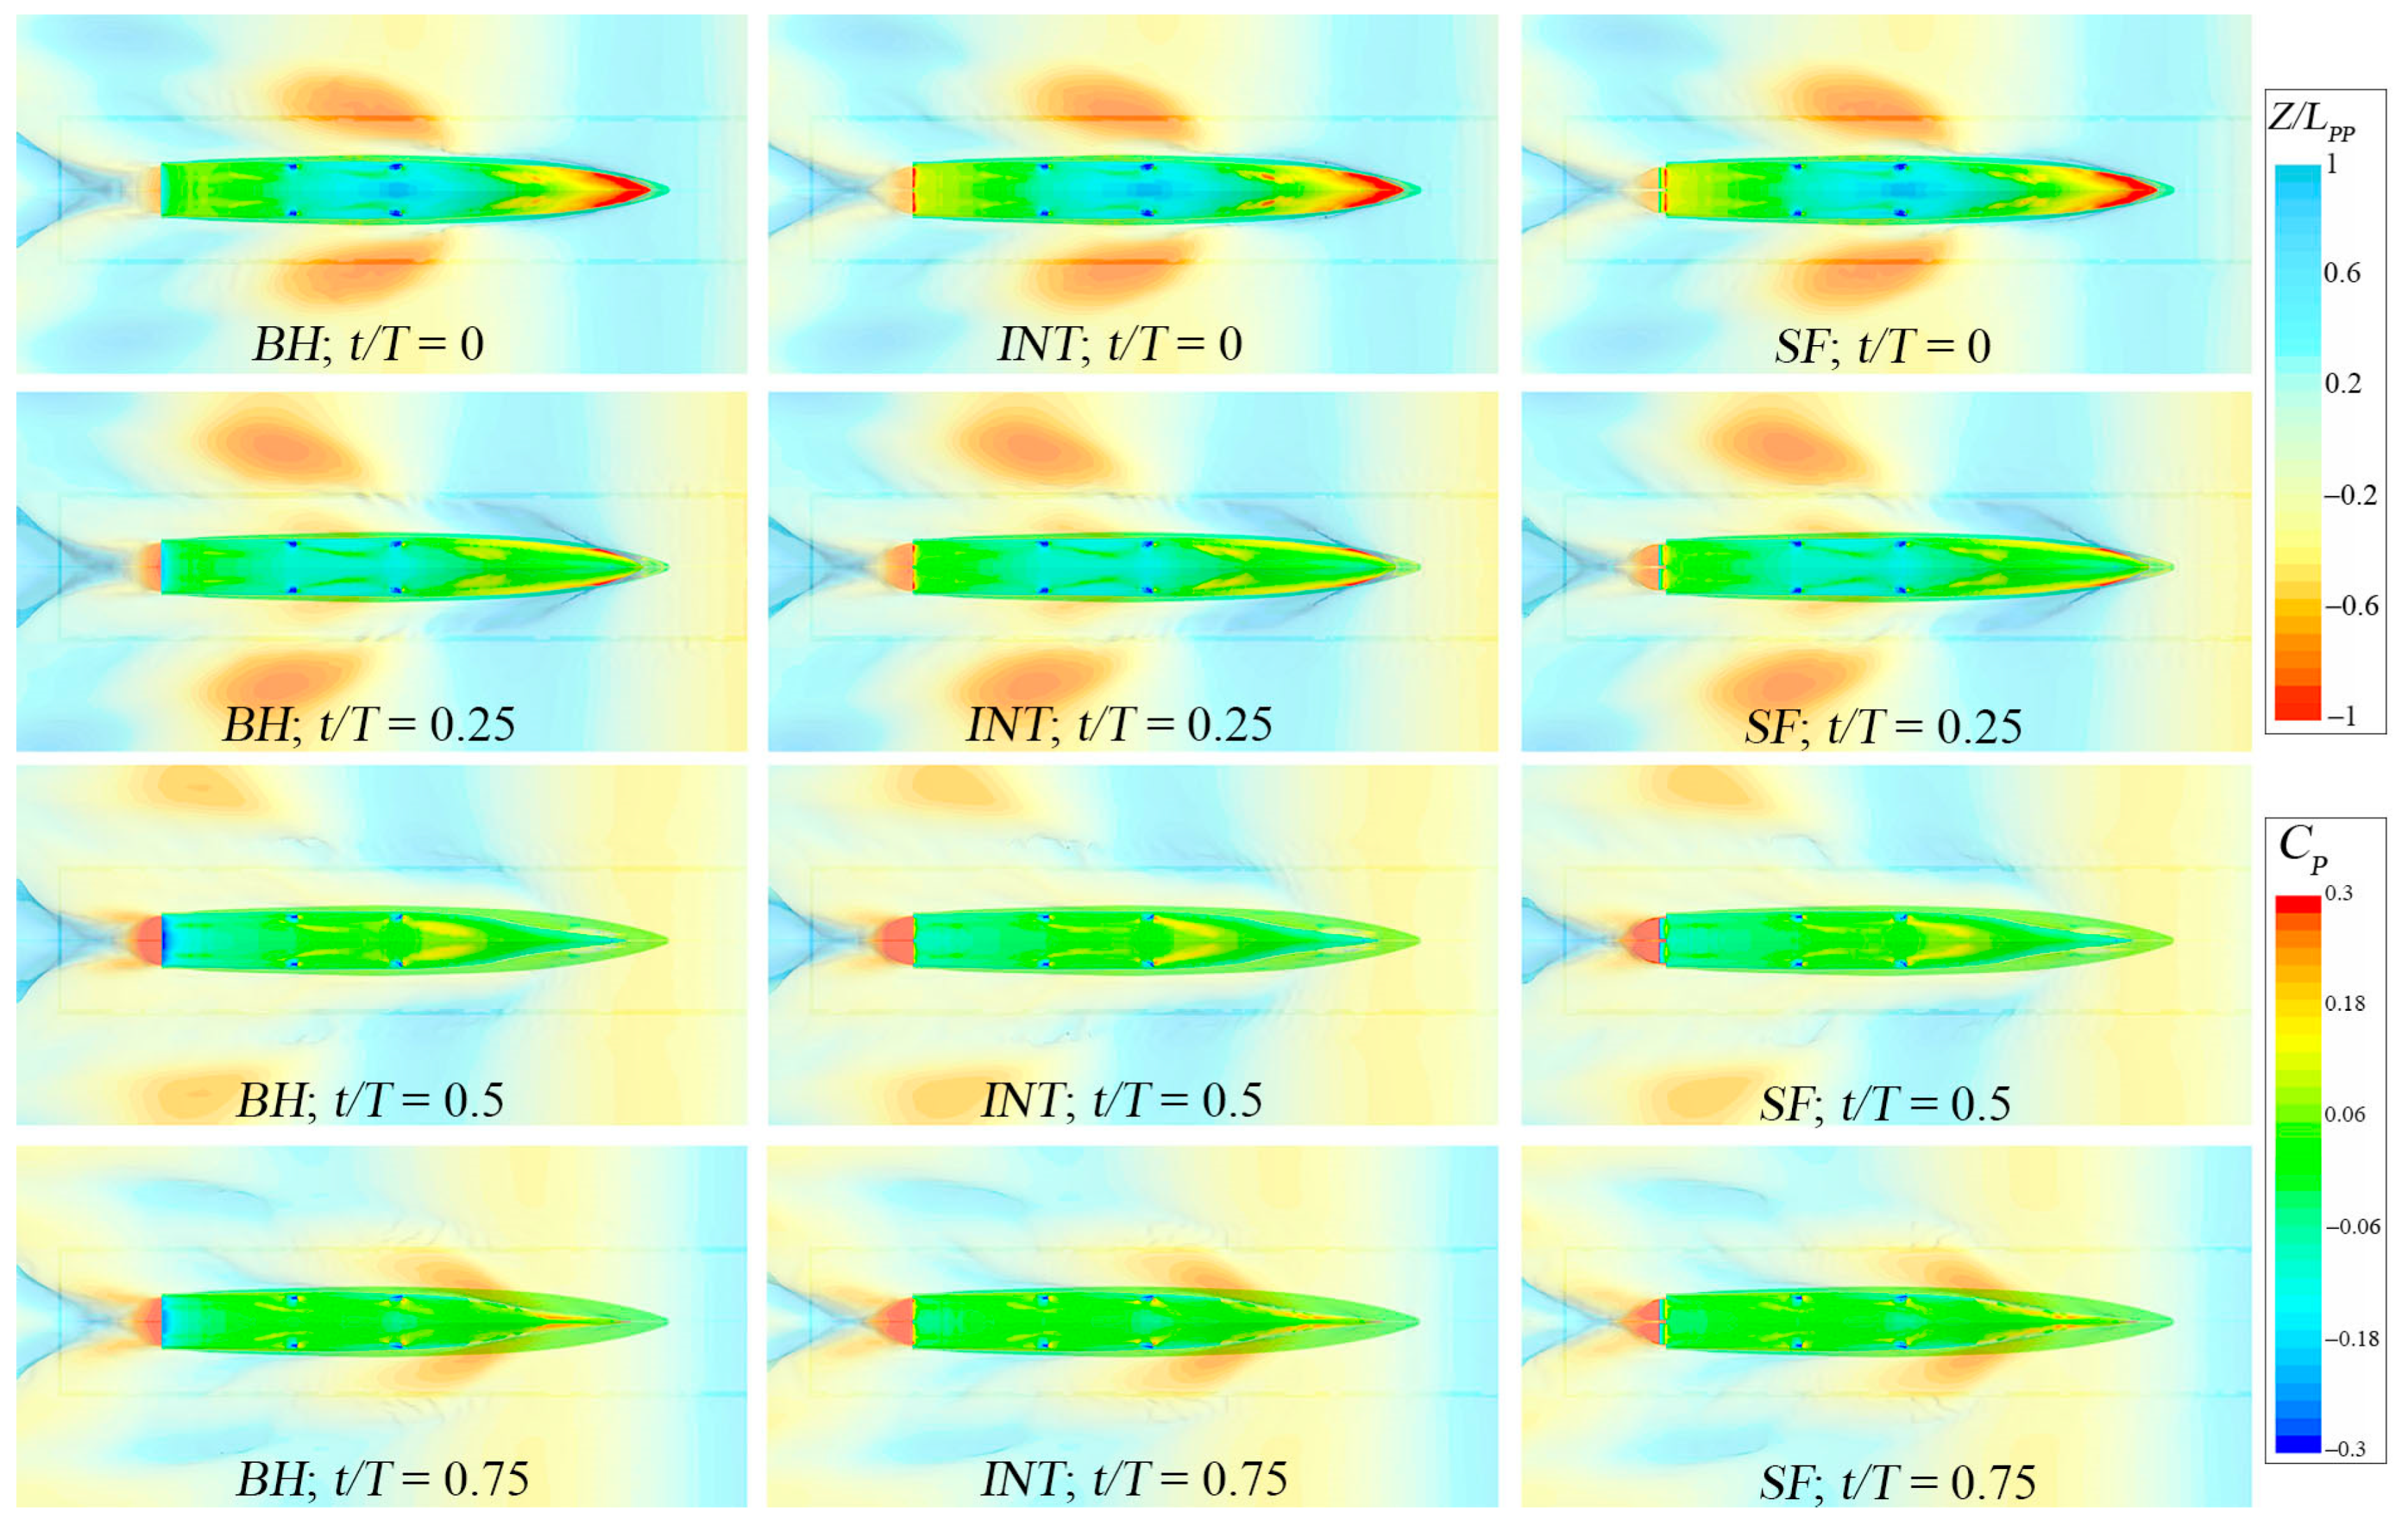
Figure 22 shows the distribution of the ship surface pressure coefficient
C P = P ρ g ( h + T ) 0.5 ρ v 2 ,
at different times, where P is the total pressure, ρ is the water density, T is the draft, h is the distance from the origin, and v is the water velocity.
At t/T = 0, waves converge at the bow of the ship, generating a high-pressure hydrodynamic load. At t/T = 0.5, a low-pressure zone forms at the stern, causing it to trim by the stern. The inclusion of the appendages considerably alters the pressure distribution at the stern, inducing higher pressure in their vicinity and influencing the wave-induced movements of the ship.
Figure 23 illustrates the green water phenomenon [35,36] on a ship’s deck at λ/LPP = 1.5, ak = 0.075 throughout an encounter period, distinctly portraying green water presence on the deck at varying times. This observation elucidates the pronounced nonlinearity in the resistance of the ship and the particularly evident added resistance under this wave condition, as previously discussed. Nevertheless, the presence of green water does not significantly influence the ship’s motion response, which remains almost consistent across other wave conditions. Additionally, integrating the stern appendages does not induce noticeable changes in the green water phenomenon on the deck.

5. Conclusions and Future Works

This research leveraged numerical simulation to probe the effects of interceptors and SFs on the resistance and motion response of ships to regular waves. We compared the resistance reduction rates of these two energy-saving appendages in waves against variations in wavelength and wave steepness, summarised the alterations in the heave and pitch transfer functions post-stern appendage installation, and assessed the ship resistance and motion change mechanisms from a flow field perspective. The following conclusions are outlined:
(1)
For the BH at wave steepness ak = 0.075, the added resistance coefficient increases and then diminishes as the wavelength increases. At λ/LPP = 1.5, the green water phenomenon occurs on the BH deck, leading to an added resistance peak of 70.6%.
(2)
Within the λ/LPP = 0.5–2.5 range, the resistance reduction rates for both appendages in wave conditions decline and then increase with the wavelength. Generally, these resistance reduction rates outperform calm water conditions by 1–3%. Notably, at λ/LPP = 2.5, the stern flap resistance reduction rate surpassed the calm water rate by 6.6%.
(3)
At a consistent wavelength of 1.5 LPP and wave steepness ak > 0.05, the resistance reduction rates for both appendages in regular waves declined as the wave steepness increased.
(4)
Installing the appendages diminishes the pitch across all wave steepness ranges and decreases the heave at ak = 0.025–0.075. Given the enhanced ship motion amplitude in wave conditions, the influence of the stern appendages on the posture of the ship was notably enhanced.
(5)
A remarkable reduction in TF3 and TF5 was observed post-installation of the appendages, particularly within the λ/LPP = 1–2 range. The SF outperformed the interceptor in ship seakeeping, achieving reductions in TF3 and TF5 of 7.2% and 3.9%, respectively, versus 4.4% and 2.1%.
(6)
The inclusion of stern appendages decreases the height of the stern wave system, most notably in the rooster tail area. The SF offers a more pronounced optimisation of the stern flow field and reduces resistance slightly more effectively than the interceptor.
We examined the efficacy of both appendages under varying wave conditions, comparing the resistance reduction rates in both wave and calm water conditions, shedding light on their respective influences on seakeeping performance. We also found that introducing stern appendages impacts the wake field, which in turn may influence the propulsion performance of the ship. It would be useful to conduct comprehensive research considering a ship + propeller + stern appendage as a combined entity under wave conditions. This would produce a deeper understanding of the unsteady hydrodynamic performances of ships and propellers, particularly in the context of stern appendages.

Author Contributions

K.S.: Conceptualization, Methodology, Writing—original draft, Writing—review, and editing. J.G.: Conceptualization, Software, Writing—review, and editing. J.M.: Validation, Data curation. Q.X.: Supervision, Data curation. Y.S.: Software, Visualization. F.X.: Resources, Visualization. All authors have read and agreed to the published version of the manuscript.

Funding

This work was supported by the Natural Science Foundation of Jiangsu Province (Grant Number: BK20230285), Natural Science Foundation of the Jiangsu Higher Education Institutions of China (Grant Number: 23KJB580004), and High-level Talents Research Start-up Fund supported by Jiangsu Shipping College (Grant Number: HYRC/202403).

Institutional Review Board Statement

Not applicable.

Informed Consent Statement

Not applicable.

Data Availability Statement

The data presented in this study are available on request from the corresponding author. The data are not publicly available due to privacy.

Conflicts of Interest

The authors declare no conflicts of interest.

References

  1. Choi, H.; Park, J.; Kim, D.; Kim, S.; Lee, J.; Ahn, J.; Kim, N. System identification and pitch control of a planing hull ship with a controllable stern intercepter. J. Soc. Nav. Archit. Korea 2018, 5, 401–414. [Google Scholar] [CrossRef]
  2. Villa, D.; Brizzolara, S. A systematic analysis of flap/interceptors hydrodynamic performance. In Proceedings of the International Conference on Fast Sea Transport, Athens, Greece, 5–8 October 2009. [Google Scholar]
  3. Katayama, T.; Suzuki, K.; Ikeda, Y. A new ship motion control system for high-speed craft. In Proceedings of the 7th International Conference on Fast Sea Transportation, Ischia, Italy, 7–10 October 2003. [Google Scholar]
  4. Brizzolara, S. Hydrodynamics analysis of interceptors with CFD methods. In Proceedings of the 7th International Conference on Fast Sea Transportation, Ischia, Italy, 7–10 October 2003. [Google Scholar]
  5. Brizzolara, S.; Salian, R. Adjustable energy saving device for transom stern hulls. In Proceedings of the SNAME Maritime Convention, Providence, RI, USA, 25 October 2018. [Google Scholar]
  6. Deng, R.; Huang, D.B.; Zhou, G.L. Preliminary numerical research of the hydrodynamic mechanism of interceptor. J. Ship Mech. 2012, 16, 740–749. [Google Scholar]
  7. Mansoori, M.; Fernandes, A.C. Hydrodynamics of the interceptor on a 2D flat plate by CFD and experiments. J. Hydrodyn. 2015, 27, 919–933. [Google Scholar] [CrossRef]
  8. Jacobi, G.; Thill, C.H.; van’t Veer, R.; Juijasmans, R.H.M. Analysis of the influence of an interceptor on the transom flow of a fast ship by pressure reconstruction from stereoscopic scanning PIV. Ocean Eng. 2019, 181, 281–292. [Google Scholar] [CrossRef]
  9. Tsai, F.J.; Hwang, J.L. Study on the compound effects of interceptor with stern flap for two fast monohulls. In Proceedings of the Oceans ‘04 MTS/IEEE Techno-Ocean ‘04 (IEEE Cat. No.04CH37600), Kobe, Japan, 9–12 November 2004; Volume 2, pp. 1023–1028. [Google Scholar]
  10. John, S. Hydrodynamic Performance Enhancement Using Stern Wedges, Stern Flaps, and Interceptors for Ships; ISCOT: Kharagpur, India, 2011. [Google Scholar]
  11. De Luca, F.; Pensa, C. Experimental investigation on conventional and unconventional interceptors. Trans. R. Inst. Nav. Architects. Part B Int. J. Small Craft Technol. 2012, 154, 65–72. [Google Scholar]
  12. Mansoori, M.; Fernandes, A.C. The interceptor hydrodynamic analysis for controlling the porpoising instability in high speed crafts. Appl. Ocean Res. 2016, 57, 40–51. [Google Scholar] [CrossRef]
  13. Mansoori, M.; Fernandes, A.C. Interceptor and trim tab combination to prevent interceptor’s unfit effects. Ocean Eng. 2017, 134, 140–156. [Google Scholar] [CrossRef]
  14. Mansoori, M.; Fernandes, A.C. Hydrodynamics of the interceptor analysis via both ultra-reduced model test and dynamic CFD simulation. J. Offshore Mech. Arct. Eng. 2017, 139, 021101. [Google Scholar] [CrossRef]
  15. Maki, A.; Arai, J.; Tsutsumoto, T.; Suzuki, K.; Miyauchi, Y. Fundamental research on resistance reduction of surface combatants due to stern flaps. J. Mar. Sci. Technol. 2016, 21, 344–358. [Google Scholar] [CrossRef]
  16. Avci, A.G.; Barlas, B. An experimental investigation of interceptors for a high speed hull. Int. J. Nav. Archit. Ocean. Eng. 2019, 11, 256–273. [Google Scholar] [CrossRef]
  17. Deng, R.; Chen, S.Y.; Wu, T.C.; Luo, F.Q.; Jiang, D.P.; Li, Y.L. Investigation on the influence induced by interceptor on the viscous flow field of deep-sea vessel. Ocean Eng. 2020, 196, 106735. [Google Scholar] [CrossRef]
  18. Budiarto, U.; Samuel, S.; Wijaya, A.A.; Yulianti, S.; Kiryanto, K.; Iqbal, M. Stern flap application on planing hulls to improve resistance. Int. J. Eng. 2022, 35, 2313–2320. [Google Scholar] [CrossRef]
  19. Belibassakis, K.; Filippas, E.; Papadakis, G. Numerical and experimental investigation of the performance of dynamic wing for augmenting ship propulsion in head and quartering seas. J. Mar. Sci. Eng. 2021, 10, 24. [Google Scholar] [CrossRef]
  20. Capasso, S.; Tagliafierro, B.; Mancini, S.; Martínez-Estévez, I.; Altomare, C.; Domínguez, J.M.; Viccione, G. Regular wave seakeeping analysis of a planing hull by smoothed particle hydrodynamics: A Comprehensive Validation. J. Mar. Sci. Eng. 2023, 11, 700. [Google Scholar] [CrossRef]
  21. Sun, X.S.; Yao, C.B.; Xiong, Y.; Ye, Q. Numerical and experimental study on seakeeping performance of a SWATH vehicle in head waves. Appl. Ocean Res. 2017, 68, 262–275. [Google Scholar] [CrossRef]
  22. Niklas, K.; Pruszko, H. Full scale CFD seakeeping simulations for case study ship redesigned from V-shaped bulbous bow to X-bow hull form. Appl. Ocean Res. 2019, 89, 188–201. [Google Scholar] [CrossRef]
  23. Gong, J.; Yan, S.; Ma, Q.; Li, Y. Added resistance and seakeeping performance of trimarans in oblique waves. Ocean Eng. 2020, 216, 107721. [Google Scholar] [CrossRef]
  24. Guan, G.; Wang, L.; Geng, J.; Zhuang, Z.; Yang, Q. Parametric automatic optimal design of USV hull form with respect to wave resistance and seakeeping. Ocean Eng. 2021, 235, 109462. [Google Scholar]
  25. Day, A.H.; Cooper, C. An experimental study of interceptors for drag reduction on high-performance sailing yachts. Ocean Eng. 2011, 38, 983–994. [Google Scholar] [CrossRef]
  26. Rijkens, A.; Cleijsen, H.; Keuning, J. On the hydrodynamic performance of an improved motion control device for fast ships. In FAST 2013; FAST Organizing Committee: Amsterdam, The Netherlands, 2013. [Google Scholar]
  27. Karimi, M.H.; Seif, M.S.; Abbaspoor, M. A study on vertical motions of high-speed planing boats with automatically controlled stern interceptors in calm water and head waves. Ships Offshore Struct. 2015, 10, 335–348. [Google Scholar]
  28. Park, J.Y.; Choi, H.; Lee, J.; Choi, H.; Woo, J.; Kim, S.; Kim, D.J.; Kim, S.Y.; Kim, N. An experimental study on vertical motion control of a high-speed planing vessel using a controllable interceptor in waves. Ocean Eng. 2019, 173, 841–850. [Google Scholar] [CrossRef]
  29. Wang, X.; Liu, L.; Zhang, Z.; Feng, D. Numerical study of the stern flap effect on catamaran’s seakeeping characteristic in regular head waves. Ocean Eng. 2020, 206, 107172. [Google Scholar] [CrossRef]
  30. Li, Y.; Li, A.; Gong, J.; Fu, Z.; Dai, K. Numerical investigation on added resistance and motions of a high-speed trimaran equipped with T-foil and stern flap in regular head and oblique waves for varying wave steepness. J. Braz. Soc. Mech. Sci. Eng. 2021, 43, 451. [Google Scholar] [CrossRef]
  31. Song, K.W.; Guo, C.Y.; Gong, J.; Li, P.; Wang, L.Z. Influence of interceptors, stern flaps, and their combinations on the hydrodynamic performance of a deep-vee ship. Ocean Eng. 2018, 170, 306–320. [Google Scholar] [CrossRef]
  32. Wang, W.; Wu, T.; Zhao, D.; Guo, C.; Luo, W.; Pang, Y. Experimental-numerical analysis of added resistance to container ships under presence of wind-wave loads. PLoS ONE 2019, 14, e0221453. [Google Scholar]
  33. ITTC. Practical Guidelines for Ship CFD Applications. In Proceedings of the 26th ITTC, Rio de Janeiro, Brazil, 28 August–2 September 2011. [Google Scholar]
  34. Xing, T.; Stern, F. Factors of safety for Richardson extrapolation. J. Fluids Eng. 2010, 132, 061403. [Google Scholar] [CrossRef]
  35. Huang, S.; Jiao, J.; Chen, C. CFD prediction of ship seakeeping behavior in bi-directional cross wave compared with in uni-directional regular wave. Appl. Ocean Res. 2021, 107, 102426. [Google Scholar] [CrossRef]
  36. Tezdogan, T.; Demirel, Y.K.; Kellett, P.; Khorasanchi, M.; Incecik, A.; Turan, O. Full-scale unsteady RANS CFD simulations of ship behaviour and performance in head seas due to slow steaming. Ocean Eng. 2015, 97, 186–206. [Google Scholar] [CrossRef]
Figure 1. Geometric model of the ship.
Jmse 12 00929 g001
Figure 2. Installation of (a) interceptor (b) and stern flap (SF).
Jmse 12 00929 g002
Figure 3. Computational domain and boundary conditions.
Jmse 12 00929 g003
Figure 4. Mesh of the computational domain: (a) global, (b) symmetry plane, (c) hull-surrounding, and (d) hull meshes.
Jmse 12 00929 g004
Figure 5. Transom-stern flow field of experimental (left) and simulated (right) results at Fr = 0.4.
Jmse 12 00929 g005
Figure 6. Time histories of ship total resistance at typical conditions.
Jmse 12 00929 g006
Figure 7. FFT analysis of ship resistance at λ/LPP = 1.5, ak = 0.075.
Jmse 12 00929 g007
Figure 8. Dependence of added resistance Cad on wavelength (left) and wave steepness (right).
Jmse 12 00929 g008
Figure 9. Dependence of the resistance reduction rate of the interceptor and SF on wavelength (left) and wave steepness (right).
Jmse 12 00929 g009
Figure 10. Dependence of ship resistance components on wavelength (left) and wave steepness (right).
Jmse 12 00929 g010
Figure 11. Time histories of heave motion at typical conditions.
Jmse 12 00929 g011
Figure 12. Time histories of pitch motion at typical conditions.
Jmse 12 00929 g012
Figure 13. FFT analysis of heave (left) and pitch (right) motion at λ/LPP = 1.5, ak = 0.075.
Jmse 12 00929 g013
Figure 14. Dependence of heave on wavelength (left) and wave steepness (right).
Jmse 12 00929 g014
Figure 15. Dependence of pitch on wavelength (left) and wave steepness (right).
Jmse 12 00929 g015
Figure 16. Dependence of heave transfer function TF3 on wavelength (left) and wave steepness (right).
Jmse 12 00929 g016
Figure 17. Dependence of pitch transfer function TF5 on wavelength (left) and wave steepness (right).
Jmse 12 00929 g017
Figure 18. Wave pattern at four instants over the encounter period (λ/LPP = 1, ak = 0.075).
Jmse 12 00929 g018
Figure 19. Influence of the interceptor and SF on wave profiles of longitudinal wave cut Y/LPP = 0 (t/T = 0).
Jmse 12 00929 g019
Figure 20. Influence of the interceptor and SF on the wave profiles of longitudinal wave cut Y/LPP = 0 (t/T = 0.5).
Jmse 12 00929 g020
Figure 21. Axial velocity along the transverse section of X/LPP = 0.216 at four instants over the encounter period (λ/LPP = 1, ak = 0.075).
Jmse 12 00929 g021
Figure 22. Pressure distribution on the hull at four instants over the encounter period (λ/LPP = 1, ak = 0.075).
Jmse 12 00929 g022
Figure 23. Green water at four instants over the encounter period (λ/LPP = 1.5, ak = 0.075).
Jmse 12 00929 g023
Table 1. Main parameters of the geometric model.
Main DimensionsSymbolsModel ScaleFull Scale
Length between perpendicularsLPP (m)6.670106.72
Length at water levelLWL (m)6.670106.72
Molded breadthB (m)0.75812.13
DraftT (m)0.2403.84
Wetted surfaceS (m2)5.4531396
Displacement∇ (m3)0.5492249
Table 2. Simulation wave conditions.
λ/LPPakfe
0.50.0751.654
10.0750.969
1.250.0750.821
1.50.0750.718
1.750.0750.643
20.0750.585
2.50.0750.500
1.50.0250.718
1.50.050.718
1.510.718
1.50.1250.718
1.50.150.718
Table 3. Resistance and transfer functions simulation results.
GfGmGcTfTmTc
Ct00.0073290.0073410.0073980.0073290.0072840.007137
TF30.43640.43150.42350.43640.42630.4031
TF50.29820.29710.29550.29820.29440.2869
Table 4. Verification for grid number and time step.
RGPGUG (Sf %)RTPTUT (Sf %)
Ct00.20462.28890.930.3050 1.71313.57
TF30.61290.70633.300.4358 1.19842.56
TF50.68900.53741.660.5144 0.95912.22
Table 5. Simulation and experimental values for ship resistance and attitude in calm water.
Experimental ValueSimulation ValueError (%)
Ctcw0.0070600.006895−2.34
Trim (°)−0.337−0.3421.48
Sinkage (mm)−11.0−10.6−3.64
Table 6. Resistance reduction rates of the interceptor and stern flap in calm water with Fr = 0.4.
Experimental Value from [31]Our Simulation Value
INT−6.92%−5.65%
SF−8.61%−7.52%
Disclaimer/Publisher’s Note: The statements, opinions and data contained in all publications are solely those of the individual author(s) and contributor(s) and not of MDPI and/or the editor(s). MDPI and/or the editor(s) disclaim responsibility for any injury to people or property resulting from any ideas, methods, instructions or products referred to in the content.